gps for use in radar verifications and tests
TRANSCRIPT

Department of Computer Science and Engineering
Division of Networks and Systems
CHALMERS UNIVERSITY OF TECHNOLOGY
Göteborg, Sweden, 2011
GPS for use in radar verifications and tests
An inventory of GPS-technique and development of a method
for use in processing of position data in radar verifications and
tests
Master of Science Thesis
MAGNUS WENNBERG

The Author grants to Chalmers University of Technology and University of
Gothenburg the non-exclusive right to publish the Work electronically and in a non-
commercial purpose make it accessible on the Internet.
The Author warrants that he/she is the author to the Work, and warrants that the Work
does not contain text, pictures or other material that violates copyright law.
The Author shall, when transferring the rights of the Work to a third party (for
example a publisher or a company), acknowledge the third party about this agreement.
If the Author has signed a copyright agreement with a third party regarding the Work,
the Author warrants hereby that he/she has obtained any necessary permission from
this third party to let Chalmers University of Technology and University of
Gothenburg store the Work electronically and make it accessible on the Internet.
GPS for use in radar verifications and tests
MAGNUS C. J. WENNBERG
© MAGNUS C. J. WENNBERG, May 2011.
Examiner: TOR AULIN
Chalmers University of Technology
University of Gothenburg
Department of Computer Science and Engineering
SE-412 96 Göteborg
Sweden
Telephone + 46 (0)31-772 1000
Cover: Photo of the author in a Swedish Air Force combat aircraft JAS 39A Gripen
over the lake Vänern in southwest Sweden.
Department of Computer Science and Engineering
Göteborg, Sweden May 2011
GPS for use in radar verifications and tests
MAGNUS WENNBERG
Department of Computer Science and Engineering
Chalmers University of Technology
Abstract
GPS has evolved as the dominating global positioning service since the official
operational start-up in 1994. This is due to continuous technical upgrades
accompanied by other competing and collaborating systems that have emerged during
the period after launch of the GPS service. This has made and will probably continue
to make satellite based navigation systems into every-day used applications in many
different areas.
Raw GPS measurements can be refined with different techniques such as differential
GPS and GPS combined with inertial measurements. An improvement in accuracy
down to decimeter or centimeter level is possible under favorable conditions. GPS is
however not entirely without cons. However, the benefits such as the flexibility
gained from the global infrastructure and the all-weather capacity are unmatched
especially in airborne and other dynamic applications.
Owing to the good properties of GPS, this technique together with enhancing methods
is regularly used in several product tests and verifications at Saab Electronic Defence
Systems. The position data from GPS is used as benchmark when verifying accuracy
in radar sensor measurements. This applies both to ground based sensor systems as
well as airborne sensor systems.
The report is directed to employees at Saab EDS for whom it serves two different
purposes. The first part of the report is an inventory of existing position measuring
equipment used at Saab EDS. This part, together with a general GPS walk-through in
appendix, is an introduction of position measurement procedures used at the
company. The second part develops, investigates and suggests a specific method to
compare GPS position data with target data from a PS-05/A radar unit mounted on
Saab Gripen fighter aircrafts. The method takes care of issues regarding data
synchronization and incompatible position coordinates.
Keywords: GPS, Radar, Gripen, PS-05/A

GPS for use in radar verifications and tests
MAGNUS WENNBERG
Department of Computer Science and Engineering
Chalmers University of Technology
Sammanfattning
GPS har sedan den officiella uppstarten 1994 utvecklats till den dominerande
positioneringstjänsten för global användning. Detta har åstadkommits genom
kontinuerlig teknisk uppgradering av systemet åtföljt av andra konkurrerande och
samarbetande system. Den här utvecklingen har gjort satellitbaserade
navigeringstjänster till något som används i vardagen inom en mängd olika områden,
och framstegen fortsätter.
Rådata från GPS-mätningar kan raffineras för ökad noggrannhet med olika metoder
och tekniker som till exempel differentiell GPS, men även genom kompletterande
mätningar med tröghetsnavigeringssystem. Under goda mätförhållanden är
en förbättring av noggrannheten ned till decimeter- eller centimeternivå möjlig. GPS
som mätmetod är dock inte helt utan svagheter, vilket delvis manifesteras i skiftande
datakvalité. Styrkan ligger däremot i den flexibla användningen som åstadkoms
genom att systemet erbjuder en global infrastruktur, samt genom att GPS fungerar
under alla väderförhållanden.
På grund av de goda egenskaperna hos GPS så används denna positioneringsteknik
tillsammans med raffineringsmetoder inom produkttester och verifieringar på Saab
Electronic Defence Systems, EDS. Positionsdata från GPS-mätningar används för att
verifiera noggrannhetskrav på mätningar gjorda av såväl markbaserade som luftburna
radarsensorer.
Denna rapport är riktad till anställda på Saab EDS och tjänar två olika syften för
dessa. Den första delen av rapporten är en inventering av befintlig GPS-mätutrustning
som används på Saab EDS. Denna del tillsammans med en allmän beskrivning av
GPS i bifogat appendix ska tjäna som en introduktion till de
positionsmätningsprocedurer som används på företaget. Den andra delen av rapporten
utvecklar, testar och föreslår en särskild metod för att jämföra positionsdata från GPS
med radardata från radarenheten PS-05/A. Denna radar tillhör utrustningen på
stridsflygplan av typ Saab Gripen. Metoden tar hand om kompatibilitetsproblem i
tids- och positionsdefinitioner i GPS- och radardata.

Preface
This report is part of a master thesis work fulfilled at the department of Computer
Science and Engineering, division of Networks and Systems, Chalmers University of
Technology. The master thesis completes a Master of Science degree in Computer
Science and Engineering. Most of the work is performed at Saab EDS Göteborg at the
section for System Integration and Verification of airborne radars and responsible for
the forward looking radar PS-05/A in service on the Saab Gripen fighter aircraft. The
report is aimed for a reader with technical skills and knowledge in level of an
undergraduate student.
Acknowledgments
I would like to thank all persons working at Saab EDS Göteborg at the section of
Airborne Radar: System Integration and Verification for support and good times.
Especially, I would like to thank Lars Andersson as being my supervisor at EDS and
also Joakim Hemsle for giving me valuable help and aid in practical evaluation
system matters. Further I would like to thank Charlotte Ball and Joakim Alhbin for
giving me the opportunity to accomplish this master thesis at Saab EDS.
I would also like to extend special thanks to my supervisor and examiner Dr. Tor
Aulin at the division of Networks and Systems, department of Computer Science and
Engineering, Chalmers University of Technology.
Last, but not least, I would like to thank my wonderful wife Jenny. Many thanks also
to our respective families helping me and Jenny with child care and support.

List of Abbreviations and Concepts
ASCII American Standard Code for Information Interchange: An
encoding scheme for text characters in computers.
C/A Coarse/Acquisition: An open GPS signal code for civilian use.
CDMA Code Division Multiple Access: Method to share a band of
frequencies by coding of the different signals.
CEP Circular Error Probability: The radius of a circle where 50% of the
population lies within.
CF CompactFlash: Standard for removable memory cards.
COMET Aircraft recording system for the Gripen fighter test aircrafts.
DGPS Differential GPS: Enhancement method to the GPS system, including
two or more GPS receivers.
DOP Dilution of Precision: A time and space dependent value describing
possible accuracy of GPS as a function of satellite geometry. DOP is
sometimes split up into PDOP, HDOP, VDOP and TDOP describing
satellite geometry influence on accuracy in position, horizontal
position, vertical position and time respectively.
MS-DOS Microsoft - Disk Operating System: A text based operating system on
IBM PC computers and predecessor to the graphic user interfaces like
Windows.
EDS Electronic Defence Systems: A business area in the Saab AB Group.
EGNOS European Geostationary Navigation Overlay Service: Satellite
based augmentation service set up to improve navigation for GPS-users
mainly in Europe.
FDMA Frequency Division Multiple Access: Method to share a band of
frequencies by splitting of the available bandwidth.
GALILEO The European GNSS that is set out to be operational in 2014 (as of
May 2010) and is a joint project of the European Space Agency (ESA)
and the European Commission (EC).
GLONASS GLObal NAvigation Satellite System: GNSS constructed by Russian
governments.
GNSS Global Navigation Satellite Systems: Family name for satellite based
systems built mainly for positioning and with global coverage.

GPRS General Packet Radio Service: Standard for data packet transfer,
designed for 2G mobile networks.
GPS Global Positioning System: The first operational GNSS with all-time
global coverage. Built and managed by US governments.
GSM Global System for Mobile Communications: 2nd
generation (2G)
mobile network systems with digital transmission of speech channels.
GUI Graphical User Interface
HDF5 Hierarchical Data Format 5: File format standard designed for large
sets of numerical data.
HOW Hand Over Word: Telemetry word in GPS for synchronization
etcetera.
IE Inertial Explorer: Software from NovAtel providing post-processing
capabilities of GNSS and inertial data.
IMU Inertial Measurement Unit: Unit that reports measurements made by
accelerometers and gyroscopes.
INS Inertial Navigation System: System that uses instruments, same as in
an IMU, to compute position, velocity and attitude of a craft by using a
dead reckoning method.
L1 GPS signal frequency at 1575.42 MHz
L2 GPS signal frequency at 1227.60 MHz
MCS Master Control Station: The main control center, situated in Colorado
USA, from where NAVSTAR GPS is controlled.
MIL-STD-
1553
Military Standard 1553: Serial bus standard developed by US
Department of Defense for use in military avionics.
P(Y) Encrypted GPS signal code for US military and governmental use
solely.
PCMCIA Personal Computer Memory Card International Association:
Standard for interface between PC laptops and peripheral units.
PPS Precise Positioning Service: The non-public service in GPS
positioning.
PRN Pseudo Random Number: Deterministic series of numbers that appear
as if they would be random.
PS-05/A Forward looking radar in service on the Saab Gripen combat aircraft.

RMS Root Mean Square: Statistical measure that indicates the variation
within a quantity.
RTC Real Time Clock: The definition of time used by internal systems in
the Gripen aircraft as it is referred to in this report.
SA Selective Availability: Intentional error that was added to the civilian
GPS signal to degrade performance in the positioning service.
Removed by the US governments in May 2000.
SBAS Satellite Based Augmentation Service: Family name of services that
improve GPS receiver performance by additional satellite signals.
SC System Computer: Central processing unit with interface to all other
sub-systems onboard the Gripen aircraft.
SD Secure Digital: Memory card format
SPAN Synchronized Position, Attitude and Navigation: Positioning system
from NovAtel including GNSS and IMU units integrated with each
other.
SPS Standard Positioning Service: Public GPS positioning service for
civilian use. The domain of GPS used by most subscribers.
SQL Structured Query Language: Computer language designed for
managing of databases.
STT Single Target Track: Air-to-air radar mode in PS-05/A focused on one
prioritized target track.
SV Space Vehicle: A commonly used abbreviation in the GPS area
referring to the GPS satellites.
TOT Time of Travel: The propagation time of an electromagnetic frequency
signal.
USB Universal Serial Bus: Computer interface specification for data
transfer and electric power supply.
UTC Coordinated Universal Time: Time standard used globally as
reference time. A bit simplified, UTC is equal to Greenwich Mean
Time (GMT).
VHF Very High Frequency: Radio frequency band 30-300MHz used by
e.g. FM radio transmissions.
VOR VHF Omnidirectional Radio range: Radio navigation aid system for
air traffic.

WAAS Wide Area Augmentation Service: SBAS system built by US aviation
authorities.
WGS84 World Geodetic System 1984: Standard system for navigation and
maps used in GPS.

Contents
1 INTRODUCTION......................................................................................................................... 1
1.1 BACKGROUND ............................................................................................................................. 1 1.2 PURPOSE ..................................................................................................................................... 2
1.2.1 GPS Inventory................................................................................................................... 2 1.2.2 Method for Comparison of Radar and GPS Data ............................................................. 3
1.3 METHODS ................................................................................................................................... 4 1.3.1 GPS Inventory................................................................................................................... 4 1.3.2 Method for Comparison of Radar and GPS Data ............................................................. 4
1.4 IMPLEMENTATION ....................................................................................................................... 4 1.4.1 GPS Inventory................................................................................................................... 4 1.4.2 Method for Comparison of Radar and GPS Data ............................................................. 5
1.5 SCOPE ......................................................................................................................................... 5
2 GPS INVENTORY – EDS ............................................................................................................ 6
2.1 GPS RECEIVER EQUIPMENT ........................................................................................................ 6 2.1.1 GPS on Ground Based Sensors ........................................................................................ 6
2.1.1.1 Z-Xtreme from Ashtech ............................................................................................................. 7 2.1.1.2 DL-V3 from NovAtel ................................................................................................................. 8 2.1.1.3 SPAN-SE-D from NovAtel together with iIMU-FSAS from iMAR .......................................... 9
2.1.2 GPS on Airborne Saab Gripen Test Aircrafts ................................................................. 10 2.1.2.1 GPS on High-Dynamic Airborne Systems ............................................................................... 10 2.1.2.2 GPS on the Gripen Test Aircrafts ............................................................................................. 12 2.1.2.3 Thales Navigation - Ashtech DG16 .......................................................................................... 13
2.2 GPS POST-PROCESSING METHODS ........................................................................................... 14 2.2.1 Differential GPS ............................................................................................................. 14
2.2.1.1 DGPS – Ground Based Systems ............................................................................................... 14 2.2.1.2 DGPS – Gripen Test Flight ...................................................................................................... 15 2.2.1.3 PNAV ....................................................................................................................................... 15 2.2.1.4 GrafNav .................................................................................................................................... 15
2.2.2 GPS combined with INS – Gripen Test Flight ................................................................ 16 2.2.2.1 Gripen INS Unit ....................................................................................................................... 16 2.2.2.2 Inertial Explorer – Post Processing Software ........................................................................... 16
3 METHOD FOR COMPARISON OF RADAR AND GPS DATA .......................................... 17
3.1 INTRODUCTION TO GRIPEN RADAR TESTS ................................................................................ 17 3.1.1 PS-05/A – Brief Facts ..................................................................................................... 17 3.1.2 Integration of PS-05/A on Gripen ................................................................................... 19 3.1.3 Radar Verification in General ........................................................................................ 20 3.1.4 Gripen Test Flights ......................................................................................................... 21
3.1.4.1 Test Flight Geometry ............................................................................................................... 21 3.1.4.2 Test Flight Recording - COMET .............................................................................................. 23
3.2 TRANSFORMATION OF COORDINATES ....................................................................................... 24 3.3 SYNCHRONIZATION OF DATA .................................................................................................... 25
3.3.1 Data Message from Radar .............................................................................................. 26 3.3.2 Data Message from INS .................................................................................................. 28 3.3.3 Synchronization Process ................................................................................................. 30
3.4 DISTANCE-TO-TARGET MEASUREMENTS .................................................................................. 31 3.4.1 Target Position - Radar .................................................................................................. 31 3.4.2 Distance-to-target – Radar ............................................................................................. 31 3.4.3 Target and Fighter Position – GPS ................................................................................ 32 3.4.4 Distance-to-target – GPS ............................................................................................... 32 3.4.5 Interpolation of GPS data ............................................................................................... 33
3.5 TEST OF COMPARISON METHOD ............................................................................................... 35 3.5.1 Determination of a Maximum Message Delay Time ....................................................... 36 3.5.2 Test Flight #1 .................................................................................................................. 39 3.5.3 Test Flight #2 .................................................................................................................. 41 3.5.4 Test Flight #3 .................................................................................................................. 43

4 CONCLUSIONS ......................................................................................................................... 45
4.1 GPS INVENTORY ....................................................................................................................... 45 4.1.1 Positioning for Ground Based Sensors ........................................................................... 45 4.1.2 Positioning in Test Flight of PS-05/A ............................................................................. 45
4.2 METHOD FOR COMPARISON OF RADAR AND GPS DATA ........................................................... 46 4.2.1 Transformation of Coordinates ...................................................................................... 46 4.2.2 Synchronization of Data ................................................................................................. 46 4.2.3 Test of Comparison Method ............................................................................................ 46
5 REFERENCES ............................................................................................................................ 47
6 APPENDICES ............................................................................................................................. 48

1
1 Introduction
1.1 Background
Saab Electronic Defence Systems (EDS) is a business area of Saab Group AB, a
company with products, services and solutions ranging from military defense to civil
security. Business area EDS is a provider of technical solutions in areas such as
surveillance, threat detection and location. These technical solutions often include
sensors using microwave technique, like radar units. This thesis work is accomplished
at a section within EDS primarily working on integration and verification of PS-05/A.
PS-05/A is a forward looking radar sensor integrated in the Saab Gripen fighter
aircraft, mainly used by the Gripen pilot for target acquisition, ground mapping and
weapon guidance.
The majority of the products from EDS in Göteborg use radar sensor technique. The
main task of a radar sensor is to serve the user with position information on objects of
interest within the radar search volume and range. During test and verification of
radar systems, there is a need to evaluate sensor accuracy and precision. This is
usually done in a comparison of sensor data with benchmarking data from an
independent source. The prevalent method to retrieve benchmarking data for
comparison with radar measurement data is to use satellite based navigation systems.
Positional data on sensor as well as target object are measured by using a suitable
satellite based navigation system, like GPS, see Figure 1-1.
Figure 1-1: Gripen fighter and target – both equipped with GPS.
Position measurements with use of a satellite based navigation system in test and
verification activities are standard procedure today. It is standard procedure not only
at EDS, but also widespread among many other commercial actors and governmental
activities dealing with same positioning issues. However, before satellite navigation
was developed, the retrieval of positional data on moving objects, sensors and targets,
was associated with complicated and quite slow processes. These difficulties were
especially characterized during position measurements of airborne objects. These
measurements formerly demanded great resources in measuring equipment and also
large amount of manual post-processing of data.

2
After the satellite based NAVSTAR Global Positioning System (GPS) was set
operational in the early 1990’s, position data was all of a sudden possible to retrieve
in a significantly less complicated and less expensive process compared to older
methods. However, not with the high accuracy during the first years as is possible
now. But the last ten years the accuracy in data delivered by GPS equipment has
increased to a preciseness that in several cases by far exceeds accuracy requirements
of most radar sensors. This trend has made GPS measurements the predominant
choice of positioning method during radar system development. On top of this there
are several GPS data processing and refining methods able to improve accuracy even
more compared to what the receiving equipment delivers.
The thesis work is divided into two separate parts. The first part is an inventory of
GPS techniques in general. The general inventory is accompanied by a local inventory
of how GPS is used at EDS today. This first part aims to introduce GPS positioning
methods for a broader range of employees at Saab EDS. The later part takes aim on
the specific GPS measurements that are done during Saab Gripen Fighter test flights.
In this part a suitable method is developed describing how GPS position data could be
used in Gripen radar test and verification procedures.
1.2 Purpose
The purpose of this thesis work is to mainly split in two. The first part is an inventory
of the GPS area as a whole and aims to serve as guidance for general GPS
understanding. But it is also an inventory of existing GPS equipment at Saab EDS.
The second part will look into the special case of GPS measurements at Saab Gripen
test flights. We will find a possible method to use GPS measurements when testing,
evaluating or verifying the PS-05/A-radar.
1.2.1 GPS Inventory
GPS in General
Engineers from Saab EDS regularly execute GPS measurements as well as use data
from previous GPS measurements. It is desirable for Saab that the engineers working
with GPS equipment and GPS data have a good basic understanding of the GPS
system. For this reason this report explains fundamental and essential facts about GPS
for a reader with basic technical skills.
GPS Inventory at Saab EDS
The thesis report is also intended to be used at Saab EDS as a more practical
guideline. A guideline aimed for people using available GPS equipment for position
measurements during system tests and verification. The question that this part of the
report considers is: -What equipment and software is available at the company and to
what degree can they help me solve a specific positioning task? Any presumptive
GPS user at the company should with this report be able to get a quick and brief idea
of existing systems at the company. The focus is particularly set on accuracy in output
data as well as system properties and limitations regarding usability. Furthermore,
available software at Saab EDS used for improving GPS data accuracy should be
introduced and described in terms of improved level of accuracy.
3
1.2.2 Method for Comparison of Radar and GPS Data
The main goal of this part of the thesis work is to find a suitable method to compare
GPS data and radar data. The suggested method will take care of existing problems
regarding synchronization and different position coordinate frames between radar and
GPS data. The purpose of developing this method is that it later can be used during
evaluation and verification of other radar measurement quantities of interest, although
these quantities are not covered in this work.
Evaluation of target position data from the PS-05/A radar can be done by comparing it
with position data measurements from another source. In order to evaluate target
position data that by default is radar relative, there is a need to have absolute position
data on both the radar unit as well as the target. Position data on both the Gripen
fighter aircraft carrying the PS-05/A radar as well as the airborne target aircraft are
orderly and as default collected through GPS measurements during Gripen test flights.
There are also methods used at Saab to refine GPS position data. These methods may
refine data to a degree of accuracy where it is assumed to correspond to Saab’s
demands on accuracy level in position data from radar measurements. However, a
comparison of radar data and GPS data is not a straight forward operation. This is due
to two major circumstances which come from the fact that data from radar and GPS
are different in terms of position coordinate frames and definition of time.
Transformation of Coordinates
GPS data and radar data from test flights are expressed by position coordinates in
different reference systems. GPS position data refer to the WGS84 coordinate system.
WGS84 is a globally used standard instance of a normal geographic coordinate
system used on most maps. A position in the WGS84 system is expressed by three
quantities, longitude, latitude and altitude [1]. Radar data are instead expressed in a
local 3-dimensional Cartesian coordinate system. Either GPS positions or target
positions in radar data has to be transformed to the other set of coordinates in order
for them to be comparable with one another. For further introduction of the two
coordinate systems see chapter 3.2.
Time Synchronization of Data
Valid time for GPS data samples are set by using universal time coordinated (UTC)
definition of time. Radar data on the other hand is set to an internal aircraft definition
of time with no obvious connection to UTC. A comparison of the two entities needs
the two data sets to be synchronized in time. The purpose of this part is therefore to
find a suitable method to synchronize the two different definitions of time.
Method to Evaluate Radar Data – Distance-to-target Measurements
A method to compare radar quantities with GPS measurements can be developed
when radar and GPS data are set into comparable position coordinate frames as well
as synchronized by the same definition of time. One of the most interesting
measurement quantities for any military radar unit is the ability to measure distance to
target with best possible accuracy. This part aims to find a suitable method to evaluate
distance-to-target measuring. The method is applied on test flight data to verify the
functionality of the method itself.

4
1.3 Methods
1.3.1 GPS Inventory
GPS in General
The report aims to describe and cover the GPS area in general and consequently the
work starts off with an extensive study of GPS literature, articles, and papers as well
as published material on official GPS internet sites.
GPS Inventory at Saab EDS
Information for the next part, focusing on GPS receivers and software used at Saab, is
gathered with help from, and in cooperation, with employees working with GPS
applications at both Saab EDS in Göteborg and Saab Aeronautics in Linköping.
Furthermore, product manuals together with other printed and internet based material
from manufacturers have been studied to gather information on the different products
subject to the local GPS receiver and refining software inventory.
1.3.2 Method for Comparison of Radar and GPS Data
Transformation of Coordinates
Transformation of any position coordinates from one coordinate system to another are
done by commonly used algorithms from the Swedish mapping, cadastral and land
registration agency, Lantmäteriet. Lantmäteriet is an accepted authority in the area of
position measurements why these algorithms are assumed to be sufficient for this
work.
Time Synchronization of Data
Radar data and GPS data is possible to be synchronized in time if a useful link
between the two different definitions of time can be found. Such link is assumed to
exist and be found in data from test flight recordings. This process needs a relative
deep knowledge regarding the in-flight recording system used during test flights.
Method to Evaluate Radar Data – Distance-to-target Measurements
A comparison is done visually by plotting of radar data, with GPS data set as
reference, during three radar exposure intervals.
1.4 Implementation
1.4.1 GPS Inventory
GPS in General
Study of GPS in general is performed to get an overall understanding of the system,
its facilities and limitations. All adequate general GPS information is compiled into
Appendix A. Appendix A is aimed to serve as a GPS reference for the main report,
but can also be used as optional reading by any other reader that wants a brief walk-
through of GPS and satellite navigation theory. Appendix A describes the GPS system
through its history, system properties, functionality and also future development in the
area of global navigation satellite systems (GNSS).

5
GPS Inventory at Saab EDS
The available GPS measuring equipment used during live tests at Saab EDS are
reviewed including properties such as measurement accuracy stated by the
manufacturer. But the chapter also covers any requirements on peripheral equipment
such as power adapters and data logging devices. Requirements on peripherals may
affect measurements practically and/or introduce limitations in challenging
environments.
The next step is to look at GPS data refining processes to get an understanding of how
position data can be more precise compared to raw data. Different software solutions
are studied during this phase.
1.4.2 Method for Comparison of Radar and GPS Data
GPS data and radar data from test flights are delivered to EDS in a packed format not
suitable for processing or analysis. For processing and analysis of radar data
Mathworks Matlab is a commonly used software environment at EDS. Matlab is also
chosen for this part of the thesis work.
The first step is to transform the GPS and radar data from the original HDF5 format to
a manageable format before any data processing and analysis can be done. The
analysis of data is done in Mathworks Matlab software and for that purpose the data
sets are added into compatible databases with specially designed scripts.
Transformation of Coordinates
Scripts for use in Matlab environment are written during the thesis work to transform
position data according to algorithms from Lantmäteriet described in Appendix B.
Time Synchronization of Data
All data messages transmitted in the aircraft bus-system are recorded in special test
flight equipment. The registration equipment is synchronized with the UTC definition
of time and marks all incoming messages with time of arrival in UTC. This time-
stamp on messages that includes information on internal aircraft time is intended to be
used as a link between the two different definitions of time and thus also for
synchronization between them if the link is useful.
Method to Evaluate Radar Data – Distance-to-target Measurements
The radar distance-to-target estimate over time is visually displayed by plotting all
radar measurement samples on a picture of a fighter aircraft to get a quick view of
how the measurements are distributed. This picture is completed with a histogram to
describe the spread of the measurements.
1.5 Scope
Verification of GPS measurements with any other positioning method to determine
the absolute accuracy in GPS data is of course desirable. However this work will not
cover position measurements by any other method than GPS, as this requires more
resources and time than available in a master thesis work.

6
2 GPS Inventory – EDS
This chapter is a reviewing inventory of available GPS equipment, GPS data
processing methods used for test and verifications of the PS-05/A radar and ground
based systems developed at Saab EDS.
2.1 GPS Receiver Equipment
2.1.1 GPS on Ground Based Sensors
Tests and verifications of ground based sensor systems can take place in different
terrains and elements. The basic idea during test and verification of these systems is to
compare relative position measurements from the sensor with absolute position
measurements from GPS equipment. Sensor systems in subject to tests are either
static placed on ground or mounted on an off-shore operating vessel in a more
dynamic environment. The targets that are subject to the sensor measurements are in
most cases airborne vehicles of any kind, but can also be ships. In tests and
verification of the systems there is a need to have position data on both sensor and
target for comparison with sensor measurements.
GPS measurements for ground based sensor verification are done with different sets
of equipment. The receivers are from different manufacturers and thus afflicted with
different behaviors. This chapter will be a walk-through of available GPS equipment
on Saab EDS including important system properties and expected quality in output
data together with brief pros and cons of the different systems.
7
2.1.1.1 Z-Xtreme from Ashtech
Satellite Tracking: 12 channel simultaneous GPS satellite tracking.
Log Function: PCMCIA card slot for internal removable storage.
Log Setup: Setup of log variables can be done via the front panel but also from a PC
via serial port.
Power Supply: Built-in battery providing up to 10 hours of operation. For longer
operation or back-up power there is also an input for external power +10 to +28V DC.
Operation Setup: Since the data log is stored internally it only needs one connection
in form of satellite signal input from the antenna. It is possible to connect the receiver
to a PC on a serial link for parameter settings before and during operation but most of
the parameters can be set via the receiver front panel.
Output Data: Downloading of data is done from receiver to PC over serial link or
direct from the PCMCIA memory card if the PC has a driver to read that type of
memory card. Downloading of data must be done with Ashtech software and the
procedure results in binary and ASCII-files each containing different parts of
measurements.
Position accuracy - Manufacturer Technical Specification:
Stand-alone N.A.
DGPS < 1 m RMS

8
2.1.1.2 DL-V3 from NovAtel
Satellite Tracking: GPS and GLONASS satellites simultaneously tracked on 72
available channels.
Log Function: Compact Flash (CF) card slot for internal removable storage
availability or connection to an external PC.
Log Setup: Connect receiver to PC installed with NovAtel software to edit log
variables.
Power Supply: External power +9 to +28V DC.
Operation Setup: If logging to internal CF-card is done the receiver unit only needs
connection to GNSS antenna and external power from an adapter. For external
logging a PC is connected to the receiver via Ethernet, USB, Bluetooth or serial port
and the NovAtel software is used to administrate the process. When downloading data
from the internal CF-card after measurements are completed, the NovAtel software is
also used.
Output Data: If internal CF-card logging is used the download of data is either done
by direct receiver connection to PC or by putting the CF-card in a card reader
connected to the PC. Output data has to be subject to further analysis or post-
processing by using for example the GrafNav software from NovAtel.
Position accuracy - Manufacturer Technical Specification:
Stand-alone L1 1.8 m RMS (single frequency)
Stand-alone L1/L2 1.5 m RMS (dual frequency)
DGPS 0.45 m RMS

9
2.1.1.3 SPAN-SE-D from NovAtel together with iIMU-FSAS from iMAR
Satellite Tracking: GPS and GLONASS satellites simultaneously tracked on 72
available channels.
Log Function: Secure Digital (SD) card slot for internal removable storage
supplemented with real-time logging on external PC.
Log Setup: Receiver setup is made from PC using NovAtel CDU (Control and
Display Unit) software.
Power Supply: External power +9 to +30V DC.
Operation Setup: Receiver is connected to one or two antennas and IMU. PC may be
connected for log functions and receiver monitoring
Output Data: Measurement output data can be stored on the SD-card or logged in
real-time on a PC. Data format for each variable-file can be set to either binary or
ASCII.
Two-antenna Installation: The SPAN system is able to install with two antennas to
enable a heading output from a static system.
GPS/INS Integration: The NovAtel SPAN system is able to combine two
completely different technologies in a single measuring unit. SPAN uses GNSS
measurements from GPS and GLONASS (if available) together with inertial
measurements forming an integrated GNSS/INS system. Inertial measurements are
carried out by an IMU (inertial measurements unit) connected to the SPAN GNSS
receiver. For position solution a SPAN system can use the two measurements in a
combined position solution but also provide the user with a GPS-only position. The
SPAN implementation at EDS is a SPAN SE-D receiver together with the inertial
measuring unit iIMU-FSAS from the German company iMAR. The receiver has a
two-antenna installation giving the availability to present the direction, or heading, of
the SPAN system installation. The heading is derived from base-line calculation from
the two antennas using their respective geographic positions.
Position accuracy - Manufacturer Technical Specification:
GPS only
L1 1.8 m RMS (single frequency)
L1/L2 1.5 m RMS (dual frequency)
DGPS 0.45 m RMS
GPS/INS [2]
North 0.038 m RMS
East 0.034 m RMS
Height 0.033 m RMS

10
2.1.2 GPS on Airborne Saab Gripen Test Aircrafts
In verification and tests of various systems onboard an aircraft, like the Saab Gripen
fighter, there are quite often demands to continuously be able to record where in space
and time the aircraft is. Determination of the relative or absolute position of a flying
object is, however, not an elementary task. The dynamic airborne environment of a
fighter aircraft introduces a few additional constraints compared to a static ground
based environment.
- A relatively long distance to any observer of the object results in great impact for
errors in angular measurements.
- The lack of reference objects close to an object flying in free space gives no ability
to compare aircraft position with other fixed objects.
- Relative high speed on the object leads to strict timing requirements to get adequate
accuracy in position measurements.
The history of aircraft position measurements at Saab involves methods such as
photogrammetry and theodolite measurements. Both of them require quite extensive
measuring equipment as well as a large number of operating people. Furthermore,
these methods were bound in geography to a predetermined area where equipment
used for the measurements was installed. This made all positioning measurements on
airborne objects quite inflexible and complex. These methods also demand a clear
line-of-sight, leading to lot of constraints on suitable weather during measurements.
Since GPS can produce positional data with high accuracy it is now the back-bone in
position measurements in Gripen flight test and verification programs. GPS is also
versatile as it is global and all-weather operational. Cost effectiveness for users are
also substantial as the infrastructure including satellites and ground installations is
already in place and provided by other interests.
2.1.2.1 GPS on High-Dynamic Airborne Systems
Compared with most other environments where GPS is used, the airborne platform
and the environment where it operates is a challenging one with special properties.
These challenges together with demands on data response time and quality set the
standard for what equipment and methods to be used in airborne positioning.
Below are two examples of what problems an airborne GPS receiver has to deal with.
Generally it is difficult to get transparency in how receiver manufacturers tackle these
problems. However, usually the product manual states any limits of the operational
envelope of the receiver. The operational envelope of a GPS receiver is typically
limited by several physical conditions, as for example temperature and acceleration.
Outside the envelope the product cannot be guaranteed full performance.
Interrupted line-of-sight to satellite
For a maneuvering aircraft in general and military fighters in particular, turns and
other dynamics leads to that the aircraft continually will experience a lot of different
attitudes. This means that it may rotate around all three axes in space during dynamic
flight phases. With a single roof-top installed antenna, as it is on the Gripen, the best
conditions for satellite acquisition are when flying straight forward in level flight with
the antenna pointing straight up. The roof-top antenna is an obvious design choice
since most of the airborne time is done in level flight even on a dynamic platform like
a combat aircraft. The antenna on the Gripen has an approximate coverage of 180˚.

11
This makes signal propagation to the antenna difficult when satellites are located in
relative position under the fuselage, see Figure 2-4. That happens for example nearly
always in hard turns when banking angles are approximately 90˚. Even if the receiver
has signal acquisition from eight or more satellites before turning, this constitutes a
problem since time of re-acquisition on each signal usually is in order of 10-20
seconds. This makes the number of valid signals for a given moment in time during a
hard turn drastically lower and sometimes below the required number of four satellite
signals. A receiver does not deliver any positional data during a period with three or
less satellite signals tracked. This result in a gap in the position data trajectory
produced during a test flight.
Figure 2-1: A turning aircraft with a partially shaded GPS antenna.
However, this problem can be dealt with by using other measuring methods during
periods of loss of GPS data. One solution is to use inertial navigation techniques with
use of gyros and accelerometers in a dead-reckoning method to update positional data
until GPS data is available again. The Gripen aircraft regularly uses the dead-
reckoning method with its Inertial Navigation System (INS) that can deliver fully
autonomous navigational data during GPS outages as well as combine it with GPS
positioning. This can be done in real time or by post-processing of data.
Lateral accelerations/High G-force
During any acceleration, a GPS receiver will experience a slight frequency shift of the
satellite signal carrier as a result of the Doppler Effect. This can be challenging for
any GPS receiver not constructed for these events. A normal handheld GPS receiver
in low dynamic environments will not experience this effect to any great extent. On
the contrary, a GPS receiver for use with military fighters with lateral accelerations up
to 9G in turns must deal with the Doppler Effect in an acceptable way. One way to
deal with frequency shifts is to make the bandwidth for signal tracking wider.
Opposed to this more dynamically robust method stands the fact that a wider
bandwidth leads to increased thermal noise sensitivity for GPS receivers [3].
12
2.1.2.2 GPS on the Gripen Test Aircrafts
To obtain sufficiently precise position measurements from flight tests of the Gripen
fighter there are installations of an additional GPS receiver on board the designated
test aircrafts. The additional receiver is a Thales DG16 unit with characteristics
according to the manufacturer that fully covers the whole Gripen flight envelope. This
means that the receiver characteristics are sufficient to all possible speeds,
accelerations and altitudes for the Gripen aircraft.
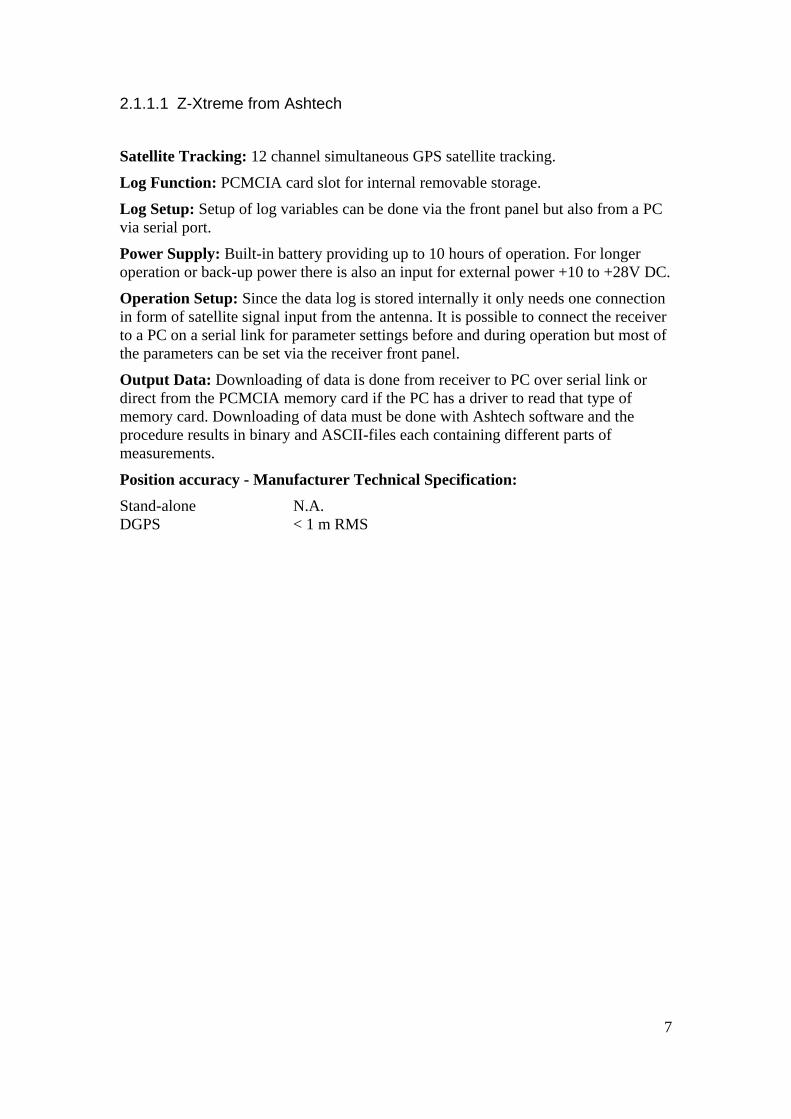
DG16 shares GPS antenna with the integrated GPS unit and is placed on the upper
ridge of the aircraft fuselage and the antenna installation point is where all GPS data
refer to as aircraft position, see Figure 2-5. Since the DG16 is installed as a one-
antenna receiver it may suffer from interrupted line-of-sight problems during aircraft
maneuvering. This problem may cause passages with no GPS positioning during data
collection due to not enough number of satellites within visible range. Since re-
acquisition of satellite signals can take 10-20 seconds, a hard maneuvering Gripen
fighter will have problem to regain sufficient number of satellite signals for any given
moment during maneuvering.
Figure 2-2: Schematic picture of GPS antenna position on Saab Gripen.
13
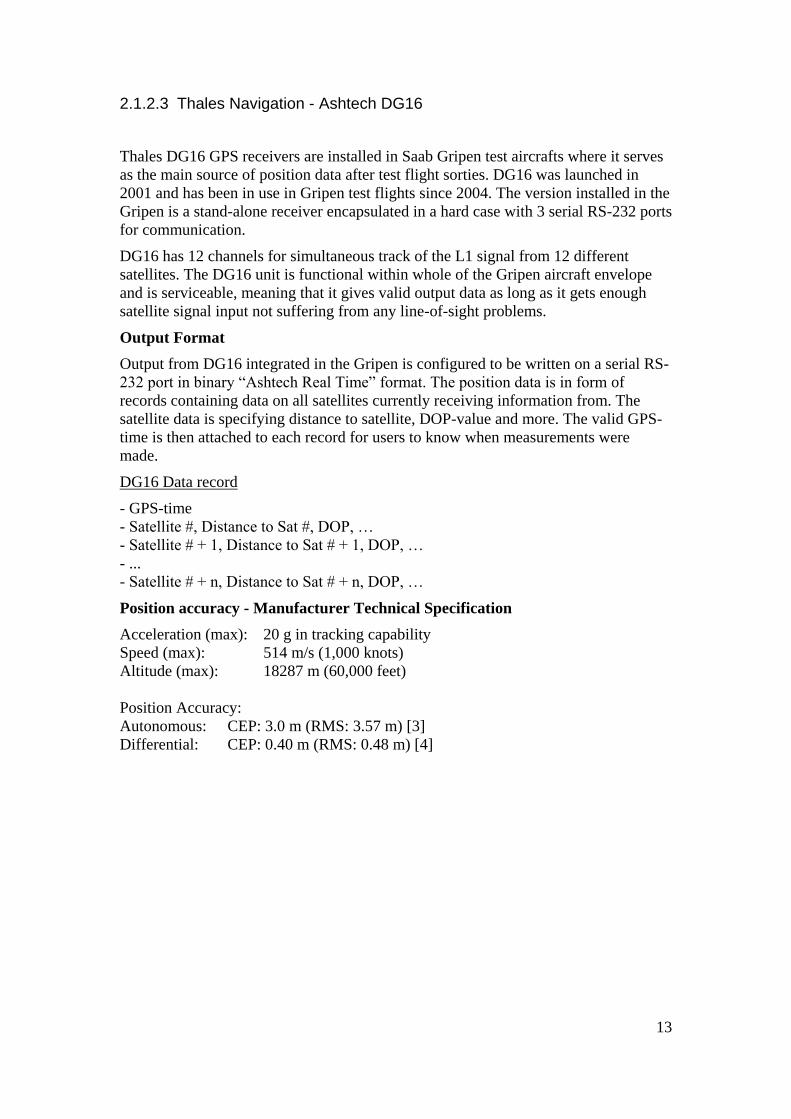
2.1.2.3 Thales Navigation - Ashtech DG16
Thales DG16 GPS receivers are installed in Saab Gripen test aircrafts where it serves
as the main source of position data after test flight sorties. DG16 was launched in
2001 and has been in use in Gripen test flights since 2004. The version installed in the
Gripen is a stand-alone receiver encapsulated in a hard case with 3 serial RS-232 ports
for communication.
DG16 has 12 channels for simultaneous track of the L1 signal from 12 different
satellites. The DG16 unit is functional within whole of the Gripen aircraft envelope
and is serviceable, meaning that it gives valid output data as long as it gets enough
satellite signal input not suffering from any line-of-sight problems.
Output Format
Output from DG16 integrated in the Gripen is configured to be written on a serial RS-
232 port in binary “Ashtech Real Time” format. The position data is in form of
records containing data on all satellites currently receiving information from. The
satellite data is specifying distance to satellite, DOP-value and more. The valid GPS-
time is then attached to each record for users to know when measurements were
made.
DG16 Data record
- GPS-time
- Satellite #, Distance to Sat #, DOP, …
- Satellite # + 1, Distance to Sat # + 1, DOP, …
- ...
- Satellite # + n, Distance to Sat # + n, DOP, …
Position accuracy - Manufacturer Technical Specification
Acceleration (max): 20 g in tracking capability
Speed (max): 514 m/s (1,000 knots)
Altitude (max): 18287 m (60,000 feet)
Position Accuracy:
Autonomous: CEP: 3.0 m (RMS: 3.57 m) [3]
Differential: CEP: 0.40 m (RMS: 0.48 m) [4]

14
2.2 GPS Post-Processing Methods
What has been described in previous chapters concerning data quality is what can be
achieved with measurements from a single stand-alone GPS receiver. However, GPS
data can be refined using post-processing methods if supplementing measurements
has been done simultaneous to the original measurements. Position data quality can be
improved to some degree depending on refining method and quality on additional
measurements. Two different methods of position measurement refining are available
at Saab for use on data from tests and verifications at EDS. The dominating method is
differential GPS and that is normally used as standard during all tests. The other
method is to combine GPS measurements with inertial measurements consisting of
gyro- and accelerometer measurements.
2.2.1 Differential GPS
One of the most common GPS refining methods is differential GPS (DGPS). DGPS
can be explained as a family name of several related procedures. Common to all
DGPS procedure is that position measurements are corrected for errors introduced by
for example atmospheric delays, satellite clock biases and satellite position
inaccuracies. The DGPS procedures include at least two receivers to reach desired
result, a rover receiver and a minimum of one reference receivers. The rover receiver
is making measurements on the unknown location and the reference, or base,
receivers are placed on well-known positions, preferably not too far from the rover
receiver. The reference receiver is usually only one set of equipment placed on a
single location. But in some installations there can be several reference receivers
forming a grid with a more advanced DGPS capability.
The differential correction in DGPS is generally done by using the additional
simultaneous measurements from the reference receiver. These additional
measurements result in a continuous error estimate covering the interval of interest
that can be used for the differential correction as described in Appendix A.
Standard procedure at EDS for all measurements in focus during the thesis project is
post-processing of GPS data with differential methods. Compared to stand-alone GPS
measurements, with a typical accuracy in position somewhere below 10 meters, the
differential methods can offer position measurements of a decimeter level [4]. As it is
a well-established, precise and a rather easy-to-use method, DGPS has become the
choice for positioning in many system tests at Saab.
Differential processing of data is done post tests using various software solutions
described below.
2.2.1.1 DGPS – Ground Based Systems
Position measurements during tests of ground based systems are by default done with
DGPS methods. For this reason a reference station is always placed on a suitable site
among several pre-defined locations for logging of additional differential
measurements. Position data from the reference station must be recorded during the
whole interval where DGPS processed position data is wanted. Therefore a reference
station must be up and running during the whole test interval.
The post-processing of reference and rover GPS data after tests of ground based
systems is done in either PNAV 2.2.1.3 or GrafNav 2.2.1.4 described in respective
chapters.

15
2.2.1.2 DGPS – Gripen Test Flight
Measurement of reference position data during Gripen test flights is carried out
through a GPS reference station with an Ashtech DG16 receiver. This receiver is
similar to the airborne receiver installed in the Gripen and positioned right by the
runway at Saab airport in Linköping during operation. The measurements are logged
to be used later for refinement of GPS data from the aircraft with DGPS post-
processing.
The post-processing of differential GPS data is done with the GrafNav tool from
NovAtel using the GPSRefinery GUI. The process is standard procedure after all
flight tests and the EDS PS-05/A verification section are regularly subscribers of the
DGPS data. The GPS data sets that are delivered to EDS includes 3-dimensional
position, UTC-timing, velocity estimate, number of tracked satellites as well as
quality measures all sampled in 1-2 Hz frequency. GPS data recording covers the
whole flight sortie from power up to shut down of aircraft systems.
For more GrafNav information see 2.2.1.4 GrafNav chapter.
2.2.1.3 PNAV
The Ashtech PNAV (Precise Differential GPS Navigation and Surveying) software is
designed for differential post-processing and runs in a MS-DOS environment. The
only GPS data format that PNAV processes is binary files produced as output from
the relatively older Ashtech GPS receivers. The program is not very instructional but
a quite fast tool to use for the experienced user.
The accuracy in position data from PNAV varies from case to case since accuracy in
the output depends on many external variables. However, the reference manual states
accuracy in position within 1-3 meters RMS, according to the manufacturer’s
technical specifications. This level of accuracy will be achieved with at least 5
satellite locks, PDOP < 4, separation between reference and rover receiver < 10 km
and C/A code phase tracking. Verification of PNAV accuracy has been done at Saab
Aeronautics. Position data for this verification was taken from airborne GPS receivers
and benchmarking data was measured with photogrammetry. The verification showed
accuracy in position down to 1.0 meters RMS, cited in [6].
2.2.1.4 GrafNav
GrafNav is a Windows based differential GPS post-processing software from
Waypoint Consulting, a group within the NovAtel Company. GrafNav uses a lot more
GUI (Graphic User Interface) features and solutions compared to the MS-DOS based
PNAV software.
The accuracies in position output are, in the dynamic user case, stated in the product
specification to be below 10 cm with a 10 km long baseline during carrier phase
tracking. The code phase tracking accuracy is not stated but according to a study at
Saab Aeronautics cited in [6] the accuracy of code phase tracking positioning on an
airborne fighter is comparable to that of PNAV and then approximately 1.0 meters.

16
2.2.2 GPS combined with INS – Gripen Test Flight
During favorable conditions there can be large benefits in combining output data from
GPS and INS described more in detail in appendix A. A possible GPS/INS solution is
provided for in the Gripen test aircrafts. This solution is a post-processing method
using data from the test aircraft GPS receiver together with the standard built-in INS
unit.
2.2.2.1 Gripen INS Unit
The Gripen aircraft has an INS unit responsible for run-time position estimation
during test flights as well as normal operations in non-test flight configurations. The
position estimate from the INS unit with support from a GPS receiver is a provider of
position data to all Gripen sub-systems. This GPS receiver is not to be confused with
the extra GPS receiver in test aircrafts that instead produces position data for post
sortie analysis only.
The INS is physically fixed to the aircraft to be able to record all changes in speed and
attitude. With three gyros and three accelerometers the INS unit measures rotation
around three axes and also accelerations along same three axes. The gyro
measurements can track all changes in attitude of the aircraft. Aircraft attitude is
determined by how it is orientated relative another reference system which usually is
a system fixed to the Earth. With gyro measurements the INS is able to measure how
the local aircraft reference system is angularly orientated relative to a geo-fixed
reference system. With accelerometer and gyro measurements the INS unit can
calculate position changes over time to keep track of how the aircraft reference
system is moving within the geo-fixed system by using a dead-reckoning method. The
gyros and accelerometers together form a navigation solution that can keep track of
aircraft position during operation after first being initialized in an alignment
procedure.
In-flight navigation in all Saab Gripen test aircrafts is carried out by the INS unit.
During test flight this unit also provides the test registration system with raw inertial
measurements from accelerometers and gyros. The inertial measurement data may be
processed after test flight sorties together with GPS data using GPS/INS post
processing software.
2.2.2.2 Inertial Explorer – Post Processing Software
The Inertial Explorer (IE) software from NovAtel is developed for post-processing of
data from GNSS (Global Navigation Satellite System) measurements together with
data from an IMU (Inertial Measurement Unit). For post-processing of Gripen test
flight position data the input to IE are GNSS data from the Thales DG16 GPS unit and
IMU data from the integrated INS unit.
The product specifications of Inertial Explorer state that IE may produce position data
with accuracy down to 1 cm horizontally and 1.5 cm vertically during full GPS
coverage and otherwise good conditions. It is very hard to verify this statement in the
special case of position measurements on an airborne Gripen aircraft due to lack of
comparable metrics with accuracy good enough to serve as benchmark. However, in
comparisons between data from IE and theodolite measurements with an accuracy of
0.5 meter, IE shows very good performance. Thus we assume that IE has a better
position accuracy output compared to what GrafNav produces from test flights.

17
3 Method for Comparison of Radar and GPS Data
3.1 Introduction to Gripen Radar Tests
Chapter 3.1 covers general facts about the radar unit PS-05/A. The chapter also
includes a description of the integration in the Gripen aircraft. Furthermore, flight test
of the radar unit is described briefly together with a description of how data is
recorded during these tests.
3.1.1 PS-05/A – Brief Facts
The PS-05/A is a Pulse Doppler
forward looking radar working on the
X-band. It is in service on the Saab
Gripen fighter aircraft since 1992 and
installed in the front part of the aircraft,
see Figure 3-1. The PS-05/A unit is a
radar unit with multi-mode
functionality. That is the radar has the
ability to switch mode depending on
how the pilot sets the system to
optimize it for different mission types.
The radar functionalities include air,
ground and sea target acquisition, ground mapping, weather mapping as well as link
functions for use in missile guidance. In air-to-air mode the radar provides guidance
on target position for pilot as well as for sensors and weapon systems. The target
information includes distance, relative angular direction and velocity on the target
together with a lot of internal system data.
In a very short explanation of radar physics a radar unit can find and sort out objects
or targets within its range through three steps:
1. The radar emits an electromagnetic signal in a precisely specified direction.
2. If the signal hits any reflecting surface on its way a portion of the signal
energy may be reflected back to the emitting radar.
3. The signal answer that is received by the radar is analyzed and the reflecting
surface is determined to have a position relative to the radar given by signal
travel time, the speed of light and the direction of the radar.
The amount of energy reflected back to the radar ( ) is given by the general radar
equation in free space stated below. As given by the equation the received energy ( )
is inversely proportional to distance-to-target here denoted as range ( ). The
equation will not be explained in any other detail here. The interested reader is
recommended to continue with reference literature on the matter [7].
Figure 3-1: Installation of PS-05/A on a Saab Gripen.
General Radar Equation.

18
As mentioned earlier PS-05/A is a Pulse Doppler radar unit. The radar looks for any
possible frequency shift of the received signal to improve target acquisition properties
compared to older radar techniques. When a radar pulse hits an object that has a
relative velocity towards or away from the radar emitter the frequency of the reflected
signal will be slightly shifted compared to the emitted signal. This frequency shift is
the result of the Doppler Effect. Doppler radars use this effect to filter out moving
objects from the massive background noise reflected from the ground. The filter
algorithms use the fact that the ground below the aircraft has a well-known relative
velocity. By this filtering the radar can sort out objects that after further analysis may
be recognized as targets on ground or in the air [8].

19
3.1.2 Integration of PS-05/A on Gripen
The Gripen fighter aircraft is a fourth generation combat aircraft meaning, in one
sense, a fully integrated system with all sub-systems controlled by a system computer
(SC). This design principle is sometimes popularly described as a system of systems
and stands in contrast to earlier generations of combat aircrafts. Sub-systems in
former combat aircrafts were not integrated to the same level as in the Gripen, but
were instead more of stand-alone systems. The integrated design principle in a
modern combat aircraft gives accessibility to information between different sub-
systems. It also gives the SC an ability to use input data from different sources in data
fusion processes to enhance the decision support for the pilot. Transmission of
information between the different systems is physically implemented in a military
standard MIL-STD-1553 bus-system. The SC has a role of being both bus-controller
and hub for the 1553-buses during normal operation, and the SC regularly processes
data from all the sub-systems.
PS-05/A is a vital sensor system on the Gripen as it gathers information from beyond
pilot visual range. This information is visualized on graphic displays to support
situation awareness for the pilot. Data from the radar unit is also delivered to other
sub-systems for use in weapon preparation for example. The radar unit is fully
integrated as one of the sub-systems on board the aircraft giving that all key
information on targets and radar status may be transmitted to the SC as well as to
other systems. Transmission of radar data is carried out via the 1553 bus-system. This
fact will prove to be very valuable for a fast and relatively easy access to radar data
used in this work.
Figure 3-2: Cut-away picture of a Saab Gripen fighter.
PS-05/A

20
3.1.3 Radar Verification in General
There are several means to verify a radar unit like the PS-05/A. This chapter will not
cover any deeper analysis of the various aspects on radar verification. But it is
justified to clarify what basic and important quantities that any radar measure and
hence what quantities that usually are verified on a radar unit. These quantities are
namely interesting when doing a comparison of radar and position data.
What generally can be said about fundamental properties in the output of any radar
unit is that the more predominant ones are accuracy in angular, distance and velocity
measurements as well as possible detecting range. There are of course other important
aspects as for example robustness but during an established target tracking phase the
velocity and position measurements are of greatest interest.
One way to verify accuracy in distance and angular measurements can be made by
comparisons between data from the radar with data from a completely different
source. This can be achieved by retrieving comparison data from position measuring
systems mounted on both carrier of radar unit and target object. When verifying a
certain level of accuracy in radar data it is obvious that the accuracy level in the
benchmarking position data must be at least better. Therefore position data with
accuracy on a preferably higher level than the specified radar accuracy is desirable
when doing a measurement comparison.
In this work the benchmarking data is solely taken from GPS measurements made
during the test flight sorties.

21
3.1.4 Gripen Test Flights
Most of the tests during aircraft development are done in simulated environments but
some tests have to be done in a real operational context during flight. The Saab Flight
Test & Verification department at Saab Aeronautics in Linköping is responsible for
test flights of the Gripen aircraft. Flight tests of PS-05/A are performed by staff from
this department but the geographic location for test sorties can be other than
Linköping depending on type of flight test.
3.1.4.1 Test Flight Geometry
Figure 3-3: Examples of different relative geometries.
As described earlier the PS-05/A is a forward looking radar unit. That is why radar
data on any target can only be measured when the aircraft carrying the radar is
pointing toward a target within radar range and aspect limitations. On the contrary the
target may have any attitude around all three axes. This leads to geometrical
requirements on the aircraft trajectories during radar test flights where target aircraft
need to be somewhere in front of the test aircraft during a radar test exposure, see
Figure 3-3.
Depending on what aspect angle the radar sees a target, see Figure 3-4, the amount of
reflected radar energy received by the same radar unit may differ a lot. This
phenomenon is quantified by the radar cross section concept. Although radar cross
section is expressed by square measures it does not reflect the exact physical area of
an object seen from a certain view. Instead it indicates the radar reflection properties

22
of an object seen from different aspect views. It is dependent on, for example, how the
object is shaped and from what materials it is built. Furthermore the center-point of
reflection on an object may also differ due to aspect angle. Relatively small changes
in aspect can lead to major changes in radar response in a non-uniform and also hard
to predict dependency [7]. Therefore dynamic aircraft trajectories on either test or
target aircraft during radar measurements can be somewhat challenging as the
dynamics will have some influence on measurements. For this work, when looking at
accuracy down to meter-level, we try to use test flight phases with low-dynamic radar
exposures that aims for low fluctuations in radar cross section area during the
exposure.
Figure 3-4: Picture exemplifying 3 different aspect angle views
on an aircraft, in this figure exampled with a Gripen.

23
3.1.4.2 Test Flight Recording - COMET
In test flights the Gripen aircrafts use the COMET recording system. The COMET
system records all traffic on the bus-system for post-flight evaluations, as described in
Figure 3-5. Along with many other inputs COMET saves all message records that are
transmitted on the buses and gives them a time stamp indicating when it arrived to
COMET. The time stamping function is synchronized with GPS time and marks all
incoming data records with arrival time referred to UTC. UTC is a time standard that
is widely used as the leading reference time in the world. GPS time is easily converted
to UTC and therefore most GPS receivers present time with UTC used as base.
Radar data with target information are transmitted from the radar unit to the system
computer on the bus system in a pre-set and uniform frequency rate. These bus
transfers entail that all transmitted radar data are recorded in COMET. COMET is not
the only recording system for radar data during a test flight sortie. But it is the most
suitable for the purpose of this work since COMET data have all parameters of
interest and are relatively easy to access. Normal procedure after radar flight tests
sorties having been run by Saab Aeronautics in Linköping is that recorded data sets
from COMET are delivered to Saab EDS in Göteborg. These data sets are then
subject to further analysis of radar behavior and performance.
Figure 3-5: Schematic picture with COMET and aircraft infrastructure.
24
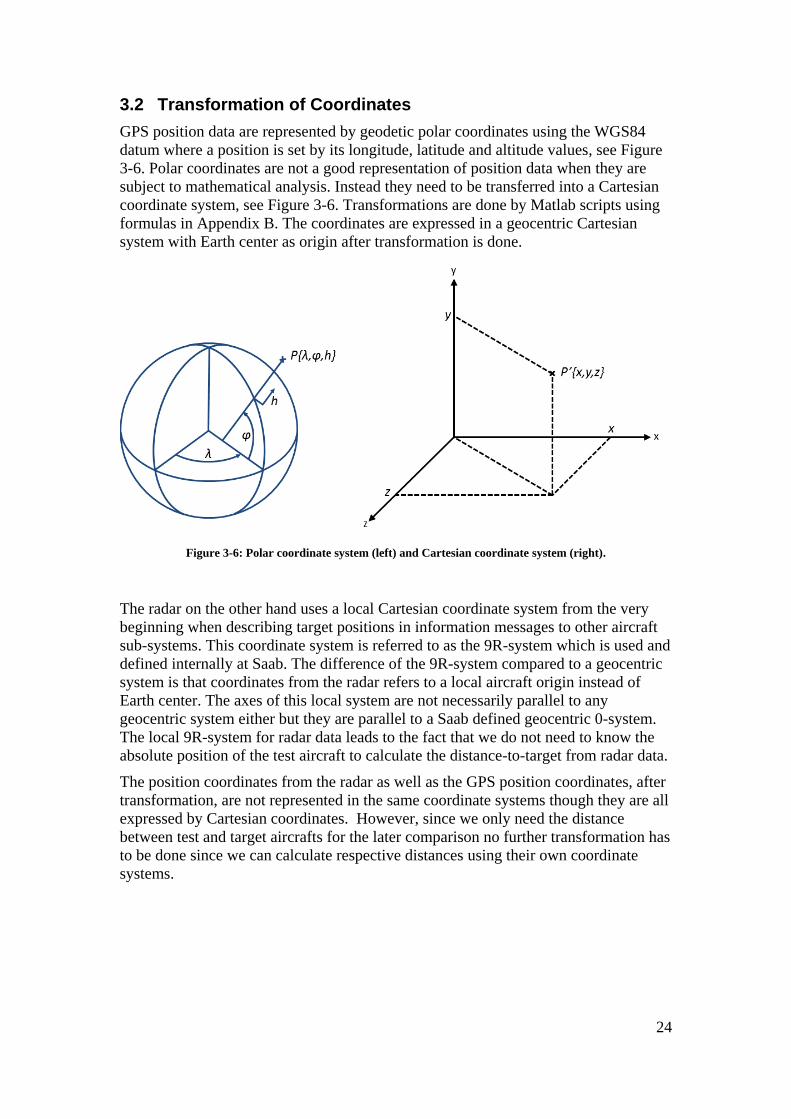
3.2 Transformation of Coordinates
GPS position data are represented by geodetic polar coordinates using the WGS84
datum where a position is set by its longitude, latitude and altitude values, see Figure
3-6. Polar coordinates are not a good representation of position data when they are
subject to mathematical analysis. Instead they need to be transferred into a Cartesian
coordinate system, see Figure 3-6. Transformations are done by Matlab scripts using
formulas in Appendix B. The coordinates are expressed in a geocentric Cartesian
system with Earth center as origin after transformation is done.
Figure 3-6: Polar coordinate system (left) and Cartesian coordinate system (right).
The radar on the other hand uses a local Cartesian coordinate system from the very
beginning when describing target positions in information messages to other aircraft
sub-systems. This coordinate system is referred to as the 9R-system which is used and
defined internally at Saab. The difference of the 9R-system compared to a geocentric
system is that coordinates from the radar refers to a local aircraft origin instead of
Earth center. The axes of this local system are not necessarily parallel to any
geocentric system either but they are parallel to a Saab defined geocentric 0-system.
The local 9R-system for radar data leads to the fact that we do not need to know the
absolute position of the test aircraft to calculate the distance-to-target from radar data.
The position coordinates from the radar as well as the GPS position coordinates, after
transformation, are not represented in the same coordinate systems though they are all
expressed by Cartesian coordinates. However, since we only need the distance
between test and target aircrafts for the later comparison no further transformation has
to be done since we can calculate respective distances using their own coordinate
systems.
25
3.3 Synchronization of Data
Comparison of GPS and radar data cannot be done unless they are synchronized in
time. Valid time for GPS data samples is only expressed in UTC. Radar data
messages with target information are instead tagged with valid time expressed by the
internal aircraft real time clock (RTC) as reference. RTC is a definition of time used
in several aircraft systems on the Gripen for internal synchronization within time
dependent sub-systems. RTC is initiated and set to zero when the aircraft is powered
up before engine start. During aircraft operation all the internal clocks are frequently
synchronized by a central time manager on board the aircraft. The time manager for
RTC does not synchronize with any other reference time and therefore RTC time is
running independent to UTC.
Nevertheless, the two sets of measurements from GPS and radar have to be set in the
same definition of time in order to allow any comparison between the two. Therefore
a transformation of the time reference of either one of the data sets is needed.
However this transformation of time reference is not an elementary operation since it
does not exist any obvious links between the two definitions of time. The strategy for
solving this problem is to transfer the valid time for radar data from RTC to UTC
since GPS data with valid time in UTC constitutes the benchmarking data for this
comparison. Thus the problem of synchronization is to find a sufficiently strong
dependency that links RTC to UTC. This dependency could possibly be found in
COMET data recordings because all recorded data, including radar data are marked
with arrival time expressed in UTC.
When looking at all recorded message traffic in COMET data the only connection
between RTC and UTC could be found in a few of all the different types of data
messages. These messages are tagged with valid data time set in RTC. The COMET
recording time is controlled by GPS and expressed in UTC and used as time stamp for
all recorded messages in COMET. One way to connect the two definitions of time is
by looking at dependencies in valid time and recording time on a suitable data
message type and from that determine the offset time between RTC and UTC. The
offset between valid time in RTC and recording time in UTC for a data message is
composed by the general RTC/UTC offset time added to the delay time derived from
the transmission between radar unit and COMET.

26
3.3.1 Data Message from Radar
The first attempt in search of a link between RTC and UTC is by looking at one of the
target data messages from the radar with information on RTC. The message type that
is chosen, in this report named RR_DATA, contains data on target position together
with some other information on the tracked target. The message type also contains
valid time for target data and that time is expressed in RTC, see Figure 3-7. When this
message is transmitted to the SC it is also recorded in COMET, see Figure 3-8. When
recorded in COMET the message is marked with a recording time expressed in UTC.
This means that from the recorded COMET-version of this message there is an ability
to get both RTC and UTC times, see Figure 3-9.
Figure 3-7: RR_DATA message created at radar unit.
Figure 3-8: RR_DATA message transmitted on the bus-system.

27
Figure 3-9: RR_DATA message stored in COMET recording system.
However, when observing this target data message in Matlab it becomes apparent that
the difference in time between RTC and UTC values over time is seemingly random
with limits beyond the acceptable, see Figure 3-12. The time span between valid data
time and recording time is varying depending on different elapse time during signal-
and data processing of target data in the radar before transmission to SC. The elapsed
time entails the target data to be transmitted on the bus with a varying delay. Thus the
dependency between valid data time and recording time in this message type clearly is
unsuitable in transformation of RTC to UTC timeframe.

28
3.3.2 Data Message from INS
Since data messages from the radar suffers from varying delays due to processing
time there is a need to find another data message recorded in COMET for which we
could determine the delay within an acceptable interval. For this purpose a candidate
message from SC to radar with position data readings from the INS (Inertial
Navigation System) unit is found. For this report the message is named INS_DATA,
see Figure 3-10. The data in INS_DATA is in contrast to radar target data in
RR_DATA not subject to any processing after valid time is set and thus not suffering
from any delay other than transmission time to COMET recording. The INS_DATA
message type contains a valid data time expressed in RTC and since it is recorded in
COMET it is also marked with a recording time expressed in UTC why it can serve as
a link between the two definitions of time, see Figure 3-11.
Figure 3-10: INS_DATA message transmitted on the bus-system.
Figure 3-11: INS_DATA message stored in COMET recording system.

29
The delay time between valid time and recording time for the INS_DATA message is
by experience and rightly assumed to have a length of maximum one message cycle.
However this assumption will be tested when evaluating one of the test flights in
chapter 0. The INS_DATA messages are transferred at a rate of 60Hz giving a
message cycle of ~16.7 msec. If not taken into account, this delay will introduce a
minor synchronization fault after a transfer of radar data from RTC to UTC. The
delay will result in a distance offset between radar measured distance and the
benchmarking GPS/INS measured distance with a size depending on relative speed
between test aircraft and target aircraft. This means that a time delay leads to a shorter
radar distance with two aircrafts relatively departing from each other, and respectively
a longer radar distance with two aircrafts closing in relative distance.
Fig 3-12 shows offset time between COMET recording time and valid data time for
both RR_DATA and INS_DATA messages. Initial offset time (t) on the y-axis is the
offset time for the first recorded INS_DATA message in the interval. This offset for
any test sortie is typical counted in days since recorded GPS time refers to seconds of
week initiated at 00.00h between Saturday and Sunday and valid time is initiated at
power up before engine start. Fig 3-12 shows that RR_DATA not only suffers to a
delay approximately 100 ms longer than the INS_DATA message but also that the
delay is varying much more than the delay of the INS_DATA. The slope that can be
observed on INS_DATA and to some extent also on RR_DATA can be explained by
the slight difference in clock rate between RTC and UTC.
Figure 3-12: Offset between recorded time and valid time for RR_DATA and INS_DATA.

30
3.3.3 Synchronization Process
The dependency between RTC and UTC is in this work considered to be linear as
they basically are two clocks running in parallel. The strategy for finding a
polynomial describing the dependency between the two is to use the polyfit function
in Matlab. As input for the polyfit function RTC and UTC values from INS_DATA
messages during the current radar exposure interval are taken, following the
conclusions made in Ch. 3.3.1-2. Polyfit returns a first degree polynomial as output
that describes the linear function . This first degree polynomial is
found with the polyfit function in Matlab by use curve fitting of input data in a least
square sense. This first degree polynomial will also take care of any indifference in
clock rates between RTC and UTC that can be observed in fig 3-12.
What is important to know is that this linear dependency includes the unknown delay
time from valid data time to recording time that the recorded INS_DATA message is
subject to. However the approach is that by the comparison of radar and GPS data in
the later test we will get a chance to determine this delay time with better accuracy.

31
3.4 Distance-to-Target Measurements
Accuracy in radar data can be distinguished in different measurements as for example
distance, velocity and angle of aspect. This test serves only as guidance for future
work on how to use GPS data together with radar measurements. The focus is set on
radar measurements made on distance-to-target and is a test of the correctness in data
transformations made in our method. The choice that is made to only look at distance-
to-target measurements is done because that is the most straightforward calculated
quantity of them all, at the same time as it fully serves the purpose of the test.
3.4.1 Target Position - Radar
The data sets from the radar are in HDF5 format. This is a file format designed for
large data structures. Scripts for putting HDF5 data into databases are available at
EDS and used to unpack data for further analyze in local evaluation environments.
Most of data analysis during the thesis work is done in Mathworks Matlab
environment with data retrieved from the databases created in earlier steps described
above.
The interesting radar data for use in the test of our method is filtered out in several
stages using Matlab. To do this filtering several scripts had to be written. These
scripts remove any irrelevant data like empty messages containing zeros. They also
eliminate radar target data with inferior quality compared to best available target data.
The result of this extraction of relevant data is a vector with elements containing all
radar estimations of target position from a specified radar exposure interval. All
position estimates are also tagged with a valid data time. These scripts had to be
written before a useful analyze of target data could be done with Matlab.
3.4.2 Distance-to-target – Radar
The radar describes target position relatively the test aircraft in three dimensions.
The calculation of the Euclidian distance is done by:
where:
Test Aircraft Position =
Target Aircraft Position =
The distance-to-target calculation is done for all radar position estimates from the
radar exposure interval resulting in a vector with distance-to-targets tagged with valid
times.
32
3.4.3 Target and Fighter Position – GPS
Previously in 2.2.2.2 we assumed that position data from post-processed GPS and INS
data probably was the most accurate position data set that could be produced from
Gripen test flights. Therefore the choice is to evaluate radar data using GPS/INS
position data as benchmark whenever it is available. This position quality is only
available for one of the test exposures and for the other two we use DGPS position
data instead, with nearly the same accuracy
GPS and INS position data from flight tests are post-processed with NovAtel Inertial
Explorer and the result is delivered in text-files specifying GPS/INS-filtered positions
in 2Hz sample frequency. If there is a lack of post-processed GPS/INS data from test
flights we choose to use differential processed GPS data from GrafNav instead.
3.4.4 Distance-to-target – GPS
Calculation of distance-to-target from GPS data can be done in the same way as for
radar data by using the same formula for the Euclidian distance.
Where:
Test Aircraft Position =
Target Aircraft Position =

33
3.4.5 Interpolation of GPS data
There is a need to interpolate one of the datasets after distance-to-target is calculated
from both radar and GPS data. This is because the distance-to-target samples from the
two different sources, GPS and radar, do not match in time, see Figure 3-13. The GPS
samples are in either 1Hz or 2Hz and suitable to be linearly interpolated over all radar
samples resulting in synchronized distance-to-target values from both GPS and radar
measurements as shown in Figure 3-14.
Figure 3-13: Example with radar and GPS data before interpolation of GPS data.

34
Figure 3-14: Example with radar and GPS data after linear interpolation of GPS data.
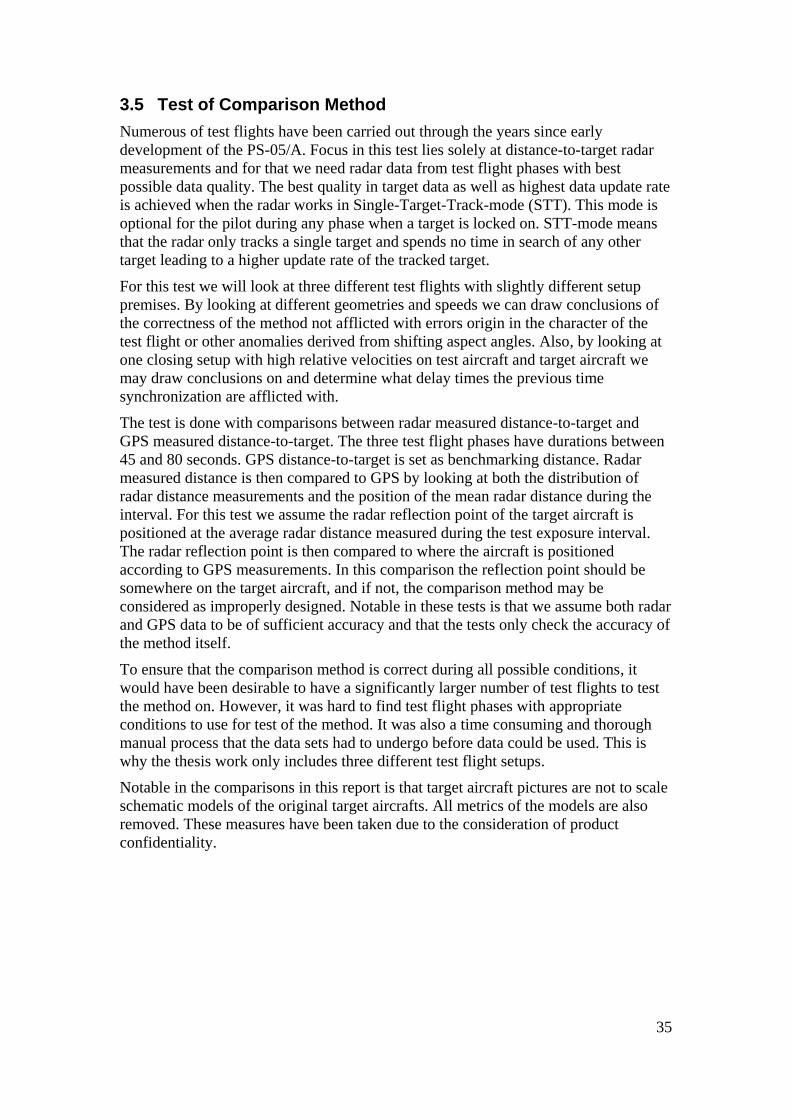
35
3.5 Test of Comparison Method
Numerous of test flights have been carried out through the years since early
development of the PS-05/A. Focus in this test lies solely at distance-to-target radar
measurements and for that we need radar data from test flight phases with best
possible data quality. The best quality in target data as well as highest data update rate
is achieved when the radar works in Single-Target-Track-mode (STT). This mode is
optional for the pilot during any phase when a target is locked on. STT-mode means
that the radar only tracks a single target and spends no time in search of any other
target leading to a higher update rate of the tracked target.
For this test we will look at three different test flights with slightly different setup
premises. By looking at different geometries and speeds we can draw conclusions of
the correctness of the method not afflicted with errors origin in the character of the
test flight or other anomalies derived from shifting aspect angles. Also, by looking at
one closing setup with high relative velocities on test aircraft and target aircraft we
may draw conclusions on and determine what delay times the previous time
synchronization are afflicted with.
The test is done with comparisons between radar measured distance-to-target and
GPS measured distance-to-target. The three test flight phases have durations between
45 and 80 seconds. GPS distance-to-target is set as benchmarking distance. Radar
measured distance is then compared to GPS by looking at both the distribution of
radar distance measurements and the position of the mean radar distance during the
interval. For this test we assume the radar reflection point of the target aircraft is
positioned at the average radar distance measured during the test exposure interval.
The radar reflection point is then compared to where the aircraft is positioned
according to GPS measurements. In this comparison the reflection point should be
somewhere on the target aircraft, and if not, the comparison method may be
considered as improperly designed. Notable in these tests is that we assume both radar
and GPS data to be of sufficient accuracy and that the tests only check the accuracy of
the method itself.
To ensure that the comparison method is correct during all possible conditions, it
would have been desirable to have a significantly larger number of test flights to test
the method on. However, it was hard to find test flight phases with appropriate
conditions to use for test of the method. It was also a time consuming and thorough
manual process that the data sets had to undergo before data could be used. This is
why the thesis work only includes three different test flight setups.
Notable in the comparisons in this report is that target aircraft pictures are not to scale
schematic models of the original target aircrafts. All metrics of the models are also
removed. These measures have been taken due to the consideration of product
confidentiality.
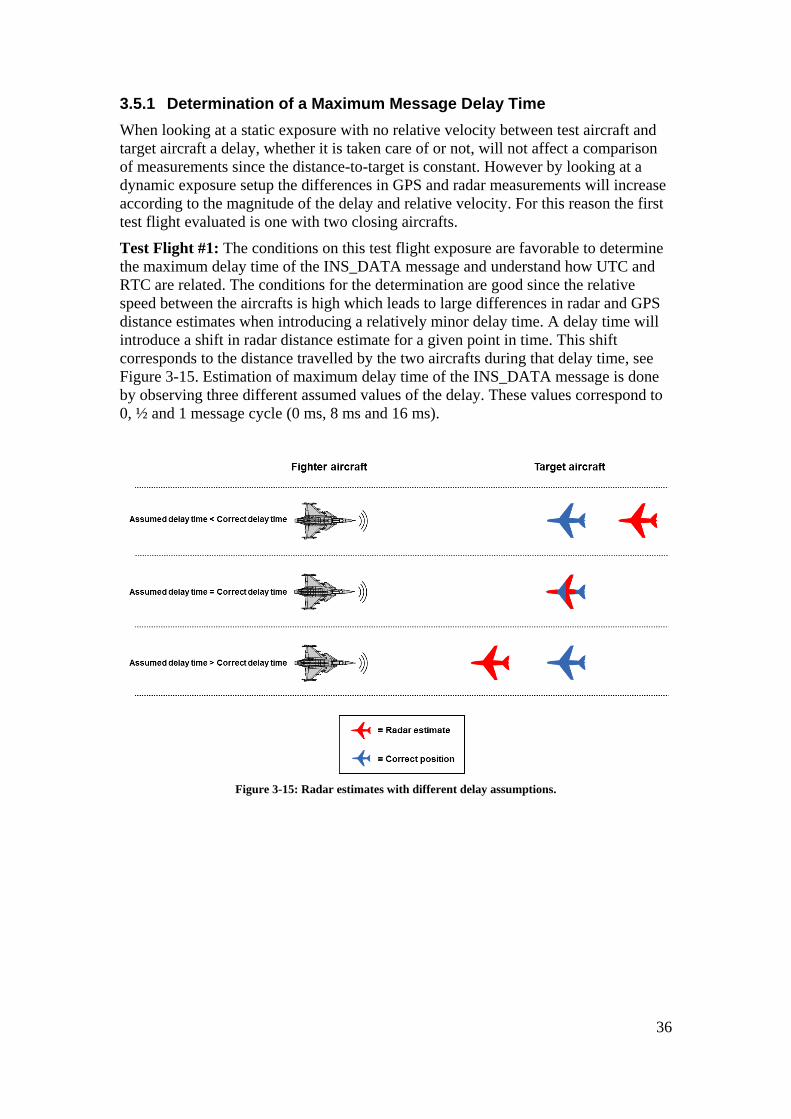
36
3.5.1 Determination of a Maximum Message Delay Time
When looking at a static exposure with no relative velocity between test aircraft and
target aircraft a delay, whether it is taken care of or not, will not affect a comparison
of measurements since the distance-to-target is constant. However by looking at a
dynamic exposure setup the differences in GPS and radar measurements will increase
according to the magnitude of the delay and relative velocity. For this reason the first
test flight evaluated is one with two closing aircrafts.
Test Flight #1: The conditions on this test flight exposure are favorable to determine
the maximum delay time of the INS_DATA message and understand how UTC and
RTC are related. The conditions for the determination are good since the relative
speed between the aircrafts is high which leads to large differences in radar and GPS
distance estimates when introducing a relatively minor delay time. A delay time will
introduce a shift in radar distance estimate for a given point in time. This shift
corresponds to the distance travelled by the two aircrafts during that delay time, see
Figure 3-15. Estimation of maximum delay time of the INS_DATA message is done
by observing three different assumed values of the delay. These values correspond to
0, ½ and 1 message cycle (0 ms, 8 ms and 16 ms).
Figure 3-15: Radar estimates with different delay assumptions.
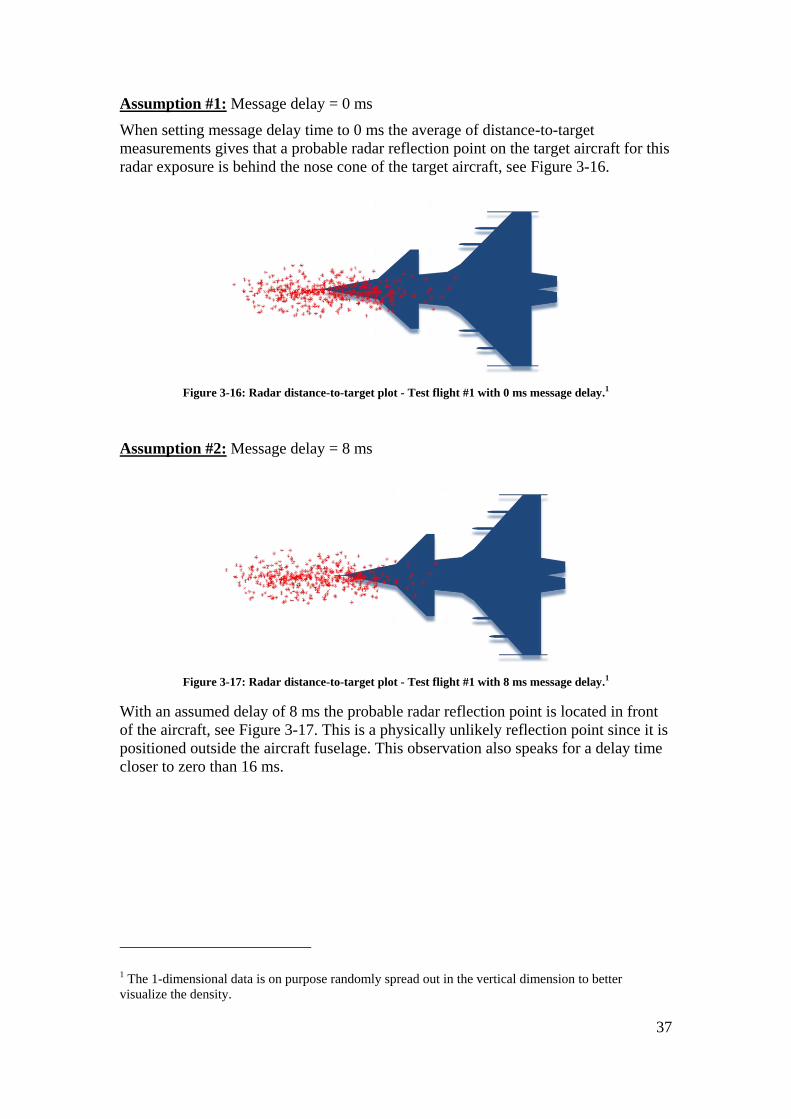
37
Assumption #1: Message delay = 0 ms
When setting message delay time to 0 ms the average of distance-to-target
measurements gives that a probable radar reflection point on the target aircraft for this
radar exposure is behind the nose cone of the target aircraft, see Figure 3-16.
Figure 3-16: Radar distance-to-target plot - Test flight #1 with 0 ms message delay.1
Assumption #2: Message delay = 8 ms
Figure 3-17: Radar distance-to-target plot - Test flight #1 with 8 ms message delay.1
With an assumed delay of 8 ms the probable radar reflection point is located in front
of the aircraft, see Figure 3-17. This is a physically unlikely reflection point since it is
positioned outside the aircraft fuselage. This observation also speaks for a delay time
closer to zero than 16 ms.
1 The 1-dimensional data is on purpose randomly spread out in the vertical dimension to better
visualize the density.

38
Assumption #3: Message delay = 16 ms
Figure 3-18: Radar distance-to-target plot - Test flight #1 with 16 ms message delay.1
This assumption moves the reflection point further away from the target aircraft nose
cone. This estimated reflection point is well in front of the target aircraft and therefore
not likely to represent a correct assumption of delay time, see Figure 3-18.
Conclusions regarding delay time: When assuming delay times of 8 or 16 ms the
radar reflection point is positioned in front of the aircraft. From this we draw the
conclusion that the correct delay time probably is somewhere between 0 and 8 ms.
Let us assume that an error of 8 ms would be introduced in our comparison method.
What could the maximum error from this be in evaluation of a test flight?
The minimum resulting position error would be 0 in a setup with radar and target
without any relative position change. Large position errors are instead obtained with
high-speed closing, or departing, aircrafts. Let us say that two aircrafts are closing
with speeds at 200 m/s, a normal aircraft speed in test flight. These aircrafts would
then have a relative speed of 400 m/s. With an error of 8 ms these aircrafts are falsely
assumed to be m closer than in reality, see Figure 3-15. 3.2 m is
then the maximum position error during normal test flight conditions. Errors of this
magnitude can be ignored for this work since they only may appear with closing
aircrafts, and as they are significantly smaller than the length of the target aircrafts.
Therefore a message delay of 0 ms will be assumed for the continuation of this work.

39
3.5.2 Test Flight #1
Test Flight #1
Exposure #15
Test Aircraft Blue Trajectory
Target Aircraft Red Trajectory
Target Tracking STT-mode
Distance ~ 35.000 – 15.000 meter
Aspect to Target Frontal
Duration ~ 45 seconds
Position Data DGPS
Figure 3-19: Setup geometry – Test flight #1.
Exposure setup: During this radar exposure the aircrafts are closing in distance
where they are heading towards each other aiming for a frontal merge, see Figure 3-
19. The exposure starts on a distance of 35.000 meter and ends at a distance of
approximately 15.000 meter. The duration of this closure of 20.000 meter is 45
seconds therefore giving an average relative speed of nearly 450 m/s.
Figure 3-20: Radar distance-to-target plot - Test flight #1.2
2 The 1-dimensional data is on purpose randomly spread out in the vertical dimension to better
visualize the density.

40
Figure 3-21: Radar distance-to-target histogram - Test flight #1.
Observations: The distance measurement samples are spread with most of them lying
within a range of one target aircraft length, see Figures 3-20 and 3-21. The average
radar measured distance is right behind the aircraft nose.

41
3.5.3 Test Flight #2
Test Flight #2
Exposure #13
Test Aircraft Blue Trajectory
Target Aircraft Red Trajectory
Target Tracking STT-mode
Distance ~ 18.000 meter
Aspect to Target Trailing
Duration ~ 50 seconds
Position Data DGPS
Figure 3-22: Setup geometry – Test flight #2.
Exposure setup: This radar exposure includes a target trailed from behind, see Figure
3-22. The velocities on the two aircrafts are nearly the same giving a quite stationary
relative geometry between the two with a low relative speed. The distance between
the two aircrafts is about 18.000 meter during the entire exposure.
Figure 3-23: Radar distance-to-target plot - Test flight #2.3
3 The 1-dimensional data is on purpose randomly spread out in the vertical dimension to better
visualize the density.

42
Figure 3-24: Radar distance-to-target histogram - Test flight #2.
Observations: The relative velocity between the aircrafts is near zero during this
exposure. Therefore the INS_DATA message delay time will not afflict the radar
distance-to-target estimate to any greater extent. What can be observed on the radar
plot is that the radar measured distance-to-target samples from this exposure are very
closely gathered relatively the target aircraft length, see Figures 3-23 and 3-24.

43
3.5.4 Test Flight #3
Figure 3-255: Setup geometry – Test flight #3.
Exposure setup: The phase is during exposure #8 of test flight #3, right after take-off
where the test aircraft trails the target aircraft with radar locked on to the target in
STT-mode, see Figure 3-25. The trajectories of the two aircrafts result in radar aspect
angles where the radar looks at the target from behind during the entire phase. The
phase is about 80 seconds long and the two aircrafts remains in nearly same aspect
angles during the whole phase. There are slight changes in altitude and speed on both
aircrafts. However, these dynamic changes are not considered to affect radar
measurements in any greater extent as aspect angle is nearly static during the entire
phase. The gap between the aircrafts increases from at first approximately 3000
meters to later about 5000 meters. This is the result when the target first has a
relatively higher speed but later on decelerates to a speed less than that of the test
aircraft and thus the gap between the aircrafts slightly closes.
Observations: The relative velocity between the two aircrafts is rather low. Therefore
any position error from synchronization will not affect the reflection point estimate to
any greater extent. The distance-to-target plot shows that most of the radar estimates
lies within a distance comparable to one target aircraft length, see Figures 3-26 and 3-
27.
Test Flight #3
Exposure #8
Test Aircraft Blue Trajectory
Target Aircraft Red Trajectory
Target Tracking STT-mode
Distance ~ 3.000 – 5.000 meter
Aspect to Target Trailing
Duration ~ 80 seconds
Position Data GPS/INS

44
Figure 3-26: Radar distance-to-target plot - Test flight #3.4
Figure 3-27: Radar distance-to-target histogram - Test flight #3.
4 The 1-dimensional data is on purpose randomly spread out in the vertical dimension to better
visualize the density.

45
4 Conclusions
4.1 GPS Inventory
4.1.1 Positioning for Ground Based Sensors
In tests of ground based sensors at EDS there is regularly need for position
measurements on sensors and targets for later comparison with sensor data. These
position measurements are primarily done by using three different sets of GPS
receiver equipment. The accuracy of these sets of equipment is very much dependent
on environmental factors which are the case with any other GPS receiver as well.
Anyway, the position data tend to be on a level that is good enough for the tests that
they are part of
- Ashtech Z-Xtreme
This receiver is easy to use since it does not need any external power source. The log-
functions are also managed internally and therefore this receiver only needs an
antenna to be set operational for basic use. After measurements are done the receiver
is not that easy to use anymore since the operator has to connect it to a PC on a serial
link with special software from the manufacturer installed on the PC.
- NovAtel DL-V3
The DL-V3 can log data to a CF-card making it quite flexible in use both during
measurements and post-operation. The receiver needs an external power source
during operation why it gets a bit more impractical compared to the Z-Xtreme with
internal battery.
- NovAtel SPAN SE-D
This receiver is very much like the DL-V3 receiver when used without INS. However
for use with INS integrated and with two-antenna installation it takes a lot more
preparatory work for adjustments and I would not recommend an installation of the
SPAN/INS combination when needing a quick system setup. However, when the
system is up and running with all calibrations done it is a very potent set of measuring
equipment.
4.1.2 Positioning in Test Flight of PS-05/A
The standard procedure for retrieval of position data to EDS from test flights is
DGPS. There is however another method available including inertial measurements
available at Saab Aeronautics that could be used for the Gripen test aircraft and also
for the target if that is a Gripen aircraft as well. This GPS/INS combined method
ensure better continuity in data as the output data of this method does not suffer from
GPS signal outages. The accuracy is also assumed to be better to some extent. It is
hard to determine the exact accuracy but it is assumed to be down in level of 0.5
meter during favorable conditions.

46
I would suggest that the GPS/INS combined method would be used on a more regular
base as it is a relatively quick process to use it on data from a Gripen test aircraft.
4.2 Method for Comparison of Radar and GPS Data
The method suggested for evaluation of radar data by using GPS measurements is
depending on what the evaluation aims at. The method in this thesis work only aims at
distance-to-target measurements. There could be several other evaluations on radar
measurements such as accuracy in angle and velocity. However, the least common
divider for any radar data evaluation consist of the two steps listed below. These steps
are therefore used in the method that this work suggests as a comparison method.
4.2.1 Transformation of Coordinates
GPS use polar coordinates in the global standard system, WGS84, to specify any
position. The GPS coordinates are transferred into a Cartesian coordinate system with
a transformation method recommended by the Swedish authority in the area of
mapping, Lantmäteriet. Position coordinates expressed in a Cartesian system is a
qualifier to be able to do any mathematical manipulations and analysis on the data.
Regarding position data from the radar, these coordinates are already expressed in a
Cartesian system and does not need any transferring before analysis.
The transformation method of GPS position data to Cartesian coordinates is, in this
work, assumed to be assured in terms of quality. This assumption is made since the
formulas used are stated by a recognized authority, Lantmäteriet.
4.2.2 Synchronization of Data
The position coordinate incompatibility found a quite straight forward solution. But
the data synchronization was instead a more troublesome area. The problem consisted
of different definitions of time for GPS and radar data regarding valid time. Radar
data was set in a local aircraft definition of time and GPS data was set in the globally
used UTC definition of time. The challenge was to get the two data sets into the same
comparable definition of time.
By using a third data entity from the aircraft system radar data was transferred to the
UTC definition of time. This transformation could be done by using message traffic
with the third data entity sent on the aircraft bus-system. This bus-traffic is recorded
during test flights for post flight evaluations and could therefore be investigated in
this thesis work.
4.2.3 Test of Comparison Method
The method was tested on three different test flight setups with high quality radar data
and favorable GPS conditions. The test was a comparison between GPS data, set as
benchmark, and radar data. Radar data was plotted onto a stylistic target aircraft
model. Plots were made showing both radar measurements, sample for sample, but
also as a histogram. For all three test flights the average distance-to-target from radar
data coincided with some part of the target models, which positions were decided
from GPS data.
From this the conclusion is drawn that the method is usable under comparable
conditions to the three above. However, I would recommend further testing of the
method in other test flight setups to better ensure functionality of it.

47
5 References
[1] Anon. “National Geospatial-Intelligence Agency: World Geodetic System”.
Retrieved at: February 6, 2011.
URL: https://www1.nga.mil/ProductsServices/GeodesyGeophysics/WorldGeodeticSystem/Pages/
default.aspx
[2] Kennedy, Hamilton, Martell. “GPS/INS Integration with the iMAR-FSAS IMU”.
Shaping the Change XXIII FIG Congress Munich Germany. October 8-13 2006.
URL: http://webone.novatel.ca/assets/Documents/Papers/GPSINSIntegrationwiththeiMAR-
FSAS_IMU.pdf
[3] Jwo. "Optimisation and sensitivity analysis of GPS receiver tracking loops in
dynamic environments," Radar, Sonar and Navigation, IEE Proceedings, vol.148,
no.4, pp.241-250, Aug 2001.
URL: http://ieeexplore.ieee.org/stamp/stamp.jsp?tp=&arnumber=942858&isnumber=20416
[4] van Diggelen. “GNSS Accuracy – Lies, Damn Lies and Statistics”. GPS World,
Cover Article, Vol.18, No.1. 2007.
[5] Kaplan, Hegarty (Ed.). “Understanding GPS: principles and applications (2nd
Edition)”. Boston. Artech House. 2006. p379-380.
[6] Persson J. ”Bearbetning av GPS-data vid Flyg- och Systemprov”. Institutionen
för systemteknik Linköpings Universitet. Linköping 2002. LiTH-ISY-Ex, 3215.
URL: http://urn.kb.se/resolve?urn=urn:nbn:se:liu:diva-1166
[7] Lacomme, Hardange, Marchais, Normant. “Air and Spaceborne Radar Systems:
An Introduction”. Norwich New York. William Andrew Publishing/Noyes,
SciTech, IEE. 2001. p25.
[8] Skolnik (Ed.). “Radar Handbook (2nd Edition)”. New York. McGraw-Hill. 1990.

48
6 Appendices
Appendix A – Overview of GPS
Appendix B – Coordinate Transformation