governor’s energy summit - west virginia€™s energy summit stonewall resort october 27, 2015....
TRANSCRIPT

Current State of the Natural Gas Industry in West Virginia:
Governor’s Energy Summit Stonewall ResortOctober 27, 2015

Independent Oil and Gas Association of West Virginia, Inc.
• Formed in 1959
• Over 700 members
• Serve both conventional and horizontal oil and gas producers
• Serves every aspect of the industry: Exploration, Drilling, Production, Transmission, Marketing, and Service Providers
Charlie Burd, Executive Director


MARCELLUS AND UTICA
SHALES
Source: Geology.com

Marcellus Development and Growth
• Horizontal drilling pioneered in Texas in the 1980’s by companies like Range Resources in the Barnett and other shale formations
• Range Resources advanced the technology to the Marcellus Shale in 2004 with the completion of the Renz #1 well in Southwest Pennsylvania
• Barnett is approximately 5,000 square miles
• Marcellus is 95,000 square miles of development potential
• Second largest natural gas find in the world (Penn State, report)
• Purported to be the largest natural gas find in when combining the Marcellus and Utica shales
• Marcellus production exceeded 16 Bcf/day in June, 2015. Marcellus/Utica combined gas production currently exceeds 18 Bcf/day
• Many new wells already drilled but waiting for pipelines to be built.

Marcellus Shale Impact in West Virginia
• First Marcellus well drilled in Marshall County, West Virginia by Chesapeake Energy in 2007
• 53 of 55 West Virginia counties have oil or natural gas operations
• All 55 counties benefit from state severance and property taxes paid by the industry
• More than $625 million in severance and property taxes has been paid in the last
three years
• Purchased gas component of residential gas rates in West Virginia have declined for last three years
Source: WV State Tax Department

Total Natural Gas ProductionSource: WVDEP
259,665,182 257,177,563287,237,781
394,125,240
539,481,159
741,852,986
1,001,969,992
0
200,000,000
400,000,000
600,000,000
800,000,000
1,000,000,000
1,200,000,000
2008 2009 2010 2011 2012 2013 2014
Gas Production in MCF(MCF = 1,000 Cubic
Feet of Gas)
Production Year
Total West Virginia Natural Gas Annual Production (MCF)
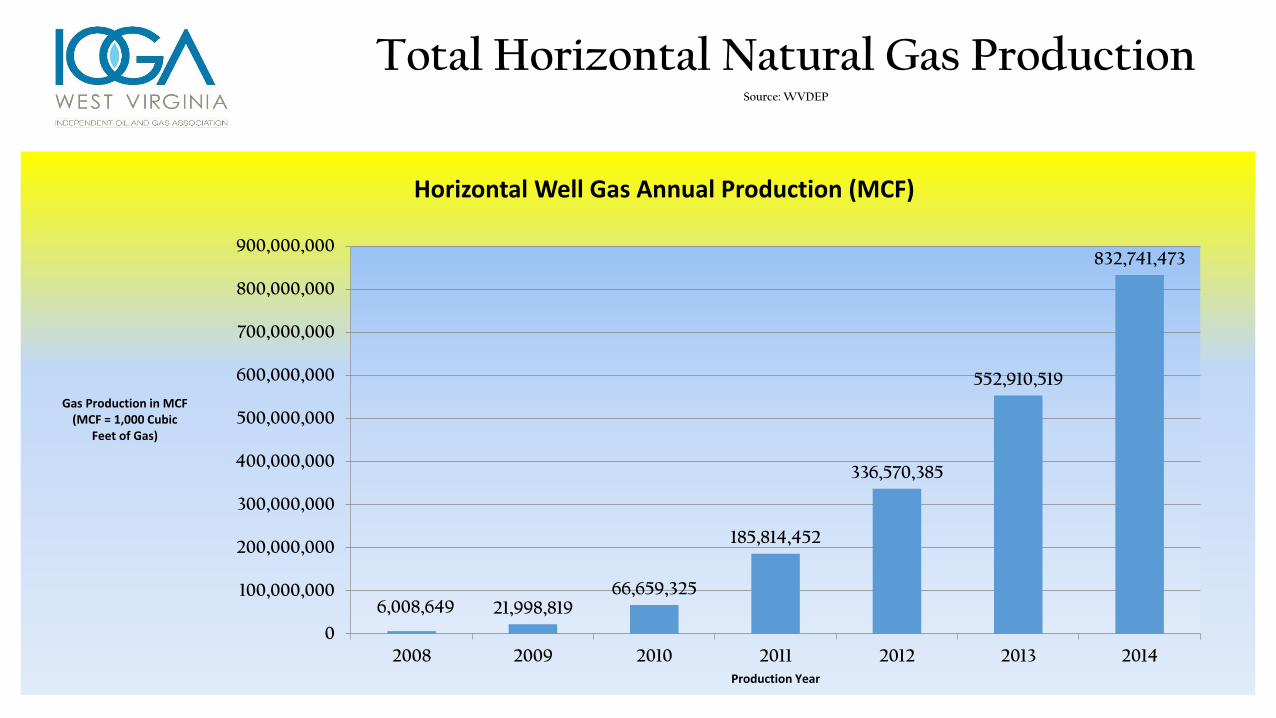
Total Horizontal Natural Gas ProductionSource: WVDEP
6,008,649 21,998,81966,659,325
185,814,452
336,570,385
552,910,519
832,741,473
0
100,000,000
200,000,000
300,000,000
400,000,000
500,000,000
600,000,000
700,000,000
800,000,000
900,000,000
2008 2009 2010 2011 2012 2013 2014
Gas Production in MCF(MCF = 1,000 Cubic
Feet of Gas)
Production Year
Horizontal Well Gas Annual Production (MCF)

Number of Horizontal Producing WellsSource: WVDEP
168
370516
765
1,050
1,383
1,753
0
200
400
600
800
1,000
1,200
1,400
1,600
1,800
2,000
2008 2009 2010 2011 2012 2013 2014
Number of WellsHorizontal Wells Reporting
Production Year
Number of Horizontal Wells Reporting Production
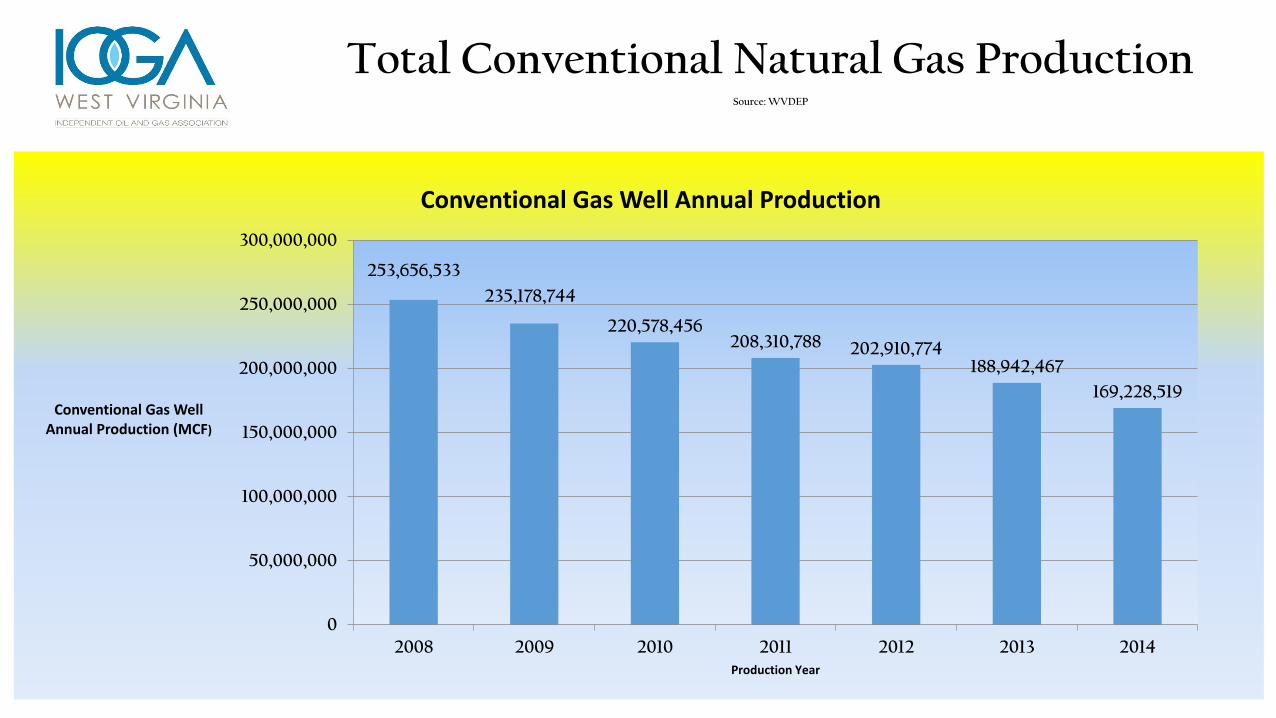
Total Conventional Natural Gas ProductionSource: WVDEP
253,656,533
235,178,744
220,578,456208,310,788 202,910,774
188,942,467
169,228,519
0
50,000,000
100,000,000
150,000,000
200,000,000
250,000,000
300,000,000
2008 2009 2010 2011 2012 2013 2014
Conventional Gas Well Annual Production (MCF)
Production Year
Conventional Gas Well Annual Production

Number of Conventional Producing WellsSource: WVDEP
52,350
48,237 51,834
56,81460,002 58,490
54,814
0
10,000
20,000
30,000
40,000
50,000
60,000
70,000
2008 2009 2010 2011 2012 2013 2014
Conventional Wells Reporting Production
Production Year
Conventional Wells Reporting Production

Top Gas Producing Counties In 2014 *Source: WVGES
1. Doddridge (225.0 Bcf) 2013: Harrison (147.4 Bcf)2. Harrison (173.6 Bcf) 2013: Wetzel (102.7 Bcf)3. Wetzel (151.7 Bcf) 2013: Doddridge (94.8 Bcf)4. Marshall (90.2 Bcf) 2013: Marshall (66.3 Bcf)5. Tyler (40.0 Bcf) 2013: Ohio (21.3 Bcf)6. Ritchie (33.0 Bcf) 2013: Marion (21.0 Bcf)7. Ohio (32.1 Bcf) 2013: Ritchie (17.3 Bcf)8. Taylor (23.9 Bcf) 2013: Taylor (15.6 Bcf)9. Marion (19.9 Bcf) 2013: Tyler (14.5 Bcf)10. Barbour (17.4 Bcf) 2013: Upshur (14.2 Bcf)
*These production volumes represent data acquired by WVGES as of July 22, 2015. This dataset uses the data posted by WVDEP as of 6/4/2015. 2014 production data from several operators reporting Marcellus production in 2013 may not have been available at the time of this report; therefore, the values listed above may change as more data become available. Additionally, these volumes represent the total production from a given well and may be commingled from multiple formations, including the Marcellus Shale.
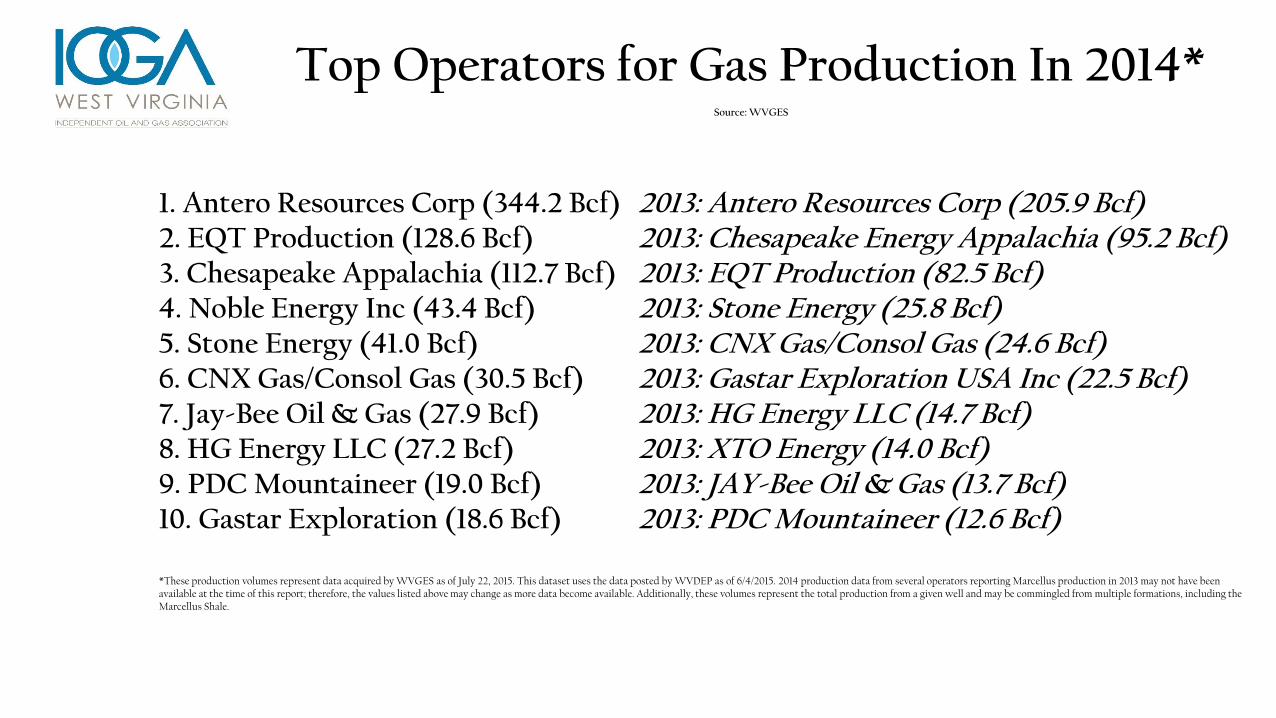
Top Operators for Gas Production In 2014*Source: WVGES
1. Antero Resources Corp (344.2 Bcf) 2013: Antero Resources Corp (205.9 Bcf)2. EQT Production (128.6 Bcf) 2013: Chesapeake Energy Appalachia (95.2 Bcf)3. Chesapeake Appalachia (112.7 Bcf) 2013: EQT Production (82.5 Bcf)4. Noble Energy Inc (43.4 Bcf) 2013: Stone Energy (25.8 Bcf)5. Stone Energy (41.0 Bcf) 2013: CNX Gas/Consol Gas (24.6 Bcf)6. CNX Gas/Consol Gas (30.5 Bcf) 2013: Gastar Exploration USA Inc (22.5 Bcf)7. Jay‐Bee Oil & Gas (27.9 Bcf) 2013: HG Energy LLC (14.7 Bcf)8. HG Energy LLC (27.2 Bcf) 2013: XTO Energy (14.0 Bcf)9. PDC Mountaineer (19.0 Bcf) 2013: JAY‐Bee Oil & Gas (13.7 Bcf)10. Gastar Exploration (18.6 Bcf) 2013: PDC Mountaineer (12.6 Bcf)
*These production volumes represent data acquired by WVGES as of July 22, 2015. This dataset uses the data posted by WVDEP as of 6/4/2015. 2014 production data from several operators reporting Marcellus production in 2013 may not have been available at the time of this report; therefore, the values listed above may change as more data become available. Additionally, these volumes represent the total production from a given well and may be commingled from multiple formations, including the Marcellus Shale.

Economics: WV Severance Tax ContributionsSource: WV State Tax Department: August 2015
$87.6 $81.4 $61.2 $59.0
$78.5 $87.7
$189.3
$141.5
$9.2 $10.6
$10.8 $13.5
$20.8 $27.3
$42.7
$56.8
$-
$50.0
$100.0
$150.0
$200.0
$250.0
08 09 10 11 12 13 14 15
Natural Gas and Oil Severance Tax Assessments (Millions) Special WC Assessment (Millions)

Economics: Oil and Gas Property Tax Contributions (Millions)
Source: WV State Tax Department: April 2015
$84.0
$110.6 $106.0
$77.5 $80.0
$91.3
$71.7
$105.4
$-
$20.0
$40.0
$60.0
$80.0
$100.0
$120.0
08 09 10 11 12 13 14 15

Negative Basis DifferentialBasis Differential to Henry Hub Spot
$(1.4000)
$(1.2000)
$(1.0000)
$(0.8000)
$(0.6000)
$(0.4000)
$(0.2000)
$-
$0.2000
$0.4000
2009 2010 2011 2012 2013 2014 2015
TCO - Appalachia DTI South Point

Recent Industry Investments
• MarkWest Energy Partners• Sherwood Processing (Doddridge County); Majorsville (Marshall County)
• Williams Ohio Valley Midstream: • Gathering, processing, fractionation and natural gas liquid (NGL) processing
• 5 Bcf/d gathering capacity
• Southwestern Energy• Recent $5.6 B purchase of Chesapeake Energy wells and lease holds in Northern
Panhandle
• Antero Resources (JV with Veolia Water Technologies Inc. and Veolia North America)
• $275 million state-of-the-art, 60,000 barrel per day water treatment complex

Face Of The Future
• ELECTRIC GENERATION• Such as MOUNDSVILLE POWER: 540 MW Gas/Ethane Fired Base-load Plant
• A twin facility being discussed at the Beech Bottom location
• With an MOU in place for a third plant in Harrison County, WV
• NATURAL GAS FUELED VEHICLES• New natural gas fueling stations being developed—5 Stations thus far
• LNG EXPORTS• Dominion is moving forward to liquefy NG for exportation at its Cove Point, MD import terminal. $3.4-$3.8B
project will begin in 2014, with an in-service date of 2017.
• INDUSTRIAL EXPANSION • Ethane crackers, plastics manufacturing, chemical manufacturing, glass, fertilizer, auto parts, etc.

Pipeline Infrastructure Projects
Project Name Operator Miles Cost Bcf/d In Service
Atlantic Coast Dominion 550 $5 B 2.0 Fall 2018
Mountain Valley EQT 330 $3 B 2.0 Fall 2018
Stonewall Momentum 50 $0.5 B 1.4 Dec. 2015
ET over Energy Transfer 711 $4.3 B 3.25 2017
Leach Express Columbia 160 $1.4 B 1.5 Fall 2017
WB Express Columbia 26 $1.0 B 1.3 Summer 2018
Mountaineer Express Columbia 165 $1.5 B 2.7 Fall 2018

Thank You