government polytechnic muzaffarpur - gpmuz.bih.nic.ingpmuz.bih.nic.in/docs/phy manual.pdf ·...
TRANSCRIPT

Government Polytechnic Muzaffarpur
Name of the Lab: Applied Science Lab
Subject Code: 1602107
EXPERIMENT NO.11
Aim
To determine the angle of divergence of laser beam using He-Ne laser.
Apparatus required
He-Ne laser, Semiconductor laser, optical bench, screen and ruler.
Formula :
𝑨𝒏𝒈𝒍𝒆 𝒐𝒇 𝒅𝒊𝒗𝒆𝒓𝒈𝒆𝒏𝒄𝒆 𝒐𝒇 𝒕𝒉𝒆 𝒍𝒂𝒔𝒆𝒓 𝒃𝒆𝒂𝒎,= (𝒂𝟐−𝒂𝟏)/(𝒅𝟐−𝒅𝟏) m
where d1 is the distance between laser source and the screen in m
a1 is the spot size of the laser beam on the screen for distance d1in m
d2 is the new distance between laser source and the screen in m
a2 is the spot size of the laser beam on the screen for distance d2 in m
Procedure
The experimental setup used to find the angle of divergence of the laser beam is
shown as in fig.1.
He-Ne laser/
a1
Diode Laser
d1
Screen
Fig.1. Measurement of Divergence of Laser beam
The Laser beam is allowed to fall on the screen and the spot of the beam is

37
observed and the spot size of the beam is measured as shown in Fig.1.
1. The laser beam from He-Ne is made to fall on the screen which is kept at a
distance of d1 from the source.
2. The spot size of the beam is noted and is taken as a1.
3. Now the position of the screen is altered to a new position d2 from the laser
source and again the spot size of the beam is noted as a2.
4. The same procedure is repeated by changing the position of the
screen at equal intervals atleast 5 times.
5. The readings corresponding to the position of the screen and spot size of
the beam is tabulated.
6. From this, the angle of divergence of the laser beam is calculated using the
formula
Φ = (a2-a1)/(d2-d1) radians
7. The same is repeated by using semiconductor laser diode for the same
distances as done with He-Ne laser.
8. The angle of divergence calculated was compared and the results are
interpreted using two different types of laser beam.
1. Measurement of angle of divergence using He-Ne laser
Distance
between Mean
laser Diameter of the Diameter of the Diameter
beam and spot spot of the
S. screen (Horizontal) ( Vertical) spot φ = (a2-a1)/(d2-d1)
No. X 10-2m X 10-2m X 10-2m X 10-2m radians

Calculation
Distance between laser source and the screen (d1) = m
Spot size of the laser beam on the screen for distance d1 (a1) = m
Distance between laser source and the screen (d2) = m
Spot size of the laser beam on the screen for distance d2 (a2) = m
Angle of divergence of the laser beam, Φ = (a2-a1)/(d2-d1) radians
Result
1. Angle of divergence of the beam using He-Ne laser =
2. Angle of divergence of the beam using semiconductor laser =
Outcome
At the end of the experiment, the students would be able
To understand the importance of laser beam compared to ordinary light
To determine the angle of divergence of the laser beam
To understand the applications of Lasers in Engineering and Medical fields

Government Polytechnic Muzaffarpur
Name of the Lab: Applied Science Lab
Subject Code: 1602107
EXPERIMENT NO.: 07
Aim: To measure the radius of curvature of a Planoconex lens using Newton’s rings apparatus
Apparatus: (1) Newton’s rings apparatus consisting of
a. Planoconvex lens
b. Optically flat glass plate
c. Beam splitter
d. T-type traveling microscope with scale with L.C. = 0.001 cm
(2) Monochromatic source of light of known wavelength (ex. Sodium)
(3) Reading lamp and reading lens
Significance of the experiment: Newton’s rings apparatus can be considered as an
interferometer, as it generates a steady state and well defined interference pattern. One of the
prime applications of interferometers is precise measurements of dimensions. This experiment is aimed at precise measurement of radius of curvature of a plano-convex using ‘Newton’s
interferometer’. The other applications of this apparatus are measuring the wavelength of monochromatic source of light, refractive index of the liquids and testing preciseness of glass
plates and lenses.
Theory: Newton’s rings are the concentric and circular fringes obtained by using interference of
circularly symmetric wedge shaped films. (Refer Fig. 1.1 a, b and c). Such film can be obtained
by placing a planoconvex lens on a glass plate. The region between these two components forms a circularly symmetric wedge shaped film, as the locus of points having same path difference forms
a circle. If this film is exposed to a plane wavefront of monochromatic light from the top, then the rays reflected from the top and bottom of the circularly symmetric wedge shaped film interfere
and produce Newton’s rings By extending the theory of wedge shaped films to Newton’s rings, it can be shown that
( 2 − 2)
= …(1.1) 4( − )
Where R = Radius of curvature of planoconvex
lens Dm = Diameter of mth
dark ring
Dn = Diameter of nth
dark ring
= Wavelength of monochromatic light
= Refractive index of the medium in
betweenplanoconvex lens and glass
plate
Thus if diameters of Newton’s rings are measured then a few important quantities such as R,
and of the liquid can be measured.

Fig 1.1 a: Experimental set up for observing Newton’s rings
Fig 1.1c: Newton’s Rings Fig 1.1b: The ray diagram for Newton’s rings
Procedure:
1. Produce Newton’s rings by the procedure given below.
a. Make every component dust free.
b. Level the whole apparatus using spirit level c. Keep the wooden box containing a beam splitter and glass plate below the T type
microscope. Keep planoconvex lens on the glass plate exactly below the microscope such that its curved part touches the glass plate
d. Render a parallel wavefront of sodium by placing the source at the focal length of a lens. Expose planoconvex lens-glass plate system parallel wavefront of light. Now Newton’s rings can be seen through the microscope.
e. Adjust the eyepiece of the microscope so that sharp Newton’s rings are produced
10
f. If the central ring is not dark then gently tap the apparatus to make the centre
dark. The central ring should be dark throughout the experiment.
2. The central dark ring is the zeroth
one. Measure the diameters of first five dark rings by using the procedure given below
a. Move the microscope, so that crosswire is adjusted on upper part of the first dark
ring. Measure this position, say P on the scale of the microscope, in the following manner
P = MSR + VSR×LC cm
Where MSR is the reading on main scale which coincides with the zero of the vernier scale. If no reading coincides, then the reading on the main sale previous to with the zero of the vernier VSR is the sequence number of division on the
vernier scale which exactly coincides with the division on the main scale. LC is the least count of the scale of the microscope
b. Move the microscope down to adjust the crosswire on the lower part of first dark ring. Measure the corresponding position on the scale, say, Q by using the procedure given above
c. The diameter of the ring is P – Q cm d. Repeat the above procedure for measuring the diameters of 2
nd , 3
rd , 4
th and
5th
dark rings
3. Plot the graph of Dn2 Vs n. Calculate the slope of this graph. The slope gives the precise
2 − 2
value of ( − ) 4. Calculate the radius of curvature of planoconvex lens by using formula (1.1). Take
μ =1 as Newton’s rings are produced in air. The source used is sodium, therefore take = 5890 Ao = 5890× 10−8
5. Compare this Re with the standard radius of curvature (Rs) given. Calculate the percentage deviation, which needs to be as less as possible.
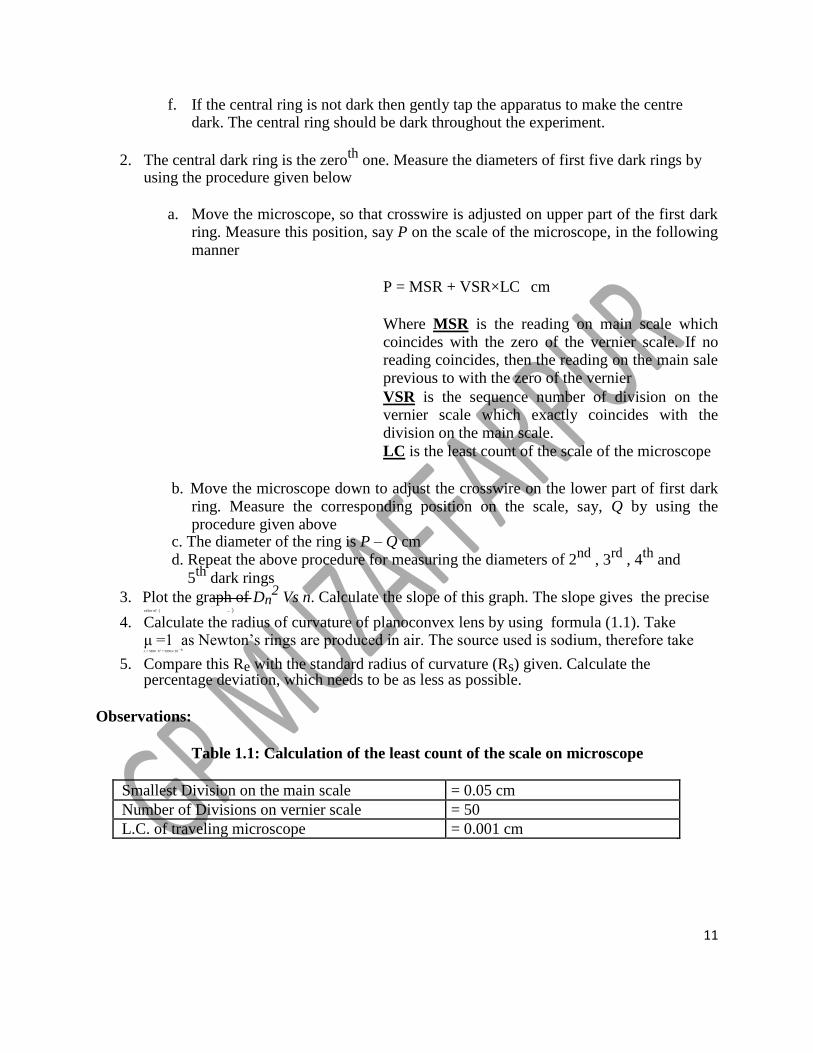
Observations:
Table 1.1: Calculation of the least count of the scale on microscope
Smallest Division on the main scale = 0.05 cm
Number of Divisions on vernier scale = 50
L.C. of traveling microscope = 0.001 cm
11

Table (1.2) Diameters of Newton’s rings
Seq. no. of Upper position Lower position Diameter Square of Dark ring (P), cm (Q), cm Dn, = P – Q cm diameter
(n) 2, cm2
1
2
3
4
5
Calculations:
Slope of the graph = ….. cm2
Radius of curvature of planoconvex lens
( 2 − 2)
=
4( − )
=
1 ×
4 × 5890 × 10−8
= ⋯ … … …
Standard radius of Radius of curvature using %= |
−
| curvature Newton’s rings
Rs, cm Re , cm × 100 %
50 …. …. %
Checklist
1. In the figures, have you shown the travelling microscope on the top of the set up? 2. Have you shown the calculation of radius of curvature? Have you expressed radius of
curvature in cm? 3. Have you written the result table, standard radius of curvature, experimental radius of
curvature and percentage deviation? 4. The graph should be in the following format
12

Viva Voce
1. Newton’s rings apparatus can be called as Newton’s interferometer. Why?
2. Enlist as many interferometers, as you know. 3. Comment on the nature of Newton’s rings which would be seen, if the source used were
polychromatic (white) 4. Is it possible to perform this experiment with Polychromatic source? Why? Why not? 5. The centre of Newton’s rings is sometimes dark and sometimes bright. What does this
signify? 6. How would Newton’s rings be seen if they were observed from the opposite side i.e.
from the downward direction? 7. Any interferometer claims best accuracy in the measurements of various dimensions.
How much was the error in your experiment? Identify the sources of errors. 8. Comment on the nature of Newton’s rings that would be seen if the lens were bioconvex
instead of planoconvex. 9. How would the Newton’s rings appear, if the planoconvex lens were kept in opposite
manner i.e. its curved surface up and plane surface down? 10. How would the Newton’s rings be seen if the glass plate at the bottom were replaced by
mirror? 11. How would Newton’s rings be seen if wavefront were not parallel? 12. Newton’s rings can be used to check the optical flatness of glass plates and precision of
the planoconvex lenses. How?

Government Polytechnic Muzaffarpur
Name of the Lab: Applied Science Lab
Subject Code: 1602107
EXPERIMENT NO. 05
Aim: To measure to coefficient of absorption for acoustical materials .
Apparatus: Sound proof box of 3 ft× 1 ft× 1 ft size, coated with sound proof materials, with a
glass window on the top for observing Sound Level Meter at the position shown in Fig 4.1, Sound Level Meter, Frequency generator, Audio amplifier, sound absorbing materials (plywood, medium density fiberboard (MDF), glass and bakelite)
Significance of the experiment: One of the major acoustical defects of an auditorium, concert
hall or theatre is excessive reverberation (and echo). A well proven method for optimizing the
reverberation time is to use sound absorbing materials in the construction of the auditorium. The capacity of a material to absorb the sound is measured in terms of absorption coefficient. Sound
absorbing materials are also used for noise reduction, coating the submarines and in acoustic delay lines and acoustic filters
Theory: When sound wave falls on any material, part of it is reflected, a part is transmitted and a part is absorbed. The property of a material by which sound energy incident on it is converted in
to other form of energy (mostly heat) is called as absorption. Absorption results into attenuation of the sound. The mechanisms responsible for absorption of the sound by a material are heat
conductivity, sound scattering due to grain boundaries, magnetic domain losses due to
ferromagnetic materials, interstitial diffusion of atoms, dislocation, relaxation process in metals, interaction of sound with lattice vibrations called phonons etc. The ability of the substance to
absorb the sound is measured in terms of absorption coefficient (a), Itis defined as the ratio of the sound energy absorbed to sound energy incident upon it 𝑎𝑏𝑠𝑜𝑟𝑝𝑡𝑖𝑜𝑛 𝑐𝑜𝑒𝑓𝑓𝑖𝑐𝑖𝑒𝑛𝑡,= 𝑠𝑜𝑢𝑛𝑑 𝑒𝑛𝑒𝑟𝑔𝑦 𝑎𝑏𝑠𝑜𝑟𝑏𝑒𝑑 𝑏𝑦 𝑡ℎ𝑒 𝑠𝑢𝑏𝑠𝑡𝑎𝑛𝑐𝑒/𝑠𝑜𝑢𝑛𝑑 𝑒𝑛𝑒𝑟𝑔𝑦 𝑖𝑛𝑐𝑖𝑑𝑒𝑛𝑡 𝑢𝑝𝑜𝑛 𝑖𝑡 =𝑊𝑎/𝑊𝐼 =𝑊𝑇/𝑊𝐼 …(4.1)
An open window is considered as an ideal absorber, as it transmits the entire acoustic energy
incident upon it. Thus the absorption coefficient of open window is 1. For an open window the absorption coefficient is same as transmission coefficient. The absorption coefficient of all the
other substances is expressed in terms of absorption coefficient an open window. This unit is called as Open Window Unit (O.W.U.) or Sabine in the name of Prof. W.C. Sabine who developed
Sabine’s formula and contributed in the theory of architectural acoustics. Three key factors on which absorption coefficient depends are…nature of material,
frequency of sound and the temperature. The ideal methods that are used to measure absorption coefficient are based on reverberation chambers and impedance tubes. Sound absorption coefficient can also be calculated using a formula given below
𝑎= (𝑊𝐼−𝑊 ) /𝑊𝐼=1− 𝑊𝑅/𝑊𝐼 … (4.2)

Figure 4.1: The experimental set up for measuring sound absorption coefficient
Procedure:
1. Make the sound level meter ON and adjust it’s range to 80 to 130 dB. Keep the sound level meter at position Y as shown Fig 4.1. Close the sound proof box
2. Make a/c mains, frequency generator, audio amplifier and speaker ON. At first adjust the frequency in the frequency generator to 500 Hz.
3. Measure the intensity in sound level meter in dB (decibels) at position Y in the absence of
material as shown in Fig 4.1. Let this reading be WI. This is direct reading. 4. Measure the direct sound intensities at other frequencies; 1000 Hz, 1500 Hz, 2000 Hz and
2500 Hz. Record these intensities in the observation tables 4.1, 4.2, 4.3, 4.4. Direct readings are common to all four observation tables.
5. Now place the first sound absorbing material at the place as shown in the Fig. 4.1. By keeping the sound level meter at same position Y, measure the intensity of sound in dB at
the frequencies 500 Hz to 2500 Hz as mentioned earlier. Let this reading be WT. 6. Calculate the sound absorption coefficient by using following Eqn.
𝑎= 𝑊𝑇/𝑊𝐼 ….. (4.3)
7. Repeat the same procedure for all given absorbing materials.
8. Tabulate all observations and calculations as per tables 4.1 to 4.4 9. Plot the graphs of sound absorption coefficient Vs frequency for each material
27

Observations and Calculations
Table 4.1: Name of the material: Plywood, Thickness = ………… mm
Sr. Frequency Direct intensity Absorbed/transmitted Sound absorption
No. Hz WI, dB intensity, WT, dB Coefficient, a
1 500
2 1000
3 1500
4 2000
5 2500
Table 4.2: Name of the material: MDF (Medium Density Fiberboard), Thickness = ………… mm
Sr. Frequency Direct intensity Absorbed/transmitted Sound absorption
No. Hz WI, dB intensity, WT, dB Coefficient, a
1 500
2 1000
3 1500
4 2000
5 2500
Table 4.3 Name of the material: Bakelite, Thickness = ………… mm
Sr. Frequency Direct intensity Absorbed/transmitted Sound absorption
No. Hz WI, dB intensity, WT, dB Coefficient, a
1 500
2 1000
3 1500
4 2000
5 2500
Table 4.4: Name of the material: Glass, Thickness = ………… mm
Sr. Frequency Direct intensity Absorbed/transmitted Sound absorption
No. Hz WI, dB intensity, WT, dB Coefficient, a
1 500
2 1000
3 1500
4 2000
5 2500
28
Viva Voce
1. Why is sound reflected by a substance?
2. Why is sound absorbed by substance?
3. How is sound transmitted by the substance even if it is not porous? 4. The sound absorption coefficient is the ratio of two intensities in the same unit, which is
dB. So it is the dimensionless quantity. How does then it has a unit of O.W.U. (Sabine)? 5. Most of the sound energy that is absorbed by a sound absorbing material is converted in
to heat. What must be the mechanism? 6. Why different substances have different absorption coefficients? 7. Amongst the materials that you have used, which material has least absorption
coefficient? Why? 8. Amongst the materials that you have used, which material has maximum absorption
coefficient? Why? 9. Why should absorption coefficient depend upon the frequency of the sound?
10. Does sound absorption coefficient depend upon the temperature? 11. The sound absorbing materials are used to absorb the excess sound in the auditoria,
concert halls etc. Why the sound needs to be absorbed at such places? 12. In the same theater/auditorium different sound absorbing materials are used at different
locations. Why? 13. Sound absorbing materials are also used for noise reduction. What do you mean by
noise? 14. What are the typical places where noise is excessive? 15. A person has his house very near to the highway. So he is troubled due to noise. Out of the
materials that you have tested for the experiment, which material you will suggest for noise reduction?
16. Do you think that the materials with low absorption coefficients and high reflection coefficients can have applications? If, yes then what are these applications?
17. Sound absorbing materials are used in acoustic delay lines. What is acoustic delay line? Where it is used?
18. Sound absorbing materials are used in acoustic filters. What is acoustic filter? Where it is used?
19. Suppose you did this experiment by taking all absorbing materials with thickness of 3 mm and in some other institute the same experiment is performed by taking the same materials but having 6 mm thickness or say 1.5 mm thickness. Do you think that the results will be affected? Why? Why not?
Government Polytechnic Muzaffarpur
Name of the Lab: Applied Science Lab
Subject Code: 1602107
EXPERIMENT NO. 06

Aim: To determine Joule's constant (J) by electric method.
Apperatus: Joules calorimeter , Voltmeter , Power supply , Ammeter,
Thermometer, Connecting wires, Measuring cylinder. Theory
Heating effect of electric current.
It states that, current flowing through conductor is opposed by its
resistance and re-appears in the form of heat. This is called heating effect of
electric current.
Concept Structure
Joule's Law
It states that quantity of heat (H) produced in conductor is directly
proportional to square of electric current (I2) time (t) during which current flows
and resistance (R) of the conductor.
Concept Structure
Joule's Constant (J)
Joules constant is conversion factor between heat energy in joule and heat in
calories.
Concept Structure
THEORY

In 1844-1854 the English scientist J. P. Joule conducted experiments which
were destined to play an important role in science. The objective of Joule's
experiment was to establish a relation between the amount of work spent to bring
about the liberation of heat and the amount of the heat liberated.
Heat is one of the most essential concepts of thermodynamics. By its
nature the concept of heat is very close to the concept of work. Both heat and
work are forms of transfer of energy. We can only state that a certain amount of
heat or work has been imparted to, or taken away from, a body. It is customary
to assume that addition of heat involves a rise in the temperature of the body,
determined by the energy of the micro particles constituting the body, which is
often the case. But, as it will be seen later on, it happens that notwithstanding
the addition of heat to a body its temperature decreases. All depends on the
balance of the energy transferred to the body and removed from it. In the special
but most widespread case the change in the temperature of a body is determined
by the relation between the amounts of heat and work imparted to the body and
removed from it.
Circuit Diagram

Amount of heat produced by electricity is,
H= I2Rt/ J
But, V= I R
H= V I t / J ...................................(1)
Amount of heat absorbed by calorimeter and water is,
H= [ Mc. Sc + M w. S w ][ θ 2-θ 1] ...................................(2)
Equating (1) and (2) we get,
V I t J = [ Mc. Sc + M w. S w ][ θ 2-θ 1]

J= V I t [ Mc. Sc + M w. S w ][ θ 2-θ 1]
=…………………………..J/kcal