government-funded students and courses
TRANSCRIPT

Australian vocational education and training statistics
Government-funded students and courses January to March 2021
National Centre for Vocational Education Research
Highlights In the first three months to 31 March 2021, 748 500 students were enrolled in government-funded vocational education and training (VET). They included: • 735 800 students enrolled in nationally recognised training • 27 500 students enrolled in non-nationally recognised training.
Government-funded program enrolments comprised: • 93.4% in nationally recognised programs • 4.1% in locally developed programs • 2.5% in non-nationally recognised programs.
89.5% of program enrolments were in qualifications: • 81.7% of program enrolments were in training package qualifications • 7.8% were in accredited qualifications • 48.4% of qualifications were at certificate III level • 20.4% of qualifications were at certificate IV level.

2 Australian vocational education and training statistics
© Commonwealth of Australia, 2021
With the exception of the cover design, artwork, photographs, all logos, and any other material where copyright is owned by a third
party, all material presented in this document is provided under a Creative Commons Attribution 3.0 Australia
<creativecommons.org/licenses/by/3.0/au> licence.
The details of the relevant licence conditions are available on the Creative Commons website (accessible using the links provided) as is
the full legal code for the CC BY 3.0 AU licence <creativecommons.org/licenses/by/3.0/legalcode>.
The Creative Commons licence conditions do not apply to all logos, graphic design, artwork and photographs. Requests and enquiries
concerning other reproduction and rights should be directed to the National Centre for Vocational Education Research (NCVER).
This document should be attributed as NCVER 2021, Australian vocational education and training statistics: government-funded students
and courses — January to March 2021, NCVER, Adelaide.
This work has been produced by NCVER on behalf of the Australian Government and state and territory governments, with funding
provided through the Australian Government Department of Education, Skills and Employment.
The views and opinions expressed in this document are those of NCVER and do not necessarily reflect the views of the Australian
Government or state and territory governments.
ISSN 2205-4391
TD/TNC 144.13
Comments and suggestions regarding this publication are welcomed and should be forwarded to NCVER.
Published by NCVER, ABN 87 007 967 311
Level 5, 60 Light Square, Adelaide SA 5000
PO Box 8288 Station Arcade, Adelaide SA 5000, Australia
Phone +61 8 8230 8400 Email [email protected]
Web <https://www.ncver.edu.au> <http://www.lsay.edu.au>
Follow us: <https://twitter.com/ncver> <https://www.linkedin.com/company/ncver>

Government-funded students and courses – January to March 2021 3
Contents Introduction 4
About this publication 4
More information 4
Tables 7
Terms 17
Explanatory notes 20
Tables
1 Summary of government-funded training by state/territory, January to March 2017–21 (’000) 7
2 Government-funded students by type of training and state/territory, January to March 2021 (’000) 8
3 Government-funded students by type of training, January to March 2017–21 8
4 Provider reporting type by state/territory, January to March 2021 9
5 Provider reporting type, January to March 2017–21 9
6 Government-funded students by provider reporting type and state/territory, January to March 2021 (’000) 9
7 Government-funded students by provider reporting type, January to March 2017–21 (’000) 9
8 Government-funded student characteristics by state/territory, January to March 2021 (’000) 10
9 Government-funded student characteristics, January to March 2017–21 (’000) 11
10 Government-funded program enrolments by type of training and state/territory, January to March 2021 (’000) 12
11 Government-funded program enrolments by type of training, January to March 2017–21 (’000) 12
12 Government-funded program enrolments by field of education and state/territory, January to March 2021 (’000) 13
13 Government-funded program enrolments by field of education, January to March 2017–21 (’000) 13
14 Government-funded qualification enrolments by level of education and state/territory, January to March 2021 (’000) 14
15 Government-funded qualification enrolments by level of education, January to March 2017–21 (’000) 14
16 Government-funded subject enrolments by type of training and state/territory, January to March 2021 (’000) 15
17 Government-funded subject enrolments by type of training, January to March 2017–21 (’000) 16
Figures
1 Government-funded students by type of nationally recognised training, January to March 2021 (%) 5
2 Government-funded students by training provider type, January to March 2021 6
3 Government-funded program enrolments by field of education, January to March 2021 6

4 Australian vocational education and training statistics
Introduction This publication provides a summary of data on domestic government-funded vocational education and training (VET) activity delivered in Australia. It contains information on students, programs, subjects and training providers.
Data are presented for Australia and by the state or territory that administered the funding of the training activity.
Data are sourced from the National VET Provider Collection, which is compiled under the Australian Vocational Education and Training Management Information Statistical Standard (AVETMISS).
About this publication This publication covers Commonwealth and state/territory government-funded training (Commonwealth or state recurrent funding, Commonwealth specific purpose funding or state specific funding). No fee-for-service activity is included.
Data for the Government-funded students and courses series are received by NCVER in four cumulative submissions: • January to March, submitted in May • January to June, submitted in August • January to September, submitted in November • January to December, submitted in March.
This allows additional data to be reported and corrections made to previously submitted data.
The data in this publication cover the period of 1 January to 31 March 2021. For comparative purposes it also examines these data against previously submitted data for 1 January to 31 March 2017 to 2020.
More information Caution must be used for quarter to quarter comparisons as several jurisdictions have experienced implementation and system issues in different quarterly submissions. Furthermore, some training authorities do not report data for the first three quarters, which affects the comparison of quarterly data with annual data. Refer to the Data quality and comparability issues section in the explanatory notes (pages 20 to 22) for details of the issues affecting this publication.
Data in this publication may be revised for a variety of reasons. For the latest and additional data on government-funded training activity, please visit the National Centre for Vocational Education Research (NCVER) Portal <https://www.ncver.edu.au/research-and-statistics/collections/students-and-courses-collection>.

Government-funded students and courses – January to March 2021 5
Summary
Students In the first three months to 31 March 2021, 748 500 students were enrolled in government-funded VET.
Some students enrolled in one or more programs, others in stand-alone subjects, and some in a combination of both.
In the first three months to 31 March 2021, 735 800 government-funded students were enrolled in nationally recognised VET, consisting of: • training package qualifications (627 300 students or 85.2%) • accredited qualifications (59 100 students or 8.0%) • training package skill sets (13 300 students or 1.8%) • accredited courses (17 800 students or 2.4%) • locally developed programs (30 500 students or 4.1%) comprised of at least one nationally
recognised subject • stand-alone nationally recognised subjects (9 900 students or 1.3%).
Figure 1 Government-funded students enrolled in nationally recognised training, January to March 2021 (%)
Note: The sum of students will not add to 100% as a student may have enrolled in multiple programs and/or subjects in the reporting period.
In the first three months to 31 March 2021, 27 500 government-funded students were enrolled in non-nationally recognised VET, consisting of: • non-nationally recognised programs (19 300 students) • non-nationally recognised stand-alone subjects (8000 students).
85.2
8.01.8 2.4 3.7
0.5 1.30.0
10.0
20.0
30.0
40.0
50.0
60.0
70.0
80.0
90.0
100.0
Trainingpackage
qualifications
Accreditedqualifications
Trainingpackage skill
sets
Accreditedcourses
Locallydeveloped skill
sets
Locallydeveloped
courses
Stand-alonesubjects
Nationally recognised programs Locally developed programs Nationallyrecognised
subjects

6 Australian vocational education and training statistics
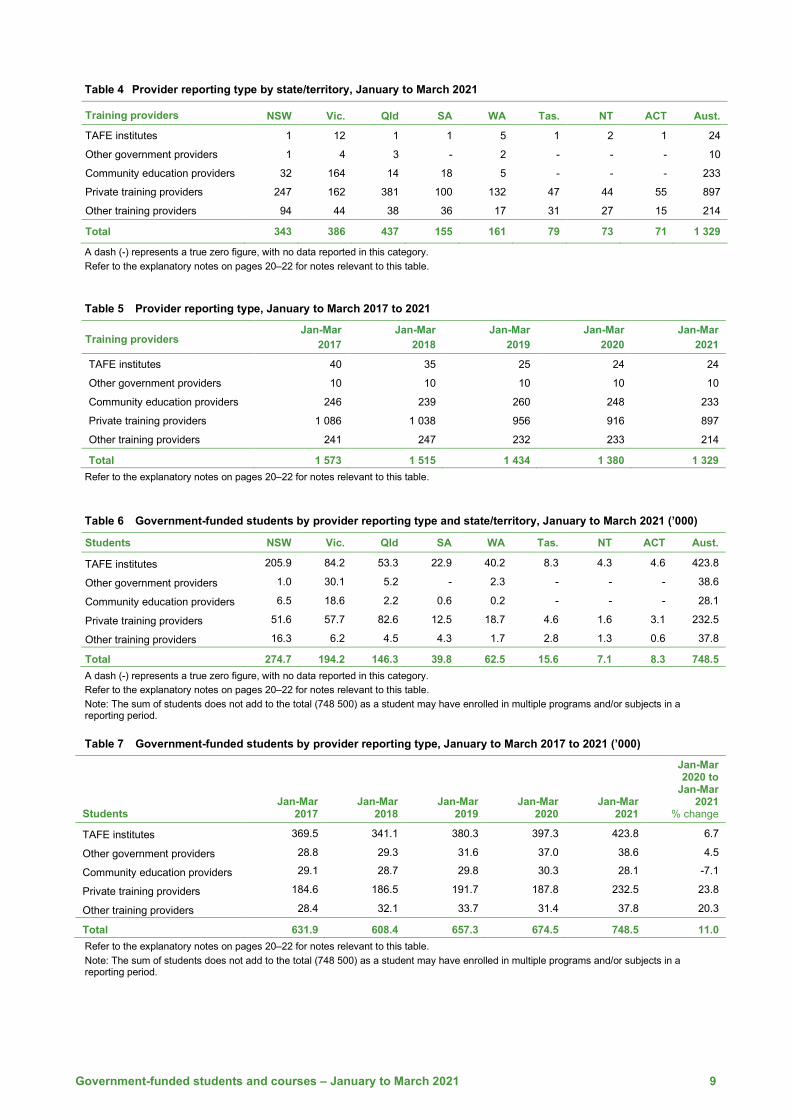
Students by training providers In the first three months to 31 March 2021, 1 329 training providers delivered government-funded VET. There were:
• 423 800 (56.6%) government-funded students at TAFE institutes • 232 500 (31.1%) government-funded students at private training providers.
Figure 2 Government-funded students by provider reporting type, January to March 2021
Note: The sum of students does not add to the total (748 500) as some students have enrolled in more than one training provider type in the reporting period.
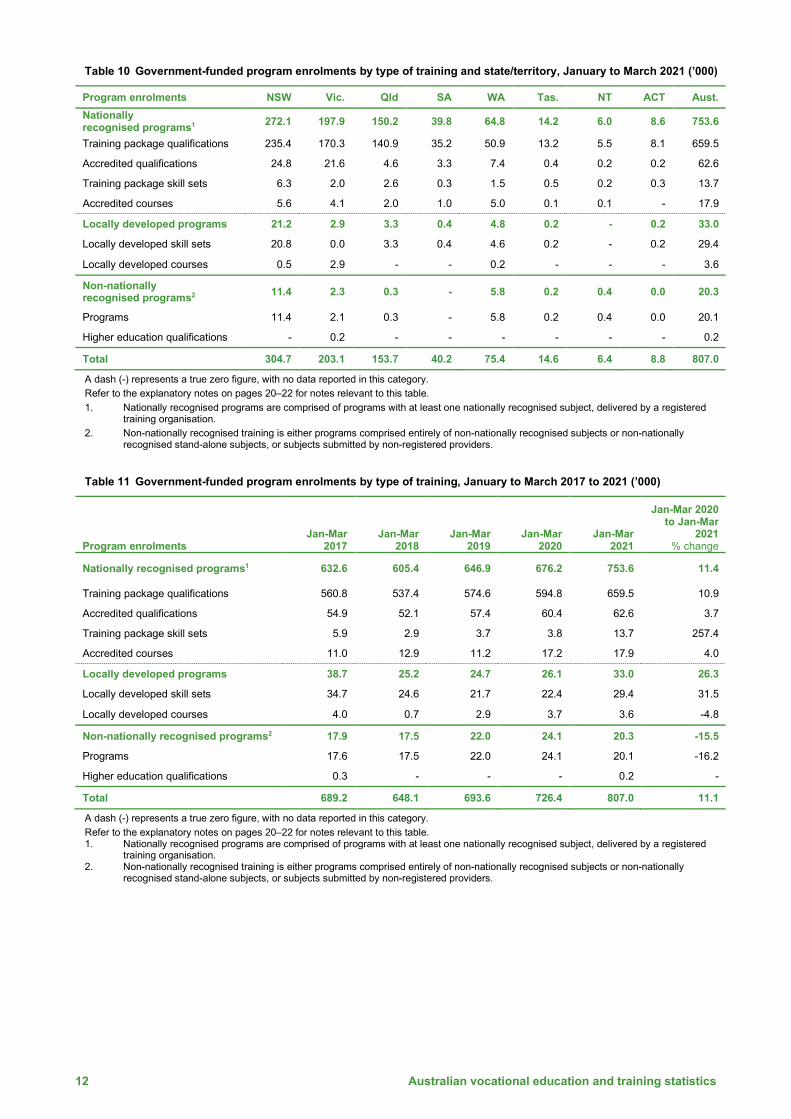
Program enrolments In the first three months to 31 March 2021, there were 807 000 government-funded program enrolments. • 89.5% were in qualifications, including training package qualifications (81.7%) and accredited
qualifications (7.8%). • 3.9% were in training package skill sets and accredited courses. • 4.1% were in locally developed programs comprised of at least one nationally recognised subject. • 2.5% were in non-nationally recognised programs. • The highest proportion of enrolments were in Society and culture (at 17.5%), followed by Engineering
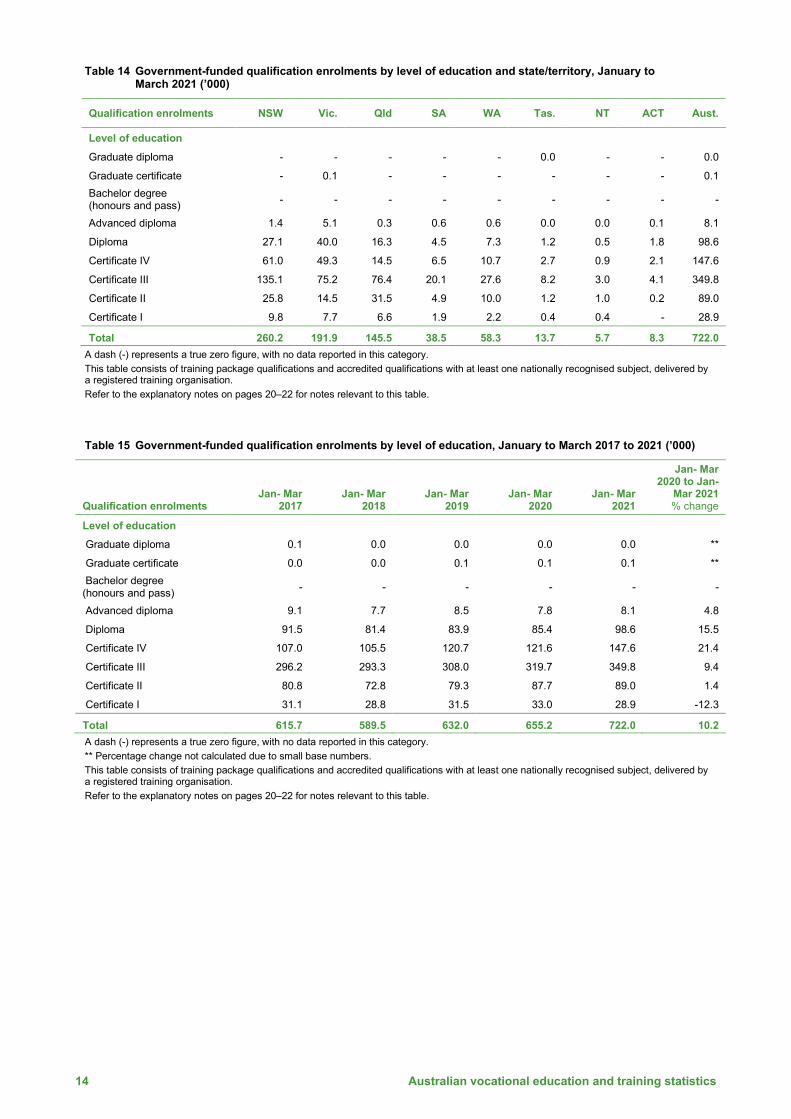
and related technologies (at 16.5%). • Most qualification enrolments were in certificate III level qualifications (48.4%), followed by
certificate IV (20.4%).
Figure 3 Government-funded program enrolments by field of education, January to March 2021
Note: (1) Training package skill sets and locally developed skill sets are not assigned a field of education. Refer to the explanatory notes on pages 20-22 for more information.
423 800
232 500
38 600
37 800
28 100
100 000 200 000 300 000 400 000 500 000
TAFE institutes
Private training providers
Other government providers
Other training providers
Community education providers
141 500
132 800
97 500
85 200
80 700
53 500
53 500
52 500
43 200
24 900
18 200
17 300
6 200
25 000 50 000 75 000 100 000 125 000 150 000
Society and culture
Engineering and related technologies
Management and commerce
Mixed field programmes
Architecture and building
Food, hospitality and personal services
Education
Health
No field of education (1)
Agriculture, environmental and related studies
Information technology
Creative arts
Natural and physical sciences

Government-funded students and courses – January to March 2021 7
Tables Table 1 Summary of government-funded training by state/territory, January to March 2017 to 2021 (’000)
Jan-Mar
2017 Jan-Mar
2018 Jan-Mar
2019 Jan-Mar
2020 Jan-Mar
2021
Jan-Mar 2020 to Jan-Mar 2021
% change
Students Australia 631.9 608.4 657.3 674.5 748.5 11.0 New South Wales 218.1 234.3 247.1 237.1 274.7 15.9
Victoria 175.4 164.0 174.0 178.1 194.2 9.0
Queensland 117.8 117.9 122.8 138.9 146.3 5.4
South Australia 30.6 15.5 38.3 39.2 39.8 1.6
Western Australia 54.5 41.9 46.4 53.0 62.5 17.9
Tasmania 13.3 13.6 13.7 14.2 15.6 10.1
Northern Territory 11.2 9.7 7.9 7.2 7.1 -1.5
Australian Capital Territory 10.8 11.7 7.1 7.0 8.3 19.8
Program enrolments Australia 689.2 648.1 693.6 726.4 807.0 11.1 New South Wales 242.8 253.1 265.3 263.8 304.7 15.5
Victoria 191.6 171.5 183.4 186.6 203.1 8.9
Queensland 123.8 124.3 130.0 146.5 153.7 4.9
South Australia 29.2 13.7 36.6 38.8 40.2 3.7
Western Australia 66.2 50.2 50.1 63.0 75.4 19.6
Tasmania 13.0 13.6 13.7 14.0 14.6 4.8
Northern Territory 10.6 8.9 7.1 6.5 6.4 -1.3
Australian Capital Territory 12.1 12.8 7.3 7.3 8.8 20.9
Subject enrolments
Australia 4 888.5 4 533.1 4 674.9 4 603.0 5 242.4 13.9 New South Wales 1 999.0 2 032.8 2 043.8 1 873.5 2 205.3 17.7
Victoria 1 213.2 1 092.9 1 106.8 1 111.0 1 315.5 18.4
Queensland 954.0 910.8 961.0 998.3 1 025.0 2.7
South Australia 149.1 57.0 160.9 168.8 178.8 5.9
Western Australia 379.0 252.7 260.0 312.6 367.3 17.5
Tasmania 68.0 70.4 71.7 71.8 78.0 8.6
Northern Territory 60.7 50.2 38.5 36.2 35.1 -3.2
Australian Capital Territory 65.4 66.4 32.3 30.8 37.3 21.2 Refer to the explanatory notes on pages 20–22 for notes relevant to this table.

8 Australian vocational education and training statistics
Table 2 Government-funded students by type of training and state/territory, January to March 2021 (’000)
Students NSW Vic. Qld SA WA Tas. NT ACT Aust. Nationally recognised programs1 253.7 183.1 143.2 38.5 57.9 13.9 5.8 8.2 704.2
Training package qualifications 223.3 159.1 135.0 34.3 49.6 13.0 5.3 7.7 627.3 Accredited qualifications 22.8 20.6 4.5 3.2 7.1 0.4 0.2 0.2 59.1 Training package skill sets 6.2 2.0 2.4 0.3 1.5 0.5 0.2 0.3 13.3 Accredited courses 5.6 4.1 2.0 1.0 4.9 0.1 0.1 - 17.8 Locally developed programs 19.3 2.8 3.2 0.4 4.5 0.2 - 0.2 30.5 Locally developed skill sets 18.8 0.0 3.2 0.4 4.3 0.2 - 0.2 27.1 Locally developed courses 0.5 2.8 - - 0.2 - - - 3.5
Stand-alone nationally recognised subjects 3.1 2.7 0.3 0.8 0.0 1.7 1.2 0.0 9.9
Nationally recognised training total 271.3 186.9 146.1 39.3 61.6 15.6 6.7 8.3 735.8
Non-nationally recognised training total2 12.0 8.4 0.3 0.6 5.6 0.2 0.4 0.0 27.5
Programs 10.8 2.0 0.3 - 5.6 0.2 0.4 0.0 19.3 Higher education qualifications - 0.2 - - - - - - 0.2 Stand-alone subjects 1.2 6.2 0.0 0.6 - - 0.0 - 8.0
Total 274.7 194.2 146.3 39.8 62.5 15.6 7.1 8.3 748.5
A dash (-) represents a true zero figure, with no data reported in this category. Refer to the explanatory notes on pages 20–22 for notes relevant to this table. 1. Nationally recognised programs are comprised of programs with at least one nationally recognised subject, delivered by a registered training
organisation. 2. Non-nationally recognised training is either programs comprised entirely of non-nationally recognised subjects or non-nationally recognised
stand-alone subjects, or subjects submitted by non-registered providers. Note: The sum of students does not add to the total (748 500) as a student may have enrolled in multiple programs and/or subjects in a reporting period. Table 3 Government-funded students by type of training, January to March 2017 to 2021 (’000)
Students Jan-Mar
2017 Jan-Mar
2018 Jan-Mar
2019 Jan-Mar
2020 Jan-Mar
2021
Jan-Mar 2020 to
Jan-Mar 2021
% change Nationally recognised1 programs 582.9 563.1 604.8 632.0 704.2 11.4
Training package qualifications 524.9 506.7 543.7 564.2 627.3 11.2
Accredited qualifications 52.0 49.5 53.3 57.1 59.1 3.5
Training package skill sets 5.3 2.8 3.5 3.7 13.3 262.5
Accredited courses 11.0 12.8 10.7 17.1 17.8 4.1
Locally developed programs 33.1 23.1 23.1 24.2 30.5 25.9
Locally developed skill sets 29.1 22.5 20.2 20.6 27.1 31.5
Locally developed courses 3.9 0.7 2.9 3.7 3.5 -6.3
Stand-alone nationally recognised subjects 13.7 15.0 19.1 9.4 9.9 5.8
Nationally recognised training total 617.7 593.5 638.9 658.7 735.8 11.7
Non-nationally recognised training2 total 26.6 27.1 32.8 33.2 27.5 -17.3
Programs 16.5 17.2 21.2 23.1 19.3 -16.4
Higher education qualifications 0.3 - - - 0.2 -
Stand-alone subjects 9.9 9.9 11.7 10.1 8.0 -21.1
Total 631.9 608.4 657.3 674.5 748.5 11.0
A dash (-) represents a true zero figure, with no data reported in this category. Refer to the explanatory notes on pages 20–22 for notes relevant to this table. 1. Nationally recognised programs are comprised of programs with at least one nationally recognised subject, delivered by a registered training
organisation. 2. Non-nationally recognised training is either programs comprised entirely of non-nationally recognised subjects or non-nationally recognised
stand-alone subjects, or subjects submitted by non-registered providers. Note: The sum of students does not add to the total (748 500) as a student may have enrolled in multiple programs and/or subjects in a reporting
period.
Government-funded students and courses – January to March 2021 9
Table 4 Provider reporting type by state/territory, January to March 2021
Training providers NSW Vic. Qld SA WA Tas. NT ACT Aust.
TAFE institutes 1 12 1 1 5 1 2 1 24
Other government providers 1 4 3 - 2 - - - 10
Community education providers 32 164 14 18 5 - - - 233
Private training providers 247 162 381 100 132 47 44 55 897
Other training providers 94 44 38 36 17 31 27 15 214
Total 343 386 437 155 161 79 73 71 1 329
A dash (-) represents a true zero figure, with no data reported in this category. Refer to the explanatory notes on pages 20–22 for notes relevant to this table.
Table 5 Provider reporting type, January to March 2017 to 2021
Training providers Jan-Mar
2017 Jan-Mar
2018 Jan-Mar
2019 Jan-Mar
2020 Jan-Mar
2021
TAFE institutes 40 35 25 24 24
Other government providers 10 10 10 10 10
Community education providers 246 239 260 248 233
Private training providers 1 086 1 038 956 916 897
Other training providers 241 247 232 233 214
Total 1 573 1 515 1 434 1 380 1 329 Refer to the explanatory notes on pages 20–22 for notes relevant to this table.
Table 6 Government-funded students by provider reporting type and state/territory, January to March 2021 (’000)
Students NSW Vic. Qld SA WA Tas. NT ACT Aust.
TAFE institutes 205.9 84.2 53.3 22.9 40.2 8.3 4.3 4.6 423.8
Other government providers 1.0 30.1 5.2 - 2.3 - - - 38.6
Community education providers 6.5 18.6 2.2 0.6 0.2 - - - 28.1
Private training providers 51.6 57.7 82.6 12.5 18.7 4.6 1.6 3.1 232.5
Other training providers 16.3 6.2 4.5 4.3 1.7 2.8 1.3 0.6 37.8
Total 274.7 194.2 146.3 39.8 62.5 15.6 7.1 8.3 748.5 A dash (-) represents a true zero figure, with no data reported in this category. Refer to the explanatory notes on pages 20–22 for notes relevant to this table. Note: The sum of students does not add to the total (748 500) as a student may have enrolled in multiple programs and/or subjects in a reporting period.
Table 7 Government-funded students by provider reporting type, January to March 2017 to 2021 (’000)
Students Jan-Mar
2017 Jan-Mar
2018 Jan-Mar
2019 Jan-Mar
2020 Jan-Mar
2021
Jan-Mar 2020 to
Jan-Mar 2021
% change
TAFE institutes 369.5 341.1 380.3 397.3 423.8 6.7
Other government providers 28.8 29.3 31.6 37.0 38.6 4.5
Community education providers 29.1 28.7 29.8 30.3 28.1 -7.1
Private training providers 184.6 186.5 191.7 187.8 232.5 23.8
Other training providers 28.4 32.1 33.7 31.4 37.8 20.3
Total 631.9 608.4 657.3 674.5 748.5 11.0 Refer to the explanatory notes on pages 20–22 for notes relevant to this table. Note: The sum of students does not add to the total (748 500) as a student may have enrolled in multiple programs and/or subjects in a reporting period.

10 Australian vocational education and training statistics
Table 8 Government-funded student characteristics by state/territory, January to March 2021 (’000) Student characteristics NSW Vic. Qld SA WA Tas. NT ACT Aust.
Gender Males 128.6 93.6 71.4 19.6 30.5 8.7 3.8 4.1 360.3 Females 145.7 99.9 74.2 20.2 31.6 6.9 3.3 4.1 385.9 Other 0.0 - 0.1 - 0.0 0.0 0.0 0.0 0.2 Not known 0.3 0.7 0.6 0.0 0.3 0.0 0.0 0.1 2.1
Age group 14 years and under 0.1 0.0 0.0 0.0 0.0 - 0.0 0.0 0.2 15 to 19 years 56.0 27.6 49.0 7.5 17.0 2.3 1.5 1.3 162.2 20 to 24 years 58.9 48.9 30.3 9.0 13.9 4.0 1.4 2.1 168.7 25 to 44 years 107.2 80.8 47.1 16.4 22.4 6.5 3.0 3.8 287.1 45 to 64 years 46.2 33.7 19.1 6.5 8.7 2.7 1.0 1.1 118.9 65 years and over 6.3 3.2 0.7 0.5 0.5 0.1 0.1 0.0 11.4 Not known 0.0 0.0 0.0 - 0.0 - 0.0 0.0 0.0
Student remoteness region
Major cities 184.4 142.4 84.1 27.7 46.8 0.0 0.0 7.5 492.9 Inner regional 64.2 41.6 33.1 5.7 6.2 9.9 0.0 0.7 161.4 Outer regional 22.2 8.5 22.9 5.0 5.2 5.2 4.2 0.1 73.4 Remote 2.1 0.1 3.7 1.0 2.3 0.4 1.3 0.0 10.9 Very remote 0.6 0.0 2.2 0.4 1.6 0.1 1.2 - 6.1 Offshore 0.1 0.1 0.1 0.0 0.2 0.0 0.0 0.0 0.5 Not known 1.1 1.4 0.3 0.1 0.1 0.1 0.3 0.0 3.4
Indigenous status Indigenous 24.2 3.6 10.7 1.8 4.2 1.0 2.2 0.3 48.1 Non-Indigenous 247.2 188.5 127.7 37.6 48.0 14.4 4.8 7.5 675.7 Not known 3.2 2.0 7.9 0.4 10.3 0.3 0.0 0.5 24.6
Disability (including impairment or long-term condition)
With a disability 15.9 17.6 11.0 2.9 4.9 1.5 0.4 0.9 55.1 Without a disability 251.4 171.6 123.0 36.4 51.4 13.1 6.3 7.4 660.5 Not known 7.4 4.9 12.3 0.6 6.2 1.0 0.3 0.1 32.9
Is a language other than English spoken at home
Yes 56.8 56.1 13.3 8.0 9.1 1.1 1.6 1.6 147.6 No 203.9 136.1 122.3 30.7 49.3 13.0 5.2 5.8 566.4 Not known 14.0 2.0 10.8 1.1 4.1 1.5 0.2 0.9 34.5
Labour force status Employed 159.4 114.6 80.8 24.5 20.5 12.2 5.2 6.5 423.7 Unemployed 66.5 42.9 29.2 7.8 9.4 2.2 1.0 1.0 160.1 Not in the labour force 34.6 27.4 18.5 6.1 7.0 0.7 0.5 0.3 95.1 Not known 14.2 9.3 17.9 1.4 25.5 0.5 0.3 0.5 69.7
School status At school 12.7 3.5 29.2 4.9 5.4 0.7 0.8 0.4 57.7 Not at school 256.8 190.3 112.6 34.1 55.3 14.0 6.1 7.3 676.5 Not known 5.2 0.3 4.5 0.8 1.8 0.9 0.2 0.6 14.4
Apprentice/trainee status
Apprentices and trainees undertaking off-the-job training
70.5 47.7 43.7 10.1 17.7 8.0 2.5 3.6 203.7
Not apprentices and trainees 204.2 146.4 102.6 29.7 44.9 7.6 4.6 4.8 544.8
SEIFA (IRSD) Quintile 1: most disadvantaged 67.9 35.8 34.8 11.8 7.6 7.2 1.5 0.1 166.6
Quintile 2 66.3 40.0 27.2 11.8 12.3 2.9 0.7 0.2 161.5 Quintile 3 54.4 43.7 36.9 7.4 16.1 2.8 1.9 0.9 164.1 Quintile 4 40.5 40.0 32.2 6.3 15.7 2.2 1.3 2.6 140.6 Quintile 5: least disadvantaged 44.0 32.6 14.9 2.4 10.4 0.4 1.4 4.4 110.6
Not known 1.5 2.1 0.3 0.1 0.4 0.1 0.3 0.2 5.1 Total students 274.7 194.2 146.3 39.8 62.5 15.6 7.1 8.3 748.5 A dash (-) represents a true zero figure, with no data reported in this category. Refer to the explanatory notes on pages 20–22 for notes relevant to this table.
Government-funded students and courses – January to March 2021 11
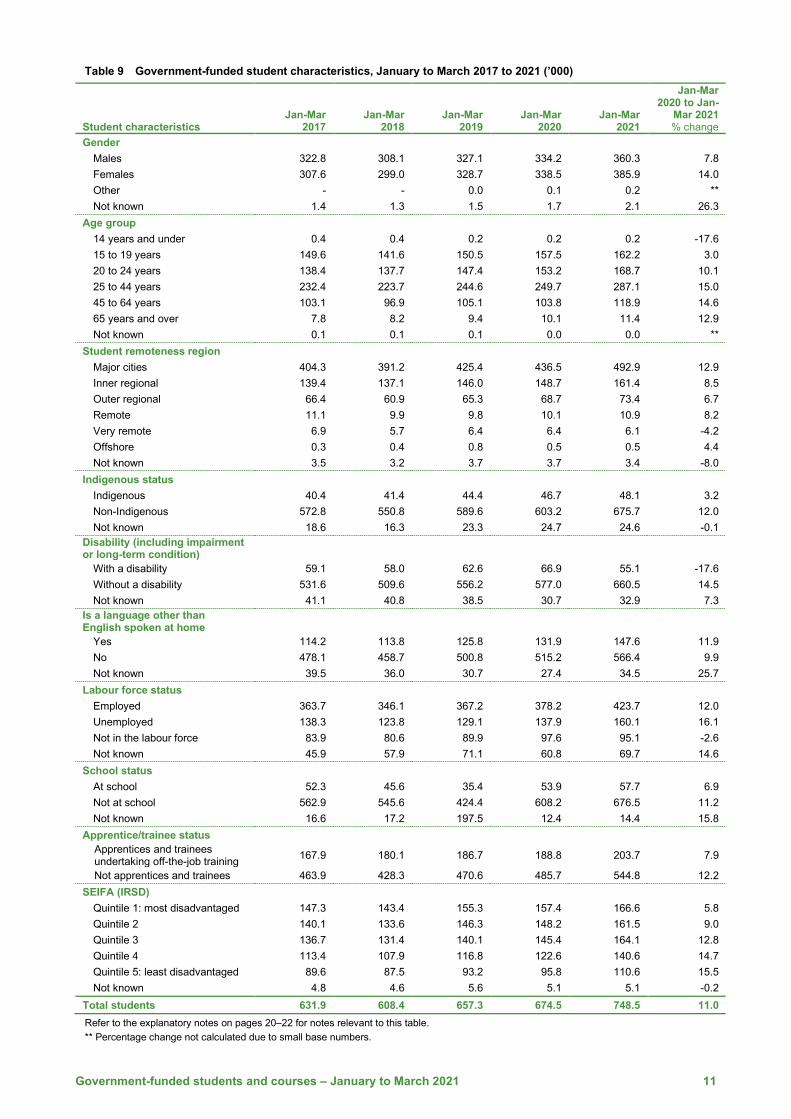
Table 9 Government-funded student characteristics, January to March 2017 to 2021 (’000)
Student characteristics Jan-Mar
2017 Jan-Mar
2018 Jan-Mar
2019 Jan-Mar
2020 Jan-Mar
2021
Jan-Mar 2020 to Jan-
Mar 2021 % change
Gender Males 322.8 308.1 327.1 334.2 360.3 7.8 Females 307.6 299.0 328.7 338.5 385.9 14.0 Other - - 0.0 0.1 0.2 ** Not known 1.4 1.3 1.5 1.7 2.1 26.3
Age group 14 years and under 0.4 0.4 0.2 0.2 0.2 -17.6 15 to 19 years 149.6 141.6 150.5 157.5 162.2 3.0 20 to 24 years 138.4 137.7 147.4 153.2 168.7 10.1 25 to 44 years 232.4 223.7 244.6 249.7 287.1 15.0 45 to 64 years 103.1 96.9 105.1 103.8 118.9 14.6 65 years and over 7.8 8.2 9.4 10.1 11.4 12.9 Not known 0.1 0.1 0.1 0.0 0.0 **
Student remoteness region Major cities 404.3 391.2 425.4 436.5 492.9 12.9 Inner regional 139.4 137.1 146.0 148.7 161.4 8.5 Outer regional 66.4 60.9 65.3 68.7 73.4 6.7 Remote 11.1 9.9 9.8 10.1 10.9 8.2 Very remote 6.9 5.7 6.4 6.4 6.1 -4.2 Offshore 0.3 0.4 0.8 0.5 0.5 4.4 Not known 3.5 3.2 3.7 3.7 3.4 -8.0
Indigenous status Indigenous 40.4 41.4 44.4 46.7 48.1 3.2 Non-Indigenous 572.8 550.8 589.6 603.2 675.7 12.0 Not known 18.6 16.3 23.3 24.7 24.6 -0.1
Disability (including impairment or long-term condition)
With a disability 59.1 58.0 62.6 66.9 55.1 -17.6 Without a disability 531.6 509.6 556.2 577.0 660.5 14.5 Not known 41.1 40.8 38.5 30.7 32.9 7.3
Is a language other than English spoken at home
Yes 114.2 113.8 125.8 131.9 147.6 11.9 No 478.1 458.7 500.8 515.2 566.4 9.9 Not known 39.5 36.0 30.7 27.4 34.5 25.7
Labour force status Employed 363.7 346.1 367.2 378.2 423.7 12.0 Unemployed 138.3 123.8 129.1 137.9 160.1 16.1 Not in the labour force 83.9 80.6 89.9 97.6 95.1 -2.6 Not known 45.9 57.9 71.1 60.8 69.7 14.6
School status At school 52.3 45.6 35.4 53.9 57.7 6.9 Not at school 562.9 545.6 424.4 608.2 676.5 11.2 Not known 16.6 17.2 197.5 12.4 14.4 15.8
Apprentice/trainee status Apprentices and trainees undertaking off-the-job training 167.9 180.1 186.7 188.8 203.7 7.9
Not apprentices and trainees 463.9 428.3 470.6 485.7 544.8 12.2 SEIFA (IRSD)
Quintile 1: most disadvantaged 147.3 143.4 155.3 157.4 166.6 5.8 Quintile 2 140.1 133.6 146.3 148.2 161.5 9.0 Quintile 3 136.7 131.4 140.1 145.4 164.1 12.8 Quintile 4 113.4 107.9 116.8 122.6 140.6 14.7 Quintile 5: least disadvantaged 89.6 87.5 93.2 95.8 110.6 15.5 Not known 4.8 4.6 5.6 5.1 5.1 -0.2
Total students 631.9 608.4 657.3 674.5 748.5 11.0 Refer to the explanatory notes on pages 20–22 for notes relevant to this table. ** Percentage change not calculated due to small base numbers.
12 Australian vocational education and training statistics
Table 10 Government-funded program enrolments by type of training and state/territory, January to March 2021 (’000)
Program enrolments NSW Vic. Qld SA WA Tas. NT ACT Aust. Nationally recognised programs1 272.1 197.9 150.2 39.8 64.8 14.2 6.0 8.6 753.6
Training package qualifications 235.4 170.3 140.9 35.2 50.9 13.2 5.5 8.1 659.5
Accredited qualifications 24.8 21.6 4.6 3.3 7.4 0.4 0.2 0.2 62.6
Training package skill sets 6.3 2.0 2.6 0.3 1.5 0.5 0.2 0.3 13.7
Accredited courses 5.6 4.1 2.0 1.0 5.0 0.1 0.1 - 17.9
Locally developed programs 21.2 2.9 3.3 0.4 4.8 0.2 - 0.2 33.0
Locally developed skill sets 20.8 0.0 3.3 0.4 4.6 0.2 - 0.2 29.4
Locally developed courses 0.5 2.9 - - 0.2 - - - 3.6
Non-nationally recognised programs2 11.4 2.3 0.3 - 5.8 0.2 0.4 0.0 20.3
Programs 11.4 2.1 0.3 - 5.8 0.2 0.4 0.0 20.1
Higher education qualifications - 0.2 - - - - - - 0.2
Total 304.7 203.1 153.7 40.2 75.4 14.6 6.4 8.8 807.0
A dash (-) represents a true zero figure, with no data reported in this category. Refer to the explanatory notes on pages 20–22 for notes relevant to this table. 1. Nationally recognised programs are comprised of programs with at least one nationally recognised subject, delivered by a registered training organisation. 2. Non-nationally recognised training is either programs comprised entirely of non-nationally recognised subjects or non-nationally recognised stand-alone subjects, or subjects submitted by non-registered providers.
Table 11 Government-funded program enrolments by type of training, January to March 2017 to 2021 (’000)
Program enrolments Jan-Mar
2017 Jan-Mar
2018 Jan-Mar
2019 Jan-Mar
2020 Jan-Mar
2021
Jan-Mar 2020 to Jan-Mar
2021 % change
Nationally recognised programs1 632.6 605.4 646.9 676.2 753.6 11.4
Training package qualifications 560.8 537.4 574.6 594.8 659.5 10.9
Accredited qualifications 54.9 52.1 57.4 60.4 62.6 3.7
Training package skill sets 5.9 2.9 3.7 3.8 13.7 257.4
Accredited courses 11.0 12.9 11.2 17.2 17.9 4.0
Locally developed programs 38.7 25.2 24.7 26.1 33.0 26.3
Locally developed skill sets 34.7 24.6 21.7 22.4 29.4 31.5
Locally developed courses 4.0 0.7 2.9 3.7 3.6 -4.8
Non-nationally recognised programs2 17.9 17.5 22.0 24.1 20.3 -15.5
Programs 17.6 17.5 22.0 24.1 20.1 -16.2
Higher education qualifications 0.3 - - - 0.2 -
Total 689.2 648.1 693.6 726.4 807.0 11.1
A dash (-) represents a true zero figure, with no data reported in this category. Refer to the explanatory notes on pages 20–22 for notes relevant to this table. 1. Nationally recognised programs are comprised of programs with at least one nationally recognised subject, delivered by a registered training organisation. 2. Non-nationally recognised training is either programs comprised entirely of non-nationally recognised subjects or non-nationally recognised stand-alone subjects, or subjects submitted by non-registered providers.

Government-funded students and courses – January to March 2021 13
Table 12 Government-funded program enrolments by field of education and state/territory, January to March 2021 (’000)
Program enrolments NSW Vic. Qld SA WA Tas. NT ACT Aust.
Field of education
Natural and physical sciences 2.0 1.6 1.6 0.3 0.6 0.1 0.0 0.0 6.2
Information technology 8.0 5.0 1.7 0.8 1.8 0.3 0.1 0.4 18.2 Engineering and related technologies 41.0 27.7 34.7 8.1 15.4 3.0 1.6 1.3 132.8
Architecture and building 26.2 30.5 13.0 4.1 3.4 2.2 0.5 1.0 80.7 Agriculture, environmental and related studies 9.7 6.6 4.4 1.6 1.5 0.6 0.5 0.1 24.9
Health 15.8 16.4 12.0 2.1 4.7 0.7 0.3 0.4 52.5
Education 13.5 16.9 11.3 2.1 8.2 0.4 0.3 0.7 53.5
Management and commerce 50.6 16.3 16.3 3.5 5.9 2.6 0.9 1.5 97.5
Society and culture 49.3 38.8 28.0 9.5 10.5 2.1 1.4 2.0 141.5
Creative arts 7.2 5.0 1.8 0.5 2.5 0.1 0.1 0.1 17.3 Food, hospitality and personal services 15.4 14.0 14.7 2.7 4.6 1.1 0.4 0.7 53.5
Mixed field programmes 39.0 22.4 8.4 4.3 10.1 0.8 0.2 0.0 85.2
No field of education 1 27.1 2.0 5.9 0.7 6.1 0.7 0.2 0.5 43.2
Total 304.7 203.1 153.7 40.2 75.4 14.6 6.4 8.8 807.0 1. Training package skill sets and locally developed skill sets are not assigned a field of education. Refer to the explanatory notes on pages 20–22 for notes relevant to this table.
Table 13 Government-funded program enrolments by field of education, January to March 2017 to 2021 (’000)
Program enrolments Jan-Mar
2017 Jan-Mar
2018 Jan-Mar
2019
Jan-Mar
2020
Jan-Mar
2021
Jan- Mar 2020 to
Jan- Mar 2021
% change
Field of education
Natural and physical sciences 3.7 3.4 4.2 4.9 6.2 25.6
Information technology 13.9 13.2 14.4 15.1 18.2 20.2
Engineering and related technologies 120.6 115.4 121.3 129.3 132.8 2.7
Architecture and building 71.9 70.6 73.6 73.4 80.7 10.1 Agriculture, environmental and related studies 23.3 18.7 20.6 21.5 24.9 16.2
Health 35.7 36.6 41.1 44.9 52.5 16.9
Education 51.8 43.8 44.0 47.6 53.5 12.4
Management and commerce 94.8 87.3 90.6 86.3 97.5 13.0
Society and culture 87.6 94.7 108.4 118.0 141.5 20.0
Creative arts 15.7 14.0 14.8 15.8 17.3 9.6 Food, hospitality and personal services 55.9 50.1 52.2 52.5 53.5 2.0
Mixed field programmes 73.6 72.7 82.9 91.0 85.2 -6.5
No field of education 1 40.6 27.5 25.5 26.3 43.2 64.2
Total 689.2 648.1 693.6 726.4 807.0 11.1 1. Skill sets are not assigned a field of education. Refer to the explanatory notes on pages 20–22 for notes relevant to this table.
14 Australian vocational education and training statistics
Table 14 Government-funded qualification enrolments by level of education and state/territory, January to March 2021 (’000)
Qualification enrolments NSW Vic. Qld SA WA Tas. NT ACT Aust.
Level of education
Graduate diploma - - - - - 0.0 - - 0.0
Graduate certificate - 0.1 - - - - - - 0.1 Bachelor degree (honours and pass) - - - - - - - - -
Advanced diploma 1.4 5.1 0.3 0.6 0.6 0.0 0.0 0.1 8.1
Diploma 27.1 40.0 16.3 4.5 7.3 1.2 0.5 1.8 98.6
Certificate IV 61.0 49.3 14.5 6.5 10.7 2.7 0.9 2.1 147.6
Certificate III 135.1 75.2 76.4 20.1 27.6 8.2 3.0 4.1 349.8
Certificate II 25.8 14.5 31.5 4.9 10.0 1.2 1.0 0.2 89.0
Certificate I 9.8 7.7 6.6 1.9 2.2 0.4 0.4 - 28.9
Total 260.2 191.9 145.5 38.5 58.3 13.7 5.7 8.3 722.0 A dash (-) represents a true zero figure, with no data reported in this category. This table consists of training package qualifications and accredited qualifications with at least one nationally recognised subject, delivered by a registered training organisation. Refer to the explanatory notes on pages 20–22 for notes relevant to this table.
Table 15 Government-funded qualification enrolments by level of education, January to March 2017 to 2021 (’000)
Qualification enrolments Jan- Mar
2017 Jan- Mar
2018 Jan- Mar
2019 Jan- Mar
2020 Jan- Mar
2021
Jan- Mar 2020 to Jan-
Mar 2021 % change
Level of education
Graduate diploma 0.1 0.0 0.0 0.0 0.0 **
Graduate certificate 0.0 0.0 0.1 0.1 0.1 ** Bachelor degree (honours and pass) - - - - - -
Advanced diploma 9.1 7.7 8.5 7.8 8.1 4.8
Diploma 91.5 81.4 83.9 85.4 98.6 15.5
Certificate IV 107.0 105.5 120.7 121.6 147.6 21.4
Certificate III 296.2 293.3 308.0 319.7 349.8 9.4
Certificate II 80.8 72.8 79.3 87.7 89.0 1.4
Certificate I 31.1 28.8 31.5 33.0 28.9 -12.3
Total 615.7 589.5 632.0 655.2 722.0 10.2 A dash (-) represents a true zero figure, with no data reported in this category. ** Percentage change not calculated due to small base numbers. This table consists of training package qualifications and accredited qualifications with at least one nationally recognised subject, delivered by a registered training organisation. Refer to the explanatory notes on pages 20–22 for notes relevant to this table.

Government-funded students and courses – January to March 2021 15
Table 16 Government-funded subject enrolments by type of training and state/territory, January to March 2021 (’000)
Subject enrolments NSW Vic. Qld. SA WA Tas. NT ACT Aust.
Nationally recognised programs1 2 117.6 1 274.5 1 017.2 175.0 345.0 73.1 30.4 37.0 5 069.9
Training package qualifications 1 951.5 1 160.6 991.7 162.4 286.2 70.2 29.4 36.2 4 688.3
Accredited qualifications 137.0 97.9 16.9 10.1 36.9 1.9 0.6 0.4 301.7
Training package skill sets 9.2 2.0 6.3 0.6 2.2 0.8 0.4 0.4 22.0
Accredited courses 19.9 14.0 2.3 1.9 19.6 0.2 0.1 - 58.0 Locally developed programs 51.6 9.2 5.4 1.3 10.8 0.3 - 0.2 78.8 Locally developed skill sets 50.7 0.0 5.4 1.3 10.5 0.3 - 0.2 68.5
Locally developed courses 0.8 9.2 - - 0.3 - - - 10.3
Stand-alone nationally recognised subjects 7.7 8.8 1.1 1.6 0.1 4.0 2.9 0.0 26.2
Nationally recognised training total 2 176.9 1 292.5 1 023.7 177.9 355.9 77.4 33.3 37.3 5 174.9
Non-nationally recognised training total2 28.4 23.0 1.3 1.0 11.4 0.6 1.7 0.0 67.4
Programs 26.2 14.4 1.3 0.0 11.4 0.6 1.7 0.0 55.6 Higher education qualifications - 0.6 - - - - - - 0.6
Stand-alone non-nationally recognised subjects 2.2 8.0 0.0 0.9 - - 0.0 - 11.2
Total 2 205.3 1 315.5 1 025.0 178.8 367.3 78.0 35.1 37.3 5 242.4
A dash (-) represents a true zero figure, with no data reported in this category. Refer to the explanatory notes on pages 20–22 for notes relevant to this table. 1. Nationally recognised programs are comprised of programs with at least one nationally recognised subject, delivered by a registered training organisation. 2. Non-nationally recognised training is either programs comprised entirely of non-nationally recognised subjects or non-nationally recognised stand-alone subjects, or subjects submitted by non-registered providers.

16 Australian vocational education and training statistics
Table 17 Government-funded subject enrolments by type of training, January to March 2017 to 2021 (’000)
Subject enrolments Jan-Mar
2017 Jan-Mar
2018 Jan-Mar
2019 Jan- Mar
2020 Jan- Mar
2021
Jan- Mar 2020 to Jan-
Mar 2021 change (%)
Nationally recognised programs1 4 654.7 4 349.2 4 461.2 4 415.3 5 069.9 14.8
Training package qualifications 4 287.1 3 966.8 4 113.3 4 045.0 4 688.3 15.9
Accredited qualifications 303.8 315.1 291.6 300.3 301.7 0.4
Training package skill sets 14.7 7.4 9.9 10.6 22.0 107.1
Accredited courses 49.2 59.8 46.4 59.4 58.0 -2.4
Locally developed programs 123.2 74.2 71.9 72.1 78.8 9.3
Locally developed skill sets 104.8 72.8 60.8 59.3 68.5 15.5
Locally developed courses 18.4 1.4 11.1 12.8 10.3 -19.3 Stand-alone nationally recognised subjects 39.4 45.1 53.5 26.6 26.2 -1.4
Nationally recognised training total 4 817.3 4 468.5 4 586.6 4 514.0 5 174.9 14.6
Non-nationally recognised training total2 71.2 64.6 88.4 89.1 67.4 -24.3
Programs 56.5 51.4 72.0 75.3 55.6 -26.1
Higher education qualifications 1.0 - - - 0.6 - Stand-alone non-nationally recognised subjects 13.7 13.2 16.3 13.8 11.2 -19.0
Total subject enrolments 4 888.5 4 533.1 4 674.9 4 603.0 5 242.4 13.9
Refer to the explanatory notes on pages 20–22 for notes relevant to this table. 1. Nationally recognised programs are comprised of programs with at least one nationally recognised subject, delivered by a registered training organisation. 2. Non-nationally recognised training is either programs comprised entirely of non-nationally recognised subjects or non-nationally recognised stand-alone subjects, or subjects submitted by non-registered providers.

Government-funded students and courses – January to March 2021 17
Terms The information included in this publication is, unless stated otherwise, derived from the National VET Provider Collection. This collection is governed by the Australian Vocational Education and Training Management Information Statistical Standard VET Provider Collection specifications: release 8.0 (AVETMISS Release 8.0).
For other terms and definitions, refer to the resource at <https://www.ncver.edu.au/research-and-statistics/collections/students-and-courses-collection/government-funded-students-and-courses> under More information.
Accredited courses refer to nationally recognised courses accredited by VET regulators. They are courses that result in a statement of attainment outcome. The title of such courses commences with the words ‘Course in’.
Accredited qualifications refer to nationally recognised courses that lead to a qualification outcome not specified in a national training package.
Age of the student as at 30 June of the collection year. It is generally reported in age ranges.
Apprentice/trainee status identifies whether a student is undertaking some training under an apprenticeship/traineeship training contract.
Commonwealth and state funding is expenditure by Commonwealth or state/territory governments for the delivery of vocational education and training.
Community education providers are not-for-profit, community-based organisations with a primary focus on adult education. Community-based adult education delivers courses relating to leisure, personal and community development, employment skills, preparation for VET and nationally recognised programs of study.
Credit transfer refers to status or credit obtained on the basis of prior agreements between institutions or organisations in relation to the credit value of a specific course/subject.
Delivery mode identifies whether or not a subject comprises internal, external or workplace-based delivery – or a combination of these modes.
Disability refers to whether the student self-identifies as having a disability, impairment or long-term condition.
Enrolment (program/subject) is the registration of a student for the purpose of undertaking a program or subject.
Field of education describes the broad area of study related to a program or subject in which a student is enrolled.
Gender refers to whether the student identifies as male, female or other. Other gender includes individuals who may have mixed or non-binary sexual characteristics; identify as gender diverse; or identify as neither male nor female.
Government-funded VET relates to Commonwealth and state/territory funded activity delivered by TAFE institutes and other government providers, community education providers and other providers.
Higher education qualifications are accredited by higher education institutions with self-accrediting authority or state or territory accreditation authorities.
Indigenous status indicates whether a student self-identifies as being of Aboriginal or Torres Strait Islander descent.
Labour force status describes a student’s employment status.
Locally developed programs include non-nationally recognised courses and skill sets to meet an identified training need.

18 Australian vocational education and training statistics
Nationally recognised programs include training package qualifications, accredited qualifications, training package skill sets and accredited courses that are listed on the National Training Register (training.gov.au).
Nationally recognised subjects include accredited units of competency or modules that are listed on the National Training Register (training.gov.au).
Nationally recognised training leads to vocational qualifications and credentials that are recognised across Australia, that are delivered by registered training organisations (RTOs). Nationally recognised training is listed on the National Training Register (training.gov.au).
Non-nationally recognised training includes locally developed courses, higher level qualifications and locally developed skill sets. Non-nationally recognised training is not listed on the National Training Register (training.gov.au).
Other government providers are government-owned and managed education facilities/organisations, other than TAFE institutes, that deliver VET (for example, agricultural colleges).
Other training providers refer to secondary schools, non-government enterprises, education/training businesses or centres, professional associations, industry associations, equipment/product manufacturers and suppliers, and other training providers not elsewhere classified.
Private training providers refer to privately-owned and operated training providers that are registered by the Australian Skills Quality Authority, or a state/territory accrediting body.
Programs refer to structured study where associated subjects are grouped together as qualifications, courses or skill sets.
Provider reporting type refers to the type of institution or organisation providing the training.
Qualifications in the VET sector refer to the Australian Qualifications Framework (AQF) levels of education from certificate I through to graduate diploma.
Registered training organisations (RTOs) are training providers registered by the Australian Skills Quality Authority (ASQA) or a state or territory registering and accrediting body, to deliver training and/or conduct assessment and issue nationally recognised qualifications in accordance with the Australian Quality Training Framework or the VET Quality Framework.
School status indicates whether a student is still at school or not.
SEIFA Index of Relative Disadvantage (IRSD) is a general socio-economic index that summarises information about the economic and social resources of people and households within an area. This index focuses on disadvantage. A high score (or quintile) reflects a relative lack of disadvantage rather than relative advantage.
Skill sets are groupings of units of competency which are combined to provide a clearly defined statement of the skills and knowledge required by an individual to meet industry needs or a licensing or regulatory requirement. They may be either a nationally recognised skill set, which are endorsed in a national training package, or a locally developed skill set.
Stand-alone nationally recognised subjects are enrolments in nationally recognised subjects that are not delivered as part of a nationally recognised program.
State or territory is the state or territory that administered the funding of the training activity.
Students are individuals who were enrolled in a stand-alone subject and/or program.
Student remoteness region (ARIA+) is the degree of remoteness of a location in terms of the ease or difficulty people face in accessing services in non-metropolitan Australia.
TAFE (technical and further education) institutes are created by an Act of parliament and have responsibilities specified in that and other legislation and via ministerial directions. These institutes are public bodies in receipt of government funding and provide a range of technical and VET courses and other programs (for example, entry and bridging courses, language and literacy courses, adult basic education courses, senior secondary certificate of education courses, personal enrichment courses, and small business courses).

Government-funded students and courses – January to March 2021 19
Training packages are developed by Service Skills Organisations (formerly by Industry Skills Councils) to meet the training needs of an industry, or a group of industries. Each training package is made up of three components; units of competency, qualifications framework and assessment guidelines. For further information refer to <http://www.training.gov.au>.
Training package qualifications are nationally endorsed qualifications specified in a national training package.
Training package skill sets are nationally recognised skill sets, specified in a national training package, based on groupings of units of competency which are combined to provide a clearly defined statement of the skills and knowledge required by an individual to meet industry needs or a licensing or regulatory requirement.
Unique student identifier (USI) uniquely identifies an individual who accesses vocational education and training over his or her lifetime.
Vocational education and training (VET) refer to post-compulsory education and training that provides people with occupational or work-related knowledge and skills.

20 Australian vocational education and training statistics
Explanatory notes
Scope 1 The data are sourced from the administrative records held by the state training authorities and other
relevant bodies. The tables provide information on the government-funded VET delivered by: • TAFE institutes and other government VET providers • community education providers • private training providers • other training providers.
This publication does not cover the following types of training activity: • fee-for-service training activity • delivery undertaken at overseas campuses of Australian VET institutions • credit transfer • superseded training (reported with national outcome identifier '61 - superseded training'). • VET delivered in schools, where the training activity was undertaken as part of a senior
secondary certificate • any activity where revenue was earned from another training provider in terms of
subcontracting, auspicing, partnership or similar arrangements.
Student counts 2 NCVER applies a methodology to distinctly count students who may be enrolled at multiple training
providers. For further information, refer to the fact sheet Student counts in 'total VET activity' located at <https://www.ncver.edu.au/research-and-statistics/collections/students-and-courses-collection/total-vet-activity-tva-fact-sheets> or the technical paper Counting students in Total VET students and courses located at <https://www.ncver.edu.au/__data/assets/pdf_file/0028/796213/Technical-paper-Counting-students-in-Total-VET-students-and-courses.pdf>.
Reporting derivations 3 Students undertaking nationally recognised training have undertaken at least one nationally
recognised subject delivered by a registered training organisation. Because students may enrol in multiple programs and/or subjects in a calendar year, the sum of students will not add to the total (748 500 students for January to March 2021).
4 Government-funded students and courses reports training activity according to the state/territory that administered the funding of that training. NCVER apply a number of derivations to the data submitted by state training authorities so that the data are reported from a state/territory perspective.
One of the other major derivations is provider reporting type, which determines how training organisations are reported in the various Government-funded students and courses resources. A matrix was developed by NCVER — in consultation with the state training authorities in each jurisdiction — which determines how different types of training providers are reported in each state/territory. The provider reporting type derived field is based on the combination of the submitter identifier and training organisation type identifier. For example, training delivered by a TAFE institute in its own jurisdiction is reported as being delivered by a TAFE institute. However, if the TAFE institute successfully contests funding contracts in other jurisdictions, then any training delivery is reported as being delivered by ‘other training provider’ in that jurisdiction.
Government-funded students and courses – January to March 2021 21
In New South Wales, there are separate data submissions for adult and community education (ACE) training. Training submitted through these submitters are all reported as being delivered by community education providers, irrespective of the actual training organisation type identifier of the training providers. A consequence of this approach is that in these two states, a training provider that submits ACE and other activity may be reported as having two different training provider types.
Data quality and comparability issues
New South Wales 5 The increase in training activity for New South Wales in 2020 is due the introduction of fee-free
online short courses by TAFE NSW to people wanting to upskill during the COVID-19 pandemic. The majority of these fee-free short courses are locally developed skill sets.
6 NSW Private Providers reported locally developed skill sets for the first time in their January to March 2020 data submission. This training activity was previously reported as subject only enrolments.
7 NSW Workplace Training and the NSW Education Standards Authority (NESA) do not submit data for the January to March, January to June or January to September submissions. However, they do submit data for January to December. Consequently, caution should be used when comparing data from the first three quarters with annual data.
Western Australia 8 The increase in training activity for Western Australia in 2020 and 2021 is due to the introduction, by
the Department of Training and Workforce Development, of a wide range of initiatives during the COVID-19 pandemic to encourage people to enrol fee-free or at much reduced rates in targeted areas of training both at the qualification and skill set level.
Australian Bureau of Statistics data 9 Socio-Economic Indexes for Areas (SEIFA) is an ABS-developed product that ranks areas in Australia
according to relative socio-economic advantage and disadvantage. This publication uses the Index of Relative Socio-Economic Disadvantage (IRSD). Further information on SEIFA can be found at <http://www.abs.gov.au/websitedbs/censushome.nsf/home/seifa>.
10 Student remoteness is based on the Access/Remoteness Index of Australia (ARIA+), produced by the Hugo Centre for Population and Housing, the standard ABS-endorsed measure of remoteness. For more details of ARIA+ refer to <https://www.adelaide.edu.au/hugo-centre/news/list/2018/11/21/accessibilityremoteness-index-of-australia-plus-aria-2016>.
Training packages 11 The coverage of training packages is constantly changing as new training packages are developed and
existing training packages are reviewed, to meet emerging requirements across industries.
Training providers 12 There have been reductions in the number of TAFE institutes reported in New South Wales, Western
Australia and Queensland in recent years due to the implementation of reform measures in those jurisdictions. For example, from 1 January 2019 the number of TAFEs reported in New South Wales declined from 11 to one as part of the One TAFE consolidation program.
13 Training providers submit data via state training authorities as part of their funding agreement. Consequently, some training providers may be reported in more than one state/territory. In New South Wales and South Australia (up to 2016), some training providers may be reported both as a ‘Community education provider’ and ‘Other provider’. However, they are only reported once in the total.
14 The total is a distinct count of training providers that submitted data through the state training authorities. Some training providers deliver VET in more than one state/territory. Therefore, they are counted in each state/territory’s figures, but only counted once in the total.

22 Australian vocational education and training statistics
Field of education 15 Government-funded students undertaking Skill sets — training package and locally developed and
Subject only — stand-alone nationally recognised subject enrolments are not reported with a program field of education.
‘Not known’ information 16 Caution should be taken when using data with a large number of 'not known' responses. Data are
reported as ‘Not known’ for the following reasons: • information was not collected • a student has not responded to a question on the enrolment form • invalid information was supplied • where duplicate student records have conflicting demographic information; for example, where
the same student is reported as both Indigenous and non-Indigenous.
The extent of ‘Not known’ data nationally for selected variables is illustrated in the table below.
Students with ‘not known’ data, January to March 2017 to 2021 (%)
Jan- Mar 2017
Jan- Mar 2018
Jan- Mar 2019
Jan- Mar 2020
Jan- Mar 2021
Indigenous status 2.9 2.7 3.5 3.7 3.3 Disability status 6.5 6.7 5.9 4.5 4.4 Main language spoken at home 6.3 5.9 4.7 4.1 4.6 Labour force status 7.3 9.5 10.8 9.0 9.3 School status 2.6 2.8 30.0 1.8 1.9
In the January to March 2019 data, TAFE NSW reported a high proportion of students with a Students with a School status of ‘Not known’. Caution should be taken when using data with a large number of ‘Not known’ responses.
Credit transfer
17 Credit transfer is not reported in this publication (as the training effort occurred in previous years). Data on credit transfer by state/territory for 2017—2021 are presented in the table below.
Government-funded subject enrolments by credit transfer and state/territory January-March 2017 to 2021 (‘000)
Credit transfer subject Enrolments
Jan- Mar 2017
Jan- Mar 2018
Jan- Mar 2019
Jan- Mar 2020
Jan- Mar 2021
New South Wales 93.0 88.6 100.1 89.0 92.5 Victoria 95.8 73.2 80.4 70.3 54.8 Queensland 63.0 67.7 88.1 80.7 85.7 South Australia 21.4 15.5 14.5 17.1 21.3 Western Australia 14.3 17.9 31.4 35.7 36.6 Tasmania 8.4 8.7 7.2 6.8 6.7 Northern Territory 5.3 4.4 4.7 4.2 4.1 Australian Capital Territory 3.6 2.9 6.4 4.3 4.1 Australia 304.8 279.0 332.9 308.0 305.7
Miscellaneous 18 In tables containing student remoteness, ‘offshore’ refers to the overseas postal addresses of
students studying in Australia.