government expenditure and revenue wales 2019...government expenditure and revenue wales (gerw)...
TRANSCRIPT

Government Expenditure and
Revenue Wales 2019
GUTO IFAN, CIAN SIÔN & ED GARETH POOLE
GER
W

Government Expenditure and Revenue Wales
(GERW) presents a comprehensive analysis of
Wales’ public sector spending, revenues and
the nation’s overall fiscal balance.
Wales Governance Centre Director
Professor Richard Wyn Jones
Wales Fiscal Analysis Academic Lead
Dr Ed Gareth Poole
Honorary Senior Research Fellow – Wales Fiscal Analysis
Michael Trickey

Wales Fiscal Analysis | Government Expenditure and Revenue Wales 2019 3
Preface
Declaration of funding
Wales Fiscal Analysis is hosted by the Wales Governance Centre and the School of Law and Politics at
Cardiff University, and funded through a partnership between Cardiff University, the Welsh Government,
the Welsh Local Government Association and Solace Wales. The programme continues the work of
Wales Public Services 2025 hosted by Cardiff Business School, up to August 2018.
About us
Wales Fiscal Analysis (WFA) is a new research body within Cardiff University’s Wales Governance Centre
that undertakes authoritative and independent research into the public finances, taxation and public
expenditures of Wales.
The WFA programme adds public value by commenting on the implications of fiscal events such as UK
and Welsh budgets, monitoring and reporting on government expenditure and tax revenues in Wales,
and publishing academic research and policy papers that investigate matters of importance to Welsh
public finance, including the impact of Brexit on the Welsh budget and local services, options for tax
policy, and the economics and future sustainability of health and social care services in Wales.
Working with partners in Scotland, Northern Ireland, the UK and other European countries, we also
contribute to the wider UK and international debate on the fiscal dimension of devolution and
decentralisation of government.
Contact details
Guto Ifan [email protected] // 029 2087 4626 Cian Siôn [email protected] Dr Ed Gareth Poole [email protected] // 029 2087 5574
Wales Fiscal Analysis Cardiff University
Law Building Museum Avenue Cardiff CF10 3AX
4 Wales Fiscal Analysis | Government Expenditure and Revenue Wales 2019
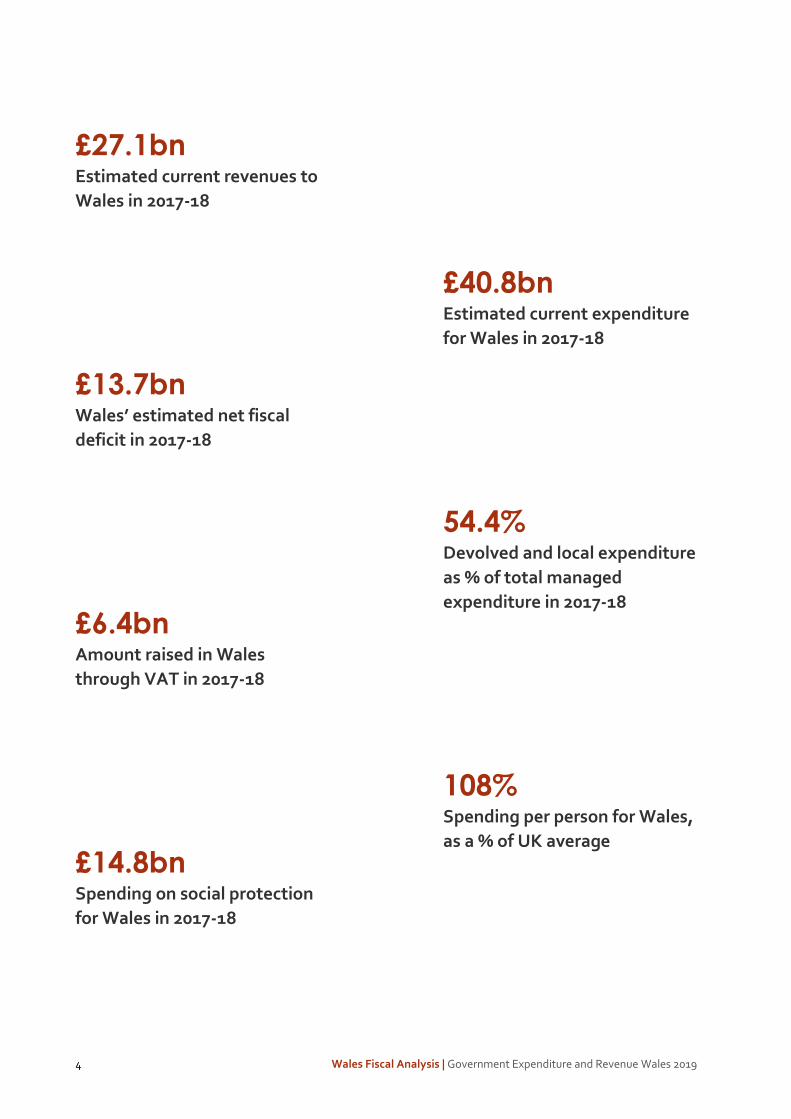
£27.1bn Estimated current revenues to
Wales in 2017-18
£13.7bn
Wales’ estimated net fiscal
deficit in 2017-18
£6.4bn Amount raised in Wales
through VAT in 2017-18
£14.8bn Spending on social protection
for Wales in 2017-18
£40.8bn Estimated current expenditure
for Wales in 2017-18
54.4%
Devolved and local expenditure
as % of total managed
expenditure in 2017-18
108% Spending per person for Wales,
as a % of UK average

Wales Fiscal Analysis | Government Expenditure and Revenue Wales 2019 5
Contents
Executive Summary ................................................................................................................. 6
1. Introduction ........................................................................................................................ 10
2. Estimated fiscal balances for Wales ................................................................................. 15
2.1 Wales’ estimated fiscal balances .................................................................................................. 16
2.2 National and regional fiscal balances across the UK ..................................................................... 21
3. Public sector revenue ........................................................................................................ 23
3.1 Composition and trends in public sector revenues for Wales ........................................................ 24
3.2 Devolved revenue streams ........................................................................................................... 32
3.3 International and regional comparisons ....................................................................................... 33
4. Public sector expenditure ................................................................................................. 40
4.1 Composition and trends in public sector expenditure for Wales ................................................... 41
4.2 Devolved and reserved expenditure ............................................................................................. 54
4.3 International and regional comparisons ....................................................................................... 59
5. Outlook for revenues and expenditure ............................................................................ 64
5.1 Outlook for revenues to Wales, 2018-19 to 2023-24 ..................................................................... 65
5.2 Outlook for expenditure for Wales, 2018-19 to 2023-24 ............................................................... 68
5.3 Projected net fiscal balance, up to 2023-24 .................................................................................. 72
5.4 Factors influencing the outlook for revenues and expenditure ..................................................... 73
Annexes .................................................................................................................................. 77
A. Methodology ................................................................................................................................. 77
B. Glossary ......................................................................................................................................... 84

6 Wales Fiscal Analysis | Government Expenditure and Revenue Wales 2019
Executive Summary
Wales’ revenue and expenditure
Figure E1 provides headline estimates of total public sector revenue in Wales as well as total public sector expenditure for Wales, from 2013-14 to 2017-18.
Figure E1 Wales’ revenue and expenditure, 2013-14 to 2017-18 (current prices)
2013-14 2014-15 2015-16 2016-17 2017-18
Current Revenue
Total (£ million) 23,175 24,074 24,741 26,099 27,081
Per person (£ per head) 1,457 1,517 1,486 1,553 1,575
Per person (UK = 100) 75.9 76.2 76.0 75.7 76.0
As a share of UK total (%) 3.7% 3.7% 3.6% 3.6% 3.6%
As a share of estimated GDP (%) 37.6% 38.1% 37.8% 38.3% 38.3%
Total Expenditure
Total (£ million) 37,663 38,323 38,710 39,464 40,776
Per person (£ per head) 13,002 13,025 13,015 12,916 13,030
Per person (UK = 100) 106.9 106.8 107.6 107.9 108.4
As a share of UK total (%) 5.1% 5.1% 5.1% 5.1% 5.1%
As a share of estimated GDP (%) 61.1% 60.6% 59.1% 57.8% 57.7%
Source: ONS (2019) Country and Regional Public Sector Finances; ONS (2018) Regional Gross Value Added; and authors’ calculations
Total current public sector revenue in Wales is estimated at £27.1 billion in 2017-18, around 3.6% of total UK revenues of £751.8 billion. Revenues per head in Wales were around £8,650, significantly less than the average UK figure of approximately £11,350. Revenues as a share of estimated GDP were 38.3%,
About GERW
Government Expenditure and Revenue Wales 2019 presents a comprehensive multi-year analysis of
Wales’ public sector spending, public sector revenues and the nation’s overall net fiscal balance. The
findings reflect Wales’ current fiscal position according to the accounting conventions of the UK
government. Using data sourced from the Country and Regional Public Sector Finances datasets
published by the ONS, it is designed to enhance public understanding of Wales’ fiscal position and
contribute to the continuing debate over Wales’ fiscal and economic future.

Wales Fiscal Analysis | Government Expenditure and Revenue Wales 2019 7
compared with 36.4% across the UK, reflecting Wales’ relatively low estimated GDP levels. Total per capita revenues in Wales have trailed all other UK countries and English regions every year since 1999-00.
VAT was the largest source of public revenue in 2017-18 (raising £6.4 billion in Wales), followed by Income Tax (£4.9 billion) and National Insurance contributions (£4.5 billion). The composition of revenues in Wales markedly differs from the UK as a whole. Large direct taxes (e.g. Income Tax and Corporation Tax) comprise a smaller share of Welsh revenue, whilst a greater share is raised through indirect taxes (e.g. VAT and excise duty).
Total Managed Expenditure for Wales is estimated at £40.8 billion in 2017-18, around 5.1% of total UK expenditure of £794.9 billion. Non-identifiable expenditure and expenditure outside the UK attributed to Wales accounted for £5.2 billion of this total (mainly defence and debt interest payments).
Social protection (which includes all benefits, social care spending and the state pension) is by far the largest expenditure area for Wales, accounting for £14.8 billion, followed by health spending (£7.3 billion) and education (£4.3 billion).
Total spending for Wales increased by 8.3% in nominal terms between 2013-14 and 2017-18, most notably on health, which increased by nearly £1.1 billion over these years. However, total spending remains below its 2011-12 level both in real terms and on a per person basis.
Total spending per person for Wales was 108% of the UK average in 2017-18, or 111% of the level in England alone. This is significantly lower than the estimated relative funding per person received through the block grant (120% of the English level). An attempt to reconcile these figures suggests that on a per person basis, non-social protection spending by the UK government is significantly lower for Wales compared with England. Capital spending per person for Wales was 4.8% lower than the UK average in 2017-18. In particular, capital spending on transport and science and technology was markedly lower.
In the international context, general government expenditure for Wales is broadly in line with the average among OECD countries, similar to Ireland and Italy. However, when expressed as a share of GDP, expenditure for Wales is significantly higher. Total revenue per head in Wales is lower than the OECD average but is comparable with Hungary and South Korea. The tax-to-GDP ratio is broadly in line with the OECD average but significantly lower than the Euro-area average.
Estimated fiscal balances for Wales
Figure E2 provides estimates of key fiscal aggregates for assessing the strength of public finances in Wales in recent years. The balance between Welsh revenues and expenditure – or Wales’ net fiscal balance – is influenced by a range of economic factors, including the various policy decisions of the UK and Welsh governments as well as the relative performance of the Welsh economy over time.
In 2017-18, Wales’ net fiscal balance was £13.7 billion, equating to 19.4% of estimated GDP. This deficit has reduced from a peak of £15.9 billion in 2009-10 (equal to 30% of GDP).
The current budget balance measures the difference between current revenues and current expenditure (excluding net investment of £1.7 billion). This current budget balance for Wales is estimated at £12.0 billion in 2017-18, down from the £14.0 billion deficit recorded in 2011-12. The recent improvement in Wales’ fiscal aggregates is attributable to a reduction in total managed expenditure as a share of GDP rather than increases in revenue.

8 Wales Fiscal Analysis | Government Expenditure and Revenue Wales 2019
Figure E2 Current Budget and Net Fiscal Balance: Wales and UK, 2013-14 to 2017-18 (current prices)
2013-14 2014-15 2015-16 2016-17 2017-18
Wales
Current Budget Balance
£ million -13,152 -12,696 -12,464 -11,883 -12,031
% of estimated GDP -21.3% -20.1% -19.0% -17.4% -17.0%
Net Fiscal Balance
£ million -14,488 -14,249 -13,969 -13,365 -13,695
% of estimated GDP -23.5% -22.5% -21.3% -19.6% -19.4%
UK
Current Budget Balance
% of GDP -3.8% -2.9% -2.0% -0.3% 0.0%
Net Fiscal Balance
% of GDP -5.5% -4.8% -3.8% -2.3% -2.0%
Source: ONS (2019) Country and Regional Public Sector Finances; ONS (2018) Regional Gross Value Added; and authors’ calculations
All four UK countries had a negative net fiscal balance in 2017-18, while only three regions of England (London, the South East and East of England) had an estimated positive net fiscal balance. Nevertheless, on a per person basis, Wales’ net fiscal deficit amounts to £4,370 per person, significantly greater than the UK average of £632.
The main driver of Wales’ worse fiscal position is lower revenue, particularly from the major direct taxes. Revenue per person raised through Income Tax and National Insurance Contributions was £1,690 lower in Wales in 2017-18 compared to the UK as a whole. Had revenue per person from these taxes in Wales matched the UK average, it would have yielded around £5.3 billion in additional revenue.
The outlook for Wales’ finances up to 2023-24
Total revenues in Wales are projected to grow by an average of 3.5% a year in nominal terms between 2018-19 and 2023-24. This is slower than the average growth rate of 3.8% over the previous five-year period. Council Tax revenues are expected to grow strongly over the forecast period, increasing by 39.6% between 2017-18 and 2023-24.
On a per person, real terms basis, total expenditure is set to recover its 2011-12 level by 2023-24. After significant reductions in the size of Wales’ net fiscal deficit since 2009-10, it is now projected to reduce only slightly relative to estimated GDP, from 19.4% in 2017-18 to 18.3% in 2023-24, as shown in Figure E3.
Of course, given considerable economic and political uncertainties, not least the continued uncertainty surrounding the terms of the UK’s departure from the European Union, trends in total revenues and expenditure could substantially deviate from the projections contained in this report.

Wales Fiscal Analysis | Government Expenditure and Revenue Wales 2019 9
Figure E3 Net fiscal balance of Wales and UK as a share of GDP, 1999-00 to 2017-18, and projections to 2023-24
Source: Authors’ calculations
£5.2bn
£10.9bn
£15.9bn
£13.7bn £15.6bn
-35.0%
-30.0%
-25.0%
-20.0%
-15.0%
-10.0%
-5.0%
0.0%
5.0%
Ne
t fisc
al b
ala
nc
e a
s %
of
GD
P
Wales UK

10 Wales Fiscal Analysis | Government Expenditure and Revenue Wales 2019
Introduction
Government Expenditure and Revenue Wales 2019
Government Expenditure and Revenue Wales (GERW) 2019 is a second edition report presenting a
comprehensive multi-year analysis of Wales’ public sector spending, revenues and the nation’s overall
net fiscal balance. It follows a similar format to the first edition of Government Expenditure and Revenue
Wales published in 2016, with updated data and analysis. This publication is designed to enhance public
understanding of Wales’ fiscal position and contribute to the continuing debate over Wales’ fiscal and
economic future.
In contrast to the annual fiscal balance reports published and disseminated in the two other devolved
countries of the UK (Government Expenditure and Revenue Scotland, or GERS, and the Northern Ireland
Net Fiscal Balance Report), there has historically been only a small amount of disaggregated public
spending, taxation and other economic data pertaining to Wales.
In 2016, the Wales Governance Centre published an inaugural report, Government Expenditure and
Revenue Wales 2016, analysing levels of public sector revenues, expenditure and Wales’ fiscal gap,
following the framework established by the GERS publication for Scotland.1
More recently, the Office for National Statistics (ONS) has started publishing public sector revenues and
expenditure estimates for the four UK nations and nine regions of England in their Country and Regional
Public Sector Finances release, which uses a similar approach and are deemed as Experimental Statistics
(or statistics that are within their development phase). This is the source for most of the data underlying
the analysis presented in this report. By basing the analysis on ONS data, it allows for a consistent
comparison to be made between Wales’ fiscal balance and that of other UK nations and English regions.
We also supplement ONS data with more detailed analysis using HM Treasury data on public
expenditure, OECD data for international comparisons, and Office for Budget Responsibility (OBR)
forecasts to project revenues and spending for Wales over the coming years.
Aims and objectives
This report aims to present a comprehensive overview of public sector finances for Wales, including an estimate of Wales’ net fiscal balance over time. We aim to provide key information on Welsh public finances to interested parties in order to promote wider debate and understanding of public finances in Wales.
Public finance in Wales has undergone significant changes in recent years, with substantial devolution of own-sourced taxes to the Welsh Government and National Assembly. In 2019-20, around £5 billion worth of taxes are under the control of the Welsh Government and local authorities in Wales. These developments mark a significant shift from historic arrangements.
1 Poole, E.G., Ifan, G. and Wyn Jones, R. (2016) Government Expenditure and Revenue Wales 2016. Cardiff University: Wales Governance Centre.
1

Wales Fiscal Analysis | Government Expenditure and Revenue Wales 2019 11
Historically, the UK has retained a highly centralised revenue structure, with tax policy standardly applied across the UK and a high percentage of tax revenues collected and pooled centrally. Trends in expenditure for Wales have also been highly linked to UK-wide expenditure, both in terms of non-devolved expenditure for Wales (spending by Whitehall departments), and devolved expenditure by Welsh and local government. Although policy-makers in Wales have had the freedom to allocate funds according to different policy priorities, they have had limited influence on changing the overall level of devolved expenditure. Fiscal devolution will, within limits, allow for more divergence in expenditure and revenue patterns in Wales and the UK. As argued by the Silk Commission (2012) which recommended fiscal devolution to Wales, the powers are intended to bring increased financial accountability and empowerment.
Chapters 2,3 and 4 of this report contain data up to 2017-18, the latest year for which complete outturn
data is available. This is prior to the devolution of Land Transaction Tax and Landfill Disposals Tax in
2018-19 as well as the introduction of Welsh Rates of Income Tax in 2019-20. Nevertheless, Chapter 5
does present the outlook for devolved and reserved revenues and expenditure up to 2023-24.
We publish this report at a time of considerable economic, fiscal and political uncertainty. The outcome
of the Brexit process and its impact on Welsh public finances are yet unknown. Furthermore, delays in
UK government decision-making mean that there are currently no firm spending plans set for most
departments, and fiscal policy could change significantly with the new Prime Minister and Chancellor.
This report will outline what will be at stake for Wales’ public finances over coming years and address the
following questions:
• How much public sector revenue is raised in Wales? (Chapter 3)
• What is the cost of providing the full range of public services that benefits Wales? (Chapter 4)
• To what extent do the revenues raised cover the costs of these public services? (Chapter 2)
• What is the outlook for expenditure and revenue to Wales over the coming years? (Chapter 5)
Approach to accounting
There is no formally agreed set of accounting concepts and definitions for the formulation of country and regional fiscal accounts in the UK. Several key elements of data necessary for constructing such accounts are also unavailable at a disaggregated level. This report uses data published by the ONS in their Country and Regional Public Sector Finances release, which itself follows the framework established by the GERS publication for Scotland which is certified as a National Statistics document in the UK.
The accounts are estimated for Wales on the basis of the national accounting standards adopted by the UK government, namely the European System of Accounts 2010 (ESA10).
The approach taken by the ONS to both the revenue and expenditure sides of the public sector fiscal accounts follows established principles in the methodology adopted for the Scotland and Northern Ireland fiscal reports and is outlined below.

12 Wales Fiscal Analysis | Government Expenditure and Revenue Wales 2019
Revenue – the ‘who pays’ principle
Public sector revenue in Wales is estimated for taxes where a financial burden is imposed on residents and enterprises in Wales. The estimate is therefore based on an assessment according to the ‘who pays’ principle.
The vast majority of public sector revenue in the UK is collected centrally. Under current UK Treasury accounting procedures, precise revenue collection figures for each country and region of the UK are unavailable. As with existing reports elsewhere in the UK, the ONS’ estimates Welsh public sector revenue by considering each revenue stream separately. The general approach is to take UK level data and apportion revenues to Wales using available data and various methodologies.
Expenditure – the ‘who benefits’ principle
Although it is relatively straightforward to account for Welsh Government and local government expenditure in Wales, deciding how a share of public expenditures that benefit Wales as well as other parts of the UK should be allocated is fraught with difficulties. Following GERS and the Northern Ireland Net Fiscal Balance Report, the ONS estimates public sector expenditures for Wales based on an assessment of what is referred to as the ‘who benefits’ principle. Public sector expenditure is deemed to be for Wales if the benefit of the service or transfer derived from the expenditure is thought to accrue to residents of Wales.
Other methods of allocating public sector expenditure across regions of the UK are possible and would yield different estimates to those in this report. Notably, estimates of expenditures made for a region will differ from estimates of expenditure in a region – that is, apportionment of spending according to where the expenditure actually took place.
While these two different approaches yield similar results in most cases (social protection payments or health expenditure, for example), there is greater difference in allocations for public sector spending that has broader (often UK-wide) impact. For example, the ‘in’ approach would attempt to locate UK defence expenditure to where the expenditure actually takes place. Alternatively, as in this report, the ‘who benefits’ approach apportions defence expenditure across the UK, as it is deemed that all UK residents benefit from the defence service provided.
Allocating spending according to the ‘who benefits’ principle is not without its challenges. In a 1998 critique of the original Welsh Office Government Expenditure and Revenue: Wales report, Professor Phil Williams argued persuasively that the share of actual Ministry of Defence spending in Wales was significantly lower than Wales’ share of the UK population that formed the basis of the for Wales spending allocation.2 Although tracing UK expenditure to the region or nation in which the expenditure actually takes place would be of real interest, detailed and exact estimates of spending in Wales by every UK government department and agency are simply not available. Consequently, in order to provide an estimate of the full range of public services consumed for the benefit of Wales and to ensure consistency with comparable publications, this report uses ONS data which follows the for Wales methodology of apportioning public sector expenditure. Notably, this may mean that some of the expenditure allocated for the benefit of Wales and included in total expenditure in this report may have been spent outside of Wales. Such expenditure will have different effects to expenditure made inside Wales; namely, it will not lead to local economic multiplier effects and will not directly increase the tax revenues collected in Wales.
2 Williams, P. (1998) Cyfres y Cynulliad 3: The Welsh Budget. Talybont: Y Lolfa.

Wales Fiscal Analysis | Government Expenditure and Revenue Wales 2019 13
Understanding Wales’ Net Fiscal Balance and Regional Transfers in the UK
The balance between Welsh revenues and expenditure – or Wales’ net fiscal balance – is influenced by a range of economic factors, including various policy decisions made by the UK and Welsh governments and the relative performance of the Welsh economy over time. Public sector revenues and expenditure are highly related to Wales’ demographics and relative economic performance; for example, lower income and company earnings are associated with lower tax revenues, and vice versa. The net result of these various factors will determine Wales’ net fiscal balance.
Large inter-regional fiscal transfers are not unusual internationally. Economic shocks and common economic policies will impact regions in asymmetric ways and will trigger various stabilising forces. In single currency areas, the absence of exchange rate adjustments requires other mechanisms to bring about regional stabilisation.3 In economic and political unions, fiscal transfers will often meet this requirement.
In some countries, there is an explicit system of fiscal equalisation between regions. A good example of this is the system of redistribution between German Länder (states), developed in the aftermath of the Second World War.4 Fiscal equalisation between countries and regions in the UK however will be largely implicit and automatic, due to centralisation of UK public finances. The redistributive effect of transfer payments (e.g. higher levels of social protection expenditure) and the progressivity of direct taxes (e.g. income tax) means that the lower levels of economic activity in Wales are somewhat offset by transfers from elsewhere in the UK.
It is important to note that the net fiscal balance reported in Chapter 2 does not constitute a direct measure of ‘regional transfers’ from other parts of the UK. This is because the UK as a whole was also in deficit during the analysed time period, and therefore borrowing funded some of the overall UK expenditure.
The estimates presented in this report reflect Wales’ fiscal position under current constitutional arrangements, and as such, are not a reflection of the finances of an independent Wales.
Overview of this report
The remainder of the report is structured as follows:
Chapter 2: presents a summary of Wales’ public sector balances using estimates of public sector revenue to Wales and public sector expenditure for Wales. Key fiscal aggregates to assess the strength of public finances in Wales (the current budget balance and net fiscal balance) are presented and analysed. Also provided is a discussion of some of the reasons for Wales’ higher fiscal deficits compared to the rest of the UK.
Chapter 3: provides detailed estimates, analysis and discussion of public sector revenue in Wales. Detailed disaggregated estimates of individual revenue streams for the years 1999-00 to 2017-18 are presented. The chapter also includes discussion of revenues that have been fully or partially devolved to Wales and some international comparisons to put Wales’ current fiscal position in a wider context.
Chapter 4: provides an estimate of public sector expenditure for Wales. The composition of public expenditure by policy function and by current and capital spending is presented an analysed. Estimates are also presented of the expenditure by Welsh Government and local government in Wales, against expenditure by UK government departments. Also included is a discussion of EU transactions in Wales 3 See, Mundell, R. (1961) “A Theory of Optimal Currency Areas,” American Economic Review, 51 (4): 657-65. 4 Zimmerman, H. (1989) “Fiscal Equalization between States in West Germany,” Government and Policy, 7: 385-93.

14 Wales Fiscal Analysis | Government Expenditure and Revenue Wales 2019
as well as an attempt to reconcile the relative funding Wales receives through the block grant from the UK government with relative levels of total spending. Lastly, some international comparisons are presented to put Wales’ expenditure levels in a wider context.
Chapter 5: projects trends in revenues and expenditure for Wales as well as the fiscal balance up to 2023-24. It also includes a discussion of some of the factors that could impact these projections. Given substantial political and economic uncertainties, trends in total revenues and expenditure could deviate substantially from projections outlined in this chapter.
The report also includes annexes detailing the methodology for estimating Welsh GDP, generating international comparisons and projections, the components of the accounting adjustment as well as a comprehensive glossary.

Wales Fiscal Analysis | Government Expenditure and Revenue Wales 2019 15
Estimated fiscal balances for Wales
This chapter presents a summary of Wales’ estimated public sector balances, using estimates of current and capital public sector expenditure for Wales and current public sector revenues to Wales. The first section presents key fiscal aggregates and analyses how Wales’ fiscal balances have changed over time. Also included is a discussion of some of the reasons for Wales’ higher fiscal deficits compared with the UK as a whole. The second section examines how Wales’ fiscal balances compares with other countries and regions of the UK.
2
Key findings:
• Wales’ net fiscal balance in 2017-18 was a deficit of £13.7 billion, equating to 19.4% of
estimated GDP. Excluding net investment of £1.7 billion, Wales’ current budget balance
in the same year amounted to a deficit of £12.0 billion.
• The estimated net fiscal deficit for Wales peaked at £15.9 billion in 2009-10, equal to
30% of GDP, when the UK’s deficit reached almost 10% of GDP.
• Revenues raised in Wales as a share of GDP has remained constant since 1999-00, at an
average of 38.1% (higher than the UK average of 35.6%). This reflects Wales’ relatively
low GDP.
• As a share of GDP, total expenditure grew from 52% in 1999-00 to 59% at the onset of
the financial crisis in 2007-08, and then peaked at 68% in 2009-10.
• The reduction in Wales’ deficit since 2009-10 has resulted from a reduction in total
managed expenditure as a share of GDP to 58%, rather than an increase in revenue.
• Wales’ net fiscal deficit amounts to £4,370 per person, compared with the UK average
of £632. The main driver of Wales’ worse fiscal position is lower revenue, particularly
from the major direct taxes (Income Tax, National Insurance contributions and
Corporation Tax).
• All four countries of the UK had a negative net fiscal balance in 2017-18. Only three
regions of England – London, the East of England and the South East of England – had
an estimated positive net fiscal balance.

16 Wales Fiscal Analysis | Government Expenditure and Revenue Wales 2019
2.1 Wales’ estimated fiscal balances
Figure 2.1 provides estimates of the main fiscal aggregates for Wales for the financial years 2013-14 to 2017-18, as reported by the ONS in their 2019 edition of the Country and Regional Public Sector Finances release.
Current revenue is the sum of all revenue raised by the entire public sector in Wales, of which the main component is tax revenues. Public sector current expenditure refers to spending on goods and services that are ‘consumed’ in a given year, while public sector capital expenditure refers to spending that adds to fixed assets. Public sector capital expenditure less capital consumption is referred to as net investment.
The current budget balance for Wales is the difference between its current revenues and current expenditure, including depreciation. This measures the extent to which current Welsh taxpayers meet the cost of paying for the public services they consume in the current year. Capital investment by the public sector is excluded from this figure. The current budget balance is often seen as an indicator of intergenerational fairness and of the sustainability of current policies.
Wales’ net fiscal balance measures the difference between total public sector expenditure (including capital expenditure) and public sector revenue. At the UK level this gap reflects public sector borrowing (or saving). In Wales however, this gap reflects Wales’ place in the overall fiscal arrangements of the UK public sector.
Figure 2.1 Net fiscal balance and current budget balance for Wales and UK, 1999-00 to 2017-18
£ million, current prices
2013-14 2014-15 2015-16 2016-17 2017-18
Current budget
Current revenue 23,175 24,074 24,741 26,099 27,081
Current expenditure 34,404 34,828 35,192 35,903 37,008
Capital consumption 1,923 1,942 2,013 2,079 2,104
Current budget balance -13,152 -12,696 -12,464 -11,883 -12,031
As share of estimated GDP -21.3% -20.1% -19.0% -17.4% -17.0%
Capital budget
Capital expenditure 3,259 3,495 3,518 3,561 3,768
Capital consumption -1,923 -1,942 -2,013 -2,079 -2,104
Net investment 1,336 1,553 1,505 1,482 1,664
Net fiscal balance -14,488 -14,249 -13,969 -13,365 -13,695
As share of estimated GDP -23.5% -22.5% -21.3% -19.6% -19.4%
Source: ONS (2019) Country and Regional Public Sector Finances; ONS (2018) Regional Gross Value Added; and authors’ calculations

Wales Fiscal Analysis | Government Expenditure and Revenue Wales 2019 17
As presented in Figure 2.1, Wales’ current budget balance in 2017-18 amounted to a deficit of £12.0 billion. This equates to 17.0% of Wales’ estimated GDP. Net investment (capital expenditure less capital consumption) of £1.7 billion leaves an estimated net fiscal balance of £13.7 billion in 2017-18 (equating to 19.4% of GDP). Though the deficits on both balances grew in the year leading up to 2017-18, both fell as a share of estimated GDP, continuing recent trends of deficit reduction.
Figure 2.2 shows a long-run series for both of these fiscal aggregates for Wales and the UK as a share of estimated GDP (net fiscal balance in solid lines and current budget balance in broken lines), from 1999-00 to 2017-18. At the turn of the century, while the UK as a whole had a fiscal surplus, the estimated net fiscal balance for Wales was a deficit of £5.2 billion, equating to 14% of estimated GDP. The net fiscal deficits of both the UK and Wales deteriorated rapidly during the recession, reflecting higher spending and lower revenues. Wales’ net fiscal deficit peaked at approximately £15.9 billion in 2009-10, equal to approximately 30% of GDP, while the UK’s deficit reached almost 10% of GDP.
Figure 2.2 Net fiscal balance and current budget balance for Wales and UK, 1999-00 to 2017-18
Source: ONS (2019) Country and Regional Public Sector Finances; ONS (2018) Regional Gross Value Added; and authors’ calculations
The deficit on Wales’ net fiscal balance has reduced significantly since 2009-10, both in absolute terms and as a share of GDP. Figure 2.3 shows the trend in both total managed expenditure (current and capital) and current revenue as a share of GDP from 1999-00 to 2017-18. As a share of GDP, revenues to Wales has remained broadly constant across the whole of the analysed period, at an average of 38.1% (higher than the UK average of 35.6%). Total managed expenditure has varied significantly however, growing from 52% of GDP in 1999-00 to 59% at the onset of the financial crisis in 2007-08. A fall in GDP
£5.2 bn
£7.9 bn
£10.9 bn
£15.9 bn
£13.7 bn
-35%
-30%
-25%
-20%
-15%
-10%
-5%
0%
5%
% o
f e
stim
ate
d G
DP
Wales net fiscal balance UK net fiscal balance
Wales current budget balance UK current budget balance

18 Wales Fiscal Analysis | Government Expenditure and Revenue Wales 2019
and growth in spending (particularly social protection) meant spending spiked, as a share of GDP, to just under 68% in 2009-10. The reduction in Wales’ deficit since 2009-10 has been a result of a reduction in total managed expenditure as a share of GDP to 58%, rather than an increase in revenue.
Figure 2.3 Total managed expenditure for Wales and current revenues to Wales as a share of estimated GDP, 1999-00 to 2017-18
Source: ONS (2019) Country and Regional Public Sector Finances; ONS (2018) Regional Gross Value Added; and authors’ calculations
Figure 2.4 analyses the factors which have contributed to the reduction in Wales’ deficit from 2009-10 to 2017-18. As a share of GDP, spending has fallen across most areas. Spending on economic affairs peaked in 2008-09 and 2009-10, partly reflecting the effects of the UK government’s financial sector interventions apportioned to Wales (see Chapter 4), and has since declined by around 1.5% percentage points of GDP. Over the first few years of austerity from 2009-10 to 2013-14, health spending for Wales as a share of GDP fell by around 1.3% percentage points, and broadly grew in line with GDP thereafter. The largest reductions in spending as a share of GDP are attributable to education (2.2% of GDP) and social protection spending (2.1%).
The increase in VAT revenues since 2009-10 amounted to around 1.9% of GDP, reflecting the recovery of spending levels and the increase in rates. However, this was largely offset by a decrease in Income Tax revenues of around 1.7% of GDP. This means that increasing revenues have contributed very little to the overall deficit reduction since 2009-10.
0%
10%
20%
30%
40%
50%
60%
70%
80%
% o
f e
stim
ate
d G
DP
Total managed expenditure Current revenue

Wales Fiscal Analysis | Government Expenditure and Revenue Wales 2019 19
Figure 2.4 Changes in Wales’ net fiscal balance as share of estimated GDP from 2009-10 to 2017-18
Source: ONS (2019) Country and Regional Public Sector Finances
Figure 2.5 presents data on Wales’ current revenues, total managed expenditure and net fiscal balance on a per person basis. Per person revenues raised in Wales stood at £8,653 in 2017-18. This amounts to 76% of the UK average, a figure which has stayed broadly constant over recent years, though down from a peak of 80.6% in 2003-04.
Figure 2.5 Revenue, spending and net fiscal balance for Wales and UK, 2013-14 and 2017-18
2013-14 2014-15 2015-16 2016-17 2017-18
Current revenue
Per person (£) 7,513 7,781 7,974 8,375 8,653
Per person (UK=100) 75.9 76.2 76.0 75.7 76.0
Total Managed Expenditure
Per person (£) 12,209 12,387 12,477 12,664 13,030
Per person (UK=100) 106.9 106.8 107.6 107.9 108.4
Net Fiscal Balance
Wales - per person (£) -4,697 -4,606 -4,502 -4,289 -4,376
UK - per person (£) -1,521 -1,388 -1,101 -683 -632
Source: ONS (2019) Country and Regional Public Sector Finances and authors’ calculations
-35.0%
-30.0%
-25.0%
-20.0%
-15.0%
-10.0%
-5.0%
0.0%
% o
f e
stim
ate
d G
DP
Reducing deficit Increasing deficit Net fiscal balance

20 Wales Fiscal Analysis | Government Expenditure and Revenue Wales 2019
Total managed expenditure per person was estimated to be £13,030 in 2017-18, or 108.4% of the UK average. Relative spending per person for Wales has grown compared with the UK average from a low of 105.8% in 2009-10.
Because of higher levels of spending and lower estimated revenues per person, Wales’ net fiscal balance per person amounts to £4,370, compared with the UK average of £632.
Figure 2.6 disaggregates the difference in the per person net fiscal balances of Wales and the UK, while the figures in parenthesis show how much each element contributes to Wales’ overall net fiscal deficit of £13.7 billion. Most of Wales’ higher spending (red bars) is attributable to higher social protection spending per person, which is approximately £668 higher in Wales compared with the UK average. All other spending is around £346 per person higher in Wales.
Figure 2.6 Disaggregating Wales’ net fiscal balance compared with the UK average, 2017-18 (£ per person)
Source: ONS (2019) Country and Regional Public Sector Finances and authors’ calculations
However, the graph clearly shows that the main driver of Wales’ worse fiscal position is lower revenue (yellow bars). Wales considerably lags behind the UK average in revenue per person from the major direct taxes including Income Tax, National Insurance contributions and Corporation Tax. Revenue raised per person through Income tax and National Insurance contributions was £1,690 lower in Wales in 2017-18. If revenue per person from these taxes in Wales matched the UK average, it would yield £5.3 billion in additional revenue. As discussed in Chapter 3, per person revenues from other taxes in Wales are closer to the UK average.
The shortfall in large direct tax revenues and higher social protection spending per person for Wales compared with the UK average also corresponds to ONS data on regional gross disposable household income. This data shows that the primary incomes of Welsh households from wages, profits, property
(£2.0 bn)
(£2.1 bn)
(£1.1 bn)
(£5.3 bn)
(£1.3 bn)
(£1.9 bn) (£13.7 bn)
-5,000
-4,500
-4,000
-3,500
-3,000
-2,500
-2,000
-1,500
-1,000
-500
0
UK fiscal
balance
per person
Social
protection
spending
Other
spending
Income tax
and NICs
Corporation
tax
All other
revenue
Wales fiscal
balance
per person
Fiscal balance Higher spending Lower revenue

Wales Fiscal Analysis | Government Expenditure and Revenue Wales 2019 21
and mixed incomes was around 74% of the UK average per person in 2017. Gross disposable income however, after accounting for taxes and benefits, was 81% of the UK average per person. This is because current taxes on income and wealth and social contributions are around £1,700 per person lower in Wales, and transfers and benefits to households are around £460 higher.
2.2 National and regional fiscal balances across the UK
Figure 2.7 and Figure 2.8 show the net fiscal balance of the countries and regions of the UK, on a per person basis and as a share of their estimated GDP.
Figure 2.7 Net fiscal balance by region, 2017-18 (£ per person and % of estimated GDP)
Source: ONS (2019) Country and Regional Public Sector Finances; ONS (2018) Regional Accounts; and authors’ calculations
-6,000 -4,000 -2,000 - 2,000 4,000 6,000
London
South East England
East of England
United Kingdom
South West England
East Midlands
Yorshire and the Humber
West Midlands
Scotland
North West England
North East England
Wales
Northern Ireland
£ per person
-30% -20% -10% 0% 10%
London
South East England
East of England
United Kingdom
South West England
East Midlands
Yorshire and the Humber
West Midlands
Scotland
North West England
North East England
Wales
Northern Ireland
% of estimated GDP

22 Wales Fiscal Analysis | Government Expenditure and Revenue Wales 2019
In 2017-18, all four countries of the UK had a negative net fiscal balance, and only three regions of England had an estimated positive net fiscal balance. From 1999-00 onwards, only London and South East England have consistently had a positive net fiscal balance (except for 2009-10). Spending per person ranges from £10,970 (or 91% of the UK average) in the East of England and £14,195 (117% of the UK average) in Northern Ireland. There is greater variation in revenues per person between the countries and regions, ranging from 76% of the UK average in Wales to 149% in London.
Figure 2.8 Net fiscal balance by country and region, 2017-18 (% of estimated GDP)
Source: ONS (2019) Country and Regional Public Sector Finances; ONS (2018) Regional Accounts; and authors’ calculations

Wales Fiscal Analysis | Government Expenditure and Revenue Wales 2019 23
Public sector revenue
This third chapter looks at public sector revenues in Wales, beginning with an analysis of recent and historical trends. We then look at those revenues that have been fully or partially devolved to Wales before presenting some international comparisons to put the Welsh figures in context.
Current public sector revenue, as defined in the UK National Accounts, refers to the sum of all revenue raised in a particular year by the entire public sector, excluding the sale of assets and interest received. The main component of this is tax revenue. The amount of tax revenues collected in a given year will depend on the performance of the tax base (for example, on incomes, profits, value of transactions), as well as tax policy.
The majority of public sector revenue payable by Welsh residents and businesses is collected at a UK level. The Welsh Revenue Authority, the tax agency responsible for administering and collecting the newly devolved Land Transaction Tax (LTT) and Landfill Disposals Tax (LDT) in Wales, had not begun collecting taxes in 2017-18, the latest year for which complete outturn data on public sector finances is available. This means that for most revenue sources, it is not possible to identify precisely the proportion receivable from Wales. Instead, the ONS estimates these shares by using different methodologies to apportion revenues to Wales in their Country and Regional Public Sector Finances release.
3
Key findings:
• Total current public sector revenue in Wales is estimated at £27.1 billion in 2017-18, around 3.6% of total UK revenues of £751.8 billion.
• Revenues per head in Wales were around £8,650, significantly less than the average UK figure of around £11,350.
• VAT was the largest source of public sector revenue (raising £6.4 billion), followed by Income Tax (£4.9 billion) and National Insurance contributions (£4.5 billion). In the UK as a whole, Income Tax is the largest source of public sector revenue.
• Large direct taxes (e.g. Income Tax and Corporation Tax) comprise a smaller share of Welsh revenue, whilst a greater share is raised through indirect taxes (e.g. VAT and excise duties).
• On a per capita basis, Council Tax revenues to Wales have increased from £250, or 79.4% of the UK level, in 1999-00 to £475, or 97.6% of the UK level, in 2017-18.
• Total per capita revenues in Wales have trailed all other NUTS1 regions every year since 1999-00.

24 Wales Fiscal Analysis | Government Expenditure and Revenue Wales 2019
3.1 Composition and trends in public sector revenues for Wales
3.1.1 Composition of current revenues in Wales, 2017-18
Figure 3.1 overleaf presents an estimate of public sector revenue in Wales and the UK for 2017-18. Also highlighted is the estimated share of total revenue that each component represents, as well as how much of the UK total is raised in Wales.
Current public sector revenue in Wales is estimated at £27.1 billion in 2017-8. This equated to 3.6% of total UK current revenues of £751.8 billion. This share is significantly below Wales’ population share (4.7%) but is slightly greater than its share of UK GVA (3.4%).
Although Income Tax has historically been the single largest source of public revenue in Wales, more recently this has been surpassed by Value Added Tax (VAT), which at £6.4 billion, accounted for 23.6% of all current revenues in 2017-18. This figure includes VAT refunds of £0.9 billion, which are offset as expenditure in the National Accounts. In 2017-18, revenues from Income Tax in Wales amounted to £4.9 billion, accounting for 18.2% of total revenue. Income raised from National Insurance contributions amounted to £4.5 billion (16.8% of the total). Collectively, these three sources of revenue accounted for 58.6% of total current revenues for Wales.
In 2017-18, Wales raised more than its per capita share of the UK total in fuel duties (4.8%), tobacco duties (5.4%), betting and gaming duties (4.9%), climate change levy (5.9%), aggregates levy (9.7%), vehicle excise duty (5.0%) and gross operating surplus (5.0%). Excise duties on alcohol and tobacco are not income contingent and therefore revenues raised from these taxes are not directly affected by relatively lower income levels in Wales.
On the other hand, Wales raises significantly less than its per capita share in Income Tax (2.7%), Corporation Tax (2.3%), National Insurance contributions (3.5%) and Capital Gains Tax (1.8%). These taxes are paid on income and profit and so one would expect that Wales, with lower household income levels and GVA than the UK average, contributes less than its population share to the UK total.
Gross operating surplus (GOS) refers to the operating (or trading) surpluses (or losses) of central government, local government and public corporations. Since central and local government do not generate profit, their GOS will be equal to their capital consumption, or depreciation – a measure of the fixed capital resources used up in the production process. This is treated as revenue in the National Accounts system, but is also balanced by an offsetting item within the accounting adjustment included in total managed expenditure for Wales (see Chapter 4). For public corporations however (for example Cardiff International Airport and Cardiff City Transport Services Ltd in Wales), the GOS figure includes their gross trading surpluses and various income streams. Total GOS is estimated to be £2.3 billion in Wales and is the fourth largest revenue source. This represents a higher proportion of total revenue (8.4%) in Wales than the UK as a whole (6.1%).

Wales Fiscal Analysis | Government Expenditure and Revenue Wales 2019 25
Figure 3.1
Current revenue: Wales and UK, 2017-18
WALES UK
£ million % of total £ million % of total Wales
as % of UK
VAT 6,389 23.6% 142,771 19.0% 4.5%
Income Tax 4,930 18.2% 180,592 24.0% 2.7%
National Insurance contributions 4,547 16.8% 131,547 17.5% 3.5%
Gross operating surplus 2,273 8.4% 45,854 6.1% 5.0%
Council Tax 1,485 5.5% 32,137 4.3% 4.6%
Fuel duties 1,344 5.0% 27,878 3.7% 4.8%
Corporation tax (excl. North Sea) 1,306 4.8% 55,722 7.4% 2.3%
Non-domestic rates 1,031 3.8% 29,296 3.9% 3.5%
Other taxes, royalties and adjustments 892 3.3% 21,385 2.8% 4.2%
Tobacco duties 472 1.7% 8,766 1.2% 5.4%
Alcohol duties 457 1.7% 11,585 1.5% 3.9%
Interest and dividends 327 1.2% 7,062 0.9% 4.6%
Vehicle excise duty 316 1.2% 6,362 0.8% 5.0%
Insurance premium tax 253 0.9% 5,898 0.8% 4.3%
Rent and other current transfers 231 0.9% 5,369 0.7% 4.3%
Stamp duty land tax 230 0.8% 13,450 1.8% 1.7%
Capital gains tax 139 0.5% 7,794 1.0% 1.8%
Inheritance tax 119 0.4% 5,277 0.7% 2.3%
Betting and gaming duties 113 0.4% 2,316 0.3% 4.9%
Climate change levy 109 0.4% 1,860 0.2% 5.9%
Aggregates levy 36 0.1% 372 0.0% 9.7%
Other taxes on income and wealth 33 0.1% 691 0.1% 4.8%
Landfill tax 32 0.1% 893 0.1% 3.6%
Stamp duty on shares 10 0.0% 3,519 0.5% 0.3%
Air passenger duty 7 0.0% 3,360 0.4% 0.2%
Total current revenue (excluding North Sea revenue)
27,081 100.0% 751,756 100.00% 3.6%
North Sea revenue
Per capita share 61 1,297 4.7%
Geographical share 0 1,297 0.0%
Total current revenue (including North Sea revenue)
Per capita share 27,142 753,053 3.6%
Geographical share 27,081 753,053 3.6%
Source: ONS (2019) Country and Regional Public Sector Finances and authors’ calculations

26 Wales Fiscal Analysis | Government Expenditure and Revenue Wales 2019
Figure 3.2 Main revenues as % of total current (onshore) revenue: Wales and UK, 2017-18
Source: ONS (2019) Country and Regional Public Sector Finances and authors’ calculations
As shown in Figure 3.2, the composition of revenues differs between Wales and the rest of the UK. Large direct taxes, such as Income Tax, Corporation Tax and National Insurance contributions, make up a greater share of total revenues at a UK level than in Wales. For instance, while Income Tax represents 24.0% of total UK onshore revenues, it only accounts for 18.2% of revenues in Wales. This means that even if a tax policy is applied uniformly across the UK, it may have different effects on revenues in Wales compared to the rest of the UK.
On a per capita basis, public sector revenues is considerably higher across the UK than in Wales. The gap in public sector revenues per head between Wales and the UK was around £2,700 in 2017-18. However, current revenue as a share of estimated GDP was 38.7% in Wales in 2017-18, compared with 36.7% across the UK.
0% 20% 40% 60% 80% 100%
Wales
UK
Value Added Tax (VAT)
Income Tax
National Insurance contributions
Local authority revenue
Corporation tax (onshore)
All other revenue
Box 3.1: Apportioning North Sea oil and gas revenues
The ONS allocates North Sea oil and gas revenues (mainly received from the Petroleum Revenue Tax and Corporation Tax) using two distinct methodologies. The first involves allocating a population share of all revenues raised to the countries and regions of the UK. The second approach involves allocating revenues on a geographic basis according to where the oilfields that generate the revenue are located.
In this chapter, we exclude North Sea oil and gas revenue from our analysis. Since Wales is not allocated a geographical share of North Sea revenue, this means that total current revenue raised in Wales is equal to total revenue if North Sea oil was apportioned on a geographical basis.

Wales Fiscal Analysis | Government Expenditure and Revenue Wales 2019 27
3.1.2 Recent and historical trends in current revenue in Wales
Figure 3.3 shows the main components of revenue for Wales from 1999-00 to 2017-18. The effect of the financial crisis can be clearly seen on the graph as total revenues fell by nearly £1 billion in Wales between 2007-08 and 2009-10. Revenues have since recovered, growing by 19% in real terms since 2009-10.
There are however large differences in the growth trends of the key revenue components. These reflect changes in tax policy, largely set by the UK government, as well as changes in the tax base in Wales.
Total Income Tax revenues peaked at £5.0 billion in 2007-08, having previously steadily increased each year. This means that Income Tax revenues in 2017-18 were 18% below their 2007-08 level in real terms. Analysis by the Office for Budget Responsibility (OBR) suggests that the main reason for this downward trend has been the effects of UK Government policy, particularly the significant increases in the personal allowance, in addition to stagnant real wages.
In 2017-18, VAT accounted for 23.6% of total revenue for Wales, up from 19.5% in 1999-00. The share of revenue generated by more regressive taxes such as VAT and excise duties has therefore increased, while the share raised from more progressive direct taxes has fallen. This suggests that Wales’ tax regime may have become more regressive over the past two decades.
Corporation tax now accounts for a smaller share of total revenue (4.8%) for Wales than it did in 1999-00 (5.3%). However, the share of revenue raised via corporation tax has increased over the most recent decade, having fallen to a low of 3.4% in 2008-09, at the time of the financial crisis.
Figure 3.3 Total current revenue for Wales, 1999-00 to 2017-18, by main revenue source (nominal terms)
Source: ONS (2019) Country and Regional Public Sector Finances and authors’ calculations
0
5,000
10,000
15,000
20,000
25,000
30,000
£ m
illio
n
All other revenue
Local authorityrevenue
Value Added Tax
National InsuranceContributions
Corporation tax
Income Tax

28 Wales Fiscal Analysis | Government Expenditure and Revenue Wales 2019
Box 3.2: Convergence in Council Tax revenues
In recent years, per capita Council Tax revenues collected in Wales have nearly converged with the UK level. Figure 3.4 shows the amount of Council Tax revenue raised per person in real terms from 1990-00 to 2017-18 for Wales and the UK. In 1999-00, just over £250 per person was raised through Council Tax in Wales, 79.4% of the UK level. Although revenues grew in real terms over the next decade, they remained below 85% of the UK level throughout this period. However, following the financial crisis, these levels started to converge. By 2017-18, £475 per head was raised via Council Tax in Wales, 97.6% of the UK level (£486). Between 1999-00 and 2017-18, revenues per person in Wales had increased by 88.7% in real terms, or 169% in nominal terms.
This convergence is a direct consequence of different policy decisions made by the Welsh, Scottish and UK governments. Since 2012-13, the Council Tax system has operated under an effective cap in England following the introduction of a local referendum requirement for ‘excessive’ increases. In Scotland, a Council Tax freeze was followed by a 3% cap on annual increases, which was only lifted in 2019-20. In contrast, the Welsh Government did not impose a formal cap on Council Tax levels. Facing deep cuts in the value of Welsh Government grants from 2013-14 onwards, many Welsh local authorities authorised significant increases to Council Tax bills to mitigate some of the spending cuts. This has meant that funding for local services has been relatively better protected in Wales compared to other parts of the UK, but it has also meant that a larger share of the tax burden has been shifted onto Council Tax payers.
In 1999-00, Council Tax accounted for 3.6% of total revenue for Wales. By 2017-18, this share had increased to 5.5%. Although Council Tax revenues per person in Wales are still only 97.6% of the UK average, gross disposable household income in Wales is 80.7% of the UK level. This means that people in Wales are seeing a significantly larger share of their household income going towards Council Tax bills. This may be particularly troubling given that Council Tax, which is based on property values, is a relatively regressive form of taxation (Ifan & Poole 2018: 71-75).
Figure 3.4 Council Tax revenues per persons: Wales and UK, 1999-00 to 2017-18 (2017-18 prices)
Source: ONS (2019) Country and Regional Public Sector Finances and authors’ calculations
200
250
300
350
400
450
500
£ p
er
he
ad
Wales United Kingdom

Wales Fiscal Analysis | Government Expenditure and Revenue Wales 2019 29
Between 1999-00 and 2017-18, total current revenue for Wales has grown by 89.9% in nominal terms, markedly slower than the 106.2% growth across the UK (if London is excluded, the UK figure falls to 97.7%). The rate of population growth in Wales, particularly since 2004, has been considerably slower than across the UK. On a per capita basis (thereby conditioning for slower population growth), the growth rate in total revenue for Wales over the period is 76.1%, compared to 82.2% for the UK.
Figure 3.5 shows the annual year-on-year growth rate in current revenues for Wales and the UK over this time period. Between 2000-01 and 2007-08, the average annual growth rate for Welsh revenues was 4.9%, compared to 5.4% across the UK. Both Wales and the UK saw a contraction in revenues around the time of the financial crisis. From 2011-12 onwards, the average annual rate of growth in Welsh revenues has been 3.5% compared to 4.0% across the UK. This is slower than the rate of growth experienced during the middle of the previous decade.
As a percentage of estimated GDP, total revenue raised in Wales has remained relatively consistent. This is expected since, in most cases, taxes are related to economic activity so if the GDP grows, tax revenue should also increase. Revenues reached a high of 38.8% of Welsh GDP in 2007-08 and in 2017-18, they accounted for 38.3% of GDP. Declining Income Tax revenues means that the proportion of Welsh GDP collected through this tax reached a historic low of 7.0% in 2017-18, down from a peak of 9.3% in 2007-08. This has been offset by an increase in the share of GDP collected through VAT in Wales
In 2017-18, total current revenues per head was £8,653 in Wales, 76.0% of the UK level. Figure 3.6 offers a detailed breakdown of Welsh current revenue as a percentage of GDP, on a per capita basis and as a share of the UK level between 1999-00 and 2017-18. Figure 3.7 offers a breakdown of current revenues by source between 2013-14 and 2017-18.
Figure 3.5 Annual (nominal) growth rate of current revenues: Wales and UK, 1999-00 to 2017-18
Source: ONS (2019) Country and Regional Public Sector Finances and authors’ calculations
-4.0%
-2.0%
0.0%
2.0%
4.0%
6.0%
8.0%
10.0%
12.0%
% y
ea
r-o
n-y
ea
r c
ha
ng
e
Wales
UK

30 Wales Fiscal Analysis | Government Expenditure and Revenue Wales 2019
Fig
ure
3.6
To
tal c
urr
en
t re
ven
ue
in W
ale
s, b
y m
ain
so
urc
e,
199
9-0
0 t
o 2
017
-18
Sou
rce:
ON
S (2
019
) Cou
ntr
y a
nd
Reg
ion
al P
ublic
Sec
tor
Fin
an
ces;
ON
S (2
018
an
d p
revi
ous)
Mid
-yea
r po
pula
tion
est
ima
tes
an
d a
uth
ors’
ca
lcul
ati
ons
19
99
-0
0
200
0-
01
200
1-0
2 20
02-
03
200
3-0
4
200
4-
05
200
5-0
6
200
6-
07
200
7-0
8
200
8-
09
20
09
-10
20
10-
11
2011
-12
20
12-
13
2013
-14
20
14-
15
2015
-16
20
16-
17
2017
-18
Cu
rre
nt
reve
nu
e b
y m
ain
so
urc
e (
£ m
illi
on
) In
com
e ta
x 3,
154
3,
29
5 3,
49
6
3,6
60
3,
96
8
4,2
56
4,4
87
4,7
36
5,0
35
4,7
64
4
,574
4
,79
1 4
,657
4
,56
3 4
,49
5 4
,69
4
4,6
10
4,8
39
4,9
30
Co
rpo
rati
on
tax
75
7 73
3 6
54
596
6
41
761
837
8
94
8
74
68
7 8
50
90
0
855
9
06
8
96
9
84
1,
056
1,
257
1,
306
NI c
on
trib
uti
on
s 2
,54
0
2,7
68
2
,817
2
,834
3,
379
3,
08
4
3,2
13
3,33
9
3,51
5 3,
527
3,4
61
3,53
5 3,
639
3,
707
3,78
9
3,8
51
3,9
46
4
,36
2
4,5
47
VA
T
2,7
82
2
,919
3,
111
3,2
84
3,
610
3,
760
3,
88
8
4,1
88
4
,30
3 4
,00
9
3,78
8
4,3
96
4
,976
5,
138
5,
360
5,
618
5,
854
6
,06
4
6,3
89
LA
rev
enu
e 1,
103
1,2
22
1,
28
4
1,32
2
1,4
05
1,4
84
1,
60
9
1,70
4
1,79
6
1,9
08
1,
957
2
,015
2
,075
2
,138
2
,20
8
2,2
92
2
,38
5 2
,477
2
,516
Oth
er r
even
ue
3,9
26
4
,018
4
,070
4
,09
3 4
,418
4
,60
1 4
,939
5,
08
1 5,
42
1 5,
42
4
5,35
9
5,6
49
5,
796
5,
98
4
6,4
27
6,6
35
6,8
90
7,
100
7,
393
To
tal
14,2
62
14
,955
15
,432
15
,78
9
17,4
21
17,9
46
18
,973
19
,94
2 20
,94
4
20,3
19
19,9
89
21
,28
6
21,9
98
22
,436
23
,175
24
,074
24
,74
1 26
,09
9
27,0
81
Cu
rre
nt
reve
nu
e b
y m
ain
so
urc
e (
% o
f G
DP
) In
com
e ta
x 8
.4%
8
.4%
8
.7%
8
.6%
8
.8%
9
.0%
9
.0%
9
.0%
9
.3%
9
.0%
8
.7%
8
.7%
8
.1%
7.
6%
7.
3%
7.4
%
7.0
%
7.1%
7.
0%
Co
rpo
rati
on
tax
2
.0%
1.
9%
1.
6%
1.
4%
1.
4%
1.
6%
1.
7%
1.7%
1.
6%
1.
3%
1.6
%
1.6
%
1.5%
1.
5%
1.5%
1.
6%
1.
6%
1.
8%
1.
8%
NI c
on
trib
uti
on
s 6
.8%
7.
1%
7.0
%
6.7
%
7.5%
6
.5%
6
.4%
6
.4%
6
.5%
6
.7%
6
.6%
6
.4%
6
.3%
6
.2%
6
.1%
6
.1%
6
.0%
6
.4%
6
.4%
VA
T
7.4
%
7.5%
7.
7%
7.7%
8
.0%
7.
9%
7.
8%
8
.0%
8
.0%
7.
6%
7.
2%
8
.0%
8
.7%
8
.6%
8
.7%
8
.9%
8
.9%
8
.9%
9
.0%
LA
rev
enu
e 2
.9%
3.
1%
3.2
%
3.1%
3.
1%
3.1%
3.
2%
3.
2%
3.
3%
3.6
%
3.7%
3.
7%
3.6
%
3.6
%
3.6
%
3.6
%
3.6
%
3.6
%
3.6
%
Oth
er r
even
ue
10.5
%
10.3
%
10.1
%
9.6
%
9.8
%
9.7
%
9.9
%
9.7
%
10.0
%
10.2
%
10.1
%
10.2
%
10.1
%
10.0
%
10.4
%
10.5
%
10.5
%
10.4
%
10.5
%
To
tal
38.1
%
38.3
%
38.4
%
37.2
%
38.6
%
37.8
%
37.9
%
38.0
%
38.8
%
38.3
%
37.8
%
38.6
%
38.3
%
37.6
%
37.6
%
38.1
%
37.8
%
38.3
%
38.3
%
Cu
rre
nt
reve
nu
e b
y m
ain
so
urc
e,
pe
r p
ers
on
(20
17-1
8 p
rice
s, £
pe
r h
ea
d)
Inco
me
tax
1,5
52
1,5
83
1
,66
0
1,6
88
1
,78
3
1,8
51
1,8
93
1
,92
9
1,9
88
1
,82
0
1,7
16
1,7
58
1,6
80
1
,60
8
1,5
51
1,5
95
1
,54
9
1,5
83
1
,575
Co
rpo
rati
on
tax
3
73
352
3
10
275
2
88
3
31
353
3
64
3
45
2
63
3
19
330
3
08
3
19
30
9
334
3
55
411
4
17
NI c
on
trib
uti
on
s 1
,250
1
,330
1
,337
1
,30
7
1,5
18
1,3
41
1
,356
1
,36
0
1,3
88
1
,34
8
1,2
99
1
,29
7
1,3
12
1,3
06
1
,30
8
1,3
08
1
,32
6
1,4
27
1
,453
VA
T
1,3
69
1
,40
2
1,4
77
1,5
14
1,6
22
1
,635
1
,64
0
1,7
06
1
,69
9
1,5
32
1,4
21
1
,613
1
,79
5
1,8
11
1,8
50
1,9
09
1
,96
7
1,9
84
2
,04
2
LA
rev
enu
e 5
43
5
87
6
10
610
6
31
64
5
679
6
94
7
09
7
29
7
34
739
7
48
7
53
76
2
779
8
02
8
10
80
4
Oth
er r
even
ue
1,9
32
1,9
30
1,9
32
1,8
87
1
,98
5
2,0
01
2
,08
4
2,0
70
2,1
40
2
,073
2
,011
2
,073
2
,09
0
2,1
09
2
,218
2
,254
2
,316
2
,32
3
2,3
62
To
tal
7,0
19
7,1
85
7
,326
7
,28
1
7,8
27
7,8
04
8
,00
5
8,1
24
8,2
69
7
,76
4
7,5
00
7
,811
7
,934
7
,90
7
7,9
98
8
,179
8
,315
8
,539
8
,653
Cu
rre
nt
reve
nu
e b
y m
ain
so
urc
e,
pe
r p
ers
on
(U
K =
10
0)
Inco
me
tax
66
.0
62
.4
65.
4
67.
1 6
8.9
6
8.3
6
7.1
65.
9
65.
4
64
.6
63.
8
64
.4
63.
0
62
.1
59.4
6
0.0
57
.4
57.6
57
.7
Co
rpo
rati
on
tax
4
6.2
4
6.1
4
5.6
4
5.9
4
7.1
45.
8
44
.8
44
.8
44
.9
47.
5 50
.6
51.2
50
.6
50.0
4
8.7
4
8.4
4
9.1
4
9.5
4
9.5
NI c
on
trib
uti
on
s 9
0.3
9
0.4
9
0.6
9
0.6
9
1.2
77
.3
76.4
74
.8
75.2
74
.6
73.5
74
.5
74.0
73
.6
73.5
73
.1
72.8
72
.9
73.1
VA
T
90
.6
91.
1 9
2.5
9
3.1
92
.5
93.
2
94
.8
94
.8
95.
0
93.
4
91.
6
91.
0
91.
8
93.
1 9
2.9
9
4.1
9
4.2
9
4.4
9
4.6
LA
rev
enu
e 8
2.3
8
4.1
8
2.1
79
.6
79.7
8
0.7
8
3.0
8
3.6
8
4.8
8
5.5
85.
7 8
7.5
87.
7 8
7.8
8
7.5
89
.1
90
.6
90
.8
88
.6
Oth
er r
even
ue
87.
3 8
2.6
8
3.7
83.
4
86
.2
84
.5
82
.2
83.
3 8
1.5
80
.5
83.
1 79
.3
79.4
8
1.5
83.
5 8
3.9
8
4.9
8
4.7
8
5.7
To
tal
78.6
76
.9
78.4
79
.0
80
.6
77.4
76
.5
76.1
75
.8
75.8
75
.6
75.5
75
.7
76.1
75
.9
76.2
76
.0
75.7
76
.0

Wales Fiscal Analysis | Government Expenditure and Revenue Wales 2019 31
W
AL
ES
U
K
£ m
illi
on
20
13-1
4
2014
-15
2015
-16
20
16-1
7 20
17-1
8
2013
-14
20
14-1
5 20
15-1
6
2016
-17
2017
-18
Inco
me
tax
4,4
95
4,6
94
4
,610
4
,839
4
,930
15
7,6
16
163,
62
0
168
,874
17
7,2
48
18
0,5
92
Co
rpo
rati
on
tax
(exc
l. N
ort
h S
ea)
89
6
98
4
1,0
56
1,2
57
1,30
6
38,3
32
42
,52
3 4
5,18
3 53
,62
1 55
,72
2
Cap
ital
gai
ns
tax
69
9
8
119
14
9
139
3,
910
5,
558
7,
06
0
8,3
79
7,79
4
Oth
er t
axes
on
inco
me
and
wea
lth
2
9
19
31
25
33
597
40
8
655
53
2
69
1
Nat
ion
al in
sura
nce
co
ntr
ibu
tio
ns
3,78
9
3,8
51
3,9
46
4
,36
2
4,5
47
107,
306
11
0,2
60
11
4,0
61
126
,24
1 13
1,54
7
VA
T
5,36
0
5,6
18
5,8
54
6,0
64
6
,38
9
120
,16
7 12
4,8
46
13
0,7
15
135,
590
14
2,7
71
Fu
el d
uti
es
1,35
1 1,
364
1,
333
1,34
7 1,
344
2
6,8
82
27,
156
2
7,6
22
2
7,9
37
27,
878
Sta
mp
du
ty la
nd
tax
14
5 17
0
155
210
2
30
9,2
72
10,7
36
11,0
95
12,2
32
13,4
50
Sta
mp
du
ty o
n s
har
es
6
8
5 11
10
3,
108
2
,92
5 3,
323
3,71
5 3,
519
To
bac
co d
uti
es
42
8
46
2
49
1 4
68
4
72
9,5
56
9,2
51
9,1
06
8
,68
1 8
,76
6
Alc
oh
ol d
uti
es
436
39
9
40
7 4
40
4
57
10,3
08
10
,44
9
10,6
97
11,1
17
11,5
85
Bet
tin
g a
nd
gam
ing
du
ties
76
9
0
104
10
7 11
3 1,
64
5 1,
776
2
,14
7 2
,20
0
2,3
16
Air
pas
sen
ger
du
ty
7 7
6
7 7
3,0
03
3,2
05
3,0
40
3,
236
3,
360
Insu
ran
ce p
rem
ium
tax
12
5 12
8
160
2
09
2
53
3,0
18
2,9
73
3,71
7 4
,872
5,
89
8
Lan
dfi
ll ta
x 6
2
49
4
2
36
32
1,17
9
1,12
5 1,
02
9
99
2
89
3
Clim
ate
chan
ge
levy
6
7 9
4
106
11
3 10
9
1,2
00
1,
62
6
1,79
7 1,
932
1,
86
0
Ag
gre
gat
es le
vy
26
34
33
39
36
2
94
35
7 34
8
411
37
2
Inh
erit
ance
tax
13
2
90
10
1 11
1 11
9
4,4
17
3,8
79
4,7
12
4,8
97
5,2
77
Veh
icle
exc
ise
du
ty
308
2
95
29
4
29
7 31
6
6,1
05
5,8
94
5,
90
6
5,9
81
6,3
62
No
n-d
om
esti
c ra
tes
1,0
00
1,
013
1,
035
1,
06
1 1,
031
2
6,4
78
27,
013
2
7,75
5 2
8,5
99
2
9,2
96
Co
un
cil t
ax
1,2
08
1,
279
1,
350
1,
416
1,
48
5 2
7,36
4
28
,14
4
28
,98
6
30,3
61
32,1
37
Oth
er t
axes
, ro
yalt
ies
and
ad
just
men
ts
60
1 6
92
75
0
758
8
92
14
,611
16
,60
5 17
,671
18
,29
8
21,
385
Inte
rest
an
d d
ivid
end
s 2
89
30
7 31
5 2
95
327
6,1
83
6,6
91
6,8
68
6
,44
3 7,
06
2
Gro
ss o
per
atin
g s
urp
lus
2,0
58
2,0
58
2,1
97
2,2
28
2
,273
4
4,1
93
45,
650
4
7,0
36
47,
770
4
5,8
54
Ren
t an
d o
ther
cu
rren
t tr
ansf
ers
212
2
71
24
1 2
50
231
4
,90
2
6,2
14
5,6
09
5,
754
5,
369
To
tal c
urr
en
t re
ven
ue
(e
xcl
. No
rth
Se
a)
23,1
75
24,0
74
24,7
41
26,0
99
27
,08
1 6
31,6
46
6
58,8
84
6
85,
012
72
7,0
39
751,
756
To
tal c
urr
en
t re
ven
ue
(in
cl. N
ort
h S
ea
)
Per
cap
ita
shar
e 2
3,39
1 2
4,1
55
24
,736
2
6,1
00
2
7,14
2
636
,14
5 6
60
,575
6
84
,92
7 72
7,0
75
753,
053
Geo
gra
ph
ical
sh
are
23,
175
24
,074
2
4,7
41
26
,09
9
27,
08
1 6
36,1
45
66
0,5
75
68
4,9
27
727,
075
75
3,0
53
Fig
ure
3.7
To
tal c
urr
en
t re
ven
ue
in W
ale
s, b
y s
ou
rce
, 20
13-1
4 t
o 2
017
-18
Sou
rce:
ON
S (2
019
) Cou
ntr
y a
nd
Reg
ion
al P
ublic
Sec
tor
Fin
an
ces;
an
d a
uth
ors’
ca
lcul
ati
ons

32 Wales Fiscal Analysis | Government Expenditure and Revenue Wales 2019
3.2 Devolved revenue streams
The recent devolution of Stamp Duty, Landfill Tax and a portion of Income Tax to Wales means that the share of total revenue under the control of the Welsh Government has increased since the last iteration of GERW was published in 2016.
In 2018-19, the Welsh Revenue Authority started administering and collecting Land Transaction Tax (LTT), which replaced Stamp Duty, and Landfill Disposal Tax (LDT), which replaced the Landfill Tax. Additionally, in 2019-20, around £2.1 billion in income tax revenue was devolved to Wales. Although Income Tax is still administered centrally by HMRC, the Welsh Government has powers to set its own rates on 10p of each band and the relative performance of the Welsh tax base will directly impact the size of the Welsh budget.
In 2017-18, the latest year for which complete outturn data is available, Council Tax and non-domestic (business) rates were the only significant revenue streams that were not reserved to the UK government. Local authorities have powers to set their own Council Tax levels while the Welsh Government has control over business rates (although local authorities can provide discretionary reliefs). In 2017-18, these devolved revenue streams raised £2.5 billion and accounted for 9.3% of total revenue to Wales.
Figure 3.8 offers a breakdown of total revenue in 2017-18 based on the level of government responsible in 2019-20. Had the Welsh Rates of Income Tax, Stamp Duty and Landfill Tax been devolved in 2017-18, these would have accounted for £2.3 billion (8.4%) of total revenue. When we include revenue streams that were already devolved at the time, devolved revenue accounts for 17.7% of the total and 73.9% is reserved to the UK government. The remaining 8.4% comprises of gross operating surplus (GOS). This is offset by an equivalent amount in the accounting adjustments on the expenditure side and is included here for completeness.
Figure 3.8
Breakdown of total current revenue to Wales (2017-18), by level of government responsible in
2019-20
Source: ONS (2019) Country and Regional Public Sector Finances; OBR (2019) Economic and Fiscal Outlook: devolved tax forecasts; and authors’ calculations
73.9%
8.4%
8.4%
9.3%
UK government
Welsh Government
GOS
Local government

Wales Fiscal Analysis | Government Expenditure and Revenue Wales 2019 33
3.3 International and regional comparisons
3.3.1 UK countries and English regions
Figure 3.9 presents total current revenue per head, by country between 1999-10 and 2017-18. Data for London is shown separately to highlight the fact that this region is an outlier. In general, trends in revenue for Wales, England (excluding London) and Northern Ireland follow a similar pattern. There is more variance in the Scottish figures given the effect of North Sea Oil & Gas revenues (including offshore corporation tax and petroleum revenue tax). Given that the Scottish Government has introduced its own tax bands from 2019-20 onwards, we can expect Scottish onshore revenue trends to diverge further from the UK average in the future.
Strong growth in corporation tax revenues means that per capita revenues in London have grown at a rapid pace in recent years. In 2017-18, total revenues collected per head for London was £16,942, nearly twice the Welsh level (£8,653). Since 1999-00, total revenues raised in Wales have fallen relative to the UK level although this is partly attributable to the strong growth in London revenues, which puts upward pressure on the UK average.
The map in Figure 3.10 presents similar data on total revenue raised per head in 2017-18 on a NUTS1
level. The North East is the English region with revenue levels most closely resembling that of Wales.
Nevertheless, in 2017-18, revenues per head in the North East of England were still £260 higher than the
Welsh figure. Total per capita revenues in Wales have trailed all other NUTS1 regions every year since
1999-00.
Figure 3.9
Total current revenue (North Sea revenue by geographic share) per head, 1999-00 to 2017-18
(2017-18 prices)
Source: ONS (2019) Country and Regional Public Sector Finances; ONS (2018 and previous) Mid-year population estimates and authors’ calculations
Wales
Scotland
Northern Ireland
London
England (excl. London)
6,000
8,000
10,000
12,000
14,000
16,000
18,000
£ p
er
he
ad

34 Wales Fiscal Analysis | Government Expenditure and Revenue Wales 2019
Figure 3.10 Total current revenue (excl. North Sea revenue) per head, by NUTS1 region, 2017-18
Source: ONS (2019) Country and Regional Public Sector Finances; ONS (2018 and previous) Mid-year population estimates and
authors’ calculations

Wales Fiscal Analysis | Government Expenditure and Revenue Wales 2019 35
Since 1999-00, Wales has seen a 23.3% real terms growth in per capita revenues, ranking seventh among
NUTS1 regions on this measure. The West Midlands (17.9%) and Yorkshire and the Humber (18.5%) have
seen the slowest growth, while London (37.0%), South East England (30.8%) and the East of England
(30.1%) rank highest. The three regions with the highest real-terms per capita growth rates since 1999-
00 were the only three regions with a positive net fiscal balance in 2017-18 (see Chapter 2).
3.3.2 OECD countries
This section compares levels of spending for Wales with other OECD countries. The figures presented in the ONS (2018) Country and Regional Public Sector Finances report include data for the public sector as a whole and on a financial year basis. In contrast, international organisations such as the European Commission and the International Monetary Fund (IMF) report countries’ finances on a calendar year basis and for general government only (excluding public corporations). Figure 3.11 below presents estimates of general government revenue for Wales and the UK on this basis.
Figure 3.11 General Government receipts, Wales and UK, 2017
Total current receipts 2013 2014 2015 2016 2017
Wales 22,799 23,619 24,222 25,423 26,588
United Kingdom 633,161 645,201 669,457 705,740 746,489
Source: ONS (2019) Country and Regional Public Sector Finances; ONS (2018 and previous) Mid-year population estimates; and authors’ calculations. See Annex A for details of methodology.
The Organisation for Economic Cooperation and Development (OECD) is an intergovernmental economic organisation aimed at stimulating economic progress and world trade. Most OECD members are high-income countries and are regarded as developed economies. In this section, we present illustrative international comparisons of Wales’ revenue levels by referencing data for OECD countries.
Note that the OECD data is not wholly comparable with the data presented earlier in this chapter. For instance, total revenue as a share of GDP is slightly higher compared to the data presented earlier. This is because of differences in what the ONS and OECD include in their calculations of total revenue. A full methodology explaining how GDP figures for Wales have been calculated can be found in Appendix A of this report.
As shown in Figure 3.12, Wales appears in the fourth quartile of OECD countries in terms of revenues raised per person. Based on OECD data, total revenues per head in Wales are $12,498, roughly comparable with South Korea ($12,688) and Hungary ($12,072). This is $5,934 below the OECD average of $18,432. Although Wales does not appear grossly out of line with other OECD countries based on these figures, when taking into account Wales’ expenditure levels, its revenue levels per person are low by international standards. A discussion of expenditure levels in Wales and other OECD countries can be found in Chapter 4.
The tax-to-GDP ratio refers to the share of a country’s output that is collected by the government through taxes and it is one measure of the degree to which the government controls resources. As a percentage of GDP, revenues to Wales are much closer to the middle of the table at 40.4% (Figure 3.13). This is still significantly below the Euro-area average of 46.0%.

36 Wales Fiscal Analysis | Government Expenditure and Revenue Wales 2019
Figure 3.12 Total revenues of OECD countries ($USD per person)
Source: OECD (2016) General Government Estimates and authors’ calculations. See Annex A for details of methodology.
$16,443
$12,498
0 5,000 10,000 15,000 20,000 25,000 30,000 35,000 40,000 45,000 50,000
Luxembourg
Norway
Iceland
Denmark
Austria
Sweden
Belgium
Finland
Netherlands
Switzerland
Germany
France
Ireland
United States
Canada
Italy
Australia
United Kingdom
New Zealand
Japan
Slovenia
Czech Republic
Israel
Spain
Greece
Portugal
Korea
Wales
Hungary
Estonia
Slovak Republic
Poland
Lithuania
Latvia
Columbia
Mexico
$ USD per person

Wales Fiscal Analysis | Government Expenditure and Revenue Wales 2019 37
Figure 3.13 Total revenues of OECD countries as % of GDP
Source: OECD (2016) General Government Estimates and authors’ calculations. See Annex A for details of methodology.
40.4%
38.5%
0 10 20 30 40 50 60
Iceland
Norway
Finland
France
Denmark
Sweden
Belgium
Greece
Austria
Italy
Hungary
Germany
Luxembourg
Netherlands
Slovenia
Portugal
Canada
Wales
New Zealand
Czech Republic
Slovak Republic
Estonia
Poland
Columbia
United Kingdom
Spain
Israel
Latvia
Japan
Australia
Korea
Switzerland
Lithuania
United States
Ireland
Mexico
% of GDP

38 Wales Fiscal Analysis | Government Expenditure and Revenue Wales 2019
Figure 3.14 Tax structures of OECD countries (main tax sources as % of total tax revenues), 2016
Source: OECD (2016) General Government Estimates and authors’ calculations
Personal incometax
Corporate income tax
Social security contributions
Property taxes
Taxes on goods and services
Other
0% 20% 40% 60% 80% 100%
Denmark
Australia
United States
New Zealand
Canada
Ireland
Switzerland
Sweden
Finland
Belgium
Norway
United Kingdom
Germany
Italy
Luxembourg
OECD - Average
Austria
Spain
Latvia
Wales
Mexico
Portugal
Israel
France
Japan
Netherlands
Korea
Estonia
Greece
Turkey
Poland
Slovenia
Lithuania
Hungary
Czech Republic
Slovak Republic
% of total tax revenues

Wales Fiscal Analysis | Government Expenditure and Revenue Wales 2019 39
Tax structures and the prominence of specific types of taxes vary significantly across countries. Figure 3.14 shows the main sources of tax revenues as a share of total taxes.5 In 2016, sixteen OECD countries raised the largest share of their revenues from income taxes (both corporate and personal), including the UK, while eleven countries raised the largest share of their revenues from Social Security Contributions (SSCs). Eight countries raised the largest share of their revenues from consumption taxes (including VAT) - as was the case for Wales in 2016.
5 This figure looks at tax revenues only and therefore excludes gross operating surplus, interest and dividends, rents and other current transfers included in earlier figures in this chapter. For Wales, income taxes (both corporate and personal) mainly consists of Income Tax, corporation tax and capital gains tax. Social security contributions consist of National Insurance contributions. Property taxes consist of Council Tax, non-domestic rates, Stamp Duty Land Tax and Inheritance Tax. Taxes on goods and services mainly consist of VAT revenues and excise duties.

40 Wales Fiscal Analysis | Government Expenditure and Revenue Wales 2019
Public sector expenditure
Public sector expenditure, also referred to as government spending, refers to the total amount spent by the public sector for Wales, including by the UK government, Welsh Government, local authorities and public corporations.
This chapter begins by analysing the composition of and trends in Welsh public expenditure. We then examine the share of expenditure for Wales that is reserved and devolved. We then attempt to reconcile the relative funding Wales receives through the block grant from the UK government with relative levels of total spending. Lastly, we provide comparisons of Welsh government spending with other countries of the UK and with OECD countries.
4
Key findings:
• Total public sector expenditure for Wales in 2017-18 was an estimated £40.8 billion, around 5.1% of total UK public sector expenditure of £794.9 billion. Non-identifiable expenditure and expenditure outside the UK attributed to Wales accounted for £5.2 billion of this total (mainly defence and debt interest payments).
• Social protection is by far the largest expenditure area for Wales, accounting for £14.8 billion, followed by health spending (£7.3 billion) and education (£4.3 billion).
• Total public sector spending for Wales increased by 8.3% from 2013-14 to 2017-18, most notably on health, which increased by nearly £1.1 billion over these years. However, total spending remains below its 2011-12 level both in real terms and on a per person basis.
• Total public sector spending per person for Wales was 108% of the UK average in 2017-18, or 111% of the level in England only. This is significantly lower than the estimated relative funding per person received through the block grant (120% of the English level). An attempt to reconcile these figures suggests that, on a per person basis, non-social protection spending by the UK government is significantly lower for Wales compared with England.
• Capital spending per person for Wales was 4.8% lower than the UK average in 2017-18. Capital spending per person on transport was only 76% of the UK level, and was also lower for education and training, environment protection and science and technology.
• On a National Accounts basis, estimated transactions with the EU for Wales was a net contribution of -£211 million, meaning public sector receipts from the EU (through CAP and structural funding) outweighed Wales’ notional contribution to the EU budget.
• Spending per person for Wales is relatively close to the average across OECD countries.

Wales Fiscal Analysis | Government Expenditure and Revenue Wales 2019 41
4.1 Composition and trends in public sector expenditure for Wales
4.1.1 Identifiable, non-identifiable and expenditure outside the UK
The main source of data for public expenditure on a country and regional basis in the UK is HM Treasury’s (2018) Country and Regional Analysis (CRA). This is a statistical exercise aimed at identifying where resources were spent depending on where those who benefitted were located. It is presented on a Total Expenditure on Services (TES) basis and is formed by two types of spending. Identifiable expenditure refers to spending which can be identified as benefitting particular countries or regions. For instance, expenditure on health services or on social protection can be identified as benefitting individuals in Wales. The CRA also includes non-identifiable expenditure and expenditure outside the UK. This refers to expenditure that is deemed to be incurred on behalf of the United Kingdom as a whole, for example, public debt interest payments and defence spending. The ONS (2019) Country and Regional Public Sector Finances publication allocates non-identifiable expenditure to Wales using various methodologies (see Box 4.1).
The ONS (2019) presents expenditure for countries and regions on a Total Managed Expenditure (TME) basis, the headline measure of aggregate public sector spending in the UK public sector finances. TME includes TES and an accounting adjustment. The main component of this accounting adjustment is capital consumption (or depreciation), which is a measure of the reduction in the value of assets over time. For example, the value of the road network is assumed to decline over time as weather and traffic cause potholes to emerge. Alongside VAT refunds, this spending in the accounting adjustment also gets counted as increased current revenue, and therefore does not influence Wales’ net fiscal balance estimates discussed in Chapter 2 (see Annex A for more information).
Figure 4.1 Estimated Public Sector Expenditure for Wales, 2013-14 to 2017-18
Source: ONS (2019) Country and Regional Public Sector Finances
0
5,000
10,000
15,000
20,000
25,000
30,000
35,000
40,000
45,000
2013-14 2014-15 2015-16 2016-17 2017-18
£ m
illio
ns
Accounting Adjustments
Expenditure outside the UK
Non-identifiable expenditure
Identifiable local governmentexpenditure
Identifiable Welsh Governmentexpenditure
Identifiable UK governmentexpenditure

42 Wales Fiscal Analysis | Government Expenditure and Revenue Wales 2019
Total public sector expenditure for Wales in 2017-18 is estimated to be £40.8 billion. This amounts to 5.1% of the total UK public sector expenditure of £794.9 billion. Identifiable expenditure accounted for £32.5 billion or 79.7% of total expenditure in 2017-18. Non-identifiable expenditure and expenditure outside the UK combined amounted to £5.2 billion, or 13.1 %. The remainder of the total is made up of accounting adjustments and EU transactions (see Section 4.1.4).
Figure 4.3 provides a breakdown of total public sector expenditure for Wales and the UK by policy area. Despite being a largely non-devolved policy area (see Box 4.2), social protection is by far the largest expenditure programme for Wales, accounting for £14.8 billion or 36.3% of total expenditure. Health
Box 4.1: Composition of non-identifiable and spending outside the UK
apportioned to Wales
Non-identifiable expenditure and expenditure outside the UK refers to spending which cannot be identified as benefitting particular countries and regions within the UK. When producing their annual Country and Regional Public Sector Finances tables, the ONS apportions most of this spending to countries and regions based on population share. In 2017-18, Wales’ population accounted for 4.73% of the UK total.
In 2017-18, total non-identifiable and spending outside the UK apportioned to Wales was roughly £5.4 billion. As shown in Figure 4.2, public sector debt repayments constituted £2.1 billion of this total. UK government spending on defence apportioned to Wales amounted to £1.8 billion. The £505 million spent on international services reflects the UK government’s commitment to spending 0.7% of its GDP on international aid. Social protection expenditure includes state pension payments for UK nationals living abroad. Spending on the BBC accounts for a significant share of the recreation, culture and religion category. Other spending includes UK border agency costs and transfers to European Economic Area countries to cover the cost of healthcare for British citizens who are admitted to hospital whilst abroad.
Figure 4.2 Breakdown of non-identifiable and expenditure outside the UK apportioned to Wales, 2017-18
Source: ONS (2019) Country and Regional Public Sector Finances
Public Sector Debt Interest
£2,123 million
Defence£1,821 million
International Services
£505 million
Public and common services
£250 million
Social protection£228 million
Recreation, culture and religion£201 million
Other£201 million

Wales Fiscal Analysis | Government Expenditure and Revenue Wales 2019 43
spending is also a large component of total expenditure at £7.3 billion, followed by education at £4.3 billion. When taken together, these three largest areas of expenditure account for nearly two-thirds of total expenditure for Wales.
Approximately 90% of total expenditure for Wales in 2017-18 was classified as current expenditure. Capital expenditure accounted for the remaining £3.8 billion. Capital expenditure accounted for a slightly smaller share of total expenditure in Wales when compared to the UK as a whole.
Figure 4.3 Total Expenditure: Wales and UK, 2017-18
WALES UK
£ million % of total £ million % of total Wales
as % of UK
General public services
Public and common services 776 1.9% 12,220 1.5% 6.4%
International services 507 1.2% 10,707 1.3% 4.7%
Public sector debt interest 2,123 5.2% 44,798 5.6% 4.7%
Defence 1,833 4.5% 38,653 4.9% 4.7%
Public order and safety 1,450 3.6% 31,558 4.0% 4.6%
Economic affairs
Enterprise and econ development 536 1.3% 9,591 1.2% 5.6%
Science and technology 239 0.6% 5,063 0.6% 4.7%
Employment policies 134 0.3% 2,613 0.3% 5.1%
Agriculture, forestry and fisheries 503 1.2% 5,192 0.7% 9.7%
Transport 1,303 3.2% 32,460 4.1% 4.0%
Environment protection 646 1.6% 12,014 1.5% 5.4%
Housing and community amenities 714 1.8% 11,496 1.4% 6.2%
Health 7,263 17.8% 145,812 18.3% 5.0%
Recreation, culture and religion 743 1.8% 11,918 1.5% 6.2%
Education and training 4,279 10.5% 87,907 11.1% 4.9%
Social protection 14,800 36.3% 268,658 33.8% 5.5%
Accounting adjustments6 2,926 7.2% 64,214 8.1% 4.6%
Total Expenditure 7 40,776 100.0% 794,876 100.0% 5.1%
of which:
Current Expenditure 37,008 90.8% 711,164 89.5% 5.2%
Capital Expenditure 3,768 9.2% 83,712 10.5% 4.5%
Source: ONS (2019) Country and Regional Public Sector Finances and authors’ calculations
6 Most items included here are offset by increased current revenue. Includes EU transactions line (see Section 4.1.4). 7 Total expenditure presents Total Managed Expenditure.

44 Wales Fiscal Analysis | Government Expenditure and Revenue Wales 2019
4.1.2 Trends by expenditure programmes, 2013-14 to 2017-18
Figure 4.4 shows the change in expenditure for Wales and the UK from 2013-14 to 2017-18, by largest categories of expenditure.
Change in total expenditure over this period was roughly on a par with the UK average, at around 8.3%. However, on a real terms and per person basis, total spending for Wales increased by 0.2%, whereas total spending per head fell by 1.2% on a UK level over the same period. This reflects slower Welsh population growth over the past five years. This is also the reason why allocated spending for defence has grown more slowly for Wales.
The largest increase in expenditure for Wales from 2013-14 to 2017-18 was health spending, which grew by nearly £1.1 billion, or 17.4%. This compares with a 12.7% increase in health spending across the UK. This notable pattern can be attributed to the Welsh Government’s decision to increase health spending in Wales from 2013-14. During the early years of austerity from 2009-10, the Welsh Government used its Barnett consequentials from protected English NHS spending to moderate the impact of cuts to other spending areas, including local government, which meant that health spending across the UK outpaced growth in health spending for Wales. Between 2013-14 and 2017-18 however, this trend was reversed, and health spending for Wales grew significantly more quickly than health spending for the UK as a whole.
Figure 4.4 Change in expenditure (nominal) by largest expenditure functions: Wales and UK, 2013-14 to 2017-188
Source: ONS (2019) Country and Regional Public Sector Finances and authors’ calculations
8 Other functions line includes economic affairs, environment protection, housing and community amenities and recreation, culture and religion.
0.0% 2.0% 4.0% 6.0% 8.0% 10.0% 12.0% 14.0% 16.0% 18.0% 20.0%
Social protection
Health
Education and training
General public services
Defence
Public order and safety
Total Expenditure
Wales UK

Wales Fiscal Analysis | Government Expenditure and Revenue Wales 2019 45
In 2017-18, total health spending per head for Wales amounted to £2,321, or 105% of the UK level. This higher per capita figure reflects, in part, greater need arising from having an older, poorer and generally less healthy population. A report by the Holtham Commission (2010) argued that relative need for health expenditure in Wales was around 114% of the English level, based on UK government funding criteria.
Box 4.2: Composition of identifiable Social Protection spending for Wales
Figure 4.5 provides a breakdown of expenditure on social protection for Wales from 2013-14 to 2017-18. The largest growth area was expenditure on pensions, which grew by £480.1 million (9.1%) while the largest percentage increase was seen in expenditure on incapacity, disability and injury benefits, which increased by £375.0 million (14.9%) over this period. In 2017-18, pensions accounted for 39.5% of the social protection bill for Wales, up from 38.5% in 2013-14. This is less than the share of social protection expenditure spent on pensions across the UK, which was 41.4% in 2017-18. Higher prevalence of disabilities and chronic conditions means that incapacity, disability and injury benefits account for a relatively larger share of the total in Wales.
Figure 4.5 Breakdown of identifiable Social Protection spending for Wales, 2013-14 to 2017-18
Source: HM Treasury (2018 and previous) Country and Regional Analysis and authors’ calculations
0
2,000
4,000
6,000
8,000
10,000
12,000
14,000
16,000
2013-14 2014-15 2015-16 2016-17 2017-18
£ m
illio
n
Other social protection expenditure
Housing (Welsh Local Government)
Social Services (Welsh Government and Local Government)
Family benefits, income support and tax credits
Incapacity, disability and injury benefits
Pensions

46 Wales Fiscal Analysis | Government Expenditure and Revenue Wales 2019
Education expenditure for Wales increased by £121 million (2.9%) between 2013-14 and 2017-18, less than the equivalent percentage increase for the UK (3.8%). However, despite this smaller percentage increase, slower growth in Wales’ pupil population has meant that per pupil spending has been relatively better protected in Wales.
4.1.3 Trends in public sector capital expenditure, 2013-14 to 2017-18
Capital expenditure has been increasing more rapidly than current expenditure in recent years. Capital spending grew by 15.6% in nominal terms between 2013-14 and 2017-18, compared with a 7.6% increase in current spending. However, as a share of TME, capital spending for Wales increased by 0.5 percentage points over this time period, compared with a 1.1 percentage point increase at a UK wide level, as illustrated in Figure 4.6.
Figure 4.6 Capital expenditure for Wales as a % of Total Managed Expenditure, 2013-14 to 2017-18
Source: ONS (2019) Country and Regional Public Sector Finances and authors’ calculations
Figure 4.7 provides a breakdown of capital expenditure for Wales by largest expenditure functions. Capital spending on transport projects accounted for £693 million, or 18.4% of total capital expenditure for Wales in 2017-18. In the same year, capital spending on housing and community amenities, mostly by local government, amounted to £547 million, or 15.9% of total capital expenditure.
Capital spending on defence, allocated to Wales on a population basis, was £486 million in 2017-18. This amounted to 41% of the UK government’s capital spending for Wales. Accounting adjustment spending included in Figure 4.7 mainly relates to spending by housing associations which are accounted for in TME but not TES.
8.0%
8.5%
9.0%
9.5%
10.0%
10.5%
11.0%
2013-14 2014-15 2015-16 2016-17 2017-18
Wales UK

Wales Fiscal Analysis | Government Expenditure and Revenue Wales 2019 47
Figure 4.7 Breakdown of capital expenditure for Wales, by largest expenditure functions, 2017-18
Source: ONS (2019) Country and Regional Public Sector Finances and authors’ calculations
Figure 4.8 provides a breakdown of capital expenditure for Wales by level of government. When spending by housing associations is included, local government accounted for the largest share of capital spending for Wales (36%), though its share has been falling.
Figure 4.8 Breakdown of capital expenditure for Wales, by level of government, 2013-14 to 2017-18 (£ million)
£ million 2013-14 2014-15 2015-16 2016-17 2017-18
Local government 979 917 1,016 1,012 1,079
Welsh Government 863 991 808 926 1,117
UK government 947 1,055 1,146 1,137 1,238
Total 2,789 2,964 2,970 3,074 3,434
Source: ONS (2019) Country and Regional Public Sector Finances; HM Treasury (2018 and previous) Country and Regional Analysis and authors’ calculations
Capital spending per person for Wales was 4.8% lower than the average for the whole of the UK in 2017-18. Relative levels of capital spending for Wales compared with the UK average varies significantly between functions. Figure 4.9 shows cumulative identifiable capital spending on various spending functions over the latest five-year period, from 2013-14 to 2017-18, and how this compared with the UK average per person.9
9 Non-identifiable spending (e.g. defence) is excluded from this analysis.
Transport, £693m
Housing and community amenities,
£547m
Defence, £486m
Education and training, £443m
Health, £364m
Science and technology, £156m
Environment protection, £153m
Enterprise and economic development, £140m
Recreation, culture and religion, £118m
Other functions £334mAccounting
adjustment, £334m

48 Wales Fiscal Analysis | Government Expenditure and Revenue Wales 2019
Figure 4.9 Cumulative identifiable capital spending for Wales from 2013-14 to 2017-18, by function
Function
Cumulative identifiable spending, 2013-14 to 2017-18 (£m, 2017-18 prices)
Per person (£, 2017-18 prices)
Per person (UK = 100%)
Transport 3,201 1,031 76%
Housing and community amenities 2,668 859 148%
Education and training 1,805 581 78%
Health 1,431 461 93%
Environment protection 781 252 89%
Enterprise and economic development 684 220 204%
Science and technology 666 214 75%
Recreation, culture and religion 428 138 95%
Public order and safety 363 117 122%
Other functions 664 214 119%
Total capital identifiable expenditure 12,693 4,087 96%
Source: ONS (2019) Country and Regional Public Sector Finances and authors’ calculations
Capital spending per person on transport — the largest area of capital spending — was only 76% of the UK level, while housing and community amenities spending was significantly higher in Wales. Relative levels of capital spending per person were significantly lower for Wales in education and training, environment protection and science and technology, while enterprise and economic development capital spending was significantly higher for Wales.
Figure 4.10 Net investment per person, 2013-14 to 2017-18 (£ per person, 2017-18 prices)
Source: ONS (2019) Country and Regional Public Sector Finances and authors’ calculations
400
450
500
550
600
650
700
2013-14 2014-15 2015-16 2016-17 2017-18
£ p
er p
erso
n
Wales United Kingdom

Wales Fiscal Analysis | Government Expenditure and Revenue Wales 2019 49
Public sector capital expenditure less capital consumption (or depreciation) is referred to as Public Sector Net Investment. Higher levels of estimated capital consumption for Wales means that there is an even greater difference in per person net investment between Wales and the whole of the UK. Net investment per person in Wales amounted to £532 in 2017-18, compared with £645 across the UK (21% higher), a gap which has grown over recent years, as shown in Figure 4.10.
4.1.4 EU Transactions
As a member of the European Union (EU), the UK makes contributions to the EU budget and receives funding from the EU through several programmes. Figure 4.11 provides a breakdown of these transactions with the EU.
Wales does not make direct contributions to the EU budget and is therefore assigned a share of the UK contribution. The different components of the UK’s contribution to the EU budget are assigned as follows:
• Traditional Own Resources (comprising customs, agricultural and sugar levies) are assigned
using shares of UK VAT revenue;
• VAT-based own resource (standardised percentage of 0.3% of VAT) are assigned using shares of
UK VAT revenue;
• GNI-based own resource (a contribution based on Gross National Income) are assigned using
shares of GVA.
• The UK rebate is assigned on the basis of population.
This apportionment methodology used by the ONS closely follows the methodology developed by the
Scottish Government for their Government Expenditure and Revenue Scotland publication.
Figure 4.11 Transactions with EU institutions, 2013-14 to 2017-18, United Kingdom (£ million)
2013-14
2014-15
2015-16
2016-17
2017-18
GNI based contribution 13,845 14,154 12,570 11,440 11,761
UK abatement (rebate) -4,130 -4,811 -4,068 -4,757 -4,547
VAT-based contribution to the EU 2,163 2,316 2,751 2,477 2,974
Expenditure transfers to the EU 11,879 11,658 11,253 9,160 10,188
Receipts to cover collection costs of TOR -733 -743 -771 -357 -698
TOR 2,933 3,006 3,085 3,366 3,413
Gross contribution to the EU budget 14,079 13,921 13,567 12,169 12,903
Public sector EU receipts -3,856 -4,690 -2,811 -4,081 -4,126
Net contribution to the EU budget 10,223 9,231 10,756 8,088 8,777
less other attributed costs [1] -79
Net payments to EU institutions 10,143 9,231 10,756 8,088 8,777
EU transactions (net payments to EU institutions less TOR)
7,210 6,225 7,671 4,722 5,364
[1] UK contribution to EU aid to non-EU states
Source: Scottish Government (2018) Government Expenditure and Revenue Scotland

50 Wales Fiscal Analysis | Government Expenditure and Revenue Wales 2019
Wales receives funding directly from the EU, primarily through the Common Agricultural Policy and
European Structural and Development Funds. In the National Accounts, this expenditure is reported as
direct payments from the EU to enterprises and households, rather than being included within
departmental budgets. To present spending on a Total Managed Expenditure basis, these spending lines
are included as negative spending to remove them from departmental spending. Actual amounts are
used for these items, reflecting income reported in the Welsh Government’s annual consolidated
accounts. Wales’ estimated transactions with EU institutions are outlined in Figure 4.12.
The EU transactions line which appears in the tables presented in this chapter are produced on a National
Accounts basis and therefore exclude Traditional Own Resources (TOR) payments. As shown in Figure
4.12, EU transactions for Wales amounted to a contribution of -£211 million, meaning public sector EU
receipts outweighed Wales’ notional contribution to the EU budget. Out of the 13 NUTS1 regions, this
was only true for Wales and Northern Ireland.
However, TOR payments are normally included when reporting the UK’s net contribution to EU budgets.
Wales’ estimated net contribution to the EU in 2017-18 was a benefit of £59 million, compared with a net
contribution from the UK as a whole of £8.8 billion. This estimated net benefit has been affected by a
recent change in methodology. In 2016, the Wales Governance Centre published an estimate of Wales’
net contribution to the EU in which TOR contributions were apportioned by taking Wales’ share of
imports from outside the EU. A change in methodology for estimating these imports by HMRC means
that this share is now considerably greater, and as a result Wales’ estimated net benefit from the EU is
somewhat smaller.
Figure 4.12 Estimated transactions with EU institutions, 2013-14 to 2017-18, Wales (£ million)
2013-14
2014-15
2015-16
2016-17
2017-18
GNI based contribution 479 483 431 392 402
UK abatement (rebate) -198 -230 -193 -225 -215
VAT-based contribution to the EU 96 104 123 111 133
Expenditure transfers to the EU 377 357 360 278 320
Receipts to cover collection costs of TOR -33 -33 -35 -16 -31
TOR 131 135 138 151 153
Gross contribution to the EU budget 475 459 464 412 441
Public sector EU receipts -684 -650 -429 -401 -500
Net contribution to the EU budget -209 -191 35 11 -59
less other attributed costs [1] -4 0 0 0 0
Net payments to EU institutions -213 -191 35 11 -59
EU transactions (net payments to EU institutions less TOR)
-343 -327 -103 -139 -211
[1] UK contribution to EU aid to non-EU states
Source: Authors’ calculations. These estimates differ slightly from the EU transactions line reported in the ONS data, due to differences in amounts apportioned to Wales.
While these figures cover the transactions of the Welsh public sector with the EU, the EU also makes payments to bodies outside the public sector, such as Higher Education Institutions (HEIs). To illustrate the size of these payments, Figure 4.13 provides the latest data from the Higher Education Statistics

Wales Fiscal Analysis | Government Expenditure and Revenue Wales 2019 51
Agency (2019) on payments from the EU to HEIs in Wales and the UK. Payments to Welsh HEIs amounted to £48 million in 2017-18, just over 5% of the total for the UK. These payments and Wales’ share of the UK total have increased from 2015-16 onwards, as shown in the table.
Figure 4.13 EU payments to Higher Education Institutions, 2015-16 to 2017-18
2015-16 2016-17 2017-18
UK 841 877 924
Wales 28 35 48
Wales share of UK 3.3% 4.0% 5.2%
Source: Higher Education Statistics Agency (2019) Table 7 – Income analysed by source
4.1.5 Longer term trends in public sector expenditure
The Country and Regional Public Sector Finances dataset published by the ONS presents TME on an annual basis going back to 1999-00. Due to changes in reporting, classification and accounting procedures, historical breakdowns of this figure by capital and current spending on policy functions are subject to a degree of uncertainty. In contrast, headline historical figures for total expenditure are likely to be of a high level of accuracy. For these reasons, only trends in total expenditure are explored in this section.
Figure 4.14 Total Managed Expenditure for Wales (nominal) and annual percentage change in TME for Wales and UK, 1999-00 to 2017-18
Source: ONS (2019) Country and Regional Public Sector Finances
-
5,000
10,000
15,000
20,000
25,000
30,000
35,000
40,000
45,000
-2%
0%
2%
4%
6%
8%
10%
12%
£ m
illio
n
% c
ha
ng
e (
no
min
al)
in
TM
E
% change (Wales), left axis % change (UK), left axis TME (Wales), right axis

52 Wales Fiscal Analysis | Government Expenditure and Revenue Wales 2019
The grey line in Figure 4.14 plots the nominal growth in TME for Wales between 2000-01 and 2017-18. The red and grey bars indicate the annual percentage change in TME for Wales and the UK over the same period.
Over the first part of the last decade, Wales saw rapid growth in total expenditure levels, increasing from £19.5 billion in 1999-00 to £27.6 billion in 2004-05. Annual growth in TME for Wales averaged 7.2% over this period, less than the average growth of 7.7% in UK expenditure. Except for 2002-03 and 2006-07, growth in total expenditure for Wales trailed growth in UK-wide expenditure in each year between 1999-00 and 2009-10.
The sharp increase in TME around the time of the 2007-08 financial crisis reflects the financial sector interventions made by the UK government in the form of banking bailouts. In a previous GERW release, we estimated that Wales’ population share of the UK Government’s financial stability expenditure amounted to £407 million in 2008-09 and £203 million in 2009-10.
Since 2011-12, growth in TME for Wales has slowed and even contracted by 0.4% in nominal terms between 2011-12 and 2012-13. This reflects the austerity measures put in place by the coalition government in Westminster at the time. Between 2009-10 and 2017-18, the average annual rate of growth in TME for Wales was 1.6%, a figure roughly in line with that of the UK as a whole.
Figure 4.15 plots an index of TME for Wales in real terms and on a per capita basis using 1999-00 levels as a baseline. Real-terms increases in TME were sufficiently large to ensure that per capita spending levels grew at the same rate over the first half of the last decade. Between 2011-12 and 2013-14, however, TME for Wales fell by £1.6 billion (3.9%) in real terms. Slower population growth in recent years has protected per capita spending levels from diverging further to some extent. Nevertheless, in 2017-18, total expenditure for Wales remained below its 2011-12 level both in real terms and on a per capita basis.
Figure 4.15 Real-terms and per capita change in Total Managed Expenditure for Wales, 1999-00 to 2017-18 (1999-00 = 100)
Source: ONS (2019) Country and Regional Public Sector Finances; ONS (2018 and previous) Mid-year population estimates; ONS (2017) 2016-based population Projections and authors’ calculations
90
100
110
120
130
140
150
160
Real Terms Per Capita

Wales Fiscal Analysis | Government Expenditure and Revenue Wales 2019 53
Figure 4.16 shows the trend in total per person spending for Wales relative to the UK as a whole (UK=100). Relative per person expenditure for Wales was at its highest, at 110.6% of the UK level, in 1999-00, fell to 105.9% in 2009-10, but has increased again in recent years. In 2017-18, relative per person expenditure for Wales was 108.4% of the UK level. The recent increase may be partly attributed to relatively slower population growth in Wales compared to the rest of the UK.
Figure 4.16 Total Managed Expenditure per person for Wales, 1999-10 to 2017-18 (UK = 100)
Source: ONS (2019) Country and Regional Public Sector Finances and authors’ calculations
As previously stated, we estimate that Wales’ GDP in 2017-18 was £70.7 billion. Figure 4.17 presents Total Managed Expenditure for Wales and the UK as an estimated share of GDP. In 2017-18, total expenditure in Wales equated to 57.7% of the country’s GDP’s, significantly higher than the figure for the UK (38.4%). Expenditure for Wales as a share of GDP peaked at 67.9% in 2009-10. Nevertheless, the most recent figures are not wildly inconsistent with equivalent data for some OECD countries. We present further international expenditure comparisons in a later section of this chapter.
Figure 4.17 Total Managed Expenditure for Wales and the UK as an estimated share of GDP
Source: ONS (2019) Country and Regional Public Sector Finances; GDP estimates based on authors’ calculations
103
104
105
106
107
108
109
110
111
UK
= 1
00
0%
10%
20%
30%
40%
50%
60%
70%
80%
Wales UK

54 Wales Fiscal Analysis | Government Expenditure and Revenue Wales 2019
4.2 Devolved and reserved expenditure
4.2.1 Overview of expenditure by level of government
Figure 4.18 shows the split in Total Managed Expenditure for Wales by level of government. UK government spending accounted for £18.6 billion (45.6%) of government spending for Wales in 2017-18. Welsh Government spending accounted for 29.4% of Total Managed Expenditure, while local government spending accounted for 25.1%.
Figure 4.18 Breakdown of Total Managed Expenditure for Wales, by level of government, 2017-18
Source: ONS (2019) Country and Regional Public Sector Finances; HM Treasury (2018 and previous) Country and Regional Analysis and authors’ calculations
Figure 4.19 overleaf presents added detail on devolved, local and reserved spending between 2013-14 and 2017-18, breaking this down by government function. Welsh Government spending on health has increased by nearly £1.1 billion (17.2%) over the period, having grown at a slower pace than England over the first years of austerity.
As illustrated in Figure 4.20, Total Managed Expenditure by the Welsh Government grew faster than spending by local and UK government between 2013-14 and 2017-18. Welsh Government spending increased by £1.4 billion (13.0%) in nominal terms over this period, and over three quarters of this increase was diverted towards health spending. UK government spending grew at a relatively slower pace (7.6%) while local government spending grew by only 4.3% in nominal terms and fell by 2.1% in real terms. These trends mean the Welsh Government’s share of Total Managed Expenditure has increased slightly from 28.1% in 2013-14, while local government’s share has fallen from 26.0%.
25.1%
29.4%
45.6%
Local government Welsh Government UK government

Wales Fiscal Analysis | Government Expenditure and Revenue Wales 2019 55
L
oca
l go
vern
me
nt
We
lsh
Go
vern
me
nt
UK
go
vern
me
nt
To
tal
£ m
illi
on
20
13-
14
2014
-15
20
15-
16
2016
-17
20
17-
18
2013
-14
20
14-
15
2015
-16
20
16-
17
2017
-18
20
13-
14
2014
-15
20
15-
16
2016
-17
20
17-
18
2013
-14
20
14-
15
2015
-16
20
16-
17
2017
-18
Gen
eral
pu
blic
ser
vice
s 2
21
2
05
2
11
20
5
218
2
30
250
2
39
24
6
24
8
2,6
68
2
,575
2
,572
2
,711
2
,94
1
3,1
17
3,0
30
3,0
22
3
,16
3
3,4
06
Pu
blic
ser
vice
s 2
21
2
05
2
11
20
5
218
2
30
250
2
39
24
6
24
8
270
2
84
2
67
2
94
3
09
7
21
7
40
7
18
74
5
776
Inte
rnat
ion
al s
ervi
ces
-
-
-
-
-
-
-
-
-
-
471
5
02
4
96
5
14
50
8
470
5
02
4
97
5
15
50
7
Pu
blic
sec
tor
deb
t in
tere
st
-
-
-
-
-
-
-
-
-
-
1,9
26
1
,78
9
1,8
07
1
,90
3
2,1
23
1
,92
6
1,7
89
1
,80
7
1,9
03
2
,12
3
Def
ence
4
4
3
2
3
-
-
-
-
-
1,7
45
1
,752
1
,74
0
1,7
57
1,8
30
1,7
50
1,7
55
1,7
43
1
,76
0
1,8
33
Pu
blic
ord
er a
nd
saf
ety
82
1
84
7
811
8
05
8
39
1
1
2
1
1
58
3
59
8
510
5
44
6
10
1,4
05
1
,44
6
1,3
23
1
,350
1
,450
Eco
no
mic
aff
airs
4
91
4
35
353
3
39
39
2
1,2
59
1,2
86
1
,16
7
1,2
22
1
,30
5
715
6
80
1
,00
6
89
8
1,0
19
2,4
65
2
,40
2
2,5
27
2
,46
0
2,7
16
Eco
no
mic
dev
elo
pm
ent
112
9
2
63
4
1
85
3
00
3
28
2
34
22
4
22
4
16
4
152
2
07
1
90
2
27
5
75
572
5
05
4
55
536
Sci
ence
an
d t
ech
no
log
y -
-
-
-
-
29
4
4
37
2
1
29
1
38
16
0
18
9
18
6
211
1
68
2
04
2
25
2
08
2
39
Em
plo
ymen
t p
olic
ies
-
-
-
-
-
2
3
-
0
0
19
4
155
1
36
133
1
34
19
7
158
1
36
133
1
34
Ag
ricu
ltu
re a
nd
fo
rest
ry
22
2
0
15
1
6
14
4
51
412
4
03
4
33
470
1
6
19
1
7
16
1
9
48
8
451
4
35
46
6
50
3
Tra
nsp
ort
3
58
32
3
275
2
83
2
93
4
77
49
9
49
4
54
4
58
0
20
2
19
5
457
3
71
42
8
1,0
37
1,0
17
1,2
26
1
,19
8
1,3
03
En
viro
nm
ent
pro
tect
ion
3
83
3
69
3
61
3
67
3
54
19
5
19
5
157
1
49
1
55
130
1
44
1
45
1
20
1
36
70
9
70
8
66
3
636
6
46
Ho
usi
ng
an
d c
om
mu
nit
y
50
4
50
3
513
5
03
4
49
9
9
91
1
77
19
7
256
1
1
13
1
2
12
9
6
15
60
7
70
2
712
7
14
Hea
lth
-
-
-
-
-
6,1
45
6
,42
6
6,5
74
6,9
35
7,2
03
4
1
39
3
1
51
5
9
6,1
87
6
,46
5
6,6
05
6
,98
6
7,2
63
Rec
reat
ion
, cu
ltu
re a
nd
rel
igio
n
314
2
92
2
73
253
2
61
9
9
10
8
10
0
10
6
12
4
30
3
32
9
311
3
20
3
58
717
7
29
6
84
6
78
74
3
Ed
uca
tio
n
2,8
92
2
,84
7
2,9
08
2
,98
4
3,0
53
1,2
57
1,1
25
1
,16
1
1,1
87
1
,211
1
0
16
1
4
15
1
5
4,1
58
3,9
87
4
,08
4
4,1
86
4
,279
So
cial
pro
tect
ion
2
,914
2
,96
8
2,9
55
2,9
91
3
,077
9
4
97
9
0
92
1
05
1
0,8
95
1
1,2
94
1
1,4
78
11,
44
2
11,
618
1
3,9
03
1
4,3
60
1
4,5
23
1
4,5
25
1
4,8
00
To
tal E
xp
en
dit
ure
on
Se
rvic
es
8,5
43
8
,471
8
,38
9
8,4
49
8
,64
7
9,3
80
9
,578
9
,66
7
10,1
35
10,6
07
17
,10
0
17,4
40
17
,821
17
,870
18
,59
6
35,0
26
35,4
89
35
,876
36
,456
37
,850
Sh
are
of
TE
S
24
.4%
2
3.9
%
23.
4%
2
3.2
%
22
.8%
2
6.8
%
27.
0%
2
6.9
%
27.
8%
2
8.0
%
48
.8%
4
9.1
%
49
.7%
4
9.0
%
49
.1%
10
0%
10
0%
10
0%
10
0%
10
0%
Acc
ou
nti
ng
Ad
just
men
ts
1,2
51
1,4
14
1,4
31
1,5
14
1,5
69
1
,216
1
,19
4
1,2
22
1
,210
1
,370
1
71
22
5
18
4
28
5
-13
2
,638
2
,833
2
,837
3
,00
9
2,9
26
To
tal M
an
ag
ed
Ex
pe
nd
itu
re
9,7
94
9
,88
5
9,8
20
9,9
63
10
,216
10
,59
6
10,7
72
10,8
89
11
,34
5
11,9
77
17,2
71
17,6
65
18
,00
5
18,1
55
18,5
83
37
,66
3
38,3
23
38,7
10
39,4
64
4
0,7
76
Sh
are
of
TM
E
26
.0%
2
5.8
%
25.
4%
2
5.2
%
25.
1%
28
.1%
2
8.1
%
28
.1%
2
8.7
%
29
.4%
4
5.9
%
46
.1%
4
6.5
%
46
.0%
4
5.6
%
100
%
100
%
100
%
100
%
100
%
Fig
ure
4.1
9
To
tal E
xp
en
dit
ure
on
Se
rvic
es
for
Wa
les
by
leve
l of
go
vern
me
nt,
20
13-1
4 t
o 2
017
-18
(£ m
illio
n)
Sou
rce:
ON
S (2
019
) Cou
ntr
y a
nd
Reg
ion
al P
ublic
Sec
tor
Fin
an
ces;
HM
Tre
asu
ry (2
018
an
d p
revi
ous)
Cou
ntr
y a
nd
Reg
ion
al A
na
lysi
s a
nd
aut
hor
s’ c
alc
ula
tion
s

56 Wales Fiscal Analysis | Government Expenditure and Revenue Wales 2019
Figure 4.20 Total Managed Expenditure for Wales, by level of government, 2013-14 to 2017-18
Source: ONS (2019) Country and Regional Public Sector Finances; HM Treasury (2018 and previous) Country and Regional Analysis and authors’ calculations
4.2.2 Relative funding and spending levels in Wales
The level of spending and funding per person for Wales relative to England and the rest of the UK has often been a source of contention. The Holtham Commission (2010) estimated that Welsh Government funding received through the block grant from the UK government relative to England had fallen since devolution. The Commission’s two reports suggested that relative spending need in Wales was between 114% and 117% of the level of England and noted that relative funding in Wales might fall below this range through the simple application of the Barnett formula over time. The issue of Barnett formula convergence (see Box 5.2) was recognised in a joint statement by the Welsh and UK governments in 2012. The fiscal framework agreement of December 2016 between both governments agreed a methodology for determining relative funding for the Welsh Government, and introduced a ‘needs-based factor’ of 105% to the Barnett formula for Wales to limit the extent of future convergence (see Poole, Ifan and Phillips 2017).
Figure 4.21 shows estimated Total Managed Expenditure per person for Wales relative to England (=100), as well as total identifiable spending per person in both countries. The relative levels of total identifiable spending (which will include reserved as well as devolved spending) is significantly lower than the estimate of Wales’ relative funding through the block grant and Barnett formula. While funding per person received through the block grant is around 120% of the English level, relative total identifiable spending per person stood at 115% in 2017-18.
Total Managed Expenditure per person also includes spending lines which are allocated on the same per person basis for Wales and for England, such as defence. As such, the relative level of TME per person for Wales was lower, at 111% of the English level in 2017-18.
-
5,000
10,000
15,000
20,000
25,000
30,000
35,000
40,000
45,000
2013-14 2014-15 2015-16 2016-17 2017-18
£ m
illio
n
Local government Welsh Government UK government

Wales Fiscal Analysis | Government Expenditure and Revenue Wales 2019 57
Figure 4.21 Relative spending per person for Wales (England = 100), 1999-00 to 2017-18
Source: ONS (2019) Country and Regional Public Sector Finances; HM Treasury (2018 and previous) Country and Regional Analysis and authors’ calculations
As outlined in the annex of the 2017 Fiscal Framework Agreement, the Welsh Government’s block grant funding per head against equivalent UK government funding per head in England is derived by taking the Welsh Government’s total Departmental Expenditure Limit before adjustments for tax devolution. Equivalent UK government funding for England is calculated by multiplying each UK government department’s DEL by the comparability factor used in the Barnett Formula.10 Non-domestic rates revenues are added in to the totals to reflect its devolution from 2015-16, with the added assumption that NDR revenues in Wales would have grown at the same rate per head as in England in the absence of devolution.
Figure 4.22 shows an attempt to reconcile the relative funding per person that Wales receives through the block grant (20% higher than in England) and total identifiable spending per person for Wales (15% higher than in England) in 2017-18. Funding from the Welsh Government DEL and non-domestic rates revenue amounted to £5,180 per person, and given this is 20% higher than in England, this would amount to £4,300 per person in England. To get to relative levels of identifiable spending per person, we add in spending financed by Council Tax, housing benefit grants to local authorities from the DWP and the Police Grant from the Home Office (all somewhat below the level in England per person). Wales receives considerably higher levels of European Union funding per person (361% of the English level). We also include UK government spending on social protection per person for Wales and the UK.
Adding these funding streams together, spending for Wales is around 119% of the English level. This means that for total identifiable spending per person for Wales to be only 115% of the English level, all other identifiable spending per for Wales will be approximately 64% of the level in England. This ‘other identifiable spending’ category will include non-social protection spending by the UK government, 10 Comparability factors reflect the proportion of each department’s spending on areas that are devolved to Wales.
100
105
110
115
120
125
En
gla
nd
= 1
00
Welsh Government 'Barnett' funding
Total identifiable expenditure
Total managed expenditure

58 Wales Fiscal Analysis | Government Expenditure and Revenue Wales 2019
annually managed expenditure by the Welsh Government, locally financed expenditure (e.g. borrowing and reserves), as well as reflecting other factors such as timing and coverage differences.
Figure 4.22 also shows non-identifiable spending per person assigned to Wales on the same population basis as the rest of the UK, as well as the accounting adjustment (including EU transactions). Total Managed Expenditure in Wales is 111% of the English level.
Figure 4.22 Total managed expenditure per person for Wales and England by source, 2017-18 (£ per person)
Source: ONS (2019) Country and Regional Public Sector Finances; HM Treasury (2018 and previous) Country and Regional Analysis and authors’ calculations
Block Grant
NDR
Council Tax
Housing benefit
Police grant
EU funding
UK gov social protection
Other identifiable spending
Defence
Public sector debt interest payments
Other non-identifiable
Accounting adjustment
-
2,000
4,000
6,000
8,000
10,000
12,000
14,000
Wales England
£ p
er
pe
rso
n
Total identifiablespending is 15% higher than in England
Total Managed Expenditureis 11% higher than in England
'Barnett' funding20% higher thanin England

Wales Fiscal Analysis | Government Expenditure and Revenue Wales 2019 59
4.3 International and regional comparisons
4.3.1 UK countries and regions
Per capita Total Managed Expenditure levels vary across the United Kingdom. This reflects differences in levels of relative need of the different populations. As shown in Figure 4.23, total spending per head in Northern Ireland has remained consistently higher than the UK level over the past two decades. However, between 1999-00 and 2017-18, per capita spending in Northern Ireland has started to converge with the UK average, falling from 126.9% to 117.6% of the UK level over this period.
In the second half of the last decade, a gap started to open between total spending in Scotland and Wales, a gap that has persisted to this day. In 2017-18, spending per head in Wales amounted to £13,030 compared to £13,626 for Scotland.
Between 2009-10 and 2011-12, spending per person increased by £139 in Wales, at a time when expenditure was falling elsewhere. Between 2011-12 and 2013-14, expenditure per head for Wales fell by £602.4 million (4.4%) in real terms.
The UK average tends to closely follow English trends given the relative size of England’s population.
Figure 4.23 Total Managed Expenditure per head (2017-18 prices), by UK country, 1999-00 to 2017-18
Source: ONS (2019) Country and Regional Public Sector Finances; ONS (2018 and previous) Mid-year population estimates and authors’ calculations
8,000
9,000
10,000
11,000
12,000
13,000
14,000
15,000
16,000
Northern Ireland Scotland Wales England United Kingdom

60 Wales Fiscal Analysis | Government Expenditure and Revenue Wales 2019
Figure 4.24 Total Managed Expenditure per head (2017-18 prices), by NUTS1 region, 2017-18
Source: ONS (2019) Country and Regional Public Sector Finances; ONS (2018 and previous) Mid-year population estimates and authors’ calculations

Wales Fiscal Analysis | Government Expenditure and Revenue Wales 2019 61
The ONS publishes TME data at a NUTS1 level. The map in Figure 4.24 displays expenditure per head by NUTS1 unit in 2017-18. With the exception of London (£13,071), Wales (£13,030) has higher expenditure levels per head than any other English region. The North East is the English region with the second highest per capita expenditure level at £12,570. The East of England is the region with the lowest expenditure per capita at £10,894. However, it should be highlighted that this data does not condition for levels of relative need of the population in the respective regions.
4.3.2 OECD countries
This section compares levels of spending for Wales with other OECD countries. The figures presented in the ONS Country and Regional Public Sector Finances report include data for the public sector as a whole, and on a financial year basis. In contrast, international organisations such as the European Commission and the International Monetary Fund (IMF) report countries’ finances on a calendar year basis and for general government only (excluding public corporations). Figure 4.15 presents total spending for Wales and the UK on this basis.
Figure 4.25 General Government expenditure, Wales and UK, 2017
£ million 2013 2014 2015 2016 2017
Wales
Current expenditure 34,712 35,143 35,486 36,150 37,230
Capital expenditure 2,834 2,784 2,875 2,877 3,044
Total Managed Expenditure 37,546 37,927 38,361 39,027 40,274
UK
Current expenditure 672,122 683,722 685,988 700,402 716,499
Capital expenditure 55,080 60,056 63,025 62,414 68,096
Total Managed Expenditure 727,202 743,778 749,013 762,816 784,595
Source: ONS (2019) Country and Regional Public Sector Finances; ONS (2018 and previous) Mid-year population estimates and authors’ calculations
Figure 4.26 provides a broad comparison of the levels of general government spending for Wales in 2016 with other OECD countries, on a US$ basis. Levels of general government spending per person vary significantly across countries, highlighting the variation in the delivery of public goods and services and social protection provision.
Estimated general government spending per person for Wales is relatively close to the average across OECD countries. The difference in spending per person between Wales and the UK average is relatively small compared with the much larger differences across OECD countries.
Meanwhile, Figure 4.27 shows levels of general government expenditure as a share of GDP across OECD countries. Wales’ significantly lower levels of GDP per person means this measure shows a very large difference between Wales and the UK. This phenomenon is likely to be replicated in other countries with large territorial GDP per capita inequalities.

62 Wales Fiscal Analysis | Government Expenditure and Revenue Wales 2019
Figure 4.26 General government expenditure per person, 2016 (US$ per person)
Source: OECD (2019) General Government Accounts and authors’ calculations. See Annex A for details of methodology.
0 10,000 20,000 30,000 40,000 50,000
Luxembourg
Norway
Denmark
Austria
Belgium
Finland
Sweden
France
Iceland
Netherlands
United States
Switzerland
Germany
Ireland
Wales
Italy
Canada
OECD Average
Australia
OECD Total
United Kingdom
Japan
Spain
New Zealand
Slovenia
Israel
Portugal
Czech Republic
Greece
Slovak Republic
Hungary
Estonia
Korea
Poland
Lithuania
Latvia
Colombia
Mexico
US$ per person

Wales Fiscal Analysis | Government Expenditure and Revenue Wales 2019 63
Figure 4.27 General government expenditure per person, 2016 (% of GDP)
Source: International Monetary Fund (2019) World Economic Outlook 2019 and authors’ calculations. See Annex A for details of methodology.
0 10 20 30 40 50 60 70
Wales
France
Finland
Belgium
Denmark
Norway
Austria
Sweden
Italy
Greece
Hungary
Slovenia
Portugal
Germany
Netherlands
Spain
Luxembourg
Slovak Republic
United Kingdom
Poland
Czech Republic
Estonia
Japan
Israel
United States
Latvia
Switzerland
Lithuania
Korea
Ireland
% of GDP

64 Wales Fiscal Analysis | Government Expenditure and Revenue Wales 2019
Outlook for revenues and expenditure
In previous chapters, published outturn data were used to analyse trends in Wales’ finances since 1999-00. In this chapter, we present projections of future revenues and expenditure up to 2023-24. We use the Office for Budget Responsibility’s (2019) latest forecasts for the UK as a whole, with assumptions about growth in revenues and spending on a Welsh level.
As with any projections, they are underpinned by several assumptions about relative economic performance, UK government fiscal policy and future demographic trends. In particular, the OBR forecasts were published in March 2019 (prior to the extension of Article 50) and are underpinned by the assumption that the UK would leave the EU on 29 March 2019 and enter a transition period until December 2020. Clearly, we now know that this did not transpire. However, there is no obvious alternative on which to base revenue and expenditure projections for Wales. The full methodology behind the projections made in this chapter can be found in Annex A of this report.
First, we present the outlook for Welsh revenues, both devolved and reserved. Second, we present future expenditure forecasts broken down by level of government. Third, we discuss forecast for Wales’ net fiscal balance. Lastly, we examine some of the factors that could influence these projections.
5
Key findings:
• Total revenues to Wales are expected to grow by an average of 3.5% a year in nominal terms between 2018-19 and 2023-24. This is slower than the average growth rate of 3.8% over the previous five-year period.
• Council Tax revenues are expected to grow strongly over the forecast period, increasing by 39.6% between 2017-18 and 2023-24.
• On a per capita, real terms basis, total expenditure is set to recover its 2011-12 level by 2023-24.
• After significant reductions in the size of Wales’ net fiscal deficit since 2009-10, it is now projected to reduce only slightly relative to estimated GDP, from 19.4% in 2017-18 to 18.3% in 2023-24.
• If Wales’ population was distributed across individual age groups in the same way as the UK average, projected total expenditure in 2022-23 would be over £1 billion lower and tax revenues would be nearly £500 million higher.
• Given considerable economic and political uncertainties, trends in total revenues and expenditure could deviate substantially from projections outlined in this chapter.

Wales Fiscal Analysis | Government Expenditure and Revenue Wales 2019 65
5.1 Outlook for revenues to Wales, 2018-19 to 2023-24
In this section, we present the outlook for devolved and reserved revenues to Wales up to 2023-24. Forecasts for most of the revenue sources are based on projections published by the OBR in their March 2019 Economic and Fiscal Outlook release.
As outlined in Figure 5.2 overleaf, total revenues to Wales are expected to grow by an average of 3.5% a year in nominal terms between 2018-19 and 2023-24. This is slower than the average growth rate of 3.8% over the previous five-year period. By 2023-24, total revenues to Wales are projected to reach £33.4 billion.
Box 5.1: Council Tax revenue forecasts
Council Tax revenue forecasts used here are underpinned by OBR projections, adjusted to account for actual Council Tax rates set for 2018-19 and 2019-20 (OBR+ / middle line). The baseline OBR projections (bottom line) assumed that Council Tax would grow by 4.2% in 2019-20 whilst the actual figure was 6.6%. If Council Tax continue to grow 2ppt higher than forecast each year up to 2023-24, this would raise an additional £163 million in 2023-24 (top line).
Figure 5.1 Total Council Tax revenue forecasts for Wales, 2017-18 to 2023-24
Source: ONS (2019) Country and Regional Public Sector Finances and authors’ calculations
1,400
1,500
1,600
1,700
1,800
1,900
2,000
2,100
2,200
2,300
2017-18 2018-19 2019-20 2020-21 2021-22 2022-23 2023-24
£ m
illio
n
OBR OBR+ OBR+ and faster growth

66 Wales Fiscal Analysis | Government Expenditure and Revenue Wales 2019
Figure 5.2
Projections of current revenue to Wales, 2018-19 to 2023-24 (excl. North Sea revenue)
£ million 2017-
18 2018-
19 2019-
20 2020-
21 2021-
22 2022-
23 2023-
24
Reserved revenues
Income tax (excl. WRIT from 19-20) 4,930 5,210 3,162 3,355 3,472 3,605 3,752
Corporation tax (excl. North Sea) 1,306 1,360 1,362 1,370 1,411 1,472 1,530
National insurance contributions 4,547 4,748 4,935 5,142 5,328 5,511 5,707
VAT 6,389 6,701 6,908 7,134 7,352 7,563 7,780
Fuel duties 1,344 1,357 1,363 1,400 1,442 1,484 1,525
All other revenues 3,776 3,912 4,110 4,192 4,282 4,398 4,566
Total reserved revenue 22,292 23,288 21,840 22,593 23,287 24,033 24,860
Share of total revenue 82.3% 82.5% 75.1% 74.9% 74.7% 74.6% 74.5%
Devolved and local revenues
Welsh Rates of Income Tax (WRIT) * * 2,101 2,229 2,313 2,398 2,487
Land Transaction Tax (LTT) * 231 231 244 267 292 319
Landfill Disposals Tax (LDT) * 36 33 30 28 26 25
Council Tax 1,485 1,570 1,686 1,775 1,870 1,969 2,073
Non-domestic rates (NDR) 1,031 1,022 1,033 1,063 1,083 1,105 1,126
Total devolved / local revenue 2,516 2,859 5,084 5,341 5,561 5,790 6,030
Share of total revenue 9.3% 10.1% 17.5% 17.7% 17.8% 18.0% 18.1%
Gross operating surplus 2,273 2,073 2,139 2,229 2,311 2,399 2,494
Total current revenue 27,081 28,220 29,063 30,163 31,159 32,222 33,384
Per capita (£ per head) 8,653 8,980 9,213 9,529 9,813 10,122 10,462
Source: Authors’ calculations, see Annex A for full methodology
Council Tax revenues are expected to grow strongly over the forecast period, continuing the trend set in recent years. Our forecast suggests that revenues from this source will grow by 39.6% between 2017-18 and 2023-24. As discussed in Box 5.1, if recent trends continue, growth in Council Tax rates may well outstrip the assumptions made in the OBR forecasts which underpin our projections.
Revenues from Income Tax and National Insurance contributions are also expected to see significant growth over the next five years. Our projections indicate that devolved and reserved Income Tax revenue will increase by 26.5%, and revenue from National Insurance Contributions will increase by 25.5% between 2017-18 and 2023-24. This would mark a reversal of recent trends which has seen Income Tax revenues falling, as explained in Chapter 3.
On a per capita basis and in the baseline scenario, revenues are projected to increase by £1,809 (17.3%) per person in nominal terms between 2017-18 and 2023-24. This is equivalent to a £694 (7.9%) increase in real terms.

Wales Fiscal Analysis | Government Expenditure and Revenue Wales 2019 67
Figure 5.3 Total current revenue to Wales, 1999-00 to 2017-18, and projections to 2023-24, by level of government (excl. North Sea revenue)
* Data based on projections
Source: Authors’ calculations, see Annex A for full methodology
Figure 5.3 offers a breakdown of revenues to Wales, by level of government. In 2023-24, the projected share of devolved and local revenue is set to reach £6.0 billion (18.1%). Even with no additional fiscal powers devolved to Wales from 2019-20, devolved revenue is projected to grow more quickly than reserved revenue, partly because of particularly strong growth forecast for Council Tax revenues over the period.
Full devolution of Business Rates
LTT and LDT replace Stamp Duty and
Landfill Tax
Partial devolution of Income Tax
0
5,000
10,000
15,000
20,000
25,000
30,000
35,000
40,000
£ m
illio
n
Reserved Devolved GOS

68 Wales Fiscal Analysis | Government Expenditure and Revenue Wales 2019
5.2 Outlook for expenditure for Wales, 2018-19 to 2023-24
According to the baseline projection based on OBR forecasts, total managed expenditure for Wales was set to fall by 0.1% in real terms in 2018-19 and then increase in real terms in each subsequent year of the forecast period. As illustrated in Figure 5.4, on a per capita, real-terms basis, spending will remain below its 2011-12 level until 2023-24. Per capita spending in Wales is set to recover its pre-austerity level faster than the United Kingdom as a whole, primarily because Wales’ population has been growing — and is expected to continue growing — more slowly than that of the UK as a whole.
As discussed in Chapter 4, spending per head for Wales has diverged away from the UK level since the start of austerity. The baseline projection forecasts that this divergence will continue over the next five years, with spending increasing from 108.4% of the UK level in 2017-18 to 110.0% in 2023-24 (the highest level since 2000-01).
Figure 5.5 overleaf offers a breakdown of baseline expenditure projections by year and broad function. Between 2017-18 and 2023-24, TME is expected to grow by £6.3 billion (23.0%) in nominal terms, averaging 3.5% a year. This is markedly lower than the annual increases in expenditure that were experienced over most of the last decade.
Devolved and local spending is projected to grow at a slightly quicker pace than reserved spending (averaging 4.0%), reflecting the strong growth in projected Council Tax revenue (and consequently, spending on local services) and the fact that current plans for health spending in England account for most of the increase in UK government departmental spending, which would result in additional Barnett consequentials for the Welsh Government.
Figure 5.4 Total managed expenditure per head for Wales and UK, 1999-00 to 2023-24 (2018-19 prices)
Source: Authors’ calculations, see Annex A for full methodology
8,000
9,000
10,000
11,000
12,000
13,000
14,000
15,000
Wales UK

Wales Fiscal Analysis | Government Expenditure and Revenue Wales 2019 69
Figure 5.5 Projections of current expenditure for Wales, 2018-19 to 2023-24
£ million 2017-
18 2018-
19 2019-
20 2020-
21 2021-
22 2022-
23 2023-
24
Reserved expenditure
Public sector debt interest 2,119 1,885 2,046 1,974 2,041 2,098 2,130
Defence 1,828 1,880 1,937 1,999 2,065 2,134 2,206
Social protection 11,618 11,816 12,024 12,250 12,627 13,088 13,622
Other 3,011 3,118 3,292 3,357 3,402 3,446 3,508
Total reserved expenditure 18,590 18,699 19,299 19,581 20,135 20,766 21,467
Share of total expenditure 45.6% 45.1% 44.8% 44.2% 44.0% 43.9% 43.8%
Devolved and local expenditure
Capital expenditure 2,196 2,352 2,559 2,780 2,918 3,020 3,199
Current expenditure 17,058 17,384 18,104 18,739 19,344 19,990 20,743
Accounting adjustments 2,467 2,608 2,653 2,724 2,939 3,017 3,098
Total devolved/local expenditure 22,193 22,752 23,761 24,744 25,610 26,488 27,556
Share of total expenditure 54.4% 54.9% 55.2% 55.8% 56.0% 56.1% 56.2%
Total managed expenditure 40,783 41,452 43,061 44,325 45,745 47,254 49,024
Per capita (£ per head) 13,032 13,191 13,651 14,003 14,407 14,844 15,364
Source: Authors’ calculations, see Annex A for full methodology
Figure 5.6 illustrates the annual change in TME for Wales since 1999-00 and up to the end of the forecast period. Figure 5.7 offers an illustrative overview of the various revenues and expenditure streams for Wales in 2019-20.

70 Wales Fiscal Analysis | Government Expenditure and Revenue Wales 2019
Fig
ure
5.6
A
nn
ua
l ch
an
ge
in t
ota
l ma
na
ge
d e
xp
en
dit
ure
fo
r W
ale
s: 1
99
9-0
0 –
20
17-1
8,
an
d p
roje
ctio
ns
to 2
023
-24
Sou
rce:
OB
R (2
019
) Cou
ntr
y a
nd
Reg
ion
al P
ublic
Sec
tor
Fin
an
ces;
pro
ject
ion
s ba
sed
on
aut
hor
s’ c
alc
ula
tion
s

Wales Fiscal Analysis | Government Expenditure and Revenue Wales 2019 71
Fig
ure
5.7
Il
lust
rati
ve r
eve
nu
e a
nd
ex
pe
nd
itu
re f
low
s fo
r W
ale
s, 2
019
-20
(e
xcl
ud
ing
acc
ou
nti
ng
ad
just
me
nts
)
Sou
rce:
Aut
hor
s’ c
alc
ula
tion
s; v
alu
es a
re il
lust
rati
ve o
nly
as
they
do
not
acc
oun
t fo
r so
me
reve
nue
an
d e
xpen
dit
ure
stre
am
s, s
uch
as
borr
owin
g a
nd
res
erve
s

72 Wales Fiscal Analysis | Government Expenditure and Revenue Wales 2019
5.3 Projected net fiscal balance, up to 2023-24
Using projections of total receipts, total managed expenditure and Welsh GDP, we can present a baseline forecast of Wales’ net fiscal balance up to 2023-24. Given considerable economic and political uncertainties, it should be stressed that actual trends in the size of the fiscal gap could well deviate substantially from projections outlined in this chapter. We assume GDP per person in Wales grows in line with the UK. Following the significant reduction in the size of the fiscal gap since 2009-10, it is now projected to remain relatively constant as a share of GDP, reducing slightly from 19.4% in 2017-18 to 18.1% in 2023-24. Although the nominal net fiscal balance appears larger in 2023-34 (£15.6 billion), this figure is unadjusted for inflation. The left axis of Figure 5.8 measures the net fiscal balance as a percentage of GDP, which allows for consistent comparisons across the time series.
The UK’s overall net fiscal balance is projected to remain negative over the forecast period, although the deficit is expected to fall to 0.6% of GDP by 2023-24, according to the OBR’s baseline projection, down from 10.32% in 2009-10.
Wales’ future net fiscal balance will be affected by future trends in total revenue (including tax revenues), total expenditure and GDP, which is based on the country’s overall economic activity level.
Figure 5.8 Net fiscal balance of Wales and UK as a share of GDP, 1999-00 to 2017-18, and projections to 2023-24
Source: Authors’ calculations. See Annex A for full methodology.
£5.2bn
£10.9bn
£15.9bn
£13.7bn £15.6bn
-35.0%
-30.0%
-25.0%
-20.0%
-15.0%
-10.0%
-5.0%
0.0%
5.0%
Ne
t fisc
al b
ala
nc
e a
s %
of
GD
P
Wales UK

Wales Fiscal Analysis | Government Expenditure and Revenue Wales 2019 73
5.4 Factors influencing the outlook for revenue and expenditure
5.4.1 Wales’ demographics and age profile
Future trends in revenue and expenditure for Wales will continue to be largely determined by fiscal policy at a UK level. However, trends in Wales’ population and age profile will also play a role. Faster population growth could see faster convergence in devolved spending levels between England and Wales as a result of the Barnett Squeeze. On the other hand, a slower-growing population in Wales, particularly the population aged 16-64, will mean that tax revenues per person will need to grow at a faster rate in Wales for total revenues to keep pace with the rest of the UK.
Box 5.2: What is the Barnett Squeeze?
The block grant consists of Wales’ prior year funding carried forward, plus a change to this amount as calculated by the Barnett formula. The aim of the Barnett formula is to provide the same pounds-per-person change in funding for the devolved governments as the change in funding for comparable public services in England.
An in-built property of the Barnett formula is that if spending is growing in England, it results in convergence in per person spending over time between England and Wales. This is because the same pounds-per-person increase in spending in England and Wales represents a smaller percentage increase in Wales (Poole and Ifan 2016: 10). Over time therefore, funding per head in Wales converges to English per capita spending on comparable programmes, irrespective of relative need. This is the infamous Barnett Squeeze effect, as emphasised by the Holtham Commission report (2010) in relation to total devolved spending.
The extent to which convergence in relative funding occurs depends on a number of factors. Rapid growth in spending in England accelerates convergence in relative funding, while lower spending growth reduces the rate of convergence. Decreases in spending in England cause a divergence in relative funding levels.
Relative population growth in Wales compared with England also determines the rate of convergence. This is because the Barnett formula only determines changes in the block grant, reflecting the latest population shares; the size of the previous year’s grant that constitutes the majority of the current grant is not adjusted to account for the new population ratio. If the Welsh population grows relatively slowly (as it has done for over a decade), the rate of convergence decreases.
As a result of the fiscal framework agreement of 2016 (HM Government & Welsh Government 2016), increments to the Welsh block grant triggered by the Barnett formula are now multiplied by a Needs-Based Factor (NBF) of 105%. This leads to larger increases in the Welsh block grant and thus limits the rate of convergence in relative spending levels.
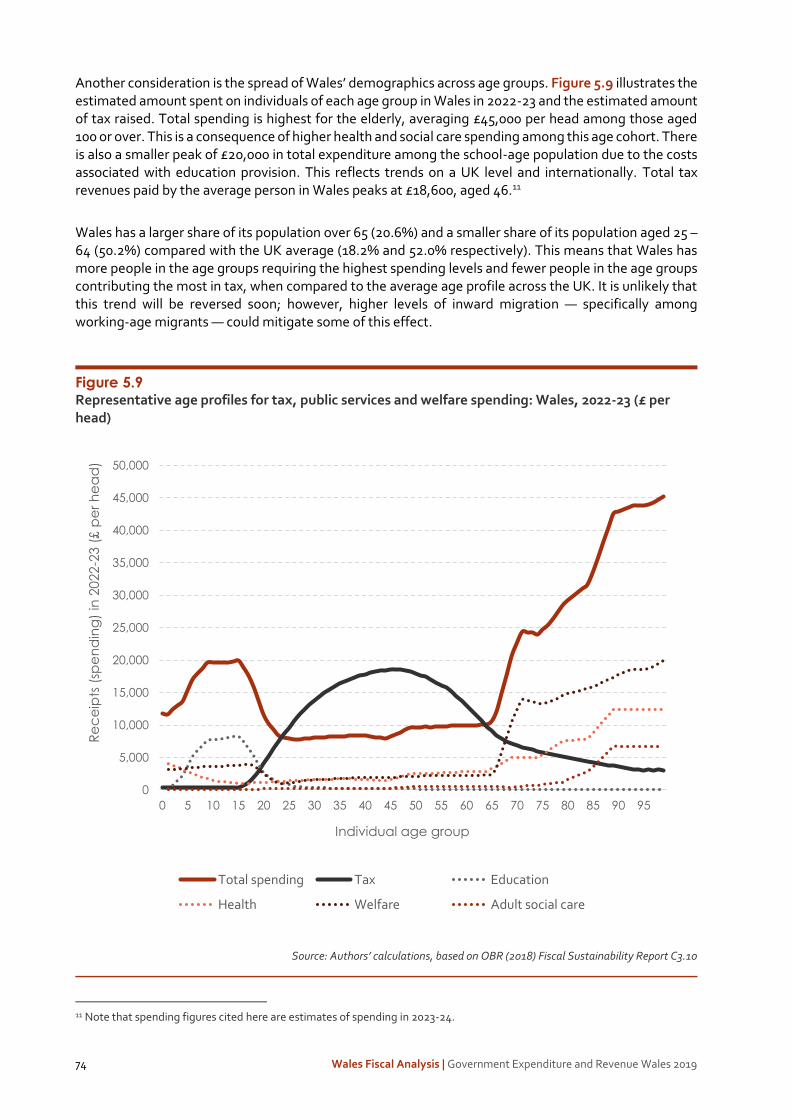
74 Wales Fiscal Analysis | Government Expenditure and Revenue Wales 2019
Another consideration is the spread of Wales’ demographics across age groups. Figure 5.9 illustrates the estimated amount spent on individuals of each age group in Wales in 2022-23 and the estimated amount of tax raised. Total spending is highest for the elderly, averaging £45,000 per head among those aged 100 or over. This is a consequence of higher health and social care spending among this age cohort. There is also a smaller peak of £20,000 in total expenditure among the school-age population due to the costs associated with education provision. This reflects trends on a UK level and internationally. Total tax revenues paid by the average person in Wales peaks at £18,600, aged 46.11
Wales has a larger share of its population over 65 (20.6%) and a smaller share of its population aged 25 – 64 (50.2%) compared with the UK average (18.2% and 52.0% respectively). This means that Wales has more people in the age groups requiring the highest spending levels and fewer people in the age groups contributing the most in tax, when compared to the average age profile across the UK. It is unlikely that this trend will be reversed soon; however, higher levels of inward migration — specifically among working-age migrants — could mitigate some of this effect.
Figure 5.9 Representative age profiles for tax, public services and welfare spending: Wales, 2022-23 (£ per head)
Source: Authors’ calculations, based on OBR (2018) Fiscal Sustainability Report C3.10
11 Note that spending figures cited here are estimates of spending in 2023-24.
0
5,000
10,000
15,000
20,000
25,000
30,000
35,000
40,000
45,000
50,000
0 5 10 15 20 25 30 35 40 45 50 55 60 65 70 75 80 85 90 95
Re
ce
ipts
(sp
en
din
g)
in 2
022
-23 (
£ p
er
he
ad
)
Individual age group
Total spending Tax Education
Health Welfare Adult social care

Wales Fiscal Analysis | Government Expenditure and Revenue Wales 2019 75
.
Box 5.3: What if Wales’ age profile matched the UK average?
If Wales’ population were to be distributed across individual age groups in the same way as the UK average, total expenditure would be over £1 billion lower and tax revenues would be nearly £500 million higher.
As shown in Figure 5.10, if Wales’ population had the same age profile as the UK average, the country would yield considerably more revenue from those aged 25-55. Conversely, total expenditure would be considerably lower among those aged 65-90, which would more than offset the increased spending on the school-age population.
Figure 5.10 Total expenditure (receipts), by age group in Wales, 2022-23
Source: Authors’ calculations, based on OBR (2018) Fiscal Sustainability Report C3.10
-
100
200
300
400
500
600
700
800
900
1,000
0 5 10 15 20 25 30 35 40 45 50 55 60 65 70 75 80 85 90 95
£ m
illio
n
Total spending (Wales age profile)
Tax (Wales age profile)
Total spending (UK age profile)
Tax (UK age profile)

76 Wales Fiscal Analysis | Government Expenditure and Revenue Wales 2019
5.4.2 Economic and policy uncertainty
The forecasts produced by the OBR and used for the projections in this chapter were made at a time of significant economic and political uncertainty. In fact, the assumptions underpinning the forecasts produced in March 2019 were that the UK would leave the European Union on 29 March 2019 and enter a transition period until December 2020; during which time there would be no change to the terms of trade between the two partners. Over the 10 years following the transition period, the OBR assumed slower import and export growth and lower inward migration trends. Of course, the UK has not left the European Union as projected by these forecasts, following an agreed six-month extension of the process to 31 October 2019.
The OBR has previously noted that a disorderly exit from the EU would have a ‘severe short-term impact on the economy’. Renewed uncertainty would further depress demand, raise inflation and the combination of a weaker pound and higher tariffs would result in higher import prices. Given the uncertainty around both the economic impact and the nature and effectiveness of any fiscal and monetary policy response, the OBR concludes that the effect on the public finances are currently unknowable. Such an economic hit would likely increase public sector spending (particularly social protection) and lower tax receipts, leading to higher borrowing levels from the UK government.
Even if the UK avoids a ‘No Deal’ scenario, UK government fiscal policy decisions could have a significant impact on the path of expenditure and revenues outlined above. At the Spring Statement in March 2019, the UK Chancellor Phillip Hammond announced that he would be commencing a Spending Review before the Summer recess, provided the UK leaves the European Union with a deal. This Spending Review would have set firm departmental spending totals for the next three fiscal years, but has since been delayed.
The spending projections used in this chapter are based on indicative UK government spending plans for the years to 2023-24 provided to the OBR for their forecasts. The government has already committed an extra £20.5 billion a year to NHS England by 2023-24 which — along with existing commitments on defence and international aid — provide a path for more than half of day-to-day spending. On current projections, spending outside these areas would continue to fall slightly in real terms. The state of UK public finances does however leave some fiscal head-room: the UK government’s ‘fiscal mandate’ requires the structural deficit to be below 2 per cent of GDP by 2020-21, and on current OBR forecasts, it is set to be around £26.6 billion lower than this target in 2020-21. Several suggestions made during the 2019 Conservative leadership election suggests the incoming Prime Minister may well consider increasing planned spending on priorities such as education or introducing substantial tax cuts, paid for by increased borrowing.12 Future UK government spending decisions will influence the size of the Welsh budget, and tax cuts could also have different effects on Welsh current revenues given the differences in the tax base explored in Chapter 3.
A final assumption is that GDP per person in Wales grows in line with UK forecasts. Faster or slower growth in per person GDP in Wales could influence the Welsh tax base, some spending areas, as well as the size of Wales’ net fiscal balance relative to the size of the economy. For the devolved and local government taxes, slower or faster relative growth in the Welsh tax base will have a negative impact on future growth in devolved spending. However, for the most part, slower or faster growth in the Welsh tax base would influence Wales’ net fiscal balance, since most spending is influenced by UK government fiscal policy.
12 Sibieta, L. (2019) Extra spending on education in England – the numbers explained, Institute for Fiscal Studies. Available at: https://www.ifs.org.uk/publications/14194 Johnson, P. (2019) Promises, promises: Tory leadership candidates are horrifying Whitehall, Institute for Fiscal Studies. Available at: https://www.ifs.org.uk/publications/14159

Wales Fiscal Analysis | Government Expenditure and Revenue Wales 2019 77
Methodology
Accounting adjustments
An accounting adjustment is introduced alongside the estimate of Total Expenditure on Services to produce a measure of expenditure on a Total Managed Expenditure basis. The main difference between TES and TME is that TES does not include general government capital consumption and does not reverse the deduction of certain VAT refunds in the budget-based expenditure. It also contains several items that are in budgets but are not in TME.
The accounting adjustments required to reconcile TME and TES for Wales are set out in Figure A1. As shown in the bottom row of the table, these adjustments largely cancel each other out on the expenditure and revenue sides of the fiscal balance calculation.
Figure A1 Accounting adjustments (excluding EU transactions): Wales, 2017-18
£ million
Expenditure Revenue Revenue line
Current expenditure Central government capital consumption
462 462 Gross Operating Surplus
Local government capital consumption
1,130 1,130 Gross Operating Surplus
Current VAT refunds 794 794 VAT
Imputed subsidy from LA to the HRA 171 n/a
Imputed flows for Renewable Obligation Certificates
305 305 Other taxes, royalties and adjustments
Local authority pensions 4 n/a
Current expenditure residual - 76 n/a
Capital expenditure
Capital VAT refunds 114 114 VAT
Network Rail 2 - n/a
Housing associations 264 - n/a
Other items and capital residual -46 - n/a
Total accounting adjustment (excl. EU Transactions)
3,124 2,805
Source: ONS (2019) Country and Regional Public Sector Finances and authors’ calculations
A

78 Wales Fiscal Analysis | Government Expenditure and Revenue Wales 2019
Apportioning revenues and expenditure to Wales
There is no formally agreed set of accounting concepts and definitions for the formulation of country or regional fiscal accounts in the UK. Several key elements of data are necessary for constructing such accounts are also unavailable at a disaggregated level. In this report, revenues and expenditure are apportioned to Wales on the basis presented by the ONS in their Country and Regional Public Sector Finances release (2019). Expenditure is determined to be for Wales if the benefit of the service derived from the expenditure is thought to accrue to the residents of Wales. Revenue is allocated according to whether the financial burden falls on residents or enterprises in Wales. Further information on the ONS’ approach to accounting can be found in Chapter 1.
As most public sector revenue in the UK is collected centrally, the general approach is to take UK level
data and apportion revenues to Wales using available data and various methodologies. Estimates of
Welsh revenues based on survey data will be subject to a degree of uncertainty. For example, based on
underlying HMRC data, the lower 95% confidence interval for Welsh income taxes is £110m below the
central estimate, while the upper 95% confidence interval is £110 million above. However, such
confidence intervals are not reported in the ONS data and are therefore not included in this report.
Classification of the Functions of Government (COFOG)
The Classification of the Functions of Government (COFOG) is a general classification of government
functions as defined by the United Nations Statistics Division to facilitate easier comparisons between
countries. As Figure A2 illustrates, first-level COFOG splits expenditure into ten ‘functional’ groups and
second level COFOG further splits each level into sub-groups.
Figure A2 Breakdown of COFOG functions by first and second level
First-level COFOG Second-level COFOG
1. General public services • Executive and legislative organs, financial and fiscal affairs, external affairs
• Foreign economic aid
• General services
• Basic research
• R&D general public services
• General public services n.e.c
• Public debt transactions
• Transfers of a general character between levels of government
2. Defence • Military defence
• Civil defence
• Foreign military aid
• R&D defence
• Defence n.e.c
3. Public order and safety • Police services
• Fire-protection services
• Law courts
• Prisons
• R&D public order and safety
• Public order and safety n.e.c.

Wales Fiscal Analysis | Government Expenditure and Revenue Wales 2019 79
4. Economic affairs • General economic, commercial and labour affairs
• Agriculture, forestry, fishing and hunting
• Fuel and energy
• Mining, manufacturing and construction
• Transport
• Communication
• Other industries
• R&D economic affairs
• Economic affairs n.e.c
5. Environmental protection • Waste management
• Wastewater management
• Pollution abatement
• Protection of biodiversity and landscape
• R&D environmental protection
• Environmental protection n.e.c.
6. Housing and community amenities • Housing development
• Community development
• Water supply
• Street lighting
• R&D housing and community amenities
• Housing and community amenities n.e.c
7. Health • Medical products, appliances and equipment
• Outpatient services
• Hospital services
• Public health services
• R&D health
• Health n.e.c
8. Recreation, culture and religion • Recreational and sporting services
• Cultural services
• Broadcasting and publishing services
• Religious and other community services
• R&D recreation, culture and religion
• Recreation, culture and religion n.e.c.
9. Education • Pre-primary and primary education
• Secondary education
• Post-secondary non-tertiary education
• Tertiary education
• Education not definable by level
• Subsidiary services to education
• R&D education
• Education n.e.c.
10. Social protection • Sickness and disability
• Old age
• Survivors
• Family and children
• Unemployment
• Housing
• Social exclusion n.e.c.
• R&D social protection
• Social protection n.e.c.
n.e.c: “not elsewhere classified”
Source: OECD (2011) Government at a Glance

80 Wales Fiscal Analysis | Government Expenditure and Revenue Wales 2019
GDP estimates for Wales
Public finance statistics are often presented as a share of GDP. GDP is a measure of the value added in the production of goods and services within a country’s borders, including the value added in the production of intermediate inputs. By controlling for the size of the economy, these statistics can help illustrate the relative size of fiscal aggregates between countries and between different years.
In June 2019, the ONS announced plans to release quarterly GDP estimates for Wales and each region of England calculated almost exclusively using VAT returns. These figures are expected to be available from September 2019.13 In order to facilitate comparisons with other publications and countries, this report estimates Welsh GDP based on GVA. These figures should be viewed as rough approximations only.
The ONS currently produces annual Regional Accounts containing estimates of Welsh GVA (balanced). GDP equates to GVA plus taxes less subsidies on products.
Wales’ GVA data is first converted from calendar years into financial years. From these, Wales’ share of UK GVA for each financial year is calculated. These shares are then applied to UK GDP figures. This methodology essentially assumes that Wales’ share of UK taxes less subsidies on products equates to Wales’ share of UK GVA. Estimates of GDP for Wales are presented in Figure A3.
Figure A3 GDP approximations for Wales, 2013-14 to 2017-18
£ million
2013-14 2014-15 2015-16 2016-17 2017-18
UK GDP14 1,781,350 1,855,049 1,912,472 1,989,398 2,067,387
Estimated Wales GDP 61,621 63,257 65,524 68,226 70,651
Wales share of UK GVA15 3.5% 3.4% 3.4% 3.4% 3.4%
Source: Authors’ calculations
The GDP figures cited in Chapter 5 of this report for 2018-19 onwards are projections. These are calculated by assuming that per person growth in Welsh GDP tracks per person growth in forecast UK GDP. Projections of Welsh GDP from 2018-19 to 2023-24 are presented in Figure A4.
Figure A4 GDP projections for Wales, 2018-19 to 2023-24
£ million
2018-19 2019-20 2020-21 2021-22 2022-23 2023-24
UK GDP16 2,130,611 2,199,839 2,274,802 2,355,229 2,439,946 2,528,665
Estimated Wales GDP 72,659 74,860 77,243 79,797 82,465 85,254
Source: Authors’ calculations
13 https://www.ons.gov.uk/news/news/newgdpestimateswillrevealtheeconomichealthofthenationsandregions 14 Taken from ONS (March 2019) Quarterly National Accounts 15 Share of UK GVA (including Extra-Regio i.e. GVA that can’t be assigned to regions) 16 Taken from OBR (March 2019) Economic and Fiscal Outlook

Wales Fiscal Analysis | Government Expenditure and Revenue Wales 2019 81
General government estimates
The headline GERW figures cover the whole of the public sector. As such, they include revenue and expenditure associated with public corporations such as Cardiff International Airport and Cardiff City Transport Services Ltd. They are also presented on a financial year basis. When conducting international comparisons, bodies such as the International Monetary Fund (IMF) and Organisation for Economic Co-operation (OECD) present figures on a calendar year basis and covering only general government (i.e. excluding public corporations).
In order to aid comparisons with such figures, the table below presents total revenues and expenditure for Wales on this basis. As revenue and expenditure are primarily estimated on a financial year and public sector basis, the calendar year estimates in Figure A5 below are approximations only. General Government figures for the UK are taken from the ONS (2019) Public Sector Finances February 2019 publication. Wales is then apportioned a population share of Public Corporations expenditure and revenue, which is subtracted from the ONS’ public sector estimates.
Figure A5 General Government expenditure and receipts, Wales and UK, 2013-2017
£ million 2013 2014 2015 2016 2017
Wales
Total current receipts 22,799 23,619 24,222 25,423 26,588
Total managed expenditure 37,546 37,927 38,361 39,027 40,274
Current expenditure 34,712 35,143 35,486 36,150 37,230
Capital expenditure 2,834 2,784 2,875 2,877 3,044
United Kingdom
Total current receipts 633,161 645,201 669,457 705,740 746,489
Total managed expenditure 727,202 743,778 749,013 762,816 784,595
Current expenditure 672,122 683,722 685,988 700,402 716,499
Capital expenditure 55,080 60,056 63,025 62,414 68,096
Source: ONS (2019) Country and Regional Public Sector Finances; ONS (2018 and previous) Mid-year population estimates and authors’ calculations
For international comparisons, we use OECD National Accounts data. There are some differences between the OECD and ONS data. For example, some figures (mainly related to social security and public sector pensions) are presented on a net basis in UK public sector finances data but on a gross basis in OECD figures. This means that figures for both expenditure and revenue for the UK are slightly higher in OECD data. To get Welsh estimates on a comparable basis, Wales’ share of general government expenditure and revenue from Figure A5 is applied to UK figures from the OECD data.

82 Wales Fiscal Analysis | Government Expenditure and Revenue Wales 2019
Projections methodology
Revenue projections
The forecasts presented in Chapter 5 are largely underpinned by projections made by the OBR in their Economic and Fiscal Outlook release (March 2019). For most taxes, we assume that per capita growth in Welsh revenues will track per capita percentage growth on a UK level (using OBR projections of UK revenues). It is worth emphasising that the projections published by the OBR are predicated on the assumption that the UK would leave the EU with a deal in March 2019 and immediately enter a two-year transition period.
Forecast revenue from the Welsh Rates of Income Tax and Aggregates Levy are based on the OBR’s Devolved Tax Revenue projections, published in March 2019. For Land Transaction Tax and Landfill Disposals Tax, provisional data published by the Welsh Revenue Authority on 25 April 2019 was used for 2018-19. For subsequent years, the forecasts were generated by applying the percentage year-on-year change projected in the Devolved Tax Revenue forecasts published by the OBR.
Council Tax projections were made using data on Band D equivalent dwellings and rates for 2018-19 and 2019-20, adjusted to account for historical collection rates. For subsequent years, the forecasts were generated by applying the percentage year-on-year change projected for Wales is the OBR’s Economic and Fiscal Outlook (March 2019) release.
When per capita figures are used, they are based on the ONS’ principal population projections, adjusted to give mid-financial year estimates, as presented in Figure A6 below.
Figure A6 Mid-financial year population estimates: Wales and UK, 2018-19 to 2023-24
2018-19 2019-20 2020-21 2021-22 2022-23 2023-24
Wales 3,142,373 3,154,407 3,165,479 3,175,252 3,183,401 3,190,864
UK 66,566,086 66,964,200 67,344,991 67,702,607 68,043,436 68,370,212
Source: Authors’ calculations based on ONS (2016-based) Principal population projections
Expenditure projections
The OBR’s March 2019 Economic and Fiscal Outlook release contains forecasts for the UK’s Resource Departmental Expenditure Limit (DEL) up to 2023-24. To get an estimate of the departmental allocations, we use figures published in July 2018 on the NHS England funding settlement and assume spending on defence and international development are maintained as a constant share of the UK economy over future years.17 Deducting these elements from the total gives an estimate of future changes in the DEL for all other departments. We assume that the changes are distributed evenly across these departments.
17 The five-year NHS funding plan for England is available here: https://www.gov.uk/government/news/prime-minister-sets-out-5-year-nhs-funding-plan

Wales Fiscal Analysis | Government Expenditure and Revenue Wales 2019 83
By calculating annual cash-changes for each department, we apply a model of the Barnett formula so that the Wales DEL grows by a population share of changes in spending in England on programmes devolved to Wales, adjusted by the needs-based factor of 105%. This gets us to an estimate of the amount made available in the Welsh Government DEL through the block grant, up to 2023-24.
Lastly, we add projections of NDR, Council Tax and police grant revenue, according to the methodology described in the previous section, to get to an estimate of devolved and local spending, up to 2023-24.
Reserved UK government expenditure mainly covers social security spending. We assume that spending per person on benefits grows at the same per person rate for Wales as the UK as a whole. For some age-related spending, such as on pensions, we assume spending for Wales grows at the same per-person-over-65 rate.

84 Wales Fiscal Analysis | Government Expenditure and Revenue Wales 2019
Glossary
Accounting adjustment: the difference between Total Expenditure on Services provided in the CRA
and Total Managed Expenditure. The largest element of the accounting adjustment is capital
consumption (depreciation). The accounting adjustment is largely offset by balancing items on the
revenue side and thus does not have a significant effect on the net fiscal balance.
Annually Managed Expenditure (AME): components of government expenditure that are largely
driven by demand and macroeconomic indicators. On a UK level, AME spending includes most social
security payments and debt interest. Spending on these areas is more difficult for a government to plan
in advance.
Capital consumption: the amount of assets used up in an accounting period as a result of normal wear
and tear, foreseeable obsolescence and losses from accidental damage.
Capital expenditure: spending on investment including the provision, acquisition and enhancement of
fixed assets such as land, buildings and vehicles.
Common Agricultural Policy (CAP): a European Union policy that provides financial support to farmers
in member states.
Country and Regional Analysis (CRA): an annual dataset published by HM Treasury aimed at
identifying where resources were spent depending on where those who benefitted were located.
Classification of the Functions of Government (COFOG): a general classification of government
functions defined by the United Nations Statistic Division to facilitate easier comparisons between
countries.
Current budget balance: the difference between current revenues (including taxes on capital) and
current expenditure (including capital consumption). This measures the extent to which current Welsh
taxpayers meet the cost of paying for the public services they consume in the current year. Excluded
from this is capital investment by the public sector. The current budget balance is often seen as an
indicator of intergenerational fairness and of the sustainability of current policies.
Current expenditure: the sum of current expenditure by central and local government, as well as
interests and dividends payable by public corporations to the private sector and abroad. Public sector
current expenditure is net of any transfers between parts of the public sector. It includes items such as
public sector salaries and transfer payments.
Current revenue: revenues raised by the public sector from taxation and other sources, excluding the
sale of assets or interest received.
B

Wales Fiscal Analysis | Government Expenditure and Revenue Wales 2019 85
Departmental Expenditure Limits (DELs): spending on items that can be planned over extended
periods and are not overly demand-driven. The UK government’s DEL expenditure is subject to limits
set in Spending Reviews.
Depreciation: See Capital consumption.
European Structural and Investment Funds: a European Union programme aimed at rebalancing
regional social and economic disparities in member states by providing funds to promote economic
development.
European System of Accounts 2010 (ESA10): The newest, internationally compatible, EU accounting
framework for a systematic and detailed description of an economy. This is the basis on which accounts
are estimated for Wales in this report.
European Union (EU) Transactions: public sector transactions with the EU, excluding those associated
with customs duties. See Chapter 4 for further information about how EU Transactions are treated in
this report.
Fiscal framework: the set of rules and institutions that are used to set and coordinate sustainable
public policy. The December 2016 fiscal framework agreement between the UK and Welsh Government
set out the legislative framework for the devolution of tax and borrowing powers to Wales and the
mechanism for calculating the block grant adjustment.
Government Expenditure and Revenue Scotland (GERS): an annual publication by the Scottish
Government that estimates the contribution of revenue raised in Scotland toward the goods and
services provided for the benefit of Scotland.
Gross Disposable Household Income (GDHI): the amount of money that all the individuals in the
household sector have available for spending or saving after income distribution measures (for
example, taxes, social contributions and benefits) have taken effect.
Gross Domestic Product (GDP): a measure of the value added in the production of goods and services
within a country’s borders before providing for capital consumption. This includes the value added in
the production of intermediate inputs, even if the final goods are produced outside of Wales. It is
commonly used to measure the size of a country’s economy.
Gross Operating Surplus (GOS): the surplus generated by operating activities after the labour factor
input has been recompensed. This is largely offset by the depreciation component of the accounting
adjustment on the expenditure side. For public corporations, such as Cardiff International Airport, GOS
includes their gross trading surplus and various revenue streams.
Gross Value Added (GVA): the value generated by any unit engaged in the production of goods and
services.
Identifiable expenditure: spending which can be identified as benefitting particular countries or
regions in the CRA.
Landfill Disposals Tax (LDT): a tax on waste disposed of to landfill that is collected by the Welsh
Revenue Authority. LDT replaced Landfill Tax when it was devolved to Wales in 2018-19.

86 Wales Fiscal Analysis | Government Expenditure and Revenue Wales 2019
Land Transaction Tax (LTT): a tax on property transactions that is collected by the Welsh Revenue
Authority. LTT replaced Stamp Duty Land Tax when it was devolved to Wales in 2018-19.
Local government: all 22 local authorities in Wales, three national parks and three fire and rescue
authorities. Most expenditure by police forces is also categorised as local government spending in the
CRA data published by the UK Treasury.
National Accounts: a full set of economic accounts, produced by the ONS, that record and describe
economic activity in the UK.
Net Fiscal Balance: the difference between estimated total public sector spending for Welsh residents
and estimated total public sector revenue raised in Wales. At the UK level this gap between revenue
and expenditure will be reflected by public sector borrowing (or saving). In Wales however, this gap
reflects its place in the overall fiscal position of the UK public sector.
Net investment: total public sector expenditure less capital consumption.
Non-identifiable expenditure: spending which is deemed to be incurred on behalf of the UK as a whole
in the CRA.
Nomenclature of Territorial Units for Statistics (NUTS): a geocode standard by Eurostat for
referencing the subdivisions of the UK for statistical purpose. There are 12 first level (NUTS1) regions
within the UK: Wales, Scotland and Northern Ireland as well as 9 English regions: North East, North
West, Yorkshire and the Humber, East Midlands, West Midlands, East of England, London, South East
and South West.
Office for Budget Responsibility (OBR): an arm’s length body set up as an independent fiscal
watchdog to forecast public spending. It is mandated by law to scrutinise the UK government’s fiscal
targets, costing of Budget measures and produce forecasts for the economy and public finances,
including forecasts of devolved tax revenue.
Office for National Statistics (ONS): a public body which provides independent authoritative statistics
for the UK.
Organisation for Economic Co-ordination and Development (OECD): an intergovernmental
economic organisation aimed at stimulating economic progress and world trade. In 2018, the
organisation had 36 member countries. Most OECD members are high-income economies and are
regarded as developed countries.
Outturn: expenditure (revenue) actually incurred (received) to date.
Public Corporations: a sector from the National Accounts which consist of publicly controlled market
entities.
Public Expenditure Statistical Analyses (PESA): an annual statistical exercise which provides
information on government spending by Department, function and region over a number of years.
Public sector debt interest: interest payable by the UK government to holders of government bonds.
This is the cost of servicing public sector debt.

Wales Fiscal Analysis | Government Expenditure and Revenue Wales 2019 87
Public sector expenditure: total amount spent by the UK government, Welsh Government and local
authorities on programmes in Wales.
Public Sector Finances (PSF): a monthly statistical release on the public sector produced jointly by the
ONS and HM Treasury.
Spending Review: a review of future UK government spending plans held every few years. Spending
Reviews set out the proposed Resource (Current) and Capital DEL limits for each government
department for future years.
Total Expenditure on Services (TES): an aggregate used in CRA to analyse public sector expenditure.
Total Managed Expenditure (TME): a definition of total expenditure in the UK public finances that
covers all current and capital spending carried out by the public sector. It comprises the sum of DEL and
AME, less depreciation.
Welsh Block Grant: the portion of funds allocated to Wales to fund devolved programmes.
Welsh Rates of Income Tax (WRIT): the portion of Income Tax revenue devolved to the Welsh
Government as set out in the Wales Act (2016).
Welsh Revenue Authority (WRA): the tax collection agency set up to administer LTT and LDT in
Wales.

88 Wales Fiscal Analysis | Government Expenditure and Revenue Wales 2019
Notes
_______________________________________________________________________________________
_______________________________________________________________________________________
_______________________________________________________________________________________
_______________________________________________________________________________________
_______________________________________________________________________________________
_______________________________________________________________________________________
_______________________________________________________________________________________
_______________________________________________________________________________________
_______________________________________________________________________________________
_______________________________________________________________________________________
_______________________________________________________________________________________
_______________________________________________________________________________________
_______________________________________________________________________________________
_______________________________________________________________________________________
_______________________________________________________________________________________
_______________________________________________________________________________________
_______________________________________________________________________________________
_______________________________________________________________________________________
_______________________________________________________________________________________
_______________________________________________________________________________________
_______________________________________________________________________________________
_______________________________________________________________________________________
_______________________________________________________________________________________
_______________________________________________________________________________________

Wales Fiscal Analysis | Government Expenditure and Revenue Wales 2019 89
_______________________________________________________________________________________
_______________________________________________________________________________________
_______________________________________________________________________________________
_______________________________________________________________________________________
_______________________________________________________________________________________
_______________________________________________________________________________________
_______________________________________________________________________________________
_______________________________________________________________________________________
_______________________________________________________________________________________
_______________________________________________________________________________________
_______________________________________________________________________________________
_______________________________________________________________________________________
_______________________________________________________________________________________
_______________________________________________________________________________________
_______________________________________________________________________________________
_______________________________________________________________________________________
_______________________________________________________________________________________
_______________________________________________________________________________________
_______________________________________________________________________________________
_______________________________________________________________________________________
_______________________________________________________________________________________
_______________________________________________________________________________________
_______________________________________________________________________________________
_______________________________________________________________________________________
_______________________________________________________________________________________
_______________________________________________________________________________________

90 Wales Fiscal Analysis | Government Expenditure and Revenue Wales 2019
_______________________________________________________________________________________
_______________________________________________________________________________________
_______________________________________________________________________________________
_______________________________________________________________________________________
_______________________________________________________________________________________
_______________________________________________________________________________________
_______________________________________________________________________________________
_______________________________________________________________________________________
_______________________________________________________________________________________
_______________________________________________________________________________________
_______________________________________________________________________________________
_______________________________________________________________________________________
_______________________________________________________________________________________
_______________________________________________________________________________________
_______________________________________________________________________________________
_______________________________________________________________________________________
_______________________________________________________________________________________
_______________________________________________________________________________________
_______________________________________________________________________________________
_______________________________________________________________________________________
_______________________________________________________________________________________
_______________________________________________________________________________________
_______________________________________________________________________________________
_______________________________________________________________________________________
_______________________________________________________________________________________
_______________________________________________________________________________________


Wales Fiscal Analysis
Cardiff University
Law Building
Museum Avenue
Cardiff CF10 3AX
www.cardiff.ac.uk/wales-governance-centre