governance the philippines in a global context …
TRANSCRIPT

1
GOVERNANCE THE PHILIPPINES IN A GLOBAL CONTEXT –
EVIDENCE FROM GLOBAL GOVERNANCE INDICATORS
Lino Briguglio, Carmen Saliba and Melchior Vella
University of Malta

2
CONTENTS
ABSTRACT .............................................................................................................................. 4
1. INTRODUCTION........................................................................................................... 5
2. LITERATURE ON GOVERNANCE AND ECONOMIC PERFORMANCE ......... 5
2.1 Governance and Economic Performance .................................................................. 5
2.1.1 Governance and GDP per capita ................................................................................ 6
2.1.2 Governance and economic growth .............................................................................. 6
2.2 Governance in the Philippines .................................................................................... 7
3. THE PHILIPPINE POLITICAL GOVERNANCE SCORES COMPARED ........... 8
3.1 The Worldwide Governance Indicators (WGI) ........................................................ 9
3.1.1 The WGI: Global Comparisons ................................................................................... 9
3.1.2 The WGI: Correlation with Income and Growth ....................................................... 10
3.2 The Corruption Perception Index ............................................................................ 10
3.2.1 The CPI: Global Comparisons .................................................................................. 10
3.2.2 The CPI: Correlation with Income and Growth ........................................................ 10
3.3 The Economic Freedom of the World Indictors, component 2 (EFW-2).............. 11
3.3.1 The EFW-2: Global Comparisons ............................................................................. 11
3.3.2 The EFW-2: Correlation with Income and Growth ................................................... 11
4. THE PHILIPPINE ECONOMIC GOVERNANCE SCORES COMPARED ........ 11
4.1 Macroeconomic Stability Component of the Economic Resilience Index (ERI-
STB) .................................................................................................................................... 12
4.1.1 The ERI-STB : Global Comparisons ......................................................................... 12
4.1.2 The ERI:STB Correlation with economic aggregates ............................................... 12
4.2 Components 1,3,4 & 5 of the Economic Freedom of the World Index ................. 13
4.2.1 The EFW(1345): Global Comparisons ...................................................................... 13
4.2.2 The EFW-1345: Correlation with economic aggregates........................................... 13
4.3 Macroeconomic Environment Index of the Global Competitiveness Indicators
(GCI-MCE) ........................................................................................................................ 13
4.3.1 The GCI-MCE: Global Comparisons ........................................................................ 14
4.3.2 The GCI-MCE: Correlation with economic aggregates ........................................... 14
5. THE PHILIPPINE SOCIAL GOVERNANCE SCORES COMPARED ................ 14
5.1 The Health Sub-Index of the Human Development Index ..................................... 15
5.1.1 The HDI-HLT: Global Comparisons ......................................................................... 15
5.1.2 The HDI-HLT: Correlation with economic aggregates ............................................ 15
5.2 The Education Sub-Index of the Human Development Index ............................... 15
5.2.1 The HDI-EDU: Global Comparisons ........................................................................ 16
5.2.2 The HDI-EDU: Correlation with economic aggregates ........................................... 16

3
5.3 The Gini Index of Income Inequality ....................................................................... 16
5.3.1 GINI Index: Global Comparisons ............................................................................. 16
5.3.2 GINI Index: Correlation with economic aggregates ................................................. 16
6. THE MAIN TENDENCIES THAT EMERGE FROM THE INDICATORS ......... 17
6.1 Overall Comments with regard to Philippine Political Governance ..................... 17
6.2 Overall Comments with regard to the Philippine Economic Governance............ 17
6.3 Overall Comments with regard to the Philippine Social Governance .................. 17
6.4 Overview of the Nine Governance Indicators ......................................................... 18
7. MAIN IMPLICATIONS AND CONCLUSIONS ...................................................... 18
7.1 Correlation between Governance, GDP per Capita and growth ........................... 18
7.1.1 Governance and GDP per capita .............................................................................. 18
7.1.2 Governance and Economic Growth ........................................................................... 18
7.2 Implications for the Philippines ................................................................................ 19
REFERENCES ....................................................................................................................... 20

4
GOVERNANCE IN THE PHILIPPINES IN A GLOBAL CONTEXT –
EVIDENCE FROM GLOBAL GOVERNANCE INDICATORS
Lino Briguglio, Carmen Saliba and Melchior Vella
University of Malta
ABSTRACT
The paper assesses the state of governance in the Philippines by comparing it with other
countries utilising nine indicators relating to political, economic and social governance. The
main finding is that the Philippines receives high scores for economic governance and
relatively low scores for political and social governance. The study also correlates these
indices with GDP per capita and economic growth, so as to comment on the presumption that
good political, economic and social governance is associated with these two variables. All the
nine governance scores are positively associated with GDP per capita, but not with economic
growth. The paper summarises the main findings derived from the indicators, on the basis of
which it proposes a number of implications relating to the Philippine economy.
JEL Classification: O16- Economic Development and Governance; O43 - Institutions and
Growth; E02 – Institutions and the Macroeconomy; I00 - Health, Education, and Welfare:
General; O15 - Economic Development and Income Distribution; P14 Property Rights.

5
1. INTRODUCTION
The objective of this paper is to assess the state of governance in the Philippines by
comparing it with other countries utilising nine indicators relating to political, economic and
social governance.
The indicators relating to political and legal governance used in this study are (i) the
Worldwide Governance Indicators, (ii) the Corruption Perception Index, and (iii) the Legal
Structure and Property Rights Index of the Economic Freedom of the World Index.
The indicators relating to economic governance are (i) the Macroeconomic Environment
Index (Pillar 3) of the Global Competitiveness Indicators, (ii) An average of areas 1, 3, 4 and
5 of the Economic Freedom of the World Index, and (iii) the Macroeconomic Stability sub-
index of the Economic Resilience Index. The title of these three indices does not directly
refer to governance, but they are strongly related to economic policy, which is itself
associated with economic governance. It should be noted that the economic indicators do not
include GDP per capita or economic growth, as these are considered to be outcomes of the
policies utilised for the indices.
The three indicators that relate to social governance used in this study are (i) the Education
sub-index of the Human Development Index (HDI), (ii) the health sub-index of the HDI and
(iii) the Gini Coefficient as compiled by the World Bank. Again here, the titles of three social
indices do not directly refer to governance, but they are directly related to government
policies associated with health, education and distribution of income.
It should be stated here that there is some overlap between the nine indices presented in this
study, with some of them drawing on similar sources, but they all have a degree of
distinctiveness.
The study also correlates these indices with GDP per capita and economic growth, so as to
comment on the presumption that good political, economic and social governance is
associated with these two variables.
The paper is organised in five sections. Following this introductory section, a brief literature
review is presented focussing on the connection between governance and economic
performance as well as the governance situation in the Philippines. The three sections that
follow will respectively examine the political, economic and social indicators, focussing on
the scores of the Philippines relative to other countries globally. Section 4 summarises the
main tendencies derived from the previous three sections. Section 5 concludes the study and
proposes a number of implications that emerge from the analysis, with reference to the
Philippines.
2. LITERATURE ON GOVERNANCE AND ECONOMIC PERFORMANCE
In this section, we consider two aspects of the literature, closely related to this study, namely
(a) the correlation between good governance and economic performance and (b) the
governance record in the Philippines.
2.1 Governance and Economic Performance

6
2.1.1 Governance and GDP per capita
Simple correlations between good governance indicators and GDP per capita of countries, as
done in this study, indicate that there is a high degree of correlation between the two
variables. This relationship is confirmed in more rigorous and complicated studies on this
issue, notably in Kaufman and Kraay (2002).1
There is however some debate about the direction of causality. Kaufman and Kraay (2002)
show that per capita income and the quality of governance are strongly positively correlated
across countries. They propose an empirical approach in order to assess the causality of the
relationship, that is whether governance leads to prosperity or whether increases in income
per capita lead to good governance. They find a strong positive causal effect running from
better governance to higher per capita income, and a weak and even negative causal effect
running in the opposite direction from per capita income to governance.
2.1.2 Governance and economic growth
This study also presents simple correlation coefficients between governance indictors and
economic growth, which generally indicate that the relationship is not positive, and possibly
negative.2 This is in line with neoclassical growth theory that predicts that low income
countries should converge as theoretically they would tend to grow at a faster rate than higher
income ones due to the law of diminishing marginal product with regard to capital, which is
more abundant in developed countries. This neo-classical convergence theory is associated
with Solow (1956),3 which leads to the argument that a country's growth rate tends to be
inversely related to its starting level of income per capita.
In addition, intuitively, one should think that economically backward countries can grow
faster than advanced countries as the former countries can copy and adopt readily available
technologies invented by countries that developed earlier. This catching-up technological
laggards has been termed the “advantage of backwardness” by Gerschenkron (1952).
Several publications associate good governance, and the necessary institutions for this, with
growth. A substantial body of literature consider good governance as a precondition for
growth (Kaufmann, 2005; Reynolds, 1983), and similarly with regard to governance
institutions (Acemoglu et al., 2005; North; 1990; Rodrik, 1999; Aron, 2000; Commission on
Growth and Development, 2008). The direction of causation of economic growth and
governance is also a matter of debate, with some authors arguing in favour of the theory that
growth comes first and governance and the accompanying institutions later (e.g. Durlauf et
al., 2005; Glaeser et al., 2004). The connection between growth and governance has been questioned by Kurtz and Schrank
(2007) who doubt whether such a connection exists and queries whether the data used to
1 See Baland et al (2009) for a discussion on this relationship.
2 The correlation results produced in this study should be interpreted with caution as here we are not keeping
control variables constant and not capturing the possible reverse casual effect of growth on governance. It is
acknowledged that the approach adopted in this study is somewhat simplistic, and that regressing GDP per
capita and economic growth against the governance indices listed in this study, together with a number of
control variables would have produced more rigorous results. One suspects that a more rigorous approach would
have yielded a similar outcome and as Rodrik (2008) argues, there is no strong econometric evidence that relates
standard governance criteria to growth. 3 See also Cass (1965) and Koopmans (1965).

7
measure governance as well as the methods used to estimate such a relationships are good
enough.4
Rodrik (2008) argues that there are many countries that are growing rapidly despite poor
governance to render suspect any general claim to the contrary and governance is generally
not a prerequisite for getting growth going. Rodrik also opines that as a rule, broad
governance reform is neither necessary nor sufficient for growth, and therefore a broad
governance agenda rarely deserves priority as part of a growth strategy, except in rare
instances where “weak governance is specifically identified as a generic area of binding
constraints”.
The literature on the effect of good governance on economic growth therefore sends
contradictory signals, with some authors, notably Kaufman and Kraay (2002) arguing
strongly in favour the connection and others, such as Rodrik (2008) and Kurts and Schrank
(2007) arguing that there is no evidence that such a connection exists.
2.2 Governance in the Philippines
Given that this study focusses on the Philippines, it is pertinent to briefly discuss this matter
with reference to the literature. There is a vast body of literature on the Philippine economy
and the choice of studies considered here is extremely selective and focusses on governance
aspects. Many authors identify weak governance, particularly corruption, as a main constraint
on inclusive growth in the Philippine, meaning that even if the economy is growing fast, large
sections of the population are not reaping the benefits of such growth.
In an interesting essay Polvorosa, Jr. (2014) argues that there is no guarantee that the current
good performance of the Philippine economy will continue, and refers to a sense of déjà vu
due to the fact that the economy had already experienced periods of rapid growth before
which fizzled out, particularly after World War 2. When referring to bad governance in the
Philippines, the author particularly mentions corruption and pork barrel scandals, non-
payment of taxes, the bribery of officials for the creation ghost projects, bureaucratic red
tape, bribery, lack of financing, and unsatisfactory infrastructure. The author rightly states
that in spite of the country’s rapid growth, the Philippine poverty rates as well as the
unemployment and underemployment rates are very high.
Navarro and Llanto (2014), identify a number of positive features leading to economic
growth in the Philippines, including the possibility that anti-corruption initiatives may have
permeated government consciousness and have effectively influenced policymaking. Similar
to Polvorosa (2014) they consider it necessary for the government to stay the course in this
regard. The improvements recommended by Navarro and Llanto include heightened
infrastructural investments, expanding the industrial base to create productive jobs,
introducing a competition policy framework and reforming regulatory institutions. The same
authors also refer to the high rates of poverty and unemployment as worrisome realities,
therefore implying that economic growth is not permeating into the lower income population
groups. The authors call for policies that lead to inclusive growth, which require the removal
of an array of policies and regulations that negatively affect the efficiency of the labour
market and that impede the growth of the industrial sector.
4 See also Sundaram and Chowdhury (2012) for studies that question the governance and growth connection.

8
The Global Competitiveness Report (2014-2015), with inputs relating to the perceptions of
Philippine experts, also identifies positive and negative features of the Philippine economy,
The Philippines gained of 33 places since 2010 in the Global Competitiveness Index, which
is the highest improvement among all countries included in the Index. The report argues that
this came about because of the reforms during the 2010-2014 period which have bolstered the
country’s economic fundamentals. However the report refers to a number of major economic
shortcomings including poor infrastructural facilities and severe rigidities and inefficiencies
in the labour market. According to the Global Competitiveness Report, the four most
problematic factors for doing business in the Philippines are corruption, inadequate supply of
infrastructure, tax regulations and inefficient government bureaucracy
Similar remarks relating to the Philippine economy are made by Usai (2012), who also refers
to the solid growth performance of the economy during the 2000s, but points out that the
country, however, has not yet succeeded in translating this into inclusive growth, given the
high rate of poverty and of unemployment in the country, and considers this as the Philippine
economy’s main challenge. The author opines that the Philippines has a great potential and
discusses the reasons why this has not been realised. Amongst other things he identifies the
lack of industrial dynamism as a major culprit in this regard. The reason for this, according to
the author, lies with bad governance, leading to several constraints such as under-provision of
basic infrastructure and poor business and investment climate.
The author argues that in order to achieve inclusive growth, the government needs to play an
active role in creating productive jobs by offering effective support to industry, since a
stronger industrial sector would create job opportunities for the growing labour force. The
author reminds us that industrial upgrading and diversification are unlikely to take place
without public policy response due mostly to market failures.
3. THE PHILIPPINE POLITICAL GOVERNANCE SCORES COMPARED
This section considers three indices which relate to political governance namely (a) the
Worldwide Governance Indicators; (b) the Corruption Perception Index and (c) the “legal
system and security of property rights” sub-index of the Economic Freedom of the World
Index. The scores and the rank of the Philippines in terms to these indices, compared to the
rest of the world, are presented in Table 1.
Table 1: The Political Governance Scores and Rankings of the Philippines in a Global Context
Category of Countries WGI CPI EFW-2
Score Rank Score Rank Score Rank
Philippines score -0.319 104 36.0 93 4.84 97
Best: all countries 1.846 1 91.0 1 8.90 1
Worst: all countries -2.231 187 8.0 173 2.20 152
Average: all countries -0.077 94 43.0 86 5.51 76
High-income average 0.974 34 64.9 19 7.10 31
Upper-middle-income average -0.192 96 39.2 88 5.22 82
Lower-middle-income average -0.510 119 32.5 111 4.68 101
Low-income average -0.955 150 26.8 130 4.09 117

9
Table 2 presents the results of tests of simple correlations between the chosen political
governance indicators and GDP per capita and real GDP growth for the periods 2003-2012
and 2010-2012.
Table 2: Correlations between Political Governance, GDP per Capita and Growth
Variable Correlations
with WGI
Correlations
with CPI
Correlations
with EFW-2
GDP PC 0.71* 0.75* 0.75*
Real Growth 03-12 -0.45* -0.42* -0.24*
Real Growth 10-12 -0.40* -0.33* -0.23*
3.1 The Worldwide Governance Indicators (WGI)
The 2013 Worldwide Governance Indicators (WGI)5 cover 215 countries and has six
dimensions of governance, namely (1) voice and accountability (2) political stability and
absence of violence (3) government effectiveness (4) regulatory quality (5) rule of law and
(6) control of corruption.6 The data is first rescaled using the Max-Min formula
7 to render
the data comparable across sources. The resulting estimates of governance are a weighted
average of the data from each source8 with scores assigned a value of approximately -2.5 to
2.5, with higher values corresponding to better governance. A detailed description of the
methodology is given in Kaufmann et al. (2010).
3.1.1 The WGI: Global Comparisons
In this study we utilise the 2013 version of the WGI for 187 countries.9 Table 1 shows how
the Philippines fared in terms to the WGI when compared to the rest of the World. It can be
seen that the scores of the Philippines is rather low, and is ranked 104th
among 187 countries.
Its score is on the high side when compared to the average of lower-middle income countries
but markedly lower than that for upper-middle income, and high-income countries. In terms
of the WGI therefore, one can conclude that the Philippines score is within the range of the
lower-middle income countries, and therefore in line with its income classification.
5 The 2013 WGI scores are available at: http://info.worldbank.org/governance/wgi/index.aspx#home .
6 The indicators are based on the views of persons involved in business, ordinary citizens and expert surveys,
with sources derived from various institutes, think tanks, non-governmental organizations, international
organizations, and private sector firms. 7 This rescaling method is based on the formula (Xi-Xmin)/(Xmax-Xmin) where Xi is an ith observation in an
array of observations of a given variable. Xmin is the observation with the minimum value and Xmax is the
observation with the maximum value in the same array of observations. Thus the observation with the minimum
value will be rescaled to equal zero and the observation with the maximum value will be rescaled to equal 1. All
other observations will have a value between 0 and 1. This method is commonly used in composite indices. Its
main shortcoming is that outliers can give distorted results. 8 The weights reflect the pattern of correlation among data sources. The method adopted by the authors assigns
greater weight to data sources that tend to be more strongly correlated with each other. The authors argue that
while this weighting improves the statistical precision of the aggregate indicators, it typically does not affect
very much the ranking of countries on the aggregate indicators 9 The 2013 WGI actually cover 215 countries and territories, but this study reduces the number to 187
independent countries for which data on GDP per capita and real economic growth was available.

10
3.1.2 The WGI: Correlation with Income and Growth10
Table 2 shows the correlation between the GWI and GDP per capita, which is positive and on
the high side, being different from zero at the 95% level statistical significance.11
This finding
also applies to the Philippines, in that its GDP per capita and its GWI scores are both on the
low side globally.
Table 2 also shows that the GWI is negatively correlated with economic growth, measured by
two indices namely real GDP growth over ten-years (2003-2012) and over 3 years (2010-
2012). The negative correlation between governance and economic growth has already been
explained in the literature review above. The Philippines registered relatively high growth
rates during the two periods under consideration (5.35% during the ten-year period and
6.03% during the three year period), even though its governance score was relatively low.
3.2 The Corruption Perception Index
The 2013 version of the Corruption Perception Index,12
compiled by Transparency
International, covers 177 countries and is based on perceived levels of corruption, as
determined by expert assessments and opinion surveys with data expressed over a mapping
scale of 0-100 where a 0 = highest level of perceived corruption, and 100 = lowest. The
methodology follows 4 basic steps: selection of source data, rescaling the data, aggregating
the rescaled data and then reporting a measure for uncertainty.13
3.2.1 The CPI: Global Comparisons
Table 1 shows that the CPI score of the Philippines is below average worldwide, and the
country is ranked 93rd
among 173 countries. 14
As is the case of the WGI, the CPI score of the
Philippines is on the high side when compared to the average for lower-middle income
countries but markedly lower than that for upper-middle income and high-income countries.
3.2.2 The CPI: Correlation with Income and Growth
The correlation between the CPI and GDP per capita is positive and statistically significant,
as shown in Table 2. Again, this finding applies to the Philippines, in that its GDP per capita
and its CPI scores are both relatively low. On the other hand the CPI is negatively correlated
with economic growth, measured by two indices namely real GDP growth over ten-years
(2003-2012) and over 3 years (2010-2012). This finding was also registered with regard to
the WGI.
10
Data for GDP per capita and for economic growth were sourced from the IMF World Economic Outlook
database available at: http://www.imf.org/external/pubs/ft/weo/2014/01/weodata/index.aspx . 11
The test of significance was conducted by regressing GPD per capita and real GDP growth on the governance
index and finding the t-statistic relating to the coefficient on the governance index. The asterix on the correlation
coefficient indicates that it is different from zero at the 95% level of statistical significance and the superscript n
on the coefficient indicates that it is not different from zero at the same level of significance. 12
The 2013 CPI scores are available at: http://cpi.transparency.org/cpi2013/ . 13
More information about this index is available see Transparency international (2012). 14
The 2013 CPI actually cover 177 countries, but this study reduces the number to 173 independent countries
for which data on GDP per capita and real economic growth was available.

11
3.3 The Economic Freedom of the World Indictors, component 2 (EFW-2)
The 2014 version of the Economic Freedom of the World Index (EFWI)15
has five areas (sub-
indices), namely (1) size of government; (2) legal system & security of property rights; (3)
access to sound money; (4) freedom to trade internationally; and (5) regulation of credit,
labour, and business.16
In this section we use the Index relating to political governance,
namely the second sub-index (EFW-2) entitled “Legal system & security of property rights”.
This index is composed of the following various components relating to judicial
independence, impartial courts, protection of property rights, military interference in rule of
law and politics, integrity of the legal system, legal enforcement of contracts, regulatory
restrictions on the sale of real property, reliability of police and business costs of crime.
3.3.1 The EFW-2: Global Comparisons
Table 1 shows that the score of the Philippines is again below the average worldwide and the
country is ranked 97th among 152 countries. The Philippine score is about the same as the
average for lower-middle-income countries. It is markedly lower than the average score for
high-income and upper-middle-income countries.
3.3.2 The EFW-2: Correlation with Income and Growth
Table 2 shows, as was the case of the WGI and the CPI, that the correlation between EFW-2
and GDP per capita is positive and relatively high. Again, this finding applies to the
Philippines, in that its GDP per capita and its EFW-2 scores are both relatively low.
Table 2 again shows that the EFW-2 is negatively correlated with economic growth,
measured by two indices namely real GDP growth over ten-years (2003-2012) and over 3
years (2010-2012). The correlation coefficients however are of a low magnitude.
4. THE PHILIPPINE ECONOMIC GOVERNANCE SCORES COMPARED
This section will consider three indices relating to economic governance, namely (a) the
Economic Stability Index forming part of the Resilience Index (b) an average of sub-indices
1,3,4 and 5 of the Economic Freedom of the World Index and (c) the third pillar
(macroeconomic environment index) of the Global Competitiveness Indicators. The scores
and ranking of the Philippines with respect economic governance scores are presented in
Table 3.
15
The EFWI scores are available at: http://www.freetheworld.com/release.html . 16
The Index is based on data sourced from surveys, expert panels, and generic case studies including sources
such as the International Monetary Fund, World Bank, and World Economic Forum that provide data for a large
number of countries. Data provided directly from a source within a country are rarely used, and only when the
data are unavailable from international sources. Most of the scores utilise the Min-Max formula to rescale the
data (1 to 10). The methodology is explained in the Explanatory Notes and Data Sources Appendix in Gwartney
et al. (2012).

12
Table 3: The Economic Governance Scores and Rankings of the Philippines in a Global Context
Category of Countries ERI-STB EFW-1345 GCI-MCE
Score Rank Score Rank Score Rank
Philippines score 0.63 45 7.91 21 5.76 26
Best: all countries 1.00 1 9.24 1 6.83 1
Worst: all countries 0.00 183 4.31 152 2.42 143
Average: all countries 0.54 92 7.18 75 4.76 71
High-income average 0.63 58 7.59 53 5.22 53
Upper-middle-income average 0.53 96 7.19 70 4.85 66
Lower-middle-income average 0.51 106 7.13 84 4.39 87
Low-income average 0.45 123 6.64 106 4.17 98
Table 4 presents the results of simple correlation tests between the chosen economic
governance indicators and GDP per capita and real GDP growth for the periods 2003-2012
and 2010-2012.
Table 4: Correlation between Economic Governance and GDP per Capita and Growth
Variable Correlations
with ERI-STB
Correlations
with EFW-1345
Correlations
with GCI-STB
GDP PC 0.42* 0.37* 0.45*
Real Growth 03-12 -0.07 n -0.15
n 0.11
n
Real Growth 10-12 -0.01 n -0.18
n 0.17
n
4.1 Macroeconomic Stability Component of the Economic Resilience Index (ERI-STB)
The Economic Resilience Index, which was developed in Briguglio et al. (2006; 2009) and
was recently updated in Briguglio (2014), contains three sub-indicators, namely inflation
(measured by the GDP deflator), debt and current account imbalances, the latter two
measured relative to GDP. All observations are rescaled using the Max-Min formula, so as to
enable aggregation of variables measured in different scales. The data was sourced from the
IMF World Economic Outlook database17
and the three sub-indices were averaged using
equal weights.
4.1.1 The ERI-STB : Global Comparisons
It can be seen from Table 3 that the Philippine score of the macroeconomic stability index is
on the high side and comparable to the average for high-income countries. This tendency will
also be seen in the two other economic governance indices, as will be shown below.
4.1.2 The ERI:STB Correlation with economic aggregates
The correlation of the ERI-STB with GDP per capita is positive, as shown in Table 4,
possibly reflecting the tendency that the most developed countries enjoy more stability
macroeconomically. This result is not in line with the Philippine reality, in that its GDP per
capita is relatively low while its GCI score is relatively high.
17
The database is available at: http://www.imf.org/external/pubs/ft/weo/2014/01/weodata/index.aspx .

13
The ERI-STB is negatively correlated with economic growth although the magnitude of the
coefficients are very small and not statistically different from zero at the 95% level of
statistical significance.
4.2 Components 1,3,4 & 5 of the Economic Freedom of the World Index
4.2.1 The EFW(1345): Global Comparisons
The EFW index has already been described above with regard to its second component which
relates to the legal system and security of property rights. The other components of the Index,
namely the first, third, fourth and fifth sub-indices, are directly related to economic
governance.18
It can be seen from Table 3 that the score of the Philippines on this Index is
even higher than the average for high income countries.
4.2.2 The EFW-1345: Correlation with economic aggregates
Table 4 shows that, as was the case of the previous indices considered, the correlation
between EFW-1345 and GDP per capita is positive. Again, this finding is not in line with the
Philippine reality, in that its GDP per capita is relatively low while its EFW-1345 score is
relatively high.
As shown in Table 4, EFW-1345 is negatively correlated with economic growth, though the
coefficients are again very small and not different from zero at the 95% statistically
significance.
4.3 Macroeconomic Environment Index of the Global Competitiveness Indicators (GCI-MCE)
The Global Competitiveness Index is published as part of the Global Competitiveness
Report.19
The 2014–2015 version of the index covers 144 countries, with data pertaining
mostly to 2013,20
although in some instances earlier years’ data was used. The authors define
competitiveness as “the set of institutions, policies, and factors that determine the level of
productivity of a country.” The authors argue that “the level of productivity, in turn, sets the
level of prosperity that can be earned by an economy.” The scores are based on the Min-Max
method, with scores ranging from 1 to 7. The methodology is explained in Global
Competitiveness Report itself. The overall index is a weighted average21
of many different
components, each measuring a different aspect of competitiveness. These components are
grouped into 3 sub-indices, with 12 pillars.22
18
The EFW-1345 indices measure (1) size of government as it affects the economy; (3) access to sound money;
(4) freedom to trade internationally; and (5) regulation of credit, labour, and business. 19
The 2014-15 version of the GCI is available at: http://www.weforum.org/issues/global-competitiveness . 20
There are however other years from which the data was gathered. For a detailed description of the sources of
the data see the section entitled Technical Notes and Sources in the Global Competitiveness Report available at:
http://www3.weforum.org/docs/WEF_GlobalCompetitivenessReport_2014-15.pdf . 21
The GCI utilise a somewhat complicated weighting procedure, depending on the stage of development of the
country being considered, as measured by the GDP per capita. See Schwab (2014). 22
The 3 sub-indices and the 12 pillars are: (I) Basic requirements subindex: 1: Institutions; 2: Infrastructure;
Pillar 3: Macroeconomic environment; Pillar 4: Health and primary education. (II) Efficiency enhancers
subindex: 5: Higher education and training; 6. Goods market efficiency; 7. Labour market efficiency; 8:
Financial market development; 9: Market Size; 10:Technolgocial readiness. Innovation and sophistication
factors subindex: 11: Business sophistication; 12: Innovation
14
The third pillar, namely “Macroeconomic environment” is used in this study as it is directly
related to economic governance. This index is composed of five sub-indices namely (1)
Government budget balance as a percent of GDP, (2) Gross national savings as a percent of
GDP, (3) Inflation, annual % change, (4) General government debt as a percent of GDP and
(5) the Country credit rating.
4.3.1 The GCI-MCE: Global Comparisons
The GCI-MCE scores of the Philippines compared to other countries are shown in Table 3.
Table 3 shows that the Philippines ranks 26st out of 143 countries
23 in the overall index which
is a very satisfactory score, placing the Philippines in the top half of the league, even higher
than the average of high-income countries.
4.3.2 The GCI-MCE: Correlation with economic aggregates
Table 4 shows, as was the case of the two other economic governance indices considered
above, that the correlation between GCI and GDP per capita is positive. As was argued
before, this finding is not in line with the Philippine reality, in that its GDP per capita is
relatively low while its GCI-MCE score is relatively high.
Table 4 also shows that GCI-MCE index is positively correlated with economic growth but
these averages are not statistically significantly different from zero.
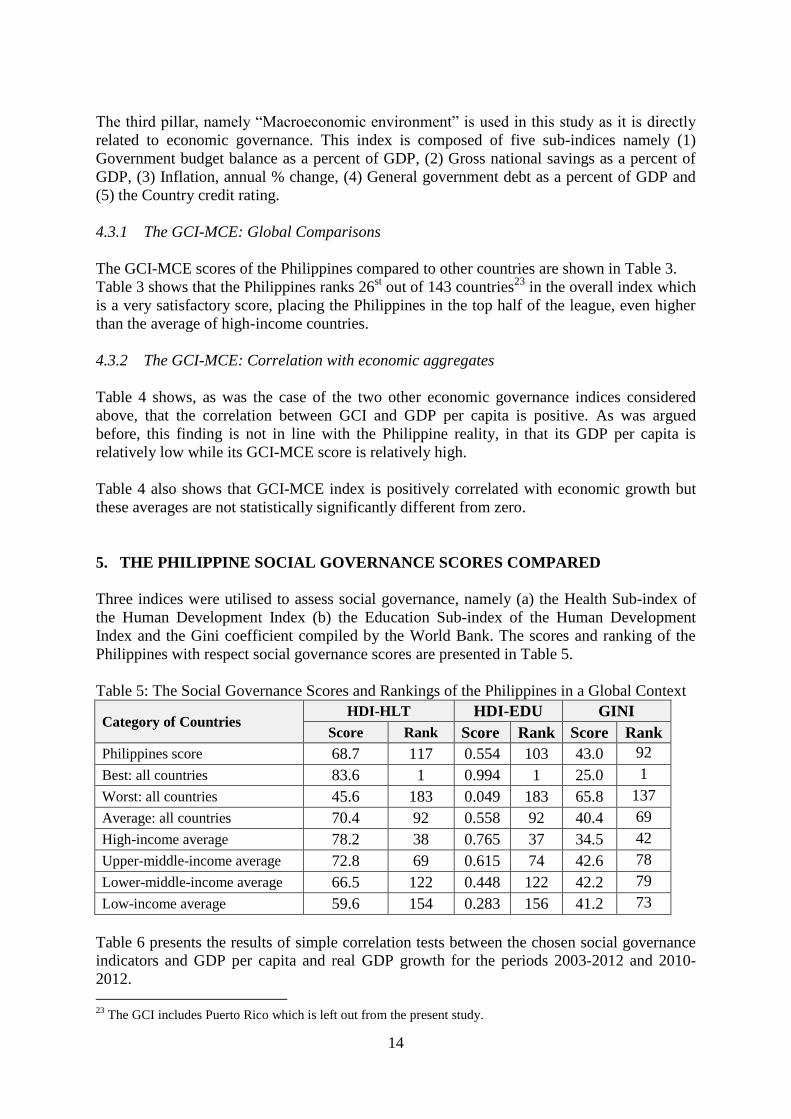
5. THE PHILIPPINE SOCIAL GOVERNANCE SCORES COMPARED
Three indices were utilised to assess social governance, namely (a) the Health Sub-index of
the Human Development Index (b) the Education Sub-index of the Human Development
Index and the Gini coefficient compiled by the World Bank. The scores and ranking of the
Philippines with respect social governance scores are presented in Table 5.
Table 5: The Social Governance Scores and Rankings of the Philippines in a Global Context
Category of Countries HDI-HLT HDI-EDU GINI
Score Rank Score Rank Score Rank
Philippines score 68.7 117 0.554 103 43.0 92
Best: all countries 83.6 1 0.994 1 25.0 1
Worst: all countries 45.6 183 0.049 183 65.8 137
Average: all countries 70.4 92 0.558 92 40.4 69
High-income average 78.2 38 0.765 37 34.5 42
Upper-middle-income average 72.8 69 0.615 74 42.6 78
Lower-middle-income average 66.5 122 0.448 122 42.2 79
Low-income average 59.6 154 0.283 156 41.2 73
Table 6 presents the results of simple correlation tests between the chosen social governance
indicators and GDP per capita and real GDP growth for the periods 2003-2012 and 2010-
2012.
23
The GCI includes Puerto Rico which is left out from the present study.

15
Table 6: Correlation between Social Governance and GDP per Capita and Growth
Variable Correlations
with HDI-HLT
Correlations
with HDI-EDU
Correlations
with GINI
GDP PC 0.58* 0.62* -0.286*
Real Growth 03-12 -0.30* -0.33* -0.024n
Real Growth 10-12 -0.32* -0.34* 0.151 n
5.1 The Health Sub-Index of the Human Development Index
The Human Development Index (HDI)24
measures the average achievements in a country in
three basic dimensions of human development, namely health (measured by life expectancy),
education (measured by the average of years of schooling and expected years of schooling)25
and the standard of living, measured by the log of GNI per capita (PPP $). All variables were
rescaled using the Min-Max formula. The HDI is the geometric mean of the three
dimensions. A description of the methodology is available at Klugman et al. (2011). The
most recent index covers 187 economies.
5.1.1 The HDI-HLT: Global Comparisons
The Health Component of the Human Development Index (HDI-HLT) measures life
expectancy at birth. It can be seen from Table 5 that in terms of the HDI-HLT, the
Philippines is ranked 117th
among 183 countries,26
with a score comparable to the average of
the lower-middle-income countries, markedly lower than the average for high-income and
upper-middle-income countries.
5.1.2 The HDI-HLT: Correlation with economic aggregates
Table 6 shows the correlation between the HDI-HLT and GDP per capita, which is positive.
This finding also applies to the Philippines, in that its GDP per capita and its HDI-HLT
scores are both on the low side globally.
Table 6 also shows that the HDI-HLT is negatively correlated with economic growth. This
finding is consistent with the other governance variables considered so far.
5.2 The Education Sub-Index of the Human Development Index
The Education Component of the Human Development Index (HDI-EDU) is measured by the
average of years of schooling and expected years of schooling.27
24
The data for this study was sourced from the 2014 HDI, available at http://hdr.undp.org/en/data . 25
Mean of years of schooling for adults aged 25 years and expected years of schooling for children of school
entering age. 26
The HDI covers 187 countries but Andorra, Liechtenstein, Palestine and Palau where left out in the index
used for this study. 27
“Mean of years of schooling” applies for adults aged 25 years and “expected years of schooling” applies for
children of school entering age (data available at http://hdr.undp.org/en/content/table-1-human-development-
index-and-its-components ). The values in years for the two indices were first rescaled using the max-min
formula and then averaged as indicated at: http://hdr.undp.org/sites/default/files/hdr14_technical_notes.pdf

16
5.2.1 The HDI-EDU: Global Comparisons
It can be seen from Table 5 that in terms of the HDI-EDU, the Philippines is ranked 103rd
among 183 countries, with a score on the high side compared with the average for lower-
middle-income countries, but markedly lower than the averages for high-income and upper-
middle-income countries.
5.2.2 The HDI-EDU: Correlation with economic aggregates
Table 6 shows the correlation between the HDI-EDU and GDP per capita, which is positive.
This finding also applies to the Philippines, in that its GDP per capita and its HDI-EDU
scores are both in the lower-middle-income category.
Table 6 also shows that the HDI-EDU is negatively correlated with economic growth, leading
to the same conclusion as in the case of HDI-HLT.
5.3 The Gini Index of Income Inequality
The Gini Index (GINI) measures the deviation of the distribution of income among
individuals or households within a country from a perfectly equal distribution. The index is
theoretically based on the so-called Lorenz Curve, where a value of 0 represents absolute
equality and a value of 100 absolute inequality. The data used in the present study covers 137
countries.28
5.3.1 GINI Index: Global Comparisons
It can be seen from Table 5 that in terms of the GINI the Philippines is ranked 92nd
among
137 countries with a relatively low score compared to the average for all country categories.
5.3.2 GINI Index: Correlation with economic aggregates
Table 6 shows the correlation between the GINI and GDP per capita, which is negative. This
finding also applies to the Philippines, in that its GDP per capita is relatively low while its
GINI score is relatively high.29
Table 6 also shows the correlation of GINI with economic growth, between 2003 and 2012
and between 2010 and 2012 with mixed results.30
The correlation coefficients were not
different from zero at the 95% level of statistical significance.
28
Source: World Bank (2013). It should be noted that data is not available for about 50 countries and the results
should therefore be interpreted in this light. 29
OECD (2012) contends that the marked cross-country variation in income inequality is mainly due to
differences in policies and institutions. 30
A commonly held view is that inequality inhibits growth (Benabou, 1996). Studies produce contradictory
results regarding the relationship between inequality and growth. Forbes (2000) asserts using empirical data that
the relationship is positive, arguing that his results suggest that in the short and medium term, an increase in a
country’s level of income inequality has a significant positive relationship with subsequent economic growth.
17
6. THE MAIN TENDENCIES THAT EMERGE FROM THE INDICATORS
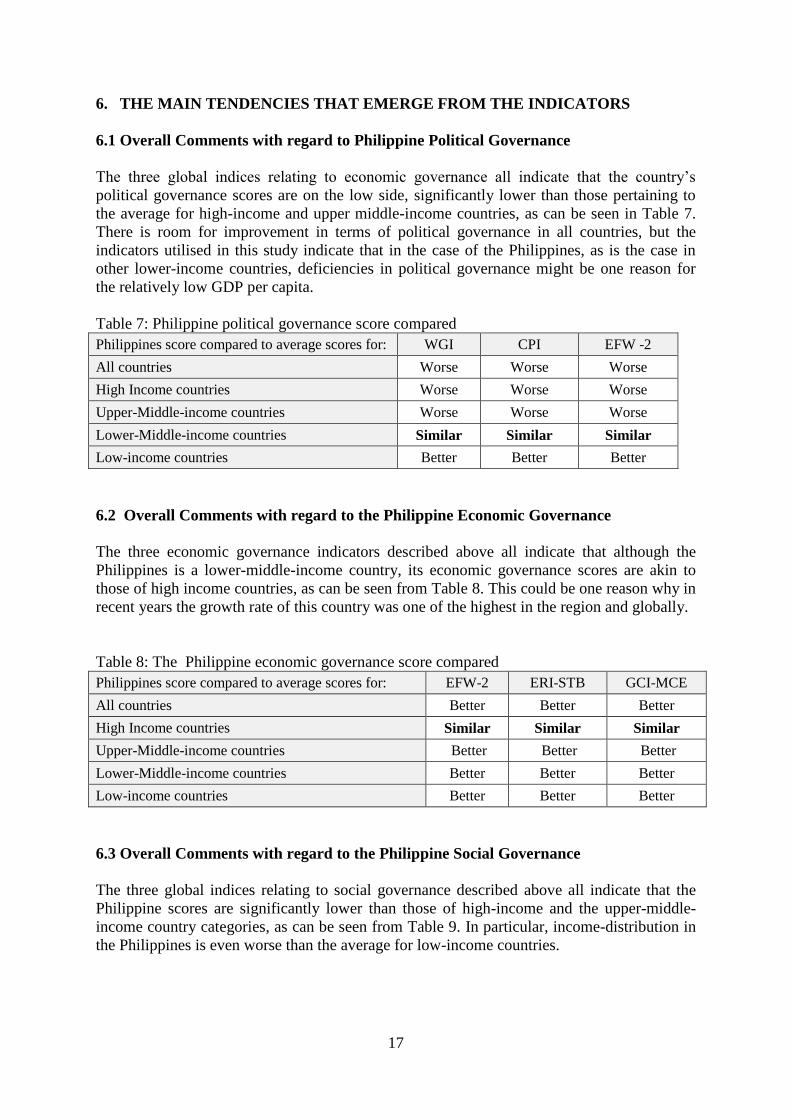
6.1 Overall Comments with regard to Philippine Political Governance
The three global indices relating to economic governance all indicate that the country’s
political governance scores are on the low side, significantly lower than those pertaining to
the average for high-income and upper middle-income countries, as can be seen in Table 7.
There is room for improvement in terms of political governance in all countries, but the
indicators utilised in this study indicate that in the case of the Philippines, as is the case in
other lower-income countries, deficiencies in political governance might be one reason for
the relatively low GDP per capita.
Table 7: Philippine political governance score compared
Philippines score compared to average scores for: WGI CPI EFW -2
All countries Worse Worse Worse
High Income countries Worse Worse Worse
Upper-Middle-income countries Worse Worse Worse
Lower-Middle-income countries Similar Similar Similar
Low-income countries Better Better Better
6.2 Overall Comments with regard to the Philippine Economic Governance
The three economic governance indicators described above all indicate that although the
Philippines is a lower-middle-income country, its economic governance scores are akin to
those of high income countries, as can be seen from Table 8. This could be one reason why in
recent years the growth rate of this country was one of the highest in the region and globally.
Table 8: The Philippine economic governance score compared
Philippines score compared to average scores for: EFW-2 ERI-STB GCI-MCE
All countries Better Better Better
High Income countries Similar Similar Similar
Upper-Middle-income countries Better Better Better
Lower-Middle-income countries Better Better Better
Low-income countries Better Better Better
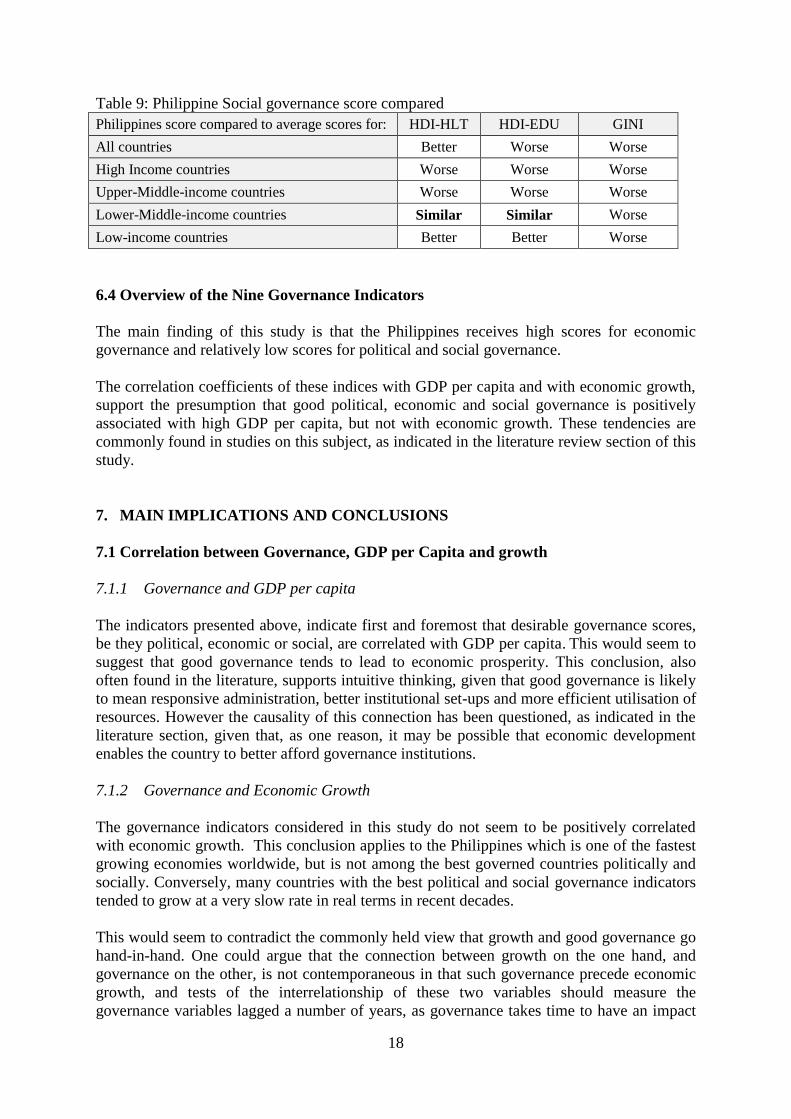
6.3 Overall Comments with regard to the Philippine Social Governance
The three global indices relating to social governance described above all indicate that the
Philippine scores are significantly lower than those of high-income and the upper-middle-
income country categories, as can be seen from Table 9. In particular, income-distribution in
the Philippines is even worse than the average for low-income countries.
18
Table 9: Philippine Social governance score compared
Philippines score compared to average scores for: HDI-HLT HDI-EDU GINI
All countries Better Worse Worse
High Income countries Worse Worse Worse
Upper-Middle-income countries Worse Worse Worse
Lower-Middle-income countries Similar Similar Worse
Low-income countries Better Better Worse
6.4 Overview of the Nine Governance Indicators
The main finding of this study is that the Philippines receives high scores for economic
governance and relatively low scores for political and social governance.
The correlation coefficients of these indices with GDP per capita and with economic growth,
support the presumption that good political, economic and social governance is positively
associated with high GDP per capita, but not with economic growth. These tendencies are
commonly found in studies on this subject, as indicated in the literature review section of this
study.
7. MAIN IMPLICATIONS AND CONCLUSIONS
7.1 Correlation between Governance, GDP per Capita and growth
7.1.1 Governance and GDP per capita
The indicators presented above, indicate first and foremost that desirable governance scores,
be they political, economic or social, are correlated with GDP per capita. This would seem to
suggest that good governance tends to lead to economic prosperity. This conclusion, also
often found in the literature, supports intuitive thinking, given that good governance is likely
to mean responsive administration, better institutional set-ups and more efficient utilisation of
resources. However the causality of this connection has been questioned, as indicated in the
literature section, given that, as one reason, it may be possible that economic development
enables the country to better afford governance institutions.
7.1.2 Governance and Economic Growth
The governance indicators considered in this study do not seem to be positively correlated
with economic growth. This conclusion applies to the Philippines which is one of the fastest
growing economies worldwide, but is not among the best governed countries politically and
socially. Conversely, many countries with the best political and social governance indicators
tended to grow at a very slow rate in real terms in recent decades.
This would seem to contradict the commonly held view that growth and good governance go
hand-in-hand. One could argue that the connection between growth on the one hand, and
governance on the other, is not contemporaneous in that such governance precede economic
growth, and tests of the interrelationship of these two variables should measure the
governance variables lagged a number of years, as governance takes time to have an impact

19
on growth. It may also be that the causality runs from economic growth to governance in that
countries that grow economically, for the same reason referred to above, are better able to
afford improvements in their governance institutions than those that do not.
There may therefore be a two-way causation in this regard, as already explained in the
literature review presented above, with some authors preferring the theory of good
governance comes first and growth later, while other take the opposite view. If the latter
version is true, we may expect improvements in political governance in the Philippines in the
future.
The negative correlation coefficients between economic growth and good governance
presented in this study were not all different from zero at the 95% statistically significance,
but they do indicate that the best governed countries are not the fastest growing ones.
However this should not be interpreted as an indication that good governance is undesirable
for growth, and that it should not, therefore, be pursued. On the contrary, the fact that good
governance and economic prosperity are correlated, in that the best governed countries tend
to enjoy the highest standard of living, can be seen as a sign that well-governed countries do
reap benefits in the form of high income per capita, albeit this has occurred over a long period
of time.
7.2 Implications for the Philippines
What are the main implications of this study for the Philippine economy? As indicated in this
paper, the Philippines registered relatively high growth rates during the recent decade, but it
is still a lower-middle-income country, according to the World Bank’s classification.
Typically, countries in that income bracket tend to have inferior governance structures when
compared to richer countries. The political and social indicators described in this study
support this contention, but the economic governance indicators do not.
As argued above, with reference to literature, it is not easy to prove conclusively as to the
whether a lower-income country, such as the Philippines, is in such a situation because its
governance leaves much to be desired, or whether the causal relationship is the other way
round, namely that the Philippine governance is weak because the country does not afford the
institutions that are needed for good governance.
Whatever the direction of the causality, there can be no doubt that good governance is
desirable in itself, and remains an important characteristic of the countries which enjoy a high
standard of living. The nine indicators described above all show the political and social
governance scores of the Philippines are typical of those found in other lower income
countries.
It is pertinent to ask in this regard whether the good economic governance indictors of the
Philippines may explain the Philippine growth performance, in spite of the country’s not-so-
good performance in the social and political fields. Again here, it is difficult to answer this
question, but if one compares the growth possibilities of two countries, A and B, with country
A better economically governed than country B, everything else remaining equal, including

20
the stage of development, one would expect that country A would register a higher growth
rate than country B.31
A related argument is that if country A is less developed than country B, its catching-up
performance is likely to improve as economic governance improves, and that such
governance can give rise to upward or downward shifts in steady state conditions of that
country. As a matter of fact, convergence is not occurring in all developing countries and
some countries are actually diverging in their income per capita from the high-income
countries, possibly due to unsatisfactory economic governance.
The fact remains however, according to the indicators we selected, that the Philippine
political and social governance leaves much to be desired, and this could possibly be one
reason why the benefits of growth in that country are not being enjoyed by large sections of
the population. As has been shown in Table 5, income distribution in this country is possibly
among the worst worldwide. According to many authors of studies on the current situation in
the Philippines, some of which were referred to above, good political and social governance
in the Philippines is an imperative for inclusive growth.
REFERENCES
Acemoglu, D., Johnson, D. and Robinson, J.A. (2005). Institutions as a Fundamental Cause
of Long-run Growth.” In Aghion, P. and Durlauf, S.N. Handbook of Economic
Growth, Volume IA. Available at : http://economics.mit.edu/files/4469
Aron, J. (2000). “Growth and Institutions: A Review of the Evidence,” The World Bank
Research Observer. Vol. 15 (1), 99-135. Available at:
http://www.ppge.ufrgs.br/giacomo/arquivos/eco02237/aron-2000.pdf.
Baland, J.M. Moene, K.O. and Robinson, J.A. (2009). “Governance and Development,” In
Rodrik, D. and Rosenzweig, M. (Eds) Handbook of Development Economics.
North Holland.
Benabou, B. (1996). “Inequality and Growth.” In Bernanke, B. and Rotemberg, J.J. eds.,
NBER Macroeconomics Annual 1996. Cambridge, MA: MIT Press: 11–74
Briguglio, L. (2014). “A Vulnerability and Resilience Framework for Small States,” In
Bynoe-Lewis, D. Building the Resilience of Small States: A Revised Framework.
London Commonwealth Secretariat.
Briguglio, L., Cordina, G., Farrugia, N. and Vella, S. (2009). “Economic Vulnerability and
Resilience: Concepts and Measurements,” Oxford Development Studies, Vol. 37(3):
229-247.
Briguglio, L., Cordina, G., Farrugia, N., and Vella, S. (2006). Conceptualising and measuring
economic resilience. In L. Briguglio, G. Cordina, and E. Kisanga, E. (Eds.), Building
the Economic Resilience of Small States (pp. 265-288). Malta: Islands and Small
States Institute in collaboration with the Commonwealth Secretariat.
Cass, D. (1965). "Optimum Growth in an Aggregative Model of Capital Accumulation,
Review of Economic Studies, Vol. 32: 230240
Durlauf, S. N., Johnson P. A. and Temple, J. R. W. (2005). “Growth Econometrics”, in
Durlauf S.N. and Aghion, P. (eds.), Handbook of Economic Growth, Elsevier.
Commission on Growth and Development (2008). The Growth Report Strategies for
31
Here, better governance can be interpreted as an outward shift in the steady state situation of two identical
economies with one being better economically governed than the other.

21
Sustained Growth and Inclusive Development. Washington, DC: World Bank.
Available at: https://openknowledge.worldbank.org/handle/10986/6507 .
Forbes, K.J. (2000). “A Reassessment of the Relationship between Inequality and Growth,”
The American Economic Review, Vol. 90 (4): 869-887.
Gerschenkron, A. (1952). “Economic Backwardness in Historical Perspective.” In The
Progress of Underdeveloped Areas, edited by Bert F. Hoselitz. Chicago: University
of Chicago Press, 1952.
Glaeser, E.L., La Porta, R., Lopez-de-Silanes, F. and Shleifer, A, (2004). “Do Institutions
Cause Growth?” NBER Working Paper 10568. Available at:
http://www.nber.org/papers/w10568.pdf.
Gwartney, J., Lawson, R. and Hall, J. (2012). Economic Freedom of the World, 2012 Report.
Available at: http://www.freetheworld.com/2012/EFW2012-complete.pdf .
International Monetary Fund (2014). World Economic Outlook Database. Available online
at http://www.imf.org/external/pubs/ft/weo/2014/01/weodata/index.aspx .
Kaufman, D. (2005). “10 Myths about Governance and Corruption.” Finance and
Development, Vol. 42 (3): 41–3.
Kaufman, D. and Kraay, A. (2002). “Growth without Governance.” Economía, Vol. 3(1):
169–215
Kaufman, D., Kraay, A. and Mastruzzi, M. (2010). “The Worldwide Governance Indicators:
Methodology and Analytical Issues,” World Bank Policy Research Working Paper
#5430. Available at: http://papers.ssrn.com/sol3/papers.cfm?abstract_id=1682130 .
Klugman, J., Rodriguez, F. and Choi, H. J. (2011). “The HDI 2010: New Controversies, Old
Critiques.” Human Development Research Paper 1. UNDP–HDRO, New York.
http://hdr.undp.org/en/reports/global/hdr2011/papers/HDRP_2011_01.pdf .
Koopmans, T.C. (1965). "On the Concept of Optimal Economic Growth," in The
Econometric Approach to Development Planning, North Holland, Amsterdam,
Kurts, J.M. and Schrank, A. (2007). “Growth and Governance: Models, Measures, and
Mechanisms,” The Journal of Politics, Vol. 69 (2),: 538–554. Available at:
http://politicalscience.osu.edu/faculty/mkurtz/papers/growthandgovernance.pdf.
North, D.C. (1990). Institutions, Institutional Change and Economic Performance.
Cambridge: Cambridge University Press.
Navarro, A.M. and Llanto, G.M. The Philippine economy in 2013 and prospects for 2014.
Philippine Institute of Development Studies, Manila.
http://dirp3.pids.gov.ph/webportal/CDN/PUBLICATIONS/pidsdrn14-1.pdf .
OECD (2012). “Reducing income inequality while boosting economic growth – Can it be
done?”, Available at: http://www.oecd-ilibrary.org/economics/economic-policy-
reforms-2012/reducing-income-inequality-while-boosting-economic-
growth_growth-2012-47-en.
Polvorosa Jnr., C. (2014). “Philippine Development, Good Governance, and the Pork Scandal
in Context,” The Manila Review, No. 4. Available at:
http://themanilareview.com/tag/issue-4-2/
Reynolds, L.G. (1983). The Spread of Economic Growth to the Third World,” Journal of
Economic Literature, Vol. 21 (3): 941-80.
Rodrik, D. (1999). Institutions for High Quality Growth: What They are and How They Affect
Growth, Paper prepared for the International Monetary Fund Conference on Second-
Generation Reforms, Washington, D.C.: 8-9 November.
Rodrik (2008). “Thinking about governance” in Government, Growth and Development
Decision Making World Bank. Available at:
http://www.wds.worldbank.org/external/default/WDSContentServer/WDSP/IB/2008

22
/08/11/000333038_20080811020814/Rendered/PDF/441860WP0REPLA1rnancean
dgrowth0test.pdf .
Schwab, K. (2014) The Global Competitiveness Report 2014-15. Switzerland: World
Economic Forum. Available at:
http://www3.weforum.org/docs/WEF_GlobalCompetitivenessReport_2014-15.pdf .
Solow, R.M. (1956). “A Contribution to the Theory of Economic Growth,” The Quarterly
Journal of Economics, 70(1): 65-94.
Sundaram, J. K and Chowdhury, A. (2012). Is Good Governance Good for Development?
Bloomsbury Academic (United Nations Series on Development).
Transparency International (2012. “The Corruption Perception Index 2012 – Methodological
notes.” Available at:
http://www.transparency.org/files/content/pressrelease/2012_CPITechnicalMethodol
ogyNote_EMBARGO_EN.pdf.
Usai, N. (2012). Taking the Right Road to Inclusive Growth: Industrial Upgrading and
Diversification in the Philippines, Manila: Asian Development Bank. Available at:
http://www.adb.org/sites/default/files/pub/2012/taking-right-road-to-inclusive-
growth.pdf .
United Nations (2014). Human Development Reports. Available online at:
http://hdr.undp.org/en/data
World Bank (2013). “World Development Indicators 2013.” Washington D.C.: World Bank.
Available online at http://data.worldbank.org