got local? want local? consumer marketing analysis of
TRANSCRIPT

Got Local? Want Local? Consumer Marketing
Analysis of Local Food
BY
Alyssa Hagerbrant
Rachel Dyckman
Olivia Gramprie

1
TABLE OF CONTENTS
Introduction…………………………….
Methods……………………………
Results…………………………………………
Grocery Store Data………………
Consumer Data……………………
Discussion……………………………..
Conclusion…………………………..
Recommendations…………………………………….
Appendix……………………………………
Appendix A: City Figures…………….
Appendix B: Grocery Store Figures…………………………………….
Appendix C: Consumer Survey………………………..
Appendix D: Consumer Survey Figures………………………………..
References……………………………….

2
Introduction
Are local foods better than long distance foods?
Local food re-connects an eater to his or her source of food, serving as a reminder that
what we eat comes from the land, not a supermarket (Pollan, 2006). Extensive research has
attributed local food systems to healthier environments, lower fossil fuel emissions, a reduction
in food safety risks, preserved farmland, support of local communities, invigoration of local
economies, and promotion of long term food sustainability (Peters et al., 2008) (Martinez, S. et
al., 2010). Local food shares many of the positive attributes of organic food because many
small-scale, local farmers use organic practices (sometimes even stricter than designated USDA
organic practices) (Gogoi, 2010). Local food has the added benefits of cutting down on
transportation costs as well as “food miles” and strengthening local and regional economies
rather than relying on the global market (DeWeerdt, 2013). The local food movement has gained
momentum since its inception in the late 1960s (Martinez, 2010). In fact, large food retailers
such as Wal-Mart and Safeway have decided to capitalize on this growing trend and recently
announced the incorporation of local food initiatives in their stores (Martinez, 2010).
How do people define local food?
The local food movement is considered to be a part of “alternative food initiatives.” The
local food initiative stems from a call for decentralization, democratization, and self-sufficiency
(Feagan, 2007). The movement was partially a reaction to the distancing of people from their
food sources and a dwindling consumer knowledge of the production and processing of food
items. Food production is geographically farther from the bulk of the American population than
ever before because of demographics and centralization of food conglomerates (Halweil, 2012).

3
Ideas of place and “the local” have reemerged and become altered as globalization has shifted
our perceptions of what “local” actually means (Feagan, 2007).
Definitions vary greatly between scholars and often “local food systems” encompass a
variety of other, more specific meanings such as: alternative agro-food networks, community
food security, civic and democratic agriculture, post-productivism, alternative or shortened food
chains, and higher quality foods (Feagan, 2007). The two most popular definitions of local food
are: food grown within a country and food grown within a state (Zepeda and Levitan-Reid,
2004). Farmer’s Markets, CSAs, and direct buying are generally accepted as markets for local
food, however, grocery stores are often overlooked as venues for these foods, despite the fact
that 90% of the food Americans eat come from grocery stores (Zepeda and Levitan-Reid, 2004)
(“Supermarket Secrets…” 2013). Scholar discrepancies on what defines a local food translates
into perpetuated misconceptions on the consumer level. Some focus groups have gathered up to
fifteen separate qualifications for local food. The most popular understanding of local concerns:
transportation type, increasing farm worker salary, seasonality, small scale farm support, and
driving distances (Zepeda & Leviten-Reid, 2004). The diversity of definitions reflects the
strength of the new food movement and the inability of suppliers to accommodate for shifting
consumer demands (Nestle, 2012).
The only attempt at a legal precedent for a local food definition exists in the Food,
Conservation, and Energy Act of 2008. The Farm Act allows grocery stores to market food items
as locally or regionally produced if they are sold within 400 miles of their source or within the
state in which they were produced (Brain, 2012)(H.R. 2419, 2008). Even though the Farm Act
determines what is local by distance, a local product most likely travels many miles to inspection
sites and approved packaging facilities (Grover, 2015). Produce in the United States travels an

4
average 1,800 miles until it reaches grocery store shelves (Grover, 2015). Until 30 years ago,
most towns supported local butchers, sites for inspection, processing, and packaging until they
closed due to consolidated businesses and with the introduction of the competitive global food
market (Halweil, 2002). Grocery stores have varying definitions of how many miles a food
product can travel from producer to store for that food to still be considered local. One study
tests out a range of definitions to determine which type of labeling consumers are most drawn to.
Local definitions range from sub-state regional level to the state level (State Proud certification -
indicating locally produced within a specific state) and to the multi-state level (Hu et al., 2011).
Results show that consumers are willing to pay more for food products that indicate they are
produced in their state or in a well-identified multi-state region (Hu et al., 2011).
How do consumers view food labels, specifically local food labeling?
Empirical studies have indicated that consumers’ motivations for purchasing local food
are largely related to environmental and health concerns, health practices, and consumer
demographic characteristics (Nie and Zepeda, 2011). There is often a gap between behavioral
patterns and attitudes towards local food, therefore an individual who is relatively sustainability
minded and environmentally conscious may not necessarily purchase local food even if they are
aware that local food is better for the environment. According to Attitude Behavior Context
(ABC) theory, there are a variety of factors that limit consumers’ ability to purchase local food
even if they have a favorable attitude towards sustainable behaviors (Nie and Zepeda, 2011).
Consumer interest in local food, perceived availability of local food, consumer values, and social
norms all affect whether or not an individual will purchase local food (Vermeir and Verbeke,
2006). One empirical study that sampled 456 young consumers showed that the factors most
important in determining whether or not an individual will buy sustainable foods are: investment
5
in sustainability initiatives and consumer perception of individual environmental impact
(Vermeir and Verbeke, 2006). This study also found that the main reason why consumers do not
purchase local food even though they show an interest in sustainability initiatives is that they
perceive there is an overall lack of available sustainable food (Vermeir and Verbeke, 2006).
Drawing from this study, it can be ascertained that improved visibility of local food through
consistent and effective signage would be beneficial to increasing consumers’ perceived
availability of local food, thus increasing the likelihood that they will purchase local food.
Food labels can be used to capture consumers interests in and develop a care for the local
food initiative. For consumers, the local origin label is an implicit guarantee of product quality.
For example, consumers’ willingness-to-pay for organic food products increases with
information on pesticide useage. Organic characteristics presented on labeling strongly impact
consumers’ willingness-to-pay for these food products (Barlagne et al., 2015). Education and
information on local food is key to increasing its sales in order to evoke the same feelings that
consumers have towards organic food and direct them towards local food. Furthermore, a study
carried out in the European Union food market found that consumers most value labels that are
regulated by law (Gracia and de-Magistris, 2015). If a local food label was developed similar to
the USDA Organic label, consumers would likely be able to trust this label and associate it with
a higher quality food product compared to conventional counterparts.
If there is a lack of local food and local food labeling in grocery stores, is it because
consumers don’t care, grocery stores don’t care, or there is a lack of local food producers?

6
A study carried out by the Food Marketing Institute in 2009, found that 82% of
Americans buy local food because of its freshness, 75% buy local food to support their local
economies, and 58% buy local food so that they know where their food comes from (Brain,
2012). Data from 2014 shows that 25% of Americans look for food and beverages that are
locally grown or produced when shopping (“U.S. Grocery…,” 2014). With this in mind, research
has found that most consumers who care about purchasing local foods are willing to pay more
for a local product because of their belief that this product is superior for a range of reasons (Hu
et al., 2011). With increased demand, increased supply follows. Food retailers ranging from local
grocery stores to large, national chains are adding more products marketed as “produced locally”
(Hu et al., 2011).
Legal precedent for local food labeling in grocery stores
Grocery stores are required to label the country of origin of certain agricultural
commodities in accordance with amendments to the 2002 Farm Bill (“Mandatory Country of
Origin…”, 2009). Covered commodities include: muscle cuts of beef including veal, lamb,

7
chicken, goat, pork; ground beef, ground lamb, ground chicken, ground goat, and ground pork;
wild and farm-raised fish and shellfish; perishable agricultural commodities; macadamia nuts;
pecans; ginseng; and peanuts (“Mandatory Country of Origin…,” 2009). Grocery stores are not,
however, required to label specifically where in their country of origin these products are
produced (“Mandatory Country of Origin…,” 2009).
Consumer perceptions on local food
One study exploring the feasibility of local market expansion in North Carolina found a
majority of consumers (60%) purchased locally grown food weekly when in season and that
shoppers were most likely to buy local food from both Farmer’s Markets (49%) and grocery
stores (49%) (TJH Research and Strategy, 2011). The largest amount of respondents in this study
defined local as grown within the state the item is sold. Another study encompassing the whole
United States found that the majority of consumers are willing to pay up to 10% more for a
“healthier” product and a little less than half (48%) selected they care about the locally sourcing
of products (Ringquist et al., 2016). Previous studies have calculated consumer perceptions of
local food, but none have focused on New York State or the Albany Capital Region.
Methods
New York State acts as an accurate representation of the United States as a whole due to
its food consumption and production trends mirroring national trends (Peters et. al, 2003). New
York State currently produces enough vegetables to provide 38% of its residents’ vegetable
consumption in addition to providing a 500 million pound surplus of certain crops such as beets,
cabbage, onions, pumpkins, snap beans, and sweet corn (Peters et. al, 2003). We also selected the

8
Upstate New York capital region as the location of our study because it supports a historically
strong farming culture facing pressure from globalized markets and increasing land prices.
The following six cities in the capital region, Albany, Troy, Saratoga Springs,
Schenectady, Glens Falls, and Mechanicville provide a diverse array of city types ranging in
demographic and economic status as well as level of urbanization (Figure 1). Albany and Troy
support the largest urban populations of all of the cities studied with a high percentage of low
socioeconomic neighborhoods, many of which are located within urban food deserts lacking
access to conventional food sources (US Census, 2014) (Appendix A: Figure 2). We chose
Schenectady because it demonstrates average demographic and economic data, neither depressed
nor booming (Appendix A: Figure 2). Mechanicville is the least dense urban area supporting the
lowest number of conventional food sources; another urban food desert with a vastly different
atmosphere than Albany. We chose the city of Saratoga Springs, NY because it is the wealthiest
city in the fastest growing county in New York State (Cooper, 2015) (Appendix A: Figure 2). In
Saratoga Springs, the high demand for development in the city increased land prices, pushed
farming communities farther from the city center, and allowed for commercial big-box stores to
offer food items sourced from around the world. However, what makes Saratoga Springs, NY
unique is the strong community support for local producers participating in the Saratoga Springs
Farmer’s Market while the number of globalized products sold in the city also increased
(Saratoga Farmer, 2012). Glens Falls is similar to Saratoga Springs in terms of its higher
socioeconomic status compared to the other cities surveyed (US Census, 2014) (Appendix A:
Figure 2). Glens Falls also has one of the smallest populations out of the cities surveyed in this
study (US Census, 2014) (Appendix A: Figure 2).

9
Figure 1: Cities in Capital Region
We decided to study cities to determine how different urban atmospheres (population per
square mile) as well as how economic fluctuations (median household income, per capita
income, percent persons in poverty) factor into consumer and grocery store desire to consume
and provide local foods (American FactFinder, 2010). We decided to focus our study specifically
on grocery stores because about 90% of all food consumed by Americans is purchased directly
from grocery stores (Supermarket Secrets, 2013). When most people think of buying local food
they think of Farmer’s Markets, CSAs, or buying direct from a farm. However, many people
around America do not have access to these alternative food supply venues. With this in mind,
we wanted to study a wide range of grocery stores so that we were able to fully measure the
entirety of local food availability the locations where the majority of people purchasing their
food. With all the benefits that surround local food at the slow food movement we feel it is

10
important for everyone, no matter their socioeconomic status or location of residence, to access
to this form of healthy, sustainable sustenance.
We categorized our retailers by how they market themselves and which niche markets
they fit into including: ethnic/specialty store, natural/health food store, convenience store, big-
box retailer, or locally owned grocery store chain (Appendix B: Figure 3, Figure 4).
In this study, literature on food system theory and market theory was reviewed along with
current data on grocery stores in Saratoga County and literature on food labeling. Data collection
was both quantitative and qualitative; a mixed methods approach was utilized in order to obtain
information on local food labeling in Saratoga County. The mixed methods approach allowed us
to gather information from each stakeholder in a way that obtained the most reliable results from
each individual. Gathering both quantitative and qualitative data through multiple methods gave
us the ability to view our research questions from the perspective of all involved stakeholders.
The goals of this study were: to quantify how much local food is offered in grocery stores
in the capital region, discover how it varies by store and city, how well it is advertised and how it
is marketed as local, what store managers’, employees’, and headquarters’ perceptions are of the
value of local food and how they differ, the attractiveness of local food to consumers,
consumers’ ability to identify local food, and consumers’ willingness to pay a premium for local
food.
Overarching Research Question: Why is there not more local food in city grocery stores within
the New York capital region?
Research Question #1: What is the availability of local food in grocery stores?

11
To measure the availability of local food, we created a checklist dividing all possible
local foods into 20 distinct categories: produce, herbs, milk, cheese, yogurt, ice cream, misc.
dairy, eggs, meat, chips/crackers, sauces/condiments, beverages, seafood, baked goods, misc.
packaged goods, honey, maple syrup, prepared foods, frozen foods, and nut butters. When
scanning the aisles of each store, the store would receive a check for a category as long as it
carried at least one local item in said category. These foods did not have to be labeled as local or
have any local signage, they just had to be made or produced locally and had to fit into the
individual grocery store’s definition of local. After the entire store was surveyed and categories
were checked off, the store would receive a percentage for the amount of local food availability
it provides. This percentage would be determined by dividing the number of categories the store
carries a local item in by the total possible 20 categories.
Research Question #2: How do grocery stores label and advertise local food?
The marketing initiatives of grocery stores were measured using a checklist (Appendix B:
Figure 5 & 6). Location where local food is placed throughout the store and the size of signage
used to showcase the local food were the two measures we used to scale the local food marketing
at each store. Documentation of signage size and text took place with a camera and photographs
from close up to farther away to illustrate perspective on signage placement as well as location
and displays of local food. Interviews were conducted from multilevel sources within each
grocery store from grocery store managers to produce managers to corporate headquarters to
better understand marketing strategies for local food. Archival analysis from grocery store
websites was conducted to collect data on if and how local food is advertised on these websites,
reflecting how these stores value local food.
12
Research Question #3: How do consumers and the grocery stores in the capital region perceive
local food?
Grocery store managers, produce managers, and consumers were interviewed on their
perceptions of local food and their definitions of local food. A surveys on local food perceptions
was designed online via Qualtrics and distributed through social media outlets to residents of the
capital region. Questions asked ranged from demographic information as well as specific
questions asking consumers how far away they think their food comes from if it is labeled as
“local,” to if the consumer is willing to pay more for a local food item versus a conventional
food item. (Appendix C). We selected survey questions utilized in peer reviewed papers and
market research studies conducted by grocery store chains (TJH Research and Strategy, 2011)
(“Buying into the Local Food Movement…”, n.d.) (Ringquist et al., 2016 ). The following
questions were taken from the 2011 research, “A Survey of Consumer Behavior and
Perceptions” by TJH Research and Strategy: Q1, Q3, Q5, Q6, Q8, Q11, Q16, Q17, and Q18
(Appendix C). We found Q9 and Q10 from ATKearney’s study on “Buying into the Local Food
Movement” (Appendix C). The following questions, Q14, Q15, and Q19, were pulled from
Deloitte’s “Capitalizing on the shifting Consumer Food Value Equation” (Appendix C). The
remaining questions were adapted from the above publications to better fit the purpose of our
study.
We hypothesized that stronger marketing initiatives will increase consumers’ ability to
find local food due to its increased visibility. We hypothesized that a large percentage of
consumers desire local food, however are unaware of its availability in grocery stores, therefore
if it is made more visible and obvious through a clear marketing initiative, local food sales may
increase.

13
GROCERY STORE RESULTS Grocery Store Definitions of Local Food
To understand how different grocery stores define “local,” we conducted interviews with
grocery store managers and employees as well as individuals on the corporate level of the stores
along with performing website analysis. All grocery stores surveyed had varying definitions of
“local food.” The Hannaford grocery store chain defines local food as food that is grown or
produced within the same state of each store’s location. Hannaford has grocery stores in Maine,
New Hampshire, Vermont, Massachusetts, and New York (“Close to Home,” 2014). Since we
surveyed stores in the Upstate New York region, Hannaford defined local food in those stores as
being grown or produced in the entirety of New York State.
Price Chopper grocery stores have a different, broader definition of local food. Price
Chopper Marketing Coordinator, Tyler Blance stated, “since consumers define ‘local’ as coming
from a variety of different geographical distances, we define local corporately as coming from
our Northeast trade area: NY, PA, CT, MA, VT, NH. Within that ‘supporting Northeast
producers’ definition, individual stores are merchandised with specific products produced within
their state or section of state; for example the Adirondack Region or the Capital District of New
York. These range from well-known brands at a state level to bread delivered directly from a
local bakery in town.”
Grocery stores that fall into the category of natural/health food stores also have varying
definitions of local food. Healthy Living, a small, privately-owned grocery store chain consisting
of one store in Saratoga Springs, NY and one store in Burlington, VT, does not have an actual
definition of local food that their stores adhere to. Healthy Living’s Marketing Assistant, Richie
Snyder stated, “we define ‘local’ as produced or grown near our store[s]... In our Vermont store

14
we have more Vermont products from the Burlington area. In our Saratoga store we have more
local New York products from the Saratoga area.”
Whole Foods, on the other hand, states on its website, “mostly we like to leave [the
definition of local food] up to our stores. Generally though, we try to use state lines. But, when a
state is enormous (like California, for example) we might get a bit more specific about it and
divide the state into growing areas like ‘The Bay Area’ or ‘Central California Coast’” (“Locally
Grown, Raised and Produced,” 2016 ).
Steuben St. Market of Albany NY, a small, independently-owned natural food store,
defines local food as food that is grown or produced within New York State (“Local Suppliers,”
2016 ). After surveying the store, it appeared that many of these designated “local,” New York
State products happened to be grown or produced in Upstate New York. Similarly, Adirondack
Natural Foods of South Glens Falls, NY appeared to label foods as local if they were grown or
produced in New York State or close by, such as in Vermont.
Four Seasons Natural Foods of Saratoga Springs, NY labeled produce as “local” if it was
grown close by in Upstate New York, whereas for packaged foods, products produced or grown
in New York State had a label that stated “Product of New York State.”
15
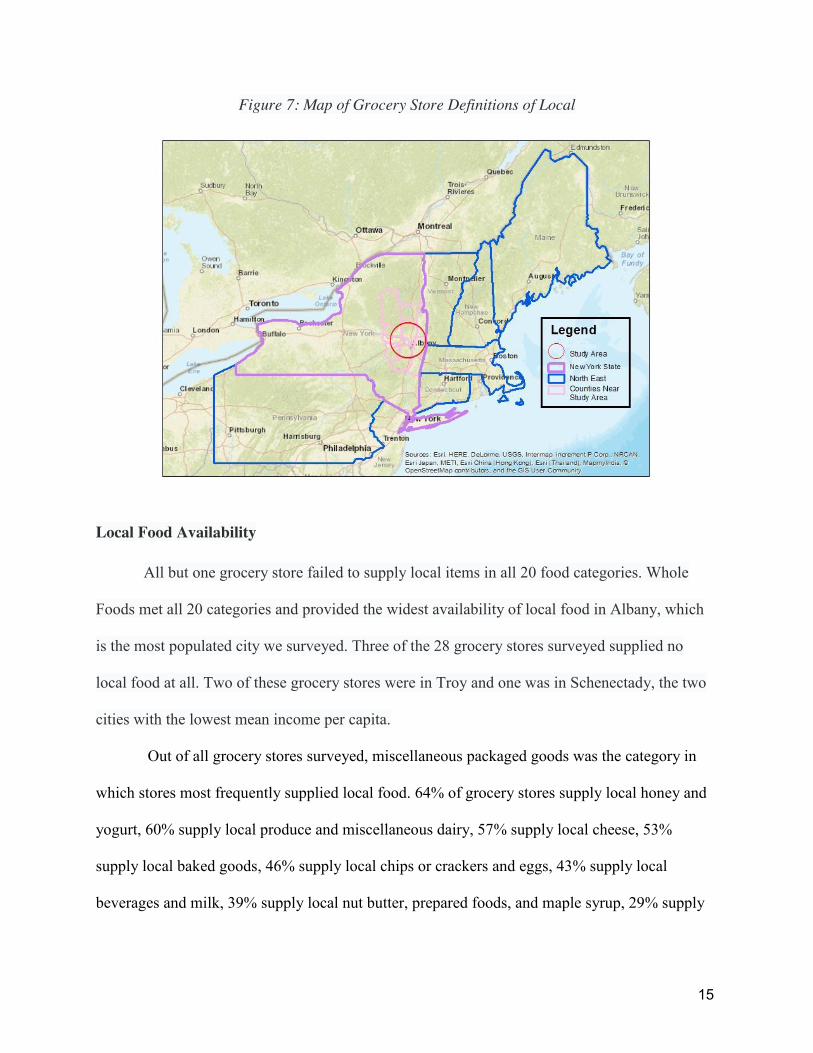
Figure 7: Map of Grocery Store Definitions of Local
Local Food Availability
All but one grocery store failed to supply local items in all 20 food categories. Whole
Foods met all 20 categories and provided the widest availability of local food in Albany, which
is the most populated city we surveyed. Three of the 28 grocery stores surveyed supplied no
local food at all. Two of these grocery stores were in Troy and one was in Schenectady, the two
cities with the lowest mean income per capita.
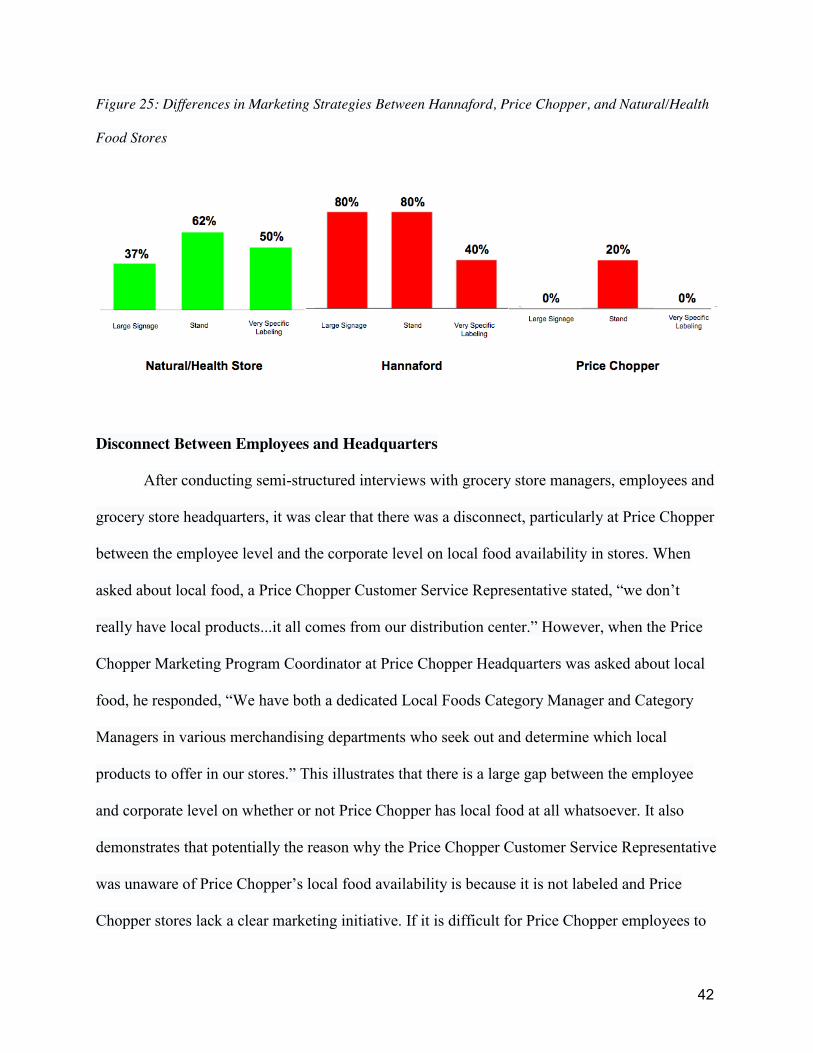
Out of all grocery stores surveyed, miscellaneous packaged goods was the category in
which stores most frequently supplied local food. 64% of grocery stores supply local honey and
yogurt, 60% supply local produce and miscellaneous dairy, 57% supply local cheese, 53%
supply local baked goods, 46% supply local chips or crackers and eggs, 43% supply local
beverages and milk, 39% supply local nut butter, prepared foods, and maple syrup, 29% supply

16
local meat and frozen foods, 11% supply local ice cream and herbs, and 7% supply local seafood
(Appendix B: Figure 7).
Saratoga Springs grocery stores provided the most local food coverage of all six cities
surveyed. Mechanicville, Glens Falls, and Albany all tied for second place in supplying the most
local food, then Troy and Schenectady. Natural/health food category supplied the most local
food availability followed by locally owned chains, big box, speciality, and finally convenience
stores (Figure 8). A majority of natural/health food stores supplied a high percentage of local
food availability, however Hannaford, a locally owned chain, supplied the second highest
percent of local food availability (Figure 9).
Figure 8: Percent Local Food Availability per Grocery Store Category

17
Figure 9: Local Food Coverage vs. Grocery Store Categories
By city Troy
Troy stores had an average local food availability of 25%. Two grocery stores in Troy
that supplied no local food were 4 Corner Grocery Store and Big Lots. Hannaford supplied the
most local food availability out of the stores surveyed in Troy.
Albany
The average percent of local food availability in albany was 50%. The store in Albany
with the highest local food availability was Whole Foods with 100%.
Mechanicville
Mechanicville stores had an average local food availability of 50%. The Price Chopper
had the lowest local food availability with 35%.
Schenectady

18
The average percent of local food availability in Schenectady was 18%. One grocery
store in Schenectady supplied no local food, Fabio Grocery.
Glens Falls
Glens Falls stores had an average local food availability of 50%. The store with the
lowest local food availability was Pure N Simple with 20%.
Saratoga Springs
The average local food availability of Saratoga Springs was 60%. Hannaford supplied the
most local food availability with 85% out of the surveyed Saratoga Springs stores.
Local Food Marketing
From the 28 grocery stores surveyed, fifteen stores showed some type of local marketing
initiative, with just eight stores implementing storewide local initiatives.
By City
Troy
Of the five grocery stores in Troy, Hannaford was the only grocery store with any local
labeling. However Hannaford provided a strong marketing initiative using small, medium, and
large signage as well as placing local items on end shelves and individual sections.
Albany
Three of the seven grocery stores surveyed in Albany had local food labeling and only
two of them, Whole Foods and Hannaford, supplied storewide programs. Hannaford displayed
its local food dispersed throughout the store as well as dedicating whole sections and end caps to
local marketing. Whole Foods provided local marketing throughout the entire store but did not
provide whole sections or end caps solely for the display of local food. Both Hannaford and

19
Whole Foods utilized signage in all sizes providing a range of visual aid to locally minded
shoppers while Steuben St. Market did not have a store wide program and only used small
signage to market a few local items.
Mechanicville
Of the three grocery stores in Mechanicville, only Hoosic Valley Shop N Save provided
any local labeling. Small signage on the price tag was used to differentiate local products. No
medium or large signs were present and the local signage was dispersed with no section or end
cap focused solely on the display of local foods.
Schenectady
Only Gabriel’s Supermarket, one of the two grocery stores surveyed in Schenectady,
provided local labeling but did not have a store wide program. It used one end shelf with medium
sized signage.
Glens Falls
Of four grocery stores surveyed within Glens Falls, two (Hannaford and Adirondack
Natural Foods) displayed local labeling and only Hannaford provided a store wide program. A
majority of the signage fell into the “small” category and was placed primarily on end caps.
Saratoga Springs
From all surveyed cities, our data shows that the Saratoga Springs/Wilton area has the
greatest number of grocery stores with local food marketing, six out of a total of seven stores.
Three of the seven stores showed expansive store wide local marketing programs. A majority of
stores allocated either an end shelf or section to display local food items.
By Type of Store
Ethnic/Specialty

20
Two ethnic/specialty stores were surveyed in Albany: Asian Supermarket and Al Medina
Market. No ethnic/specialty stores were present in the other cities surveyed. Although each of
these stores did carry a few locally grown or produced items, none were labeled as such. There
was no local signage or marketing throughout either store. The Asian Supermarket sold a wide
variety of produce however none was labeled with any sign indicating its growing location.
Natural/Health
The stores falling under the category of natural/health food, on average present more
comprehensive local marketing initiatives than stores falling into any other category. Nine of the
stores surveyed fell into this category and seven of those nine have local labeling present
somewhere throughout the store. Three stores out of those seven are the only stores we surveyed,
other than Hannafords, to have store wide, comprehensive local marketing initiatives where
every local item sold is labeled as such. These three stores are Healthy Living in Wilton, Four
Seasons in Saratoga Springs, and Whole Foods in Albany.
Each of these three stores have small, medium, and large signs and each display their
local food labeling on the price tags of each item, in whole shelf sections dedicated solely to
local foods, and in separate aisle end caps. Healthy Living markets their local food with a simple
“local” or “local legend” on the price tag of the item. Many products also have larger signs with
a more detailed description of the farmer or producer. Four Seasons markets their local food with
“Product of New York State” or “Locally Grown”. Whole Foods markets their local food as
“local” and includes the city within New York where each item is grown or produced.
Additionally, for each kind of local meat sold at Whole Foods a larger sign is provided with the
name of the farmer, a photo, and a detailed paragraph about the farm where the meat was raised.
Convenience Store

21
Out of the three convenience stores surveyed (4 Corner Store in Troy, Fabio Grocery in
Schenectady, Stewart’s in Mechanicville) only Stewart’s sells any locally grown or produced
food. However, even though Stewart’s carries a relatively large variety of local foods for a
convenience store, there is no local labeling present for any of these items. The only way to tell if
the item is local is to look on the package directly.
Big-Box Retailer
Three Big-Box retailers were surveyed, Target in Wilton, Big-Lots in Troy, and Walmart
Supercenter in Troy. Out of those three, only Target showed any local labeling. Target had one
large sign for products from Beekman Farm Pantry with the text “Farm to Shelf Goodness”.
Target carries a variety of other local foods but none were labeled as such. Walmart Supercenter
also carries local foods but has no labels. Big-Lots carries no local food and understandably has
no local labeling.
Locally Owned Chain Supermarket
Hannaford has one of the most extensive local labeling programs of any store in all cities.
Hannaford markets their local food with their signature “Close to Home” label. This label was
found throughout the entire store, was displayed on small, medium, and large signs, and was
found as a label on the price tag of local food items, marking a whole shelf section dedicated to a
local food item, and sectioning off the end cap of an aisle. All Hannaford stores market local
food with identical signage that is sent to each store from the Hannaford corporate headquarters.
Additionally, unlike any other store surveyed, Hannaford also has signs dispersed throughout the
store that tell customers what types of local food they sell in different sections of the store. The
most common local signage throughout Hannafords is the small price tag label that can be found

22
on the shelf in front of every local item they sell. This label includes the price of the item, a small
“Close to Home” label, and the specific city and state the food item comes from.
Comparatively, from the five Price Chopper’s surveyed, only the new Market 32 Price
Chopper located in Saratoga/Wilton displayed any type of local labeling or signage. Market 32 is
presenting itself as a greenwashed version of the normal Price Chopper, wanting to be thought of
as more “natural” and environmentally conscious. Because of this, Market 32 sections off a few
aisle end caps solely to present food labeled as “Home.Grown”. One medium sized
“Home.Grown” sign is the local marketing present on each of these end caps. Additionally,
some, not all, produce items have small “USA Grown” or “Product of USA” labels. Other than
those items, no other type of local labeling is present throughout the store even though they do
carry a variety of other locally grown or produced items. Overall, their local marketing is
inconsistent. All of the other Price Chopper stores have no local marketing whatsoever, even
though their local food availability is comparable to that of Hannaford.
CONSUMER RESULTS
Consumer Definitions of Local Food
54% of the consumers surveyed responded that they define local as 100 miles away from
their home or closer. 38% of consumers responded that they define local as the Upstate New
York region. 4% of consumers surveyed define local as within all of New York, and 4% define
local as within the Northeastern United States. Only two individuals, which equated to 1% of
respondents, defined local as within the United States (Figure 10).

23
The majority of individuals across all education levels, spanning from a high school
degree to a professional degree, responded that they define local as 100 miles away from their
home or closer. Similarly, 73.08% of the consumers aged 66 and older defined local as 100 miles
away from their home or closer. 55.12% of the consumers aged 50-65 defined local as 100 miles
away from their home or closer, as well as 59.26% of 34-49 year olds and 38.71% of 18-33 year
olds. The majority of individuals aged 18-33 that were surveyed defined local as within Upstate
New York, whereas the majority of individuals for every other age group defined local as within
100 miles of their home or closer.
Both the majority of males and the majority of females defined local as within 100 miles
of their home or closer; 60% and 51.3% respectively. The majority of individuals across all
incomes spanning from $25,000 to over $100,000 per year defined local as within 100 miles of
their home or closer as well.
Figure 10: Consumer Definitions of Local Food

24
Consumer Perceptions of Local Food
In order to test consumers’ initial perceptions of local food, they were asked to what
extent they agree or disagree with a series of statements. The prediction was that if the majority
of consumers agree or strongly agree with the positive statements about local food then overall
they would be more likely to carry the desire to search for and purchase local items over
conventional ones. Consumers were asked to respond to a total of nine statements by choosing to
either strongly agree, somewhat agree, neither agree nor disagree, somewhat disagree, or
strongly agree with each. The majority of consumers showed positive perceptions on local food
and seem to understand the benefits that come with buying local. The most obvious perceptions
consumers seem to have about local food is that it tastes better, is better for the environment, and
helps contribute to the local economy. Almost 63% of consumers somewhat or strongly agree
that local food tastes better, about 82% say it is better for the economy, and over 94% say they
think buying locally grown foods greatly contributes to the local economy (Figure 11).
Comparing these answers to how consumers responded to the negative statements about local
food, consumers continue to show a general positive opinion of the benefits that local food has to
offer. When asked if they think local food is attractive, rotten, or not fresh, almost 79% percent
of consumers said they either somewhat disagree or strongly disagree with this statement. Then,
when asked if they would rather buy organic food than local food, a large percentage (about
29%) felt neutral about the subject saying they neither agree nor disagree with the statement.
However, the majority of consumers did disagree with this statement. Just about 50% of
consumers said they somewhat disagree or strongly disagree that that would rather buy organic
than local. (Figure 11) This follows the trend that consumers seems to prefer local foods over
alternative sustainable options and conventional items.

25
Figure 11: Consumer perception of local food
Consumer Perceptions on Local Food Availability
Our survey aimed to grasp consumer perceptions through direct questions such as how
important availability is to them and indirect questions such as “do you agree or disagree that
there is a lack of selection of local food where you shop?”
When asked “how important is the availability of local food to you when choosing where
to shop?”, 30.77% responded “very important,” 47.84% responded “somewhat important,”
17.07% responded “not too important,” and only 4.33% responded “not at all a consideration”
(Figure 12). From this data, it is clear that the majority of consumers surveyed feel that the
availability of local food is somewhat important to very important to them when choosing where
to shop. Therefore, if consumers are not made aware of the availability of local food in grocery
stores through a clear marketing initiative, they are likely to perceive that the store does not have
a high availability of local food and potentially choose to shop elsewhere for local items.
Figure 12: The Importance of Local Food Availability to Consumers

26
When comparing responses of individuals who shop at Price Chopper, Hannaford, or
natural/health food stores once every other week to twice per week, both Hannaford and Price
Chopper shoppers had similar responses regarding the importance of the availability of local
food when choosing where to shop. The majority of both Hannaford and Price Chopper shoppers
responded that local food availability is “somewhat important to them”, whereas 27% and 26%,
respectively, responded that local food availability is “very important to them.” 21% of
Hannaford shoppers and 16% of Price Chopper shoppers responded that local food availability is
“not too important,” and 2% of Hannaford shoppers and 8% of Price Chopper shoppers
responded that local food availability is “not at all a consideration” (Figure 13). Natural/health
food store shoppers believed the availability of local food to be more important overall when
choosing where to shop. 54% of natural/health food store shoppers responded that local food
availability is “very important,” whereas 39% responded it is “somewhat important.” 6%
27
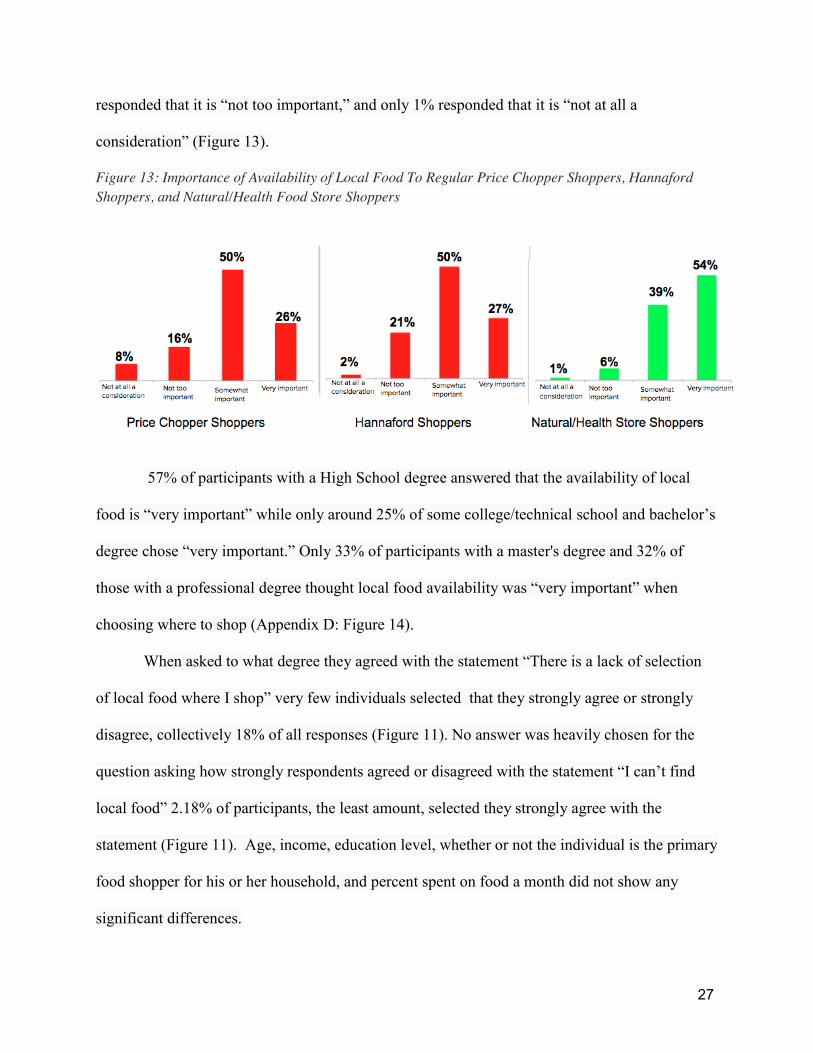
responded that it is “not too important,” and only 1% responded that it is “not at all a
consideration” (Figure 13).
Figure 13: Importance of Availability of Local Food To Regular Price Chopper Shoppers, Hannaford Shoppers, and Natural/Health Food Store Shoppers
57% of participants with a High School degree answered that the availability of local
food is “very important” while only around 25% of some college/technical school and bachelor’s
degree chose “very important.” Only 33% of participants with a master's degree and 32% of
those with a professional degree thought local food availability was “very important” when
choosing where to shop (Appendix D: Figure 14).
When asked to what degree they agreed with the statement “There is a lack of selection
of local food where I shop” very few individuals selected that they strongly agree or strongly
disagree, collectively 18% of all responses (Figure 11). No answer was heavily chosen for the
question asking how strongly respondents agreed or disagreed with the statement “I can’t find
local food” 2.18% of participants, the least amount, selected they strongly agree with the
statement (Figure 11). Age, income, education level, whether or not the individual is the primary
food shopper for his or her household, and percent spent on food a month did not show any
significant differences.

28
Consumer Perceptions on Local Food Marketing
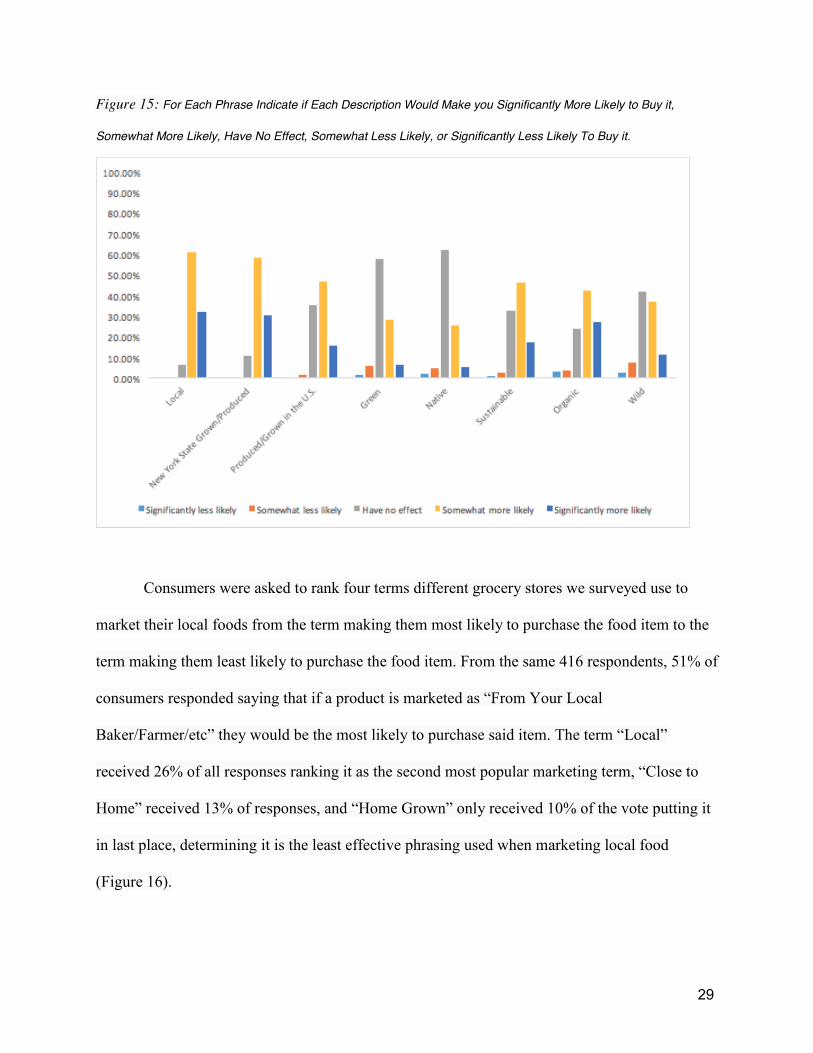
Through results gained from our consumer survey, we were able to determine that from
the marketing terms “Local”, “New York State Grown/Produced”, “Produced/Grown in the
U.S”, “Green”, “Native”, “Sustainable”, “Organic”, and “Wild”, seeing a food item marketed as
“Local” makes the consumer the most significantly more likely to purchase that item. Out of the
416 responses, 35% said “Local” made them significantly more likely to purchase the food item
and 57% of consumers said seeing an item marketed as “Local” made them somewhat more
likely to purchase said item (Figure 15). The marketing term “New York State Grown/Produced”
showed to be the second most popular among consumers with 32% of responders saying that
seeing an item marketed as such would make them significantly more likely to purchase that
item while 56% of responders said that term would make them somewhat more likely to make
that purchase (Figure 15). The terms “Green” and “Native” were the least popular among
respondents with only 7% of consumers saying marketing an item as “Green” would make them
significantly more likely to purchase said item, and only 6% of consumers saying marketing an
item as “Native” would make them significantly more likely to purchase said item (Figure 15).
29
Figure 15: For Each Phrase Indicate if Each Description Would Make you Significantly More Likely to Buy it,
Somewhat More Likely, Have No Effect, Somewhat Less Likely, or Significantly Less Likely To Buy it.
Consumers were asked to rank four terms different grocery stores we surveyed use to
market their local foods from the term making them most likely to purchase the food item to the
term making them least likely to purchase the food item. From the same 416 respondents, 51% of
consumers responded saying that if a product is marketed as “From Your Local
Baker/Farmer/etc” they would be the most likely to purchase said item. The term “Local”
received 26% of all responses ranking it as the second most popular marketing term, “Close to
Home” received 13% of responses, and “Home Grown” only received 10% of the vote putting it
in last place, determining it is the least effective phrasing used when marketing local food
(Figure 16).

30
Figure 16: Percent of Consumers who prefer each type of label phrasing
Can Consumers Distinguish Local Food?
When asked whether or not consumers can distinguish which foods are local and which
foods are not, only 5% of consumers responded that they can always distinguish which foods are
local and which are not. 48% responded most of the time, 39% responded sometimes, 6%
responded rarely, and 2% responded never (Appendix D: Figure 17). This shows us that the
majority of consumers claim to be able to distinguish which foods are local most of the time to
sometimes.
Out of the individuals who claim to always be able to distinguish which foods are local
and which are not, 36.36% have a professional degree, 22.73% have a master’s degree, 31.82%
have a bachelor’s degree, 9.09% have some college/technical school background, and 0% have
only a high school degree (Figure 18). Out of the individuals who claim to most of the time be
able to distinguish which foods are local and which are not, 21.50% have a professional degree,
29% have a master’s degree, 30% have a bachelor’s degree, 16.50% have some college/technical
school background, and 3% have a high school degree (Figure 18). Out of the individuals who

31
responded they can sometimes distinguish which foods are local and which are not, 23.75% have
a professional degree, 28.13% have a master’s degree, 28.13% have a bachelor’s degree, 16.25%
have some college/technical school background, and 3.75% have a high school degree (Figure
18). Out of the individuals who responded that they can rarely distinguish which foods are local
and which are not, 11.54% have a professional degree, 23.08% have a master’s degree, 30.77%
have a bachelor’s degree, 26.92% have some college/technical school background, and 7.69%
have a high school degree (Figure 18). Lastly, out of the individuals who can never distinguish
which foods are local and which are not, 12.50% have a professional degree, 12.50% have a
master’s degree, 50% have a bachelor’s degree, 25% have some college/technical school
background, and 0% have only a high school degree (Figure 18). There were no significant
differences between an individual's income and their ability to distinguish which foods are local
which are not when grocery shopping.
Figure 18: Ability to Distinguish Local Food By Education Level
Out of the individuals who claimed they can always distinguish local food, 64% believe
that finding local food is very important and 32% believe that finding local food is somewhat

32
important. Out of the individuals who claim they can sometimes distinguish local food, 57%
believe that finding local food is somewhat important and 22% believe that finding local food is
not too important. Lastly, out of the individuals who claim they can never distinguish local food,
50% believe that finding local food is not too important, and for 50% finding local food is not at
all a consideration (Figure 19). This shows that individuals who most value local food are
generally better able to distinguish it and are potentially willing to search for it more than
individuals who think local food is somewhat important to not at all a consideration when food
shopping.
Figure 19: Being able to always, sometimes, or never distinguish local food vs. How important the
availability of local food is when choosing a place to shop.
When consumers were asked if they look for local food in different categories of
groceries, consumers responded that the top five categories that they search for local food in are:
produce, dairy, eggs, baked goods, and meat. 71.15% of consumers responded yes to produce,

33
62.65% of consumers responded yes to dairy, 61.45% of consumers responded yes to eggs,
41.79% of consumers responded yes to baked goods, and 36.43% of consumers responded yes to
meat. Baked goods was the category that had the highest percentage of sometimes responses,
37.92%. 37.41% of consumers responded that they sometimes look for local meat, 33.90%
responded that they sometimes look for local sauces/dips/condiments, and 31.39% responded
that they sometimes look for local fish. 100% of consumers responded that they never look for
local frozen food, and 74.29% never look for local miscellaneous packaged foods such as pasta,
chips, and drink mixes. Lastly, 66.29% responded that they never look for local beverages and
the same percentage never looks for local sauces/dips/condiments (Figure 20).
Figure 20:Consumer Want to Purchase Local by Category of Food
Consumer Ability to Distinguish Local Food per Store
A cross tabulation was created on Qualtrics to show how well consumers who regularly
shop (once every other week to twice per week) at Price Chopper, Hannaford, or natural/health
food stores are able to distinguish local food. The results display that Price Chopper shoppers
have the most difficulty differentiating which products are local. 3% of Price Chopper shoppers

34
claimed they can “never” distinguish local food, 8% responded “rarely”, 48% responded
“sometimes”, 37% responded “most of the time”, and only 4% responded “always.” Hannaford
shoppers have an easier time distinguishing which products are local, with 1% of shoppers
claiming they can “never” distinguish which foods are local, 4% responding “rarely”, 39%
responding “sometimes”, 51% responding “most of the time”, and 5% responding “always.”
Natural/health food store shoppers appeared to have the easiest time distinguishing which
products are local and which are not, with 0% of shoppers responding “never” or “rarely”, 34%
responding “sometimes”, the majority (65%) responding “most of the time”, and 1% responding
“always” (Figure 21).
Figure 21: Are you able to distinguish local food at each type of store?
.

35
Consumer Willingness to Pay For Local Food
Consumers were asked if they would be willing to pay extra for local food and if so, how
much extra. The options were: Product would have to be cheaper, Would not pay more than for
other products, Up to 5% more, Up to 10% more, More than 10% more. Only 19% of consumers
said they would not pay more for a local food item than a comparable conventional item. Almost
70% responded saying they would be willing to pay 5% to 10% more for a local item and 12% of
consumers said they would even pay more than 10% more if an item was local (Figure 22).
Figure 22: Percent extra consumers are willing to pay for local food
According to the consumer survey results, the greater an individual’s income, the more
likely it is that they are willing to pay extra for local food. 24.70% of individuals who have an
annual income of 25k-75k would pay up to 10% extra for local food, whereas 43.84% of
individuals who have an annual income of 75k-100k are willing to pay up to 10% extra for local
food. 46.90% of individuals who have an annual income greater than 100k are willing to pay up
to 10% more for local food.

36
However it is not only their income that matters; the consumer survey results show that
the amount a consumer cares about shopping at a store that provides local food also correlates to
the amount extra they are willing to pay for a local product. Of the consumers who said the
availability of local food when choosing where to shop is very important to them, 40% would
pay up to 10% more and 29% said they would even pay more than 10% more for a local item.
Then, looking at the results of the consumers who responded that the availability of local food
when choosing where to shop is not at all a consideration, almost 67% said they would not pay
more for a local item compared to a conventional item. However, only 4% of all respondents said
that the availability of local food when choosing where to shop is not at all a consideration.
Whereas 31% of all respondents said it is very important (Figure 23).
Figure 23: Importance of local food availability when choosing where to shop vs. willingness to pay more for a local item
Grocery Store Brand Disloyalty
In our consumer survey, we asked how often consumers visited the grocery stores we
already surveyed. Of those we surveyed, 86% shopped at Price Chopper and 83% shopped at
Hannaford, making up the top two most visited grocery stores. Our analysis revealed 41% of
consumers who shop at Price Chopper also shop at a natural/health food store and 27% of

37
Hannaford consumers also shop at a natural/health food store. Consumers who shop at Price
Chopper are more likely to seek out a natural/health food store than Hannaford shoppers. We
theorized this brand disloyalty was due in part to Price Choppers failure to supply and market
items for the growing local food niche shoppers.
Discussion Comparison Between Grocery Store Definitions of Local Food and Consumer Definitions of Local Food
The majority of consumers surveyed across all demographics define “local” as within 100
miles of their home, whereas grocery stores had varying definitions of local. Overall, grocery
stores appeared to have a broader definition of local than consumers. For example, Hannaford
stores label foods as “Close to Home” or local if they are grown or produced within the entirety
of New York State. Price Chopper has an even broader definition of local, including the
Northeast trade area (New York, Pennsylvania, Connecticut, Massachusetts, Vermont, and New
Hampshire). Smaller, privately owned grocery stores, particularly those that fall into the category
of health and natural food stores, seemed to have slightly narrower definitions of local that are
more in keeping with consumers’ definition of local. Healthy Living does not have a local
definition but aims to supply as many Saratoga County grown and/or produced products as
possible. Four Seasons Natural Foods labels all produce grown within Upstate New York as
local (although New York State produced products are also labeled as local). Steuben St. Market,
another natural food store, defines local as coming from New York State, however many of the
products labeled as local happened to come from the Saratoga County area.

38
Stores that have broad definitions of local such as Price Chopper appear to be
disconnected with the majority of consumers’ narrower definition of locally produced foods.
Comparison between Local Food Availability in Grocery Stores and Consumer Perception of Local Food Availability
Shoppers generally care about local food availability in the grocery stores they shop at
with up to 76% of consumers selecting “somewhat important” to “very important” when asked
the importance of local food availability when choosing where to shop. Our survey’s results
showing consumer concern over local food accessibility contradicts the narrative of consumer
apathy we gathered from grocery store employee interviews.
Consumers are confused about if they can or cannot find local food across all ages,
incomes, and education levels. However, consumers generally think there is a lack of local food
where they shop. Our grocery store analysis demonstrates the opposite is occurring; stores have
more local items then they’re marketing for. Only three out of the 28 stores surveyed did not
supply any local food, yet up to 14 stores did not have local labeling. Only 57% of the grocery
stores with labeling maintained a consistent local label throughout the store.
Comparison between Local Food Categories Consumers Desire to Buy and
Categories Grocery Stores Supply
The top four categories consumers look for local food was produce (71%), Dairy (62%),
Eggs (61%), and Meat (36%). Our results from the grocery store checklist showed 100% of the
Price Choppers and Hannafords supplied local produce and Dairy. However, 0% of Price
Chopper stores supplied local eggs and meat. At Least one health food store supplied local food

39
in all the categories, however the percent health/natural food grocery stores with each category
was lower than that of hannafords (Figure 24).
Figure 24: Local Food Categories Consumers Look for Vs. Percent each Grocery store
Supplies Local Food in Top Food Categories
Comparison between Local Food Marketing in Grocery Stores and Consumer Perception of Local Food Marketing 386 out of 416 consumers surveyed responded that seeing a food item marked with a
label that reads “Local” results in them being either somewhat or significantly more likely to
purchase the item. With this in mind it is detrimental to grocery stores that only 10 of the 28
surveyed market their local food with the actual term “Local.” It is shocking that with so many
consumers being drawn to local foods, over half of the grocery stores surveyed that do carry a
variety of local foods do not make marketing them as “Local” a priority. Simply put, if local
foods are not labeled as such, fewer consumers will be aware of their locality and will likely

40
result in fewer purchases. Labels that do not use the word local but are intended to highlight that
a food item is local proved to be the least successful in appealing to consumers due to their
ambiguity. For example, the Hannaford “Close to Home” label and the Price Chopper
“Home.Grown” label were both rated least appealing among consumers according to our survey.
More specific labeling that stated “From Your Local Farmer” or “From Your Local Baker” and
listed the exact city, state, and farm or bakery that the food item originated from proved to be
most successful. Overall, it appears that consumers find specific labeling with the word “local”
the most appealing.
Price Chopper Vs. Hannaford Marketing The survey results conclude that 30% of consumers go to Hannaford about once every
week whereas only 26% of consumers go to Price Chopper about once every week. Price
Chopper shoppers are also more likely than Hannaford shoppers to shop regularly at a
natural/health Food Store in addition to Price Chopper. The reason for this could potentially be
that people who regularly shop at Price Chopper are unable to distinguish which products are
local, and therefore perceive that there is a low availability of local food at Price Chopper (even
though Price Chopper has a fair amount of local food). This displays the importance a of a clear
marketing initiative and how it has the ability to change consumers’ perceptions of local food
availability.
In addition, both Price Chopper’s “Home.Grown” label and Hannaford’s “Close to
Home” label are unsuccessful at conveying that a food item is local. Consumers also do not find
these phrases appealing. Hannaford’s more specific local labels that state “From Your Local
41
Farmer/Baker, etc.” were rated as the most appealing labels to consumers. If Hannaford changed
the phrasing of their “Close to Home” label as “Local” or “From Your Local
Farmer/Baker/Producer, etc.,” their local labeling initiative would be more successful at
appealing to consumers and conveying to them that the labeled items are indeed local. Price
Chopper would also be more successful at conveying a food item is local if the store adopts a
clear marketing initiative and labels all local food items as either “Local” or “From Your Local
Farmer/Baker/Producer, etc.” Stating the specific city and state that the item originates from
would also be beneficial and more appealing to consumers.
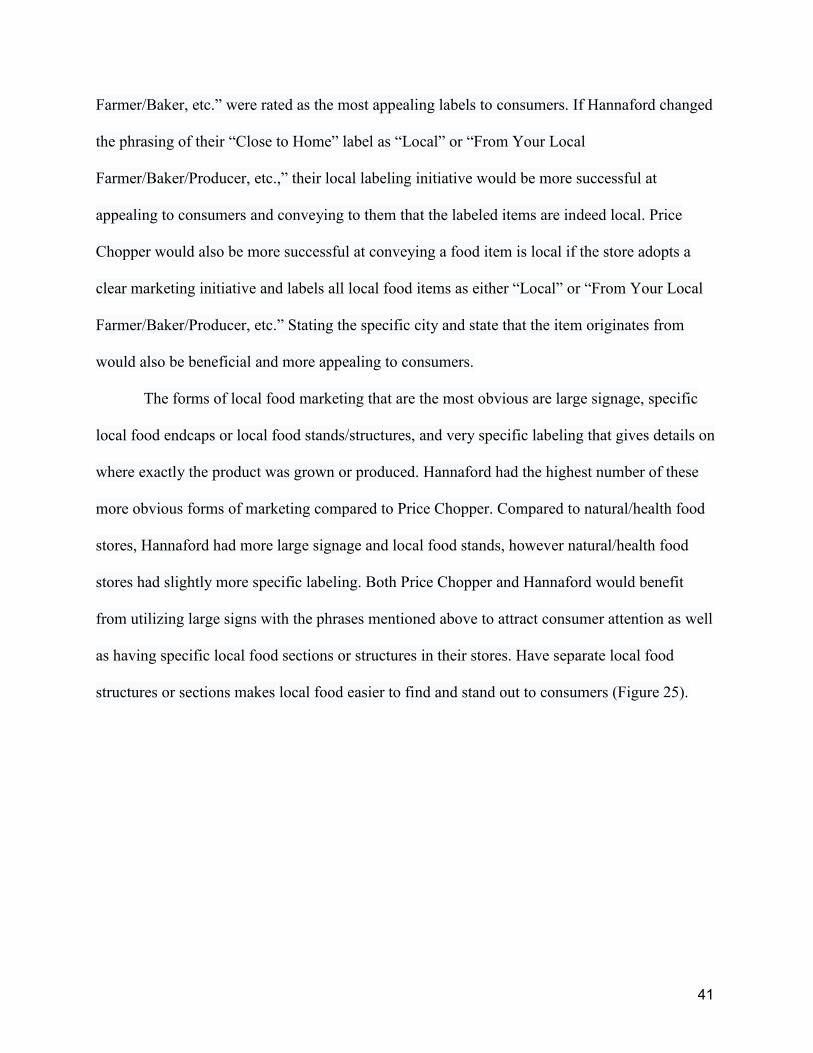
The forms of local food marketing that are the most obvious are large signage, specific
local food endcaps or local food stands/structures, and very specific labeling that gives details on
where exactly the product was grown or produced. Hannaford had the highest number of these
more obvious forms of marketing compared to Price Chopper. Compared to natural/health food
stores, Hannaford had more large signage and local food stands, however natural/health food
stores had slightly more specific labeling. Both Price Chopper and Hannaford would benefit
from utilizing large signs with the phrases mentioned above to attract consumer attention as well
as having specific local food sections or structures in their stores. Have separate local food
structures or sections makes local food easier to find and stand out to consumers (Figure 25).
42
Figure 25: Differences in Marketing Strategies Between Hannaford, Price Chopper, and Natural/Health
Food Stores
Disconnect Between Employees and Headquarters
After conducting semi-structured interviews with grocery store managers, employees and
grocery store headquarters, it was clear that there was a disconnect, particularly at Price Chopper
between the employee level and the corporate level on local food availability in stores. When
asked about local food, a Price Chopper Customer Service Representative stated, “we don’t
really have local products...it all comes from our distribution center.” However, when the Price
Chopper Marketing Program Coordinator at Price Chopper Headquarters was asked about local
food, he responded, “We have both a dedicated Local Foods Category Manager and Category
Managers in various merchandising departments who seek out and determine which local
products to offer in our stores.” This illustrates that there is a large gap between the employee
and corporate level on whether or not Price Chopper has local food at all whatsoever. It also
demonstrates that potentially the reason why the Price Chopper Customer Service Representative
was unaware of Price Chopper’s local food availability is because it is not labeled and Price
Chopper stores lack a clear marketing initiative. If it is difficult for Price Chopper employees to

43
distinguish which foods are local and which are not, it must be exceedingly difficult for
consumers to distinguish local products at Price Chopper. It is also no wonder why more
individuals who regularly shop at Price Chopper also shop at a natural/health food store to
potentially seek out local food options. They do not believe that Price Chopper has much local
food availability and therefore feel the need to go elsewhere to purchase it.
When other Price Chopper employees were asked about local food and if they feel
consumers value local food, many responded that consumers very rarely ask about local food and
therefore they do not feel that consumers care about local food. Price Chopper Headquarters
appears to value local food, however, and realize that consumers value local food. This once
again shows the disconnect that exists between the employee and corporate levels.
While Hannaford appeared to have a smaller gap between the employee and corporate
levels, nonetheless, a gap still exists. When one store manager was asked about how consumers
value local food, he responded that consumers generally do not ask about local food unless they
are seeking out a specific local product such as Saratoga Peanut Butter. In his opinion,
consumers have loyalty to certain brands that may happen to be local such as Saratoga Peanut
Butter, however they do not necessarily purchase these products solely because they are local.
Another Hannaford store manager stated that the only time consumers ask about local products is
during the summer when more local produce is available in Upstate New York. He did not seem
to feel that consumers desire local products other than produce. He also viewed local food
specifically as a seasonal commodity. While we were unable to reach individuals from
Hannaford’s corporate level, by looking at Hannaford’s website as well as the signage present in
stores, it is clear that Hannaford headquarters values local food and believes that consumers
value local food as well. Overall, however, unlike Price Chopper, Hannaford employees and

44
store managers were aware that Hannaford carries a wide range of local products due to its
extensive marketing initiative. They did not seem to be aware of how consumers value local
food, but were aware that Hannaford headquarters puts emphasis on advertising local food and
seeking it out by welcoming local vendors to pitch their products to individual stores and then to
Hannaford headquarters.
Conclusion
Our results demonstrate a majority of consumers (82%) would pay more, between 5%
and 10%, for a local product. Consumers are also looking for specific local product categories
like produce, dairy, eggs, baked goods, and meat, which the two most shopped at stores,
Hannaford and Price Chopper, have varying availability of in their stores. A higher number of
Hannaford stores supply local items in the top five categories consumers look for local food than
Price Chopper stores. Consumers demonstrated a loyalty to stores with stronger local food
marketing initiatives and higher local food availability. Specific labeling that states “From your
local farmer/baker” with the town and state the product is from was ranked as the top signage
consumers desire to buy a product labeled with the phrasing. Hannaford’s and Price Chopper’s
labels, “Close to Home” and “Home.Grown.” both ranked lowest in label wording that appeal
most to consumers. The labeling language and size as well as local food placement correlated
with consumers ability to easily distinguish or find local food in stores. We observed a
disconnect between locally owned chains’ headquarters and employees concerning if the store
had local items at all and the chains’ local marketing initiative. We estimate this disconnect
might account for inconsistent labeling across stores as well as the general confusion consumers
have finding local products.

45
Recommendations For Future Research We feel this research is only the start to a better understanding of local food availability
and marketing within grocery stores. With that in mind, there are a multitude of avenues future
researchers could combat.
First off, there were some obvious gaps in our data. For one, due to the location we were
based in and the people we had access to, about 50% of our consumer survey results came from
Saratoga Springs residents leaving the other 50% as a combination of the other four cities
surveyed (Albany, Troy, Schenectady, and Mechanicville). To obtain stronger data in these cities
we suggest trying to create stronger contacts with influentials in each city who would be willing
to distribute the survey to people they trust to take it. Additionally, surveys could be passed out
in person outside of grocery stores, schools, meeting places, or a variety of other locations where
large, diverse, groups of people visit. However, in many of these situations it is likely that
permission would have to be gained by the owner of the property and this is likely to pose a
challenge.
Additionally, in order to obtain more concrete consumer information, focus groups could
be implemented to work in conjunction with the consumer survey. More specific questions
should be asked in more of a conversational style. Also, a more diverse sampling could be
reached especially if the focus groups made sure to include a variety of consumers from each city
studied as well as a variety of consumers who shop at each category of grocery store.
Then moving forward from these focus groups, we recommend directly contacting the
grocery stores consumers claim to purchase local food from and look into gathering quantitative
data on consumer purchasing patterns. From this data, it can be confirmed whether or not the

46
consumer survey results saying that consumers care about purchasing local food actually
matches with their true actions.
Moving on from consumers, one area our research was unable to touch on is the process
grocery stores and local food producers need to go through in order for a local food item to begin
being sold in certain grocery stores. This could be researched by conducting interviews with the
head of purchasing at each store, with the head of the distribution center for each larger store,
and with the heads of different local food producers. These interviews have the potential to
provide information on why some local food are sold in some stores and why some are not,
creating more depth to the question of local food availability each store provides. With how
complicated the intricacies of the food system are, it seems likely there may be barriers within
the process of local food producers trying to get their foods to be sold in grocery stores and
potentially also within the process grocery stores must go through to seek out local items to sell.
Lastly, our specific research could be conducted again but with greater attention to details
on the availability and marketing present within each grocery store. The specific amount of food
available in each of the 20 categories could be recorded for each store as well as the most
popular brands available in each category. Additionally, the number of each size of local signs
each store provides could be recorded so that a more concise and accurate comparison between
the marketing measures of each store could be conducted.

47
Appendix Appendix A: City Data
Figure 2: Cities Surveyed in Capital District Region
2014 US Census United States Saratoga Springs Troy Albany Schenectady Mechanicville Glens Falls
Median household
income $53,482.00 $67,303.00 $39,526.00 $41,099.00 $38,916.00 $43,355.00 $45,538.00
Per capita income
(in past 12
months) $28,555.00 $39,395.00 $21,625.00 $24,342.00 $20,652.00 $23,525.00 $27,630.00
Percent persons
in poverty 14.80% 7.60% 27.60% 26.70% 23.80% 18.90% 14.00%
Population per
square mile
(2010) 87.4 947.3 4,840.10 4,575.30 6,135.50 6,178.40 3,817.20
Population
estimate (2014) 318,857,056 27,436 49,910 98,566 66,135 5,172 14,428
Appendix B: Grocery Store Data
Figure 3: Grocery Store Categorization
Location (City)
Grocery Store Name
Type of Grocery Store
Ethnic/Specialty Natural/Health Food
Convenience Store
Big-Box Retailer Locally Owned Chain Supermarket

48
Figure 4 : Map of Grocery Stores by Grocery Store Categories

49
Figure 5: Grocery Store Local Evaluation
Location of Local Food Size of Signage
Local Labeling?
(Yes/No)
Store wide program?
(Yes/No)
If “yes”, text of “local” program (e.g. “close to home”, “we love local”)
Disperse Section
End Cap
Small
(Only on the price tag)
Medium
(Separate sign on shelf)
Large
(Section heads or the label on an end cap)
Location details provided
(e.g. “Made in U.S.A., N.Y State,
City, Farmer information)
Consistent labeling on all local items throughout the store?
Local promotion on website?

50
Figure 6 : Specifics of Local Labeling
Store Who decides labeling
Prominence of Local Labeling
Specificity of Labeling
Individual Stores
Headquarters Yes No Specific Farmer/ producer location
Specific Location
Product of NY (or other state)
“Local,” “Close to Home,” “Home Grown”
Market 32 Price Chopper (Wilton)
X X X
Target (Wilton) X X X
Hannaford (Wilton)
X (have some discretion)
X (must sign off)
X X (baked goods)
X X
Healthy Living (Wilton)
X X X X
Price Chopper (Saratoga Springs)
X X
Four Season's (Saratoga Springs)
X X X (some produce)
X
Fresh Market (Saratoga Springs)
X X X
Price Chopper (Mechanicville)
X X
Stewart's (Mechanicville)
X X
Hoosic Valley Shop N Save (Schacticoke)
X X X X X
Hannaford (Troy)
X X X X (baked goods)
X X
4 Corner Grocery Store (Troy)
X X
Big Lots (Troy) X X

51
Walmart Supercenter (Troy)
X X
Uncle Sam's Good and Natural Products (Troy)
X X
Hannaford (Albany)
X X X X X
Tierra Farm Store (Albany)
X X X
Asian Supermarket (Albany)
X X
Al Medina Market(Albany)
X X
Whole Foods (Albany)
X X X X X X
Price Chopper (Albany)
X X
Streuben St. Market(Albany)
X X X
Fabio Grocery (Schenectady)
X X
Gabriels (Schenectady)
X X X
Hannaford (Glenn's Fall)
X X X X X X
Price Chopper (Glenn's Falls)
X X
Adirondack Natural Foods (Glen's Falls)
X X X
Pure N Simple (Glen's Falls)
X X
52
Figure 7: Categories Covered vs Type of Store
Ethnic/Specialty Natural/Health Food
Convenience Store
Big-Box Retailer Locally Owned Chain Supermarket
Produce X X X
Herbs X X
Milk X X X
Cheese X X X
Yogurt X X X X
Ice Cream X X X
MISC. Dairy X X X X
Eggs X X X X X
Meat X X
Seafood X
Chips/ Crackers
X X X X
Sauces/ Condiments
X X X
Honey X X X X X
Maple Syrup X X
Nut Butter X X X
MISC. Packaged/ Grocery
X X X X
Prepared Foods
X X X
Frozen Foods X X X X
Baked Goods X X X
Beverages X X X X
53
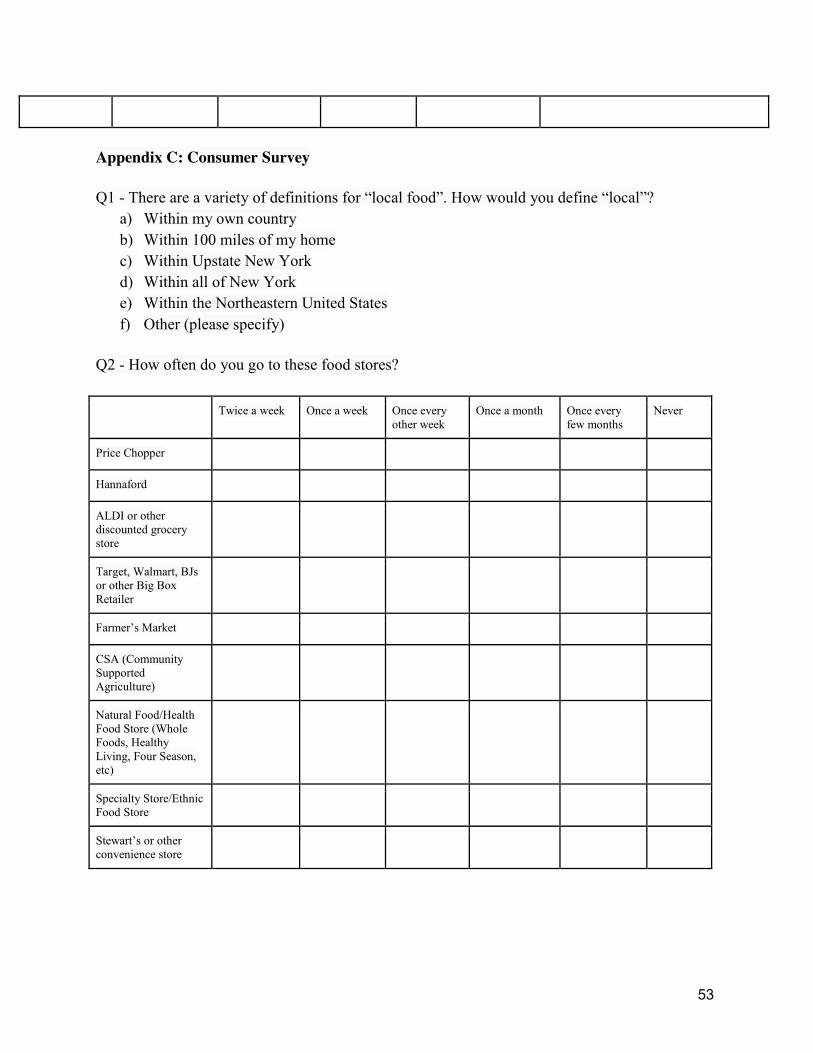
Appendix C: Consumer Survey Q1 - There are a variety of definitions for “local food”. How would you define “local”?
a) Within my own country b) Within 100 miles of my home c) Within Upstate New York d) Within all of New York e) Within the Northeastern United States f) Other (please specify)
Q2 - How often do you go to these food stores?
Twice a week Once a week Once every other week
Once a month Once every few months
Never
Price Chopper
Hannaford
ALDI or other discounted grocery store
Target, Walmart, BJs or other Big Box Retailer
Farmer’s Market
CSA (Community Supported Agriculture)
Natural Food/Health Food Store (Whole Foods, Healthy Living, Four Season, etc)
Specialty Store/Ethnic Food Store
Stewart’s or other convenience store

54
Q3 - How important is the availability of local food to you when choosing where to shop?
a) Not at all a consideration b) Not too important c) Somewhat important d) Very important
Q4 - Do you look for local food when you shop for the following categories of groceries?
Yes Sometimes No
Produce
Dairy
Eggs
Beverages
Sauces/Dips/Condiments
Peanut Butter/Nut Butter
Meat
Fish
Frozen Food
Premade Food
Miscellaneous packages foods (chips, pasta, drink mixes, etc.)
Baked Goods
Q5 - About what percent of your monthly food bill is spent on locally grown or produced foods?
a) 0-10% b) 10-20% c) 20-30% d) 30-40% e) >40%

55
Q6 - When shopping for your household, how often do you typically purchase locally grown foods when in season?
a) Weekly b) Monthly c) A few times a year d) Once a year e) Never
Q7 - When you go food shopping, can you distinguish which foods are locally produced/grown and which are not?
a) Always b) Most of the time c) Sometimes d) Rarely e) Never
Q8 - Below are statements about local food. Please rate how strongly you agree or disagree with them.
Strongly agree Somewhat agree Neither agree nor disagree
Somewhat disagree Strongly disagree
Local food is too expensive
There is a lack of selection of local food where I shop
I would rather buy organic than local
I can’t find local
Local food tastes better
Local food is not attractive/rotten/not fresh
Local food is better for the environment
Buying locally grown foods greatly contribute to the local economy
Local food is healthier than the alternatives

56
Q9 - How do you trust each format to deliver local food?
Not at all Not really Neutral Somewhat A lot
Big box retailer (Walmart, Target, BJ’s, etc.)
Locally-owned chain supermarket (Price Chopper, Hannaford, etc.)
Natural foods market
Gourmet specialty store
Convenience store
Q10 - How much extra are you willing to pay for local food?
a) Product would need to be cheaper b) Would not pay more than for other products c) Up to 5% more d) Up to 10% more e) More than 10% more
Q11 - The following are words and phrases that describe food products. For each please indicate if each description would make you significantly more likely to buy it, somewhat more likely, have no effect, somewhat less likely, or significantly less likely to buy it.
Significantly less likely
Somewhat less likely
Have no effect Somewhat more likely
Significantly more likely
Local
New York State Grown/Produced
Produces/Grown in the U.S.
Green
Native
Sustainable
Organic
Wild

57
Q12 - the following are words and phrases that describe food products. Please rank each phrase in order of your desire to buy the food product labeled with the phrase. 1 being the most likely to buy the product, and 4 being the least likely to buy the product.
1) Close to Home 2) Local 3) Home Grown 4) From Your Local Farmer/Baker/etc...
Q13 - Which city/town do you live in>
a) Saratoga Springs b) Albany c) Schnectady d) Troy e) Glens Falls f) Mechanicville g) Other (Please specify)
Q14 - What is your age group?
a) 18-33 b) 34-49 c) 50-65 d) 66+
Q15 - What is your gender?
a) Male b) Female c) Other
Q16 - Are you the primary food shopper in your household?
a) Yes b) No
Q17 - What best describes your education level?
a) No high school degree b) High school degree c) Some college/technical school d) Bachelor’s Degree e) Master’s Degree f) Professional Degree (Ph.D., M.D., etc.)

58
Q18 - Generally how much do you spend on food each month? a) <$100 b) $101-$150 c) $151-$200 d) $201-$300 e) $301-$400 f) $401-$500 g) $501-$750 h) $751+
Q19 - What is your income?
a) <$25k b) $25k-$75k c) $75k-$100k d) >$100k
Appendix D: Consumer Survey Data
Figure 14: Importance of Local Food Availability when Choosing Where to Shop vs. Education Level

59
Figure 17: Consumer Ability to Distinguish Local Food

60
References
Barlagne, C., Bazoche, P., Thomas, A., Ozier-Lafontaine, H., Causeret, F., & Blazy, J. (2015).
Promoting local foods in small island states: The role of information policies. Food Policy, 57,
62-72. Retrieved November 4, 2015, from
http://www.sciencedirect.com.lib2.skidmore.edu:2048/science/article/pii/
Brain, R. (2012, September 1). The Local Food Movement: Definitions, Benefits & Resources.
Retrieved November 4, 2015, from
https://extension.usu.edu/files/publications/publication/Sustainability_2012-09pr.pdf
Buying into the Local Food Movement - Paper - A.T. Kearney - A.T. Kearney. (n.d.). Retrieved
May 06, 2016, from https://www.atkearney.com/paper/-
/asset_publisher/dVxv4Hz2h8bS/content/buying-into-the-local-food-movement/10192
Close to Home. (2014). Hannaford.com. Retrieved April 6, 2016 from
http://www.hannaford.com/assets/hf/assets/pdf/cms/foodlove/ClosetoHomebrochure2014.pdf
Cooper, R. (2015, December 7). Saratoga mayor charts course heading into new year. Albany
Business Review. http://www.bizjournals.com/albany/news/2015/12/07/saratogas-controversies-
over-developments-will.html

61
DeWeerdt, S. (2013). Is Local Food Better. World Watch Magazine, 22(3). Retrieved February
13, 2016, from http://www.worldwatch.org/node/6064
Feagan, R. (2014). The Place of Food: Mapping out the 'Local' in Local Food Systems. Progress
in Human Geography, 31(1), 23-42. Retrieved October 11, 2015, from
http://phg.sagepub.com/content/31/1/23.short
Gogoi, P. (2010). The Local Food Movement Benefits Farms, Food Production, Evironment.
BusinessWeek Online. Retrieved December 4, 2015, from
http://ic.galegroup.com/ic/ovic/ViewpointsDetailsPage/ViewpointsDetailsWindow?query=&pro
dId=OVIC&contentModules=&dviSelectedPage=&displayGroupName=Viewpoints&limiter=&
disableHighlighting=&displayGroups=&sortBy=&search_within_results=&zid=&p=OVIC&acti
on=2&catId=&activityType=&documentId=GALE|EJ3010722203&source=Bookmark&u=pala8
2631&jsid=217a5f1f6067a268af1d99198d40ab2e
Gracia, A., & De-Magistris, T. (2016). Consumer Preferences of Food Labeling: What Ranks
First? Food Control, 61(March), 39-46. Retrieved April 15, 2016, from
http://www.sciencedirect.com/science/article/pii/S0956713515302024

62
Grover, J. (2002). Eating Locally. Ebscohost. Retrieved November 4, 2015, from
http://eds.a.ebscohost.com.lib2.skidmore.edu:2048/eds/pdfviewer/pdfviewer?sid=cdf64edc-
7215-494f-95f1-ad1319fe6fdd@sessionmgr4005&vid=4&hid=4210
Halweil, B. (2002). Home Grown: The Case For Local Food In A Global Market. World Watch
Institute.
https://books.google.com/books?hl=en&lr=&id=9cef41L_nVEC&oi=fnd&pg=PT3&dq=local+f
ood+labeling&ots=eQMMgj3NbO&sig=ysRfD3p92ifMGTM4-
xBT__GzciQ#v=onepage&q=local%20food%20labeling&f=false
Hempel, C., & Hamm, U. (2015). How important is local food to organic-minded
consumers? Appetite, 309-318.
H.R. 2419, Title VI Section 6015: Food, Conservation, and Energy Act of
2008. (2008). Retrieved November 4, 2015, from http://www.gpo.gov/fdsys/pkg/BILLS-
110hr2419enr/pdf/BILLS-110hr2419enr.pdf
Hu, W., Batte, M. T., Woods, T., & Ernst, S. (2012). Consumer Preferences for Local Production
and Other Value-Added Label Claims for a Processed Food Product. European Review Of
Agricultural Economics, 39(3), 489-510.

63
Locally Grown, Raised and Produced. (2016). Wholefoodsmarket.com. Retrieved April 6, 2016
from http://www.wholefoodsmarket.com/local
Local Suppliers. (2016). Steubenstmarket.com. Retrieved April 6, 2016 from
http://steubenstmarket.com/local-suppliers/
Mandatory Country of Origin Labeling of Beef, Pork, Lamb, Chicken, Goat Meat, Wild and
Farm-raised Fish and Shellfish, etc. (2009). Agricultural Marketing Service. Retrieved January
31, 2016 from http://www.regulations.gov/#!documentDetail;D=AMS-LS-07-0081-0815
Martinez, S. (2010). Varied interests drive the popularity of local foods. USDA.gov. Retrieved
May 6, 2016 from http://www.ers.usda.gov/amber-waves/2010-december/varied-interests-drive-
growing-popularity-of-local-foods.aspx
Mercola, A. (n.d.). Walmart Plans Grocery Push: Not Good For Small Farmers. Retrieved
November 4, 2015 from
http://articles.mercola.com/sites/articles/archive/2013/02/21/walmart-vs-local-farmers.aspx
64
Nestle, M. (2012, January 10). Defining Organic: The Difference Between
Sustainable and Local. Retrieved November 4, 2015 from
http://www.theatlantic.com/health/archive/2012/01/defining-organic-the-difference-between-
sustainable-and-local/250903/
Nie, C., & Zepeda, L. (2011, August 1). Lifestyle segmentation of US food shoppers to
examine organic and local food consumption. Retrieved December 16, 2015 from
http://www.sciencedirect.com/science/article/pii/S0195666311001164
Peters, C., Bills, N., Wilkins, J., & Smith, R. (2003, February 1). Vegetable Consumption,
Dietary Guidelines and Agricultural Production in New York State – Implications For Local
Food Economies. Retrieved December 16, 2015, from
http://agribusiness.dyson.cornell.edu/SmartMarketing/pdfs/peters2-03.pdf
Peters, C.J., et al. (2008). “Foodshed Analysis and Its Relevance to Sustainability,” Renewable
Agriculture and Food Systems, Vol. 24, pp. 1-7. Retrieved November 20th, 2015.
http://lib2.skidmore.edu:2048/login?url=http://search.ebscohost.com/login.aspx?direct=true&db
=edsagr&AN=edsagr.US201301606734&site=eds-live&scope=site
65
Pollan, M. (2006, June 7). What’s For Dinner? The New York Times Opinion Pages. Web.
Retrieved May 6, 2016 from http://pollan.blogs.nytimes.com/2006/06/07/whats-for-
dinner/?module=BlogPost-
ReadMore&version=Blog%20Main&action=Click&contentCollection=Opinion&pgtype=Blogs
®ion=Body&_r=0#more-27
Retail Trade: Geographic Area Series: Summary Statistics for the United States, States, Metro
Areas, Counties, and Places: 2007 more information 2007 Economic Census of the United
States. (2007). Retrieved November 8, 2015, from
http://factfinder.census.gov/faces/tableservices/jsf/pages/productview.xhtml?src=bkmk
Ringquist, J, T. Phillips, B. Renner, R. Sides, K. Stuart, M. Baum, J. Flannery. (2016).
Capitalizing on the shifting consumer value equation. Deloitte Consulting LLP. Retrieved March
6, 2016 from http://www2.deloitte.com/content/dam/Deloitte/us/Documents/consumer-
business/us-fmi-gma-report.pdf
Saratoga County Farms. (2015). Retrieved November 4, 2015, from
http://www.saratogafarms.com/farms.htm
American FactFinder. (2010). Retrieved May 06, 2016, from http://factfinder.census.gov

66
Supermarket Secrets. (2013). British Broadcasting Corporation (BBC). Retrieved November 18,
2015.
TJH Research and Strategy. (2011). A Survey of Consumer Behavior and Perceptions. The
Appalachian Sustainable Agriculture Project. Retrieved April 21, 2016, from
http://asapconnections.org/downloads/asap-2011-consumer-survey.pdf
U.S Census Bureau. (2014). Census.gov. Retrieved April 6, 2016 from
http://www.census.gov/quickfacts/table/PST045215/3675484
"USDA ERS - Retailing & Wholesaling: Retail Trends." USDA ERS - Retailing & Wholesaling:
Retail Trends. Web. 9 Nov. 2015. <http://www.ers.usda.gov/topics/food-markets-
prices/retailing-wholesaling/retail-trends.aspx>.
U.S. Grocery Shopper Trends 2014. (2014). Retrieved November 4, 2015, from
http://www.fmi.org/research-resources/grocerytrends2014
Vermeir, I., & Verbeke, W. (2006, April 1). Sustainable Food Consumption: Exploring the
Consumer. Retrieved December 16, 2015, from http://link.springer.com/article/10.1007/s10806-
005-5485-3#/page-1

67
Zepeda, L., & Leviten-Reid, C. (2004). Consumers’ views on local food. Journal
of Food Distribution Research, 35(3), 1-6.
http://ageconsearch.umn.edu/bitstream/27554/1/35030001.pdf