gorden river monitoring annual report 2001-02
TRANSCRIPT
HYDRO ELECTRIC CORPORATION ABN 048 072 377 158
4 Elizabeth St, Hobart
Tasmania, Australia
Basslink Monitoring Program
Gordon River Basslink Monitoring
Annual Report
2001-02
Prepared by
Hydro Tasmania September 2002
Executive Summary Gordon River Basslink Monitoring Annual Report 2001-02
ii
Executive Summary The Gordon River Basslink Monitoring Annual Report is an output from the Gordon River Basslink
Monitoring Program being conducted by Hydro Tasmania. The objective of the report is to present
the consolidated results of all monitoring undertaken pursuant to the Gordon River Basslink
Monitoring Program during the 2001-02 reporting year.
The Gordon River Basslink Monitoring Program for 2001-02 is the first of a three-year pre-Basslink
program of monitoring. The program will extend the understanding gained during the 1999-2000
investigative years (see Locher 2001) on the present condition, trends, and spatial and temporal
variability of potentially Basslink-affected aspects of the middle Gordon River environment.
The Gordon River Basslink Monitoring Program will obtain long-term data, which will permit more
precise quantification of spatial and temporal variability, processes and rates. This information will
assist in the future management of the river.
The results from the 2001-02 monitoring are reported in eight sections. Analyses of longer-term
trends have not been undertaken because there are presently insufficient data to make such
analyses meaningful. Most of the information presented in this document is extracted from field
reports produced by the various researchers employed to conduct the monitoring. The efforts of
these authors are duly acknowledged.
The requirements of the Gordon River Basslink Monitoring Program were met in 2001-02 and the
results of this work have set the groundwork for future years.
Hydrology The hydrological conditions in the Gordon River are important, both in direct terms and with regard
to their effect on the physical and biotic systems of the river. This section discusses the hydrological
regimes which prevailed in Lake Gordon, the power station tailrace, and site 44, some 33 km
downstream of the power station over the 2001-02 monitoring year.
The hydrological data presented in this report indicate that 2001-02 was a year when the power
station operated more than the historic average, but similarly to recent years. This resulted in a
significant drawdown of Lake Gordon, to decade-low levels and with the greatest drawdown being
in the summer-autumn months of 2002.
Power station operation, and hence tailrace discharge, varied throughout the year. From mid-
February to early June 2002 the power station was operating at full gate almost continuously.

Gordon River Basslink Monitoring Annual Report 2001-02 Executive Summary
iii
Analysis of the discharge pattern at site 44 (Gordon above Franklin) indicated that the discharge at
this site matched the power station tailrace discharge pattern closely, with occasional high discharge
spikes indicating natural high-volume discharge events originating in tributary streams.
The hydrological data indicated that the power station discharge had a dominating effect on the
middle Gordon River, from the power station tailrace to its junction with the Franklin River, which
tended to override the natural seasonal discharge pattern. The tributary streams contributed
seasonally variable amounts to this flow, as well as peak discharges during major runoff events.
Water Quality Water quality parameters were measured in Lakes Gordon and Pedder, and in the Gordon River
downstream of the power station. Additionally, an investigation into the incidence of gas
supersaturation at the power station tailrace was undertaken.
Water column profiles in Lake Gordon showed that thermocline and oxycline development was
strongest in autumn and winter, although in the Boyes Basin this was likely to be influenced by the
level of inflow to the lake from the upper Gordon River. This was in contrast to the shallower and
more exposed waters of Lake Pedder, where no significant stratification was recorded.
Surface water quality in both lakes was similar, with low turbidity and chlorophyll-a values, mildly
acidic pH, healthy levels of dissolved oxygen and low concentrations of nutrients. A single, relatively
high, chlorophyll-a reading was recorded at Boyes Basin in Lake Gordon.
The water quality in Lakes Pedder and Gordon is good, and within the range expected for lakes in
this region. Water temperature variations at sites downstream of the power station were greatly
reduced, both diurnally and seasonally. Low dissolved oxygen in water released from the power
station was not perceived as a great risk because it has been shown to reach ambient conditions
within 1.5 km of the tailrace. Gas supersaturation was not evident in 2001-02.
Fluvial Geomorphology The fundamental objective of the Gordon River Basslink geomorphology monitoring program is to
document fluvial geomorphic changes to the banks of the middle Gordon River between the power
station tailrace and the mouth of the Franklin River, and to relate these changes to power station
operations or other factors wherever possible.
Erosion pin and scour chain results indicated that scour of bank toes occurred throughout the study
area, although this generally decreased with distance downstream. A notable exception was Zone
1, closest to the power station, where relatively little toe scour was recorded.
Seepage erosion was most active in Zone 2, and decreased in occurrence and magnitude
downstream. Erosion pins and scour chains recorded the enlargement of bank cavities and the

Executive Summary Gordon River Basslink Monitoring Annual Report 2001-02
iv
downslope movement of sandy material. Seepage erosion activity was consistent with peizometer
data which showed banks were saturated for much of the monitoring period due to the prolonged
use of 3-turbines at the power station.
Karst Geomorphology Preliminary results suggest that deposition may have occurred in both caves between December
2001 and March 2002. Very limited data from the two original erosion pins installed in September
2000 suggest that there may have been nett deposition in Kayak Kavern and negligible nett
sediment change in Bill Neilson Cave.
In the Gordon-Albert dolines there has been no appreciable sediment movement between
November 2001 and March 2002.
The water level recorder data show that during the summer months when there was little natural
pickup in the catchment, the Gordon River affects the recorder in Bill Neilson cave when the power
station is releasing more than approximately 210 cumecs. This suggests that, at least during the
summer months, the dry sediment bank located 175 m into the cave is unlikely to be affected by
power station operations. The influence of high flows in the Denison River on the system in
conjunction with the power station will be assessed when the winter data have been obtained and
the recent theodolite survey data have been analysed.
Riparian Vegetation Riparian vegetation sampling was conducted in Autumn (March-April) 2002. Quadrat studies were
conducted at 23 permanent sites along the Gordon, Franklin and Denison Rivers. Photo-monitoring
studies will commence in December 2002 and be reported in the 2002-03 Gordon River Basslink
Monitoring Annual Report.
Eighty-five plant species were recorded in the quadrat surveys across all rivers. Patterns of species
cover and diversity within the Gordon River were consistent with Davidson and Gibbons (2001)
who found significant differences in sites of varying bank height on the Gordon River. The results
show a large degree of variability within each site as a consequence of the extent of disturbance
regime. Species diversity, species overlapping cover and litter cover are all directly proportional to
bank height (quadrat location) whilst bare ground and root exposure are inversely proportional.
Recruitment within the Gordon River has not previously been quantified. The diversity and level of
recruitment identified in the March-April monitoring was higher at most sites than expected and not
confined to the quadrats above high water mark. This suggests that recruitment of some species is
not restricted by propagule availability and that conditions suitable for germination do occur.
However, the absence of older cohorts casts doubt on the successful establishment of seedlings
and more temporal data points are required to confirm any patterns.

Gordon River Basslink Monitoring Annual Report 2001-02 Executive Summary
v
Macroinvertebrates Macroinvertebrates were monitored in spring (October) 2001 and autumn (March) 2002 at nine
sites in the Gordon River between the Gordon Power Station and the Franklin River confluence. Six
reference sites were monitored in the Franklin, Denison, Maxwell and Jane Rivers at the same time.
Patterns and trends in abundance and diversity and O/E values were similar to those observed in
1995-96 and 1998-99, with:
Ø Number of taxa and total macroinvertebrate abundance increasing from low levels with
distance downstream of the power station;
Ø O/E values increasing with distance from the power station, with values upstream of the
Denison River falling significantly below reference values.
Ø no statistically significant differences between O/E values for 2001-2002 and 1998-99.
Data collected in this survey will form part of the database used to assess changes in instream
conditions associated with changes in flow regimes resulting from Basslink.
Algae Benthic algae were sampled in spring (October) 2001 and autumn (March) 2002 at nine sites in the
Gordon River between the Gordon Power Station and the Franklin River confluence.
Patterns and trends in algal cover were similar between the two seasons, with:
Ø Aquatic flora having a consistently low to moderate cover across all sites (a grand mean
of 10.5% by area for both seasons);
Ø Moss and filamentous algae having similar, low overall mean % cover across all sites (4-
5% of benthic area);
Ø Mean percent moss and filamentous algal cover being positively correlated;
Ø Filamentous algae being more abundant at sites 75 (G4) and 74 (G4a) than at other sites;
Ø Characeous algae being observed only at sites 74 (G4a) and 72 (G5).
Ø Mean moss cover being highly variable, ranging from 0.2 to 19%.
Ø Macrophytes occurring only at sites 72 (G5) and 69 (G6), and at low densities.
Fish Monitoring of the fish populations of the middle Gordon River, its tributaries and out-of-catchment
reference sites was conducted during December 2001 and April 2002. Six sites were not visited
due to bad weather, high flows or equipment failure at the time of monitoring.
The fish communities of the middle Gordon River remain dominated by brown trout (Salmo trutta),
particularly in the upstream zones, where they have become well established in all the major
tributaries as well as the Gordon River itself. A second exotic species, redfin perch (Perca fluviatilis)
was detected for the first time in the middle Gordon River.

Executive Summary Gordon River Basslink Monitoring Annual Report 2001-02
vi
Numbers and distributional patterns for native species were similar to previous surveys of the
Gordon River, with galaxiids being largely restricted to tributaries, and with low numbers of native
species in the Gordon River generally. Other patterns initially reported during the Basslink
investigations phase are still apparent, including the higher catch rates of eels in the Gordon River
compared to the unregulated Franklin River.

Gordon River Basslink Monitoring Annual Report 2001-02 Contents
vii
Contents
1 The Report and the Program .... . . . . . . . . . . . . . . . . . . . . . . . . . . . . . . . . . . . . . . . . . . . . . . . . . . . . . . . . . . . . . . . . . . . . . . . . . . . . . . . . . . . . . . . 1 1.1 Origins ..........................................................................................................................................................1 1.2 The Monitoring Program .........................................................................................................................1 1.3 Logistical Considerations .........................................................................................................................2 1.4 Document structure ..................................................................................................................................2 1.5 Authorship of Field Reports ....................................................................................................................3
2 Hydrology... . . . . . . . . . . . . . . . . . . . . . . . . . . . . . . . . . . . . . . . . . . . . . . . . . . . . . . . . . . . . . . . . . . . . . . . . . . . . . . . . . . . . . . . . . . . . . . . . . . . . . . . . . . . . . . . . . . 4 2.1 Site Locations ..............................................................................................................................................4 2.2 Gordon Power Station discharge ..........................................................................................................5
2.2.1 Event analyses....................................................................................................................................5 2.2.2 Discharge ............................................................................................................................................6 2.2.3 Median monthly discharge.............................................................................................................7 2.2.4 Duration curves .................................................................................................................................8
2.3 Gordon River downstream of the power station ..............................................................................8 2.3.1 Flow ......................................................................................................................................................8 2.3.2 Median monthly flows.....................................................................................................................9 2.3.3 Duration curves .................................................................................................................................9
2.4 Conclusion.................................................................................................................................................11
3 Water Quality.. . . . . . . . . . . . . . . . . . . . . . . . . . . . . . . . . . . . . . . . . . . . . . . . . . . . . . . . . . . . . . . . . . . . . . . . . . . . . . . . . . . . . . . . . . . . . . . . . . . . . . . . . . . . . 12 3.1 Site Locations and field methods.........................................................................................................12
3.1.1 Lake Gordon ....................................................................................................................................12 3.1.2 Lake Pedder......................................................................................................................................12 3.1.3 Gordon River ...................................................................................................................................13
3.2 Water Quality of Lake Gordon ............................................................................................................13 3.2.1 Characteristics of stratification ....................................................................................................13 3.2.2 Surface water characteristics .......................................................................................................17
3.3 Water Quality of Lake Pedder..............................................................................................................19 3.3.1 Characteristics of stratification ....................................................................................................19 3.3.2 Surface water characteristics .......................................................................................................19
3.4 Water Quality in the Gordon River....................................................................................................22 3.4.1 Water Temperature ........................................................................................................................22 3.4.2 Dissolved Oxygen ..........................................................................................................................22
3.5 Gas supersaturation ................................................................................................................................25 3.6 Conclusion.................................................................................................................................................26
Contents Gordon River Basslink Monitoring Annual Report 2001-02
viii
4 Fluvial Geomorphology... . . . . . . . . . . . . . . . . . . . . . . . . . . . . . . . . . . . . . . . . . . . . . . . . . . . . . . . . . . . . . . . . . . . . . . . . . . . . . . . . . . . . . . . . . . . . . . 27 4.1 The fluvial geomorphology monitoring program ............................................................................ 27 4.2 Methodology............................................................................................................................................ 28
4.2.1 Monitoring approaches ................................................................................................................ 28 4.2.2 Timing and frequency of monitoring ........................................................................................ 31 4.2.3 Geomorphology monitoring sites.............................................................................................. 31
4.3 Hydrologic Overview............................................................................................................................. 38 4.4 Results ........................................................................................................................................................ 40
4.4.1 Erosion pins & scour chains......................................................................................................... 40 4.4.2 Peizometers ..................................................................................................................................... 40 4.4.3 Photo Monitoring........................................................................................................................... 41
4.5 Discussion................................................................................................................................................. 41 4.5.1 Erosion pins and scour chains..................................................................................................... 41 4.5.2 Peizometer results.......................................................................................................................... 47 4.5.3 Synthesis of monitoring data....................................................................................................... 47
5 Karst Geomorphology... . . . . . . . . . . . . . . . . . . . . . . . . . . . . . . . . . . . . . . . . . . . . . . . . . . . . . . . . . . . . . . . . . . . . . . . . . . . . . . . . . . . . . . . . . . . . . . . . 49 5.1 Gordon-Albert karst area – November 2001 .................................................................................. 49
5.1.1 Monitoring sites .............................................................................................................................. 49 5.1.2 The new cave (GA-X1).................................................................................................................. 50
5.2 Nicholls Range karst area – December 2001.................................................................................. 50 5.2.1 Monitoring sites .............................................................................................................................. 50 5.2.2 Kayak Kavern and Bill Neilson Caves ....................................................................................... 51
5.3 Both karst areas – March 2002........................................................................................................... 51 5.3.1 Erosion pin data.............................................................................................................................. 51 5.3.2 Water level recorders.................................................................................................................... 52 5.3.3 Photo-monitoring ........................................................................................................................... 52
5.4 Discussion................................................................................................................................................. 54 5.4.1 Erosion pins...................................................................................................................................... 54 5.4.2 Water level monitoring in Bill Neilson cave ............................................................................ 55 5.4.3 Photo-monitoring ........................................................................................................................... 55
6 Riparian Vegetation ... . . . . . . . . . . . . . . . . . . . . . . . . . . . . . . . . . . . . . . . . . . . . . . . . . . . . . . . . . . . . . . . . . . . . . . . . . . . . . . . . . . . . . . . . . . . . . . . . . . . 56 6.1 Monitoring Strategy................................................................................................................................ 56 6.2 Methods..................................................................................................................................................... 56
6.2.1 Quadrat sites................................................................................................................................... 56 6.2.2 Photo-monitoring sites .................................................................................................................. 60
6.3 Results ........................................................................................................................................................ 60 6.3.1 Species diversity and cover......................................................................................................... 61 6.3.2 Ground conditions......................................................................................................................... 67 6.3.3 Species recruitment ....................................................................................................................... 69 6.3.4 Photo-monitoring methodology trial ......................................................................................... 70
6.4 Discussion................................................................................................................................................. 71

Gordon River Basslink Monitoring Annual Report 2001-02 Contents
ix
7 Macroinvertebrates .. . . . . . . . . . . . . . . . . . . . . . . . . . . . . . . . . . . . . . . . . . . . . . . . . . . . . . . . . . . . . . . . . . . . . . . . . . . . . . . . . . . . . . . . . . . . . . . . . . . . . 72 7.1 Introduction and Methods ....................................................................................................................72
7.1.1 Monitoring Sites ..............................................................................................................................72 7.1.2 Macroinvertebrate sampling ........................................................................................................73 7.1.3 Habitat variables .............................................................................................................................73 7.1.4 Analysis ..............................................................................................................................................73
7.2 Results.........................................................................................................................................................73 7.2.1 Quantitative (surber) sampling....................................................................................................73 7.2.2 RBA (kick) sampling .......................................................................................................................75
7.3 Conclusion.................................................................................................................................................78
8 Algae ... . . . . . . . . . . . . . . . . . . . . . . . . . . . . . . . . . . . . . . . . . . . . . . . . . . . . . . . . . . . . . . . . . . . . . . . . . . . . . . . . . . . . . . . . . . . . . . . . . . . . . . . . . . . . . . . . . . . . . . . 81 8.1 Introduction and Methods ....................................................................................................................81
8.1.1 Sample sites......................................................................................................................................81 8.1.2 Benthic algal survey........................................................................................................................82 8.1.3 Analysis ..............................................................................................................................................83
8.2 Results.........................................................................................................................................................83 8.3 Conclusion.................................................................................................................................................85
9 Fish ... . . . . . . . . . . . . . . . . . . . . . . . . . . . . . . . . . . . . . . . . . . . . . . . . . . . . . . . . . . . . . . . . . . . . . . . . . . . . . . . . . . . . . . . . . . . . . . . . . . . . . . . . . . . . . . . . . . . . . . . . . 87 9.1 Introduction...............................................................................................................................................87 9.2 Methods .....................................................................................................................................................87 9.3 Results and Discussion...........................................................................................................................89
9.3.1 Exotic Species ..................................................................................................................................90 9.3.2 Eels and lampreys ...........................................................................................................................93 9.3.3 Galaxiids and Sandys .....................................................................................................................96 9.3.4 Isolation and Competitive Interactions.................................................................................. 100 9.3.5 Fish stranding ................................................................................................................................ 100
9.4 Conclusion.............................................................................................................................................. 100
10 References... . . . . . . . . . . . . . . . . . . . . . . . . . . . . . . . . . . . . . . . . . . . . . . . . . . . . . . . . . . . . . . . . . . . . . . . . . . . . . . . . . . . . . . . . . . . . . . . . . . . . . . . . . . 102


Gordon River Basslink Monitoring Annual Report 2001-02 The Report and the Program
1
1 The Report and the Program The Gordon River Basslink Monitoring Annual Report is a primary output from the Gordon River
Basslink Monitoring Program being conducted by Hydro Tasmania. The objective of the report is to
present the consolidated results of all monitoring undertaken pursuant to the Gordon River Basslink
Monitoring Program during 2001-02. The report is to be submitted to the Minister administering the
Water Management Act 1999 (Tasmania) and the Commonwealth Environment Minister. It will also
be made available to the public.
1.1 Origins The Basslink interconnector will link the Tasmanian electricity grid to that of mainland Australia. This
will allow Hydro Tasmania to feed renewable energy into the National Electricity Market in a
manner that optimises the utility of hydro-electric generation (i.e. to meet demand peaks), while also
facilitating the importation of electricity to Tasmania at other times, as required. Consequently, once
Basslink commences, there are likely to be changes to the way the Tasmanian electricity generation
system is operated.
Comprehensive modelling and associated studies have been carried out to determine what the
effects of these likely changes will be, and how best to mitigate any detrimental effects (Locher
2001). The middle Gordon River downstream of the Gordon Power Station, in the south-west of the
state, is the waterway most likely to be affected by the changes resulting from Basslink operations.
The discharge from the power station runs through the Tasmanian Wilderness World Heritage Area,
to the river mouth at Macquarie Harbour.
Hydro Tasmania commissioned numerous environmental studies in this area to better understand
the existing conditions within the regulated reaches of the Gordon River. The results of these studies
have been reported in the Basslink Integrated Impact Assessment Statement (IIAS), under the
heading, “Potential effects of changes to hydro power generation”.
The Gordon River Basslink Monitoring Program arose from the recommendations of these studies
and was endorsed by the Basslink Joint Advisory Panel (Basslink Joint Advisory Panel 2002a). The
monitoring program was incorporated into Hydro Tasmania’s Special Water Licence by a Deed of
Amendment (Basslink Joint Advisory Panel 2002b). The work carried out in 2001-02 was based on
the requirements of the ‘Gordon River Basslink Monitoring Program’ document, which forms
Attachment 3 of the draft Deed of Amendment.
1.2 The Monitoring Program The Gordon River Basslink Monitoring Program for 2001-02 formed the first of a three-year pre-
Basslink program of monitoring which aims to extend the knowledge gained during the 1999-2000
investigative years (see Locher 2001) on the middle Gordon River environment.

The Report and the Program Basslink Monitoring Program Annual Report 2001-02
2
The Gordon River Basslink Monitoring Program will obtain long-term data which will permit
refinement of theories and more precise quantification of spatial and temporal variability, processes
and rates. This information will assist in the future management of the river.
1.3 Logistical Considerations Access presents significant challenges in this part of the Tasmanian Wilderness World Heritage
Area. On-site monitoring activities require helicopter support, due to the density of the terrestrial
vegetation and the absence of access infrastructure.
Power station shutdowns are needed because the only viable landing sites are on cobble bars in the
river bed which are exposed only when there is little or no discharge from the power station. They
are also required because most of the biotic and geomorphic monitoring activities require
measurements or sampling to take place within the river channel, which would not be possible
under conditions of power station discharge.
The Gordon River Basslink Monitoring Program has a schedule of four visits per year, each involving
two consecutive days of power station shutdown. These are planned to occur most frequently on
weekends when power demand from the Gordon Power Station is lowest. If access is impossible on
the planned shutdown weekends, the outage for the Gordon Power Station will be postponed to a
subsequent weekend. Co-ordination with the power station maintenance timetable is an essential
requirement of the monitoring program.
In 2001-02, the summer (December) fish monitoring was interrupted by poor weather, resulting in it
being re-scheduled for the following weekend.
1.4 Document structure This document is the first of the Gordon River Basslink Monitoring Annual Reports to be produced,
and is organised into ten sections and an executive summary.
This first section outlines the origins of the Gordon River Basslink Monitoring Program and discusses
the requirements and some of constraints of the program. Sections 2 - 9 report on the monitoring
work which was undertaken during 2001-02, and present the consolidated results of each of the
individual monitoring elements. These include:
Ø Hydrology (section 2);
Ø Water quality (section 3);
Ø Fluvial geomorphology (section 4);
Ø Karst geomorphology (section 5);
Ø Riparian vegetation (section 6);
Ø Macroinvertebrates (section 7);
Ø Algae (section 8); and
Ø Fish (section 9).

Gordon River Basslink Monitoring Annual Report 2001-02 The Report and the Program
3
Only the results from the 2001-02 monitoring are reported in each of these sections. No analyses of
longer-term trends have been undertaken because there are presently insufficient data to make such
analyses meaningful. The analysis of variability and time-related trends within the Gordon River
ecosystems under study will be reported in the Basslink Baseline Report, which is due to be
submitted two months prior to the implementation of Basslink.
Section 10 lists the reference material used in this document.
1.5 Authorship of Field Reports The information presented in sections 2-9 was extracted from field reports produced by the various
researchers employed to conduct the monitoring, as shown in Table 1.1. The efforts, and original
contributions, of these authors are duly acknowledged.
Table 1.1. Section numbers, section titles and original authors from whose field reports most of the information in
sections 2 – 9 was extracted.
Section Section title Author(s)
2 Hydrology: David Blühdorn and Bryce Graham (Hydro Tasmania)
3 Water quality Chris Bobbi (Hydro Tasmania)
4 Fluvial geomorphology Lois Koehnken (consultant) and Helen Locher (Hydro Tasmania)
5 Karst geomorphology J. Deakin and J. Butt (consultants)
6 Riparian vegetation Anita Wild (Hydro Tasmania)
7 Macroinvertebrates Peter Davies and Laurie Cook (consultants)
8 Algae Peter Davies and Laurie Cook (consultants)
9 Fish David Andrews and Mick Howland (Hydro Tasmania)

Hydrology Basslink Monitoring Program Annual Report 2001-02
4
2 Hydrology The hydrological conditions in the Gordon River are important, both in direct terms and with regard
to their effect on the physical and biotic systems of the river. The potential for changed hydrology is
the major impact that Basslink might have on the Gordon River, and hence any changes to the
current hydrological regime are of prime importance in the analysis of other aspects of the Gordon
River environment.
This part of the Gordon River Basslink Monitoring Annual Report summarises the hydrological data
from Lake Gordon and the Gordon River downstream of the Gordon Power Station for the 2001-02
period.
2.1 Site Locations The seven gauging stations used to record river levels during 2001-02 are shown in Figure 2.1.
These were sites 39, 44, 62, 69, 71, 75 and the Gordon Power Station. Figure 2.1 also indicates a
monitoring location at site 65. This site has yet to be installed.
Figure 2.1 Location of the water level recorders in the middle Gordon River.
N
#Y
#S
#S
#S#S
#S #S #S
Den
ison
R.
Max
wel
l R.
Lake Gordon
GordonPowerStation
39
44
6265
69 71 75
Lake Pedder
Ca tchm
ent B
oundary
Fran
klin
R.
Sp
rent R.
Olg
a R.
Ora n
ge R.
Albert R.
0 10 20 Kilometres

Gordon River Basslink Monitoring Annual Report 2001-02 Hydrology
5
Data from the power station tailrace and site 44 were analysed for this report. Site 44 is the furthest-
downstream site which is not affected by tidal influences. The intermediate sites showed discharges
appropriate to their locations in the catchment, but not differing greatly in overall pattern from
those recorded at site 44 or the tailrace. Notable differences are the greater influx of natural flows at
sites downstream of the Denison River, and a general decrease in the height of river level change
(associated with power station operation) with distance downstream.
2.2 Gordon Power Station discharge
2.2.1 Event analyses One of the methods for analysing power station operations and their effect on discharge into the
Gordon River is to examine the number and duration of shutdown (zero discharge) and operating
(>zero discharge) events.
In 2001-02, the shutdown events were clustered around the 1-4 hour and 8-9 hour durations, with a
further peak at 72 hours. Figure 2.2 shows the frequency and duration of shutdown events for 2001-
02. In total, 47 shutdown events were recorded during the year. Most of the 40 to 72 hour events
were attributable to the power station outages required for downstream monitoring.
Figure 2.2. Frequency and duration of zero discharge (shutdown) events recorded for the Gordon Power Station during
2001-02.
0
1
2
3
4
5
6
7
8
1 2 3 4 5 6 7 8 9 10 11 12 16 20 24 28 32 36 40 44 48 72 96 120
144
186
336
504
>504
Zero discharge event duration (hrs)
Num
ber
of e
vent
s .

Hydrology Basslink Monitoring Program Annual Report 2001-02
6
The number of operating events, indicated by discharges greater than zero cumecs (m3.s-1), is shown
in Figure 2.3. This figure indicates that there were a comparatively large number of short (1 hour)
events, as well as those of 16, 44, 180, and >504 hours duration. This pattern tends to indicate that
the power station was operated for relatively lengthy periods between shutdowns, with some short-
duration start-ups.
Figure 2.3. Frequency and duration of operating (discharge > zero) events recorded for the Gordon Power Station
during 2001-02.
2.2.2 Discharge Figure 2.4 shows the time series plot for discharge from the power station tailrace. It indicates that,
from July to October 2001, the power station was operating at a range of discharges, which
frequently varied from full gate (approximately 250 cumecs) to zero. From mid-October to early
February, the power station operated at intermediate discharges, while from mid-February to early
June 2002 the power station was operating at full gate almost continuously. During June, the
pattern reverted to one of intermittent operation.
0
1
2
3
4
5
6
7
8
1 2 3 4 5 6 7 8 9 10 11 12 16 20 24 28 32 36 40 44 48 72 96 120
144
186
336
504
>504
Release event duration (hrs)
Num
ber
of e
vent
s .

Gordon River Basslink Monitoring Annual Report 2001-02 Hydrology
7
Figure 2.4. Tailrace discharge from the Gordon Power Station during 2001-o2
2.2.3 Median monthly discharge Figure 2.5 shows the median monthly discharge from the power station for 2001-02 compared with
long-term values. This illustrates that the power station has been run on higher loads than has been
the historic norm. The power station has been utilized more frequently due to increased power
demand, and this trend is likely to continue. Additionally, the Gordon Power Station has been
required to make up the loads which stations elsewhere in the state have been unable to provide
due to the dry winter of 2001 and the relatively dry autumn of 2002.
Figure 2.5. Median monthly discharge from the tailrace of the Gordon Power Station for 2001-02.
0
50
100
150
200
250
July
Aug
ust
Sep
tem
ber
Oct
ober
Nov
embe
r
Dec
embe
r
Janu
ary
Feb
ruar
y
Mar
ch
Apr
il
May
June
Dis
char
ge (m
3 .s-1
)
Historic
2001-02
0
50
100
150
200
250
300
Jul-0
1
Aug
-01
Sep
-01
Oct
-01
Nov
-01
Dec
-01
Jan-
02
Feb
-02
Mar
-02
Apr
-02
May
-02
Jun-
02
Jul-0
2
Dis
char
ge (
m3 .s-1
) .

Hydrology Basslink Monitoring Program Annual Report 2001-02
8
2.2.4 Duration curves Figure 2.6 gives the duration curve for the power station tailrace discharge for 2001-02. It shows the
characteristic bulges and inflection points associated with the operation of one (80 m3.s-1), two (160
m3.s-1), or three (240 m3.s-1) turbines.
Figure 2.6. Duration curve for discharge from the power station tailrace for 2001-02.
2.3 Gordon River downstream of the power station A number of stream gauging sites have been established on the Gordon River downstream of the
Gordon Power Station (Figure 2.1). The Gordon above Franklin site (site 44) is the furthest
downstream site unaffected by tidal influences. Site 44 records the power station discharge
following 33 km of flow in the natural stream channel. It also captures the discharge from a number
of significant tributaries, including the Albert, Orange, Denison, Olga and Sprent Rivers. It does not
include information about flows in the Franklin River. Data from site 44 were used to indicate the
effects of tributary streams on the discharge pattern from the power station.
2.3.1 Flow Figure 2.7 shows the time series plot for flow at site 44 for 2001-02. The power station discharge
pattern (see Figure 2.4) remains discernable, especially during the autumn 2002 period. Over this is
superimposed the discharge pattern from tributary streams, such as the Denison River, giving the
high peak discharges evident in Figure 2.7. Peak flows occurred in August 2001 and June 2002.
0
50
100
150
200
250
300
0 10 20 30 40 50 60 70 80 90 100
Percentage of time flow is exceeded
Flo
w (m
3 .s-1
)

Gordon River Basslink Monitoring Annual Report 2001-02 Hydrology
9
Figure 2.7. Discharge recorded at site 44 (Gordon above Franklin) during 2001-02.
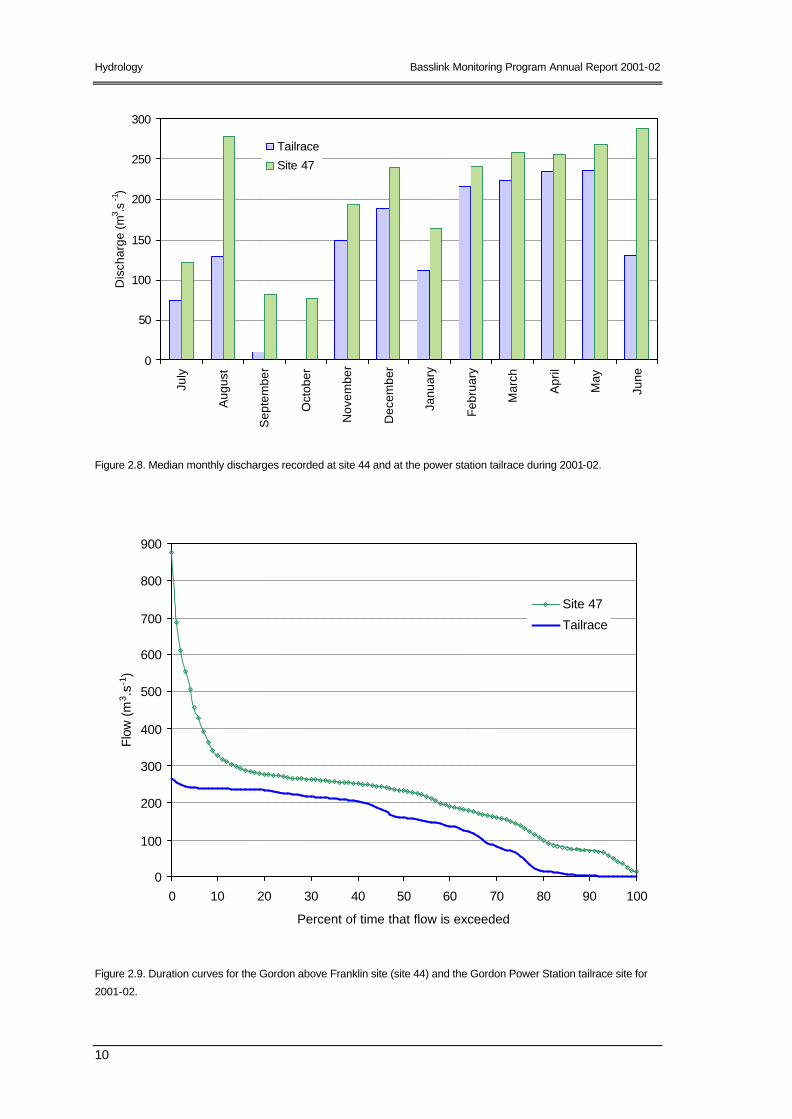
2.3.2 Median monthly flows The peaks in the discharge data for site 44 (Figure 2.7) are also reflected in the median monthly
discharge. Figure 2.8 shows the median monthly discharge for this site as well as the tailrace site. It
indicates that substantial natural discharges occurred in August 2001 and June 2002, while the
power station discharge tended to dominate the flow pattern from February to May 2002.
2.3.3 Duration curves Figure 2.9 illustrates the duration curve for Gordon River site 44 (upstream of the Franklin River)
and compares it with that of the power station tailrace. It shows the effects of the power station
discharge, indicated by the curve’s shape, between the 10th and 90th percentiles, matching that of
the tailrace. It also shows the effects of natural inflows, indicated by the high discharge values in the
<10th percentiles and the elevated discharge from the 90th to the 100 th percentiles, as well as
providing the additional flow in the 10th to 90 th percentile range.
0
50
100
150
200
250
300
350
400
450
500
550
600
650
700
750
800
850
900
Jul-0
1
Aug
-01
Sep
-01
Oct
-01
Nov
-01
Dec
-01
Jan-
02
Feb
-02
Mar
-02
Apr
-02
May
-02
Jun-
02
Dis
char
ge (
m3 .s-1
)
Hydrology Basslink Monitoring Program Annual Report 2001-02
10
Figure 2.8. Median monthly discharges recorded at site 44 and at the power station tailrace during 2001-02.
Figure 2.9. Duration curves for the Gordon above Franklin site (site 44) and the Gordon Power Station tailrace site for
2001-02.
0
50
100
150
200
250
300
July
Aug
ust
Sep
tem
ber
Oct
ober
Nov
embe
r
Dec
embe
r
Janu
ary
Feb
ruar
y
Mar
ch
Apr
il
May
June
Dis
char
ge (m
3 .s-1
)
Tailrace
Site 47
0
100
200
300
400
500
600
700
800
900
0 10 20 30 40 50 60 70 80 90 100
Percent of time that flow is exceeded
Flow
(m
3 .s-1
)
Site 47
Tailrace

Gordon River Basslink Monitoring Annual Report 2001-02 Hydrology
11
2.4 Conclusion The hydrological data presented in this report indicate that 2001-02 was a year when the power
station operated more than usual.
Discharge from the power station reflected this operational pattern. Event analysis indicated that the
power station was operated for relatively lengthy periods between shutdowns, with some short-
duration start-ups. The power station discharge also showed an alteration to the usual seasonal
discharge pattern in that, from mid-February to early June 2002, the power station was operating at
full gate almost continuously. The median monthly discharge values show that, in almost every
month, the discharge for 2001-02 exceeded the historic value.
Given this high rate of power station usage and generally low tributary flows, it could be expected
that downstream sites would be more than usually dominated by power station discharges. The
furthest-downstream gauging site that is independent of tidal influences, the Gordon above Franklin
(site 44), was used to compare discharge patterns. The data from this site showed that the discharge
at site 44 matched the power station tailrace discharge pattern closely, with occasional peaks
indicating natural high volume discharge events originating in tributary streams. This pattern was
also evident in the median monthly flow pattern, which closely followed that of the tailrace except
in August 2001 and June 2002, when high natural discharge events occurred. The duration curve
for site 44 also mirrored the tailrace pattern, with the inclusion of flood flows forming the lower
percentile values (0 - 10), and more discharge at the higher percentile values (90 - 100).
The hydrological data indicate that the power station discharge had a dominating effect on the
flows in the middle Gordon River, from the power station tailrace to its junction with the Franklin
River and the commencement of tidal influences on water levels. The tributary streams contributed
seasonally variable amounts to this flow, as well as peak flows during major runoff events.
Under natural conditions, late summer and autumn tend to be the times of lowest flows. In 2001-
02, these months recorded among the highest median monthly discharge values.
Water Quality Basslink Monitoring Program Annual Report 2001-02
12
3 Water Quality Water quality parameters were measured in Lakes Gordon and Pedder, and in the Gordon River
downstream of the power station. Additionally, an investigation into the incidence of gas
supersaturation at the Gordon Power Station tailrace was undertaken.
3.1 Site Locations and field methods In the lakes, water samples for nutrient analysis were taken from the surface waters. For each water
sample, the following parameters were measured by laboratory analysis:
Ø total phosphorus and dissolved reactive phosphorus (DRP);
Ø nitrite, nitrate, total Kjeldahl nitrogen (TKN), ammonia;
Ø chlorophyll-a;
Ø metals (Fe, Mn, Zn, Cd, Cu, AL, Co, Cr, Ni and Pb);
Ø sulphate;
Ø alkalinity; and
Ø dissolved organic carbon.
Additionally, depth profiles of basic physico-chemical parameters (water temperature, dissolved
oxygen, conductivity, pH, and turbidity) were taken at approximately 2m intervals at each of the
nominated depth profile sites in Lakes Gordon and Pedder. The water quality monitoring sites are
shown in Figure 3.1.
3.1.1 Lake Gordon During 2001-02, water quality data from Lake Gordon were collected quarterly at the power station
intake, at Calder Reach and at Boyes Basin near the upper Gordon Rive r inflow. At all three of these
locations, depth profiles of water temperature, dissolved oxygen, pH, and conductivity were taken
to characterise stratification of the water column. Depth samples for turbidity were collected only at
the power station intake. Surface water chlorophyll-a, water temperature, pH, conductivity, turbidity
and dissolved oxygen concentration was also recorded at these locations. Surface samples for
laboratory measurement of nutrients and metals were collected in Lake Gordon at the power
station intake and at Boyes Basin.
3.1.2 Lake Pedder At Lake Pedder, depth profile data were collected quarterly off Groombridge Point, which is the
deepest part of the lake. Surface water samples (chlorophyll-a, water temperature, pH, conductivity,
turbidity and dissolved oxygen concentration) were recorded at Groombridge Point, Hermit Basin
and Edgar Bay, while samples for laboratory analysis were collected from the surface only at
Groombridge Point.

Gordon River Basslink Monitoring Annual Report 2001-02 Water Quality
13
N
#Y
%[
%[
%[
%[
%[
%[
Sp
re
nt R.
Olg
a R.
Ora n
ge R
.A
lb ert R.
Deni
son
R.
Ma x
wel
l R.
Lake Pedder
Lake Gordon
GordonPowerStation
#
Boyes Basin
#
Calder Reach#
Knob Basin
#
Hermit Basin
#
Groombridge Point
#
Edgar Bay
0 5 10 15 20 25 Kilometres
#S
#S
75
62
Figure 3.1. Map of the locations of water quality monitoring sites in Lakes Pedder and Gordon, and the Gordon River,
for 2001-02.
3.1.3 Gordon River Water quality monitoring was carried out remotely at three sites within the Gordon River
downstream from the Gordon Power Station. These were:
Ø Gordon Power Station tailrace;
Ø Gordon River at site 75 (G4 -Albert Rapids);
Ø Gordon River at site 62 (downstream of the Denison junction).
Water temperature was measured at all three sites, while dissolved oxygen was also recorded at the
tailrace site to monitor the changes in oxygen concentrations resulting from power station
operations.
3.2 Water Quality of Lake Gordon
3.2.1 Characteristics of stratification As a result of the complex morphology and bathymetry of the lake, stratification tends to be
variable between basins. However the most pronounced stratification appears to have occurred at
the same time (March 2002) at all three site. At deeper locations, pronounced stratification was also
evident in June 2001. Figure 3.2 and Figure 3.3 present the profile data from the sites monitored in
Lake Gordon.

Water Quality Basslink Monitoring Program Annual Report 2001-02
14
Figure 3.2. Depth profiles of dissolved oxygen at Boyes Basin (top plots), Calder Reach (middle plots) and at the power
station intake (bottom plots) recorded between May 2001 and April 2002.
0
5
10
15
20
25
30
35
0 2 4 6 8 10 12
Dissolved Oxygen (mg/L)D
epth
(m)
18-Jun-01
18-Sep-01
29-Nov-01
21-Mar-02
0
10
20
30
40
50
60
0 2 4 6 8 10 12
Dissolved Oxygen (mg/L)
Dep
th (
m)
18-Jun-01
18-Sep-01
29-Nov-01
21-Mar-02
0
20
40
60
80
100
120
0 2 4 6 8 10
Dissolved Oxygen (mg/L)
Dep
th (
m)
18-Jun-01
18-Sep-01
29-Nov-01
21-Mar-02
0
5
10
15
20
25
30
35
0 20 40 60 80 100
Dissolved Oxygen (%Saturation)
Dep
th (
m)
18-Jun-01
18-Sep-01
29-Nov-01
21-Mar-02
0
10
20
30
40
50
60
0 20 40 60 80 100
Dissolved Oxygen (% Saturation)
Dep
th (m
)18-Jun-01
18-Sep-01
29-Nov-01
21-Mar-02
0
20
40
60
80
100
120
0 20 40 60 80 100
Dissolved Oxygen (% Saturation)
Dep
th (
m)
18-Jun-01
18-Sep-01
29-Nov-01
21-Mar-02

Gordon River Basslink Monitoring Annual Report 2001-02 Water Quality
15
Figure 3.3. Depth profiles of temperature (left) and pH (right) at Boyes Basin (top plots), Calder Reach (middle plots)
and at the power station intake (bottom plots) recorded between May 2001 and April 2002.
0
5
10
15
20
25
30
35
6 8 10 12 14 16 18
Temperature (degC)
Dep
th (
m)
18-Jun-01
18-Sep-01
29-Nov-01
21-Mar-02
0
10
20
30
40
50
60
6 8 10 12 14 16 18
Temperature (degC)
Dep
th (
m)
18-Jun-01
18-Sep-01
29-Nov-01
21-Mar-02
0
20
40
60
80
100
120
6 8 10 12 14 16
Temperature (degC)
Dep
th (
m)
18-Jun-01
18-Sep-01
29-Nov-01
21-Mar-01
0
5
10
15
20
25
30
35
5 5.5 6 6.5 7
Field pH
Dep
th (m
)
18-Jun-01
18-Sep-01
29-Nov-01
21-Mar-02
0
10
20
30
40
50
60
5 5.5 6 6.5 7
Field pH
Dep
th (
m)
18-Jun-01
18-Sep-01
29-Nov-01
21-Mar-02
0
20
40
60
80
100
120
5 5.5 6 6.5 7
Field pH
Dep
th (
m)
18-Jun-01
18-Sep-01
29-Nov-01
21-Mar-01

Water Quality Basslink Monitoring Program Annual Report 2001-02
16
Figure 3.4. Depth profiles of conductivity (left) at Boyes Basin (top), Calder Reach (middle) and conductivity and turbidity
(right) at the power station intake (bottom) recorded between May 2001 and April 2002.
0
5
10
15
20
25
30
35
0 10 20 30 40 50 60
Conductivity (µS/cm)D
epth
(m)
18-Jun-01
18-Sep-01
29-Nov-01
21-Mar-02
0
10
20
30
40
50
60
0 10 20 30 40 50 60
Conductivity (µS/cm)
Dep
th (m
)
18-Jun-01
18-Sep-01
29-Nov-01
21-Mar-02
0
20
40
60
80
100
120
0 10 20 30 40 50 60
Conductivity (µS/cm)
Dep
th (m
)
18-Jun-01
18-Sep-01
29-Nov-01
21-Mar-01
0
20
40
60
80
100
0 1 2 3 4 5
Turbidity (NTU)
Dep
th (m
)
18-Jun-01
19-Sep-01
30-Nov-01
21-Mar-02

Gordon River Basslink Monitoring Annual Report 2001-02 Water Quality
17
The data for Boyes Basin generally reflect the influence of inflowing water from the upper Gordon
River, which tends to reduce the development of stratification in this basin. Inflowing water would
generally tend to be cooler than surface water in the lake during the summer months. This inflow is
likely to flow into the deeper layers of the lake, preventing deoxygenation. However, dry conditions
during the summer of 2002 meant that inflow volumes were lower than normal, and hence the
bottom water did approach anoxia during March. Thermal stratification was most pronounced in
the Boyes Basin in March 2002, although greatest thermal variation in the water column was found
in November 2001: a range of almost 8o C.
The pattern of thermal stratification measured at Calder Reach and the power station intake was
very similar, with strongest development occurring in March 2002, when the upper 25m was
warmed to about 14o C. The deeper water at both sites varied by little more that 1o C all year round,
and virtually complete vertical thermal mixing was apparent at both sites in September 2001. This
vertical mixing was also reflected in the dissolved oxygen profile at Calder Reach. Despite some
penetration of oxygen enriched water into the bottom of the water column at the power station
intake, a residual volume of deoxygenated water remained at mid-depth, between 50-70 m.
While all three locations showed some variation of pH with depth, the most noticeable change was
found at the power station intake. Water throughout the lake tends to be mildly acidic, which is
typical of water on the west coast and the southwest of Tasmania. Deep water at the power station
intake site was found to have a pH as low as 5.
The profiles for conductivity in Lake Gordon (Figure 3.4) clearly show that the inflow of water into
Boyes Basin alters the conductivity of water below about 15m depth. However, the profile data
show that there is generally minimal vertical variation in conductivity at deeper locations.
Sampling of the water column for turbidity at the power station intake in Lake Gordon (Figure 3.4)
indicated that there was no significant change in turbidity with depth in this part of the lake.
3.2.2 Surface water characteristics The surface water quality data from Lake Gordon are summarised graphically in Figure 3.5a & b. For
the purposes of this report, all surface water data from the three sites on Lake Gordon have been
pooled and plotted in the form of a boxplot. In this graphical technique, the boxes represent the
middle 50% of the data, with the horizontal line intersecting the box indicating the median (or 50th
percentile) value. The vertical bars extend out to show the 95 th and 5th percentile values and
individual dots show outliers.
The summary plots show that surface water quality in Lake Gordon is within the normal range for
Tasmanian fresh waters, with healthy oxygen concentrations, low turbidity and nutrient levels and
mild acidity (in this case, typical of Tasmanian west coast water). The plot for chlorophyll-a shows
that although the majority of the data are indicative of a low productivity system, there appear to be

Water Quality Basslink Monitoring Program Annual Report 2001-02
18
periods when algal activity was elevated. During the November 2001 monitoring, the chlorophyll-a
concentration exceeded 12 µg.L-1 at Boyes Basin, suggesting a spring bloom of algae in this area at
that time. This appears to have been limited to only the Boyes Basin, as chlorophyll-a concentrations
elsewhere at that time were only 1-2 µg.L-1.
Figure 3.5a & b. Boxplots summarizing the data from surface water sampling on Lake Gordon. Units for dissolved
oxygen are mg.L-1; for turbidity, NTU and for chlorophyll-a, µg.L-1. pH is unitless. Data from all three Lake Gordon
monitoring sites have been pooled for illustrative purposes.
Iron and aluminium were the only metals detected in any significant concentrations (Figure 3.5b),
although most of the common metals were measured, including Zn, Cu, Cd, Co, Cr, Ni, Mn and Pb.
The concentrations of these two metals in Lake Gordon were similar to previous data collected
from Lake Gordon and are consistent with concentrations found in other Tasmanian organic-rich
0
2
4
6
8
10
12
14
Uni
ts /
Con
cent
ratio
n
Dissolved O2 Field pH Turbidity Chl-a
0.001
0.01
0.1
1
Con
cent
ratio
n (m
g/L
)
Total P TKN NO3-N Fe Al

Gordon River Basslink Monitoring Annual Report 2001-02 Water Quality
19
west coast waterways (Koehnken, 2001). Although the aluminium levels exceed the ANZECC
(1992) guideline concentration for the protection of aquatic ecosystems (<100 µg.L- 1 for freshwater
with a pH<6.5), it is recognized that the presence of higher concentrations of dissolved organic
matter (DOM) in Lake Gordon is likely to greatly reduce the bioavailability of aluminium and other
metals (Koehnken, 1992), and is therefore unlikely to represent any threat to biological health in
general.
Analysis showed that all the other heavy metals (Zn, Cu, Cd, Co, Cr, Ni, Mn and Pb) were present at
or below the limit of detection (0.005 – 0.001 mg.L-1). Mean values and concentration ranges for
alkalinity, sulphate and dissolved organic carbon in Lake Gordon are show in Table 3.1 below, and
are within the normal range for waters on the west coast of Tasmania.
Table 3.1. Mean values and concentration ranges for alkalinity, sulphate and dissolved organic carbon in surface waters
of Lake Gordon.
Alkalinity (mg.L -1) Sulphate (mg.L -1) Dissolved Organic Carbon (mg.L -1)
Lake Gordon 8.02 (6-10) 0.95 (0.92-1.0) 5.78 (2.2-9.9)
3.3 Water Quality of Lake Pedder
3.3.1 Characteristics of stratification The profile data from Lake Pedder were collected from Groombridge Point. These data, shown in
Figure 3.6, clearly illustrate that Lake Pedder does not stratify to any notable degree and is well
mixed for most of the year.
There were no other significant features of the profile data from Lake Pedder. These data show a
water body with water quality characteristics similar to other west coast lakes.
3.3.2 Surface water characteristics The surface water quality data collected from sites in Lake Pedder are summarised graphically in
Figure 3.7a & b. The data indicate that water quality in Lake Pedder was good, with healthy oxygen
concentrations and low turbidity. Similar to Lake Gordon, pH in Lake Pedder is typical of lakes on
the west coast of Tasmania, and algal activity, as indicated by chlorophyll-a values, was low.

Water Quality Basslink Monitoring Program Annual Report 2001-02
20
Figure 3.6. Depth profile characteristics in Lake Pedder off Groombridge Point recorded between May 2001 and April
2002.
0
2
4
6
8
10
12
14
16
18
5 5.5 6 6.5 7
Field pH
Dep
th (m
)
19-Jun-01
19-Sep-01
29-Nov-01
21-Mar-02
0
2
4
6
8
10
12
14
16
18
4 6 8 10 12 14 16
Temperature (degC)D
epth
(m
)
19-Jun-01
19-Sep-01
29-Nov-01
21-Mar-01
0
2
4
6
8
10
12
14
16
18
60 65 70 75 80 85 90 95 100
Dissolved Oxygen (% Saturation)
Dep
th (m
)
19-Jun-01
19-Sep-01
29-Nov-01
21-Mar-02
0
2
4
6
8
10
12
14
16
18
6 8 10 12
Dissolved Oxygen (mg/L)D
epth
(m
)
19-Jun-01
19-Sep-01
29-Nov-01
21-Mar-02
0
2
4
6
8
10
12
14
16
18
0 10 20 30 40 50 60
Conductivity (µS/cm)
Dep
th (m
)
19-Jun-01
19-Sep-01
29-Nov-01
21-Mar-02

Gordon River Basslink Monitoring Annual Report 2001-02 Water Quality
21
Figure 3.7a & b. Boxplots and vertical scatter plots showing the data from surface water sampling in Lake Pedder for
2001-02. Units for dissolved oxygen are mg.L-1; for turbidity, NTU and for chlorophyll-a, µg.L-1. pH is unitless. Data from
all Lake Pedder sites have been pooled in figure 3.8a for illustrative purposes.
The nutrient and metal concentrations measured in Lake Pedder are almost identical to those found
in Lake Gordon during this round of monitoring. The nutrient values are well below the default
trigger levels for the protection of ecosystems in slightly disturbed environments in Tasmania as
recommended in the recently revised edition of the National Water Quality Guidelines (ANZECC,
2001), while the metal concentrations are of no environmental concern given the level of dissolved
organic matter in the water of this lake (see previous comments regarding metals in Lake Gordon,
Section 3.2.2).
0
2
4
6
8
10
12
0.001
0.01
0.1
1
Uni
ts /
Con
cent
ratio
n
Dissolved O2 Field pH Turbidity Chl-a
Con
cent
ratio
n (m
g/L
)
Total P TKN NO3-N Fe Al

Water Quality Basslink Monitoring Program Annual Report 2001-02
22
Analysis showed that all the other heavy metals (Zn, Cu, Cd, Co, Cr, Ni, Mn and Pb) were present at
or below the limit of detection (0.005 – 0.001 mg.L-1). Mean values and concentration ranges for
alkalinity, sulphate and dissolved organic carbon in Lake Pedder are show in Table 3.2 below, and
are not markedly different from those recorded in Lake Gordon.
Table 3.2. Mean values and concentration ranges for alkalinity, sulphate and dissolved organic carbon in surface waters
of Lake Pedder.
Alkalinity (mg.L -1) Sulphate (mg.L -1) Dissolved Organic Carbon (mg.L -1)
Lake Pedder 5.65 (5-7) 1.02 (0.97-1.1) 6.33 (2.1-12)
3.4 Water Quality in the Gordon River Because of the lead-time required for the production of this report, the water quality data reported
here cover the period 1st May 2001 to 30 th April 2002. Water temperature was monitored at three
remote sites within the Gordon River, including:
Ø Gordon Power Station tailrace;
Ø Gordon River at site 75;
Ø Gordon River at site 62.
Dissolved oxygen was monitored only at the power station tailrace.
3.4.1 Water Temperature Water temperature in the Gordon River immediately downstream from the Gordon Power Station is
primarily controlled by conditions in Lake Gordon at the level of the intake. Figure 3.8 shows the
high degree of correlation between water temperature at the tailrace site and site 62 (downstream
of the junction with the Denison River) some 15 km downstream. The main difference between the
water temperatures recorded at these two sites is the increased level of daily variation evident at
the downstream site, although the water temperature was also generally slightly higher. This is more
clearly shown in Figure 3.9, where the data from Nov-Dec 2001 are plotted.
During brief shut-downs of the power station in June and July of 2001, both sites showed the level
of daily variation that might be experienced during winter under ‘unregulated’ flow conditions.
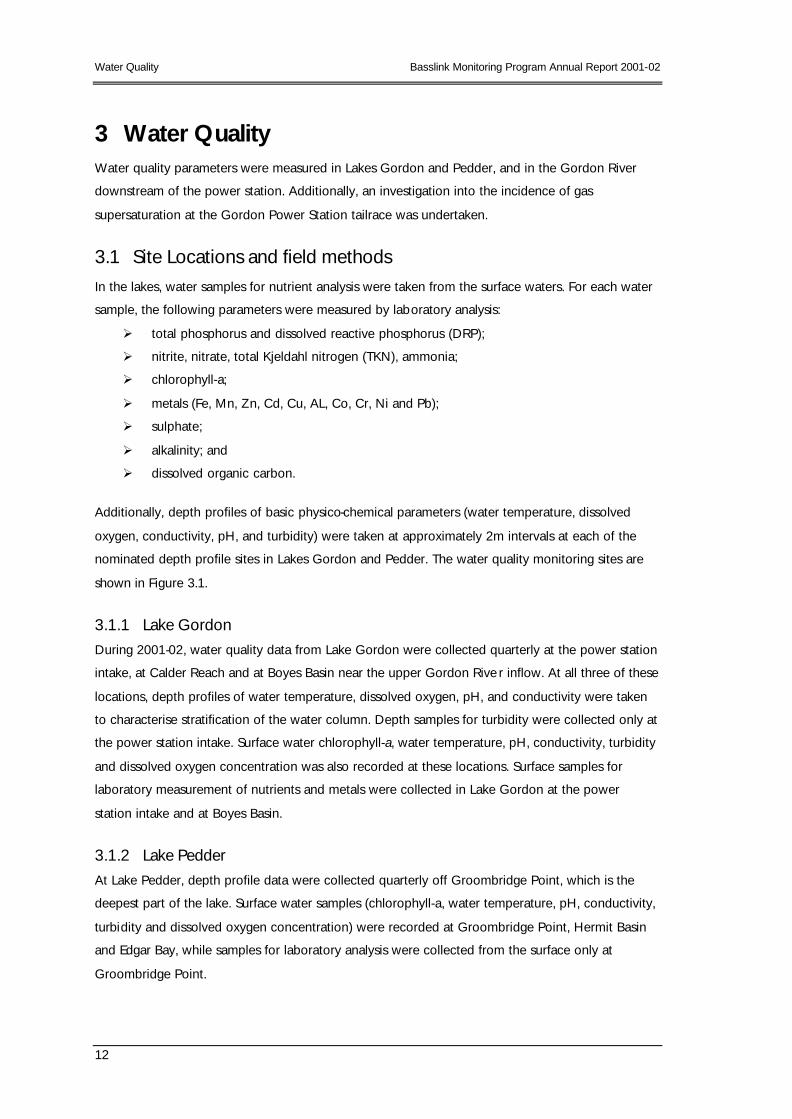
3.4.2 Dissolved Oxygen The potential influence of oxygen stratification at the power station intake on water used for power
generation is shown in Figure 3.10. This figure illustrates the change in oxygen concentration of
water at the level of the intake in Lake Gordon, using depth profile data collected over the past
couple of years. It shows that, despite a decline in lake level over the period, the oxygen content of
water being drawn into the power station appears to have consistently been within the range of 6 -
8 mg.L-1.

Gordon River Basslink Monitoring Annual Report 2001-02 Water Quality
23
Figure 3.8. Water temperature variation in the Gordon River at the power station tailrace and at the junction of the
Gordon and Denison rivers (site 62, approximately 15km downstream).
Note: The data from Albert Rapids (site 75) has not been included as it shows no difference from that recorded at the
tailrace site.
Figure 3.9. Water temperature data for Nov-Dec 2001, showing more clearly the 0.5-1.0° C difference between water
temperature at the power station tailrace (dark line) and the Gordon River at the Denison River junction (site 62). It also
illustrates the greater range of daily temperature variation at the latter site.
These data imply that the water being discharged from the power station during the recent period
of monitoring is not likely to have contained sufficiently low oxygen concentrations to pose a
significant risk to instream biota in the Gordon River downstream. This is confirmed to some degree
by the data collected from the tailrace (discussed in section 3.4.2). Oxygen concentrations recorded
in the tailrace appear to have been about 0.5 mg.L-1 lower.
7
8
9
10
11
12
13
01/11/01 08/11/01 15/11/01 22/11/01 29/11/01 06/12/01 13/12/01 20/12/01 27/12/01
Gordon at Tailrace
Gordon at Denison Junction
Wat
er T
empe
ratu
re (
o C)
6
7
8
9
10
11
12
13
14
Gordon at TailraceGordon at Denison Junction
1/05/01 1/07/01 1/09/01 1/11/01 1/01/02 1/03/02 1/05/02
Wat
er T
empe
ratu
re (
o C)
Water Quality Basslink Monitoring Program Annual Report 2001-02
24
Figure 3.10. Changes in dissolved oxygen profile characteristics in Lake Gordon at the power station intake, along with
changes in lake level since January 2000.
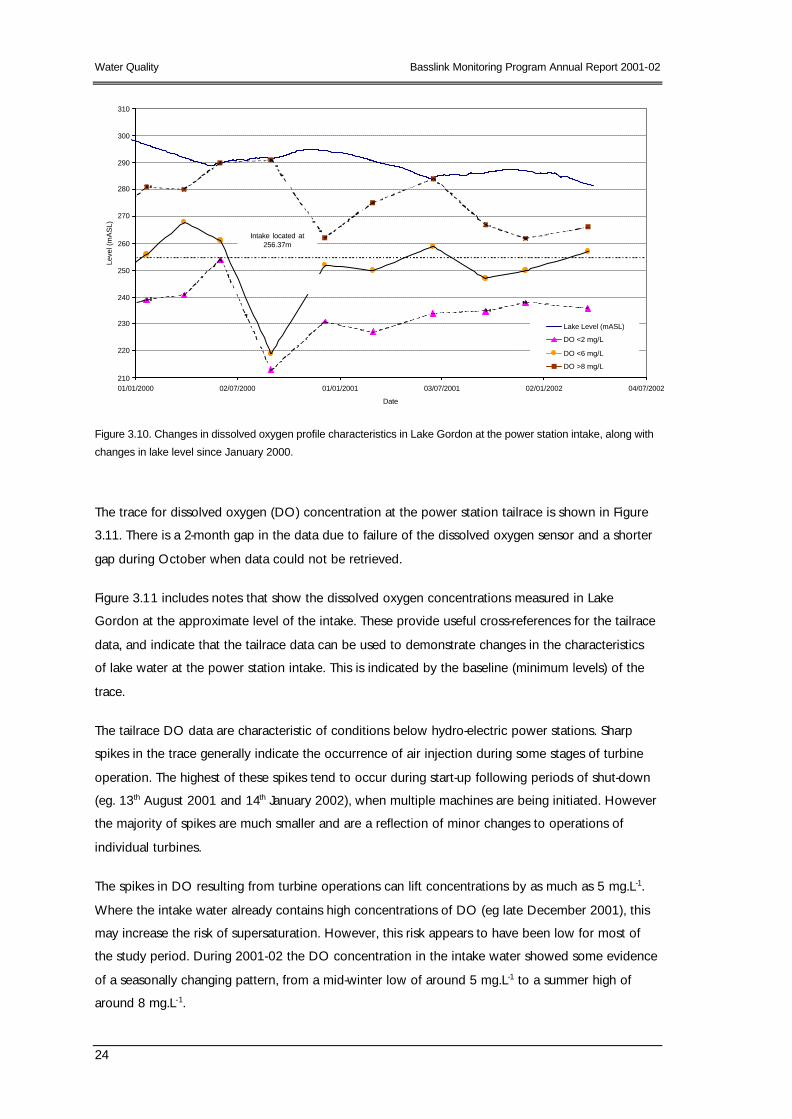
The trace for dissolved oxygen (DO) concentration at the power station tailrace is shown in Figure
3.11. There is a 2-month gap in the data due to failure of the dissolved oxygen sensor and a shorter
gap during October when data could not be retrieved.
Figure 3.11 includes notes that show the dissolved oxygen concentrations measured in Lake
Gordon at the approximate level of the intake. These provide useful cross-references for the tailrace
data, and indicate that the tailrace data can be used to demonstrate changes in the characteristics
of lake water at the power station intake. This is indicated by the baseline (minimum levels) of the
trace.
The tailrace DO data are characteristic of conditions below hydro-electric power stations. Sharp
spikes in the trace generally indicate the occurrence of air injection during some stages of turbine
operation. The highest of these spikes tend to occur during start-up following periods of shut-down
(eg. 13th August 2001 and 14th January 2002), when multiple machines are being initiated. However
the majority of spikes are much smaller and are a reflection of minor changes to operations of
individual turbines.
The spikes in DO resulting from turbine operations can lift concentrations by as much as 5 mg.L-1.
Where the intake water already contains high concentrations of DO (eg late December 2001), this
may increase the risk of supersaturation. However, this risk appears to have been low for most of
the study period. During 2001-02 the DO concentration in the intake water showed some evidence
of a seasonally changing pattern, from a mid-winter low of around 5 mg.L-1 to a summer high of
around 8 mg.L- 1.
210
220
230
240
250
260
270
280
290
300
310
01/01/2000 02/07/2000 01/01/2001 03/07/2001 02/01/2002 04/07/2002
Date
Leve
l (m
AS
L)
Lake Level (mASL)
DO <2 mg/L
DO <6 mg/L
DO >8 mg/L
Intake located at 256.37m
Gordon River Basslink Monitoring Annual Report 2001-02 Water Quality
25
Figure 3.11. Dissolved oxygen concentration in the Gordon River at the power station tailrace. Arrows on the plot also
show the measured concentration of oxygen in the water column at the level of the intake during periods when profile
data were recorded in Lake Gordon.
3.5 Gas supersaturation The main water quality issue identified for the Gordon River downstream of the Gordon Power
Station by Koehnken (2001) was that of ‘spiking behaviour’ in dissolved oxygen concentrations in
water being discharged from the power station. Air injection is used during power generation to
increase the mechanical efficiency of individual turbines when they are under intermediate loads.
During air injection, dissolved oxygen concentration in the discharge water can increase by as much
as 5 mg.L-1. When the water already contains appreciable concentrations of oxygen (and other
gases) prior to power generation, this can produce ‘supersaturation’ of dissolved gas, and this may
present a threat to aquatic biota in the river downstream.
While the measurement of dissolved oxygen alone does not identify the level of total gas saturation
in water, it can be used to indicate the approximate level of total gas saturation (Bobbi, 2000). The
oxygen concentration data from below Gordon Power Station can be converted to percent
saturation using an algorithm that uses dissolved oxygen concentration, electrical conductivity and
water temperature (APHA, 1992). From this and other reference sources, it is estimated that total
gas supersaturation starts to develop when oxygen saturation exceeds about 105%. In
concentration terms, this equates to roughly 12-13 mg.L-1 of dissolved oxygen at a water
temperature of about 10o C in water exhibiting the low conductivity of Lake Gordon. The ANZECC
(2001) guideline for total dissolved gas saturation in freshwaters has been set at 105% for the
protection of aquatic biota.
At the Gordon Power Station, air injection takes place when power output from each turbine is less
than about 110MW. Therefore when any of the three turbines is operating below that output level,
1/05/01 1/07/01 1/09/01 1/11/01 1/01/02 1/03/02 1/05/02
Dis
solv
ed O
xyge
n (m
g/L)
0
2
4
6
8
10
12
14
16
18
Intake at 7.5mg/L level in water column
Intake at 7.6mg/L level in water column
Intake at 5.9mg/L level in water column

Water Quality Basslink Monitoring Program Annual Report 2001-02
26
there is potential for the generation of gas supersaturation in at least part of the discharge water. It
is therefore important to examine the pattern of use of all three turbines when trying to interpret
changes in dissolved oxygen in the discharge water.
Further study of supersaturation in the Gordon River downstream of Gordon Power Station is
planned prior to the commencement of Basslink. This study will;
Ø examine the degree to which water discharged from Gordon Power Station is saturated in
terms of total gas as well as dissolved oxygen; and
Ø examine the distance that supersaturated water is carried downstream, and whether the
physical characteristics of the river act to exacerbate or ameliorate levels of dissolved gas.
The field study will be carried out when the power station is operating in the intermediate load
range and when the intake to the power station is drawing in water from above the oxycline (>8
mg.L-1). It is these two factors have been shown from the data to result in higher gas saturation.
These conditions generally apply in the winter months.
3.6 Conclusion Surface water quality in both Lakes Gordon and Pedder is characteristic of lakes in the west and
southwest of Tasmania, with low nutrient concentrations and turbidity, mildly acid pH and generally
low algal activity. While the majority of heavy metal analytes were not detected in any significant
concentration, higher levels of iron and aluminium are not considered to be of environmental
concern due to the abundance of dissolved organic matter in these waters. Iron concentration in
Lake Gordon is in the range that may impact on aesthetics (taste) for human consumers (ANZECC
1992).
Stratification (thermocline and oxycline) appears to be relatively stable in deeper waters in Lake
Gordon (at the power station intake). However the precise influence this has on the quality of water
being drawn into the power station may be variable, as the depth of the intake appears to generally
fall within the thermocline. Small changes in the characteristics of stratification may therefore have
larger impacts on the quality of intake water.
The data from water temperature monitoring in the Gordon River supports earlier conclusions
(Koehnken, 2001) regarding the influence of Lake Gordon on water temperature in the lower
Gordon River. These data show that although there is still a broad seasonal signal, this is likely to be
less than would be expected in an unregulated system. In a similar manner, diurnal variation
appears to be depressed in the lower Gordon River as a result of flow regulation.
The data for dissolved oxygen concentration in the discharge water indicate that supersaturation of
the discharge water may be an issue when the intake water already contains appreciable amounts
of dissolved gas. This does not appear to have been a significant issue during the past year.

Gordon River Basslink Monitoring Annual Report 2001-02 Fluvial Geomorphology
27
4 Fluvial Geomorphology
4.1 The fluvial geomorphology monitoring program The fundamental objective of the fluvial geomorphology monitoring program is to document fluvial
geomorphic changes on the banks of the middle Gordon River between the power station tailrace
and the mouth of the Franklin River, and to relate these changes to power station operations or
other factors wherever possible.
Scour and seepage erosion are the major focus of the monitoring program, as these processes have
been identified as the dominant erosion processes presently affecting alluvial banks and the ones
most likely to be affected by Basslink.
The fluvial geomorphology monitoring program focuses on the same study area as the initial
Basslink investigations (Koehnken et al. 2001). Little previous geomorphic work had been
completed in the study area, so the Basslink investigation findings were based on field observations
and analysis of one year of results from hydrologic records, erosion pins, scour chains and in-bank
peizometers. The initial Basslink investigations identified five geomorphic zones in the study area
which are shown in Figure 4.1. These zones were used in the implementation, presentation and
discussion of the monitoring program.
A major field component of the Basslink geomorphology investigations (Koehnken et al. 2001) was
the mapping of bank characteristics on both sides of the river over the length of the study area. The
mapping identified the following bank characteristics on a reach by reach basis:
Ø underlying material (sandy alluvium or colluvium, cobbles, bedrock);
Ø height to green vegetation (indication of water level fluctuations);
Ø percent cover on bank of large woody debris (LWD);
Ø percent tea-tree on banks;
Ø slope of bank, extent and nature of buttressing of bank toe, and level of recent activity
(recent tree falls, active seepage erosion).
These characteristics were found to be important to overall bank stability in the middle Gordon
River, and monitoring sites that reflect a range of these characteristics, as well as position in the river
(inside bend, outside bend, above/below constrictions, etc), have been incorporated into the
monitoring program.
Erosion pin and scour chain sites that were established as part of the original Basslink investigations
have been retained, providing a record of erosive activity since December 1999.

Fluvial Geomorphology Gordon River Basslink Monitoring Annual Report 2001-02
28
N
#Y
Spre
nt River
Olga R
iv er
Ora nge R
.
Alber t R.
Deni
son
R ive
r
Max
wel
l Riv
erLake Pedder
Lake Gordon
GordonPowerStation
Zone 2Zone 3Zone 4Zone 5
Zone 1
0 5 10 Km
Figure 4.1. Geomorphology zones in the middle Gordon River.
4.2 Methodology
4.2.1 Monitoring approaches A number of approaches have been adopted for the geomorphology monitoring program. These
include:
Ø The installation of erosion pins and scour chains in sandy alluvial and colluvial banks;
Ø The installation of erosion pins in vertical cobble banks;
Ø Photo-monitoring of selected banks and features (landslips, tree falls, cobble bars); and,
Ø The expansion and upgrading of the peizometer array in Zone 2.
The approach and rationale adopted for each of these monitoring techniques is discussed in the
following sections.
4.2.1.1 Erosion pins and scour chains A total of 48 erosion pin sites (>200 pins) and 25 scour chain sites have been established in the
middle Gordon River. The erosion pins consist of 10 mm diameter steel rods varying in length
between 500 mm and 3,000 mm, with the majority between 1,000 mm and 1,500 mm. Scour
chains are approximately 1.5 m long and composed of links each ~25 mm in length.
Gordon River Basslink Monitoring Annual Report 2001-02 Fluvial Geomorphology
29
Considerable judgement is required in the selection of erosion pin sites. As much as possible, the
sites have been selected such that the ranges of bank characteristics (active seepage erosion;
steeply / shallowly sloping; abundance of LWD; inside / outside bend; vegetation communities,
buttressing, etc) documented during the bank mapping exercise are reflected in the monitoring sites
in each zone.
On banks affected by seepage erosion, primarily upstream of the Denison River, erosion pins were
typically installed in a horizontal position within the cavities on the vertical wall of the bank, and in a
vertical position in the sediment flows on the lower banks and at the toe of the bank. On sandy
alluvial banks not experiencing seepage erosion, pins were typically placed in a vertical position.
These were aligned in a transect perpendicular to the flow of the river, with the transect extending
from the toe of the bank, up the bank slope and into the overlying colluvium, or were placed
parallel to the river along the bank toe. At selected sites, pins were also installed in, or adjacent to,
some bank features, such as gullies and tree falls.
The field measurement of erosion pins also involves judgment, as the contact surface where the pin
meets the bank surface is rarely uniform and can change with time. During the initial Basslink
investigations, measurements were made by a variety of people along the shortest side of the pin. In
an attempt to reduce the variability of measurements, the 2001-02 monitoring program measured
two points on the pins, the upslope and downslope sides for vertically placed pins, or in the case of
pins inserted horizontally into bank faces, the top and bottom. In this report, the ‘top’
measurements are presented for pins on vertically inserted on bank slopes, and the ‘bottom’
measurements are used for pins horizontally inserted in bank faces. These are easier to measure and
likely to be more accurate.
Erosion pins installed in deep (>1 m) bank cavities were difficult to measure, as the exposed pin
length may be up to 2m long, and measurements involve carefully moving the tape measure along
the bottom of the pin, weaving through a web of exposed roots. It is likely that some of these
measurements may have several centimetres of error. A new system of measurement which will
reduce error is being considered for future monitoring.
At two sites, one in Zone 2 (Site 2F) and one in Zone 4 (4C), erosion pins were driven horizontally
into vertical cobble banks between low water level and full-gate operating level. The nature of the
cobble bank materials made the installation of these pins difficult, with material dislodged near the
pin during installation. This local disturbance has been enlarged by scour at the base of the pin
during the three month monitoring period and raises questions about the suitability of erosion pins
to document processes affecting vertical cobble banks. Photo-monitoring of cobbles will assist with
the long-term interpretation of the erosion pin results.
Three to seven scour chains were installed in each zone, typically mid-slope on sandy alluvial banks.
Several chains were purposely placed downslope of cavities on banks prone to seepage erosion.

Fluvial Geomorphology Gordon River Basslink Monitoring Annual Report 2001-02
30
Monitoring of the scour chains involved measuring and describing any deposition that has occurred
on the chain, and measuring and counting the links of the chain that were lying horizontal on the
bank slope. The chains were ‘reset’ by removing deposited material and laying the exposed chain
on the surface of the banks stretching in the downstream direction.
4.2.1.2 Photo-monitoring Photo-monitoring sites were established in all zones, and focused on geomorphic processes not
easily documented using erosion pins or scour chains, such as the evolution of tree falls and land
slips. Photo-monitoring sites also included cobble bars and cobble banks, and sandy alluvial banks.
A total of 54 sites were established for the geomorphology monitoring. Additional photo-monitoring
sites in each zone have been established by the riparian vegetation monitoring program. These will
used to better understand the link between vegetation and geomorphic processes in the middle
Gordon River.
Photos of each erosion pin site were taken following installation of the site. These photos will be
used during the analysis of erosion pin data, and will be repeated as changes at the sites are
documented.
4.2.1.3 Expansion and upgrading of Zone 2 peizometers sites In Zone 2, at site 71, a line of peizometers was established in early 2000 (Koehnken et al., 2001),
consisting of 5 probes extending from power station ‘off’ low-water level to approximately 23 m
inland. The reasons for installing the site were:
Ø to examine rates of water level decrease with the turning off of the power station:
Ø to examine how this links with occurrences of seepage flows out of the banks; and
Ø to establish rates of bank saturation under various power station operating patterns.
For these reasons, the site was located in what has been identified as one of the most active regions
of the river with respect to seepage flows. The site is subjected to large (~4 m) water level
fluctuations and high rates of change, while still being a physically stable site itself.
It was originally intended to use the probes for the duration of the initial Basslink investigations only.
Because of the importance of understanding bank saturation and how it relates to seepage erosion
processes, Hydro Tasmania upgraded the installation using more robust probes and installed solar
panels as a more reliable power supply. The installation will be maintained for the duration of the
Basslink monitoring program.
Each probe records water level at 15-minute intervals with the output stored in a data logger. A
newly established helipad allows access to the peizometer site, guaranteeing accessibility to the
data even during periods when power station shutdowns are not possible.

Gordon River Basslink Monitoring Annual Report 2001-02 Fluvial Geomorphology
31
4.2.2 Timing and frequency of monitoring Monitoring is scheduled for March and October, with shutdowns and river access provided for 2-
days. During this period, all erosion pin and scour chain sites must be measured and photo-
monitoring sites recorded. Any alterations to the monitoring infrastructure (installation of additional
pins, establishment of new sites) must also be completed during this time.
4.2.3 Geomorphology monitoring sites A total of 46 sites were monitored during 2001-02 over the five zones of the middle Gordon River
(see Figure 4.1). The location and arrangement of monitoring sites and photo-monitoring sites are
illustrated in the following figures:
Ø Figure 4.2 shows the locations of the six geomorphic monitoring sites and five photo
monitoring sites established in Zone 1 of the Gordon River;
Ø Figure 4.3 shows the locations of the 12 geomorphic monitoring sites and 11 photo
monitoring sites established in Zone 2;
Ø Figure 4.4 shows the locations of the seven geomorphic monitoring sites and five photo
monitoring sites established in Zone 3;
Ø Figure 4.5 shows the locations of the eight geomorphic monitoring sites and eight photo
monitoring sites established in Zone 4; and
Ø Figure 4.6 and Figure 4.7 show the locations of the 13 geomorphic monitoring sites and
21 photo monitoring sites established in Zone 5.

Fluvial Geomorphology Gordon River Basslink Monitoring Annual Report 2001-02
32
Figure 4.2. Map of the geomorphic monitoring sites (1a – 1f) and photo-monitoring sites (P1-1 to P1-5) in Zone 1 of the
Gordon River, 2001-02.

Gordon River Basslink Monitoring Annual Report 2001-02 Fluvial Geomorphology
33
Figure 4.3. Map of the geomorphic monitoring sites (2a – 2L) and photo-monitoring sites (P2-1 to P2-11) in Zone 2 of
the Gordon River, 2001-02.
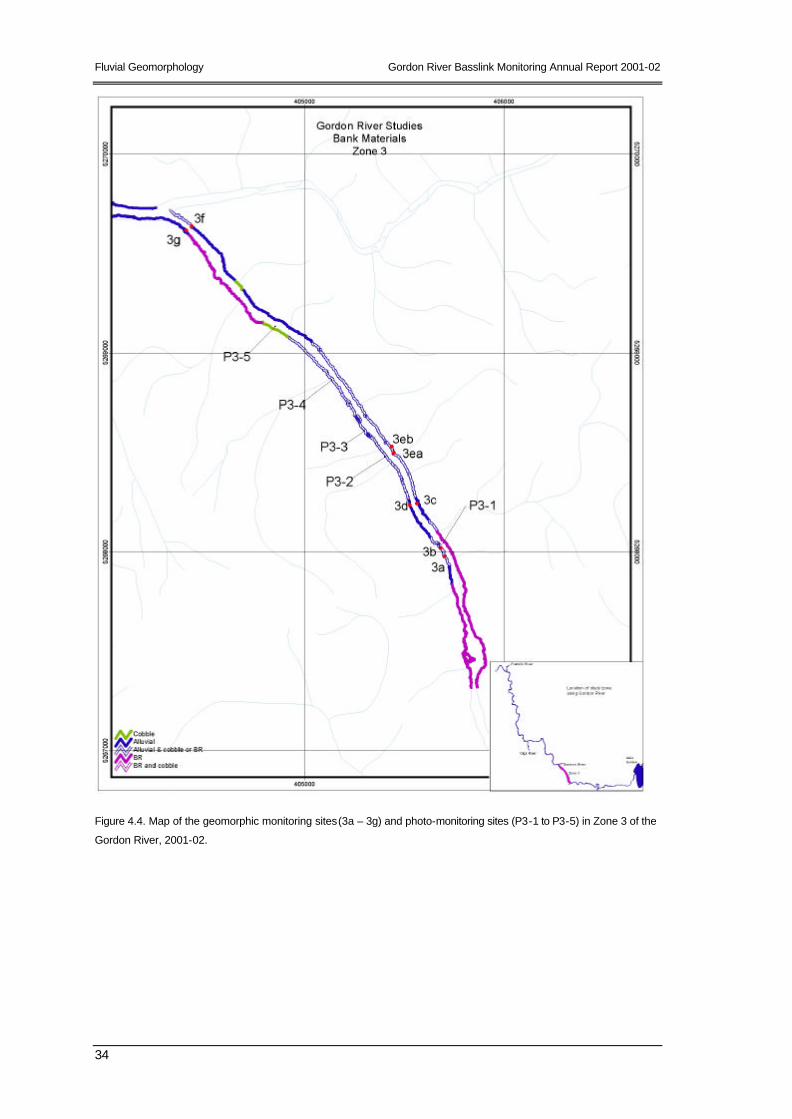
Fluvial Geomorphology Gordon River Basslink Monitoring Annual Report 2001-02
34
Figure 4.4. Map of the geomorphic monitoring sites (3a – 3g) and photo-monitoring sites (P3-1 to P3-5) in Zone 3 of the
Gordon River, 2001-02.

Gordon River Basslink Monitoring Annual Report 2001-02 Fluvial Geomorphology
35
Figure 4.5. Map of the geomorphic monitoring sites (4a – 4h) and photo-monitoring sites (P4-1 to P4-8) in Zone 4 of the
Gordon River, 2001-02.
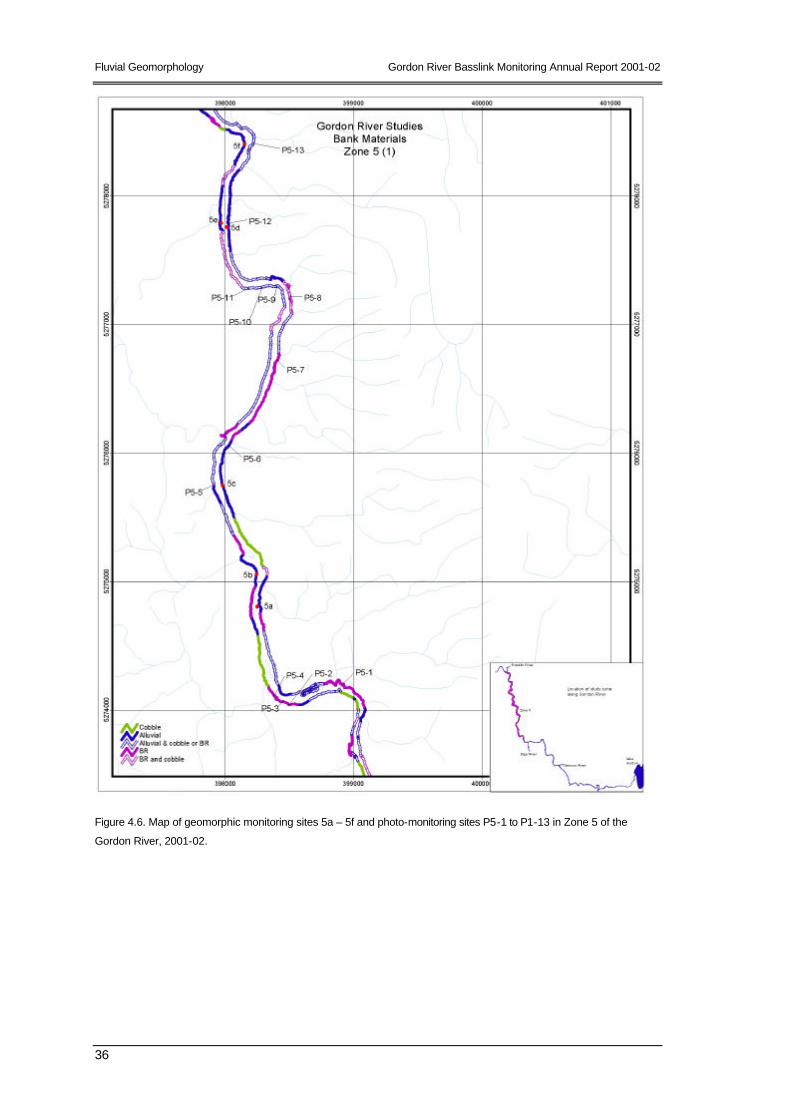
Fluvial Geomorphology Gordon River Basslink Monitoring Annual Report 2001-02
36
Figure 4.6. Map of geomorphic monitoring sites 5a – 5f and photo-monitoring sites P5-1 to P1-13 in Zone 5 of the
Gordon River, 2001-02.

Gordon River Basslink Monitoring Annual Report 2001-02 Fluvial Geomorphology
37
Figure 4.7. Map of geomorphic monitoring sites 5f – 5m and photo-monitoring sites P5-13 to P5-21 in Zone 5 of the
Gordon River, 2001-02.

Fluvial Geomorphology Gordon River Basslink Monitoring Annual Report 2001-02
38
4.3 Hydrologic Overview Figure 4.8, Figure 4.9 and Figure 4.10 show hourly discharge at the Gordon Power Station between
1 January 2000 and 15 February 2002, incorporating the Basslink study year (2000), and recent
monitoring period (2001-02). The red arrows indicate dates when erosion pins were measured.
Figure 4.8. Hourly flow at the Gordon Power Station 1 Jan 00 - 31 Dec 00.
Figure 4.9. Hourly flow at the Gordon Power Station 1 Jan 01 - 31 Dec 01.
0
50
100
150
200
250
300
1/01
/01
1/02
/01
1/03
/01
1/04
/01
1/05
/01
1/06
/01
1/07
/01
1/08
/01
1/09
/01
1/10
/01
1/11
/01
1/12
/01
Hou
rly
flow
at G
ordo
n P
ower
Sta
tion
(cum
ecs)
0
50
100
150
200
250
300
1/01
/00
1/02
/00
1/03
/00
1/04
/00
1/05
/00
1/06
/00
1/07
/00
1/08
/00
1/09
/00
1/10
/00
1/11
/00
1/12
/00
Hou
rly
flow
at G
ordo
n P
ower
Sta
tion
(cu
mec
s)

Gordon River Basslink Monitoring Annual Report 2001-02 Fluvial Geomorphology
39
Figure 4.10. Hourly flow at the Gordon Power Station 1January 02 - 15 February 02.
The hydrographs show similar operational patterns at the power station for 2000 and 2001, with
high flow in the summer months, when less water is available from other power schemes in the
State, and generally lower flow during the rainy, winter months. There was a 3-month period in both
2000 and 2001 when the station was predominantly at ‘full-gate’, with flow exceeding 240 m3.s-1. To
date, the 2002 hydrograph is similar to the first few months of 2000, with the station being run at or
near full-gate levels. See Section 2.2 for a more detailed analysis of hydrology in the Gordon River
for 2001-02.
Table 4.1 provides a comparison of flow between the initial Basslink study year, 2000, and 2001.
During 2000, flow at the power station exceeded 210 m3.s-1 a greater proportion of time as
compared to 2001, however, during 2001, three turbine (>170 m3.s- 1) flow occurred for a longer
cumulative duration. This is significant, because the Basslink findings suggested that much of the
bank activity observed during the initial study year was related to the on-going adjustment of the
middle Gordon River to 3-turbine power station usage, which had been limited prior to 2000. Based
on the distribution of flow during 2001, it would be expected that this bank adjustment process
continued.
Table 4.1. Percent of time flow at Gordon Power Station was less than 2 turbines (<150 m3.s -1), 3 turbines (>170 m3.s -1),
and greater than 3 turbines efficient load (>210 m3.s -1), based on hourly flow records.
Year <150 m 3.s -1 >170 m 3.s -1 >210 m 3.s -1
2000 51 44 32
2001 39 49 20
0
50
100
150
200
250
300
1/01
/02
1/02
/02
1/03
/02
1/04
/02
1/05
/02
1/06
/02
1/07
/02
1/08
/02
1/09
/02
1/10
/02
1/11
/02
1/12
/02
Hou
rly
flow
at G
ordo
n P
ower
Sta
tion
(cum
ecs)

Fluvial Geomorphology Gordon River Basslink Monitoring Annual Report 2001-02
40
4.4 Results
4.4.1 Erosion pins & scour chains The number of erosion pin and scour chain measurements varied depending on when the site was
established, and how often it had been measured. The short period of monitoring and limited
number of data points is a very important consideration when viewing all of these results. All sites
have a minimum of 2 measurements. Because the majority of the monitoring sites were established
between November 2001 and February 2002, the results largely reflect summer conditions (high
power station flows).
The results of erosion pin and scour chain monitoring are discussed in Section 4.5.1 of this report.
4.4.2 Peizometers
Peizometer results from Zone 2 are presented in Figure 4.11. The upgrading of the peizometer
array was completed in December 2001, and results reflect summer flow conditions. Figure 4.11
also shows the corresponding river level heights for various power station operating modes.
The peizometer results show a discrepancy between river level (red) and probes 2 – 5 in Figure
4.11. Above river level 3.27 m the river level probe and probe 2 should record the same water
height, as both are submerged by the river. The similarity in water level between probe 2 and
probes 3 – 5 following prolonged periods of inundation suggests that these four probes are
responding consistently, and the river level probe is reading high. Following the period of full-gate
power station operation between the 6th and 8th of March 2002, the difference between river level
and probe 2 is 16.5 cm. The cause of this discrepancy is unknown and is being investigated.
Peizometer results are discussed in Section 4.5.2.
Figure 4.11. Peizometer results from Zone 2 peizometer site.
0.00.51.01.52.02.53.03.54.04.5
19-D
ec-0
1
26-D
ec-0
1
2-Ja
n-02
9-Ja
n-02
16-J
an-0
2
23-J
an-0
2
30-J
an-0
2
6-F
eb-0
2
13-F
eb-0
2
20-F
eb-0
2
27-F
eb-0
2
6-M
ar-0
2
Lev
el (
m)
River levelProbe 2, 6.5 mProbe 3, 13.3 mProbe 4, 19.2 mProbe 5, 27.2 m
Full-gate >250 m3.s-1 3 turbines 210 m3.s-1
2 turbines 140 m3.s-1 1 turbine -70 m3.s-1
Power Station Operation

Gordon River Basslink Monitoring Annual Report 2001-02 Fluvial Geomorphology
41
4.4.3 Photo Monitoring As this is the first photo-monitoring campaign, no comparisons with previous photos are presented
or discussed in this report, but will be provided in future monitoring reports.
4.5 Discussion The majority of monitoring sites in the middle Gordon River have been established only recently
and results reflect a few months of summer flow conditions. Analysis of results in any meaningful
way is prevented by this short time period and limited number of data points. Based on this limited
data set, trends can be noted, but a longer monitoring record will be required to accurately quantify
processes operating in the middle Gordon, and to identify links with power station operation. In the
following discussions, broad trends are identified, and comparisons are made between the recently
collected data and the findings of the Basslink geomorphology investigation (Koehnken et al., 2001).
The results from the erosion pin and scour chain monitoring are discussed for each zone, followed
by a discussion of the peizometer results. A synthesis of the discussion is presented in Section 4.5.3.
4.5.1 Erosion pins and scour chains The erosion pin results varied significantly within and between sites and zones. In general, the
monitoring results indicate that during the summer, when flows have been high and include long
periods of continuous power station operation, scour of the toes of sandy banks is common and
widespread in the study area, with the remainder of the bank showing far less change. Banks
affected by seepage erosion were found to be active: the erosion pin and scour chain results were
consistent with the downslope movement of material on the bank, including the removal of material
from the back walls of cavities. Each zone is briefly described in the following sections.
4.5.1.1 Zone 1 Zone 1 has 6 erosion pin sites, including one relatively long-term site established in December 1999
(Site 1A). The remaining sites have been monitored 3 times over a 6-month period. The long-term
site (Site 1A) is located in a colluvial bank adjacent to a left bank cobble bar. Most of the pins are
placed horizontally in the vertical bank face and create a longitudinal transect spanning 70 m.
Figure 4.2 shows the location of the erosion pins in this zone.
The pins show a range of responses, with most pin measurements showing some variability, but
little nett change within the error of measurement associated with the long-term sites. Two
exceptions were noted, but these results reflect the movement of soil material around the pin,
rather than fluvial deposition. The two scour chains at Site 1A, located near pins 1A/1 and 1A/4
have shown less than 1 link of change since installation.
At the other sites in Zone 1, the greatest level of activity is associated with pins located in cavities
(1D pin 1; and site 1F, all pins).

Fluvial Geomorphology Gordon River Basslink Monitoring Annual Report 2001-02
42
The alluvial banks without cavities (1C = series of pins along the bank toe; 1E = profile up a bank
slope) show minor deposition or little change. A scour chain was installed at Site 1E in March 2002,
but has not been revisited for measurement.
Figure 4.12 shows erosion pin results from sandy bank toes in Zone 1, indicating that there has
been minor deposition or erosion throughout the zone. This relative stability is probably related to
the underlying cobbles or bedrock present throughout the zone.
Figure 4.12. Erosion pin results from bank toes in Zone 1.
4.5.1.2 Zone 2 Over the 2001-02 monitoring period, Zone 2 appeared to be the most active zone, based on field
observations. This was consistent with the investigations reported in Koehnken et al. (2001). The 12
erosion pin sites in Zone 2 showed a range of responses but were generally very dynamic, with
large changes documented at both the long-term sites and the recently installed sites. Six sites were
installed in November 1999, and provided a reference which indicated that the scale of changes
documented at the new sites was consistent with the longer term observations. Figure 4.3 shows
the location of the erosion pins in this zone.
Zone 2 has the highest proportion of sandy alluvial banks in the study area, and the bank materials
tend to be more micaceous as compared to the other zones. Water level fluctuations due to power
station operation were high in this zone (~4 m), and the Albert River is the only significant tributary
entering the zone (see Figure 4.1).
23-N
ov-
01
9-D
ec-0
1
10-F
eb-0
2
9-M
ar-0
2
-100-90
-80-70
-60-50-40
-30-20
-100
102030
4050
6070
8090
100
Cha
nge
(mm
)
Zone 1 - 'toes' ofalluvial banks
1B/5 - toe1C/1 - toe1C/2 - toe1C/3 - toe1C/4 - toe1E/1 - toe

Gordon River Basslink Monitoring Annual Report 2001-02 Fluvial Geomorphology
43
In general, sites characterised by bank cavities and sediment flows (2B, 2C, 2E, 2G, 2H, 2K) showed
sediment movement consistent with the downslope movement of material derived from the
collapse of bank walls. At these sites, deposition on bank slopes and erosion in cavities of up to 100
mm has been documented over the recent summer months. Some of the sediment movement at
monitoring sites may have been the result of a vegetation sampling near the site prior to the
measurement of the pins.
The alluvial banks without cavities (2A, 2D, 2I, 2J 2K, 2L) tended to show erosion of the bank toe,
with decreasing erosion upslope. The scale of these changes varied considerably. At Sites 2A and 2I
which have low slopes and are vegetated by tea-tree, changes were on the order of millimetres.
Erosion on the scale of centimetres has been recorded on steeper banks that show evidence of
downslope mass-movement, even in the absence of distinct cavities (2D, 2J).
Site 2F consisted of two pins driven into the face of a vertical cobble bank. The data indicated
erosion for both pins. However, this was due to local scour around the base of the pins that has
resulted in the loss of gravels from the bank. The surrounding bank face has not experienced a
similar change over the same time period.
shows erosion pin results from bank toes in Zone 2. Erosion at the long-term site 2L is characterised
by one major event followed by relative stability. The other sites generally showed a combination of
deposition and erosion, with nett erosion the general trend.
Figure 4.13. Erosion pin results from bank toes in Zone 2.
11-D
ec-
99
19-D
ec-
99
4-M
ar-0
024
-Mar
-00
22-J
ul-0
0
26-S
ep-0
0
25-N
ov-
00
28-J
ul-0
14-
Aug
-01
23-N
ov-
01
9-D
ec-
01
9-F
eb-0
29-
Mar
-02
13-A
pr-0
2
-230-220-210-200-190-180-170-160-150-140-130-120-110-100
-90-80-70-60-50-40-30-20-10
010203040
Cha
nge
(mm
)
Zone 2 - EPs on 'toes' ofalluvial banks
2A/1 = toe2D/4 - toe2E/5 - toe2H/6 - toe2I/2 - toe2J/3 - toe2K/5 - toe2L/4 - toe
Note scale is different

Fluvial Geomorphology Gordon River Basslink Monitoring Annual Report 2001-02
44
Scour chains are located on the mid-bank slope at sites 2A, 2D, 2K and 2L. Site 2A has only a three-
month record, whereas the other sites were installed in December 1999. No change has been
recorded at Site 2A. At Site 2D, the overall trend was depositional, due to the movement of material
downslope. At site 2K, there was nett erosion of 9 links, although not continuous, with deposition
from the downslope movement of material at times burying the chain. Results from Site 2L showed
two links were exposed since December 1999, with no periods of deposition.
4.5.1.3 Zone 3 Figure 4.4 shows the location of the erosion pins in Zone 3. Of the eight monitoring sites in this
zone, only one (3A) is a long-term site. Site 3A consists of a star-picket in a bank toe and has
indicated consistent erosion since installation in December 1999. A total of 380 mm change has
been recorded at the site, which is consistent with results from a scour chain installed a few metres
downstream of the star picket. There, eight links (235 mm) have been exposed during the same
time period, without any evidence of depositional episodes (i.e., the scour chain is always fully
exposed).
Immediately downstream of 3A, Site 3B is characterised by cavities and sediment flows and has also
shown a high level of activity. Although Site 3A appears to be a ‘new’ site, pins were originally
installed in December 1999. However, the level of activity has resulted in the disappearance of
most of the pins due to bank collapse and downslope movement of bank material, and the site
required re-installation in November 2001.
Similar to Zone 2, the sites in Zone 3 installed in, and downslope of, cavities (3C, 3F) had high
variability. Site 3Ea is a ‘V’ formation of 5 pins installed in a small gully. The data indicated the
collapse of one of the downstream gully walls (pin 3Ea/5), with deposition downslope (pins 3Ea/3,
3Ea/4).
Other sites generally showed erosion of bank toes, with erosion decreasing with distance upslope.
Figure 4.14 depicts erosion pin results from all of the bank toes monitored in Zone 3. Unlike Zones
1 and 2, the results were fairly consistent, with all except one site showing erosion of between 30
mm and 80 mm, similar to the trend documented at the long-term Site 3A. Site 3D, which showed
minor deposition may be reflecting activity of the upslope cavity.
Scour chain results were consistent with the erosion pin results. At sites showing erosion of bank
toes, without active cavities upslope, scour chain results indicated either erosion or no nett change.
At Site 3A, a total of eight links had been exposed since installation in December 1999. Two links
have been exposed at the recently installed chain at site 3Eb, and there has been no nett change at
Site 3G. The active sediment flows at Site 3B resulted in deposition on the scour chain of between
30 mm and 190 mm, with no nett erosion.
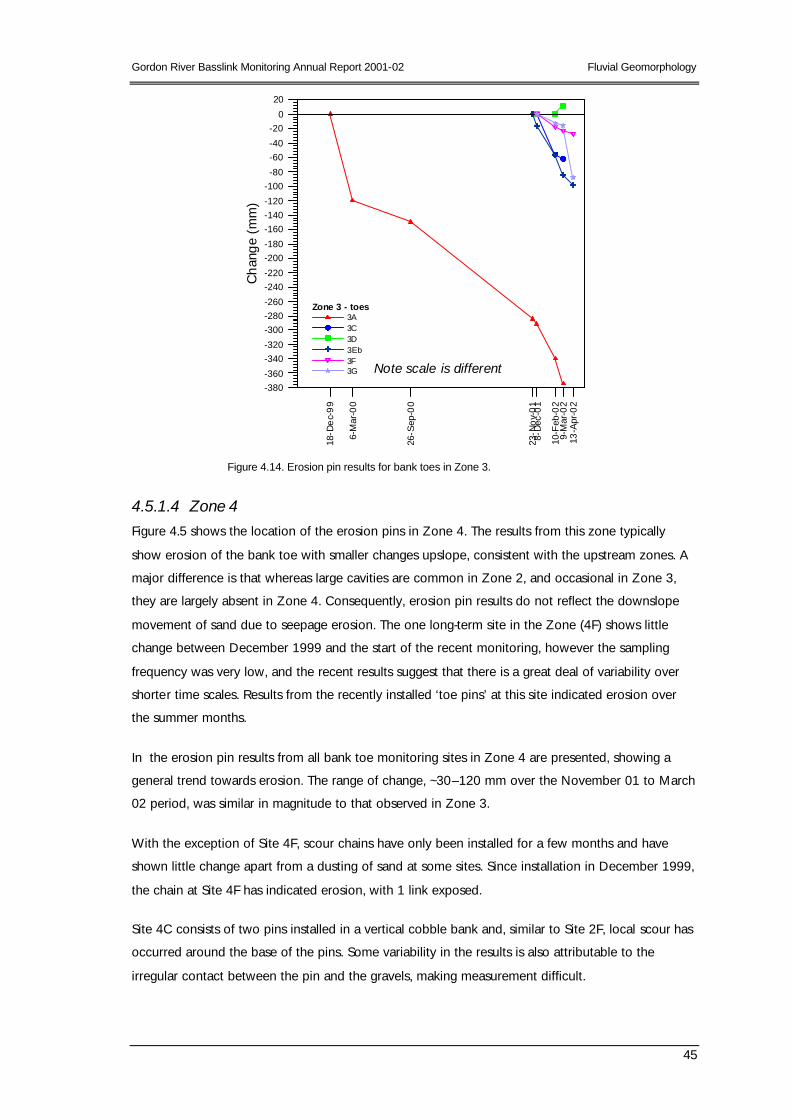
Gordon River Basslink Monitoring Annual Report 2001-02 Fluvial Geomorphology
45
Figure 4.14. Erosion pin results for bank toes in Zone 3.
4.5.1.4 Zone 4 Figure 4.5 shows the location of the erosion pins in Zone 4. The results from this zone typically
show erosion of the bank toe with smaller changes upslope, consistent with the upstream zones. A
major difference is that whereas large cavities are common in Zone 2, and occasional in Zone 3,
they are largely absent in Zone 4. Consequently, erosion pin results do not reflect the downslope
movement of sand due to seepage erosion. The one long-term site in the Zone (4F) shows little
change between December 1999 and the start of the recent monitoring, however the sampling
frequency was very low, and the recent results suggest that there is a great deal of variability over
shorter time scales. Results from the recently installed ‘toe pins’ at this site indicated erosion over
the summer months.
In the erosion pin results from all bank toe monitoring sites in Zone 4 are presented, showing a
general trend towards erosion. The range of change, ~30–120 mm over the November 01 to March
02 period, was similar in magnitude to that observed in Zone 3.
With the exception of Site 4F, scour chains have only been installed for a few months and have
shown little change apart from a dusting of sand at some sites. Since installation in December 1999,
the chain at Site 4F has indicated erosion, with 1 link exposed.
Site 4C consists of two pins installed in a vertical cobble bank and, similar to Site 2F, local scour has
occurred around the base of the pins. Some variability in the results is also attributable to the
irregular contact between the pin and the gravels, making measurement difficult.
18-D
ec-
99
6-M
ar-0
0
26-S
ep-0
0
23-N
ov-
01
8-D
ec-0
1
10-F
eb-0
29-
Mar
-02
13-A
pr-0
2
-380-360
-340-320
-300-280-260
-240-220
-200-180
-160-140-120
-100-80
-60-40
-200
20
Cha
nge
(mm
)
Zone 3 - toes3A3C3D3Eb3F3G Note scale is different

Fluvial Geomorphology Gordon River Basslink Monitoring Annual Report 2001-02
46
Figure 4.15. Erosion pin results for bank toes in Zone 4.
4.5.1.5 Zone 5 The results from the 13 monitoring sites in Zone 5 were generally consistent with upstream trends,
but changes were typically on a smaller scale. Similar to Zone 4, there was little evidence of
seepage erosion induced sediment flows. The one site established near a cavity (5E), however,
showed changes over the entire bank face with the results similar to the upstream sites (erosion of
cavity, deposition on slope, erosion of toe). Figure 4.6 and Figure 4.7 shows the location of the
erosion pins in this zone.
The one long-term site in the Zone (5G) showed consistent changes since December 1999,
although sampling frequency has been very low. The upper slopes and pins placed behind LWD
showed deposition, whereas pins in the lower slope and toe of the bank have recorded material
loss.
Figure 4.16 shows the erosion pin results from bank toes in Zone 5; although most sites showed
erosion, there was a wide range of responses, with the slopes of the recent monitoring sites varying
considerably. With the exception of Site 5A, changes were less than 30 mm.
Scour chains were installed in Zone 5 in February and March 2002, and have been monitored only
once. The sites are generally located on the mid-bank slope and so far have not recorded any
deposition or erosion. The chain at the long-term site, 5G, has shown nett erosion with 3 links
exposed since December 1999, with no depositional periods.
23-N
ov-0
1
8-D
ec-0
1
10-F
eb-0
2
10-M
ar-0
2
13-A
pr-0
2
-120
-110-100-90
-80-70-60
-50-40-30-20
-100
10
203040
506070
80
Cha
nge
(mm
)
Zone 4 - 'toes' onalluvial banks
4A/3 = toe4B/3 - toe4D/3 - toe4E/4 - toe4F/5 - toe4Ga/4 - toe4Gb/5 - toe

Gordon River Basslink Monitoring Annual Report 2001-02 Fluvial Geomorphology
47
Figure 4.16. Erosion pin results from bank toes in Zone 5.
4.5.2 Peizometer results The peizometer results showed that the high usage of the Gordon Power Station over the summer
months has resulted in long-durations of elevated water levels in the banks. Water levels at all
probes were generally equivalent to river level for much of the monitoring record (assuming river
level is equivalent to probe 2 at high flow). Since January 15th, relative water levels in the banks
have exceeded two metres with the short power station shutdowns insufficient in duration to allow
bank draining. The water level movement within the bank was consistent with previous
observations; in-bank water levels rapidly responded to river level changes, and were evident at
distances of 20 m and more inland.
The saturated bank conditions recorded by the peizometers were consistent with the active
seepage erosion observed during power station shutdowns, and the erosion pin and scour chain
results that indicated a high level of activity at sites where cavities and sediment flows were present.
Bank responses to water level changes were consistent with those reported in detail in Koehnken et
al., (2001).
4.5.3 Synthesis of monitoring data The recent monitoring period (November 01 – March 02) has been characterised by high power
station usage, including prolonged periods of 3-turbine and full-gate operation. Local rainfall and
associated natural inflows have been low, so flow in the entire study reach has been dominated by
discharge from the power station.
20-D
ec-
99
26-S
ep-0
0
23-N
ov-
01
9-D
ec-0
1
10-F
eb-0
210
-Mar
-02
13-A
pr-0
2
-140-130
-120-110
-100-90-80
-70-60
-50-40
-30-20-10
010
2030
4050
60
Cha
nge
(mm
)
Zone 5 'toes' on alluvial banks
5A/4 = toe5B/4 - toe5C/3 - toe5D/3 - toe5E/4 - toe5F/3 - toe5G/6 - toe5H/4 - toe5I/4 - toe5J/4 - toe5K/3 - toe5L/4 - toe5M/3 - toe
Fluvial Geomorphology Gordon River Basslink Monitoring Annual Report 2001-02
48
The erosion pin and scour chain results indicate scour of bank toes is occurring throughout the
study reach, with seepage erosion processes very active in the reaches upstream of the Denison
River. Erosion decreases with distance upslope, with upper banks showing little change over the
short monitoring period. These trends are consistent with the findings of the Basslink
Geomorphology investigations which related bank toe scour to increased use of 3-turbines in the
power station, and seepage erosion to saturated bank conditions and rapid draw-down. In general,
the hydrology of the recent monitoring period has been very similar to the summer portion of the
2000 Basslink study year, and the erosion pin, scour chain and peizometer data reinforce the
premise that the middle Gordon River is still actively adjusting to 3-turbine power station operation.
There is a large degree of variability within and between the zones, with Zone 1 monitoring sites
showing relatively less bank toe scour as compared to the downstream reaches. This is likely to be
attributable to the widespread buttressing of bank toes by bedrock and cobbles in the zone.
The Zone 2 sites showed a high level of activity, with bank toe scouring and the downslope
movement of bank material through seepage processes resulting in deposition and scour,
sometimes at the same site. This Zone has the highest proportion of alluvial banks in the middle
Gordon River and experiences large (~4 m) water level fluctuations associated with power station
operation. It was identified as the most active zone in the Basslink investigations and the monitoring
results indicated this was still the case.
Downstream of Zone 2, scour of bank toes appeared to be the dominant process, with the number
of sites dominated by seepage erosion processes decreasing, especially downstream of the Denison
River. In general, the magnitude of bank toe scour also decreases with distance downstream.
More measurements are required, and specifically during the wet winter months, before an in-depth
analysis of the relationship between power station operation and erosion in the middle Gordon
River can be completed. A fair understanding has been gained, during the past 2-years, of how
summer power station operation during drought conditions affects bank stability. However, there is
a poor understanding of how winter flows affect banks. Field observations during winter months
suggest that seepage processes are less active with the banks in Zone 2 appearing more stable.
Trends at two of the long-term erosion pin sites, 2K and 3A, suggest that winter processes may
result in reduced erosion rates (3A, Mar 00 – Sept 00) or even deposition (2K, Mar 00 – Sept 00).
These findings highlight the need to collect data over a range of summer and winter flow
conditions.
The present monitoring sites provide good information about the erosive processes operating in the
middle Gordon River.

Gordon River Basslink Monitoring Annual Report 2001-02 Karst Geomorphology
49
5 Karst Geomorphology Key karst features are monitored in both the Gordon-Albert and Nicholls Range karst areas twice
per year. During 2001-02, monitoring trips occurred in December 2001 and March 2002. An
additional monitoring trip was conducted in November 2001 to survey the Gordon-Albert karst area
and install monitoring equipment.
Figure 5.1 shows the location of the two karst areas investigated by the monitoring program.
Figure 5.1. Map of the locations of karst monitoring sites in the Gordon River during 2001-02.
5.1 Gordon-Albert karst area – November 2001
5.1.1 Monitoring sites There are 4 karst monitoring sites in the Gordon–Albert Karst area, all of which can be accessed
from two points in the river. Site 1 is a backwater channel known as Channel Cam, Site 2 is the new
cave (GA-X1) with a doline at the entrance, and Sites 3 and 4 are dolines. Each site has a number of
6 mm diameter 316 stainless steel erosion pins installed and a photo-monitoring site marked with a
red metal peg.
N
#YOlga R
. Orange R
.
Albert R
.Deniso
n R.M
axw
e ll R
.
Lake Pedder
Lake Gordon
GordonPowerStation
Gordon-Albert Karst#S
#SNichol ls Range Karst
0 5 10 Kilometres

Karst Geomorphology Gordon River Basslink Monitoring Annual Report 2001-02
50
5.1.2 The new cave (GA-X1) A new cave was found in the Gordon-Albert karst area, which was designated as GA-X1. The cave is
28 m long (including the large entrance area), 10 m deep, and is located approximately 10–20 m
from the Gordon River. There are two entrances to the cave: the smaller entrance lies on the
western (river) side of the feature and is a short near-vertical shaft leading down into the main
chamber; the second entrance is much larger and is effectively the base of a second large doline.
The cave has a sump at its lowest level, which is (within the level of accuracy of the survey) at the
same level as the Gordon River.
In November 2001, there was evidence of flood debris (small twigs and leaves) on the walls of the
cave, which is 3–4 m above the level of the sump. This level is consistent with the range of
fluctuations of the Gordon River in this area based on the water level recorder at site 71. The lower
portions of the cave were also encrusted with mud, which suggests recent flooding.
Continued, repeated fluctuation of the river may draw sediment out through the sump at the
bottom of the cave, thereby destabilising the sediments on the cave floor and at the entrances,
potentially leading to collapse of the surrounding vegetation. Doline collapse is a normal karst
process but the primary Basslink management issue is whether the expected increased number of
river fluctuations would significantly alter the natural process.
Erosion pins were installed into the sediments in the cave, doline and a nearby doline. With these,
and regular photo-monitoring, the karst monitoring program will continue to learn more about the
sediment transport processes through the system. The low energy environment in this cave (apart
from the lower levels subject to flooding) suggests that the most significant influence on sediment
transport will likely be from human visitation to read the erosion pins.
5.2 Nicholls Range karst area – December 2001
5.2.1 Monitoring sites There are two karst monitoring sites in the Nicholls Range Karst area, Site 5 in Kayak Kavern and
Site 6 in Bill Neilson Cave. Both sites were accessed by boat.
Kayak Kavern has 4 erosion pins installed and a photo-monitoring site marked with a red metal peg.
Bill Neilson Cave site has 5 sub-sites within the cave which are designated 6A–E. Sub-sites 6A –C
comprise various arrays of erosion pins. Sub-sites 6D and 6E are two lightweight capacitive water
level probes. Water levels were recorded every 20 minutes over a range of 1.0 m.
All pins and pegs are flagged with yellow fluorescent tape.
Gordon River Basslink Monitoring Annual Report 2001-02 Karst Geomorphology
51
5.2.2 Kayak Kavern and Bill Neilson Caves Since the previous trips to Kayak Kavern in August and September 2000, the following changes
have been noted:
Ø The 0.1 m mound on the top of the silt bank was not present on 8th December 2001.
Ø New large branches and logs had washed up on the silt bank at the entrance.
Ø The beach at the entrance of the cave appears to have changed shape. It has become less
steep and has retreated towards the back of the cave by a couple of metres.
Ø A small scarp (~0.2 m) had formed in the silt beach approximately 0.3 m from the original
erosion pin. There was associated cracking in the sediment and the pin had tilted slightly
forwards towards the water.
Ø The original erosion pin had changed in height from 325 mm measured on 2nd September
2000 to 309 mm which would suggest that sediment has been deposited. However this is
not a conclusive result as there was only one sample point.
There was also evidence of change in Bill Neilson Cave as follows:
Ø Recent inundation by Gordon River water had been to lower levels than had been
observed in 2000. While the inundation marks were not accurately recorded, the newly
installed water level recorder should provide this information in the future.
Ø Several new logs and branches had fallen into the cave through the daylight holes. Three
of the four water level recorder stakes, which had been installed as rudimentary water
level recorders, had been knocked over by falling debris.
Ø The remaining stake, which was the one closest to the floor of the cave, showed a definite
‘clean zone’ at approximately 0.89 RL where the soluble paint had been washed off. The
paint was still visible above this line and also on the other three stakes. This suggested
that water levels had not reached more than 10 cm higher than observed in 2000, in the
interim 15 months. This equates to an inundation distance of approximately 200 m into
the cave.
5.3 Both karst areas – March 2002
5.3.1 Erosion pin data The erosion pin data for all sites are summarised in Table 5.1.
There was clear evidence that some of the pins had been interfered with by either animals or birds,
particularly in the dolines at Sites 3 and 4 where the pins are relatively accessible. The yellow
fluorescent tape around the tops of the pins had been chewed and, in the case of pin 5, had been
completely removed. There had also been some interference in Bill Neilson Cave at the second wet
sediment bank, where the tape on the pins above the water level had been chewed. It was
interesting to note that the tape in the adjacent wet sediment bank, and in Kayak Kavern, had not
been touched.

Karst Geomorphology Gordon River Basslink Monitoring Annual Report 2001-02
52
Table 5.1. Erosion pin data for karst geomorphology monitoring sites for 2001-02.
Site
no.
Site
description
Pin
no.
Length at
23/11 or
8/12/01 (mm)
Length at
9/3/02 (mm)
Change
(mm)
Condition of
tape
Preliminary
interpretation
1 Channel Cam 1 322 318 –4 Deposition?
2 GA-X1 cave 2
3
4
250
190
154
239
189
161
–11
–1
+7
clean
clean
muddy
Deposition?
No change?
Erosion?
Doline at cave
entrance
9
10
214
278
213
278
–1
0
clean
clean
No change
No change
3 Doline adjacent
to GA-X1
5
6
7
8
259
300
254
195
287
300
252
196
+28
0
–2
+1
gone
clean
clean
clean
Interference
No change
No change
No change
4 Small doline 12
13
14
192
234
253
171
238
256
–21
+4
+3
chewed
chewed
chewed
Interference
Interference
Interference
5 Kayak Kavern 16
17
18
19
309
293
267
249
308
291
266
245
–1
–2
–1
–4
muddy
muddy
muddy
muddy
No change?
Deposition?
No change?
Deposition?
6 Bill Neilson:
6A at entrance
20
21
22
483
300
272
480
299
272
–3
–1
0
muddy
muddy
clean
Deposition?
No change?
No change
Bill Neilson:
6B Sed bank II
25
26
27
194
203
215
195
203
216
+1
0
+1
muddy
clean/chewed
clean/chewed
No change?
No change
No change?
Bill Neilson:
6C Dry sed bank
23
24
297
227
297
226
0
–1
clean
clean
No change
No change?
Note that in the caves, smaller changes in erosion pin heights can be regarded as more significant than in the dolines as
the substrate is fine sediment and measurements can be made reasonably accurately. The substrate in the dolines is
leaf litter and twigs which is more unstable and therefore readings are less accurate.
5.3.2 Water level recorders
The hydrographs from the two water level recorders in Bill Neilson Cave, between 8 December
2001 and 9 March 2002, are shown in Figure 5.2. The flow in the tailrace at the power station over
the same period is also shown, for comparison.
5.3.3 Photo-monitoring Photos were taken at all photo-monitoring sites as planned. A portfolio for each site is being
assembled.

Gordon River Basslink Monitoring Annual Report 2001-02 Karst Geomorphology
53
Figure 5.2: Water level data from Bill Neilson Cave,and power station tailracedischarge. During the relatively dry prevailing conditions, the recorder was not inundated until the power station was
releasing more than approximately 210 cumces. The effects of high flows in the Denison River have not yet been isolated.
0
0.2
0.4
0.6
0.8
1
1.2
1.4
08/1
2/20
01@
2:40
:00
10/1
2/20
01@
2:40
:00
12/1
2/20
01@
2:40
:00
14/1
2/20
01@
2:40
:00
16/1
2/20
01@
2:40
:00
18/1
2/20
01@
2:40
:00
20/1
2/20
01@
2:40
:00
22/1
2/20
01@
2:40
:00
24/1
2/20
01@
2:40
:00
26/1
2/20
01@
2:40
:00
28/1
2/20
01@
2:40
:00
30/1
2/20
01@
2:40
:00
01/0
1/20
02@
2:40
:00
03/0
1/20
02@
2:40
:00
05/0
1/20
02@
2:40
:00
07/0
1/20
02@
2:40
:00
09/0
1/20
02@
2:40
:00
11/0
1/20
02@
2:40
:00
13/0
1/20
02@
2:40
:00
15/0
1/20
02@
2:40
:00
17/0
1/20
02@
2:40
:00
19/0
1/20
02@
2:40
:00
21/0
1/20
02@
2:40
:00
23/0
1/20
02@
2:40
:00
25/0
1/20
02@
2:40
:00
27/0
1/20
02@
2:40
:00
29/0
1/20
02@
2:40
:00
31/0
1/20
02@
2:40
:00
02/0
2/20
02@
2:40
:00
04/0
2/20
02@
2:40
:00
06/0
2/20
02@
2:40
:00
08/0
2/20
02@
2:40
:00
10/0
2/20
02@
2:40
:00
12/0
2/20
02@
2:40
:00
14/0
2/20
02@
2:40
:00
16/0
2/20
02@
2:40
:00
18/0
2/20
02@
2:40
:00
20/0
2/20
02@
2:40
:00
22/0
2/20
02@
2:40
:00
24/0
2/20
02@
2:40
:00
26/0
2/20
02@
2:40
:00
28/0
2/20
02@
2:40
:00
02/0
3/20
02@
2:40
:00
04/0
3/20
02@
2:40
:00
06/0
3/20
02@
2:40
:00
08/0
3/20
02@
2:40
:00
Wat
er le
vel r
eco
rder
s (m
)
0
50
100
150
200
250
300
Tai
lrac
e (c
um
ecs)
Tailrace flow high enough to influence the water level recorder
Cave stream
Cave stream plus Gordon River
Tailrace flow

Karst Geomorphology Gordon River Basslink Monitoring Annual Report 2001-02
54
5.4 Discussion
5.4.1 Erosion pins All results presented are based on limited data collected between December 2001 and March
2002, and should be considered very preliminary.
5.4.1.1 Bill Neilson cave The erosion pin data suggest that, overall, there appears to be little nett sediment movement in Bill
Neilson Cave. The sediment closest to the floor of the cave appears the most mobile, which is to be
expected as it is also influenced by the cave stream processes.
The data indicate that there may have been some deposition in the cave, although the maximum
change in pin height (pin no. 20) was only –3 mm. It would appear from the very limited data so far
that, over the longer term, there may be a nett balancing of deposition and erosion, as pin no. 20,
which was installed on 4th September 2000, has had a nett change of zero mm in 18 months.
5.4.1.2 Kayak Kavern The pins in Kayak Kavern corroborated the results from Bill Neilson Cave. The maximum sediment
displacement on the pins was –4 mm on pin no. 19. This pin is protected in an eddy in the cave and
so a larger change in pin height relative to the other pins could have been anticipated. Pin no. 16,
which has been in place since 2nd September 2000, showed little change (–1 mm). While this pin
has had a change of –17 mm over 18 months, it is important to note that there is evidence of some
displacement since it was originally installed.
5.4.1.3 GA-X1 The pin array in the new cave in the Gordon-Albert karst area had a range of results. Pin 4, which is
the pin closest to the lower level sump, has increased in exposed length by 7 mm. Pin no. 2, which
is located further back into the cave and at a higher level, has shown a decrease in pin length of
11 mm. These results, combined with the sediment flow patterns on the cave floor and the mud on
the tape at pin 4, suggest that sediment may be moving through the cave from the smaller upper
level entrance, and out through the sump at the bottom. Further analyses will be possible when the
water level recorder data have been obtained next season.
5.4.1.4 Dolines Changes of up to +28 mm have been observed in the erosion pins located in the dolines. However,
all of these relatively large changes have been recorded from pins which show evidence of some
interference. Pins which have not been affected have recorded changes of –2 mm to +1 mm which
indicates that there had been little to no appreciable sediment movement to date. It is anticipated
Gordon River Basslink Monitoring Annual Report 2001-02 Karst Geomorphology
55
that the 12-monthly survey of the pin arrays should provide more useful information, than this 4-
month measurement interval of individual pin lengths.
There are significant differences in the sensitivity of the pin measurements between sites which
must be considered in analysing the results: pins inserted into a fine sediment base, such as those in
the caves, can be much more accurately measured than the doline sites where the pins are inserted
through vegetation and leaf litter. These differences in error margins of measurement need to be
considered in determining whether actual changes have occurred.
5.4.1.5 Channel Cam The erosion pin in Channel Cam has changed by –4 mm suggesting that deposition may be
occurring in this area. The original survey of the channel showed that the base of the depression
was inundated when the water level at site 71 was approximately 4.1 m (or between 225 and
230 cumecs of flow in the tailrace in dry weather). Based on the hourly water level recordings at
site 71, this area was inundated for less than 9 full days (8.7 days) between 23rd November 2001
and 9th March 2002, which suggests an average deposition rate of almost 0.5 mm per day.
5.4.2 Water level monitoring in Bill Neilson cave The data from the water level recorders in Bill Neilson cave are shown in Figure 5.2, together with
the flow at the tailrace over the same period. The effects of the Gordon River water on the cave
stream can be clearly seen in the data when the two hydrographs are compared. In relatively dry
weather, the Gordon River water only affects the water level recorder, which is located
approximately 130 m into the cave, when the power station is releasing more than 210 cumecs.
By isolating periods when the cave stream level was low, the maximum fluctuation in water level
due to the effects of the power station alone was estimated to be 0.45 m (between 0.15 m and
0.6 m on the gauge). This suggests that, in dry weather, a power station output of up to 240 cumecs
causes the water level in the cave to rise to a height of approximately 0.56 mRL. This indicates that,
at least during the summer months, the dry sediment bank 175 m into the cave is unlikely to be
affected by power station operations.
The highest peaks in the hydrograph corresponded to rainfall events rather than the effects of the
power station but the data series is not yet long enough to determine the effects of the station
combined with a heavy rainfall event and high flows in the Denison. The effect of high flows in the
Denison River are likely to be significant and this will be assessed as the winter flow data become
available in conjunction with the new cave survey data.
5.4.3 Photo-monitoring The photo-monitoring has so far, not revealed any additional information that had not already been
gleaned from direct observations.

Riparian Vegetation Gordon River Basslink Monitoring Annual Report 2001-02
56
6 Riparian Vegetation
6.1 Monitoring Strategy The riparian vegetation monitoring program aims to investigate current condition and processes on
the middle Gordon River and relate these to potential future changes in power station operation.
Each year data will be collected to allow both spatial and temporal comparisons. Data collected will
enable detection of changes occurring within the Gordon River system both pre- and post-Basslink.
Variations between the Gordon River and the Denison and Franklin Rivers will allow spatial
comparisons between the affected and reference rivers.
6.2 Methods This monitoring program collected data on the cover and abundance of the existing vascular
riparian species at permanent plots located in the middle Gordon River and in two reference rivers.
The Franklin and Denison Rivers are included in the monitoring program as reference rivers to
control for regional variables such as drought and recruitment events over the duration of the
monitoring program.
The monitoring comprised two methods of assessment: permanent quadrat sites and photo-
monitoring sites.
6.2.1 Quadrat sites
Permanent quadrat sites have been established and measured at areas of high disturbance to focus
on recruitment and loss of keystone species, as identified by Davidson and Gibbons (2001).
Quadrat sites were located along riverbanks in a design stratified to select sites prone to high levels
of disturbance, and on vegetated cobble bars. This method will enable more rapid detection of any
changes to the riparian vegetation as a “worst case” scenario. This bias has resulted in a majority of
the permanent quadrat sites being located on the active alluvial river banks.
Within the Gordon River all bank sampling sites corresponded with sites established for
geomorphology monitoring. One of the primary considerations in site selection was long term
stability of the quadrats. In areas of overhangs or very active scour, vegetation monitoring sites have
been located nearby.
Bank sampling sites have been established in four of the five geomorphology zones of the Gordon
River (see Figure 4.1, Zones 2-5). No bank sites were established in Zone 1, the zone closest to the
power station, due it being dominated by bedrock substrate. Cobble bar sites were selected on the
basis of having some shrub cover and being partially or totally inundated at three-turbine operation.
Two cobble bar sites were established in Zone 2 and one site in both Zones 4 and 5. There were
no suitably vegetated cobble bars in Zone 3.

Gordon River Basslink Monitoring Annual Report 2001-02 Riparian Vegetation
57
Site selection within the Denison and Franklin Rivers was largely dictated by logistical constraints.
Only those sites accessible by helicopter under a range of flows (except very high flows) were
selected for quadrat sites. This resulted in all bank monitoring sites being adjacent to, or accessible
from, cobble bars.
The location of all riparian vegetation monitoring sites is shown in Figure 6.1.
N
#Y
#
###
#
#
#
#####
####
###
#
##
#
Deni
son
R.
Max
wel
l R.
Lake Gordon
GordonPowerStation
Franklin 1
Franklin 2
Franklin 3
Gordon 5l
Gordon 5gGordon 5d
Gordon 5b
Denison 1
Denison 2Denison 3Denison 4
Gordon 4fGordon 4e
Gordon 4cGordon 4a
Gordon 3g Gordon 3ebGordon 3b
Gordon 2g Gordon 2dGordon 2bGordon G5a-1, G5a-2
0 5 10 15 Kilometres
Figure 6.1. Map of the riparian vegetation sites in the Gordon, Denison and Franklin Rivers, monitored during 2001-02.
At each site, one permanent transect, comprising 8 one-metre-square quadrats was established.
Quadrats were offset by 0.5 m from the transect line to avoid trampling impacts and were located
with reference to the high water mark as shown in Figure 6.2. At most of the quadrat sites the high
water mark was delineated by a star picket installed to mark three-turbine operation. At sites where
there was no delineation of high water mark, this was estimated by changes in litter cover and
ground disturbance.
Sites were permanently marked using deck spikes and flagging tape at the landward end of the
transect. Deck spikes were located in the top corners of the most landward quadrats to facilitate
accurate future alignment of the quadrats. On areas of uneven ground additional deck spikes were
installed. It is anticipated that all quadrat corners will be marked in the future to ensure accurate re-
location.

Riparian Vegetation Gordon River Basslink Monitoring Annual Report 2001-02
58
Figure 6.2 Diagrammatic representation of quadrat positions along transects in the Gordon, Franklin and Denison
Rivers.
Monitoring within these sites included assessment of ground species cover, levels of recruitment,
density of trees and shrubs, health of vegetation and habitat variables including substrate and
aspect, as discussed in the following sections.
6.2.1.1 Measures of cover Percentage overlapping cover values were recorded for ground cover species, and small shrubs
(<1m high) only, as this technique is not appropriate for tall species. Measures were visually
estimated to the nearest one percent. To minimise the influence of recorder bias field data will be
grouped using the Braun-Blanquet cover scale (Kershaw, 1974; Kent and Coker, 1994) and mid
points used for analysis (Bonham, 1989). This scale groups the estimates of area occupied by
individual plant species, ground litter, bare ground, rock and mosses into the classes defined in
Table 6.1, below.
Table 6.1. Rating scale for overlapping cover values of riparian ground cover and small shrub vegetation.
Rating Area occupied by plant species
+ Very small (<1%)
1 Small 1-5%
2 6-25%
3 26-50%
4 51-75%
5 76-100%

Gordon River Basslink Monitoring Annual Report 2001-02 Riparian Vegetation
59
6.2.1.2 Measures of tree and shrub density and stem size Measures of tree and large shrub density were obtained by stem counts within a belt transect
located within the quadrat areas. The number of individuals of tree and shrub species rooted within
1.5m of the central tape line (see Figure 6.2) were recorded. This arrangement formed a 3 m belt
transect, 4 metres long. These data were further grouped into size classes representing the width of
the stem 30 cm above the base. The size groupings were:
Ø 1-5 cm
Ø 6-10 cm
Ø 11-20 cm
Ø >21 cm
6.2.1.3 Descriptors of health
The relative health of the vegetation within the quadrat was assessed through visual inspection of
indicators of poor health from factors such as inundation and waterlogging. Presence of indicators
including chlorosis (yellowing) of older leaves, premature leaf fall, growth of adventitious roots and
wilting were noted, particularly for tea-tree. These data have been recorded as presence/absence
data for the above indicators.
6.2.1.4 Measures of root exposure Root exposure was scored as a percent of the quadrat and the average depth of this exposure
measured, giving a volumetric measure.
6.2.1.5 Measures of vertical bank change Measurements of ground conditions and species were taken along each permanent transect
running perpendicular to the river. Ground conditions were classified into the following classes:
Ø FF: Forest with floor litter intact (not regularly inundated);
Ø MD: Moderately disturbed - some inundation apparent;
Ø HD: High disturbance - little or no vegetation cover.
6.2.1.6 Measures of recruitment Recruitment of individual species was assessed within quadrats by counting and measuring
seedlings of all species. Some seedlings were not readily identifiable to species and have been
recorded as dicotyledons or monocotyledons. These data were recorded as number of seedlings
within each quadrat. Where numbers of seedlings for a species were very high (exceeding 10), the
measure was recorded as >10 and an average height given.

Riparian Vegetation Gordon River Basslink Monitoring Annual Report 2001-02
60
6.2.1.7 Measures of environmental variables Environmental variables measured include:
Ø Aspect – N, NE, E, SE, S, SW, W or NW;
Ø Illumination – illuminated cobble or shaded bank (as per Davidson and Gibbons, 2001);
and
Ø Substrate type – Alluvial, Alluvial and Cobble or Bedrock, Cobble.
6.2.2 Photo-monitoring sites Photo-monitoring locations will be established at representative sites covering all substrate types to
obtain more general and representative data on patterns and processes. Photo-monitoring has not
yet been implemented, and is planned to commence in December 2002. However, a series of
photographs was taken in April 2002 to test the methodology.
Photo-monitoring sites will be established at representative sites covering all substrate types within
the major reaches to obtain representative data on patterns and processes within the rivers. These
photo-monitoring sites will enable accurate, objective measurements of canopies of shrub and tree
species, presence/absence of ground layer species and assessment of health indicators. The
following factors will be considered in taking oblique photographs to reduce distortion and variation
(Magill, 1989):
Ø Photos will be taken using the same focal length and film type;
Ø Range poles will be placed on permanent markers at 5 m intervals (parallel to the river);
Ø Photos will be taken in the same season to avoid seasonal changes.
Post-processing of photos will include scanning into a Geographical Information System package.
Photos will be rectified into virtual coordinates using the permanent points and tops of the range
poles. A number of transects will be ‘drawn’ across the photograph and the following
measurements will be taken and compared over time:
Ø Canopy width for individual trees and shrubs;
Ø Number of individual trees and shrubs;
Ø Numbers of clumps of graminoids and ferns;
Ø Presence/absence of ground species.
6.3 Results Riparian vegetation sampling was conducted in Autumn (March-April) 2002 in accordance with the
requirements of the Basslink Monitoring Program for the Gordon River. The studies undertaken to
date represent the first component of the quantitative studies of riparian vegetation. Quadrat
studies were conducted at 23 permanent sites along the Gordon, Franklin and Denison Rivers.
Photo-monitoring and recruitment monitoring will commence in December 2002 and be reported
in the 2002-03 Gordon River Basslink Monitoring Annual Report.

Gordon River Basslink Monitoring Annual Report 2001-02 Riparian Vegetation
61
Surveys were successfully completed at all tributary sites and those in the Gordon River
geomorphology Zones 2, 3 and 4. These sites are shown in Figure 6.1.
The data for Zone 5 sites have been excluded as analysis showed very low cover estimates,
indicating poor site selection. The location of sites will be reviewed during the next field monitoring
to investigate and overcome these assumed sampling and/ or recording errors.
The data presented in this report represent the first monitoring of permanent sites. There are
insufficient data for detailed analyses, and these have not been undertaken. The following
discussion presents general trends in the riparian vegetation at the high disturbance sites. At the end
of the baseline sampling period these data will provide a time series which will be analysed to
determine patterns and indicate processes in the riparian vegetation.
A list of the plant species recorded during this monitoring is provided in Table 6.2.
6.3.1 Species diversity and cover A total of eighty-five species were recorded in the quadrat surveys in all rivers. The species diversity
(as number of species) and cover was vertically stratified on the Gordon River banks, concomitant
with increasing disturbance.
Figure 6.3, Figure 6.4, and Figure 6.5 show the number of ground species recorded for each
quadrat, grouped by quadrat type, for Zones 2, 3 and 4, respectively.
Figure 6.6, Figure 6.7, and Figure 6.8 present the total overlapping cover percentages recorded for
each quadrat, grouped by quadrat type, for Zones 2, 3 and 4, respectively.
The lower banks (see Figure 6.2: quadrats 4 & 8, the channel quadrats) recorded sparse vegetation
cover with limited species diversity. Ground species were generally limited to bryophytes,
occasional ferns (Blechnum spp.) and the grasses Ehrharta spp. Overhanging shrub and tree species
such as Eucryphia lucida, Richea pandanifolia and Nothofagus cunninghamii were also recorded
when branches were under the 1m cut off for cover estimates. The inundation and disturbance
tolerant shrub Leptospermum riparium was also often present and frequently dominates on lower
alluvial banks.
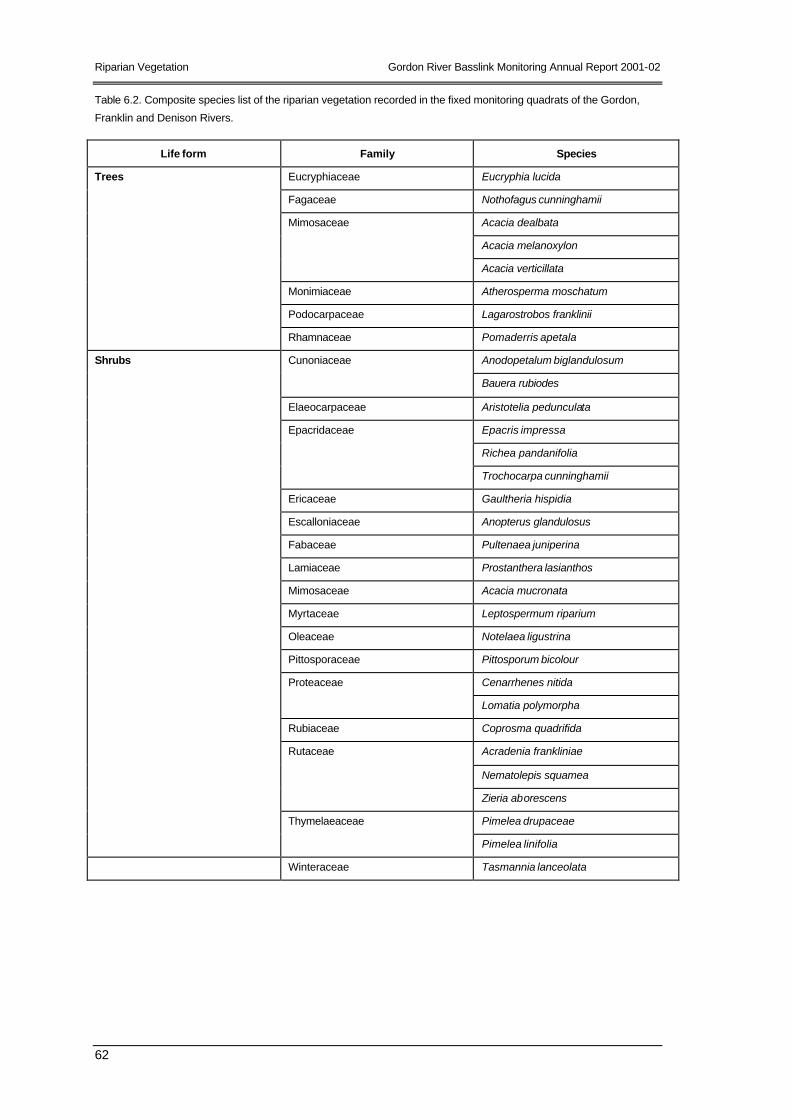
Riparian Vegetation Gordon River Basslink Monitoring Annual Report 2001-02
62
Table 6.2. Composite species list of the riparian vegetation recorded in the fixed monitoring quadrats of the Gordon,
Franklin and Denison Rivers.
Life form Family Species
Trees Eucryphiaceae Eucryphia lucida
Fagaceae Nothofagus cunninghamii
Mimosaceae Acacia dealbata
Acacia melanoxylon
Acacia verticillata
Monimiaceae Atherosperma moschatum
Podocarpaceae Lagarostrobos franklinii
Rhamnaceae Pomaderris apetala
Shrubs Cunoniaceae Anodopetalum biglandulosum
Bauera rubiodes
Elaeocarpaceae Aristotelia pedunculata
Epacridaceae Epacris impressa
Richea pandanifolia
Trochocarpa cunninghamii
Ericaceae Gaultheria hispidia
Escalloniaceae Anopterus glandulosus
Fabaceae Pultenaea juniperina
Lamiaceae Prostanthera lasianthos
Mimosaceae Acacia mucronata
Myrtaceae Leptospermum riparium
Oleaceae Notelaea ligustrina
Pittosporaceae Pittosporum bicolour
Proteaceae Cenarrhenes nitida
Lomatia polymorpha
Rubiaceae Coprosma quadrifida
Rutaceae Acradenia frankliniae
Nematolepis squamea
Zieria aborescens
Thymelaeaceae Pimelea drupaceae
Pimelea linifolia
Winteraceae Tasmannia lanceolata

Gordon River Basslink Monitoring Annual Report 2001-02 Riparian Vegetation
63
Life form Family Species
Herbs and Twiners Apiaceae Hydrocotyle hirta
Hydrocotyle muscosa
Oreomyrrhis gunnii
Asteraceae Brachyscome sp.
Gnaphal ium spp.
Lagenifera stipitata
Haloragaceae Gonocarpus teucroides
Iridaceae Libertia pulchella
Liliaceae Drymophila cyanocarpa
Onagraceae Epilobium sp.
Oxalidaceae Oxalis perrenans
Plantaginaceae Plantago paradoxa
Ranunculaceae Clematis aristata
Rosaceae Acaena novae-zelandiae
Rubiaceae Galium australe
Violaceae Viola hederacea
Grasses, reeds and tussocks Cyperaceae Carex appressa
Carex sp.
Gahnia grandis
Isolepis crassiuscula
Isolepis fluitans
Schoenus maschalinus
Uncinia sp.
Juncaceae Juncus pallidus
Juncus pauciflorus
Juncus sp.
Poaceae Agrostis sp.
Deyeuxia monticola
Ehrarta tasmanica
Ehrarta stipoides
Ehrharta spp.
Poaceae sp. aff. Danthonia
Poa sp.
Restionaceae Restio tetraphyllus

Riparian Vegetation Gordon River Basslink Monitoring Annual Report 2001-02
64
Vegetation type Family Species
Ferns Adiantaceae Adiantum aethiopicum
Aspleniaceae Asplenium flabellifolium
Blechnaceae Blechnum fluviatile
Blechnum minus
Blechnum nudum
Blechnum wattsii
Doodia cordata
Culcitaceae Calochlaena dubia
Gleicheniaceae Gleichenia microphylla
Sticherus tener
Grammitidaceae Grammitis billardieri
Grammitis magellanica
Hymenophyllaceae Hymenophyllum australe
Hymenophyllum cupressiformis
Hymenophyllum flabellatum
Hymenophyllum peltatum
0
2
4
6
8
10
12
14
16
18
20
Channel Low bank High Bank Above high water
Quadrat type
Num
ber
of g
roun
d sp
ecie
s
2b left2d left2g left2b right2d right2g right
Figure 6.3. Number of ground species by quadrat type for Zone 2 bank sites in the Gordon River in March-April 2002.
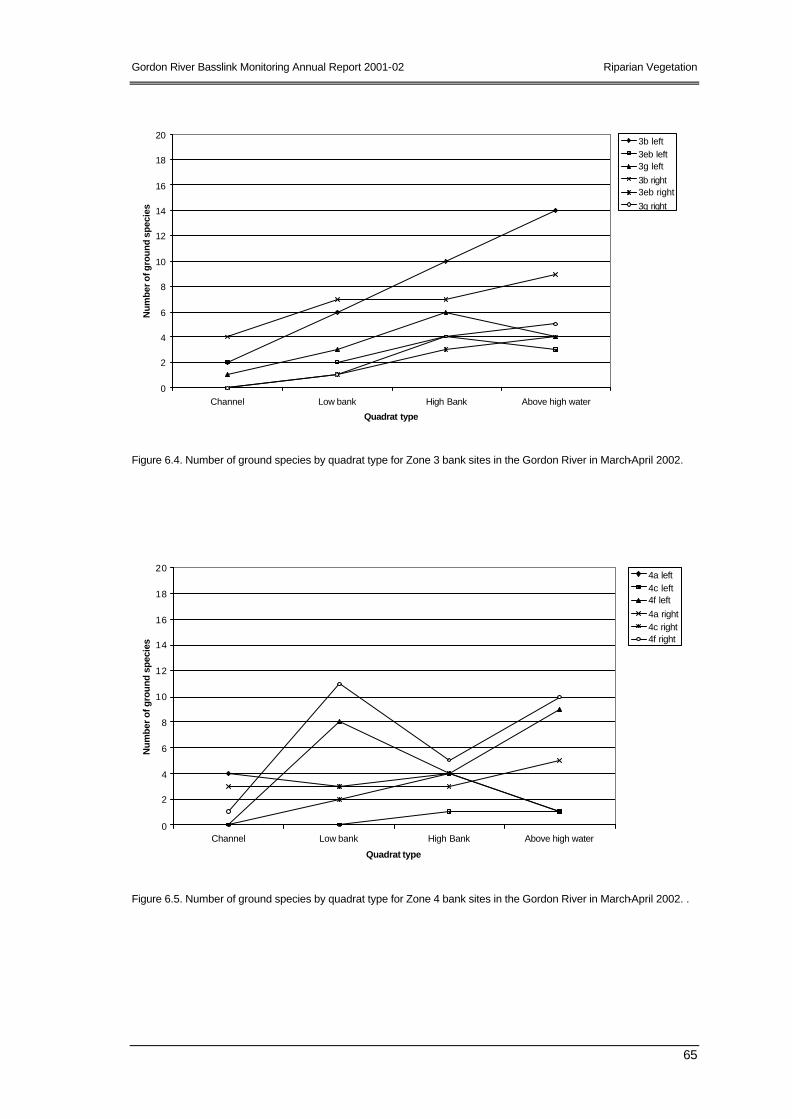
Gordon River Basslink Monitoring Annual Report 2001-02 Riparian Vegetation
65
0
2
4
6
8
10
12
14
16
18
20
Channel Low bank High Bank Above high water
Quadrat type
Num
ber o
f gro
und
spec
ies
3b left3eb left3g left3b right3eb right3g right
Figure 6.4. Number of ground species by quadrat type for Zone 3 bank sites in the Gordon River in March-April 2002.
0
2
4
6
8
10
12
14
16
18
20
Channel Low bank High Bank Above high water
Quadrat type
Num
ber
of g
roun
d sp
ecie
s
4a left4c left4f left4a right4c right4f right
Figure 6.5. Number of ground species by quadrat type for Zone 4 bank sites in the Gordon River in March-April 2002. .

Riparian Vegetation Gordon River Basslink Monitoring Annual Report 2001-02
66
0
10
20
30
40
50
60
70
80
90
100
Channel Low bank High Bank Above high water
Quadrat type
Ove
rlap
ping
cov
er (%
)
2b left2d left2g left2b right2d right2g right
Figure 6.6. Total overlapping cover values for all ground species by quadrat type for Zone 2 bank sites in the Gordon
River in March-April 2002.
0
10
20
30
40
50
60
70
80
90
100
110
120
130
140
150
160
170
180
Channel Low bank High Bank Above high water
Quadrat type
Ove
rlap
pin
g c
ove
r (%
)
3b left3eb left3g left3b right3eb right3g right
Figure 6.7. Total overlapping cover values for all ground species by quadrat type for Zone 3 bank sites in the Gordon
River in March-April 2002.

Gordon River Basslink Monitoring Annual Report 2001-02 Riparian Vegetation
67
0
10
20
30
40
50
60
70
80
90
100
Channel Low bank High Bank Above high water
Quadrat type
Ove
rlap
ping
cov
er (%
)4a left4c left4f left4a right4c right4f right
Figure 6.8. Total overlapping cover values for all ground species by quadrat type f or Zone 4 bank sites in the Gordon
River in March-April 2002.
In the ‘low-bank’ and ‘high-bank’ quadrats (see Figure 6.2: quadrats 3 & 7 and 2 & 6, respectively -
those associated with 2-3 turbine inundation) the species diversity increased. A greater number of
additional fern and graminoid species (Gleichenia microphylla, Isolepis spp. and Juncus spp.)
occurred and some isolated shrubs, such as Coprosma quadrifida, were rooted within these
quadrats. Cover contributed by mosses reduces in relative importance but remains significant.
The ‘above high water’ quadrats (see Figure 6.2: quadrats 1 & 5) were generally characterised by
increased ground species diversity. Shrubs such as Richea pandanifolia, Trochocarpa cunninghamii
and Anopterus glandulosus became more frequent, providing a previously absent middle canopy
structure to the vegetation. The ground layer retained a diverse cover of ferns and mosses in many
places with overlapping cover also increasing. Some quadrats had substantial overlapping ground
layers, largely comprised of ferns and moss cover. Therefore the total overlapping cover at times
exceeded one hundred percent (see the ‘above high water’ quadrats at site 3b –Figure 6.7).
6.3.2 Ground conditions Mineral substrates predominated in the channel and lower bank quadrat sites at all sites measured,
displaying an expected inverse relationship to vegetation cover. Figure 6.9, Figure 6.10, and Figure
6.11 illustrate the percentage of bare ground recorded for the various sites in Zones 2 – 4,
respectively.
Site 4c (Figure 6.11) displayed consistently high bare ground and low species cover in all quadrats
due to this site being an exposed, near vertical cobble bank.

Riparian Vegetation Gordon River Basslink Monitoring Annual Report 2001-02
68
0
10
20
30
40
50
60
70
80
90
100
Channel Low bank High Bank Above high water
Quadrat type
Ove
rlap
pin
g c
ove
r (%
)
2b left
2d left2g left2b right
2d right2g right
Figure 6.9. Percentage overlapping cover for bare ground by quadrat type for Zone 2 bank sites in the Gordon River in
March-April 2002.
0
10
20
30
40
50
60
70
80
90
100
Channel Low bank High Bank Above high water
Quadrat type
Ove
rlap
ping
cov
er (%
)
3b left3eb left3g left3b right3eb right3g right
Figure 6.10. Percentage overlapping cover for bare ground by quadrat type for Zone 3 bank sites in the Gordon River in
March-April 2002.

Gordon River Basslink Monitoring Annual Report 2001-02 Riparian Vegetation
69
0
10
20
30
40
50
60
70
80
90
100
Channel Low bank High Bank Above high water
Quadrat type
Ove
rlap
ping
cov
er (%
)4a left4c left4f left4a right4c right4f right
Figure 6.11. Percentage overlapping cover for bare ground by quadrat type for Zone 4 bank sites in the Gordon River in
March-April 2002.
Root exposure was consistently higher in the lower quadrats, representing up to 65% cover in the
‘channel’ and ‘low bank’ quadrats. The ‘high bank’ quadrats also recorded high values in areas of
localised scour, representing up to 45% cover. As expected, the areas above high water mark had
more moderate root exposure: up to 16% at a site in Zone 2. The depth of root exposure followed
a similar pattern.
Litter cover was inversely proportional to the amount of disturbance and generally only present in
the ‘channel’ and ‘low bank’ quadrats as fixed litter in the form of logs and branches. In the upper
quadrats, leaves and smaller branches persisted in more protected sites. Litter cover was subject to
influence by the immediate pre-monitoring power station operations and is expected to be highly
variable over time.
6.3.3 Species recruitment Active recruitment was recorded at most sites within each of the geomorphic zones although this
was generally restricted to the higher quadrats. Figure 6.12 shows the total number of seedlings
measured for each quadrat position in each Gordon River zone.

Riparian Vegetation Gordon River Basslink Monitoring Annual Report 2001-02
70
0
5
10
15
20
25
30
35
40
Channelquadrats
Low bankquadrats
High bankquadrats
Above HWquadrats
Quadrat type
Num
ber
of s
eedl
ings
Zone 2
Zone 3
Zone 4
Figure 6.12. Total number of seedlings of all species measured in each quadrat type for each of the Gordon River
zones.
Small (<5 cm) even-aged Clematis aristata and Nothofagus cunninghamii seedlings were locally
abundant at many sites. However there were few, if any, older individuals located in the quadrats.
Other species present as seedlings included: Atherosperma moschatum, Coprosma quadrifida,
Leptospermum riparium, Pomaderris apetala and Acacia verticillata. In some instances seedlings
were not readily identifiable and have been recorded as either monocotyledons or dicotyledons.
6.3.4 Photo-monitoring methodology trial The photo-monitoring trial indicated that a large number of sites could be covered in the limited
field time available. This would enable a larger, representative sample of riparian vegetation on all
substrates to be monitored for health indices and changes in diversity and cover.
Initial analysis of photographs indicated that quantitative variables could be determined from the
photographs with an appropriate degree of accuracy. Problems of site relocation and angle of
photographs can be minimised by installing permanent marking points and using ranging poles to
frame the photographs. Species recognition can be difficult in some photographs and can be
assisted by lists taken in the field.
Qualitative measurements such as indications of chlorosis may not be as reliable due to light
changes and supplementary data will be collected in the field to overcome this.

Gordon River Basslink Monitoring Annual Report 2001-02 Riparian Vegetation
71
6.4 Discussion The results presented above are from a single monitoring event: therefore, meaningful analysis is
limited by the short time period and a consequent lack of data.
Patterns of species cover and diversity within the Gordon River were consistent with Davidson and
Gibbons (2001) who found significant differences in sites of varying bank height on the Gordon
River. The results showed a large degree of variability within each site as a consequence of the
extent of the area affected by flows. Species diversity, species overlapping cover and litter cover
were all directly proportional to bank height (quadrat location) whilst bare ground and root
exposure were inversely proportional.
Recruitment within the Gordon River has not been previously quantified but had been regarded as
generally low (Davidson and Gibbons, 2001). The diversity and level of recruitment identified in this
monitoring was higher than expected at most sites and not confined to the quadrats above high
water mark. This suggests that recruitment of some species was not restricted by viable propagule
availability and that conditions suitable for germination do occur. However, the absence of older
cohorts casts doubt on the longevity and establishment of seedlings, and more temporal data points
are required to confirm any patterns. The presence of large numbers of Nothofagus cunninghamii
seedlings may also indicate a localised masting event which is common for this and numerous other
rainforest species (Read 2001). Recruitment monitoring will be undertaken twice yearly to help
elucidate any trends.
Sampling was completed successfully for Zones 2, 3 and 4. Zone 5 data were excluded from
discussion due to assumed sampling and recording errors and will be reviewed in the next field
session. Field data sheets have been redesigned to minimise the likelihood of such errors occurring
in the future. Site relocation will be undertaken for those sites deemed unsuitable. Zone 5 is the
zone of least impact from flow regulation, receiving flood and natural flows from both the Denison
and Franklin Rivers.

Macroinvertebrates Gordon River Basslink Monitoring Annual Report 2001-02
72
7 Macroinvertebrates
7.1 Introduction and Methods Macroinvertebrate sampling was conducted in spring (October) 2001 and autumn (March) 2002.
Both quantitative (surber) and rapid bioassessment (RBA) sampling was conducted at nine
‘monitoring’ sites in the Gordon River between the power station and the Franklin River junction.
Monitoring was also conducted at six ‘reference’ sites in rivers within the Gordon catchment but in
undisturbed condition.
7.1.1 Monitoring Sites The locations of the monitoring sites are shown in Figure 7.1.
N
#Y#S#S#S#S
#S
#S
#S
#S
#S
#S
#S
#S
#S
#S
Den i
son
R.
Max
wel
l R.
Lake Gordon
GordonPowerStation
Fr21
Fr11
42
48
58
Ma7
De35
De760
63
69
72
74 75
0 5 10 15 20 Kilometres
Figure 7.1. Map of the locations of macroinvertebrate monitoring sites in the Gordon, Denison and Franklin Rivers for
2001-02.

Gordon River Basslink Monitoring Annual Report 2001-02 Macroinvertebrates
73
7.1.2 Macroinvertebrate sampling The same monitoring method was conducted at all sites. Thus, at each site at low flows, riffle habitat
was selected and sampled by:
Ø Collecting 10 surber samples (30 x 30 cm area, 500 micron mesh) by hand disturbance of
substrate to a depth of 10 cm and washing into the net; and
Ø Disturbing substrate by foot and hand immediately upstream of a standard 250 micron
kick net over a distance of 10m.
All surber samples from a site were pooled and preserved (10% formalin) prior to lab processing.
Samples were elutriated with a saturated calcium chloride solution and then sub-sampled to 20%
using a Marchant box subsampler, and random cell selection. The subsamples were then hand
picked and all fauna identified to family level with the exception of oligochaetes, Turbellaria,
Hydrozoa, Hirudinea, Hydracarina, Copepoda and Tardigrada. Chironomids were identified to sub-
family.
All RBA samples were live-picked on site for 30 minutes, with pickers attempting to maximise the
number of taxa recovered. All taxa were identified to the same taxonomic levels as described
above.
7.1.3 Habitat variables A set of standard habitat variables were recorded at each site, and a number of variables were
recorded from maps.
7.1.4 Analysis No detailed analysis has been conducted for this report, other than to derive O/E scores and plot
summary trends. All RBA data were analysed using the Hydro RIVPACS models developed by
Davies et al. (1999), with predictions and O/Epa and O/Erk values derived using the RBA
macroinvertebrate data in combination with key ‘predictor’ habitat variables.
7.2 Results
7.2.1 Quantitative (surber) sampling Data from surber samples are shown in Table 7.1 and Table 7.2, below. A trend of increasing
diversity and total abundance was apparent in these data (see Figure 7.2), generally consistent with
that observed by Davies and Cook (2001) in 1998-99. A high value for site 60 (G9) was due to a
very high density of simuliids observed in spring 2001 – values for all other taxa at this site were
consistent with the overall downstream trend. Mean values for reference sites are also shown in
Figure 7.2.

Macroinvertebrates Gordon River Basslink Monitoring Annual Report 2001-02
74
Table 7.1. Quantitative macroinvertebrate data (abundances as n per 0.18 m2) for Gordon and reference sites sampled
in Spring 2001.
In general, all sites upstream of the Denison River fall below reference site abundance and diversity,
while sites down stream of the Denison have similar numbers of taxa to reference sites but are
lower in abundance. Again, this is consistent with the Davies and Cook (2001) observations from
1998-99.
Date: Spring (October 2001)River: Gordon Denison Maxwell JaneType: Monitoring Reference
Site: 75 74 72 69 63 60 57 48 42 Fr11 Fr21 De7 De35 Ma7 Ja7Order Class Family
Cnidaria Hydrozoa 1PlatyhelminthesTurbellaria 1 2 2 2 2Nematoda 1 1 2 2 4 5 1 6 8Mollusca Bivalvia Sphaeriidae 1 4
Gastropoda Hydrobiidae 1 4 4 1 8 2 8 3 221 1PlanorbidaeLymnaeidae
AncylidaeUnid. gastropods
Annelida HirudineaOligochaeta 1 19 6 1 26 29 13 54 85 24 99 57 58 109 224
Arachnida Hydracarina 1 1 1 1 1 2 1 7 1Crustacea Amphipoda Paramelitidae 4 2 6
Ceinidae 1Isopoda Phreatoicidea 5
Janiridae 9 4 1 2 2 7 1Ostracoda 1
Insecta Collembola 2 1Plecoptera Eustheniidae 1 1 1 1 1 1 2 1 8 3
Gripopterygidae 2 3 3 16 7 10 3 16 8 4 11 37 9Ephemeroptera Leptophlebiidae 3 2 3 20 16 9 20 23 32 56 97 91 110
Baetidae 1 32 15 4 28 42 37Diptera Chironomidae Chironominae 1 3 4 2 21 49 43 9 1 19 10 5
Orthocladiinae 1 14 5 2 1 5 16 1 21 8 3Podonominae 2 2 1 8 5 4 15 7 19 4 6 5 6Tanypodinae 1 1Diamesinae 1 2 2
Aphroteniinae 1 5 3 3Simuliidae 39 7 10 42 1076 17 537 331 436 230 44 124 39 48Tipulidae 1 1 1
AthericidaeBlephariceridae 2 4 17 22 22 2 14 2 1
Ceratopogonidae 1 4 4 2 6Empididae 8 2 3
Unid. pupae 3 8 5 22 8 4 2 4Trichoptera Calocidae 2
Conoesucidae 1 1 15 12 5 13 5 1 2 15Ecnomidae
Glossosomatidae 1 1 11Helicophidae
HelicopsychidaeHydrobiosidae 1 1 3 8 1 3 8 11 9 4 5 9 5
Hydropsychidae 65 272 14 4 19 2 1 7 1Hydroptilidae 1 2 3 1Leptoceridae 1 1 1 8 2 15
Philopotamidae 1 3Philorheithridae 2 1 2 2
Polycentropodidae 1Unid. pupae
Coleoptera Adult Elmidae 5 6 5 2 9 3 19 23 44 24Larval Elmidae 4 6 24 3 7 10 12 139 176 137 263
Larval Scirtidae 1 1 8 1 8 2 3 Larval Psephenidae 2 9 2
N Taxa 3 12 14 9 22 19 18 21 24 22 20 13 23 37 23Total Abundance 11 75 30 26 232 1472 115 709 605 690 462 336 606 852 781

Gordon River Basslink Monitoring Annual Report 2001-02 Macroinvertebrates
75
Table 7.2. Quantitative macroinvertebrate data (abundances as n per 0.18 m2) for Gordon and reference sites sampled
in Autumn 2002.
7.2.2 RBA (kick) sampling Data from of RBA kick-sampling and live picking are shown in Table 7.3 and Table 7.4, below. These
data were entered, along with values of predictor variables into the combined season RIVPACS
models developed by Davies et al. (1999). O/E values derived from the presence/absence (pa) and
rank abundance (rk) models are shown in Table 7.5. The trends in O/E values with distance
downstream of the power station are shown in Figure 7.3, accompanied by values for reference
sites sampled at the same time.
Date: Autumn (March 2002)River: Gordon Denison Maxwell JaneType: Monitoring Reference
Site: 75 74 72 69 63 60 57 48 42 Fr11 Fr21 De7 De35 Ma7 Ja7Order Class Family
Cnidaria Hydrozoa 2PlatyhelminthesTurbellaria 2 1 1 1Nematoda 1 6 7 4 3 2Mollusca Bivalvia Sphaeriidae 2
Gastropoda Hydrobiidae 1 1 2 1 1 12 1 6 1 3 1 25PlanorbidaeLymnaeidae
Ancylidae 1 4 8 1Unid. gastropods
Annelida HirudineaOligochaeta 7 10 6 30 10 73 8 141 111 9 9 16 4 68
Arachnida Hydracarina 4 2 1 3 2 5 2Crustacea Amphipoda Paramelitidae 1 2 15 3
CeinidaeIsopoda Phreatoicidea 2 2
Janiridae 21 5 1 1 2 9 1 4 4Ostracoda
Insecta CollembolaPlecoptera Eustheniidae 1
Gripopterygidae 6 7 11 4 1 4 2 1 4 6 4 3Ephemeroptera Leptophlebiidae 2 2 5 9 13 7 7 9 16 66 26 54 53 85 125
Baetidae 2 3 7 9 4 31 42 39Diptera Chironomidae Chironominae 2 7 2 45 5 1 1 4 4 2
Orthocladiinae 3 4 8 2 2 2 31 1 10 11 2 3 27 15 3Podonominae 2 2 3 3 2 3 11 2 6TanypodinaeDiamesinae 1
Aphroteniinae 1 2Simuliidae 4 3 9 49 31 80 36 57 64 172 117 62 14 97Tipulidae 2 1 1 2
Athericidae 1Blephariceridae 1 3 2 1 3 1 14 12 2 8
Ceratopogonidae 4 1 1Empididae 5 1 2 1 14 1
Unid. pupae 1 2 1 3 3 2 1Trichoptera Calocidae
Conoesucidae 3 2 1 1 5 4 10 1Ecnomidae 1 14
Glossosomatidae 6 1 6 1 4 4 2 1 8Helicophidae 2
Helicopsychidae 1Hydrobiosidae 1 5 2 2 2 6 7 3 6 8 5 5
Hydropsychidae 1 88 3 100 1 50 1 1 2 4Hydroptilidae 1 1 2Leptoceridae 3 1 16 8 1
Philopotamidae 1 1Philorheithridae 5 2 24 8 27
Polycentropodidae 1Unid. pupae 2 3 3 4
Coleoptera Adult Elmidae 2 1 3 24 6 7 5 10 42 40 16Larval Elmidae 3 6 26 7 66 2 71 86 85 211 179
Larval Scirtidae 4 1 91 25 33 22 35 52 Larval Psephenidae 2 1 2 4 5 1
N Taxa 5 12 9 14 19 14 30 15 25 27 18 21 26 27 19Total Abundance 28 40 31 57 227 78 417 81 439 430 351 348 445 548 643

Macroinvertebrates Gordon River Basslink Monitoring Annual Report 2001-02
76
0
5
10
15
20
25
30
0 5 10 15 20 25 30 35 40 45
Distance from PS (km)
N T
axa
Test sites Reference
0
100
200
300
400
500
600
700
0 5 10 15 20 25 30 35 40 45
Distance from PS (km)
Tot
al A
bund
ance
Test sites Reference
Figure 7.2. Trends in diversity (number of taxa) and total abundances of macroinvertebrates in the Gordon River with
distance downstream of the Gordon Power Station. Mean values for the reference sites sampled at the same time are
also shown, with error bars (+/- 1 SD).

Gordon River Basslink Monitoring Annual Report 2001-02 Macroinvertebrates
77
Overall, the values of O/E and the downstream trends are similar to those observed previously in
1995-96 and 1998-99 by Davies et al. (1999) and Davies and Cook (2001). Thus, O/E values are
low in the river reach upstream of the Denison River junction.
Table 7.3. RBA macroinvertebrate data (abundances per live picked sample) for Gordon and reference sites sampled in
spring 2001.
Date: Spring (October 2001)River: Gordon Denison Maxwell JaneType: Monitoring Reference
Site: 75 74 72 69 63 60 57 48 42 Fr11 Fr21 De7 De35 Ma7 Ja7Order Class Family
Platyhelminthes Turbellaria 1 1 4
Nematoda 1 3 5
Mollusca Bivalvia SphaeriidaeGastropoda Hydrobiidae 1 2
Annelida HirudineaOligochaeta 16 32 6 23 35 21 42 36 33 8 25 16 8 24
Arachnida Hydracarina 1 1 3 1
Crustacea Amphipoda Paramelitidae 17 2 1 10 9 5 1
Isopoda PhreatoicideaJaniridae 3 1 1 1
Plecoptera Eustheniidae 4 2 1 5 2 2 3 5 6 5 2 2
Austroperlidae 1 1 1
Gripopterygidae 2 8 7 18 4 3 6 6 12 8 3 30 9
Notonemouridae 3 2 1 2 1
Ephemeroptera Leptophlebiidae 11 3 33 10 7 50 24 30 49 69 103 84 66 79 112
Baetidae 21 9 5 12 33 9
Odonata Telephlebiidae 1
Diptera Chironomidae Chironominae 1 2 2 1 1 3 1 3 1 4 1
Orthocladiinae 2 8 1 6 2 1 1 9 2 6 1
Podonominae 2 2 36 27 15 29 9 25 10 11 9 19 5
TanypodinaeDiamesinae 6
AphroteniinaeSimuliidae 38 4 6 18 107 35 36 26 60 82 41 18 9 6
Tipulidae 1 2 2 1 1 1 1 1 2 2 1
Athericidae 1 1 1
Blephariceridae 4 3 1 4 4 7 4 2
Ceratopogonidae 3 4 2
Empididae 1 1 2 2
Unid. pupae 1 3 1 2
Trichoptera Calocidae 2
Conoesucidae 1 3 3 2 1 1 3
Glossosomatidae 4 6
Hydrobiosidae 11 3 7 4 19 26 7 15 6 17 21 25 29 26 14
Hydropsychidae 40 27 23 4 1 17 1
HydroptilidaeLeptoceridae 1 2 1 1 1 2
PhilopotamidaePhilorheithridae 1 2 1 1 1 2
Unid. pupae 2 2 5
Coleoptera Adult Elmidae 1 3 3 3 9 10 11 17 31 28
Adult Hydrophilidae 1
Larval Elmidae 1 3 1 5 1 5
Larval Scirtidae 1 1 1 1 2 6 2
Larval Psephenidae 2 1 1 3 2 1
Nematomorpha Gordiidae 1 1
N Taxa 13 12 16 15 20 12 17 17 18 21 19 14 17 23 20
Total Abundance 63 79 100 50 191 285 154 184 159 268 291 221 189 293 232
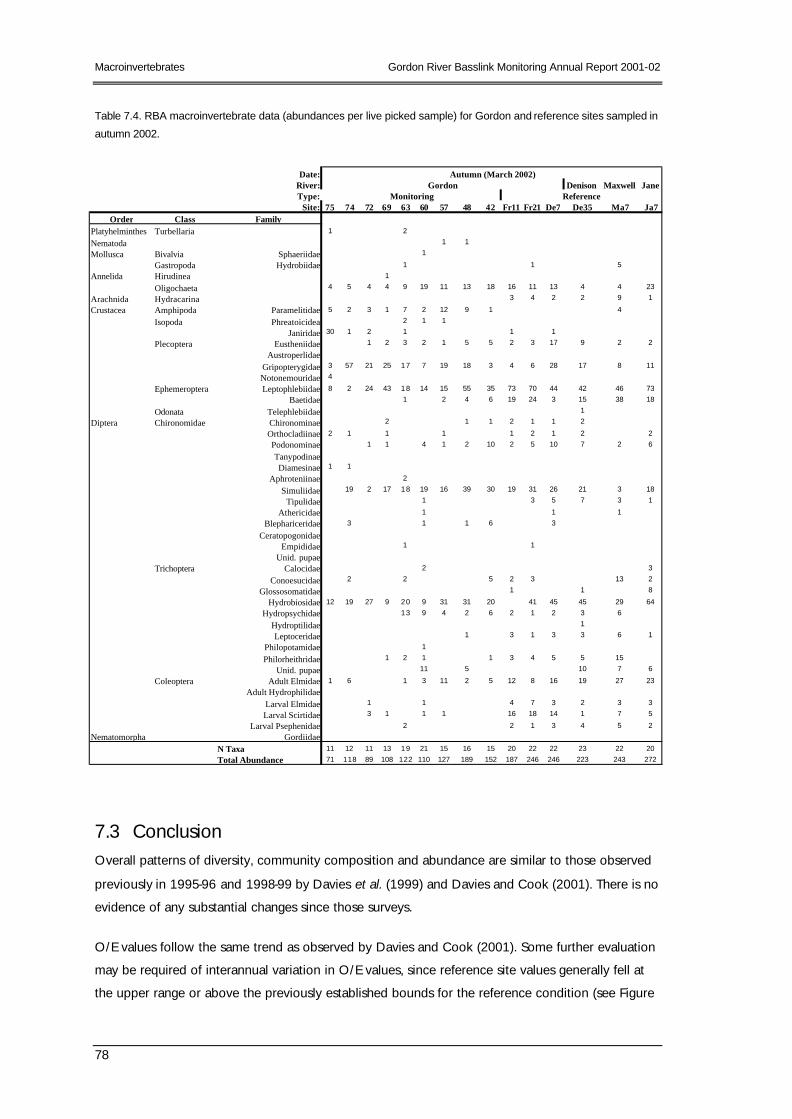
Macroinvertebrates Gordon River Basslink Monitoring Annual Report 2001-02
78
Table 7.4. RBA macroinvertebrate data (abundances per live picked sample) for Gordon and reference sites sampled in
autumn 2002.
7.3 Conclusion Overall patterns of diversity, community composition and abundance are similar to those observed
previously in 1995-96 and 1998-99 by Davies et al. (1999) and Davies and Cook (2001). There is no
evidence of any substantial changes since those surveys.
O/E values follow the same trend as observed by Davies and Cook (2001). Some further evaluation
may be required of interannual variation in O/E values, since reference site values generally fell at
the upper range or above the previously established bounds for the reference condition (see Figure
Date: Autumn (March 2002)River: Gordon Denison Maxwell JaneType: Monitoring Reference
Site: 75 74 72 69 63 60 57 48 42 Fr11 Fr21 De7 De35 Ma7 Ja7Order Class Family
Platyhelminthes Turbellaria 1 2
Nematoda 1 1
Mollusca Bivalvia Sphaeriidae 1
Gastropoda Hydrobiidae 1 1 5
Annelida Hirudinea 1
Oligochaeta 4 5 4 4 9 19 11 13 18 16 11 13 4 4 23
Arachnida Hydracarina 3 4 2 2 9 1
Crustacea Amphipoda Paramelitidae 5 2 3 1 7 2 12 9 1 4
Isopoda Phreatoicidea 2 1 1
Janiridae 30 1 2 1 1 1
Plecoptera Eustheniidae 1 2 3 2 1 5 5 2 3 17 9 2 2
AustroperlidaeGripopterygidae 3 57 21 25 17 7 19 18 3 4 6 28 17 8 11
Notonemouridae 4
Ephemeroptera Leptophlebiidae 8 2 24 43 18 14 15 55 35 73 70 44 42 46 73
Baetidae 1 2 4 6 19 24 3 15 38 18
Odonata Telephlebiidae 1
Diptera Chironomidae Chironominae 2 1 1 2 1 1 2
Orthocladiinae 2 1 1 1 1 2 1 2 2
Podonominae 1 1 4 1 2 10 2 5 10 7 2 6
TanypodinaeDiamesinae 1 1
Aphroteniinae 2
Simuliidae 19 2 17 18 19 16 39 30 19 31 26 21 3 18
Tipulidae 1 3 5 7 3 1
Athericidae 1 1 1
Blephariceridae 3 1 1 6 3
CeratopogonidaeEmpididae 1 1
Unid. pupaeTrichoptera Calocidae 2 3
Conoesucidae 2 2 5 2 3 13 2
Glossosomatidae 1 1 8
Hydrobiosidae 12 19 27 9 20 9 31 31 20 41 45 45 29 64
Hydropsychidae 13 9 4 2 6 2 1 2 3 6
Hydroptilidae 1
Leptoceridae 1 3 1 3 3 6 1
Philopotamidae 1
Philorheithridae 1 2 1 1 3 4 5 5 15
Unid. pupae 11 5 10 7 6
Coleoptera Adult Elmidae 1 6 1 3 11 2 5 12 8 16 19 27 23
Adult HydrophilidaeLarval Elmidae 1 1 4 7 3 2 3 3
Larval Scirtidae 3 1 1 1 16 18 14 1 7 5
Larval Psephenidae 2 2 1 3 4 5 2
Nematomorpha GordiidaeN Taxa 11 12 11 13 19 21 15 16 15 20 22 22 23 22 20
Total Abundance 71 118 89 108 122 110 127 189 152 187 246 246 223 243 272

Gordon River Basslink Monitoring Annual Report 2001-02 Macroinvertebrates
79
7.3). However, paired t-tests of O/Epa and O/Erk values for all sites did not suggest a significant
change between this survey and that conducted in 1998-99 (both with p > 0.05). This indicates that
no consistent significant change in O/E values had occurred across all sites between these dates.
Care should however be taken in future surveys to evaluate if there is a need to change band
bounds with variation in reference site O/E values between years.
The Gordon River Basslink Monitoring Program requires that the data from the quantitative
macroinvertebrate samples be analysed to assess changes in time in relation to reference sites by
conducting analysis of variance with time (year) and location (Gordon section vs reference rivers) as
factors, with abundance of each species and overall diversity as test statistics, and with a
time*location interaction term being used to assess the significance of any changes. The intent of
these requirements is to assess changes in macroinvertebrate communities associated with the
effect of changed flow regimes under Basslink. Such detailed analysis of these data will be
conducted at the end of the pre-Basslink phase of this program, when more data have been
acquired.
Table 7.5. O/E values derived from combined season 2001-2002 RBA macroinvertebrate data for Gordon and reference
sites. O/Epa, O/Erk = derived using presence/absence and rand abundance data, respectively.
Site River OEpa OErk
Monitoring75 Gordon 0.64 0.5174 Gordon 0.71 0.54
72 Gordon 0.72 0.7069 Gordon 0.86 0.7063 Gordon 0.93 0.95
60 Gordon 0.93 0.9558 Gordon 0.97 0.9548 Gordon 0.83 0.90
42 Gordon 0.89 0.92Reference
Fr11 Franklin 1.15 1.06
Fr21 Franklin 1.23 1.11De7 Denison 1.22 1.16
De35 Denison 1.22 1.16
Ma7 Maxwell 1.22 1.17Ja7 Jane 1.08 1.03

Macroinvertebrates Gordon River Basslink Monitoring Annual Report 2001-02
80
0.00
0.20
0.40
0.60
0.80
1.00
1.20
0 5 10 15 20 25 30 35 40 45
Distance from PS (km)
O/E
pa
Test sites Reference
A
B
C
0.00
0.20
0.40
0.60
0.80
1.00
1.20
0 5 10 15 20 25 30 35 40 45
Distance from PS (km)
O/E
rk
Test sites Reference
B
C
A
Figure 7.3. Trends in O/Epa and O/Erk values for macroinvertebrates in the Gordon River with distance downstream of
the Gordon Power Station. Mean values for the reference sites sampled at the same time are also shown, with error
bars (+/- 1 SD). Horizontal lines indicate bounds of impairment bands A, B and C (see Davies and Cook 2001).

Gordon River Basslink Monitoring Annual Report 2001-02 Algae
81
8 Algae
8.1 Introduction and Methods Benthic algae were surveyed in spring (October) 2001 and autumn (March) 2002. This monitoring
constitutes the first year of the pre-Basslink algal monitoring being conducted in the Gordon River
catchment.
Quantitative (quadrat-based) assessment of algal cover was conducted at nine ‘monitoring’ sites in
the Gordon River between the power station and the Franklin River junction.
8.1.1 Sample sites Survey sites were the same as for the Basslink monitoring macroinvertebrate sampling being
conducted in the Gordon River, as shown in Figure 8.1.
N
#Y#S#S#S#S
#S
#S
#S
#S
#S
Den
iso
n R
.
Max
wel
l R
.
Lake Gordon
GordonPowerStation
42
48
58
60
63
69
72
74 75
0 5 10 15 20 Kilometres
Figure 8.1. Map of the algal monitoring sites in the Gordon River for 2001-02.

Algae Gordon River Basslink Monitoring Annual Report 2001-02
82
8.1.2 Benthic algal survey All algal assessment was conducted by measuring percent area of cover at fixed distances along
existing transects across the Gordon River, with one transect assessed at each site.
As required under the monitoring program specifications, the distance from the transect datum
(‘head peg’) and percent cover was initially recorded at 0.5 m intervals across the relevant sections
for three transects. This was deemed too subjective (‘relevant sections’ being undefined).
Algal density was generally consistent, though patchy, within areas of similar substrate. Preliminary
analysis of these density data indicated that cover assessment at nine locations (using a 3 x 3
sample layout – see below) appeared adequate for describing mean algal cover within areas of
similar substrate, while also providing ‘point’ estimates for assessing trends through time. All
subsequent data collected in spring 2001 was therefore conducted as follows:
Ø Transects were re-established by running a measuring tape across the river from the
existing transect head-peg (which was designated as the zero distance offset);
Ø The transect, perpendicular to the direction of river flow, was then divided into broadly
similar ‘zones’, characterised by consistency of benthic substrate composition;
Ø Three sites were located at ¼, ½ and ¾ of the distance across each zone;
Ø Algal density, as % cover, was recorded using a 30 cm x 30 cm quadrat at three locations
– 1m upstream of the transect line, on the transect line, and 1 m downstream of the
transect line – this typically resulted in between 18 and 72 cover assessments per
transect;
Ø Within each quadrat, density was reported for four broad floristic groups – filamentous
algae, characeous algae, moss and macrophytes.
Zones were defined following visual inspection of the channel substrate, and defined in terms of
their dominant substrate composition, e.g.: cobble/gravel, sand/silt, sand/snags, bedrock etc.
Subsequent analysis revealed that the use of the 3 x 3 location sampling layout was not adequate.
There were significant departures from mean zone percent cover under this design compared with
more intense sampling; e.g. at 0.5 m and 2.5 m transect offset intervals, as shown in Figure 8.2.
A final sampling design was adopted in which algal cover was measured every 2.5 m across the
channel, independent of zones, but with the extent of substrate zones still being recorded.
Five scrapes of filamentous algae/moss were taken from the upper surface of boulder/cobbles in
the centre of each zone at each site on all sampling occasions. The five scrapes were pooled,
resulting in a single, composite and representative sample of the dominant benthic species present
within each zone. These samples were preserved in 10% formalin for later identification.

Gordon River Basslink Monitoring Annual Report 2001-02 Algae
83
y = 0.8649xR
2 = 0.6254
0.00
4.00
8.00
12.00
16.00
20.00
0.00 2.00 4.00 6.00 8.00 10.00 12.00 14.00
2.5 m spacing
3 x
3 sa
mpl
ing
layo
ut
Figure 8.2. Plot of estimate of % mean algal and moss cover derived from the 3 site x 3 location sampling design vs that
derived from sampling very 2.5 m across the channel, for all sites. Note the high scatter of points and relatively low r2.
8.1.3 Analysis
The 2001-02 algal monitoring provided only the first year’s data on benthic algae. Consequently, no
detailed analyses were conducted for this report, other than to summarise plant cover scores and
plot summary trends. Detailed analyses will be completed following the end of first three years of
monitoring, when sufficient data are available.
Peak algal and moss cover positions are also reported below.
8.2 Results Monitoring was successfully completed across the entire river channel for sites 75, 74, 72, 69, 63
and 60. The presence of deep, fast water prevented survey across the entire channel for sites 57, 48
and 42. An average 68m of river bed was surveyed across all sites, ranging from 43 to 91 m.
Data from the monitoring are summarised in Table 8.1. Aquatic flora have a consistently low to
moderate cover across all sites, with a grand mean of 10.5% cover by area over both seasons. Moss
and filamentous algae were the dominant forms, and had similar, low overall mean percent cover
across all sites (4-5% of benthic area). Mean moss cover was highly variable, ranging from 0.2 to
19%. Mean site percent moss and filamentous algal cover were positively correlated (p < 0.005,
Spearman’s rho = 0.673), as shown in Figure 8.3.
A trend of decreasing algae and moss cover with distance from the Gordon Power Station is
evident (see Table 8.1), with some increase in the reaches upstream of the Franklin River junction
(sites 48 and 42). Low values were observed in both seasons at site 72, which may be related to the
significant increase in sand substrate evident downstream of the Albert River.

Algae Gordon River Basslink Monitoring Annual Report 2001-02
84
Table 8.1. Summary cover data for algae, moss and macrophytes surveyed in spring 2001 and autumn 2002 for Gordon
River sites. * indicates transects for which only part of the channel could be surveyed. Total distances surveyed from the
transect head pegs are indicated.
Mean % cover WidthSite Date N Zones Moss Filamentous green Characeous Macrophytes surveyed75 Oct-01 4 18.70 13.00 6774 Oct-01 6 4.70 21.70 7.80 6172 Oct-01 7 0.21 1.03 4.68 0.40 7969 Oct-01 4 15.97 5.57 0.02 7563 Oct-01 8 0.83 4.15 6960 Oct-01 5 0.24 0.58 8657 Oct-01 3* 1.08 5348 Oct-01 3* 1.06 5442 Oct-01 2* 0.45 1.87 43
75 Mar-02 5 4.40 8.13 6874 Mar-02 5 16.55 12.30 4.25 6572 Mar-02 8 3.00 2.15 2.53 6.82 9369 Mar-02 7 1.02 1.13 7063 Mar-02 6 1.27 0.24 0.07 7060 Mar-02 6 0.41 2.44 8557 Mar-02 6 0.52 0.01 6548 Mar-02 4* 4.63 3.44 7042 Mar-02 4* 5.75 5.57 43
0.0
5.0
10.0
15.0
20.0
25.0
0.0 2.0 4.0 6.0 8.0 10.0 12.0 14.0 16.0 18.0 20.0
% cover, moss
% c
over
, fila
men
tous
Figure 8.3. Relationship between mean percent filamentous algal and moss cover in the Gordon River in spring 2001
and autumn 2002.

Gordon River Basslink Monitoring Annual Report 2001-02 Algae
85
Characeous algae were only observed at sites 74 and 72, with both Chara sp. and Nitella evident.
Macrophytes only occurred at sites 72 and 69. Both Callitriche sp. (starworts) and Isolepis fluitans
were observed at these sites. Densities were low, with the single exception of the silt-mud
backchannel at site 72, in which macrophyte cover was occasionally high (up to 90-95%).
Channel profiles for sites 75 and 63 are shown in Figure 8.4, with percent cover of moss and
filamentous algae (for autumn 2002) superimposed. They illustrate the variability across the channel
profile, as well as the relative differences between zones (eg bedrock and cobble substrates), and
the differences in overall cover between an upstream site, 75, and a downstream site, 63.
8.3 Conclusion Sampling was conducted successfully, though with some adjustment to sampling layout aimed at
reducing field time and data redundancy.
Overall aquatic algal and plant cover was low, and decreased downstream from the Gordon Power
Station to the Franklin River junction. The degree to which higher algal and moss cover is related to
the presence of the power station is unknown at this stage. Patterns of algal density may also be
dictated by the inflow of fine grained, scouring sediments from tributary streams (eg the Albert
River), and hence geomorphic differences in channel sediment dynamics.
Several years’ data are required in order to confirm the patterns observed during 2001-02.
Relationships between the influence of the Gordon Dam and Power Station, river geomorphology
and algal cover will then be assessed at the end of the pre-Basslink monitoring period.
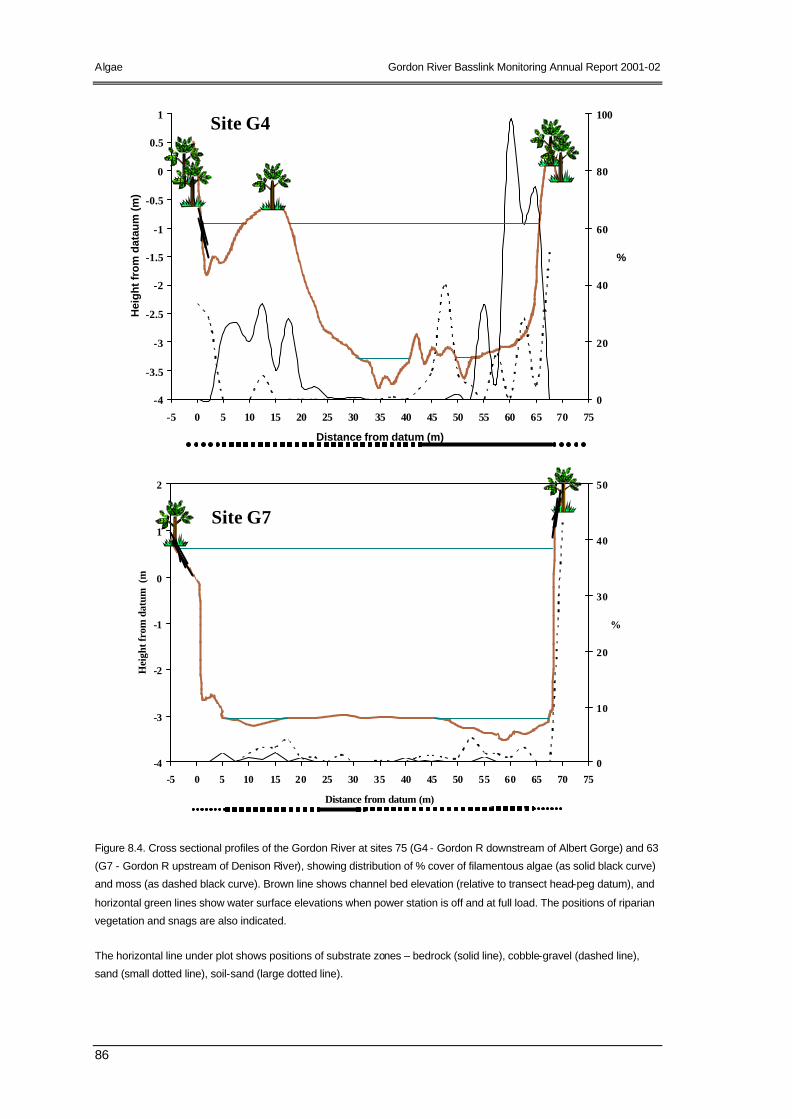
Algae Gordon River Basslink Monitoring Annual Report 2001-02
86
-4
-3.5
-3
-2.5
-2
-1.5
-1
-0.5
0
0.5
1
-5 0 5 10 15 20 25 30 35 40 45 50 55 60 65 70 75
Distance from datum (m)
Hei
gh
t fro
m d
atau
m (m
)
0
20
40
60
80
100
%
-4
-3
-2
-1
0
1
2
-5 0 5 10 15 20 25 30 35 40 45 50 55 60 65 70 75
Distance from datum (m)
Hei
ght f
rom
dat
um (
m)
0
10
20
30
40
50
%
Figure 8.4. Cross sectional profiles of the Gordon River at sites 75 (G4 - Gordon R downstream of Albert Gorge) and 63
(G7 - Gordon R upstream of Denison River), showing distribution of % cover of filamentous algae (as solid black curve)
and moss (as dashed black curve). Brown line shows channel bed elevation (relative to transect head-peg datum), and
horizontal green lines show water surface elevations when power station is off and at full load. The positions of riparian
vegetation and snags are also indicated.
The horizontal line under plot shows positions of substrate zones – bedrock (solid line), cobble-gravel (dashed line),
sand (small dotted line), soil-sand (large dotted line).
Site G4
Site G7

Gordon River Basslink Monitoring Annual Report 2001-02 Fish
87
9 Fish
9.1 Introduction The specific aims of the Gordon River Fish Monitoring Program are to:
Ø quantify pre and post-Basslink variability in the relative abundance of fish populations to
allow statistical comparison between these times and appropriate reference sites;
Ø assess changes in the longitudinal fish community structure of the Gordon River with the
aim of identifying any changes in the zone of influence;
Ø detect and assess changes in CPUE which may result from Basslink operations;
Ø determine the incidence of fish stranding both pre- and post-Basslink; and
Ø determine any changes to the fish populations of affected tributaries, in particular, if
recruitment success for juvenile galaxiids is improved under Basslink.
This report summarises the monitoring results of the two surveys undertaken during 2001-02.
9.2 Methods Monitoring was conducted in December 2001 and April 2002. Approximately thirty Gordon
catchment ‘test’ sites were monitored on each occasion; 3 river and 3 tributary sites in each of the 5
Gordon catchment zones, and these are listed in Table 9.1. Figure 9.1 shows the Gordon catchment
fish monitoring zones. A discussion on zone allocations is contained in Howland et al. (2001).
Additionally, seven river ‘reference’ sites and 4 tributary ‘reference’ sites were monitored in
conjunction with the Gordon catchment sites. These sites are shown in Table 9.2.
Nine optional sites, listed in Table 9.3, were included in the monitoring for 2001-02. These sites
were monitored if time and logistics permitted. However, core sites took priority in the sampling
regime. Optional sites consist of 6 ‘test’ and 3 ‘reference’ tributary and river sites and were included
to provide opportunistic supplementary data for the monitoring program.
A number of core sites were not monitored due to bad weather, high flows or equipment failure at
the time of sampling. In December 2001, these were:
Ø Denison u/s Maxwell;
Ø Denison @ Maxwell; and
Ø Pocacker River.
In April 2002, these were:
Ø Denison @ Maxwell;
Ø Mudback Creek; and
Ø Site 69 (G6).
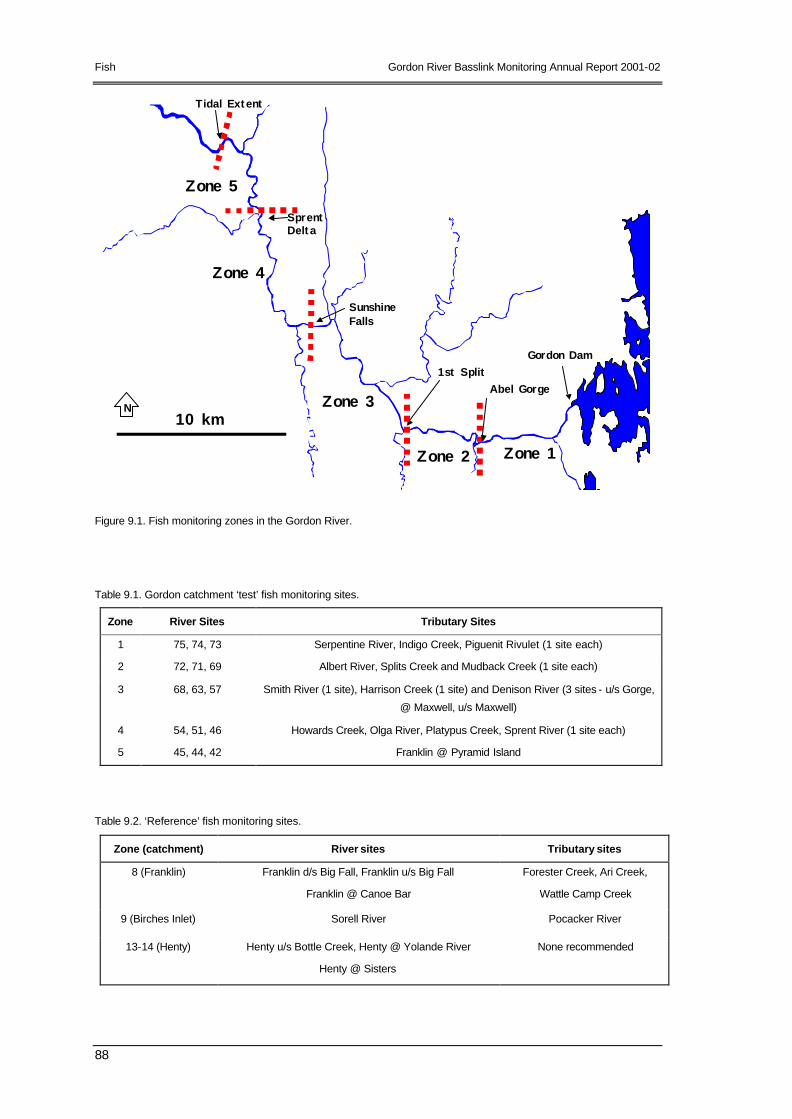
Fish Gordon River Basslink Monitoring Annual Report 2001-02
88
Zone 1Zone 2
Zone 3
Zone 4
Zone 5
1st SplitAbel Gorge
SunshineFalls
SprentDelta
Tidal Extent
10 kmN
Gordon Dam
Figure 9.1. Fish monitoring zones in the Gordon River.
Table 9.1. Gordon catchment ‘test’ fish monitoring sites.
Zone River Sites Tributary Sites
1 75, 74, 73 Serpentine River, Indigo Creek, Piguenit Rivulet (1 site each)
2 72, 71, 69 Albert River, Splits Creek and Mudback Creek (1 site each)
3 68, 63, 57 Smith River (1 site), Harrison Creek (1 site) and Denison River (3 sites - u/s Gorge,
@ Maxwell, u/s Maxwell)
4 54, 51, 46 Howards Creek, Olga River, Platypus Creek, Sprent River (1 site each)
5 45, 44, 42 Franklin @ Pyramid Island
Table 9.2. ‘Reference’ fish monitoring sites.
Zone (catchment) River sites Tributary sites
8 (Franklin) Franklin d/s Big Fall, Franklin u/s Big Fall
Franklin @ Canoe Bar
Forester Creek, Ari Creek,
Wattle Camp Creek
9 (Birches Inlet) Sorell River Pocacker River
13-14 (Henty) Henty u/s Bottle Creek, Henty @ Yolande River
Henty @ Sisters
None recommended

Gordon River Basslink Monitoring Annual Report 2001-02 Fish
89
Table 9.3. Optional sites surveyed during the 2001-02 fish monitoring program.
Zone River Sites Tributary Sites
1 76 (G2) Left bank Creek @ site 75
2 Gordon @ Grotto Creek none
3 Site 60 (G9), Gordon @ G8 Orange River
8 (Franklin) Franklin @ Forester Creek, Franklin @
Wattle Camp Creek
none
14 (Henty) Henty @ West Sister none
Fish surveys were undertaken by backpack electrofishing following the methods described in
Howland et al. (2001). Surveys were typically conducted by 1 to 3 teams, each consisting of two
people, with an electrofishing target of greater than 1200 seconds shocking time for each site visit.
In some cases this time target was not achievable as fishable habitat was limited by the flow
conditions at the time.
9.3 Results and Discussion A total of 1113 fish, comprising nine species, were captured during December 2001 and April
2002. The species consisted of:
Ø two exotic species (Salmo trutta and Perca fluviatilis);
Ø one species of eel (Anguilla australis);
Ø two species of lamprey (Mordacia mordax and Geotria australis);
Ø three galaxiid species (Galaxias brevipinnis, G. maculatus, G. truttaceus); and
Ø one bovichthyid species, the Sandy or freshwater flathead (Pseudaphritis urvillii).
Eight fish species were caught in the 1999 and 2000 surveys (Howland et al. 2001). Consequently,
it is highly significant that redfin perch (Perca fluviatilis) were caught during both the December
2001 and April 2002 monitoring.
As this is the initial year of the monitoring program, insufficient data precluded comprehensive
statistical analysis of catch data i.e. interannual, longitudinal and population structure analysis.
Although catch records for the majority of species are relatively small, length-frequency histograms
have been included to give a general indication of number and size ranges of key species caught.

Fish Gordon River Basslink Monitoring Annual Report 2001-02
90
9.3.1 Exotic Species
9.3.1.1 Brown trout Brown trout (Salmo trutta) have been captured previously at most sites and were dominant in the
upper zones of the middle Gordon River. This species can reproduce within the tributaries of the
Gordon River and therefore has an advantage over the native species, all of which are diadromous
in riverine environments. The native species have to negotiate several significant migration barriers
before reaching upstream habitats. Trout are known to prey directly on native species, and are likely
to compete significantly for food and other resources.
The numbers of brown trout captured varied. Catch rates for the Gordon River monitoring sites
were consistently higher in December 2001 than in April 2002 (paired T-test, p=0.0009). The catch
per unit effort (CPUE) values are shown in Table 9.4. This pattern was not displayed for the
adjoining tributaries of the Gordon (Table 9.4), with no clear relationship between month and
CPUE.
These patterns indicate that conditions in the Gordon River itself were more favourable for brown
trout in December 2001 than April 2002. As this relationship was not evident in the tributaries, it
suggests that the flow regime preceding the December monitoring was more conducive to either
the fish themselves or to their capture by backpack electrofishing than it was for the April survey.
Table 9.4. Catch Per Unit Effort (fish per 1200 seconds) for S. trutta in the Gordon River and tributaries.
Zone River Dec-01 River Apr-02 Tributary Dec-01 Tributary Apr-02
1 0.74 0.20 1.29 3.15 2 5.34 2.11 3.77 2.15
3 7.50 1.62 8.98 10.58 4 3.24 2.26 7.93 5.30 5 2.08 0.94 1.77 2.23
Trout were not captured from the Birches Inlet rivers during the current study, nor were they
captured during the 1999-2000 study (Howland et al. 2001). They were, however, present in the
Henty River in significant numbers during the monitoring survey, particularly during December
2001.
Figure 9.2 shows the length-frequency distribution for brown trout caught in Gordon River Zones 1 -
5 during the December 2001 and April 2002 monitoring. As indicated previously, CPUE and total
numbers captured were lower in the April 2002 survey than in the December 2001 survey. The size
range of fish captured in December was also marginally broader, and may reflect the recruitment of
a juvenile cohort into the sampled population.

Gordon River Basslink Monitoring Annual Report 2001-02 Fish
91
Figure 9.2. Length-frequency of Salmo trutta captured in the Gordon River from Zones 1 – 5 during the December 2001
(n = 83) and April 2002 monitoring (n = 28).
Figure 9.3 shows the length-frequency data pooled from December 2001 and April 2002. The data
were divided by position relative to the Splits (Zones 1- 2, upstream vs Zones 3-5, downstream) to
examine the assumption that brown trout population structure between zones is unlikely to be
affected by migratory barriers along the Gordon River.
Figure 9.3. Length-frequency of Salmo trutta captured in the Gordon River from upstream (Zones 1 – 2) and
downstream (Zones 3-5) of the Splits during the December 2001 (n = 43) and April 2002 monitoring (n = 68).
0
2
4
6
8
10
12
0 20 40 60 80 100
120
140
160
180
200
220
240
260
280
300
320
340
360
380
Fork length (mm)
Num
ber
of fi
sh
Dec-01
Apr-02
0
1
2
3
4
5
6
7
8
9
10
0 20 40 60 80 100
120
140
160
180
200
220
240
260
280
300
320
340
360
380
Fork length (mm)
Num
ber
of fi
sh
Upstream of Splits
Downstream of Splits

Fish Gordon River Basslink Monitoring Annual Report 2001-02
92
The size range of brown trout from the upper two zones appears to be displaced upwards
compared to that of Zones 3-5. This pattern probably reflects the dominance of trout and reduced
competition for resources in the upper reaches of the river. It may also reflect the vulnerability of
larger trout to capture by electrofishing in the isolated and dewatered backwater habitats of upper
Zone 2, rather than the effects of migratory barriers along the river. To date all brown trout caught
in the surveys have been river residents, with no sea run trout observed or captured.
9.3.1.2 Redfin perch The other exotic species collected during the 2001-02 monitoring, redfin perch (Perca fluviatilis),
had not previously been recorded from the Gordon River below the Gordon Dam. It was first
detected during the December 2001 monitoring, with one live specimen captured at Site 69 (G6),
just upstream of the Second Splits, and two partially buried, somewhat decomposed specimens
found on the riverbank near the Serpentine River junction. No other redfin were located at that time
despite significant survey effort.
The April 2002 monitoring recorded higher catches, effectively confirming the presence of redfin
perch in significant numbers. These fish were restricted to Zones 1 and 2 (Table 9.5), and ranged in
size from 127 to 193 mm. It is assumed that these fish originated from the Lake Gordon stock.
Table 9.5. Capture locations and numbers caught for redfin perch (Perca fluviatilis).
Site Dec-01 Apr-02
Zone 1
Gordon @ Serpentine *2 0
Site 76 (Gordon @ G2) N/S 0
Site 75 (Gordon @ G4) 0 0
Site 74 (Gordon @ G4a) 0 0
Site 73 Gordon @ G3, u/s) 0 0
Site 73 (Gordon @ G3, d/s) 0 2
Zone 2
Site 72 (Gordon @ G5, upper) 0 7
Site 72 (Gordon @ G5, lower) 0 2
Site 71 (Gordon @ G5a, pipe) 0 0
Site 71(Gordon @ G5a, water) 0 2
Gordon @ Grotto Creek N/S 0
Site 69 (Gordon @ G6) 1 N/S
Notes: *stranded on river bank; N/S not monitored.
The presence of this new exotic piscivorous species, should it become established, is likely to have
a detrimental impact on the fish communities of the Gordon River and, should they become more
widespread, in the tributaries and possibly elsewhere in the Macquarie Harbour catchment. Redfin
are currently absent from the reference sites monitored in this study.

Gordon River Basslink Monitoring Annual Report 2001-02 Fish
93
9.3.2 Eels and lampreys
9.3.2.1 Short headed lampreys The short-headed lamprey (Mordacia mordax) was not re corded from the Gordon River during the
December 2001 and April 2002 surveys. It was, however, found in very low numbers in the Franklin
River, one of its tributaries, and the Pocacker River (Birches Inlet). It is not known why this species is
found in such low numbers, although it is clear that it has a wide distribution as shown by previous
surveys (Howland et al. 2001).
9.3.2.2 Pouched lampreys Pouched lampreys (Geotria australis) were captured in Zone 5 in the December 2001 monitoring,
were recorded from Zones 3 to 5 of the Gordon River during the April 2002 monitoring, and were
found relatively abundantly within other waterways. Catch rates for G. australis showed clear
seasonal variation between samples, with a higher CPUE recorded in the Gordon River during April
2002, as shown in Table 9.6.
Interestingly, both lamprey species have been captured upstream of Sunshine Gorge and hence do
not appear to be permanently restricted from passage past this barrier. However, no lampreys were
captured in Zones 1 and 2 (upstream of the Splits) during the 2001-02 monitoring, supporting the
earlier observations of Howland et al. (2001). No analysis of flow regimes in relation to this has
been undertaken, but it is suspected that the high utilisation of the Gordon Power Station in recent
years may have precluded upstream passages of lampreys.
Table 9.6. CPUE (standardised to fish per 1200 seconds) for G. australis in the Gordon and Franklin Rivers.
Zone Dec-01 Apr-02
Zone 1 0 0
Zone 2 0 0
Zone 3 0 4.55
Zone 4 0 1.29
Zone 5 1.66 2.11
Franklin d/s Big Fall 0 2.74
Franklin u/s Big Fall 0 0
Figure 9.4 shows the length-frequencies of pouched lampreys captured during the December 2001
and April 2002 monitoring. Although relatively low numbers were caught, examination of histogram
and field observations indicates that captured individuals were found in both the ammocete stage
and macrothalmia stage of the species’ juvenile life cycle. They ranged in size between 30 and 115
mm. G. australis remain as ammocetes until they reach a body length of about 100 mm (Fulton,
1990) prior to passage into the macrothalmia stage. Adult migrant pouched lampreys are usually
around 600 mm long. It is interesting to note that the April 2002 monitoring captured the widest
size range of individuals and recorded a higher CPUE than the December 2001 sample, which may
reflect the development of an increasing proportion of juveniles into the macrothalmia stage.

Fish Gordon River Basslink Monitoring Annual Report 2001-02
94
Figure 9.4. Length-frequency of Geotria australis captured in the Gordon River from Zones 3 – 5 during the December
2001 monitoring (n = 8) and the April 2002 monitoring (n = 27).
9.3.2.3 Short-finned eels The short-finned eel (Anguilla australis) was found throughout the middle reaches of the Gordon
River, with highest abundances in the downstream zones. Table 9.7 shows that, in these lower
reaches, the CPUE for this species was not significantly different between the December 2001 and
April 2002 samples (paired T test, p=0.88). The relatively lower numbers captured in the upstream
zones prevented any meaningful comparison between monitoring trips. One stranded, live short-
finned eel was collected from a gravel bar in Zone 1.
Table 9.7. CPUE (fish per 1200 seconds) for A. australis caught in the Gordon and Franklin Rivers in 2001-02.
Zone Dec-01 Apr-02
Zone 1 2.22 0.20*
Zone 2 0.38 0.00
Zone 3 1.99 0.97
Zone 4 4.05 3.56
Zone 5 5.19 6.32
Franklin d/s Big Fall 0.38 4.52
Franklin u/s Big Fall 1.06 3.58
Note: *stranded on river bank.
A. australis was captured in the Birches Inlet reference sites and, to a lesser extent, Henty reference
sites. No consistent seasonal pattern was detected at these sites with the presently available data.
Figure 9.5 shows length-frequency distribution for data pooled from river Zones 1 to 5 from the
December 2001 and the April 2002 monitoring. The former sample has a greater size range and a
0
2
4
6
8
10
12
0 10 20 30 40 50 60 70 80 90 100 110 120 130 140 150
Length (mm)
Num
ber
of fi
sh
December 2001
April 2002

Gordon River Basslink Monitoring Annual Report 2001-02 Fish
95
marginally higher proportion of larger eels, however more data are needed to expand on the
reasons for this.
Figure 9.5. Length-frequency of Anguilla australis captured in the Gordon River from Zones 1 – 5 during the December
2001 survey (n = 56).
A. australis is diadromous and in-stream barriers may affect recruitment and upstream dispersal of
the species. Figure 9.6 shows the length-frequency distributions for A. australis combined for both
December 2001 and April 2002 and divided relative to the river’s main migration barrier, the Splits.
Figure 9.6. Length-frequency of Anguilla australis captured in the Gordon River from upstream (Zones 1 – 2: n = 13)
and downstream (Zones 3 – 5: n= 85) for the combined December 2001 and April 2002 monitoring).
0
2
4
6
8
10
12
14
80 120
160
200
240
280
320
360
400
440
480
520
560
600
640
680
720
760
800
840
880
920
960
Length (mm)
Num
ber
of fi
sh
Dec-01
Apr-02
0
2
4
6
8
10
12
14
16
18
20
80 120
160
200
240
280
320
360
400
440
480
520
560
600
640
680
720
760
800
840
880
920
960
Length (mm)
Num
ber
of fi
sh
Upstream of the Splits
Downstream of the Splits

Fish Gordon River Basslink Monitoring Annual Report 2001-02
96
Although the catch numbers are low for Zones 1 and 2, inspection of these histograms combined
with assessment of CPUE data show longitudinal differences in A. australis abundance and
population structure, with fewer, larger eels generally inhabiting the upper zones.
9.3.3 Galaxiids and Sandys Table 9.8 provides a summary of CPUE for galaxiids and sandys captured in the individual Gordon
River zones during the December 2001 and April 2002 monitoring. Catch data indicated that the
spatial distribution of the three galaxiid species (G. truttaceus, G. brevipinnis, and G. maculatus) and
sandys (P. urvillii) were similar to those observed by Howland et al. (2001).
All galaxiid species were absent from the Gordon River in Zones 1-3, while G. truttaceus were
present in Zones 4 and 5. G. brevipinnis, G. maculatus and P. urvillii were caught only in the lowest
Gordon River survey reach, Zone 5.
G. truttaceus and, to a lesser degree, G. brevipinnis were present in low numbers in several Zone 3
and Zone 4 tributary streams, while G. brevipinnis was the only galaxiid present in the Zone 1
tributaries. Table 9.9 shows the CPUE values recorded during December 2001 and April 2002 for
the Gordon tributaries.
All four species were captured in the Franklin River, although the small amount of data prevent any
further examination of distributional patterns. Table 9.10 lists the sites and CPUE values for the
Franklin River sites.
Only G. truttaceus and G. brevipinnis were recorded in the Franklin tributary sites, as shown in
Table 9.11.
Table 9.8. CPUE for galaxiids (G. brevipinnis, G. maculatus, G. truttaceus) and sandys (P. urvillii) captured in the
Gordon River during December 2001 and April 2002.
Zone Species Dec-01 Apr-02
Zones 1 - 3 All (galaxiids and sandys) 0 0
Zone 4 G. brevipinnis 0 0 G. maculatus 0 0 G. truttaceus 0.81 0.64 P. urvillii 0 0
Zone 5 G. brevipinnis 0 0.47 G. maculatus 0.42 2.34 G. truttaceus 4.98 3.98 P. urvillii 2.91 2.34

Gordon River Basslink Monitoring Annual Report 2001-02 Fish
97
Table 9.9. CPUE for galaxiids (G. brevipinnis, G. maculatus, G. truttaceus) and sandys (P. urvillii) captured in the
Gordon River tributaries during December 2001 and April 2002.
Zone Species Dec-01 Apr-02
Zone 1 G. brevipinnis 8.07 1.75
Zone 2 All (galaxiids and sandys) 0 0
Zone 3 G. truttaceus 0 0.12 P. urvillii 0.18 0
Zone 4 G. brevipinnis 0.28 0 G. maculatus 0 0 G. truttaceus 4.53 1.56 P. urvillii 0.28 0.31
Zone 5 G. brevipinnis 0 0 G. maculatus 0 3.35
G. truttaceus 2.95 2.23 P. urvillii 1.18 3.35
Table 9.10. CPUE for galaxiids (G. brevipinnis, G. maculatus, G. truttaceus) and sandys (P. urvillii) captured in the
Franklin River during December 2001 and April 2002.
Zone Species Dec-01 Apr-02
Zone 7 (Franklin d/s Big Fall) G. brevipinnis 9.73 0 G. maculatus 0 0 G. truttaceus 0 2.74
P. urvillii 3.24 2.74
Zone 8 (Franklin u/s Big Fall) G. brevipinnis 1.33 0 G. maculatus 0 0 G. truttaceus 0.53 0.45 P. urvillii 0.27 0.45
Table 9.11. CPUE for galaxiids (G. brevipinnis, G. maculatus , G. truttaceus) and sandys (P. urvillii) captured in the
Franklin River tributaries during December 2001 and April 2002.
Zone Species Dec-01 Apr-02
Zone 8 (Franklin u/s Big Fall) G. brevipinnis 1.61 1.28 G. maculatus 0 0 G. truttaceus 4.02 2.87
9.3.3.1 Climbing galaxias Howland et al. (2001) reported climbing galaxias (G. brevipinnis) in Zone 1. Remnant populations
of mature G. brevipinnis were again found in the Zone 1 tributaries, including Indigo Creek, during
both surveys, and in the Serpentine River and Left Bank Creek at site 75 in the December 2001
monitoring. Catch rates were substantially lower in the April monitoring, however the reasons for
this are not clear. Figure 9.7 shows the length-frequency distribution for G. brevipinnis captured in
Zone 1 tributaries during December 2001.

Fish Gordon River Basslink Monitoring Annual Report 2001-02
98
0
1
2
3
4
5
6
0 15 30 45 60 75 90 105 120 135 150 165 180 195 210Fork length (mm)
Num
ber
Figure 9.7. Length-frequency of Galaxias brevipinnis caught in Zone 1 tributary streams during December 2001 (n = 25).
The data for April 2002 have not been included as only five G. brevipinnis were caught. However,
the size range was similar to the December 2001 data, indicating that no detectable recruitment
had occurred between the December 2001 and April 2002 surveys.
An influx of small G. brevipinnis (45-53 mm) was recorded in the Franklin River (Zones 7 and 8)
during the December 2001 monitoring, presumably as a result of recruitment from white bait
stocks. However the lower Gordon regions (Zones 4 and 5) did not reflect this pattern. Data from
the Gordon and Franklin Rivers and their tributaries suggest that catch rates were generally higher in
December 2001 compared to April 2002, although there were insufficient data to test this
relationship statistically. Small numbers of G. brevipinnis were reported from the Birches Inlet and
Henty River sites during 1999 – 2000 (Howland et al., 2001) and again during this year’s
monitoring.
9.3.3.2 Spotted galaxias Figure 9.8 shows the length-frequency-distribution of spotted galaxias (Galaxias truttaceus) in the
Gordon River Zones 4-5 for the December 2001 and April 2002 monitoring. Zones 1-3 were not
included in the analysis as G. truttaceus were not captured in these areas.
Similar numbers of fish were caught during each survey. However, there appears to be a higher
proportion of smaller fish in the April 2002 sample. This, combined with a bimodal length-frequency
distribution, may represent galaxiids that successfully recruited from whitebait runs in 2001. In
contrast, it is notable that catch data provided no evidence that recruitment had recently occurred
to Zone 3 and Zone 4 tributary populations of G. truttaceus or G. brevipinnis.
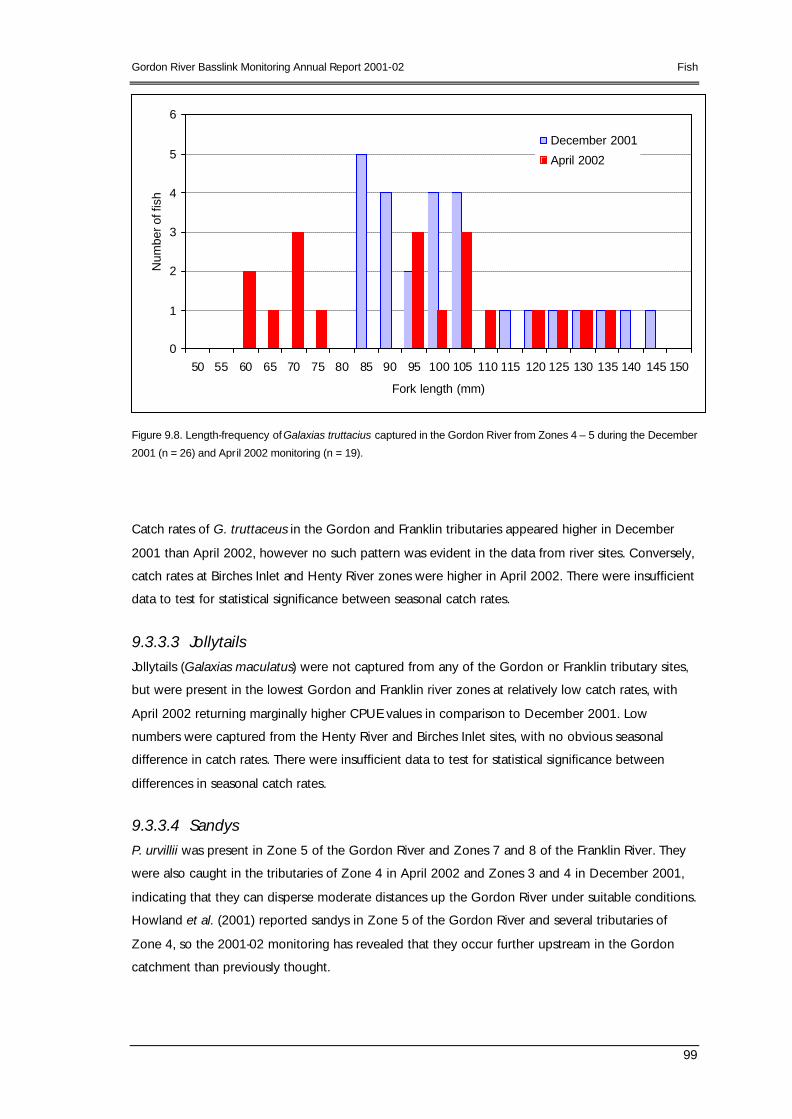
Gordon River Basslink Monitoring Annual Report 2001-02 Fish
99
Figure 9.8. Length-frequency of Galaxias truttacius captured in the Gordon River from Zones 4 – 5 during the December
2001 (n = 26) and April 2002 monitoring (n = 19).
Catch rates of G. truttaceus in the Gordon and Franklin tributaries appeared higher in December
2001 than April 2002, however no such pattern was evident in the data from river sites. Conversely,
catch rates at Birches Inlet and Henty River zones were higher in April 2002. There were insufficient
data to test for statistical significance between seasonal catch rates.
9.3.3.3 Jollytails Jollytails (Galaxias maculatus) were not captured from any of the Gordon or Franklin tributary sites,
but were present in the lowest Gordon and Franklin river zones at relatively low catch rates, with
April 2002 returning marginally higher CPUE values in comparison to December 2001. Low
numbers were captured from the Henty River and Birches Inlet sites, with no obvious seasonal
difference in catch rates. There were insufficient data to test for statistical significance between
differences in seasonal catch rates.
9.3.3.4 Sandys P. urvillii was present in Zone 5 of the Gordon River and Zones 7 and 8 of the Franklin River. They
were also caught in the tributaries of Zone 4 in April 2002 and Zones 3 and 4 in December 2001,
indicating that they can disperse moderate distances up the Gordon River under suitable conditions.
Howland et al. (2001) reported sandys in Zone 5 of the Gordon River and several tributaries of
Zone 4, so the 2001-02 monitoring has revealed that they occur further upstream in the Gordon
catchment than previously thought.
0
1
2
3
4
5
6
50 55 60 65 70 75 80 85 90 95 100 105 110 115 120 125 130 135 140 145 150
Fork length (mm)
Num
ber o
f fis
hDecember 2001
April 2002

Fish Gordon River Basslink Monitoring Annual Report 2001-02
100
Catch rates were high at the Birches Inlet sites during both monitoring trips, particularly during April
2002. These catches were the highest recorded for any species regardless of season. Low catch
rates were recorded from the Henty River sites, with little seasonal difference evident.
9.3.4 Isolation and Competitive Interactions As discussed in Howland et al. (2001), trout appear to be out-competing and displacing native
species within the Gordon, particularly the upper zones of the river downstream of the Gordon
Dam. This competitive interaction is not restricted to the main river, and is evident in some of the
tributary streams.
The aging populations of G. brevipinnis in Indigo Creek and the Serpentine River are examples of
populations that appear to have benefited from isolation from brown trout. However, they also
appear to have suffered poor recruitment as a result of this isolation.
Further evidence of competitive interaction between trout and native species is also evident at
other monitoring sites. Howland et al. (2001) described reaches of the Franklin and Henty Rivers
where native species were not found in the same section of river as trout or, when they did occur
together in a reach, the abundance of native species appeared to be reduced. Consequently,
analysis of the catch data for longitudinal trends in native fish populations must take into account
the potential for confounding interactions between galaxiids and trout. These may mask longitudinal
changes occurring with the implementation of changed power station operating regimes under
Basslink.
9.3.5 Fish stranding Three stranded fish were collected during the 2001-02 monitoring; two partially decomposed redfin
perch and one live short-finned eel. All stranded fish were collected from Zone 1. Given their partial
state of decomposition and burial, the redfin probably died prior to their deposition. The results of
the study to date indicate that fish stranding following power station shut down is uncommon.
9.4 Conclusion The 2001-02 monitoring confirmed that brown trout are dominant in the middle Gordon River,
particularly the upper reaches, and may show seasonal changes in catch rates related to the
hydrology of the river.
Redfin perch were captured downstream of the Gordon Power Station for the first time during
2001-02. The impacts of the occurrence of an additional exotic species to the Gordon River depend
upon its dispersal potential and ability to develop self-sustaining populations.
Numbers of the short-headed lamprey were markedly lower in the 2001-02 monitoring compared
with the Basslink surveys conducted in 1999 and 2000. It is not clear why this is so. Pouched

Gordon River Basslink Monitoring Annual Report 2001-02 Fish
101
lamprey catches showed seasonal variation, with higher catches recorded in April 2002 survey,
which may reflect a higher proportion of macrothalmia in catches.
The catch rate for short-finned eels did not appear to vary in between the December 2001 and April
2002 surveys. This species is able to access the length of the river up to Zone 1, although catch
rates in the upper zones were lower relative to the downstream zones.
Three species of galaxiid were captured during the study. Notable results of the monitoring were
that remnant populations of G. brevipinnis exist in several tributaries of Zone 1. G. truttaceus were
restricted to the lower reaches of the study area, and were found in both river and tributary areas of
the Gordon River. Some sites showed evidence of recent recruitment.
The monitoring confirmed that G. maculatus was confined to the lower reaches of the Gordon and
Franklin Rivers, and was not found in their tributaries.
Sandy populations in the Gordon River appeared restricted to Zone 5, however a specimen was
captured from a Zone 3 tributary indicating that they can successfully negotiate the Gordon River
past Ewarts Gorge.
The results of the monitoring to date indicate that fish stranding following power station shut down
is uncommon.

References Gordon River Basslink Monitoring Annual Report 2001-02
102
10 References
ANZECC. 1992. Australian Water Quality Guidelines for Fresh and Marine Waters. Australian and
New Zealand Environment and Conservation Council. November 1992
ANZECC. 2001. Australian and New Zealand Guidelines for Fresh and Marine Water Quality.
Volume 1: The Guidelines’. Australian and New Zealand Environment and Conservation
Council.
APHA. 1992. Standard Methods for the Analysis of Water and Wastewater. American Public Health
Association, American Water Works Association and Water Environment Federation. 18th
Edition.
Basslink Joint Advisory Panel. 2002a. Draft Panel Report: Basslink – proposed interconnector linking
the Tasmanian and Victorian electricity grids (Volume 1).
Basslink Joint Advisory Panel. 2002b. Appendix 15: Draft Deed of Amendment to Hydro Tasmania’s
Special Water Licence. Draft Panel Report: Basslink – proposed interconnector linking the
Tasmanian and Victorian electricity grids (Volume 2: Appendices).
Bobbi, C. 2000. Dissolved oxygen in the King River downstream from John Butters power station.
Environmental Services Technical Report, Hydro Tasmania.
Bonham, C.D. 1989, Measurements for Terrestrial Vegetation. John Wiley and Sons, New York.
Davies, P.E. and Cook, L.S.J. 2001. Gordon River Macroinvertebrates and Aquatic Mammals
Assessment. Basslink Integrated Impact Assessment Statement - Potential Effects of
Changes to Hydro Power Generation. Appendix 7: Hydro Tasmania, Hobart.
Davies, P.E., Cook, L.S.J. and McKenny, C.E.A. 1999. The influence of changes in flow regime on
aquatic biota and habitat downstream of hydro-electric dams and power stations in
Tasmania. Hydro Technical Report Project No. 95/034. Hobart Tasmania 128 pp.
Davidson, N. and Gibbons, A. 2001. Gordon River Riparian Vegetation Assessment. Basslink
Integrated Impact Assessment Statement - Potential Effects of Changes to Hydro Power
Generation. Appendix 6: Hydro Tasmania, Hobart.
French, G. 1994. Tasmanian trout waters . G. French, Hobart. 336 pp.
Fulton, W. 1990. Tasmanian freshwater fishes. Fauna of Tasmania Handbook no. 7. University of
Tasmania, Hobart. 80 pp.

Gordon River Basslink Monitoring Annual Report 2001-02 References
103
Howland, M.B., Davies, P.E., Blühdorn, D.R. & Andrews, D. 2001. Gordon River Fish Assessment.
Appendix 8: Basslink Integrated Impact Assessment Statement - Potential Effects of
Changes to Hydro Power Generation, Hydro Tasmania, Hobart.
Kent, M. and Coker, P. 1994 Vegetation Description and Analysis – a practical approach . John
Wiley and Sons, Chichester.
Kershaw, K.A. 1974 Quantitative and Dynamic Plant Ecology. 2nd edn. Edward Arnold Publishers,
London.
Koehnken, L. 1992. Pieman River Environmental Monitoring Program. Technical Report August
1992. Department of Environment & Planning, Tasmania.
Koehnken, L. 2001. Gordon River Water Quality Assessment. Appendix 3: Basslink Integrated
Impact Assessment Statement - Potential Effects of Changes to Hydro Power Generation.
Hydro Tasmania, Hobart.
Koehnken, L., Locher, H. and Rutherfurd, I. 2001. Gordon River Fluvial Geomorphology Assessment
Basslink Integrated Impact Assessment Statement - Potential Effects of Changes to Hydro
Power Generation. Appendix 4. Hydro Tasmania, Hobart.
Locher, H. 2001. Summary Report: Basslink Integrated Impact Assessment Statement: Potential
Effects of Changes to Hydro Power Generation. Hydro Tasmania, Hobart.
Magill, A.W. 1989. Monitoring Environmental Change with Color Slides. Gen. Tech. Rep. PSW-117.
Berkeley CA: Pacific Southwest Forest and Range Experiment Station, Forest Service,
USDA. 55p.
Read, J. 2001. Rainforest Ecology in: Vegetation of Tasmania, eds J.B. Reid, R.S. Hill, M.J. Brown &
M.J. Hovenden, Monotone Art Printers, Tasmania, pp. 160-198.