google data centers · google data centers: economic impact and community benefit | 3 oxford...
TRANSCRIPT
GOOGLE DATA CENTERS
APRIL 2018
Economic Impact and Community Benefit
2 | GOOGLE DATA CENTERS: ECONOMIC IMPACT AND COMMUNITY BENEFIT
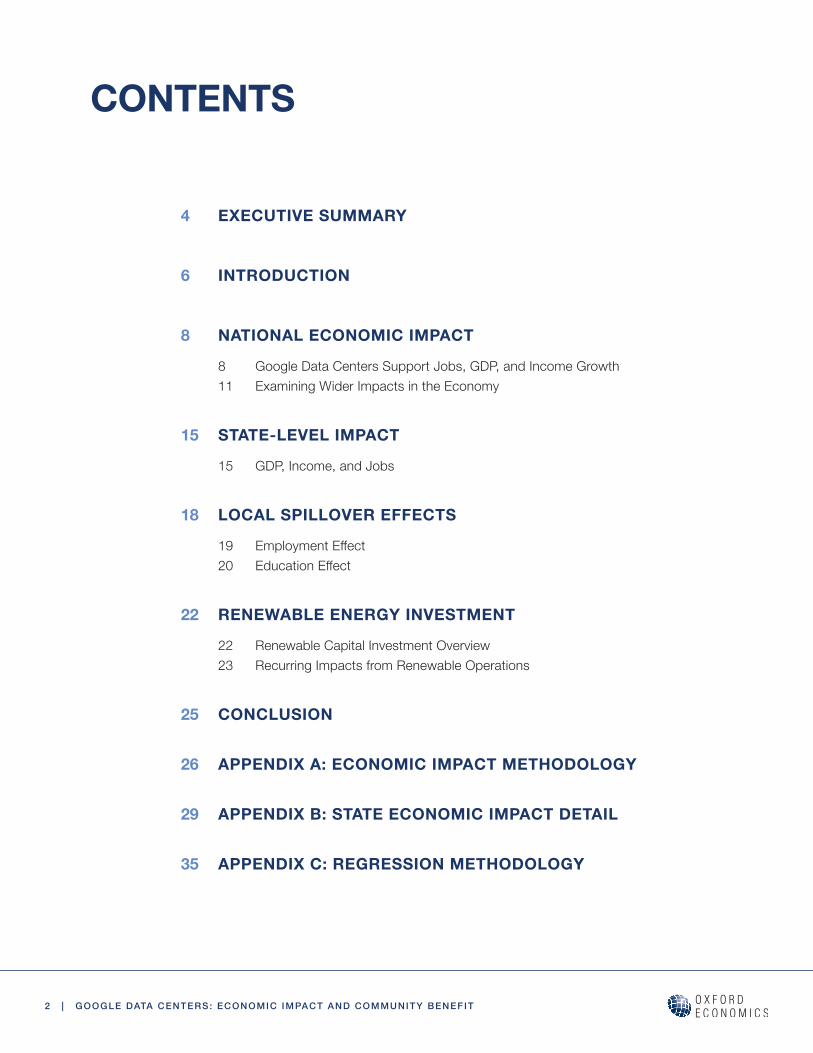
CONTENTS
4 EXECUTIVE SUMMARY
6 INTRODUCTION
8 NATIONAL ECONOMIC IMPACT
8 Google Data Centers Support Jobs, GDP, and Income Growth11 Examining Wider Impacts in the Economy
15 STATE-LEVEL IMPACT
15 GDP, Income, and Jobs
18 LOCAL SPILLOVER EFFECTS
19 EmploymentEffect20 EducationEffect
22 RENEWABLE ENERGY INVESTMENT
22 Renewable Capital Investment Overview23 Recurring Impacts from Renewable Operations
25 CONCLUSION
26 APPENDIX A: ECONOMIC IMPACT METHODOLOGY
29 APPENDIX B: STATE ECONOMIC IMPACT DETAIL
35 APPENDIX C: REGRESSION METHODOLOGY
GOOGLE DATA CENTERS: ECONOMIC IMPACT AND COMMUNITY BENEFIT | 3
OXFORD ECONOMICS
Oxford Economics was founded in 1981 as a commercial venture with Oxford University’s business college to provide economic forecasting and modeling to UK companies and financial institutions expanding abroad. Since then, we have become one of the world’s foremost independent global advisory firms, providing reports, forecasts, and analytical tools on 200 countries, 100 industrial sectors, and more than 3,000 cities. Our best-of-class global economic and industry models and analytical tools give us an unparalleled ability to forecast external market trends and assess their economic, social, and business impact.
Headquartered in Oxford, England, with regional centers in London, New York, and Singapore, Oxford Economics has offices across the globe in Belfast, Chicago, Dubai, Miami, Milan, Paris, Philadelphia, San Francisco, and Washington, DC. We employ more than 300 full-time people, including more than 200 professional economists, industry experts, and business editors—one of the largest teams of macroeconomists and thought-leadership specialists. Our global team is highly skilled in a full range of research techniques and thought-leadership capabilities, from econometric modeling, scenario framing, and economic impact analysis to market surveys, case studies, expert panels, and Web analytics. Underpinning our in-house expertise is a contributor network of more than 500 economists, analysts and journalists around the world.
Oxford Economics is a key adviser to corporate, financial, and government decision makers and thought leaders. Our worldwide client base now comprises over 1,000 international organizations, including leading multinational companies and financial institutions; key government bodies and trade associations; and top universities, consultancies, and think tanks.
April 2018
All data shown in tables and charts are Oxford Economics’s own data, except where otherwise stated and cited in footnotes, and are copyright © Oxford Economics Ltd.
This report is confidential to Google LLC and may not be published or distributed without its prior written permission.
The modeling and results presented here are based on information provided by third parties, upon which Oxford Economics has relied in producing its report and forecasts in good faith. Any subsequent revision or update of those data will affect the assessments and projections shown.
To discuss the report further please contact:
Dan Levine Practice Leader, Location Strategies Oxford Economics 5 Hanover Square, 8th Floor New York, NY, 10004 Tel: 646-503-3067 Email: [email protected]
4 | GOOGLE DATA CENTERS: ECONOMIC IMPACT AND COMMUNITY BENEFIT
EXECUTIVE SUMMARY
As of the date of this report, six data center campuses provide the technological
infrastructure necessary to power Google’s operations in the United States. The data
centers allow Google to provide search engine, cloud computing, and other Web-based
services on which so much economic activity now depends. In addition to enabling Google
to offer these services to people and businesses throughout the United States, the data
centers also contribute significantly to job growth and income gains at both the national and
state levels. Even more important are the economic contributions that Google data centers
make to the communities in which they are located.
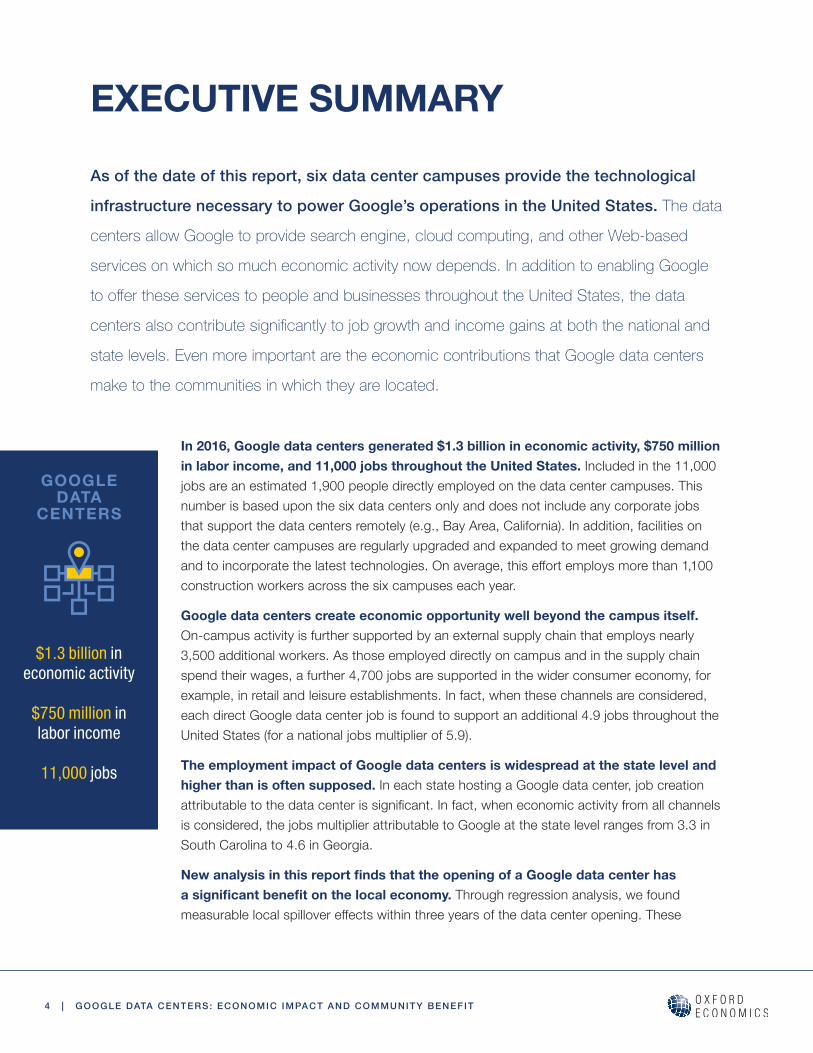
In 2016, Google data centers generated $1.3 billion in economic activity, $750 million in labor income, and 11,000 jobs throughout the United States. Included in the 11,000 jobs are an estimated 1,900 people directly employed on the data center campuses. This number is based upon the six data centers only and does not include any corporate jobs that support the data centers remotely (e.g., Bay Area, California). In addition, facilities on the data center campuses are regularly upgraded and expanded to meet growing demand andtoincorporatethelatesttechnologies.Onaverage,thiseffortemploysmorethan1,100construction workers across the six campuses each year.
Google data centers create economic opportunity well beyond the campus itself. On-campus activity is further supported by an external supply chain that employs nearly 3,500 additional workers. As those employed directly on campus and in the supply chain spend their wages, a further 4,700 jobs are supported in the wider consumer economy, for example, in retail and leisure establishments. In fact, when these channels are considered, each direct Google data center job is found to support an additional 4.9 jobs throughout the United States (for a national jobs multiplier of 5.9).
The employment impact of Google data centers is widespread at the state level and higher than is often supposed. In each state hosting a Google data center, job creation attributabletothedatacenterissignificant.Infact,wheneconomicactivityfromallchannelsis considered, the jobs multiplier attributable to Google at the state level ranges from 3.3 in South Carolina to 4.6 in Georgia.
New analysis in this report finds that the opening of a Google data center has a significant benefit on the local economy. Through regression analysis, we found measurablelocalspillovereffectswithinthreeyearsofthedatacenteropening.These
GOOGLE DATA
CENTERS
$1.3 billion in economic activity
$750 million in labor income
11,000 jobs
GOOGLE DATA CENTERS: ECONOMIC IMPACT AND COMMUNITY BENEFIT | 5
benefitsincludeemploymentgainsthatwentfurtherthanthosedirectlyconnectedtothedata center campus as well as an increase in county residents holding a bachelor’s degree. These results seem to suggest that the opening of a Google data center signals to out-of-county businesses and residents that new opportunities exist in that county (now that a Google data center has opened there).
Google’s long-term commitment to take power from renewable energy sources has economic as well as environmental benefit. For example, Google’s long-term contract commitments to renewable energy have resulted in $2.1 billion of investment in eight renewable energy generation projects (wind and solar), to date. The construction phase of these projects required an estimated 2,800 direct jobs. The maintenance and operation of these eight renewable facilities now supports an estimated 520 ongoing jobs (when all channels are considered).
Beyond these measurable effects, the addition of a Google data center also ripples through local economies in other, less easily quantifiable ways. These are no less substantive in their positive impact on the lives of ordinary citizens living in data center communities. For example, Google partners with communities on workforce development and education initiatives that both prepare the current workforce for positions in the new economy and increase engagement with young women and minority students interested in science and math. Our report includes a series of case studies that explore these softer impacts on the counties and surrounding regions where Google data centers are located.
Google’s commitment
to clean energy has spurred
$2.1 billion in new investment
in renewable energy projects.
6 | GOOGLE DATA CENTERS: ECONOMIC IMPACT AND COMMUNITY BENEFIT
INTRODUCTION
Since 2006, Google has opened six U.S. data center campuses. Each is a state-of-the-art,
world-class facility that enables the company to provide the search engine, cloud computing,
and other Web-based services on which so much of the modern economy depends.
To date, the company has invested $10.5 billion in these facilities.
In this report, we examine the economic impact that has resulted from Google’s investment andoperationofitsdatacentercampuses.Ourfindingsarediscussedatthenational,state,and local levels and are organized as follows:
• National Economic Impact: Examines Google’s economic impact at the national level. Wefind,forexample,thatGoogledatacenterssupportnearly11,000jobsthroughoutthe U.S. economy.
• State-Level Impact: Explores Google’s economic impact in the six states where thedatacentercampusesarelocated.Ourfindingsdemonstratethatthestatejobsmultipliers associated with Google data centers are higher than commonly supposed.
• Local Spillover Effects: Discussesthelocalcommunityspillovereffectsthatresultinlocations with a Google data center campus, including overall employment gains and an increase in the county-level college-educated workforce.
• Renewable Energy Investment: Examines the economic impact that has resulted from Google’s long-term commitment to take power from renewable energy sources.
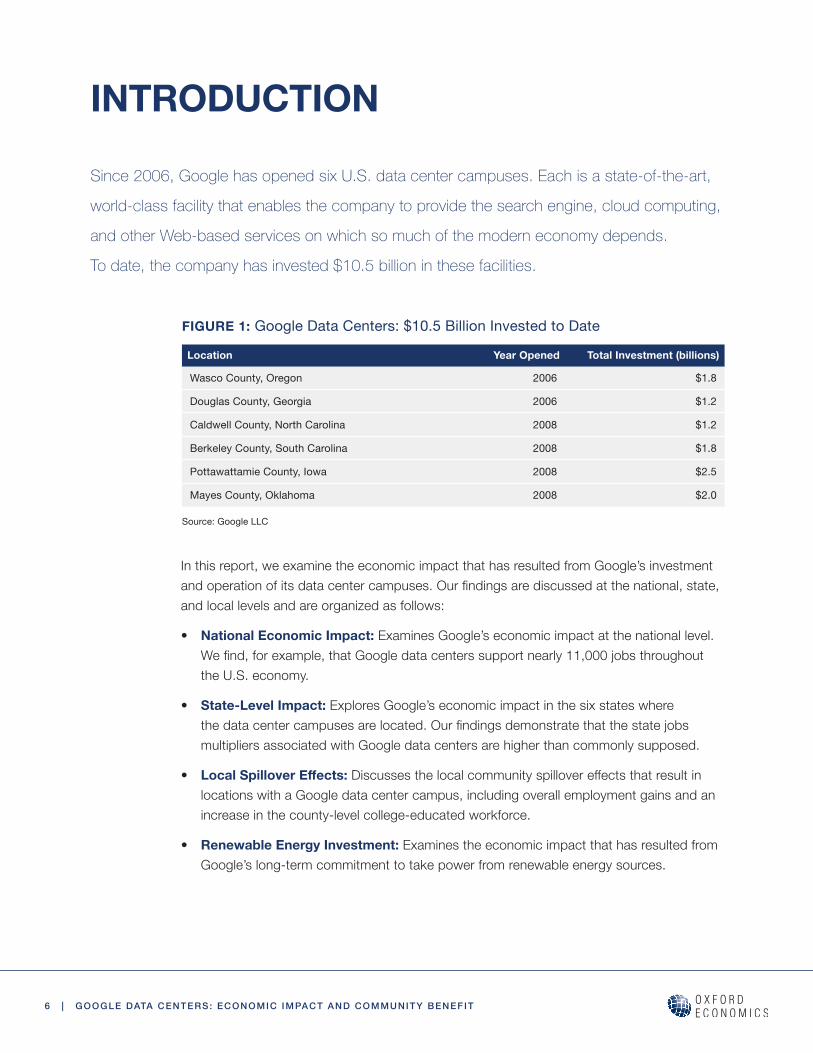
FIGURE 1: Google Data Centers: $10.5 Billion Invested to Date
Location Year Opened Total Investment (billions)
Wasco County, Oregon 2006 $1.8
Douglas County, Georgia 2006 $1.2
Caldwell County, North Carolina 2008 $1.2
Berkeley County, South Carolina 2008 $1.8
Pottawattamie County, Iowa 2008 $2.5
Mayes County, Oklahoma 2008 $2.0
Source: Google LLC
GOOGLE DATA CENTERS: ECONOMIC IMPACT AND COMMUNITY BENEFIT | 7
METHODOLOGICAL INTRODUCTION: ECONOMIC IMPACT ANALYSIS
National, state, and renewable energy economic impact results were calculated using an input-output model. In making our calculations, we examined three categories of activity associated with each data center and then aggregated these categories to produce our total impact results. The three categories examined were operations, construction, and renewable.
Operations: This is the direct activity that occurs within the four walls of each data center, particularly wages, earnings, and activity of the data center employees. However, our calculations exclude all the production activity associated with manufacturing the information technology equipment utilized within each data center. The value of these equipment purchases is measured in the hundreds of millions of dollars at each data center, and so this decision to exclude the impacts associated with the manufacture of this equipment keeps our calculations conservative.
Construction: Each data center undergoes periodic expansion and renovation as Google updates its infrastructure to meet customer demand and integrate the latest technological advances. The construction figures presented reflect the average annual amount of (actual) construction activity that each data center has experienced since it opened. The impacts presented, therefore, are estimates based on the average amount of annual construction activity that occurs at each data center based on past experience. However, the actual construction pattern historically (and likely in the future), is for periodic bursts of very large-scale construction when major renovation or expansion is required. Therefore during peaks of actual construction, our estimates are low for that year, but in years with no construction, our estimates are high. On average, however, they are accurate estimates of the average
amount of construction activity expected to occur each year.
Renewable: Google’s long-term commitment to buying renewable power has resulted in the construction of seven wind projects and one solar project, each of which requires a limited number of personnel to operate and maintain. This section captures the economic impact of the ongoing operations and maintenance of these renewable generation facilities. (The one-time construction impacts associated with the construction of these facilities is separately reported in a later section.)
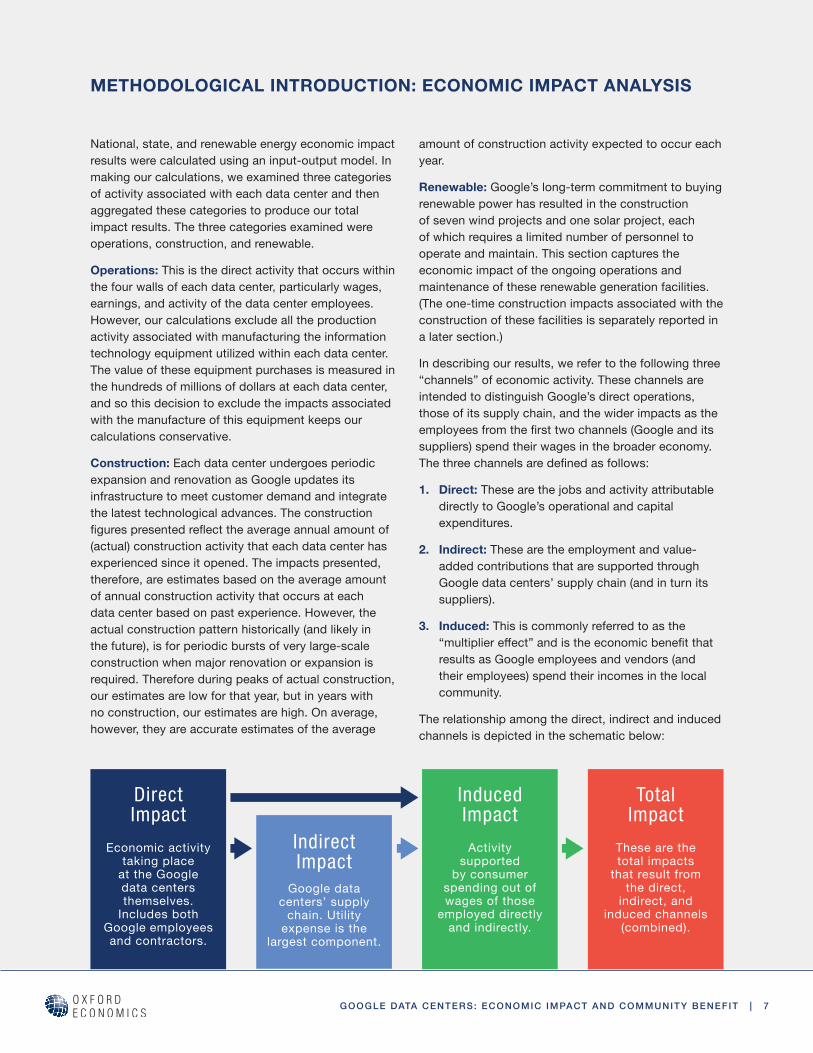
In describing our results, we refer to the following three “channels” of economic activity. These channels are intended to distinguish Google’s direct operations, those of its supply chain, and the wider impacts as the employees from the first two channels (Google and its suppliers) spend their wages in the broader economy. The three channels are defined as follows:
1. Direct: These are the jobs and activity attributable directly to Google’s operational and capital expenditures.
2. Indirect: These are the employment and value-added contributions that are supported through Google data centers’ supply chain (and in turn its suppliers).
3. Induced: This is commonly referred to as the “multiplier effect” and is the economic benefit that results as Google employees and vendors (and their employees) spend their incomes in the local community.
The relationship among the direct, indirect and induced channels is depicted in the schematic below:
Direct Impact
Economic activity taking place
at the Google data centers themselves.
Includes both Google employees and contractors.
Indirect Impact
Google data centers’ supply
chain. Utility expense is the
largest component.
Induced Impact
Activity supported
by consumer spending out of wages of those
employed directly and indirectly.
Total Impact
These are the total impacts
that result from the direct,
indirect, and induced channels
(combined).
8 | GOOGLE DATA CENTERS: ECONOMIC IMPACT AND COMMUNITY BENEFIT
NATIONAL ECONOMIC IMPACT
GOOGLE DATA CENTERS SUPPORT JOBS, GDP, AND INCOME GROWTH
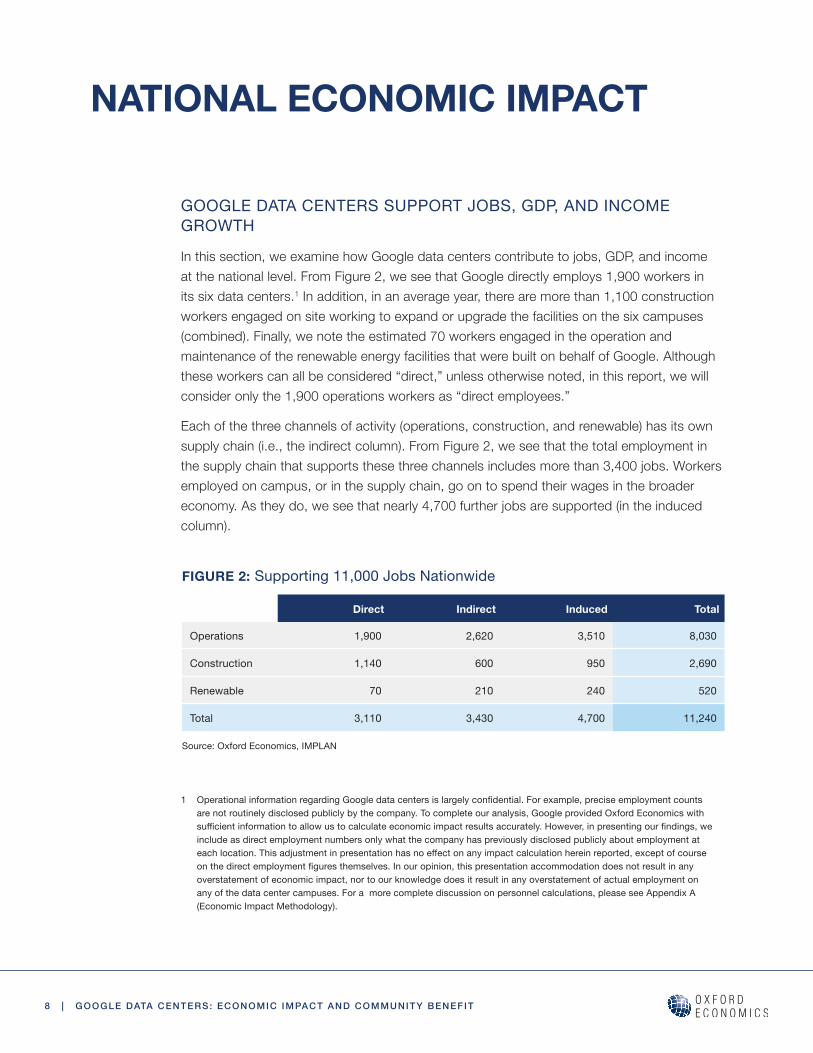
In this section, we examine how Google data centers contribute to jobs, GDP, and income at the national level. From Figure 2, we see that Google directly employs 1,900 workers in its six data centers.1 In addition, in an average year, there are more than 1,100 construction workers engaged on site working to expand or upgrade the facilities on the six campuses (combined). Finally, we note the estimated 70 workers engaged in the operation and maintenance of the renewable energy facilities that were built on behalf of Google. Although these workers can all be considered “direct,” unless otherwise noted, in this report, we will consider only the 1,900 operations workers as “direct employees.”
Each of the three channels of activity (operations, construction, and renewable) has its own supply chain (i.e., the indirect column). From Figure 2, we see that the total employment in the supply chain that supports these three channels includes more than 3,400 jobs. Workers employed on campus, or in the supply chain, go on to spend their wages in the broader economy. As they do, we see that nearly 4,700 further jobs are supported (in the induced column).
1 Operational information regarding Google data centers is largely confidential. For example, precise employment counts are not routinely disclosed publicly by the company. To complete our analysis, Google provided Oxford Economics with sufficient information to allow us to calculate economic impact results accurately. However, in presenting our findings, we include as direct employment numbers only what the company has previously disclosed publicly about employment at each location. This adjustment in presentation has no effect on any impact calculation herein reported, except of course on the direct employment figures themselves. In our opinion, this presentation accommodation does not result in any overstatement of economic impact, nor to our knowledge does it result in any overstatement of actual employment on any of the data center campuses. For a more complete discussion on personnel calculations, please see Appendix A (Economic Impact Methodology).
FIGURE 2: Supporting 11,000 Jobs Nationwide
Direct Indirect Induced Total
Operations 1,900 2,620 3,510 8,030
Construction 1,140 600 950 2,690
Renewable 70 210 240 520
Total 3,110 3,430 4,700 11,240
Source: Oxford Economics, IMPLAN
GOOGLE DATA CENTERS: ECONOMIC IMPACT AND COMMUNITY BENEFIT | 9
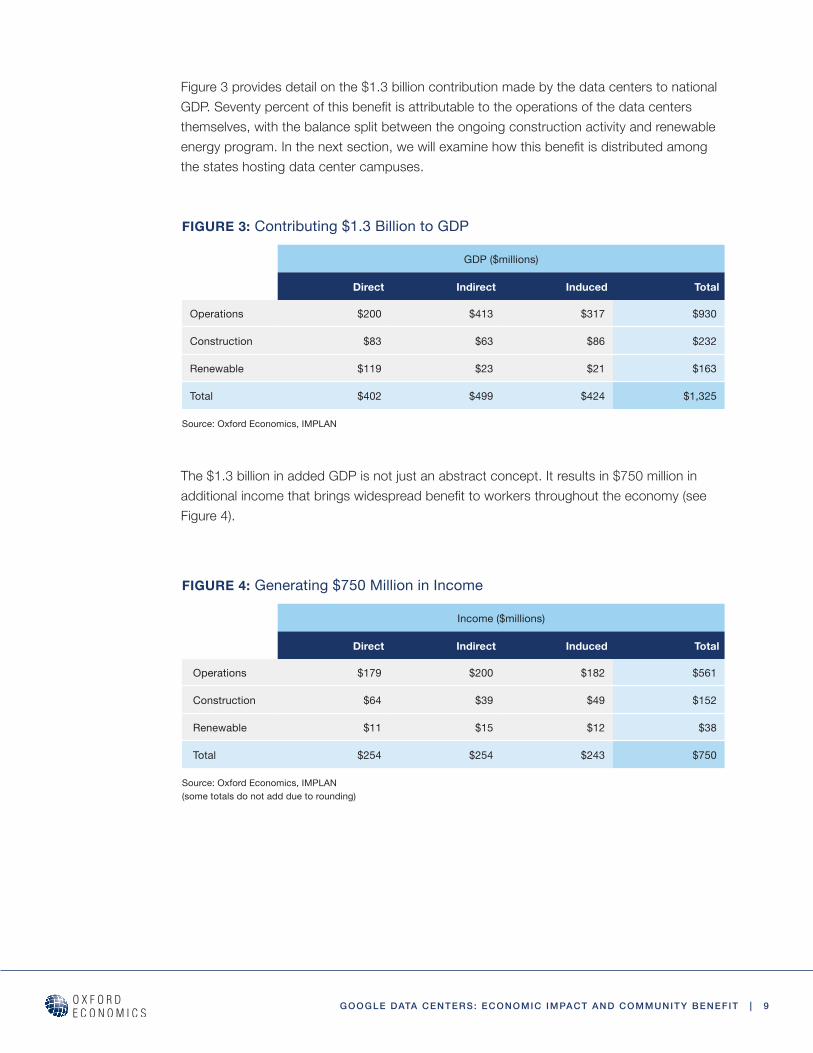
Figure 3 provides detail on the $1.3 billion contribution made by the data centers to national GDP.Seventypercentofthisbenefitisattributabletotheoperationsofthedatacentersthemselves, with the balance split between the ongoing construction activity and renewable energyprogram.Inthenextsection,wewillexaminehowthisbenefitisdistributedamongthe states hosting data center campuses.
The $1.3 billion in added GDP is not just an abstract concept. It results in $750 million in additionalincomethatbringswidespreadbenefittoworkersthroughouttheeconomy(seeFigure 4).
FIGURE 3: Contributing $1.3 Billion to GDP
GDP ($millions)
Direct Indirect Induced Total
Operations $200 $413 $317 $930
Construction $83 $63 $86 $232
Renewable $119 $23 $21 $163
Total $402 $499 $424 $1,325
Source: Oxford Economics, IMPLAN
FIGURE 4: Generating $750 Million in Income
Income ($millions)
Direct Indirect Induced Total
Operations $179 $200 $182 $561
Construction $64 $39 $49 $152
Renewable $11 $15 $12 $38
Total $254 $254 $243 $750
Source: Oxford Economics, IMPLAN(some totals do not add due to rounding)
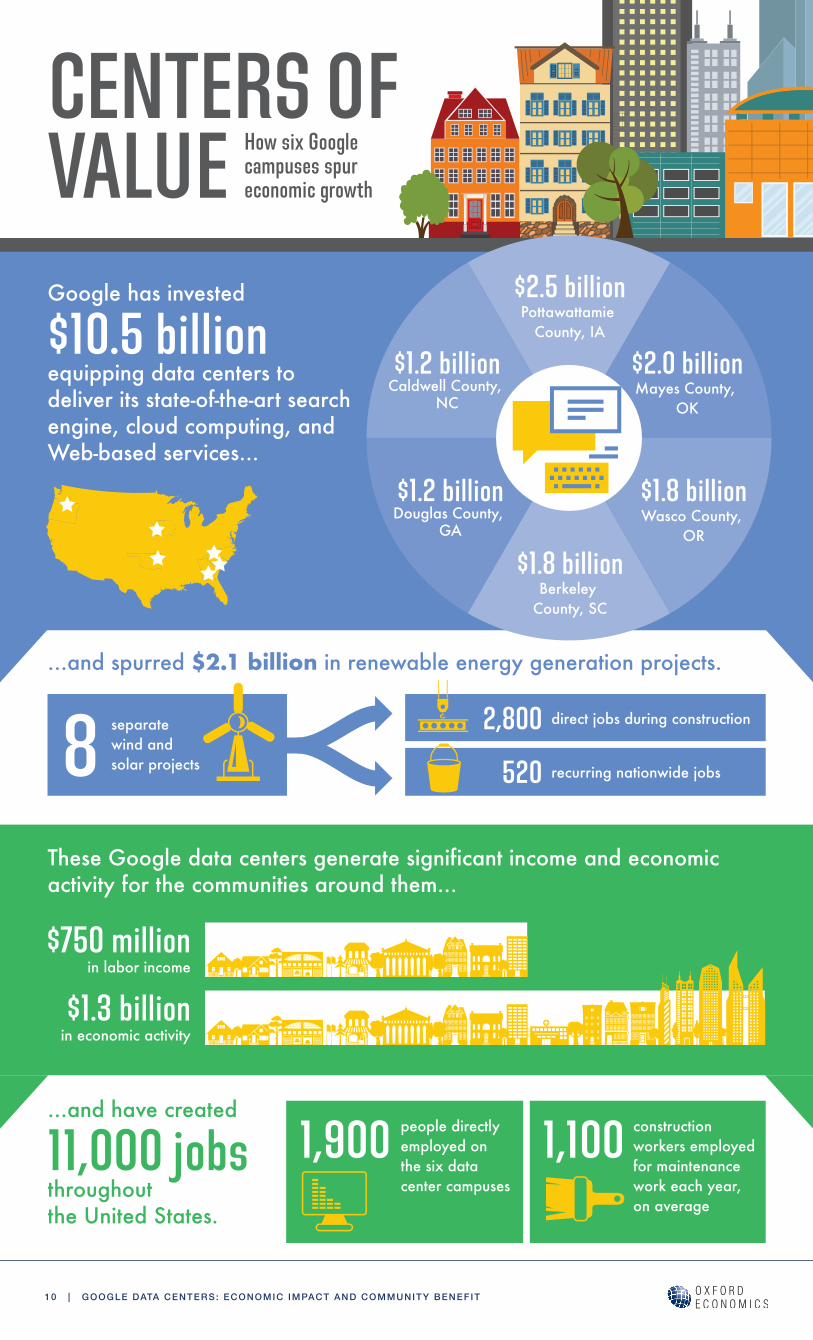
CENTERS OF VALUEGoogle has invested
$10.5 billion equipping data centers to deliver its state-of-the-art search engine, cloud computing, and Web-based services...
...and spurred $2.1 billion in renewable energy generation projects.
These Google data centers generate significant income and economic activity for the communities around them...
...and have created
11,000 jobs throughout the United States.
separate wind and solar projects8 2,800 direct jobs during construction
520 recurring nationwide jobs
$1.3 billionin economic activity
$750 millionin labor income
1,900 people directly employed on the six data center campuses
1,100 construction workers employed for maintenance work each year, on average
How six Google campuses spur economic growth
$2.0 billionMayes County,
OK
$1.8 billionWasco County,
OR
$1.8 billionBerkeley
County, SC
$1.2 billionCaldwell County,
NC
$1.2 billionDouglas County,
GA
$2.5 billionPottawattamie
County, IA
10 | GOOGLE DATA CENTERS: ECONOMIC IMPACT AND COMMUNITY BENEFIT
GOOGLE DATA CENTERS: ECONOMIC IMPACT AND COMMUNITY BENEFIT | 11
EXAMINING WIDER IMPACTS IN THE ECONOMY
In this section, we examine the national jobs multiplier associated with the data centers and then turn our attention to how the economic impact previously described spreads from the data center campus to the broader economy.
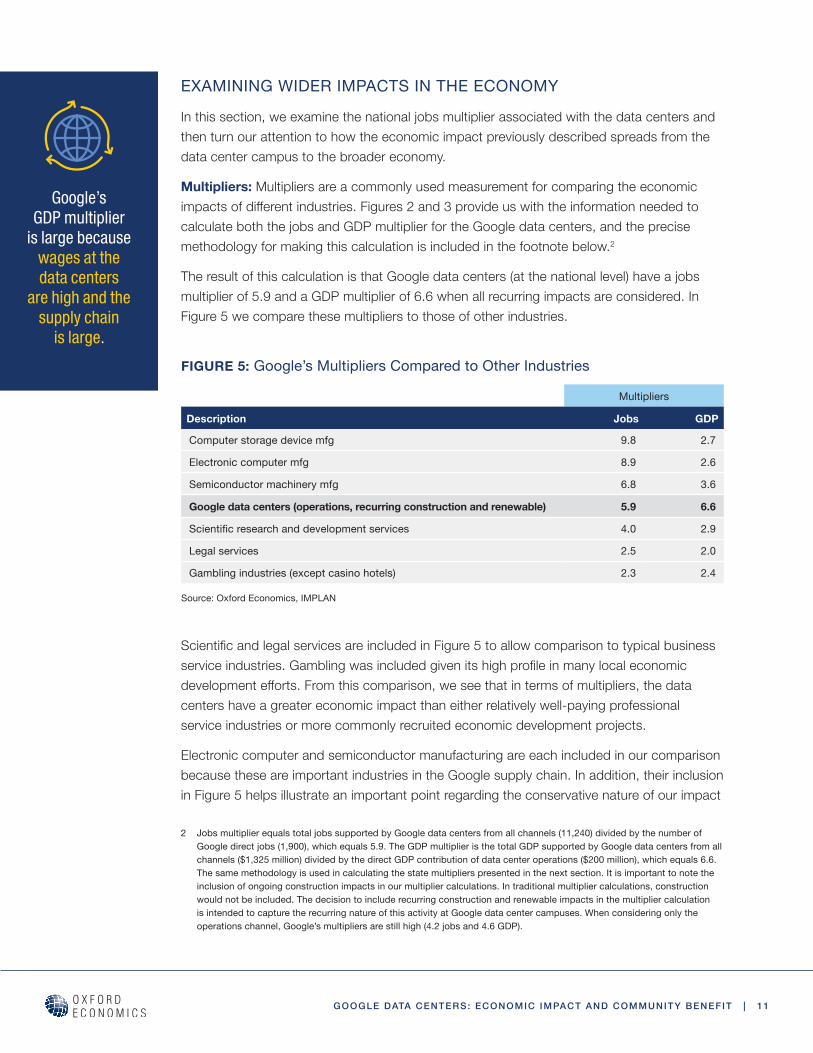
Multipliers: Multipliers are a commonly used measurement for comparing the economic impactsofdifferentindustries.Figures2and3provideuswiththeinformationneededtocalculate both the jobs and GDP multiplier for the Google data centers, and the precise methodology for making this calculation is included in the footnote below.2
The result of this calculation is that Google data centers (at the national level) have a jobs multiplier of 5.9 and a GDP multiplier of 6.6 when all recurring impacts are considered. In Figure 5 we compare these multipliers to those of other industries.
ScientificandlegalservicesareincludedinFigure5toallowcomparisontotypicalbusinessserviceindustries.Gamblingwasincludedgivenitshighprofileinmanylocaleconomicdevelopmentefforts.Fromthiscomparison,weseethatintermsofmultipliers,thedatacenters have a greater economic impact than either relatively well-paying professional service industries or more commonly recruited economic development projects.
Electronic computer and semiconductor manufacturing are each included in our comparison because these are important industries in the Google supply chain. In addition, their inclusion in Figure 5 helps illustrate an important point regarding the conservative nature of our impact
2 Jobs multiplier equals total jobs supported by Google data centers from all channels (11,240) divided by the number of Google direct jobs (1,900), which equals 5.9. The GDP multiplier is the total GDP supported by Google data centers from all channels ($1,325 million) divided by the direct GDP contribution of data center operations ($200 million), which equals 6.6. The same methodology is used in calculating the state multipliers presented in the next section. It is important to note the inclusion of ongoing construction impacts in our multiplier calculations. In traditional multiplier calculations, construction would not be included. The decision to include recurring construction and renewable impacts in the multiplier calculation is intended to capture the recurring nature of this activity at Google data center campuses. When considering only the operations channel, Google’s multipliers are still high (4.2 jobs and 4.6 GDP).
FIGURE 5: Google’s Multipliers Compared to Other Industries
Multipliers
Description Jobs GDP
Computer storage device mfg 9.8 2.7
Electronic computer mfg 8.9 2.6
Semiconductor machinery mfg 6.8 3.6
Google data centers (operations, recurring construction and renewable) 5.9 6.6
Scientific research and development services 4.0 2.9
Legal services 2.5 2.0
Gambling industries (except casino hotels) 2.3 2.4
Source: Oxford Economics, IMPLAN
Google’s GDP multiplier
is large because wages at the data centers
are high and the supply chain
is large.
12 | GOOGLE DATA CENTERS: ECONOMIC IMPACT AND COMMUNITY BENEFIT
calculations. As previously noted, Google invests billions of dollars-worth of equipment in each data center campus. As seen in Figure 5, the jobs multipliers (and hence economic impacts) associated with the manufacturing of this equipment are quite large. However, none ofthisextraeconomicimpactisincludedinourresults.Specifically,weexcludedallimpactassociated with the manufacturing of computer, telecom, or other equipment placed into service at the data centers. This was done to keep our results conservative and to make sure that our impact calculations only measure the contribution of the data center campuses themselves.
It is also interesting to note that Google’s GDP multiplier (6.6) is higher than that of any of the other industries presented. This is a function of the relatively high wages associated with many of the data center positions and the high contribution of economic activity associated with the Google supply chain.
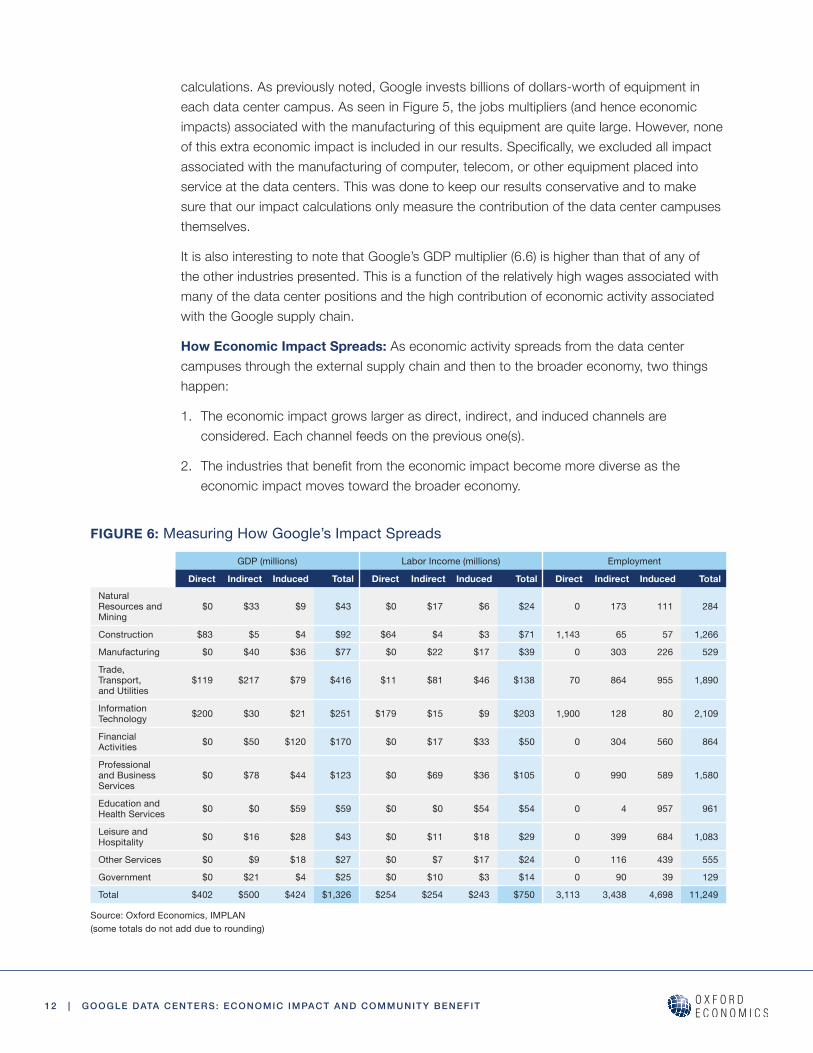
How Economic Impact Spreads: As economic activity spreads from the data center campuses through the external supply chain and then to the broader economy, two things happen:
1. The economic impact grows larger as direct, indirect, and induced channels are considered. Each channel feeds on the previous one(s).
2. Theindustriesthatbenefitfromtheeconomicimpactbecomemorediverseastheeconomic impact moves toward the broader economy.
FIGURE 6: Measuring How Google’s Impact Spreads GDP (millions) Labor Income (millions) Employment
Direct Indirect Induced Total Direct Indirect Induced Total Direct Indirect Induced Total
Natural Resources and Mining
$0 $33 $9 $43 $0 $17 $6 $24 0 173 111 284
Construction $83 $5 $4 $92 $64 $4 $3 $71 1,143 65 57 1,266
Manufacturing $0 $40 $36 $77 $0 $22 $17 $39 0 303 226 529
Trade, Transport, and Utilities
$119 $217 $79 $416 $11 $81 $46 $138 70 864 955 1,890
Information Technology $200 $30 $21 $251 $179 $15 $9 $203 1,900 128 80 2,109
Financial Activities $0 $50 $120 $170 $0 $17 $33 $50 0 304 560 864
Professional and Business Services
$0 $78 $44 $123 $0 $69 $36 $105 0 990 589 1,580
Education and Health Services $0 $0 $59 $59 $0 $0 $54 $54 0 4 957 961
Leisure and Hospitality $0 $16 $28 $43 $0 $11 $18 $29 0 399 684 1,083
Other Services $0 $9 $18 $27 $0 $7 $17 $24 0 116 439 555
Government $0 $21 $4 $25 $0 $10 $3 $14 0 90 39 129
Total $402 $500 $424 $1,326 $254 $254 $243 $750 3,113 3,438 4,698 11,249
Source: Oxford Economics, IMPLAN(some totals do not add due to rounding)

GOOGLE DATA CENTERS: ECONOMIC IMPACT AND COMMUNITY BENEFIT | 13
Figure 6 provides a description of how the economic impact grows and then spreads throughout more industries as we move from direct (on campus), to indirect (supply chain), and then to the broader economy (induced).
Examining the employment columns in Figure 6 helps demonstrate how impact both increasesandspreadsasdifferentchannelsareadded.
• When just the direct channel is considered, we see most of the on-campus (direct) jobs are in either information technology (1,900) or construction (1,143) industries.
• When the supply chain (indirect) is considered, we see big jumps in trade and utilities (864) and professional and business services (990).
• By the time induced channel (broad economy) is considered, both leisure and hospitality (684) and education (957) show large gains in the employment that is supported by Google.
In fact, when all channels are considered we note that less than 20% of the more than 11,000 jobs supported by Google data centers are even in the information technology industry. The economic impact is both large and widespread.
14 | GOOGLE DATA CENTERS: ECONOMIC IMPACT AND COMMUNITY BENEFIT
T HE greatest value of landing a Google data center may come from seeding future economic growth and diversificationinregionsthatneedaboost.Google’s
impact on its host communities starts with construction spendinganddatacenterjobs,buttherippleeffectsinclude broad-based workforce development, new revenue streams, and a reputation as a good place to do
business, says Deborah Murray, executive director at the Caldwell County Economic Development Commission in Lenoir, North Carolina.
When Google arrived a decade ago, the town was struggling with the loss of furniture jobs, which had sustained its economy for generations. Since then, the unemployment rate has plummeted, unused industrial square footage has decreased more than 90%, and median household income growth outpaced the rest of the
statein2016.Theeconomyhasdiversifiedtoincludeameaningful advanced manufacturing component, and the workforce has reskilled to support what Ms. Murray calls “twenty-firstandtwenty-secondcenturyjobs.”
“I’m not going to tell you that Google is responsible for all of this, but they helped us learn about our capabilities,” Ms. Murray says. “The world has changed, and Google helped us change with it.”
One catalyst has been a program at Caldwell Community College, created after local leaders visited Google’s Mountain View, California, headquarters. The initiative began with specialized training for potential data center employees and has expanded to support numerous other industries. “It gives us the ability to respond when we are courting a company with particular needs or when acompanyneedscertainskillstofillanew-economyposition,” she says. “Google allowed us to demonstrate what we can do with that kind of specialized training.” Theschoolalsoofferspopularonlinecoursesincloudsoftware.
Anotherbenefittothestateasawholeisattractingcompanies looking to locate their own data centers. “Google gave us the credibility to compete,” Ms. Murray says. In recent years, the region around Caldwell County—from the Appalachian foothills to the Piedmont—has become known as the North Carolina Data Center Corridor, a hotspot for major facilities operated by some of the biggest names in technology and other industries.
Similar stories are playing out in other Google communities. In Iowa, Google sparked a big-company, data-centerboomwithitsCouncilBluffsoperation,andthesamedynamicisineffectalongtheColumbiaRiverinOregon,whereGoogle’sfirstdatacenteropenedinThe Dalles in 2006. These operations generate franchise fee revenue for host communities and some also share Google’s focus on renewable energy, helping to spur growth in that industry state-wide.
Meanwhile, in Pryor Creek, Oklahoma, a rising generationisfindingjobsin a rural area that must compete for talent with nearby Tulsa and other cities. Scott Fry is Director of Workforce Development at Pryor Creek’s MidAmerica Industrial Park, home to a Google data center and dozens of other companies. With local school districts bolstered by Google support andthepark’svisibilityenhancedbyitshigh-profiletenant, students are increasingly aware of opportunities intechnicalfieldsandthepossibilityofgoodworkatGoogle or neighboring businesses. “We are getting great feedback from employers, with more young talent entering the workforce right out of high school,” Mr. Fry says. “Having Google in our community is a game changer.”
“Google gave us the credibility to
compete.”—Deborah Murray Executive Director,
Caldwell County Economic Development Commission
Lenoir, NC“More young talent [is] entering the workforce…Having Google in our community is a game changer.”—Scott Fry Director, Workforce Development MidAmerica Industrial Park Pryor Creek, Oklahoma
How Google supports the next-generation economy in data center communitiesCREATING THE FUTURE
GOOGLE DATA CENTERS: ECONOMIC IMPACT AND COMMUNITY BENEFIT | 15
STATE-LEVEL IMPACT
Google data centers significantly contribute to the growth of jobs, income, and economic
activity in each state where a campus is located, and in this section we examine key state-
level economic impacts. (More detail on the economic impact in each of these states is
included in Appendix B).
GDP, INCOME, AND JOBS
In general, the size of state economic impacts varies based on the data center size and the amount of Google’s supply chain that is located in the state:
• The bigger the data center, the bigger will be the economic impact, other things being equal. For example, the bigger the data center, the bigger will be the economic impact found in that state’s direct channel.
• The greater the concentration of the data center’s supply chain that is located in the state, the greater will be the economic impact in that state. Morespecifically,thebiggerthe in-state supply chain, the bigger will be the economic impact found in that state’s indirect channel.
Differencesineitherofthesevariablesgetamplifiedasweconsidertheinducedeffectsoccurring in the broader economy. That is because as either the amount of in-state direct or indirect economic activity increases, the greater is the amount of induced in-state economic
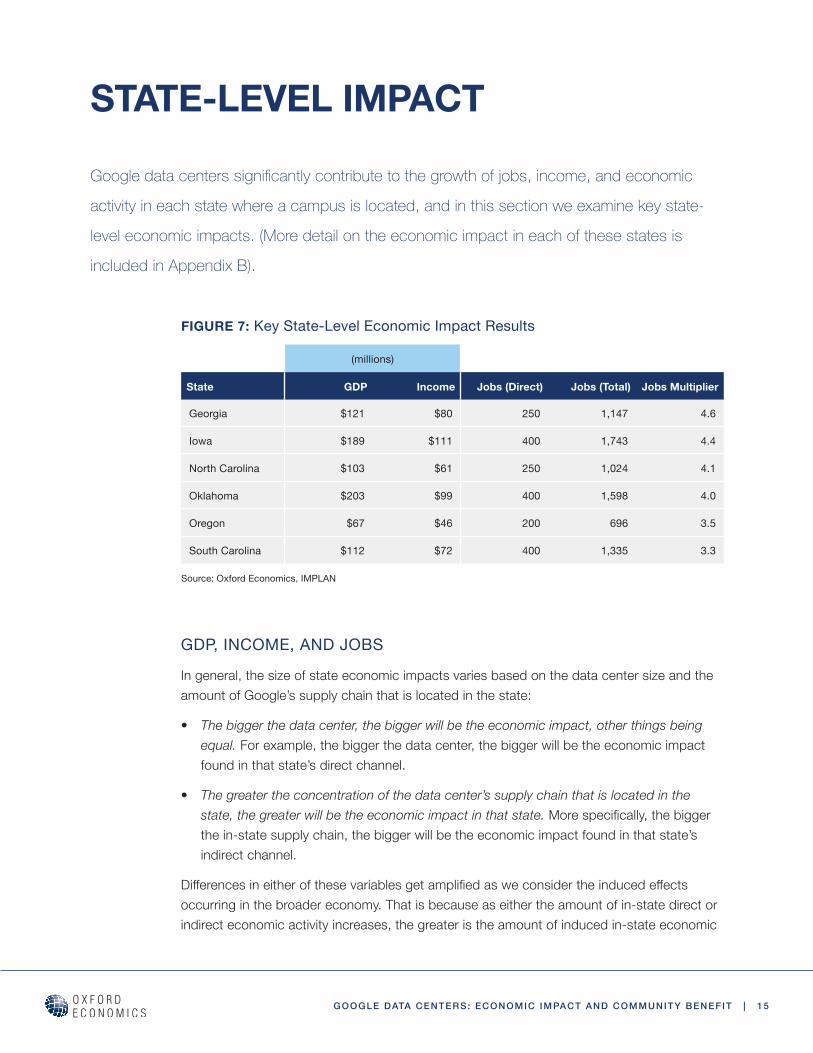
FIGURE 7: Key State-Level Economic Impact Results
(millions)
State GDP Income Jobs (Direct) Jobs (Total) Jobs Multiplier
Georgia $121 $80 250 1,147 4.6
Iowa $189 $111 400 1,743 4.4
North Carolina $103 $61 250 1,024 4.1
Oklahoma $203 $99 400 1,598 4.0
Oregon $67 $46 200 696 3.5
South Carolina $112 $72 400 1,335 3.3
Source: Oxford Economics, IMPLAN
16 | GOOGLE DATA CENTERS: ECONOMIC IMPACT AND COMMUNITY BENEFIT
activity that occurs in the state as well. Stated simply, the more workers that are located in the state (whether direct employees or those in the supply chain), the more likely it is that economicbenefitwillspillovertothebroader(local)economyastheseworkersspendtheirwages on home improvement, health care, or entertainment close to where they live.
As was true at the national level, state jobs multipliers are useful as a common denominator with which to compare impacts between states because they show how many additional jobs are supported by each Google worker located in that state, regardless of the size of the data center itself. State jobs multipliers are almost always smaller than national jobs multipliersbecause,bydefinition,thestatejobsmultiplierscaptureonlytheeconomicactivity associated with that state, whereas the national jobs multiplier captures all the economic activity occurring within the entire country. Although smaller than Google’s national jobs multiplier of 5.9, we see from Figure 7 (see previous page) that Google’s state jobs multipliersareallsignificantandrangefrom3.3inSouthCarolinato4.6inGeorgia(withthevariance again largely attributable to the size of the data center and the amount of supply chain activity located in the state).
GOOGLE DATA CENTERS: ECONOMIC IMPACT AND COMMUNITY BENEFIT | 17
G OOGLE manages its local philanthropic involvement with a light touch, but that does not mean the companyshiesawayfromdifficultissues.InBerkeley
County, South Carolina, for example, the 2015 shooting ofWalterScottbyapoliceofficerandthe2015massacreat Charleston’s Emanuel African Methodist Episcopal Church led Google to grant the College of Charleston Foundation $125,000 to found the Race and Social Justice Initiative (RSJI) at the college’s Avery Research Center for African American History and Culture. This organization’s goal is to promote public awareness and dialogue about race and socioeconomic issues in Charleston and beyond. In 2016, Google increased its support and donated $200,000.
Local control matters. “We don’t want to run a grassroots initiative like this with corporate oversight. Google trusts us to run with it,” says Daron Lee Calhoun II, RSJI coordinator. “It’s a blessing for Google to run this the way they do.” Mr. Calhoun has been associated with the college since 2012 and has been heavily involved in social justice activism protests since then.
The results of the center’s work have been notable. “We’ve held international conferences” Mr. Calhoun says. Nationally known speakers at RSJI events have included author Ta-Nehisi Coates and Dr. Lonnie G. Bunch III, director of the Smithsonian’s National Museum of African American History and Culture.
The Avery Research Center is just one example of Google’s presence in the community. Among various volunteereffortsintheregion,theBlackGooglerNetwork—oneofthemanyaffinitygroupswithinGoogle—traveled to Charleston to participate in an educational event that included lectures, seminars, and
even mock interviews with black students at the college. GooglealsohasgrantedfundstononprofitsincludingMUSC Children’s Hospital, SC Together (formerly the SouthCarolinaAssociationofNonprofitOrganizations),and the Coastal Community Foundation of South Carolina. And Google’s employees have become deeply rooted in other community initiatives since the data center opened in 2007.
Much of the work done by Google in its host cities and towns across the country is done through the GoogleServe program, an initiative that encourages Google employees to get involved in community life.
Google workers in Council Bluffs,Iowa,havecleanedand refurbished computer labs and re-imaged, installed, and inventoried computer equipment at local high schools. The work makes adifference,saidDavidFringer,theCouncilBluffsCommunity School District’s chieftechnologyofficer,inanarticle in a local newspaper.
“They will have pushed us weeks ahead of what we could have done without their help. This has become a tradition with this Google team.”
The same energy is on display in other Google communities. In The Dalles, Oregon, for example, employees have volunteered with a wide range of organizations including Home at Last Humane Society, Wonderworks Children’s Museum of the Gorge, and the Celilo Cancer Center.
Google’s presence in communities where it has built data centers has sparked meaningful, ongoing change. “We would not be able to do the work that we do without the monetary and educational support from Google, period,” Mr. Calhoun says.
“It’s a blessing for Google to run this the way they do.”
—Daron Lee Calhoun II, Avery Research Center for
African American History and Culture
Google’s approach to philanthropy and community involvementLOCAL CONTROL
18 | GOOGLE DATA CENTERS: ECONOMIC IMPACT AND COMMUNITY BENEFIT
LOCAL SPILLOVER EFFECTSGoogle has located each of its six data center campuses in small population counties
located some distance away from a major city center. Oxford Economics set out to test the
hypothesis that the opening of a Google data center in a small county, some distance from
a major city, would improve the economic trajectory of that county relative to a comparable
group of counties that did not host a data center campus. What our research uncovered was
that, in fact, for most of the counties hosting a Google data center, there was measurable
improvement at the county level in overall employment or education, measured by the
number of county residents holding a bachelor’s degree. These local spillover effects were
measured independently of the economic impact calculations previously described.
Tocalculatetheseeffects,OxfordEconomicsutilizedeconometrictechniques(regressionanalysis) that are more fully described in Appendix C. Regression work allows us to compare the economic experience in counties where Google opened a data center to a comparable group of counties that does not host a Google data center during a given time period. The counties share many key characteristics and then are divided between those where Google opened a data center and those where it did not. The experiences of the two groups of counties following the date that the data center opened, are then compared. The group of counties selected for comparison to those hosting a data center is called the “control group.” In selecting our control group, we considered population, state tax policy, electric rates, proximity to a large city, as well as several other variables.3
Our initial goal was to test a range of socioeconomic variables, including home prices, retail activity, and concentrations of technology workers. Data limitations forced us to drop these variables from consideration. However, available data did allow us to examine employment and educational level of county residents, and for each of these variables, positive local spillovereffectsattributabletotheGoogledatacentercampuswerefound.Oneprocessbywhich an anchor institution (like the Google data center) functions as a magnet that attracts evenmoreeconomicactivityiscalledanagglomerationeffectandthatmightpartiallyexplainthe source of some of this additional growth.4
3 The selection of the control group of counties is discussed more thoroughly in Appendix C. Here it is important to note that the control group constitutes a selection of counties that shared key characteristics with the counties that now host a Google data center, except that in fact Google did not open a data center in any of those counties.
4 The concept of agglomeration economies dates to the 1890s, when Alfred Marshall’s agglomeration theory sought to explain the geographic co-location, or “clustering,” of similar industries and often competing businesses. These agglomeration economies generate a local pool of skilled talent, local supplier linkages, and local knowledge spillovers. Quite possibly, some of the employment gains are attributable to these effects, while other gains might be in totally unrelated fields such as restaurants or hotels.
Most counties quickly
experience a jump in
employment or an increase in
college-educated residents shortly
after a Google data center
opens.
GOOGLE DATA CENTERS: ECONOMIC IMPACT AND COMMUNITY BENEFIT | 19
EMPLOYMENT EFFECT
Using our regression framework, counties hosting a Google data center were found to have experienced more job growth than the matched control counties. The impact began approximately one to two years prior to opening of the data center (presumably due to site acquisition, construction, and related activities) and continued throughout the period that we tested (three years beyond the opening date). As a group, the counties where the data center opened before 2008 had greater additional job growth than those that opened in 2008.5
• Counties where the data center opened before 2008 experienced employment gains of 2,405.
• Counties where the data center opened in 2008 experienced employment gains of 580.
We speculate that the national recession that followed the data center openings in 2008 stuntedtheadditionaleconomicbenefitfortheselocations.
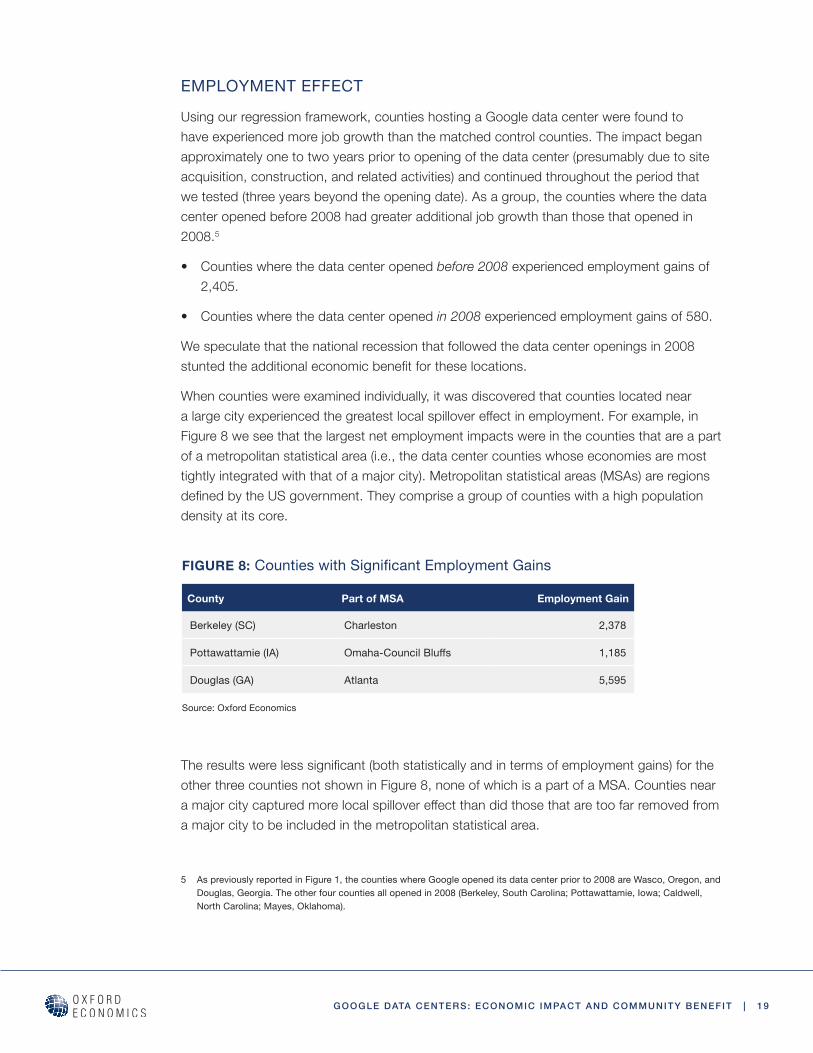
When counties were examined individually, it was discovered that counties located near alargecityexperiencedthegreatestlocalspillovereffectinemployment.Forexample,inFigure 8 we see that the largest net employment impacts were in the counties that are a part of a metropolitan statistical area (i.e., the data center counties whose economies are most tightly integrated with that of a major city). Metropolitan statistical areas (MSAs) are regions definedbytheUSgovernment.Theycompriseagroupofcountieswithahighpopulationdensity at its core.
Theresultswerelesssignificant(bothstatisticallyandintermsofemploymentgains)fortheother three counties not shown in Figure 8, none of which is a part of a MSA. Counties near amajorcitycapturedmorelocalspillovereffectthandidthosethataretoofarremovedfroma major city to be included in the metropolitan statistical area.
5 As previously reported in Figure 1, the counties where Google opened its data center prior to 2008 are Wasco, Oregon, and Douglas, Georgia. The other four counties all opened in 2008 (Berkeley, South Carolina; Pottawattamie, Iowa; Caldwell, North Carolina; Mayes, Oklahoma).
FIGURE 8: Counties with Significant Employment Gains
County Part of MSA Employment Gain
Berkeley (SC) Charleston 2,378
Pottawattamie (IA) Omaha-Council Bluffs 1,185
Douglas (GA) Atlanta 5,595
Source: Oxford Economics
20 | GOOGLE DATA CENTERS: ECONOMIC IMPACT AND COMMUNITY BENEFIT
EDUCATION EFFECT
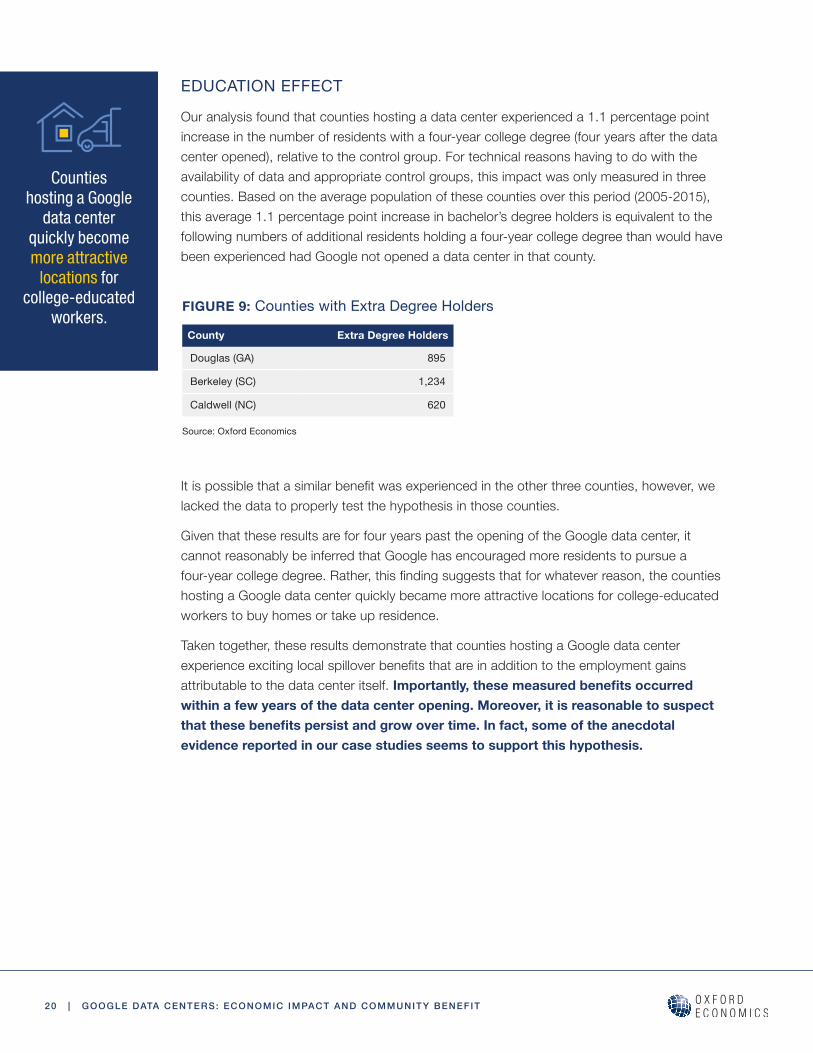
Our analysis found that counties hosting a data center experienced a 1.1 percentage point increase in the number of residents with a four-year college degree (four years after the data center opened), relative to the control group. For technical reasons having to do with the availability of data and appropriate control groups, this impact was only measured in three counties. Based on the average population of these counties over this period (2005-2015), this average 1.1 percentage point increase in bachelor’s degree holders is equivalent to the following numbers of additional residents holding a four-year college degree than would have been experienced had Google not opened a data center in that county.
Itispossiblethatasimilarbenefitwasexperiencedintheotherthreecounties,however,welacked the data to properly test the hypothesis in those counties.
Given that these results are for four years past the opening of the Google data center, it cannot reasonably be inferred that Google has encouraged more residents to pursue a four-yearcollegedegree.Rather,thisfindingsuggeststhatforwhateverreason,thecountieshosting a Google data center quickly became more attractive locations for college-educated workers to buy homes or take up residence.
Taken together, these results demonstrate that counties hosting a Google data center experienceexcitinglocalspilloverbenefitsthatareinadditiontotheemploymentgainsattributable to the data center itself. Importantly, these measured benefits occurred within a few years of the data center opening. Moreover, it is reasonable to suspect that these benefits persist and grow over time. In fact, some of the anecdotal evidence reported in our case studies seems to support this hypothesis.
FIGURE 9: Counties with Extra Degree Holders
County Extra Degree Holders
Douglas (GA) 895
Berkeley (SC) 1,234
Caldwell (NC) 620
Source: Oxford Economics
Counties hosting a Google
data center quickly become more attractive
locations for college-educated
workers.
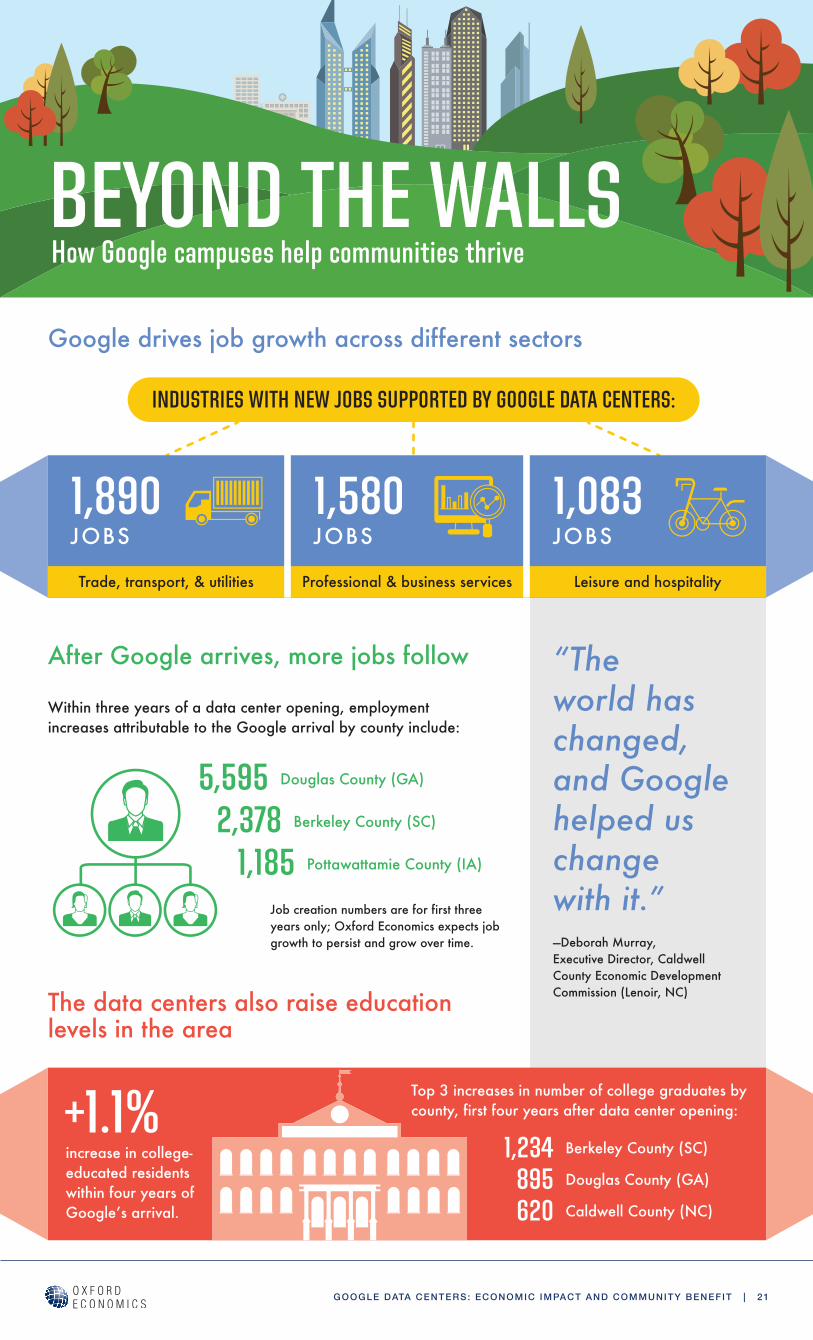
Within three years of a data center opening, employment increases attributable to the Google arrival by county include:
Job creation numbers are for first three years only; Oxford Economics expects job growth to persist and grow over time.
Google drives job growth across different sectors
After Google arrives, more jobs follow
The data centers also raise education levels in the area
1,890JOBS
1,580JOBS
1,083JOBS
Trade, transport, & utilities Professional & business services Leisure and hospitality
INDUSTRIES WITH NEW JOBS SUPPORTED BY GOOGLE DATA CENTERS:
“The world has changed,and Google helped us change with it.”—Deborah Murray, Executive Director, Caldwell County Economic Development Commission (Lenoir, NC)
5,595 Douglas County (GA)
2,378 Berkeley County (SC)
1,185 Pottawattamie County (IA)
BEYOND THE WALLSHow Google campuses help communities thrive
increase in college-educated residents within four years of Googleʼs arrival.
+1.1%1,234 Berkeley County (SC)
895 Douglas County (GA)
620 Caldwell County (NC)
Top 3 increases in number of college graduates by county, first four years after data center opening:
GOOGLE DATA CENTERS: ECONOMIC IMPACT AND COMMUNITY BENEFIT | 21
22 | GOOGLE DATA CENTERS: ECONOMIC IMPACT AND COMMUNITY BENEFIT
RENEWABLE ENERGY INVESTMENT
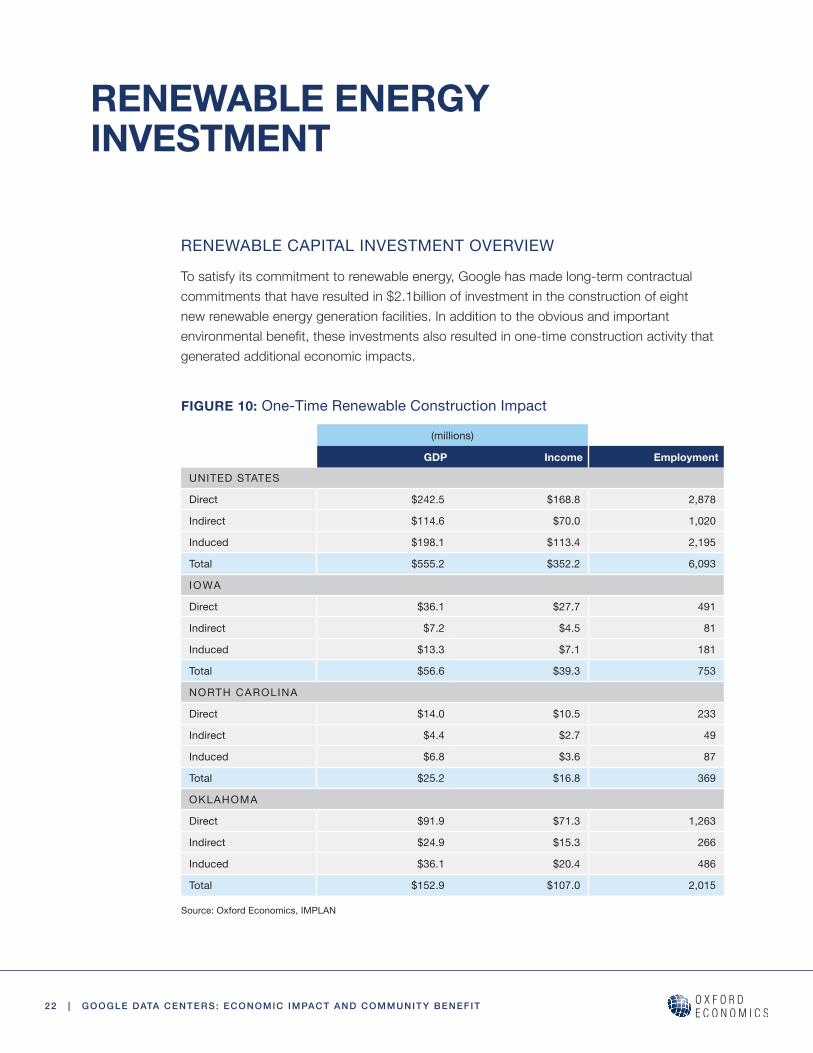
RENEWABLE CAPITAL INVESTMENT OVERVIEW
To satisfy its commitment to renewable energy, Google has made long-term contractual commitments that have resulted in $2.1billion of investment in the construction of eight new renewable energy generation facilities. In addition to the obvious and important environmentalbenefit,theseinvestmentsalsoresultedinone-timeconstructionactivitythatgenerated additional economic impacts.
FIGURE 10: One-Time Renewable Construction Impact
(millions)
GDP Income Employment
UNITED STATES
Direct $242.5 $168.8 2,878
Indirect $114.6 $70.0 1,020
Induced $198.1 $113.4 2,195
Total $555.2 $352.2 6,093
IOWA
Direct $36.1 $27.7 491
Indirect $7.2 $4.5 81
Induced $13.3 $7.1 181
Total $56.6 $39.3 753
NORTH CAROLINA
Direct $14.0 $10.5 233
Indirect $4.4 $2.7 49
Induced $6.8 $3.6 87
Total $25.2 $16.8 369
OKLAHOMA
Direct $91.9 $71.3 1,263
Indirect $24.9 $15.3 266
Induced $36.1 $20.4 486
Total $152.9 $107.0 2,015
Source: Oxford Economics, IMPLAN
GOOGLE DATA CENTERS: ECONOMIC IMPACT AND COMMUNITY BENEFIT | 23
To calculate the one-time economic impact that resulted from the construction of the eight renewableprojectsGoogleinvestedin,OxfordEconomicsfirstestimatedthepercentageofthe $2.1 billion investment that went toward construction activity including site preparation, on site construction, and other related on site activity. Based on published sources, we estimate that nearly 15% of the investment cost went toward construction activity.6 The balance of the investment was assigned to equipment costs, and these were excluded from our impact calculations.
As described in Figure 10, construction of these eight projects created an estimated 2,878 construction jobs (one-time, temporary job creation). Moreover, nearly 70% of those construction jobs were in a state that also hosts a data center (Iowa, North Carolina, Oklahoma). They are not included in the impact calculations presented elsewhere in the report because these jobs are temporary.
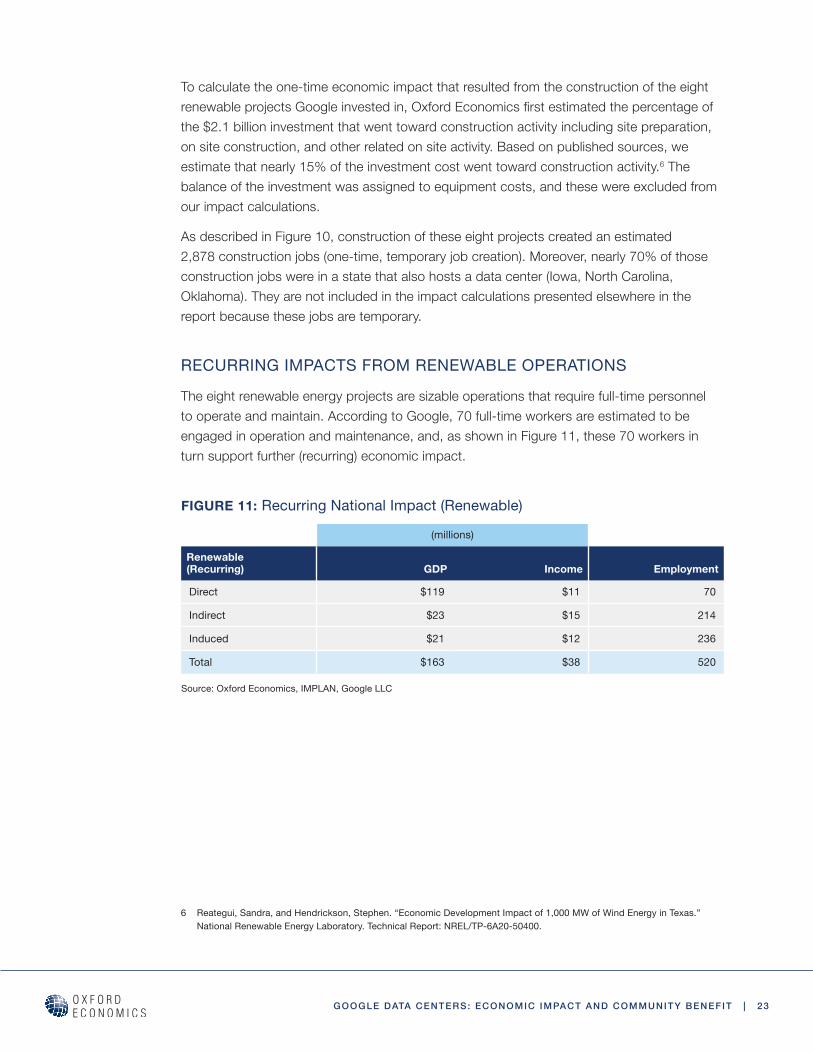
RECURRING IMPACTS FROM RENEWABLE OPERATIONS
The eight renewable energy projects are sizable operations that require full-time personnel to operate and maintain. According to Google, 70 full-time workers are estimated to be engaged in operation and maintenance, and, as shown in Figure 11, these 70 workers in turn support further (recurring) economic impact.
6 Reategui, Sandra, and Hendrickson, Stephen. “Economic Development Impact of 1,000 MW of Wind Energy in Texas.” National Renewable Energy Laboratory. Technical Report: NREL/TP-6A20-50400.
FIGURE 11: Recurring National Impact (Renewable)
(millions)
Renewable (Recurring) GDP Income Employment
Direct $119 $11 70
Indirect $23 $15 214
Induced $21 $12 236
Total $163 $38 520
Source: Oxford Economics, IMPLAN, Google LLC
24 | GOOGLE DATA CENTERS: ECONOMIC IMPACT AND COMMUNITY BENEFIT
AT thefirstGeorgiaGravityGamesin2010,roughly20 teams of students showed up with cars they had designed and built over the preceding months,
ready to try for the fastest run down Church Street in Douglasville, Georgia. By 2017, 60 teams were competing—at least one from every school in the county, including teams with kids from populations
that are traditionally underrepresented in engineering and technology. In fact, the program’s growth has been so rapid that Chris Thompson, associate director of technology and student activities for the Center for Education, Integrating Science, Mathematics, and Computing (CEISMC) at the Georgia Institute of Technology and manager of the program, jokes that
itisbecomingdifficulttoaccommodatealltheparticipants.“The street is only so big.”
The core goal of the Gravity Games, funded by Google and run by Google, Georgia Tech, and the city of Douglasville, is to spur interest in science, technology, engineering, and math (STEM) among young people in the community. The initiative has accomplished that and more: participating students have not only received hands-on engineering experience through their school clubs, but also have had the opportunity to interact with Georgia Tech students and faculty. One group of participating students even went on to join a robotics team.
The Gravity Games also take place in North Carolina—part of a partnership between Google, Appalachian State University, the University of North Carolina, and the city of Lenoir. And Google funds other types of educational programs around the country, including robotics camps
in Mayes County, Oklahoma; a competition to build the strongest wind turbine in The Dalles, Oregon; and a program, called Rolling Study Halls, that supplies Wi-Fi and educational resources to students in rural communities on their long bus rides to school.
Berkeley County, South Carolina, one area that has implemented these Rolling Study Halls, reports noticeable improvements among students from the program. According to Diane Driggers, chief information and technologyofficerfortheBerkeleyCountySchoolDistrict,students who participate are more likely to understand and complete their homework, more engaged with the curriculum, and better behaved on the bus. Perhaps most importantly, the program provides Internet access to students in the rural district, many of whom may not have it at home.
Bringing these types of opportunities to underserved communities is the thread running through all of Google’s education initiatives, including Gravity Games, which promotes STEM engagement among minorities and females. “We have a diverse group participating, including at least one all-female team” Mr. Thompson says. Last year, Georgia Tech sponsored three teams from low-income areas, and local businesses support underrepresented parts of the region. The Douglas County Chamber of Commerce also works to connect businesses with teams that need sponsorships. The hope is that some of these young students will be interested enough in what they see at the Gravity Games to pursue further education and careers in related disciplines. Some may even end up at Georgia Tech.
“The Gravity Games have grown so
popular that they are approaching the town’s capacity. The
street is only so big.”
—Chris Thompson, Associate Director of Technology and Student Activities,
Georgia Institute of Technology
Students who participate in a Google-funded mobile study hall are more likely to understand and complete homework, engage with the curriculum, and behave on the school bus.—Berkeley County, SC, School District
Google’s focus on educationROBOTS, Wi-Fi, AND MATH
GOOGLE DATA CENTERS: ECONOMIC IMPACT AND COMMUNITY BENEFIT | 25
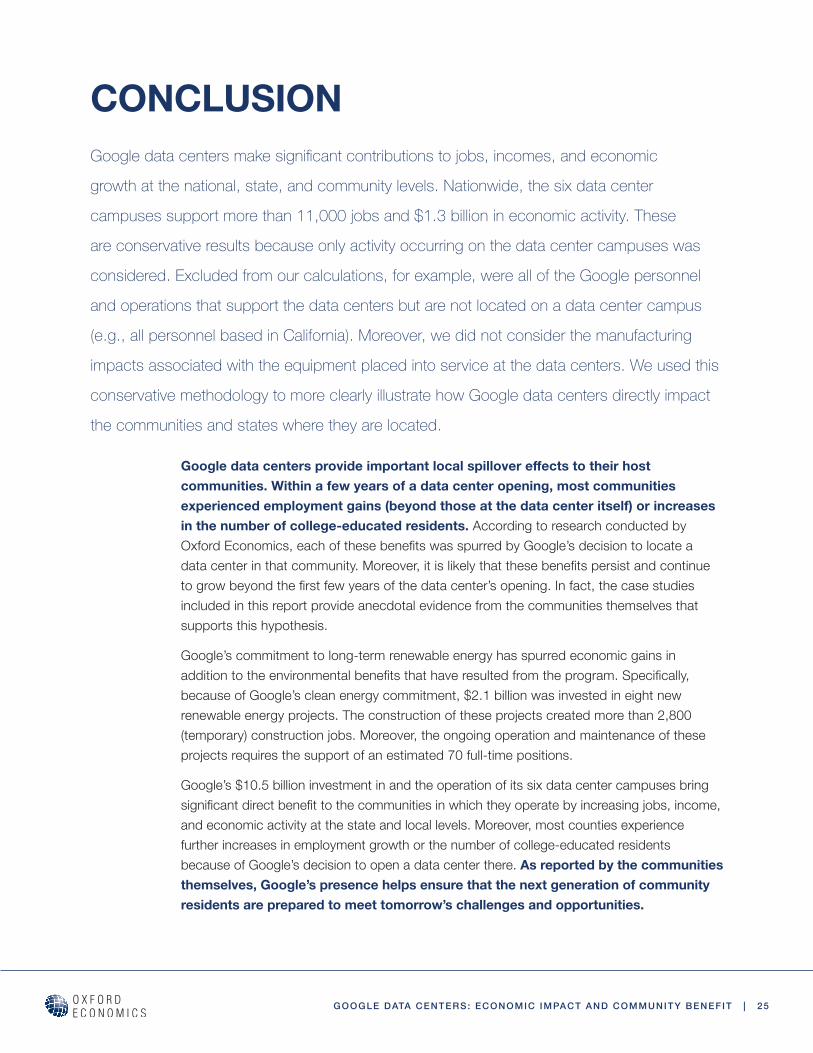
CONCLUSIONGoogle data centers make significant contributions to jobs, incomes, and economic
growth at the national, state, and community levels. Nationwide, the six data center
campuses support more than 11,000 jobs and $1.3 billion in economic activity. These
are conservative results because only activity occurring on the data center campuses was
considered. Excluded from our calculations, for example, were all of the Google personnel
and operations that support the data centers but are not located on a data center campus
(e.g., all personnel based in California). Moreover, we did not consider the manufacturing
impacts associated with the equipment placed into service at the data centers. We used this
conservative methodology to more clearly illustrate how Google data centers directly impact
the communities and states where they are located.
Google data centers provide important local spillover effects to their host communities. Within a few years of a data center opening, most communities experienced employment gains (beyond those at the data center itself) or increases in the number of college-educated residents. According to research conducted by OxfordEconomics,eachofthesebenefitswasspurredbyGoogle’sdecisiontolocateadatacenterinthatcommunity.Moreover,itislikelythatthesebenefitspersistandcontinuetogrowbeyondthefirstfewyearsofthedatacenter’sopening.Infact,thecasestudiesincluded in this report provide anecdotal evidence from the communities themselves that supports this hypothesis.
Google’s commitment to long-term renewable energy has spurred economic gains in additiontotheenvironmentalbenefitsthathaveresultedfromtheprogram.Specifically,because of Google’s clean energy commitment, $2.1 billion was invested in eight new renewable energy projects. The construction of these projects created more than 2,800 (temporary) construction jobs. Moreover, the ongoing operation and maintenance of these projects requires the support of an estimated 70 full-time positions.
Google’s $10.5 billion investment in and the operation of its six data center campuses bring significantdirectbenefittothecommunitiesinwhichtheyoperatebyincreasingjobs,income,and economic activity at the state and local levels. Moreover, most counties experience further increases in employment growth or the number of college-educated residents because of Google’s decision to open a data center there. As reported by the communities themselves, Google’s presence helps ensure that the next generation of community residents are prepared to meet tomorrow’s challenges and opportunities.
26 | GOOGLE DATA CENTERS: ECONOMIC IMPACT AND COMMUNITY BENEFIT
APPENDIX A: ECONOMIC IMPACT METHODOLOGY
DISCUSSION OF KEY ASSUMPTIONS
Reliance on the IMPLAN7 default profile:Whileagreatdealofreal-worlddetailspecifictoeach data center could be incorporated into the model, this was not the approach followed. Instead, in most instances, Google data centers were assumed to resemble the national defaultprofilefordatacentersthatisultimatelyderivedfromU.S.BureauofEconomicAnalysis (BEA) data (NAICS code 518210). The Google project team expressed concern thattoomuchspecificdataregardingdatacenterinputsmightrevealtoomuchproprietaryinformation regarding the operation of the data center. Only two pieces of information specifictoeachdatacenterwereusedasthebasisofourcalculations:employmentand utility consumption. These two metrics allowed us to make reasonable assumptions regarding the size of the data center. Our assumptions regarding employment at each data center were explicitly reported in the results of our calculations as the direct employment at that data center. Our assumption regarding electricity consumption, although explicit in our calculations, was not explicitly reported out. Instead, the estimated electricity consumption was an important, but not the only, contributor to the indirect impacts that were reported for each data center.
Construction at data centers: We were provided with the cumulative construction hours spent at each data center from inception to the present. These hours were annualized over the life of each data center to give us an average amount of people-years spent on construction throughout the life of the data center. Again, this was used along with sector-specificeconomicdatafromBEAtodevelopaprofileoftheeconomicactivity(weassumed half the hours were construction of new commercial structures and half repair and maintenance of existing commercial structures). This average annual construction activity was then treated as a recurring input at each data center. This approach was utilized becauseweknowthatthereareburstsofsignificantconstructionactivityfromtimetotime at each data center, and we wanted to capture an average, understanding that some amount of this activity will occur annually.
7 IMPLAN is an input-output modeling system used to build models at various levels of geography, including national and state. It allows for adjustable assumptions of supply-chain connections and leakages from survey input data and improved accuracy of assumptions. All data are presented in 2016 values. IMPLAN is widely used and recognized by government organizations, nonprofits, economic development organizations, workforce planners, education institutions, and consultants across the U.S. and Canada.
GOOGLE DATA CENTERS: ECONOMIC IMPACT AND COMMUNITY BENEFIT | 27
Personnel: We were provided full-time equivalents (FTEs) and payroll information on the direct employees assigned to each data center and the annual amount spent on third-party contractors who are also assigned to each data center. In our model and the results that we report, we treated the contract and the direct Google employees in the same way to reflectthat,takentogether,wehaveanaccurateestimateofthenumberoffull-timeworkersemployed in each data center.
Renewable: We were provided the one-time overall development cost of each renewable generation facility (seven wind and one solar). We obtained a detailed breakout of a typical wind farm development (see footnote 6). Overall, the breakout was as follows:
• Equipment 78.8%
• Materials (e.g., construction) 13.2%
• Labor 5.5%
• Other (e.g., easements, legal) 2.5%
Labor was embedded in other categories as well, and when all sources were considered, 14.9% of overall project costs were attributed to labor (and this constitutes the most input used in our renewable energy calculations). All equipment was treated as imported.
Equipment: 100% of all business personal property (e.g., computer equipment) placed in service within the four walls of each data center was assumed to be imported. Notably, this is at odds with the IMPLAN default tables, which would suggest that local (U.S.) domestic manufacturing content for many of these components is more than 50%. This assumption likely reduces the national impacts by substantially more than it does most of the states involved. However, in the IMPLAN default tables, most equipment is considered capital ratherthanoperationalspendinganyway,andsothishadarelativelyminoreffect(giventhatwedidnotscaleupthemodeltoreflectGoogle’sactualinvestmentinthiscategory).Overall,our key objective in disregarding any domestically produced manufacturing content was to keep results conservative and limited to only activity occurring with the data center facility.
MORE ON THE INPUT-OUTPUT MODEL
Oxford Economics utilized IMPLAN software to calculate the economic impacts presented in thesenotes.TheIMPLANmodelwasadjustedsomewhattomatchGoogle’sspecificdirectand supply chain spend, using what IMPLAN refers to as an analysis by parts. For example, ourassumptionsregarding0%domesticcontent,describedabove,neededtobereflectedin the input model tables used to calculate results.
For each state with a data center, separate models were run for operational impacts and for construction impacts. Where applicable, models were also run for renewable energy operations and construction.
28 | GOOGLE DATA CENTERS: ECONOMIC IMPACT AND COMMUNITY BENEFIT
• The operational model was based primarily on Google-provided data on employment and compensation of Google employees and additional compensation for contract employees. Contractors were assumed to have the same average salary and were added to the employment totals of direct employees. This employment number was the primary scaler used to estimate data center size. We generally used IMPLAN defaults for data centers (i.e. on a per-worker basis) with the following exceptions:
à The amount of estimated electricity Google reports using is much greater than the IMPLAN defaults for this industry. We thus scaled up the energy consumption.
à Because contract workers were treated as direct employees, we also excluded inputs from employment services. Finally, we excluded spending on leasing of intangible assets.
• As discussed above, total construction hours were annualized, converted to FTEs, and ultimately to IMPLAN employment. Construction impacts were scaled to construction employment and were split evenly between construction of new commercial structures and maintenance and repair of nonresidential structures.
• Renewable energy operational impacts were based on energy employment provided by Google. FTE employment was adjusted to IMPLAN employment and used as a scaling factor for solar (NAICS 221114) or wind (NAICS 221115) power as appropriate.
• Renewable energy construction impacts were calculated by assigning a percentage of overall capital spending to construction activities on the renewable plant, as discussed earlier in this report.8 This was applied to NAICS 233240, construction of new power and communication structures.
8 Per Google’s request, the precise percentages applied is withheld from publication to protect confidential data.
GOOGLE DATA CENTERS: ECONOMIC IMPACT AND COMMUNITY BENEFIT | 29
APPENDIX B: STATE ECONOMIC IMPACT DETAIL
GEORGIA
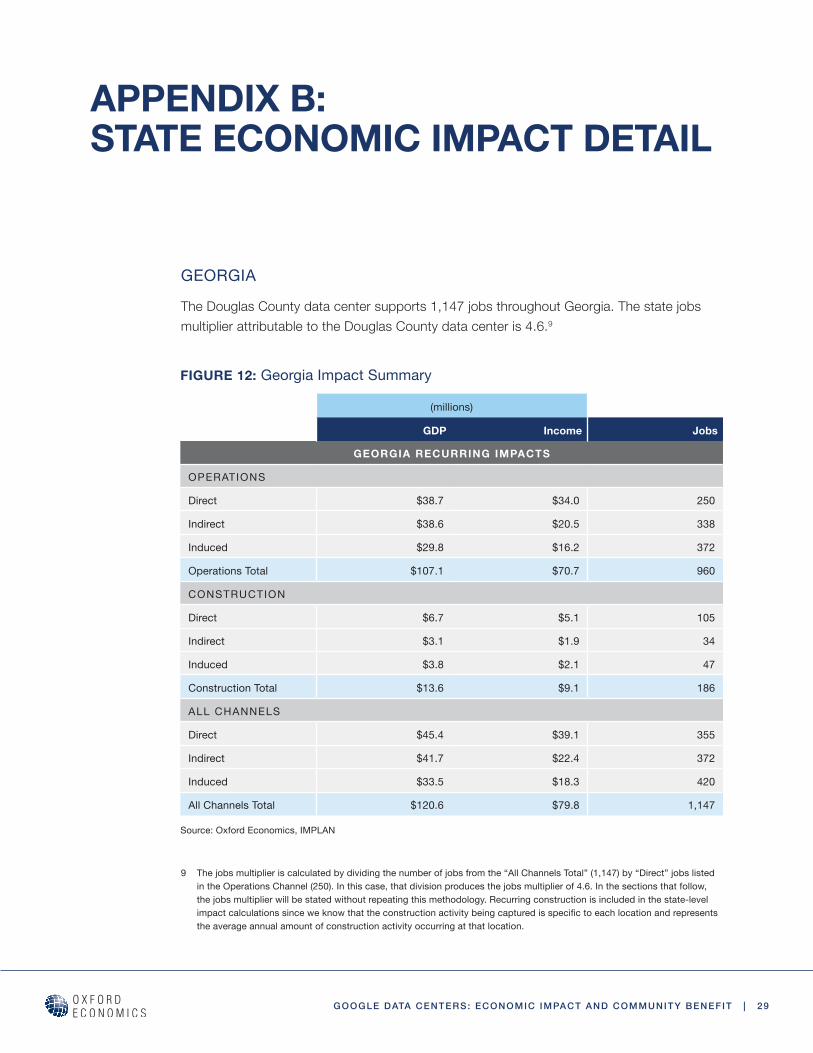
The Douglas County data center supports 1,147 jobs throughout Georgia. The state jobs multiplier attributable to the Douglas County data center is 4.6.9
9 The jobs multiplier is calculated by dividing the number of jobs from the “All Channels Total” (1,147) by “Direct” jobs listed in the Operations Channel (250). In this case, that division produces the jobs multiplier of 4.6. In the sections that follow, the jobs multiplier will be stated without repeating this methodology. Recurring construction is included in the state-level impact calculations since we know that the construction activity being captured is specific to each location and represents the average annual amount of construction activity occurring at that location.
FIGURE 12: Georgia Impact Summary
(millions)
GDP Income Jobs
GEORGIA RECURRING IMPACTS
OPERATIONS
Direct $38.7 $34.0 250
Indirect $38.6 $20.5 338
Induced $29.8 $16.2 372
Operations Total $107.1 $70.7 960
CONSTRUCTION
Direct $6.7 $5.1 105
Indirect $3.1 $1.9 34
Induced $3.8 $2.1 47
Construction Total $13.6 $9.1 186
ALL CHANNELS
Direct $45.4 $39.1 355
Indirect $41.7 $22.4 372
Induced $33.5 $18.3 420
All Channels Total $120.6 $79.8 1,147
Source: Oxford Economics, IMPLAN
30 | GOOGLE DATA CENTERS: ECONOMIC IMPACT AND COMMUNITY BENEFIT
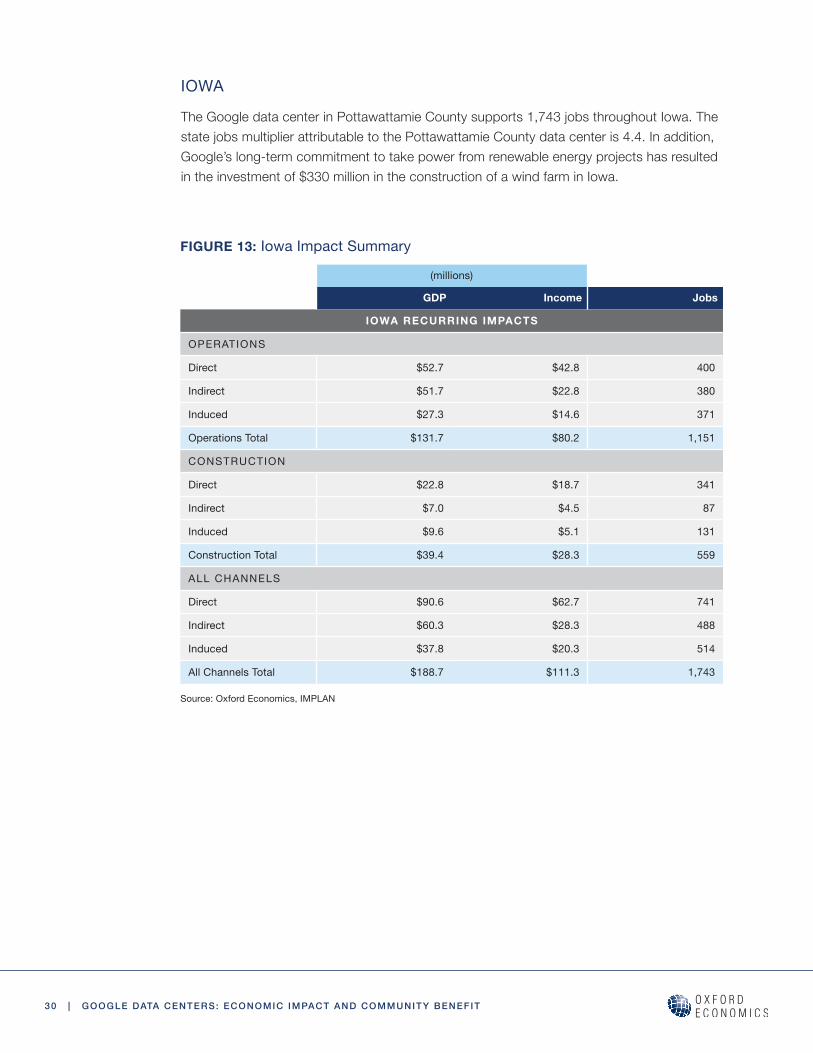
IOWA
The Google data center in Pottawattamie County supports 1,743 jobs throughout Iowa. The state jobs multiplier attributable to the Pottawattamie County data center is 4.4. In addition, Google’s long-term commitment to take power from renewable energy projects has resulted in the investment of $330 million in the construction of a wind farm in Iowa.
FIGURE 13: Iowa Impact Summary
(millions)
GDP Income Jobs
IOWA RECURRING IMPACTS
OPERATIONS
Direct $52.7 $42.8 400
Indirect $51.7 $22.8 380
Induced $27.3 $14.6 371
Operations Total $131.7 $80.2 1,151
CONSTRUCTION
Direct $22.8 $18.7 341
Indirect $7.0 $4.5 87
Induced $9.6 $5.1 131
Construction Total $39.4 $28.3 559
ALL CHANNELS
Direct $90.6 $62.7 741
Indirect $60.3 $28.3 488
Induced $37.8 $20.3 514
All Channels Total $188.7 $111.3 1,743
Source: Oxford Economics, IMPLAN
GOOGLE DATA CENTERS: ECONOMIC IMPACT AND COMMUNITY BENEFIT | 31
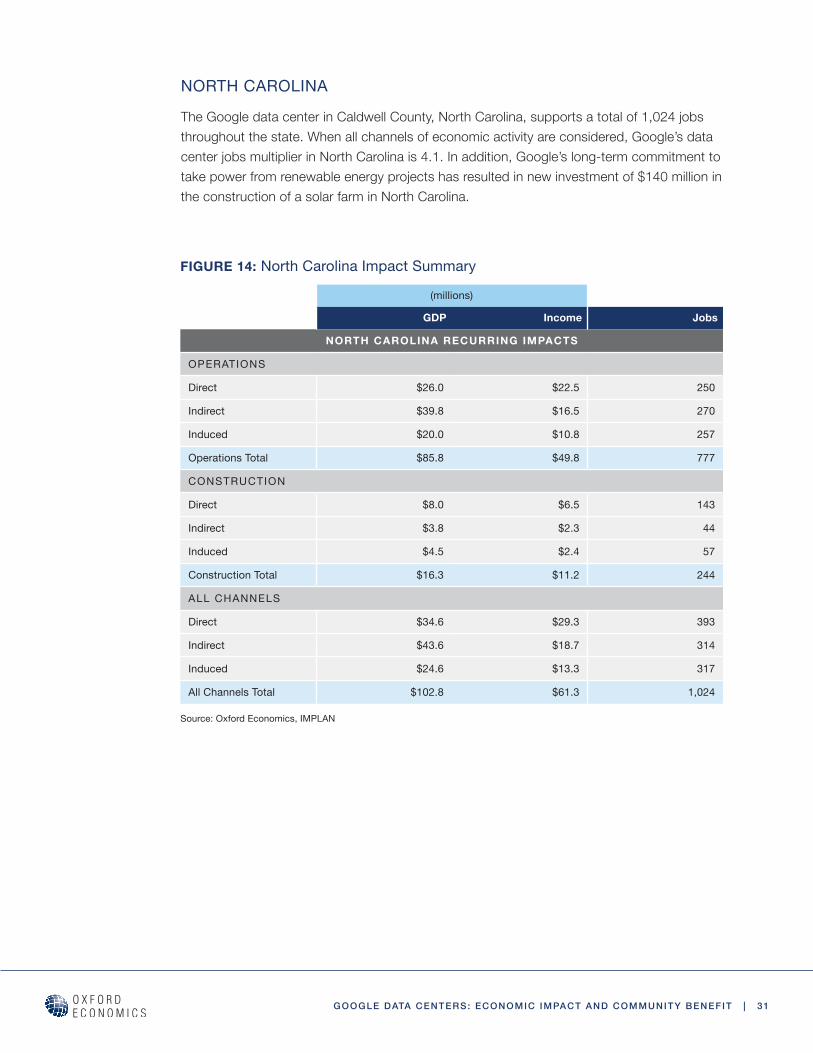
NORTH CAROLINA
The Google data center in Caldwell County, North Carolina, supports a total of 1,024 jobs throughout the state. When all channels of economic activity are considered, Google’s data center jobs multiplier in North Carolina is 4.1. In addition, Google’s long-term commitment to take power from renewable energy projects has resulted in new investment of $140 million in the construction of a solar farm in North Carolina.
FIGURE 14: North Carolina Impact Summary
(millions)
GDP Income Jobs
NORTH CAROLINA RECURRING IMPACTS
OPERATIONS
Direct $26.0 $22.5 250
Indirect $39.8 $16.5 270
Induced $20.0 $10.8 257
Operations Total $85.8 $49.8 777
CONSTRUCTION
Direct $8.0 $6.5 143
Indirect $3.8 $2.3 44
Induced $4.5 $2.4 57
Construction Total $16.3 $11.2 244
ALL CHANNELS
Direct $34.6 $29.3 393
Indirect $43.6 $18.7 314
Induced $24.6 $13.3 317
All Channels Total $102.8 $61.3 1,024
Source: Oxford Economics, IMPLAN
32 | GOOGLE DATA CENTERS: ECONOMIC IMPACT AND COMMUNITY BENEFIT
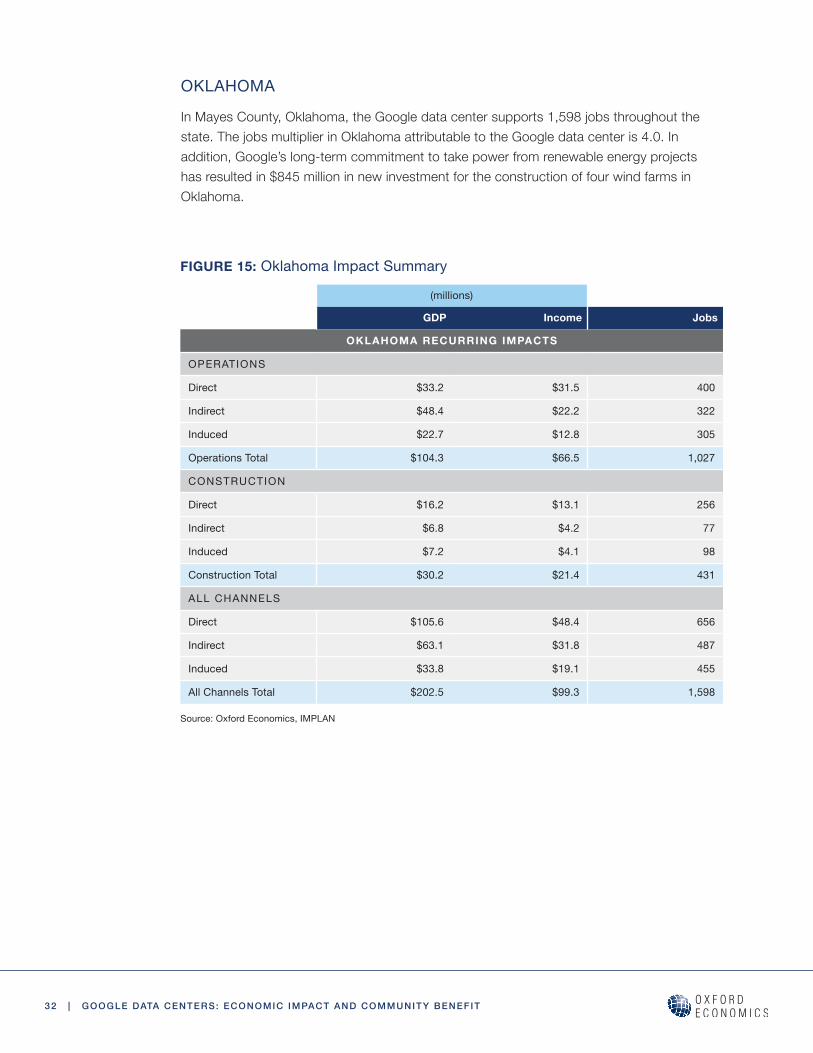
OKLAHOMA
In Mayes County, Oklahoma, the Google data center supports 1,598 jobs throughout the state. The jobs multiplier in Oklahoma attributable to the Google data center is 4.0. In addition, Google’s long-term commitment to take power from renewable energy projects has resulted in $845 million in new investment for the construction of four wind farms in Oklahoma.
FIGURE 15: Oklahoma Impact Summary
(millions)
GDP Income Jobs
OKLAHOMA RECURRING IMPACTS
OPERATIONS
Direct $33.2 $31.5 400
Indirect $48.4 $22.2 322
Induced $22.7 $12.8 305
Operations Total $104.3 $66.5 1,027
CONSTRUCTION
Direct $16.2 $13.1 256
Indirect $6.8 $4.2 77
Induced $7.2 $4.1 98
Construction Total $30.2 $21.4 431
ALL CHANNELS
Direct $105.6 $48.4 656
Indirect $63.1 $31.8 487
Induced $33.8 $19.1 455
All Channels Total $202.5 $99.3 1,598
Source: Oxford Economics, IMPLAN
GOOGLE DATA CENTERS: ECONOMIC IMPACT AND COMMUNITY BENEFIT | 33
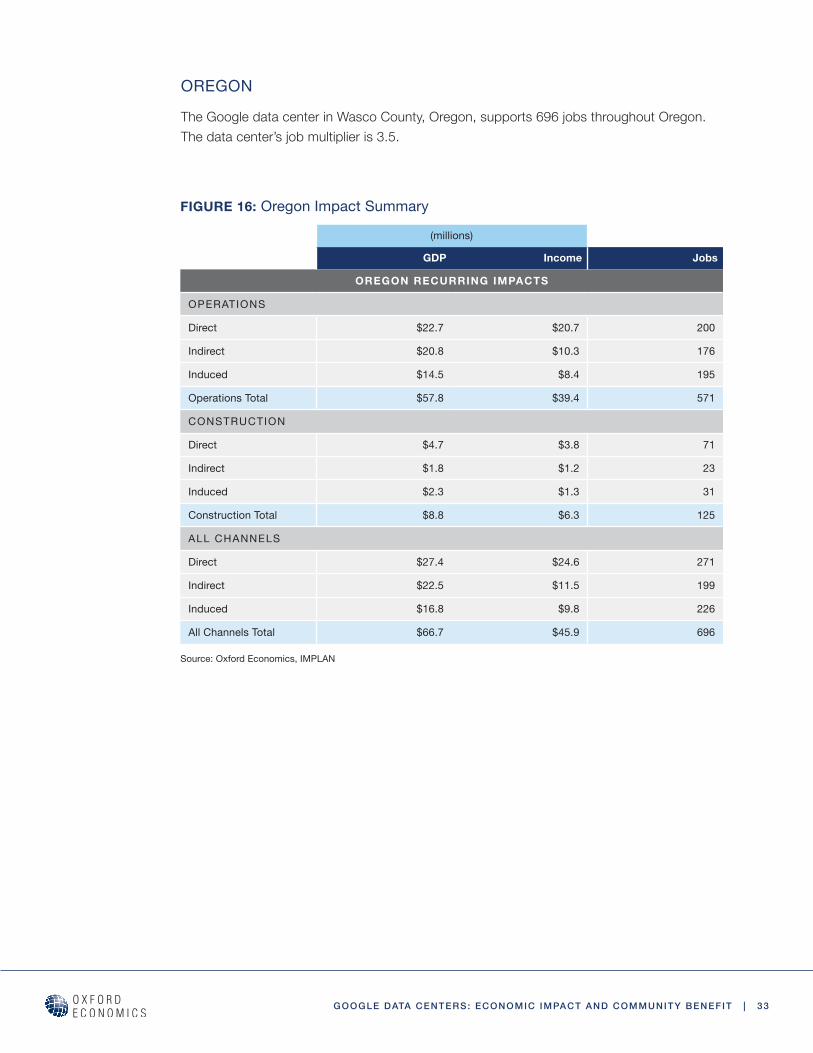
OREGON
The Google data center in Wasco County, Oregon, supports 696 jobs throughout Oregon. The data center’s job multiplier is 3.5.
FIGURE 16: Oregon Impact Summary
(millions)
GDP Income Jobs
OREGON RECURRING IMPACTS
OPERATIONS
Direct $22.7 $20.7 200
Indirect $20.8 $10.3 176
Induced $14.5 $8.4 195
Operations Total $57.8 $39.4 571
CONSTRUCTION
Direct $4.7 $3.8 71
Indirect $1.8 $1.2 23
Induced $2.3 $1.3 31
Construction Total $8.8 $6.3 125
ALL CHANNELS
Direct $27.4 $24.6 271
Indirect $22.5 $11.5 199
Induced $16.8 $9.8 226
All Channels Total $66.7 $45.9 696
Source: Oxford Economics, IMPLAN
34 | GOOGLE DATA CENTERS: ECONOMIC IMPACT AND COMMUNITY BENEFIT
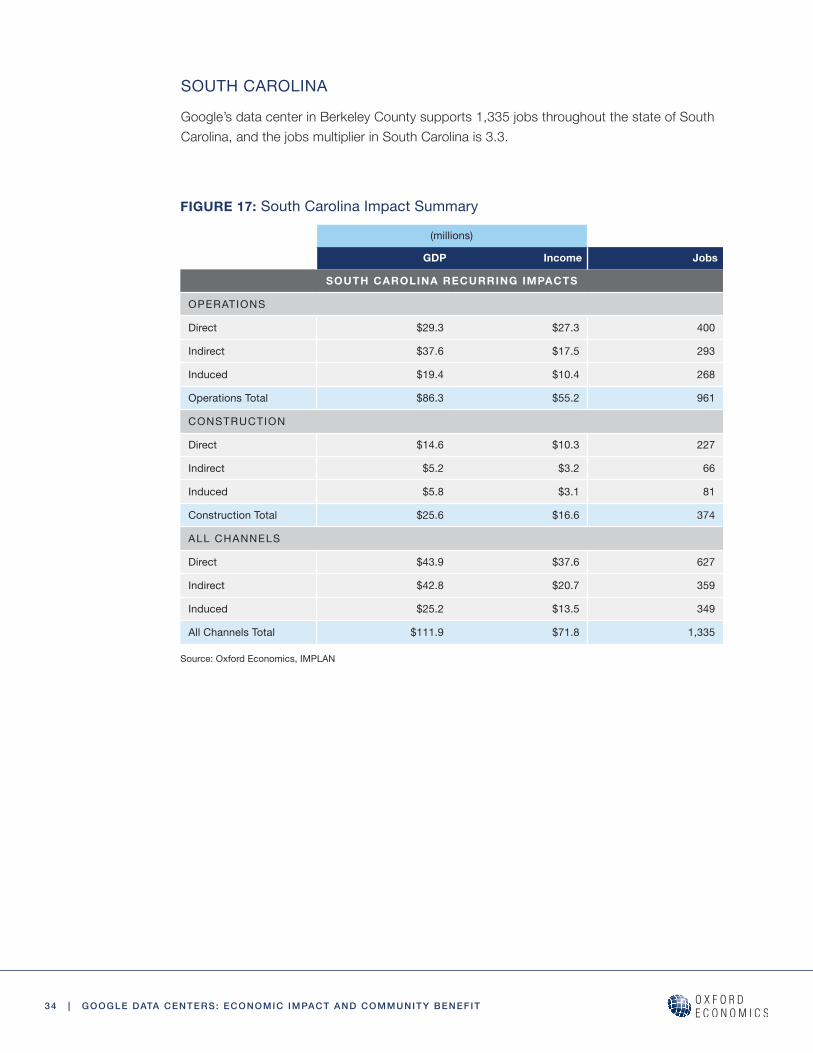
SOUTH CAROLINA
Google’s data center in Berkeley County supports 1,335 jobs throughout the state of South Carolina, and the jobs multiplier in South Carolina is 3.3.
FIGURE 17: South Carolina Impact Summary
(millions)
GDP Income Jobs
SOUTH CAROLINA RECURRING IMPACTS
OPERATIONS
Direct $29.3 $27.3 400
Indirect $37.6 $17.5 293
Induced $19.4 $10.4 268
Operations Total $86.3 $55.2 961
CONSTRUCTION
Direct $14.6 $10.3 227
Indirect $5.2 $3.2 66
Induced $5.8 $3.1 81
Construction Total $25.6 $16.6 374
ALL CHANNELS
Direct $43.9 $37.6 627
Indirect $42.8 $20.7 359
Induced $25.2 $13.5 349
All Channels Total $111.9 $71.8 1,335
Source: Oxford Economics, IMPLAN
GOOGLE DATA CENTERS: ECONOMIC IMPACT AND COMMUNITY BENEFIT | 35
APPENDIX C: REGRESSION METHODOLOGY
DIFFERENCE-IN-DIFFERENCES MODEL
To estimate the impact of Google data centers on local (county-level) economies, we used aDifference-in-Differences(DiD)econometricapproach.Wetaketworegions(AandB)withsimilarcharacteristicssuchthateveniftheirmagnitudeisdifferentandchangesovertime,thedifferencesbetweenthemarestableovertime(paralleltrendsassumption).Atagiven time, a Google data center locates in region A (we call that a treated region) and not inregionB(controlregion)andchangesthegrowthofregionA.Thedifferenceinthepost-eventdifferencesingrowthratesbetweenthetworegionsreflectsthegrowthimpactofthedata center.10Inotherwords,onlycountiesthatwereunaffectedbyaGoogledatacenterwere eligible for inclusion in the control group.
HOW THE CONTROL GROUP WAS CHOSEN
Findingtwoidenticalregionstoreplicateaperfectlycontrolledexperimentisdifficultbecause regions can vary in dimensions that are not measurable or observable. If these non-measurable or observable features of the control vary systematically to those of the treated, then the impacts found will not be due to the event we are examining but to these unaccounteddifferences.Below,wedescribetheelementsinourapproachthatensureourestimation of the economic impact is as robust as possible.
The regions used in the control group were selected to ensure they are as similar as possible to the treated regions (regions where data centers are located). The control group is designed to approximate counties that Google might select for a data center if the company were to undertake a site selection search today based upon the characteristics of counties previously selected. An examination of the existing county locations revealed several “rules” derived from publicly available data that were then applied to all counties in the lower 48 states. These rules were:
• Always locate in a state that allows sales tax exemptions for data center projects.
• Never locate more than 85 miles from a mid-to-large-sized metropolitan area.
• Never locate in a state with above average commercial electric rates.
10 Angrist, Joshua, and Pischke, Jörn-Steffen. Mostly Harmless Econometrics: An Empiricist’s Companion. Princeton University Press, 2009.
36 | GOOGLE DATA CENTERS: ECONOMIC IMPACT AND COMMUNITY BENEFIT
• Never locate in a state that is principally desert or abnormally dry (based upon average annual rainfall).
• Never locate in a county with more than 250,000 people.
• Never locate in a state that already hosts a Google data center.
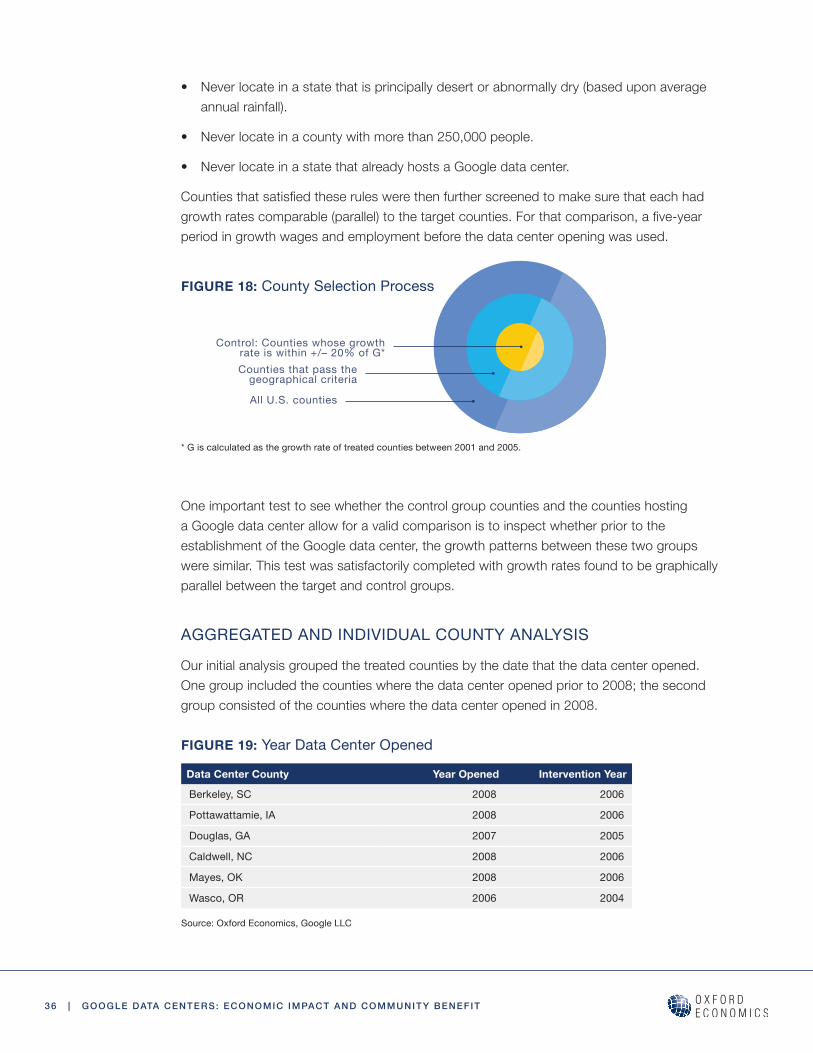
Countiesthatsatisfiedtheseruleswerethenfurtherscreenedtomakesurethateachhadgrowthratescomparable(parallel)tothetargetcounties.Forthatcomparison,afive-yearperiod in growth wages and employment before the data center opening was used.
One important test to see whether the control group counties and the counties hosting a Google data center allow for a valid comparison is to inspect whether prior to the establishment of the Google data center, the growth patterns between these two groups were similar. This test was satisfactorily completed with growth rates found to be graphically parallel between the target and control groups.
AGGREGATED AND INDIVIDUAL COUNTY ANALYSIS
Our initial analysis grouped the treated counties by the date that the data center opened. One group included the counties where the data center opened prior to 2008; the second group consisted of the counties where the data center opened in 2008.
FIGURE 18: County Selection Process
FIGURE 19: Year Data Center Opened
Data Center County Year Opened Intervention Year
Berkeley, SC 2008 2006
Pottawattamie, IA 2008 2006
Douglas, GA 2007 2005
Caldwell, NC 2008 2006
Mayes, OK 2008 2006
Wasco, OR 2006 2004
Source: Oxford Economics, Google LLC
* G is calculated as the growth rate of treated counties between 2001 and 2005.
Control: Counties whose growth rate is within +/– 20% of G*Counties that pass the
geographical criteria
All U.S. counties
GOOGLE DATA CENTERS: ECONOMIC IMPACT AND COMMUNITY BENEFIT | 37
The use of the two groups allowed for a comparison of the average of treated regions with the average of several control regions. The averaging of the growth rates before and after the presence of the data center also reduced the chance that we erroneously attributed the change in the growth rates to Google when it more likely was the consequence of some other event or shock (such as another simultaneous investment). The risk of this type of error isreducedbecauseevenifthatisthecaseforonecounty,theeffectshouldbeaveragedoutwhen we look at the group’s growth.
After completing our analysis of grouped counties, we turned to an examination of the treated counties individually. Individual county tests are trickier because this necessitates the selectionofacontrolgroupappropriatetoeachspecifictargetcounty.Insomecases,thatwas not possible. In those instances, a synthetic control method was used instead of the difference-in-differencesmethod.
Thesyntheticcontrolmethodbuildsanartificialcounterfactualusingallthecountiesselectedfor the control group and assigning weights to each according to how similar it is to the target county before the data center was built. The trajectory of the target county is then compared to that of this synthetic control after the data center is built. To verify that any differencefoundissignificant,weapplythissyntheticcontrolmethodtoallthecounties(treated and control) and check whether the post-data center trajectory of the treated is significantlydifferentfromthatofthecontrols.
OUTCOME VARIABLES AND THE INTERVENTION PERIOD
Using data from the Bureau of Labor Statistics (Quarterly Census of Employment and Wages) for the years 2001-2015, the following outcome variables were examined for each county:
• Total annual wages
• Annual average of quarterly employment
• Annual average weekly wages
Ofthese,significantresultswereestablishedforannualwagesandannualaverageofquarterly employment. Arithmetically, it is not surprisingly that having found a positive influenceonthelevelofemployment,wealsofoundapositiveinfluenceonthelevelofoverall wages. Other things being equal, if more people are working in a county, then one would expect that cumulative county wages would also increase.
Activity surrounding the actual opening of the data center starts well in advance of the opening date. For example, site assemblage, acquisition, infrastructure preparation, and construction activity of the facility itself all obviously occur in advance of opening. In our statistical examination, we found that an intervention period beginning two years prior to the officialopeningyearsatisfactorilyaccountedforthispre-openingactivity.
38 | GOOGLE DATA CENTERS: ECONOMIC IMPACT AND COMMUNITY BENEFIT
ROBUSTNESS TESTS
The following methods were used to verify robustness of results:
• Placebo Tests: Two types of placebo tests were successfully completed, as follows:
1. We re-estimated the model by falsely modifying the time when the data centers were built.TheDiDmodelbasedonthemade-upeventsshouldnotfindanysignificantdifferencesbetweenthetreatmentandcontrolgroupsunlessthereareanyeventsnot related to the data centers present in the data. The placebo tests are important forgivingusconfidencethatthecontrolandtreatedgroups(counties)werenotexperiencingdifferencesingrowthratespriortotheinterventionperiod.
2. Prior to estimating the impact of the data centers, we graphically plotted and inspected growth trend lines to visually validate the parallel trends assumption.
• Dummy Regressions: We regressed the growth of wage or employment on a dummy equal to one if a county is in the treated group for the period prior to the intervention. This is to check whether the counties in the treatment and control groups are growing at statistically similar rates with respect to the variables of interest prior to Google’s decision tooperateinthesites.Wewantthedummyinthatregressiontobeinsignificantforthetwogroups(treatedandcontrol)toestablishthattherearenostatisticallysignificantdifferences.
• Estimation Procedure: Weestimatedthemodelusingfixedeffects.Fixedeffectsestimation controls for the bias that time-invariant characteristics might cause.

GOOGLE DATA CENTERS: ECONOMIC IMPACT AND COMMUNITY BENEFIT | 39
Update this with your document title
24