good practice guidelines on urban traffic emission...
TRANSCRIPT

www.bsc.es
Good practice guidelines on urban traffic emission compilation
Marc Guevara1, Matthias Vogt2, Leonor Tarrasón2
1 Barcelona Supercomputing Center - Centro Nacional de Supercomputación, Earth Sciences
Department, Barcelona, Spain. 2 NILU - Norwegian Institute for Air Research, Urban Environment and Industry, Kjeller, Norway.
FAIRMODE Technical Meeting
24-25 June 2015, Aveiro, Portugal

1
Urban traffic emissions
Road traffic is the emission source that
contributes most to air pollution in urban areas
Daily PM10 LV
Annual NO2 LV

2
Traffic emission models
Average-speed models
(e.g. COPERT)
Traffic-situation models
(e.g. HBEFA)
Traffic-variable models
(e.g. TEE)
Cycle-variable models
(e.g. VERSIT+)
Modal models
(e.g. PHEM)
TYPES OF MODEL (Smit et al., 2010)
Macroscopic
Microscopic
OUTPUT INPUT
Vehicle activity
Vehicle fleet
composition
Exhaust EF
f-NO2
Non-exhaust
EF
(Soret et al., 2014)
(Borge et al., 2015)

3
Current review works

4
Research questions
1) What methods are currently used to compile the input
parameters that estimate road traffic emissions?
2) What is the sensitivity of the emission results to these
parameters?
3) What are the best practices to apply when estimating
urban traffic emissions?
5
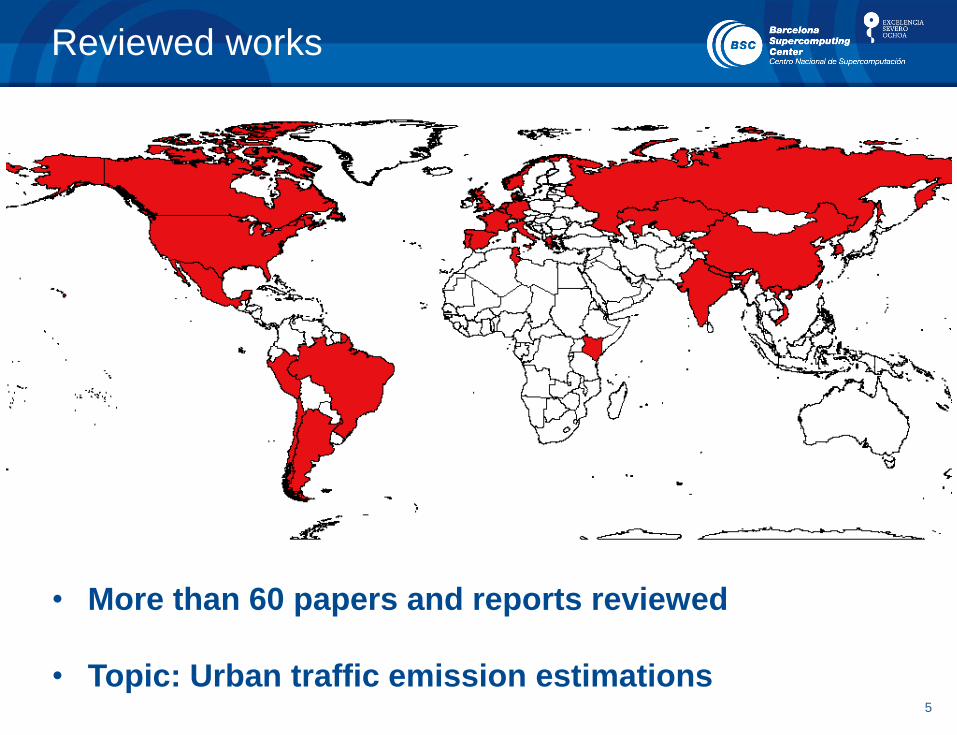
Reviewed works
• More than 60 papers and reports reviewed
• Topic: Urban traffic emission estimations

6
Vehicle activity:
Definition
Traffic volume Driving patterns

7
Vehicle activity:
Summary of works
Manual counting and
video recording Davis et al. (2005); Kassomenos et al. (2006); MoUD (2008); Gokhale et al. (2011); Ho and
Clappier (2011); Lozhkina (2015); Shrestha et al. (2013)
Automatic Traffic
Recorders
Muller-Perriand (2014); Borrego et al. (2000); Tchepel et al. (2012); Hung et al. (2010);
Guevara et al. (2013); Ariztegui et al. (2004); Pallavidino et al. (2014); Cai and Xie (2011);
Malcom et al. (2003); Baldasano et al. (2010); Tchepel et al. (2012); Muller-Perriand (2014); ;
Guevara et al. (2013); Cai and Xie (2011); Malcom et al. (2003); Baldasano et al. (2010)
Traffic Models
Brutti-mairesse et al. (2012); Thiyagarajah and North (2012); Jie et al. (2013); Samaras et al.
(2014); Nanni et al. (2010); Radice et al. (2012); Cook et al. (2008); Borge et al. (2012);
Lindhjem et al. (2012); Pallavidino et al. (2014); Nejadkoorki et al. (2008); Hatzopoulou and
Miller (2010); Borge et al. (2015); Brutti-mairesse et al. (2012); Jie et al. (2013); Samaras et al.
(2014); Cook et al. (2008); Borge et al. (2012); Nejadkoorki et al. (2008); Hatzopoulou et al.
(2010); Hirschmann et al. (2010); Bai et al. (2007); Nanni et al. (2010); Bedogni et al. (2014);
Kanaroglou et al. (2008)
Instrumented vehicles Tate et al. (2013); ISSRC studies; Oanh et al. (2012); Wang et al. (2008); LAIE (2010); Gois
and Maciel (2007); Malcom et al. (2003); MoUD (2008); Carslaw et al. (2005); LAIE (2008)
Floating car data Gühnemann et al. (2004); Yu and Peng (2013); LAEI (2010); Lin-Jun et al. (2014); Ryu et al.
(2013)

8
Vehicle activity:
Automatic traffic recorders
Guevara et al. (2013)
Limited spatial coverage (main streets)
Muller-Perriand (2014)

9
Vehicle activity:
Traffic and travel demand models Macroscopic models Microscopic models
Calibration / Validation
Driving patterns of each vehicle in
the traffic stream Traffic volume and speed
at the link level
Automatic Traffic Recorders Probe vehicle or image processing

10
Vehicle activity:
Floating car data (FCD)
Speed. Very high spatial and temporal resolution
Volume. Only equipped vehicles. But….
Collects real-time traffic state information from
individual vehicles equipped with positioning
(GPS) or cellular-based (e.g. GSM, GPRS) systems
Huber et al. (1999) Brower (2014) Gühnemann et al. (2004)

11
Vehicle activity:
Extendend Floating car data (xFCD)
Extended Floating Car Data (xFCD)
Beside the vehicle speed, there is a whole range of other operating and switching
data available in digital form on the bus systems of modern vehicles
Car’s fuel consumption
Car’s CO2 emissions
Prummer (2014) Huber et al. (1999)

12
Vehicle activity:
Sensitivity analysis
Samaras et al. (2013)
Brutti-Mairesse et al. (2012)
flat curves

13
Vehicle fleet composition:
Definition
• Type of fuel consumed
• Engine capacity
• Emission control regulation
• After treatment technology
• Manufacturer
Franco et al. (2014)

14
Vehicle fleet composition:
Summary of works
Official vehicle registration data
Yan et al., 2011; Pandey et al. (2014); Zheng et al. (2014); Kassomenos
et al. (2006); Radice et al. (2012); Cook et al. (2008); Pallavidino et al.
(2014); D’Angiola et al. (2010); Coelho et al. (2014); Zamboni et al.
(2009); Nejadkoorki et al. (2008); Caserini et al. (2013); Souza et al.
(2013)
Vehicle owner and parking lot
surveys
Davis et al. (2005); Wang et al. (2008); ; Malcom et al. (2003); Oanh et al.
(2012); Ho and Clappier (2011); Gois and Maciel (2007); Ariztegui et al.
(2004)
Remote sensing devices (RSD) Tate et al. (2013); Ko and Cho (2006); Aguilar-Gómez et al. (2009), AB
(2010); Guevara et al. (2013); Borge et al. (2012)
Automatic Number Plate
Recognition (ANPR) data Eijk (2012); AM (2014); LAIE (2010); Bedogni et al. (2014); Borge et al.
(2015)

15
Vehicle fleet composition:
Official vehicle registration data
Corrections can improve the representativeness
Not based on real circulation data
Dropping
functions
Limited
Traffic Zones
Caserini et al. (2013)
Radice et al. (2012)
16
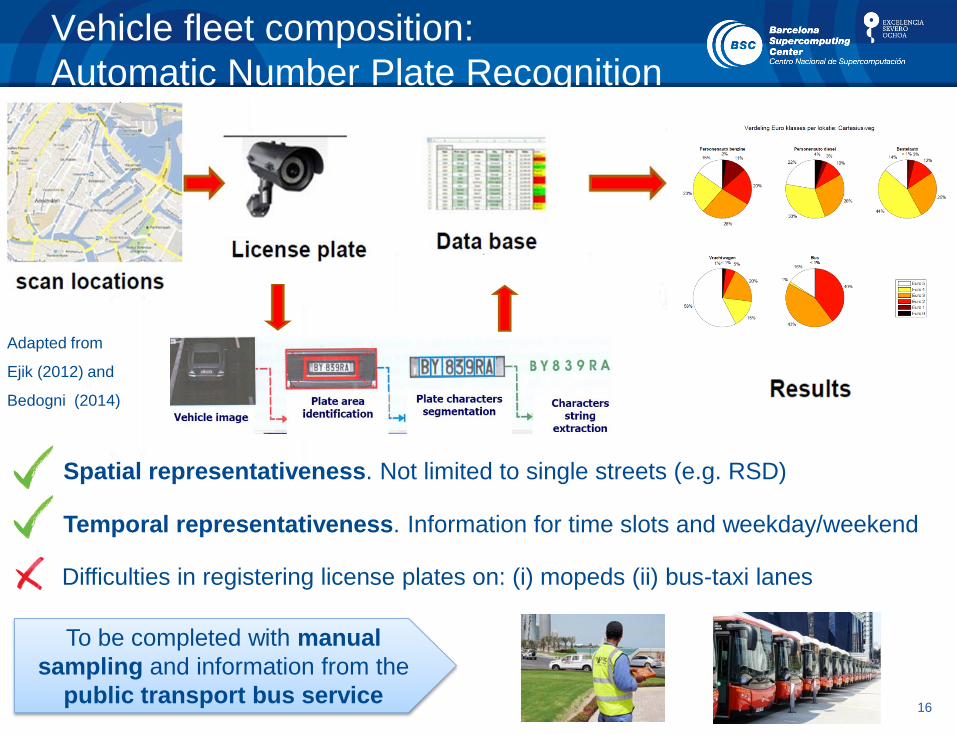
Vehicle fleet composition:
Automatic Number Plate Recognition
Spatial representativeness. Not limited to single streets (e.g. RSD)
Temporal representativeness. Information for time slots and weekday/weekend
Difficulties in registering license plates on: (i) mopeds (ii) bus-taxi lanes
To be completed with manual
sampling and information from the
public transport bus service
Adapted from
Ejik (2012) and
Bedogni (2014)

17
Vehicle fleet composition:
Sensitivity analysis
Temporal resolution
Registration vs circulating data
Malcom et al. (2003)
Lindhjem et al. (2012) Wang et al. (2010)

18
f-NO2:
Summary of works
5% Ambient monitoring data
Tunnel measurements
Dynamometer
measurements
Portable Emission
Measurement Systems
Remote sensing
devices
Fleet-weighted value and
influence of other species
Based on limited tests/vehicles
Thousands of vehicles
scanned within a day under
“real-driving” conditions
Boulter et al. (2007)
Abbot et al. (2005)
McClintock (2007)
Soltic et al. (2003)
Franco et al. (2014)

19
f-NO2:
Remote Sensing Devices
Carslaw and Rhys-Tyler (2013)

20
f-NO2:
Databases
Vehicle type Fuel/type Euro class Carslaw and Rhys-Tyler (2013) EEA (2013)
Passenger
car Gasoline
pre-Euro 0.6±0.4 4
Euro 1 1.3±0.6 4
Euro 2 1,4±0.4 4
Euro 3 2,1±0.5 3
Euro 4 4,1±0.7 3
Euro 5 8,4±3 3
Euro 6 - 3
Passenger
car Diesel
pre-Euro 15,3±5 15
Euro 1 13,7±3.3 13
Euro 2 8,7±0.9 13
Euro 3 16,3±0.8 27
Euro 4 28,4±0.9 46
Euro 5 25,2±0.9 33
Euro 6 - 30

21
Best practices
Vehicle fleet
composition
Remote Sensing
Devices
Automatic
Number Plate
Recognition Vehicle registration
information
Traffic and travel
demand models
Vehicle
activity
Automatic Traffic
Recorders
Floating car data
Manual counting
or video recording
Instrumented vehicles
f-NO2

22
Conclusions
Vehicle activity: TDM calibrated/validated or ATR
Limited spatial coverage and spatial resolution
Diffusion of in-car navigators: FCD
Privacy concerns (eCall)
Big data concerns (large amount of data to process)
Vehicle fleet composition: Automatic Number Plate Recognition data
Detailed information on vehicles (manufacturer, after-treatment tech)
Increase of European urban mobility policies (LEZ)
f-NO2: in-situ measurements with RSD (Carslaw and Rhys-Tyler, 2013)
Taxis and urban buses: Separated treatment
Limited literature relating to sensitivity studies
xFCD: spatial referencing of real, non-modelling based fuel consumption
data of vehicles
