good design is not enough 20 cm subgrade strength · good design is not enough ... 1961 the aasho...
TRANSCRIPT

2013 IJPC Paper 160-2
© Copyright 2013 IJPC − International Journal of Pavements Conference, São Paulo, Brazil Page 1
PAVEMENT DESIGN OR PAVEMENT MANAGEMENT?
GOOD DESIGN IS NOT ENOUGH
Waheed Uddin
Director, Center for Advanced Infrastructure Technology (CAIT), the University of Mississippi, USA
Ralph Haas
Professor Emeritus, University of Waterloo, Waterloo, Ontario, Canada N2L 3G1
W. Ronald Hudson *
* DeWitt C. Green Professor Emeritus, University of Texas, Senior Consultant, AgileAssets, Inc.
3001 Bee Caves Road, Austin, Texas 78746, USA [email protected]
ABSTRACT: Design is only one of many factors in providing good, economical pavement performance, albeit
an important starting place. Engineers keep seeking the elusive, perfect mechanistic pavement design method as
the “Total Solution,” to providing good pavements as evidenced by the US $15 million spent on the Mechanistic
- Empirical Pavement Design Guide (MEPDG) and more money needed for calibration in the USA. No matter
how good the design method, perfect results are not possible because of variability in materials, testing,
construction, the environment, traffic, etc. What is worse, almost all variability observed in the field after design
is on the negative side, providing less performance than expected. The paper puts these efforts into perspective
for conference attendees and readers and redefines good Pavement Management principles as the desired long
term solution which can also accommodate new directions like sustainability, climate effects, related new
materials, and other new factors as they arise.
KEY WORDS: Pavement design, management, performance, design life, rehabilitation, maintenance
1. INTRODUCTION
Since the first Roman roads were built over 2,300 years ago, design of pavement thickness and material selection
has been of primary concern. In 1935, Mr. O. J. Porter of the California Highway Department codified the
thickness design of pavements in the California Bearing Ratio (CBR) method [1]. During World War II, Mr.
Porter joined the US Corp of Engineers as a Colonel and adapted his CBR method for the design of airfield
pavements. Many people think the CBR method contributed as much as anything to winning the World War II
since nearly all forward airfields were designed using this CBR method.
Figure 1. The basics of the CBR method
CBR Design Chart
Pa
vem
ent
Th
ick
nes
s
Subgrade Strength
Increasing
loads
20 cm
40 cm

2013 IJPC Paper 160-2
© Copyright 2013 IJPC − International Journal of Pavements Conference, São Paulo, Brazil Page 2
Figure 1 shows the basics of the CBR method which used three main variables, traffic loads, subgrade strength,
and total pavement thickness. The CBR method became the world’s pavement design method for all flexible
pavements until the early 1960s. The Westergaard equations served as the major design method for the worlds
Portland cement concrete pavements for 50 years until about 1962 and continued to be recommended by the
Portland Cement Concrete Association and others after that [1].
From 1958 – 1961 the AASHO Road Test, a $30 million designed experiment was conducted and showed
conclusively that the strength of base and subbase layers was important to the performance of pavements [2,3].
Such strength was not included as part of the CBR method. As a result of the Road Test, the first AASHO
Pavement Design Method was produced. Dr. Hudson, a co-author of this paper [3], had the benefit and pleasure
to serve at that Road Test and also helped prepare the design guides themselves. These improved design methods
based on sound empirical evidence from the AASHO Road Test were used to design many heavy duty
pavements worldwide, especially the US Interstate Highway System. Even using these improved methods, these
heavy duty pavements began to fail after 8-10 years, much earlier than the design predicted, particularly on the
US Interstate Highway System but also worldwide.
Defining failure and performance requires using a simple pavement quality versus age performance curve. The
preferred method of defining quality in the US at that time was the Present Serviceability Index (PSI) using a
scale from 0 to 5, where 0 was total failure and 5 was considered a perfect pavement. Categories in-between
were very poor, poor, fair, good, and very good. It was also necessary to define a minimum required level of
serviceability (failure) which varied from 1.0 to 2.5 based on the class of highway considered. In this paper PSI
will be used to define quality on this scale of 0 to 5 and a generic minimum serviceability or quality level will
define failure (usually 1.0 to 2.5). Canada had a similar index which ranged from 0 to 10, called the riding
comfort index but which operated in the same way with each category spanned two digits, 0 to 2 very poor, 2 to
4 poor, etc. Since the 1990’s, the IRI (International Roughness Index) and the PCI (Pavement Condition Index)
have been used in the United States. In this paper we will use PSI as a measure of quality on all our graphs and
figures, 5.0 is the Best and 0.0 is the Worst, because it is easier to understand.
Figure 2 shows the expected performance for a well designed heavy duty pavement using a 20 year design
period. Figure 3 shows the actual observed performance of many heavy duty pavements in the United States
during the 1950’s and many pavements around the world today. Field observations show early deterioration (the
’s) and the extrapolated dashed line shows the expected life is less than “designed.”
0
5
20
|
_Predicted performance
(Design Life)
Failure Minimum PSI
Serviceability
PS
I
(Ser
vic
eab
ilit
y)
Years 0
5
20
|
_
Actual Observed
Feedback
Current Predicted Life|
14 Years
PS
I
(Serv
icea
bil
ity)
Failure
Design Life
Figure 2. The expected performance for
heavy duty pavement Figure 3. The actual observed performance of
heavy duty pavement

2013 IJPC Paper 160-2
© Copyright 2013 IJPC − International Journal of Pavements Conference, São Paulo, Brazil Page 3
50
25
15
10
5
ES
AL
s to
Fa
ilu
re, m
illi
on
20 22.5 25 27.5 30 cm
Surface Thickness, cm
0
50
25
15
10
5
1993 AASHTO Guide Designs for Clay/Silt Subgrade,
50 cm Subbase, 20 cm Base, Moderate Climate
ESALs to
Failure
5
million
10
million
15
million
25
million
50
million
Surface
Thickness
20 cm 22.5 cm 25 cm 27.5 cm 30 cm
2. DEVELOPMENT OF PAVEMENT MANAGEMENT SYSTEMS
In 1963-65 major research was funded by the National Cooperative Highway Research Program in the United
States involving all state DOTs to solve this premature failure problem [4]. Similar research was carried out by
Dr. Haas and his associates in Canada [5,6,7,8]. Both these studies showed that pavement design alone was not
adequate to produce required pavement performance. Although good design is certainly the first step in
providing desired performance. Design also requires accurate predictions of traffic loads and volumes, subgrade
strength, base material and surface strength, and as-constructed pavement thickness, as well as surface
smoothness. Failure to predict any and all of these factors accurately will result in early deterioration and failure.
Looking at Figure 1, a design thickness of 20 cm is shown by the solid line, but because the actual traffic loads
were heavier that predicted, the actual thickness needed is shown dashed to be 40 cm. Similar examples could
be shown where the subgrade is weaker than predicted, etc. Therefore, when the thickness required is greater
than actually built, then the pavement will also fail early. In the case of the US interstate system, most early
failures were caused by errors in predicting traffic loads accurately or were due to inadequate thickness and
materials strength resulting from efforts to get the Interstate Highway System constructed as rapidly as possible.
Inability to predict heavy traffic loads was a problem worldwide during the 1960s where rapid expansion of the
world economy after World War II resulted in a greater demand for goods, but the use of railroads declined so
that more and more heavy loads used the world’s highways.
Table 1 illustrates the effect of axle loads on thickness required for a typical design case. A 25 cm thick surface
for weak subgrade will carry 15 million Equivalent Single Axle Loads (ESALs) but a 20 cm thick surface will
handle only 5 million ESALs to failure. What does this mean in terms of applied axle loads? The AASHO Road
Test [2,3] showed the relative effect of heavy axles (Figure 4). If the damage of a 8,165 kg (18,000 lb) axle is
taken as 1.0 then a 10,886 kg (24,000 lb) axle will cause three times as much damage (three times as many
ESALs) as the 8,165 kg axle. Thus as illustrated in Table 1, if the designer expected primarily 8,165 kg axles
then the thickness would need to be 20 cm surface. If the average trucks are actually loaded to 10,886 kg per
heavy axle then they will produce 15 million ESALs (three times as many) and require 25 cm surface. The 20
cm surface will likely fail in seven years instead of 20 years.
Table 1. Effect of ESALs on Surface Thickness Required

2013 IJPC Paper 160-2
© Copyright 2013 IJPC − International Journal of Pavements Conference, São Paulo, Brazil Page 4
In some cases after WW II, inadequate construction due to poor quality control resulted in poor quality materials
and inadequate pavement thickness and rough surface construction which led to early failure. It only takes one
bad prediction error. This was true in both developed and developing countries. In North America and Europe
the primary causes of early failure were in most cases higher traffic volumes, heavier loads, and extreme weather
conditions, but poor construction quality in the pavement surface or low compaction and aggregate quality on
asphalt pavements also contributed. Bad construction methods on Portland cement concrete pavements,
particularly continuously reinforced concrete pavements, also produced early failure as did the use of reactive
aggregates which causes surface damage.
Figure 4. Relative effect of heavy axles
The authors have been called upon to inspect failed pavements in the US, Canada, Brazil, Argentina, as well as
in Africa. On most pavements we inspected, the in-place thicknesses were less than designed and paid for. The
asphalt concrete or Portland cement concrete was also of inferior quality in some cases with the asphalt content
or cement content being less than specified for construction. This was sometimes due to inadequate inspection
because of graft and pay-offs between the contractor and highway agency employees in some countries. In some
cases, vastly overloaded trucks were permitted to operate on the highway system and thus destroyed the
pavements prematurely. The AASHO Road Test [3] showed that a 13,608 kg (30,000 lb) axle does 10 times as
much damage to the pavement as a 8,165 kg (18,000 lb) axle. Yes, you read that correctly. Many engineers then
and now think the relationship between load and damage is linear. It is not. It is either logarithmic or a power
function as shown in Figure 4. In some cases this damage ratio is even made worse by the poor selection of
materials. In the 1970s Dr. Hudson was asked to inspect severe damage on cement treated bases in Brazil where
failure was due to heavy loads from greatly increased soybean production. There was strong pressure in those
days to use cement for road construction in Brazil because of the lack of available asphalt. These pavements
were a mixture of local soil and a very high cement content (near 10%) which caused them to crack due to
temperature change and fail in flexure under the heavy traffic loads thus causing major damage. The resulting
performance was much worse than predicted.
The NCHRP and Canadian studies cited above showed that planning, design, construction, maintenance, and
rehabilitation must all be considered in what has become known as Pavement Management and Pavement
Management Systems (PMS). PMS works for individual sections at the project level and also on a network of
several or many pavement sections. The project level pavement activities include design and are considered most
importantly in this paper.
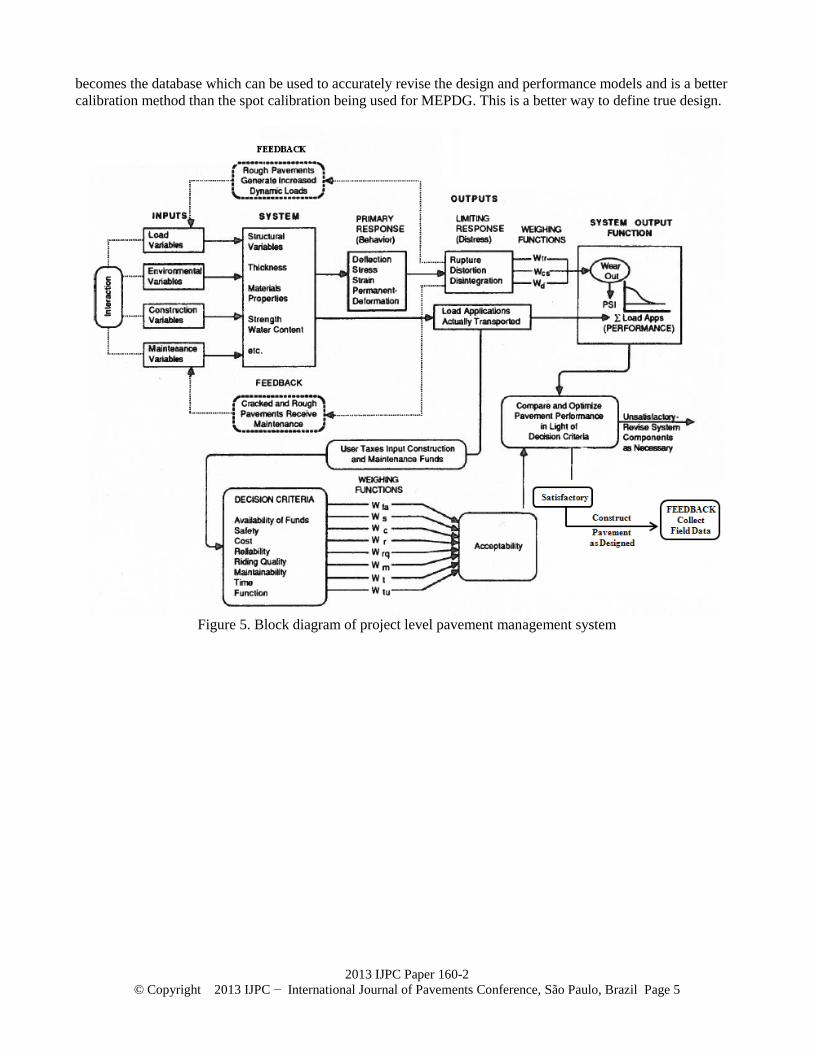
Figure 5 depicts the project level management process which is the focus of this paper. The model of the
pavement structure shown upper left is only a small but important part of providing good pavements. It also
shows that the model outputs are deflection, stress and strain. These taken to a limit, produce distresses which
combine to define the performance. More detailed explanation can be obtained in Haas et al. [5] as can details of
network level pavement management which are beyond the scope of this paper. Figure 6 shows the PMS process
with more emphasis on field feedback data. The accumulated feedback for many pavements over several years
ΣD
am
age
10.0
1.0
Accumulated Axles
2013 IJPC Paper 160-2
© Copyright 2013 IJPC − International Journal of Pavements Conference, São Paulo, Brazil Page 5
becomes the database which can be used to accurately revise the design and performance models and is a better
calibration method than the spot calibration being used for MEPDG. This is a better way to define true design.
Figure 5. Block diagram of project level pavement management system

2013 IJPC Paper 160-2
© Copyright 2013 IJPC − International Journal of Pavements Conference, São Paulo, Brazil Page 6
Figure 6. Performance and cost models diagram
3. A REALISTIC LOOK AT DESIGN
3.1 Single Designs Pavement design engineers tend to think of the design of a pavement section as being uniform for the total
section length of perhaps four to ten kilometers or more. But there is variability along the length of any section
of road. Nevertheless, the designer often makes a single selection of materials and thicknesses which he/she calls
“the design.” Even if such a design is perfect we must then move to construction.
3.2 The Construction Process Construction quality must recognize the variability of materials and the statistics of quality control and quality
assurance (QC/QA) by using a normal distribution curve as shown in Figure 7. As an example, if the mean
thickness of the asphalt surface is 30 centimeters as shown in this normal distribution diagram [5], we know that
50% of the pavement constructed will be thinner than 30 cm the mean. We must set the design at a lower value,
at least one or two standard deviations (as a measure of error); thus the effective thickness in this case would be
about 25 centimeters. Even then 16% (using 1σ) or 6% (using 2σ) of the actual constructed pavement would be
thinner than 25 cm. If a 30 cm pavement is truly required, then the contractor would need to adjust and construct
at least a 35 cm mean thickness to produce the required 30 cm thickness 84-94% of the time.
INPUTS
•Traffic
•Materials
•Thickness
Models
Design Behavior Distress Performance
Costs
Safety
Traffic
Counts &
Weights
DeflectionCondition
Surveys
Roughness
PSI
Update
Models•Test Pits
•Lab Tests
•Count
•Weigh
•Classification
•Rainfall
•Temperature
RECORD
• Construction
• MaintenanceLONG-TERM
DATABASE
&
ANALYSIS

2013 IJPC Paper 160-2
© Copyright 2013 IJPC − International Journal of Pavements Conference, São Paulo, Brazil Page 7
Figure 7. Normal distribution of thickness construction
Figure 8. Distorted distribution with contractor working for a maximum of 32 cm
In reality the contractor has no desire to build 84% of the pavement that he is to be paid for thicker than required.
He will therefore work against a construction maximum as shown in Figure 8. In this case, if he is seeking a 30
cm thickness, he would likely work against a 32 cm maximum. Therefore the resulting distribution is skewed
and as much as 75% of the thickness could be less than the desired 30 cm design. In this case, as shown in
Figure 8, an expected (realistic design) thickness of 25 centimeters would result; but even then 15-25% of the
pavement could be less than the effective 25 cm thick. If in fact a 30 cm pavement were required then the
contractor would need to work against a 37 cm control thickness for construction. Even when construction
inspection reveals these thin areas, in many cases the contractor will pay a penalty for the reduced thickness but
the resulting thicknesses will remain substandard and thus produce shorter pavement life which must be dealt
with in future years.
There are many ways that this substandard thickness pavement can be distributed along the length of the specific
pavement section but Figure 9 shows an example possible distribution where about 25% of the pavement
(hatched) is thinner than required and can fail earlier than predicted. How does “design” deal with this situation?
The answer is, design cannot handle this situation. It must be dealt with by preventive maintenance and/or
corrective maintenance. Up to 25% of the example pavement can fail earlier than predicted by design and must
receive corrective maintenance or preventive maintenance early in the life. A similar early failure problem exists
σ σ
30 352520
84%
Thicker
Thickness, cm
Up to 16%
Thinner
3025 32
25%
Too Thin
75%
Thicker Meets
Specifications
Thickness, cm
Contractor’s
Target

2013 IJPC Paper 160-2
© Copyright 2013 IJPC − International Journal of Pavements Conference, São Paulo, Brazil Page 8
for inadequate asphalt content, asphalt strength, concrete strength and other variables. The results are also
cumulative so there could be as much as 25 to 50% of the pavement constructed below the desired (designed)
value. It is unlikely that QA/QC practice can prevent this entire problem. The pavement management process
now moves from design and construction to the preventive maintenance or maintenance phase. Let us be clear,
you cannot deal with this problem with any “design” no matter how perfect the design may be.
Figure 9. Random distribution of poor pavement construction
The majority of the example project or section is well constructed and should perform nearly as designed if no
other unexpected variation occurs during the performance period as shown by the solid curve in Figure 2 and
Figure 10. The remaining 25%, shown crosshatched (in Figure 9), is weaker than designed and will deteriorate
earlier, shown by the dashed curve in Figure 3 and Figure 10. We may deal with this in two ways, (1) apply early
preventive maintenance to extend life as shown by the dashed curves in Figure 10 or, (2) as often happens for
lack of funds, wait longer until the pavements gets into fair or poor condition and then apply heavy maintenance
to extend the pavement life as shown in the dotted lines in Figure 10.
3.3 Effects of Traffic Loads and Environment during the Pavement’s Life
Even in the case of the well-constructed parts of the original 10 kilometer pavement section, extra traffic, worse
weather than expected, etc. can all produce more damage than predicted in the design. This problem is handled
in bridges by using a safety factor of 2.0 but this is not possible in pavements since the resulting pavement
thicknesses would be cost prohibitive. Thus pavement management becomes more important the longer the
pavements remain in service and when the accumulated damage becomes bad enough, even in the face of
applied maintenance, rehabilitation is required to renew the pavement surface and improve quality.
Adequate thickness (75% of total length)
Too Thin (25% of Total Length)
Too ThinOK

2013 IJPC Paper 160-2
© Copyright 2013 IJPC − International Journal of Pavements Conference, São Paulo, Brazil Page 9
Figure 10. Early pavement failure with maintenance options
3.4 Rehabilitation
Continued deterioration of pavement quality for the original pavement section will show up in proper feedback
data on pavement condition, strength, traffic, etc. In such cases major rehabilitation or overlay will be required
as shown in Figure 11. The overlay can be applied with variable thickness as needed to bring the whole 10
kilometer section back to the required performance or design life. A new predicted design or performance life
can even be set for the overlaid pavement as shown, another benefit of pavement management not available in
design alone. In fact many pavements remain in service far beyond the 20 year design life usually prescribed.
Most of the world’s interstate and trunk road systems have remained in service since 1955-1965, thus total
service life is reaching 50 to 55 years not just 20 years. This pavement reality cannot be dealt with by design but
can be handled by Pavement Management.
Figure 11. Early failure with rehabilitation to extend pavement life
0
5
20
|
_
30
|
Preventive Maintenance
|
1510
|
Design
PS
I (S
ervic
eab
ilit
y)
Heavy Maintenance
or Rehabilitation
Actual
Failure
Minimum PSI
Years
0
5
20
|
_
30
|
Years
Minimum PSI
FailurePS
I (S
erv
icea
bil
ity
)
Rehabilitation
DesignActual

2013 IJPC Paper 160-2
© Copyright 2013 IJPC − International Journal of Pavements Conference, São Paulo, Brazil Page 10
4. WHY SO MUCH FOCUS ON DESIGN?
In spite of the fact that pavement management was first developed in the early 70’s and that many countries and
all the states in the United States and provinces in Canada now require use of pavement management, many
pavement engineers still seek the "holy grail" of the “perfect design method.” The US alone has spent $20-30
million in the last 10 years to develop the Mechanistic-Empirical Pavement Design Guide, known as MEPDG,
and for its region-specific calibration efforts. To further illustrate the problem, the method started out to be the
Mechanistic Pavement Design Guide, but two years into the project, the project staff admitted the reality that no
mechanistic equations can predict pavement performance. They only predict stress, strain, and deflection
(Figures 5 and 6). Therefore, calibration and empirical adjustment is required. So the most complex design
methods are not purely mechanistic, even the Westergard equations used for Portland Cement Concrete (PCC)
for over 50 years, required practical empirical adjustments for the real world.
This illusive MEPDG mechanistic method for asphalt pavement design now includes over 300 input variables.
On its face this seems so absurd that it is hard to understand why anyone would try to develop a method with so
many variables since in the real world it has been difficult to get agencies to obtain good data for more than five
to ten variables much less 300. Furthermore the amount of time, and thus money, required to obtain this large
number of variables with any degree of accuracy is prohibitive. Calibration efforts by each state are being carried
out for only some variables [9]. This will lead users of the method to use many default values for design which
means that the detailed MEPDG method is not really being used anyway.
5. DESIGN METHODS DO NOT PREDICT PERFORMANCE
Another problem with mechanistic design methods is that they do not predict pavement smoothness or
performance. They predict stress, strain, or deformation (Figure 5). Everything else is empirical modification of
the theory. Only by obtaining regular (hopefully annually) feedback measurements of roughness, cracking, and
other distress can we know how to provide the performance required for pavements. Pavement management
automatically provides a historical way to predict, monitor, and maintain required pavement performance and
life-cycle for minimum costs through feedback.
6. TIME AND COST OF DETAILED DESIGN PROHIBITIVE
Even if the 300 MEPDG variables could be measured, the cost of obtaining and using those values on each
individual pavement section would be prohibitive. Even worse all of that time and money goes to waste because
the previously discussed actual values of construction, traffic, climate, etc. will change and as-built thicknesses
and strength almost always vary from the design value. Your authors remain amazed at this pursuit of the
“perfect design, holy grail” when reality and research have shown time and again that pavements must be
managed in the face of real world conditions and required performance in the field. Pavement management is a
more realistic answer.
7. EFFECT OF ENGINEERING EDUCATION
Perhaps one of the most important contributors to this Design mentality is the design culture in university civil
engineering curricula. The average civil engineering curricula worldwide contains 15-20 course units in design;
steel design, concrete design, bridge design, waterworks design, sewage treatment design, etc. Usually there are
no courses at all on maintenance and rehabilitation. In some universities, there is a three unit course in asset
management but this cannot offset the weight of 15 - 20 units of “design courses” in the mind of the average
student. This level of design education encourages the quest for better mechanistic design of pavements who
some people already consider the poor cousin in civil engineering. Bridge design and structural design are held
up as icons for engineers. A parallel contributing factor is that work on analytical and mathematical
improvements in design fits better into master’s theses or a PhD dissertation than does the messy use of field

2013 IJPC Paper 160-2
© Copyright 2013 IJPC − International Journal of Pavements Conference, São Paulo, Brazil Page 11
data and the empirical problems of pavement maintenance, rehabilitation, and management. The three authors of
this paper have a total of 105 years in teaching at the university level. We are to some degree contributors to this
design mentality. However, all of us since the mid-1970s have strongly developed and supported pavement
management and asset management systems as a necessary supplement to design [10].
8. WE USUALLY HAVE MORE THAN ONE PAVEMENT SECTION TO MANAGE
What if you have a network of 10 pavement sections that need to be dealt with? Assume you design them but
you don’t’ have enough money to do all 10 at the desired design level. Do you then build the six most important
or spread the money over the network of all ten sections? Design cannot tell you but you can deal with this
problem with network level pavement management. In this case our example network was only 10 sections but
pavement management can also handle 100, 1000, 100,000 and more sections. You can learn more about
network PMS in Haas and Hudson [5].
In addition, pavement management systems can and do integrate with maintenance management systems [11]
including the preservation and rehabilitation cycles. This provides the beginning of an asset management system
as outlined in References [11,12,13,14]. Proper pavement management provides a lasting useable framework.
Furthermore, project-level pavement management and maintenance management integrate into network-level
pavement management to allocate funds among many pavement sections for the whole agency network to
maintain and maximize overall service; not for a few highly designed roads while the rest suffer deterioration.
9. RECOMMENDATIONS
We have shown that design alone cannot guarantee good pavements. What should the process actually look like?
We suggest the steps listed in Table 2 as part of pavement management. No design method, no matter how
complicated or well documented can accomplish these tasks. Only by managing pavements can you achieve the
goals of providing good serviceability at reasonable or minimum costs and of reducing user costs on these
pavements.
Table 2. Actual Steps Involved in Providing Good Pavement Performance
1 Design the pavement with reasonable input estimates and reasonable design methods.
2 Build the pavement with good construction methods and reasonable quality control.
3 Measure the feedback from the pavement including performance properties, roughness,
serviceability, distress at least annually.
4 Provide preventive maintenance when the pavement begins to deteriorate below the desired
performance curve.
5 Provide maintenance or major maintenance when needed to extend serviceability.
6 Rehabilitate the pavement when it becomes clear that the performance levels are dropping too
rapidly for maintenance to be economical.
7 Adjust the performance curves and prediction to the required level as needed.
8 Continue this cycle for as long as the highway needs to remain in service, usually 50 years or
more.
9 Work toward a complete asset management by adding a Maintenance Management System.
10. SUMMARY
This is a Pavement Asset Management Conference. If at all possible when you return to your agency, look at the
pavement related activities in your agency. Use the information herein to gain support among your design

2013 IJPC Paper 160-2
© Copyright 2013 IJPC − International Journal of Pavements Conference, São Paulo, Brazil Page 12
cohorts to put design into proper perspective as part of project level Pavement Management. Again, we are not
suggesting sloppy or inferior design. Rather produce a good but economical design and immediately follow-up
with the principles of pavement management discussed in Recommendations.
REFERENCES:
[1] Yoder, E.J. and M.W. Witczak. Principles of Pavement Design. 2nd
Ed., Wiley, New York, 1975.
[2] Carey, W.N. and P.E. Irick. The Pavement Serviceability-Performance Concept. HRB Bulletin 250,
Highway Research Board, 1960.
[3] Highway Research Board. The AASHO Road Test: Report 5-Pavement Research. HRB Special Report
61-E, Highway Research Board, 1962.
[4] Hudson, W.R., F.N. Finn, B.F. McCullough, K. Nair, and B.A. Vallerga. Systems Approach to Pavement
Design, Systems Formulation, Performance Definition and Materials Characterization. Final Report,
NCHRP Project 1-10, Materials Research and Development Inc., March 1968.
[5] Haas, Ralph and W.R. Hudson. Pavement Management Systems. McGraw-Hill, New York, 1978.
[6] Wilkins, E.B. Outline of a Proposed Management System for the CGRA Pavement Design and
Evaluation Committee. Proceedings, Canadian Good Roads Association, 1968.
[7] Hutchinson, B.G. and R.C.G. Haas. A Systems Analysis of the Highway Pavement Design Process.
Highway Research Record No. 239, Highway Research Board, 1968.
[8] Haas, R.C.G. and B.G. Hutchinson. A Management System for Highway Pavements. Proceedings,
Australian Road Research Board, 1970.
[9] Souliman, Mena I., Michael Mamlouk, Mohamed El-Basyouny, and Claudia E. Zapata. Calibration of the
AASHTO MEPDG for Designing Flexible Pavements in Arizona Conditions. IJP - International Journal
of Pavements, Vol. 9, No. 1-2-3, 2010, pp. 2-13.
[10] Uddin, W., W.R. Hudson, and Ralph Haas. Public Infrastructure Asset Management. McGraw Hill, New
York, 2013.
[11] Hudson, W.R., S.W. Hudson, Eric Perrone, and Charles Pilson. Improving PMS by Simultaneous
Integration of MMS. Proceedings, 8th International Conference on Managing Pavement Assets, Santiago,
Chile, November 15 – 19, 2011.
[12] Hudson, W.R., R. Haas, “Progress Assessment of PMS,” Keynote Presentation and Paper, 8th
International Conference on Managing Pavement Assets, Santiago, Chile, November 15 – 19, 2011.
[13] Haas, Ralph, W.R. Hudson, and L. Cowe-Falls. Evolution of and Future Challenges for Pavement
Management. Proceedings, 8th International Conference on Managing Pavement Assets, Santiago, Chile,
November 15 – 19, 2011.
[14] Rada, G.R. and W.R. Hudson. Balancing Accurate Pavement Management Data Collection and Software
Requirements. Proceedings, 8th International Conference on Managing Pavement Assets, Santiago, Chile,
November 15 – 19, 2011.