golder associates (uk) · pdf filemarch 2009 - es-2 - 07514150008 a.2 golder associates the...
TRANSCRIPT
Golder Associates (UK) Limited 1st Floor Clyde House Reform Road Maidenhead Berkshire, SL6 8BY England
Tel: [44] (0)1628 771731 Fax: [44] (0)1628 770699 E-mail: [email protected] http://www.golder.com
_______________________________________________________________________________________________________________________________________________
GOLDER ASSOCIATES: OPERATIONS IN AFRICA, ASIA, AUSTRALASIA, EUROPE, NORTH AMERICA AND SOUTH AMERICA Company Registered in England No 1125149. At Attenborough House, Browns Lane Business Park, Stanton-on-the-Wolds, Nottinghamshire, NG12 5BL.
REPORT TO
Submitted to:
Boliden Tara Mines Ltd Knockumber
Navan Co. Meath
Ireland
DISTRIBUTION: 4 copies - Boliden Tara Mines Ltd 2 copies - Golder Associates (UK) Ltd March 2009 07514150008.500/A.2
BOLIDEN TARA MINES LIMITED
DESIGN OF STAGE 5 TAILINGS DAM RAISE
For
insp
ectio
n pur
pose
s only
.
Conse
nt of
copy
right
owne
r req
uired
for a
ny ot
her u
se.
EPA Export 27-07-2013:00:02:53

March 2009 - ES-1 - 07514150008 A.2
Golder Associates
EXECUTIVE SUMMARY
Boliden Tara Mines Limited (Tara Mines) operates a tailings management facility (TMF) built in five stages during the period 1974 to 2006. Stages I and II were filled and re-vegetated in 1988. Construction of Stage 4A, a raised facility over the existing tailings in Stages I and II, began in late summer of 1998 and was completed in July 2000. The Stage 4A tailings facility was filled by 2007 Stage III was constructed between 1985 and 1987 and was filled in March 2003. The construction of Stage 4B, which is founded on the Stage III tailings, started in the summer of 2003 and the dam wall was completed in 2006. Stage 4B is operational.
To date the total capacity of the tailings facilities, Stages I, II, III, 4A and 4B is approximately 35.6Mtonnes (25Mm3).
Stage 4B will be filled by 2013 and Tara Mines propose raising the Stage 4 facility from a crest elevation of 1590mAMD to an elevation of 1594mAMD to form Stage 5. Stages I, II and III were constructed to an elevation of 1584mAMD. Stage 4 is a 7.5m high dam wall constructed on tailings with a crest elevation of 1590mAMD. The proposed Stage 5 will be a 5.5m high dam wall constructed on tailings with a crest elevation of 1594mAMD. The total maximum height of the raised structure above the original ground level will be 27m and the minimum height will be 18m. The method of raising a dam wall on previously deposited tailings is a common practice in the mining industry and is termed the upstream method.
Tara Mines typically produces between 2.6 and 2.7 million tonnes of ore per annum and approximately 52% of the tailings, 1.06Mt, were discharged into the tailing facilities whilst the remaining tailings were placed underground as backfill. Historically, approximately 48% to 52% of the mine tailings are discharged into the tailings facilities.
Based on current ore reserves, Tara Mines needs to increase the storage capacity of their tailings facility to allow the processing of ore beyond the year 2013.
The preferred option for storing tailings is to raise Stage 4 from a crest elevation of 1590mAMD to 1594mAMD. Tara Mines and Golder Associates have considerable technical and practical expertise raising on the tailings having completed the construction and filled Stage 4A with no detrimental effects and having completed the construction of Stage 4B on recently deposited tailings.
The Stage 5 raise would be implemented in two phases. The first phase would be the construction of the Stage 5A wall within the Stage 4A facility and the second phase would be the construction of the Stage 5B wall within the Stage 4B facility. The Stage 5A and Stage 5B embankment walls will be constructed using a multi-stage approach and each over three construction seasons.
.
For
insp
ectio
n pur
pose
s only
.
Conse
nt of
copy
right
owne
r req
uired
for a
ny ot
her u
se.
EPA Export 27-07-2013:00:02:53

March 2009 - ES-2 - 07514150008 A.2
Golder Associates
The existing tailings, with a minimum thickness of 18m will act as a low permeability liner. The vertical permeability of the tailings is controlled by the slimes which are likely to be of the order of 1E-9m/s to 1E-8m/s. A 10m thickness of tailings at a permeability of 1E-8m/s is equivalent to a 1m thick layer of clay at 1E-9m/s.
The design for the Stage 5 raise will be based on the design developed for the Stage 4A raise and modified and improved for the Stage 4B raise using glacial clay/silt till with a granular internal drainage system consisting of a chimney and blanket drain. The raise will be zoned with the upstream half comprising the more clayey, and therefore less permeable portion of the glacial till (Type A1). The less clayey material is termed Type A2 and placed on the downstream sector of the dam wall. A glacial sand and gravel (Type A3) will be used to form the base of the downstream drainage blanket. This conforms with the designations used during construction of the previous dam stages. Approximately 46 percent of the total clay fill requirement is for Type A1 material
As with Stage 4B, preloading the majority of the footprint of the dam wall using imported mine rock will be carried out to reduce settlement beneath the dam wall and increase the shear strength of the foundation tailings.
The estimate of the quantities of the fill materials required to construct Stage 5 are 725,000m3 of locally borrowed glacial till and 215,500m3 of imported granular material from the mine rock stockpile at Tara Mines. The glacial till volumes incorporate a 10% contingency factor to take into account settlement of the foundation tailings. There are two primary sources of materials on site to construct the Stage 5 raise and these are:
• The partially excavated northern borrow area; and • The seven fields borrow area.
The total volume of material available from the Northern borrow area and the Seven Fields borrow area is approximately 420,000m3 of Type A1 material, 403,000m3 of Type A2 and 75,000m3 of Type A3.
Four principal engineering aspects of the Stage 5 raise behaviour have been considered:
1. Foundation settlement; 2. Stability; 3. Seepage flows; 4. Water quality.
The analysis of these involves the consideration of many factors. However, because of the extensive monitoring of Stage 4A and Stage 4B, it is now possible to predict with some degree of certainty the behaviour and performance of Stage 5 during construction and operations. During the operation of Stage 5, the facility will be regularly monitored and the performance compared with the design criteria. Stages I, II, III and 4 will also be regularly monitored as currently undertaken.
.
For
insp
ectio
n pur
pose
s only
.
Conse
nt of
copy
right
owne
r req
uired
for a
ny ot
her u
se.
EPA Export 27-07-2013:00:02:53

March 2009 - ES-3 - 07514150008 A.2
Golder Associates
The maximum measured settlements/deformation beneath the Stage 4 B dam wall during the preloading phase was generally between 650mm and 700mm in tailings slimes and a minimum generally between 5mm and 20mm tailings. Monitoring of the settlements resulting from the dam wall construction were for the lower bound values between 50mm and 150mm and upper bounds between 300mm and 500mm. The maximum tailings settlement observed beneath the 7.5m Stage 4B embankment wall was approximately 1200mm on tailings less than 6 months old.
By preloading the tailings, the majority of the settlement/deformation can be taken out prior to construction of the dam wall. Preloading induces significant pore pressures in the tailings which dissipate as the tailings settle, stiffen and gain strength. Placing a minimum of 2m of preload constructed of mine rock is equivalent to 50% of the final Stage 5 dam loading.
Based on the monitoring, post preload settlement for the Stage 5 raise is likely to be of the order of a minimum of between 25mm and 75mm and a maximum of between 150mm and 250mm. The settlements would be substantially completed by the end of construction of the raise and post construction settlement will be small.
The multistage construction approach accommodates the low undrained shear strength of the near surface tailings which were between about 5kPa and 30kPa which is insufficient to allow the embankment to be constructed to its full height in a single stage. A multi-stage strategy allows time for construction pore pressures in the foundation tailings material to dissipate, thereby increasing its strength for subsequent loadings. The analysis of the embankment stability during construction has accounted for the multi-stage procedure through a simulation of the dissipation process based on the performance of Stage 4.
The transient pore water pressures in the foundation tailings material and the undrained strength of the fill, are the two principal variables to consider when evaluating the stability of the dam raise during and up to the end of construction. The undrained shear strength of the fill will be a minimum of 40kPa to accommodate the proposed maximum 30 tonne dump trucks used in construction and to prevent severe rutting. The pore water pressure distribution is influenced by numerous factors although the monitoring of Stage 4B indicated that the pore water pressures developed during preloading are dissipated reasonably rapidly and within a period of three weeks. Once the pore pressures dissipate, the tailings have consolidated, stiffened and the shear strength of the tailings material increases. After placing a minimum of 2.0m of mine rock preload on the tailings of the Stage 4B upstream footprint, the material was removed and construction of the dam wall commenced. Further loading of the tailings during construction resulted in only a modest increase in subsequent pore water pressures in the tailings and at a dam height of 3m above the tailings there appeared to be little or no effective pore pressure response to construction loading.
Analyses have been undertaken using ru values to determine the stability of the dam wall during construction. The ru value is defined as the piezometric pressure divided by the total
for the coarser total
For
insp
ectio
n pur
pose
s only
.
Conse
nt of
copy
right
owne
r req
uired
for a
ny ot
her u
se.
EPA Export 27-07-2013:00:02:53

March 2009 - ES-4 - 07514150008 A.2
Golder Associates
stress at a given point. The analyses indicate that the ru should not exceed 0.2 at the end of construction for a factor of safety of 1.3 which is readily achievable based on the performance of Stage 4 provided pore pressures are allowed to dissipate. Pore pressures will be monitored from vibrating wire piezometers installed into the tailings foundation during construction.
Stability analyses were carried out assuming that filling Stage 5 will increase the piezometric pressures in the tailings foundations on the downstream side of both Stages 4 and 5. The analyses indicate that the piezometric level should not exceed an elevation of 1588.3mAMD in the tailings foundation on the downstream side of the Stage 4 dam wall or approximately 4.2m below the pond water level. Based on monitoring of the Stage 4A performance, the maximum piezometric level in the downstream foundation tailings of the dam raise is greater than 5.5m below the pond water level. Thus, for the Stage 5 raise, and assuming an increase in pond water level of 4m, the phreatic surface in the tailings beneath the Stage 4 dam wall is unlikely to rise above 1587mAMD which will be confirmed by monitoring during filling.
A series of stability analyses have been carried out to check the long-term stability of the Stage 5 raise. The geometry of the combined Stage 5 raise, existing embankments, internal drainage systems and deposited tailings will lead to a complex steady seepage condition throughout the dams. The pore water pressures within the slopes are chiefly affected by the efficiency of the internal drainage in the raise and existing embankments. The chimney, blanket and finger drains have been designed to minimise the water pressures, and evidence from monitoring of the existing dams over the past 20 years indicate that this has been achieved. However, unforeseen circumstances may impair the efficiency of the internal drains and this possibility has been investigated. For the maximum height dam section, two phreatic surfaces have been considered. These two phreatic surfaces correspond to the following conditions of the internal drainage systems of the dams:
1. The drains of the Stage 5 and Stage 4 raises and Stages I to III working to specification; and
2. The drains in both the raise and existing dam throttling the flows. As expected, the analyses for the situation where the drainage systems are impaired yield the lowest factors of safety of 1.39 which is satisfactory. The factor of safety for the facility with a fully operational drainage system is 1.53 and satisfactory.
The Stage 5 raise internal drainage systems are designed to accommodate the expected flows under and through the dam wall and this is then discharged into the existing Stage 4 manhole chambers and then into the eastern and western perimeter interceptor channels which are located downstream of Stage I and II dam walls and Stage III dam wall respectively. The quantity of seepage through the Stage 5 dam wall is dependent on the height of the pond water level above the tailings, the thickness of and nature of the tailings which underlie the dam walls and the permeability of the upstream dam fill material.
For
insp
ectio
n pur
pose
s only
.
Conse
nt of
copy
right
owne
r req
uired
for a
ny ot
her u
se.
EPA Export 27-07-2013:00:02:53

March 2009 - ES-5 - 07514150008 A.2
Golder Associates
The expected seepage volumes have been evaluated for the following cases:
• Emanating through the dam walls of Stage 5, Stages 4 and Stages I, II and III and collected by the internal drainage system prior to discharge into the perimeter interceptor channel; and
• Emanating through the base of the Stage I, II and III facilities and intercepted by the perimeter interceptor channel.
The pond water level has risen from 1582.5mAMD to 1588.5mAMD after the construction and filling of the Stage 4A raise. The pond water will subsequently rise from 1588.5m to 1592.5m after the completion of the Stage 5 raise. As the facility is filled with tailings, the pond water rises and provided that they rise at approximately the same rate, the hydraulic head across the tailings remains the same and close to unity. If the hydraulic head remains the same then theoretically, the seepage should be constant through the base of the facility and controlled by the vertical permeability of the tailings. Therefore at the end of the life of Stage 5, seepage through base will not increase as a result of raising the facility with tailings. Also, as the tailings level increases, consolidation of the lower layers occurs resulting in a decrease in permeability of the tailings at depth and therefore a decrease in vertical seepage.
The seepage monitored from raising Stage 4A and excluding rainfall infiltration was of the order of 0.5l/s which was 50 times less than the value predicted in the Stage 4 design. A similar value of 0.5l/s can be assumed from filling Stage 4B. Therefore, the total seepage monitored/estimated from the internal drainage system of Stage 4A and Stage 4B raise will be of the order of 1l/s.
An estimate of seepage flow from Stages I, II and III has been based on the monitoring records in the perimeter interceptor channel. The lower bound flow rate monitored is 3l/s over the entire dam alignment of Stages I, II and III and it can be assumed that seepage could not be greater than the minimum values monitored. These are an over estimate as the readings are influenced by seepage through the base of the facility, ground water and surface rainfall water runoff during low rainfall events. Thus, from the monitoring, the total seepage to be collected from the internal drainage systems of Stages I, II, III, 4A and 4B are conservatively estimated in the order of 4l/s.
Modelling of seepage flow using Seep/W indicates the seepage from Stage 5 will be between 0.33l/s and 0.54l/s and Stage 4 will be between 0.37l/s and 0.64l/s. Based on the performance of Stage 4A where a seepage value of 0.5l/s is currently being monitored, it can be expected that the additional seepage flow from the internal drainage system of Stage 5 will stabilise at about 0.7l/s. The additional seepage emanating from the internal drainage systems of Stages I, II, III and 4 is considered minimal as by increasing the pond water level in Stage 4A has had a limited impact on the piezometric pressures at depth and hence the volume of downward seepage. Modelling of seepage flow using Seep/W indicated that seepage
For
insp
ectio
n pur
pose
s only
.
Conse
nt of
copy
right
owne
r req
uired
for a
ny ot
her u
se.
EPA Export 27-07-2013:00:02:53

March 2009 - ES-6 - 07514150008 A.2
Golder Associates
emanating from the internal drainage system for Stages I, II and III was between 0.34l/s and 1.75l/s.
The total seepage emanating from underneath the dam wall and from the internal drainage systems of the various dam stages based on the monitoring is predicted to be less than 4.7l/s.
Based on the low vertical permeability of the tailings, the downward seepage through the base of the facility will range from the order of 1.5l/s to 15l/s with a best estimate at about 8.3 l/s based on a vertical permeability of 5E-9m/s.
The surface and groundwater monitoring indicates that sulphate concentrations detected in the groundwater and surface water have generally decreased since 1996 due to the deepening of the perimeter interceptor channel. Monitoring data from the eastern interceptor channel indicates a slight decline in sulphate values which is not unexpected considering seepage from Stage 4A is decreasing. Sulphate concentration values are between 200mg/l to 800mg/l with flow rates between 2l/s and 28l/s. The sulphate values monitored in the western interceptor channel are between 200mg/l and 2000mg/l with flow rates between 1l/s and 15l/s. The higher values tend to relate to the dryer summer periods where dilution is at a minimum. The sulphate level of the pond water in the tailings facility generally fluctuates between 520 mg/l and 2010 mg/l.
Seepage modelling indicates a limited increase in seepage emanating through the internal drainage system of Stage 5 by the construction and filling of Stage 5. This increase is of the order of 18% and it could be expected that sulphate concentration will increase during operation as occurred during the Stage 4 operation and then decrease as the tailings consolidated. The final sulphate concentration monitored in the perimeter interceptor channel after the completion of Stage 5 will be similar to current values. Any additional seepage will be diluted by surface runoff from the side walls of Stage 5 and infiltration through the dam wall of Stage 5.
For
insp
ectio
n pur
pose
s only
.
Conse
nt of
copy
right
owne
r req
uired
for a
ny ot
her u
se.
EPA Export 27-07-2013:00:02:53

March 2009 - i - 07514150008 A.2
Golder Associates
TABLE OF CONTENTS
SECTION PAGE 1.0 INTRODUCTION......................................................................................... 1
1.1 General....................................................................................................1 1.2 Project Description ..................................................................................1 1.3 Tailing Management Facility Options ......................................................2
2.0 BORROW AREAS ...................................................................................... 4 2.1 General....................................................................................................4 2.2 Northern Borrow Area..............................................................................4 2.3 Seven Fields Borrow Area.......................................................................4
2.3.1 General ........................................................................................4 2.3.2 Field Investigation........................................................................5 2.3.3 Subsurface Conditions.................................................................5 2.3.4 Groundwater Levels.....................................................................6 2.3.5 Laboratory Testing.......................................................................6 2.3.6 Moisture Content and Atterberg Limits ........................................6 2.3.7 Particle Size Distribution..............................................................7 2.3.8 Soil Compaction...........................................................................8 2.3.9 Shear Strength.............................................................................8 2.3.10 Permeability Testing ....................................................................9 2.3.11 Organic Content...........................................................................9
2.4 Operation of Earthmoving Plant ..............................................................9 2.5 Estimation of Quantities of Available Fill Materials................................10
2.5.1 Northern Borrow Area................................................................10 2.5.2 Seven Fields Borrow Area .........................................................10 2.5.3 Clay Fill Requirements...............................................................11
2.6 Summary and Conclusions....................................................................12 3.0 CURRENT PERFORMANCE OF THE EXISTING TAILINGS FACILITIES .......................................................................................................... 13
3.1 General..................................................................................................13 3.2 Piezometric Monitoring Data Stages I, II & III ........................................13
3.2.1 General ......................................................................................13 3.2.2 Stages I and II............................................................................13 3.2.3 Stage III .....................................................................................14 3.2.4 Stage 4A ....................................................................................14 3.2.5 Stage 4B ....................................................................................17
3.3 Seepage Monitoring ..............................................................................19 3.3.1 Stages I, II, III.............................................................................19 3.3.2 Stages 4A and 4B......................................................................20
3.4 Water Quality.........................................................................................22 3.5 Foundation Tailings & Dam Movement Observations ...........................24
3.5.1 Stage 4A ....................................................................................24
For
insp
ectio
n pur
pose
s only
.
Conse
nt of
copy
right
owne
r req
uired
for a
ny ot
her u
se.
EPA Export 27-07-2013:00:02:53

March 2009 - ii - 07514150008 A.2
Golder Associates
3.5.2 Stage 4B ....................................................................................25 4.0 TAILINGS TEST WORK ........................................................................... 26
4.1 General..................................................................................................26 4.2 CPT Results ..........................................................................................26
4.2.1 A Series CPT .............................................................................27 4.2.2 B Series CPT .............................................................................28
4.3 Dissipation Tests ...................................................................................29 4.4 In situ Vane Testing...............................................................................30 4.5 Laboratory Testing Tailings ...................................................................31
4.5.1 General ......................................................................................31 4.5.2 Moisture Content .......................................................................31 4.5.3 Classification test.......................................................................31 4.5.4 Density.......................................................................................32 4.5.5 Undrained Shear Strength .........................................................32 4.5.6 Consolidated Undrained Triaxial Tests with Pore Water Pressure Measurements .......................................................................32 4.5.7 Consolidation Test .....................................................................32
5.0 DAM FOUNDATION CONDITIONS ......................................................... 34 5.1 General..................................................................................................34 5.2 Piezometric response ............................................................................34
5.2.1 Cluster 150. ...............................................................................34 5.2.2 Cluster 1300 ..............................................................................35 5.2.3 Cluster 2200 ..............................................................................35
5.3 Stage 4A................................................................................................35 5.4 Settlement .............................................................................................36
6.0 DESIGN..................................................................................................... 38 6.1 General..................................................................................................38 6.2 Design Elements ...................................................................................38 6.3 Fill Requirements...................................................................................40 6.4 Internal Drainage System ......................................................................40 6.5 Toe drain ...............................................................................................42 6.6 Drain Discharge.....................................................................................42 6.7 Wick Drains ...........................................................................................43 6.8 Decant System ......................................................................................43
7.0 ANALYSES ............................................................................................... 44 7.1 General..................................................................................................44 7.2 Foundation Settlement ..........................................................................44 7.3 Static Stability ........................................................................................45
7.3.1 General ......................................................................................45 7.3.2 Stability: During Construction ....................................................45 7.3.3 Stability During Filling of Stage 5...............................................47 7.3.4 Stability: Long-Term...................................................................48
7.4 Dynamic Stability ...................................................................................49
For
insp
ectio
n pur
pose
s only
.
Conse
nt of
copy
right
owne
r req
uired
for a
ny ot
her u
se.
EPA Export 27-07-2013:00:02:53
March 2009 - iii - 07514150008 A.2
Golder Associates
7.4.1 General ......................................................................................49 7.4.2 Liquefaction ...............................................................................49 7.4.3 Seismic Induced Slope Failure ..................................................50
7.5 Seepage ................................................................................................50 7.5.1 General ......................................................................................50 7.5.2 Seepage Collected from the Internal Drainage Systems. ..........51 7.5.3 Downward Seepage ..................................................................53 7.5.4 Total Seepage ...........................................................................53
7.6 Water Quality.........................................................................................54 8.0 CONSTRUCTION ..................................................................................... 55
8.1 General..................................................................................................55 8.2 Pre Construction Phase: 2010...............................................................55 8.3 2010 Construction Season ....................................................................56 8.4 2011 Construction Season ....................................................................56 8.5 2012 Construction Season ....................................................................57 8.6 Instrumentation......................................................................................57
9.0 REFERENCES.......................................................................................... 58 LIST OF FIGURES Figure 1 Site Location Plan Figure 2 Location of Dam Stages and Borrow Areas Figure 3 Plan of Stage 5 Dam Raise Figure 4 Trial pit Locations in the Seven Fields Borrow Area Figure 5 Stages I, II, and Stage 4A Location of Piezometer and Seepage Monitoring
Points Figure 6 Stages III and Stage 4B Location of Piezometer and Seepage Monitoring PointsFigure 7 Casagrande Standpipes (Stage I South Wall) Figure 8 Casagrande Standpipes (Stage I & II East Wall) Figure 9 Casagrande Standpipes (Stage II North Wall) Figure 10 Cross Section Stage III, North Dam Wall Piezometer Cluster 1 Figure 11 Stage III Casagrande Piezometer-Cluster 1 Figure 12 Stage III Casagrande Piezometer-Cluster 2 Figure 13 Stage III Casagrande Piezometer-Cluster 3 Figure 14 Stage III Casagrande Piezometer-Cluster 4 Figure 15 Stage III Casagrande Piezometer-Cluster 5 Figure 16 Cross Section Stage 4A South Dam Instrument Cluster 400 Figure 17 Stage 4A Cluster 400 Casagrande Piezometers Figure 18 Stage 4A Cluster 1000 Casagrande Piezometers Figure 19 Stage 4A Cluster 1600 Casagrande Piezometers Figure 20 Stage 4A Cluster 2200 Casagrande Piezometers Figure 21 Stage 4A Cluster 2800 Casagrande Piezometers
For
insp
ectio
n pur
pose
s only
.
Conse
nt of
copy
right
owne
r req
uired
for a
ny ot
her u
se.
EPA Export 27-07-2013:00:02:53

March 2009 - iv - 07514150008 A.2
Golder Associates
Figure 22 Stage 4A Cluster 3400 Casagrande Piezometers Figure 23 Stage 4A Cluster 400 Vibrating Wire Piezometers Figure 24 Stage 4A Cluster 1000 Vibrating Wire Piezometers Figure 25 Stage 4A Cluster 1600 Vibrating Wire Piezometers Figure 26 Stage 4A Cluster 2200 Vibrating Wire Piezometers Figure 27 Stage 4A Cluster 2800 Vibrating Wire Piezometers Figure 28 Stage 4A Cluster 3400 Vibrating Wire Piezometers Figure 29 Cross Section Stage 4B Instrument Cluster 500 Figure 30 Stage 4B Cluster 150 Vibrating Wire Piezometers Figure 31 Stage 4B Cluster 510 Vibrating Wire Piezometers Figure 32 Stage 4B Cluster 850 Vibrating Wire Piezometers Figure 33 Stage 4B Cluster 1300 Vibrating Wire Piezometers Figure 34 Stage 4B Cluster 1750 Vibrating Wire Piezometers Figure 35 Stage 4B Cluster 2200 Vibrating Wire Piezometers Figure 36 Stage 4B Cluster 150 Casagrande Piezometers Figure 37 Stage 4B Cluster 510 Casagrande Piezometers Figure 38 Stage 4B Cluster 850 Casagrande Piezometers Figure 39 Stage 4B Cluster 1300 Casagrande Piezometers Figure 40 Stage 4B Cluster 1750 Casagrande Piezometers Figure 41 Stage 4B Cluster 2200 Casagrande Piezometers Figure 42 Eastern Interceptor Channel Flowrates Figure 43 Western Interceptor Channel Flowrates Figure 44a Figure 44b
Stage 4A Discharge Over V-Notch Weirs Stage 4A Discharge Over V-Notch Weirs Sum and Average of 8 Weirs
Figure 45 Stage 4A Discharge Over V-Notch Weirs period Sept 2000 to Sept 2002 Figure 46 Stage 4A Discharge Over V-Notch Weirs period Sept 2002 to Jan 2008 Figure 47 Groundwater and Surface Water Monitoring Location Plan Figure 48a Eastern Perimeter Interceptor Channel: Rainfall and Sulphate vs Time Figure 48b Western Perimeter Interceptor Channel: Rainfall and Sulphate vs Time Figure 49a Eastern Perimeter Interceptor Channel E.I.C.P1- Sulphate vs Rainfall Figure 49b Western Perimeter Interceptor Channel W.I.C.P1- Sulphate vs Rainfall Figure 50a Eastern Perimeter Interceptor Channel: Flowrate and Sulphate vs Time Figure 50b Western Perimeter Interceptor Channel: Flowrate and Sulphate vs Time Figure 51a Eastern Perimeter Interceptor Channel E.I.C.P1- Sulphate vs Flowrate Figure 51b Western Perimeter Interceptor Channel W.I.C.P1- Sulphate vs Flowrate Figure 52a Eastern Perimeter Interceptor Channel E.I.C.P1- Rainfall vs Flowrate Figure 52b Western Perimeter Interceptor Channel W.I.C.P1- Rainfall vs Flowrate Figure 53a I.C.P.1E Sulphate Concentrations Figure 53b I.C.P. 6 Sulphate Concentrations Figure 54a I.C.P.1W Sulphate Concentrations Figure 54b I.C.P. 3 Sulphate Concentrations Figure 55 T 12 Sulphate Concentrations Figure 56 Location of Stage 4A Ground Movement Monitoring Instruments
For
insp
ectio
n pur
pose
s only
.
Conse
nt of
copy
right
owne
r req
uired
for a
ny ot
her u
se.
EPA Export 27-07-2013:00:02:53
March 2009 - v - 07514150008 A.2
Golder Associates
Figure 57 Location of Stage 4B Ground Movement Monitoring Instruments Figure 58 Plan Showing Location of Cone Penetration Tests. Figure 59 Cone Penetration Test 1400A Figure 60 Cone Penetration Test 1900A Figure 61 Cone Penetration Test 2950A Figure 62 Cone Penetration Test 3000A Figure 63 Series A Lower Bound Cone Penetration Resistance with Depth Figure 64 Cone Penetration Test 200B Figure 65 Cone Penetration Test 800B Figure 66 Cone Penetration Test 1400B Figure 67 Cone Penetration Test 1900B Figure 68 Cone Penetration Test 2375B Figure 69 Cone Penetration Test 2750B Figure 70 Series B Lower Bound Cone Penetration Resistance with Depth Figure 71 Casagrande Chart for the Tailings Figure 72 Stage 4B Cluster 150 Vibrating Wire Piezometers Preloading Response Figure 73 Stage 4B Cluster 1300 Vibrating Wire Piezometers Preloading Response Figure 74 Stage 4B Cluster 2200 Vibrating Wire Piezometers Preloading Response Figure 75 Stage 5 Typical Section - Preload Figure 76 Stage 5 Typical Section - Upstream Toe Berm and Downstream Drainage
Blanket Figure 77 Stage 5 Typical Section - Construction of the Dam Wall Figure 78 Stage 5 Typical Section Drainage Figure 79 Grading Envelope Type A1 Material Figure 80 Grading Envelope Type A3 Material Figure 81 Grading Envelope Type B Material Figure 82 Grading Envelope Type C Material Figure 83 Location of Stage 5 Collector and Inspection Chambers Figure 84 Toe Drain and Manhole Details Figure 85 Pond Location Stage 5A Figure 86 Pond Location Stage 5B Figure 87 Stability Analyses During Construction Factor of Safety vs ru Figure 88 Stability Analyses Tailings Piezometric Level 1592mAMD Stage 4 Figure 89 Stability Analyses Tailings Piezometric Level 1590mAMD Stage 4 Figure 90 Stability Analyses Tailings Piezometric Level 1589mAMD Stage 4 Figure 91 Stability Analyses Tailings Piezometric Level 1588mAMD Stage 4 Figure 92 Stability Analyses Tailings Piezometric Level 1587mAMD Stage 4 Figure 93 Stability Analyses Tailings Piezometric Level 1592mAMD Stage 5 Figure 94 Stability Analyses Tailings Piezometric Level 1590mAMD Stage 5 Figure 95 Stability Analyses Tailings Piezometric Level 1588mAMD Stage 5 Figure 96 Long Term Stability Analyses Drains Functional Figure 97 Long Term Stability Analyses Drains Non-Functional Figure 98 Location of 30m Clay Blanket
For
insp
ectio
n pur
pose
s only
.
Conse
nt of
copy
right
owne
r req
uired
for a
ny ot
her u
se.
EPA Export 27-07-2013:00:02:53

March 2009 - vi - 07514150008 A.2
Golder Associates
Figure 99 Instrumentation Details for the Inclinometers/Extensometers and Vibrating Wire Piezometers
For
insp
ectio
n pur
pose
s only
.
Conse
nt of
copy
right
owne
r req
uired
for a
ny ot
her u
se.
EPA Export 27-07-2013:00:02:53

March 2009 - 1 - 07514150008 A.2
Golder Associates
1.0 INTRODUCTION
1.1 General
Boliden Tara Mines Limited (Tara Mines) operates a tailings management facility (TMF) built in five stages during the period 1974 to 2006. Figure 1 shows the site location and Figures 2 and 3 show the layout plan for the existing tailings dam facilities and the proposed Stage 5 raise. Stages I and II were filled and re-vegetated in 1988. Construction of Stage 4A, a raised facility over the existing tailings in Stages I and II, began in late summer of 1998 and was completed in July 2000. The Stage 4A tailings facility was filled by the end of 2006. Stage III was constructed between 1985 and 1987 and was filled in March 2003. The construction of Stage 4B, which is founded on the Stage III tailings, started in the summer of 2003 and the dam walls were completed in 2006. Stage 4B is currently operational.
To date the total capacity of the tailings facilities, Stages I, II, III, 4A and 4B is approximately 35.6Mtonnes (25Mm3).
Stage 4B will be filled by 2013 and Tara Mines propose raising the Stage 4 facility from a crest elevation of 1590mAMD to an elevation of 1594mAMD to form Stage 5. Stages I, II and III were constructed to an elevation of 1584mAMD. Stage 4 is a 7.5m high dam wall constructed on tailings and the proposed Stage 5 will consist of a 5.5m high dam wall constructed on tailings. The maximum height of the raised structure above the original ground level will be 27m and the minimum height will be 18m. The method of raising a dam wall on previously deposited tailings is a common practice in the mining industry and is termed the upstream method.
Golder Associates (UK) Limited (Golder) have been retained by Tara Mines for the site investigation, design and construction of the Stage 5 dam, in a similar arrangement to that for previous work undertaken by Golder during the period 1974 to 2006 for Stages I, II III 4A and 4B. A major component of the present work involves an assessment of the material which is available to construct the dam raise, the geotechnical behaviour of the foundation tailings and the performance of the existing Stage 4A and 4B raises on the tailings.
1.2 Project Description
Tara Mine is Europe's largest zinc and lead mine, and currently produces between 2.6 and 2.7 million tonnes of ore per annum and approximately 52% of the tailings, 1.06Mt, were discharged into the tailings whilst the remaining tailings were placed underground as backfill. Historically, approximately 48% to 52% of the mine tailings are discharged into the tailings facilities. The tailings used in backfill are the coarse fraction consisting mainly of sands separated via cycloning and the overflow material, the slimes, is discharged into Stage 4B. If no backfill is placed underground, the total tailings including the coarse fraction are discharged into the southern section of Stage 4B. A specially built causeway has been
For
insp
ectio
n pur
pose
s only
.
Conse
nt of
copy
right
owne
r req
uired
for a
ny ot
her u
se.
EPA Export 27-07-2013:00:02:53
March 2009 - 2 - 07514150008 A.2
Golder Associates
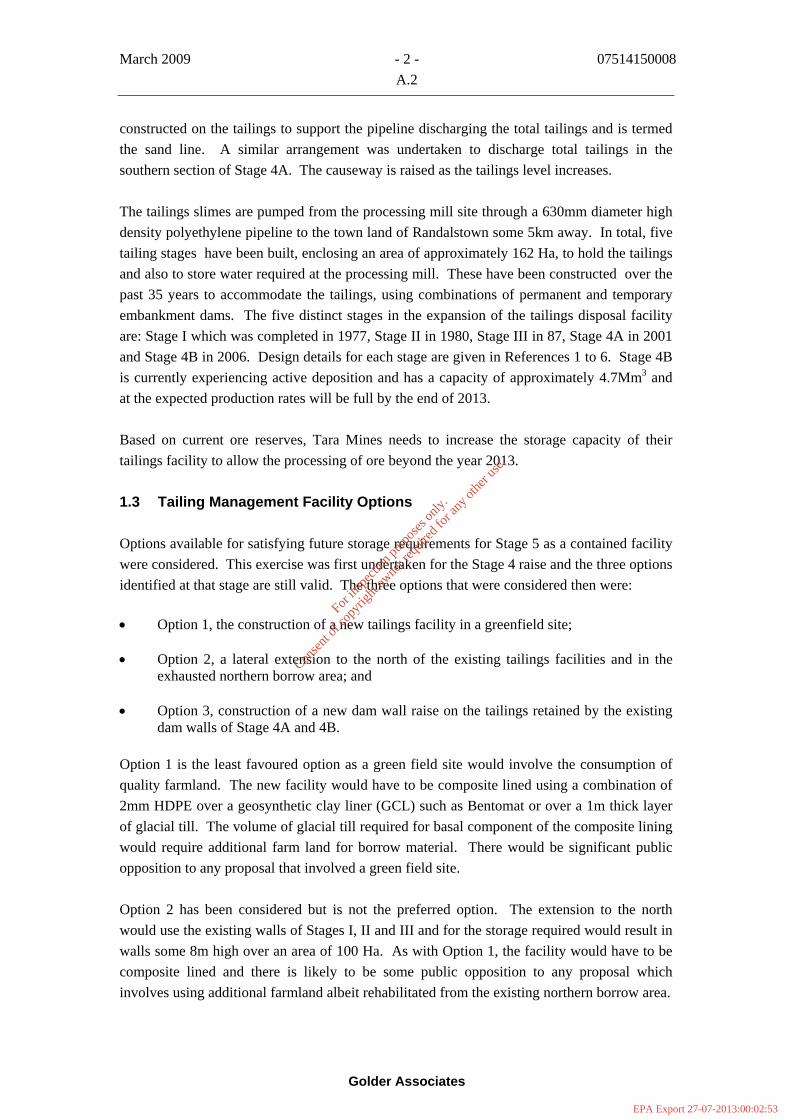
constructed on the tailings to support the pipeline discharging the total tailings and is termed the sand line. A similar arrangement was undertaken to discharge total tailings in the southern section of Stage 4A. The causeway is raised as the tailings level increases.
The tailings slimes are pumped from the processing mill site through a 630mm diameter high density polyethylene pipeline to the town land of Randalstown some 5km away. In total, five tailing stages have been built, enclosing an area of approximately 162 Ha, to hold the tailings and also to store water required at the processing mill. These have been constructed over the past 35 years to accommodate the tailings, using combinations of permanent and temporary embankment dams. The five distinct stages in the expansion of the tailings disposal facility are: Stage I which was completed in 1977, Stage II in 1980, Stage III in 87, Stage 4A in 2001 and Stage 4B in 2006. Design details for each stage are given in References 1 to 6. Stage 4B is currently experiencing active deposition and has a capacity of approximately 4.7Mm3 and at the expected production rates will be full by the end of 2013.
Based on current ore reserves, Tara Mines needs to increase the storage capacity of their tailings facility to allow the processing of ore beyond the year 2013.
1.3 Tailing Management Facility Options
Options available for satisfying future storage requirements for Stage 5 as a contained facility were considered. This exercise was first undertaken for the Stage 4 raise and the three options identified at that stage are still valid. The three options that were considered then were:
• Option 1, the construction of a new tailings facility in a greenfield site;
• Option 2, a lateral extension to the north of the existing tailings facilities and in the exhausted northern borrow area; and
• Option 3, construction of a new dam wall raise on the tailings retained by the existing
dam walls of Stage 4A and 4B. Option 1 is the least favoured option as a green field site would involve the consumption of quality farmland. The new facility would have to be composite lined using a combination of 2mm HDPE over a geosynthetic clay liner (GCL) such as Bentomat or over a 1m thick layer of glacial till. e of glacial till required for basal component of the composite lining would require additional farm land for borrow material. There would be significant public opposition to any proposal that involved a green field site.
Option 2 has been considered but is not the preferred option. The extension to the north would use the existing walls of Stages I, II and III and for the storage required would result in walls some 8m high over an area of 100 Ha. As with Option 1, the facility would have to be composite lined and there is likely to be some public opposition to any proposal which involves using additional farmland albeit rehabilitated from the existing northern borrow area.
The volum
For
insp
ectio
n pur
pose
s only
.
Conse
nt of
copy
right
owne
r req
uired
for a
ny ot
her u
se.
EPA Export 27-07-2013:00:02:53

March 2009 - 3 - 07514150008 A.2
Golder Associates
Option 3 is considered to be the most suitable and the preferred option. Tara Mines and Golder have considerable technical expertise raising on tailings having completed the construction and filled Stage 4A with no detrimental effects and having completed the construction of Stage 4B on recently deposited tailings. A 5.5m high low permeability clay embankment wall placed just inside the present embankment walls, on top of the Stage 4A and 4B tailings, would provide the required storage capacity. A chimney drain inside a clay embankment construction, very similar to the existing Stage 4 embankments would be used to control seepage and retain the tailings. The raise would be implemented in two phases. The first phase would be the construction of the Stage 5A wall within the Stage 4A facility and the second phase would be the construction of the Stage 5B wall within the Stage 4B facility. The existing tailings will act as a low permeability liner some 18m to 25m thick. The vertical permeability of the tailings will be controlled by the slimes which are likely to be of the order of 1E-9m/s to 1E-8m/s. It should be noted that 10m thickness of tailings at a permeability of 1E-8m/sec is equivalent to a 1m thick layer at 1E-9m/s. Land acquisition is less problematic under Option 3 as the borrow areas used to construct the walls will be returned to agricultural use. In addition, it presents the least environmental impact as large areas of additional land will not be placed under tailings; there would be no further encroachment toward adjacent residences; and the effect on ground and surface water, and other resources would be minimal.
Also consider was the reduction in the quantity of tailings required for disposal. Apart from disposal as mine backfill as currently done consideration was given to utilising tailings in cement production but this was rejected due to technical constraints.
The reclamation of the borrow areas and the tailings ponds will be discussed in a later report.
The design for the Stage 5 raise will be based on the design developed for Stage 4A raise (Reference 4) and modified and improved for the Stage 4B raise (References 5 and 6) using glacial clay/silt fill with a granular internal drainage, and has similar upstream and downstream slopes to the existing dams. The Stage 4 dam raise was a 7.5m raise on the tailings to a crest elevation of 1590mAOD. The Stage 5 dam raise will be a 5.5m rise on the tailings to a crest elevation of 1594mAMD.
The estimate of the quantities of the fill materials required to construct Stage 5 are 725,000m3 of locally borrowed material and 212,500m3 of imported granular material from the mine rock stockpile at Tara Mines.
All the previous embankment walls have been built using materials obtained chiefly from borrow areas on the site of their construction. This was an economical operation and also freed the surrounding roads from the disturbance that transporting large quantities of material entails. The Stage 5 dam raise will be constructed from materials obtained from two borrow areas located close to the tailings facility as discussed in Section 2.
For
insp
ectio
n pur
pose
s only
.
Conse
nt of
copy
right
owne
r req
uired
for a
ny ot
her u
se.
EPA Export 27-07-2013:00:02:53

March 2009 - 4 - 07514150008 A.2
Golder Associates
2.0 BORROW AREAS
2.1 General
There are two primary sources of materials on site to construct the Stage 5 raise and these are:
• The partially excavated northern borrow area; and • The seven fields borrow area.
The borrow area assessment for the northern borrow area and the seven fields borrow area are presented in References 7 and 8 respectively.
2.2 Northern Borrow Area
The northern borrow area was extensively used in the construction of Stage 4A and 4B raises and lies north of, and adjacent to, the Stages II and III tailings facility (Figure 2). It is bounded to the north by a road running east-west, to the east by a hedgerow and for part of the way by a stream, which also runs along the southern boundary before joining the Yellow River which forms the western boundary of the site. This stream is a diversion of an old stream which once ran to the south through the area now occupied by the Stages I and II tailings ponds. A north-south road, the former Randalstown Road, divides the borrow area in two. In the north of the borrow area there are two dwellings, one situated amongst associated farm buildings and the other in a wooded area.
Previously, the glacial material has been used from this borrow area for construction of Stage 4.
2.3 Seven Fields Borrow Area
2.3.1 General
This borrow area consists of approximately 17 hectares of mainly arable farmland and divided into seven fields, lying immediately to the north of Stage II tailings facility, Figure 2. It is bounded to the north and east by roads running approximately east-west and north-south respectively and to the west by a hedgerow separating it from the original northern borrow area. There is one dwelling existing in the north of the area.
Two 38 kV powerlines exist within the area, one running across the north of the area in a south-west direction and the other, in the southern half, running in a south-east direction, parallel to the east boundary of the area.
The surface topography of the area slopes gently from a ground elevation of 1580mAMD in the north, to 1577mAMD in the south. The area drains towards small ditches at the field boundaries.
For
insp
ectio
n pur
pose
s only
.
Conse
nt of
copy
right
owne
r req
uired
for a
ny ot
her u
se.
EPA Export 27-07-2013:00:02:53

March 2009 - 5 - 07514150008 A.2
Golder Associates
A brief description of the findings of the site investigation undertaken in the seven fields is presented below as this will be the principal borrow area.
2.3.2 Field Investigation
Soil conditions within the seven fields were investigated by excavating 22 trial pits to depths up to approximately 5m. Figure 4 shows the trial pit locations for the investigations.
The soils encountered in each pit are shown in the trial pit logs given in Appendix A Reference 8. Bulk samples were taken at intervals, generally from the horizons containing the most likely fill material. These were examined by the field engineer before being double-bagged and stored ready for testing. The elevations at which bulk samples were taken are indicated in the trial pit logs. All trial pits were backfilled on the day of their excavation. Standpipes were installed in 9 of the trial pits. These were positioned at or near to the level of the base of the trial pit which corresponds to the maximum depth recorded in the trial pit logs.
The maximum depth reached in each trial pit was generally dictated by the depth of bedrock or by numerous boulders, as recorded on the trial pit logs.
2.3.3 Subsurface Conditions
In general, the deposits found in the seven fields consisted of a sequence of distinct till deposits underlying the topsoil. From the surface down these comprise the following:
a) An orange/brown becoming grey with orange/brown mottling, slightly sandy, very silty clay/clayey SILT, with some gravel and occasional cobbles and boulders. This is predominantly a firm to stiff material and in this area ranges from 0.4m to 1.8m thick and averages at 1.0m thick. This soil type usually contains some organic material;
b) A brown to grey/brown silty sandy CLAY with some to much gravel, some cobbles and
occasional boulders. This is generally a soft to firm material which ranges from 0.5m to 1.7m thickness within this area, with an average of 1.1m; and
c) A grey to dark blue/grey silty sandy CLAY with some to much gravel, occasional to
some cobbles and occasional boulders. This soil type is generally soft to firm in strength and varies in thickness between 0.5m and 2.0m with an average of 0.9m.
The last soil type described above generally becomes a dark blue/grey sandy, clayey GRAVEL with an increase in cobbles and boulders content with depth, generally showing that it is near to bedrock. Bedrock was encountered at depths between 2.25m and 4.8m.
Another soil type often encountered consisted of an orange/grey to grey/brown slightly silty, clayey SAND and GRAVEL with occasional cobbles and boulders. This deposit predominantly occurs below the clays in the southern half of the area.
For
insp
ectio
n pur
pose
s only
.
Conse
nt of
copy
right
owne
r req
uired
for a
ny ot
her u
se.
EPA Export 27-07-2013:00:02:53

March 2009 - 6 - 07514150008 A.2
Golder Associates
2.3.4 Groundwater Levels
Standing water levels could not generally be obtained as the trial pits were backfilled soon after excavation to avoid endangering livestock. Where groundwater was observed seeping into the trial pits, the inflow elevations were recorded and are noted on the trial pit logs. These are not an accurate indication of the natural groundwater surface elevation as the low permeability tills retard water flow and the elevations at which seepages were first observed are generally the elevations at which relatively permeable granular deposits first arise below the natural groundwater table. Nine standpipes were installed in the trial pits within the additional land and the groundwater levels recorded were between 2m to 3m below ground level in summer and 1m to 2m in winter.
2.3.5 Laboratory Testing
Properties of the soil deposits encountered in the seven fields were evaluated through a laboratory testing programme which included classification tests to determine index properties of the soils together with, compaction, strength, permeability and organic content tests on selected samples.
Samples selected for laboratory testing were generally of the soil types consisting of the most likely fill material. Results of the laboratory tests are discussed under the relevant headings in the following sections of this report, in relation to the three soil types most suitable for use as fill material.
These soil types can generally described as:
a) Light grey silty clay; b) Brown/grey silty sandy clay; and c) Blue/grey silty sandy clay.
Though the soils can be sub-divided visually, they are very variable (typical of glacial deposits) and there is a broad range of properties applicable to each division.
The majority of the laboratory testing was carried out by Irish Geotechnical Services, however samples requiring permeability, compaction and triaxial testing, in addition to classification tests, were sent to Trinity College, Dublin.
2.3.6 Moisture Content and Atterberg Limits
Atterberg Limit classification tests were carried out to determine the degree of plasticity of selected samples of soil showing some cohesion. The tests were conducted on the finer fraction of the material (particles less than 425µm) and hence they cannot be used alone to characterize the soil. A comprehensive soil description, and where available, particle size distribution curves and moisture content are provided in addition to the Atterberg limits.
For
insp
ectio
n pur
pose
s only
.
Conse
nt of
copy
right
owne
r req
uired
for a
ny ot
her u
se.
EPA Export 27-07-2013:00:02:53
March 2009 - 7 - 07514150008 A.2
Golder Associates
The majority of the results indicate clays of low plasticity with only a few of intermediate plasticity. Liquid limits varied between 22% and 39% and plastic limits between 13% and 23%. Virtually all the materials had a plasticity index greater than 10% and less than 20%.
In general the light grey silty clay have a higher plasticity index than the brown/grey silty sandy clay, which in turn has a slightly higher plasticity than the grey blue silty sandy clay. Nearly all the silty sandy clay and silty clay results fall into a relatively well defined area which indicates that the samples have been taken from deposits which are geologically similar despite their different appearances.
2.3.6.1 Light Grey Silty Clay
The liquid limit of this material ranges from 25% to 39%. The plastic limit was found to vary from 14% to 23% and the plasticity index from 10 to 19%. The natural moisture content varies from 8.8% to 22% with a mean of 15%.
2.3.6.2 Brown/Grey Silty Sandy Clay
The liquid limit of this material ranged from 22% to 30%. The plastic limit ranged from 13% to 16% and the plasticity index from 9% to 14%. The natural moisture content varied from 7.8% to 20%, with a mean of 12%.
2.3.6.3 Blue/Grey Silty Sandy Clay
The liquid limit of this material ranged from 23% to 25%, the plastic limit from 13% to 15% and the plasticity index from 9% to 10%. The natural moisture content varied between 10% and 13% with an average of 12%.
These materials are very similar to the cohesive till deposits found in the Northern borrow area used for the construction of Stage 4A and 4B and it can be seen that the above cohesive till deposits, discussed in the same sequence as they occur in the field, indicate a decreasing plasticity index with depth and a decreasing water content with depth.
2.3.7 Particle Size Distribution
The grading curves from the results of particle size analyses on 27 samples of the overburden indicate the fines content (percentage of the material smaller than 0.06mm) for each sample is variable with a range from 10% to 74%. The grading curves are typical of glacial deposits, generally showing the presence of a broad range of particle sizes. There is a very wide range of material types ranging from clays containing as little 26% sand and gravel sized material to gravels containing 10% fines. There is a general tendency for the blue/grey silty sandy clays to be coarser than the brown-grey silty sandy clays which in turn are coarser than the light
For
insp
ectio
n pur
pose
s only
.
Conse
nt of
copy
right
owne
r req
uired
for a
ny ot
her u
se.
EPA Export 27-07-2013:00:02:53

March 2009 - 8 - 07514150008 A.2
Golder Associates
grey silty clays, which correlates with the variations in the plasticity index for these materials noted above.
As mentioned previously, the blue/grey silty sandy clay becomes a clayey sandy gravel, increasing in cobbles and boulders content with depth. However, samples were not selected for testing from the gravels because these are not classed as being a suitable dam fill material.
2.3.8 Soil Compaction
Standard laboratory compaction tests were performed on 6 samples and it was considered that the test samples are representative of the range of tills that were encountered in the borrow area.
The maximum dry densities range from 1.8Mg/m3 to 2.18 Mg/m3 and the optimum moisture contents range from 8% to 17%. In general, the higher densities are associated with tills containing the lowest percentage of fine material.
In general, glacial materials suitable for use as fill should have a natural moisture content not exceeding its standard Proctor optimum moisture content by more than 3% to 4%. The results therefore indicate the material in the additional borrow area may be suitable for use as fill. The results here are similar to those found for the original Northern borrow area.
2.3.9 Shear Strength
The till samples that were selected for compaction testing were also tested to determine their undrained shear strength. The test samples were remoulded and compacted in a similar manner to the standard Proctor compaction tests. The moisture content was varied to establish the relationship between undrained strength and water content for the standard compactive effort. As expected there was a significant reduction in remoulded shear strength with increasing moisture content. Typically the remoulded strength at natural moisture content have strengths ranging between 23 and 152 kPa. At the higher strength end, the reduction in strength can be as much as 4 times with an increase in moisture content as little as 3% but is very much dependant on the plasticity of the material.
Unconsolidated-undrained tests give strengths which are relevant during and up to the end of construction. The significance of the undrained shear strength results relates to possible rutting from construction traffic as discussed later.
In the long term, the strength of the glacial till will be dependant on the effective strength parameters of the material, From past testing and current testing, the frictional angle of the glacial till will be between 33 and 36 degrees and the effective cohesion of between 5 and 15kPa reducing to zero in the very long term.
For
insp
ectio
n pur
pose
s only
.
Conse
nt of
copy
right
owne
r req
uired
for a
ny ot
her u
se.
EPA Export 27-07-2013:00:02:53
March 2009 - 9 - 07514150008 A.2
Golder Associates
2.3.10 Permeability Testing
Permeability tests were carried out on selected samples of soil in a triaxial cell with a constant head difference between the top and bottom ends of the sample. Only the fractions of each sample passing the BS 6.3mm sieve were used. The samples were first saturated and then permeated until stable readings were obtained with the water inflow rate equal to the outflow rate indicating steady state conditions.
Six soil samples from the borrow area were tested; the sample size was 101.6mm diameter by 116.4mm high at a mean effective stress of 65 kPa. The average effective stress for each sample was calculated from the mean of the differences between the confining pressure and the head applied to each end of the sample. The range of permeabilities for the tills was from 7.5E-11 to 1.3E-9 m/s.
2.3.11 Organic Content
The organic contents of 4 of the light grey silty clay overburden samples were found using dichromate oxidation, BS 1377. Measurements of the organic content ranged from 0.2% to 8.5%. The organic content affects the interpretation of the measured sample properties. For example, a sample with a high organic content will retain a high percentage of water, reduce the amount of compaction possible and increase the plasticity index. The organic contents that were measured indicate that the undisturbed till has a low organic content although care will be required to recognise materials containing root material etc which will be excluded in construction.
2.4 Operation of Earthmoving Plant
The moisture content of cohesive fills affects the ability of earthmoving plant to operate efficiently, as well as affecting the stability of embankment construction. The considerations of earthwork stability and settlement which determine the upper limit of moisture content for the use of cohesive fill have been addressed in the Stage 4 raise design report (Reference 4). The performance of wheeled vehicles on fill is chiefly governed by the soil-tyre/track interaction, which, in simple analogy with a foundation is determined by the strength of the supporting soil and therefore its water content.
Several methods are generally used to assess the condition of cohesive fill: the ratio of moisture content to plastic limit and the shear strength. Both have advantages and disadvantages. The shear strength is a direct measure of suitability but it is not feasible to test a large enough number of samples to gain an accurate picture of the situation. Generally only a small number of tests, sufficient to characterise the fill, is undertaken.
As discussed in Section 2.3.8, the six undrained triaxial tests from the additional borrow area gave in-situ strengths of between 23kPa and 152kPa for the fill at natural moisture content.
For
insp
ectio
n pur
pose
s only
.
Conse
nt of
copy
right
owne
r req
uired
for a
ny ot
her u
se.
EPA Export 27-07-2013:00:02:53

March 2009 - 10 - 07514150008 A.2
Golder Associates
The lower part of this range in strength would make the dump truck operation problematic due to potential deep rutting. The minimum strength to prevent rutting is about 40kPa for the 25/30 tonnes dump trucks that will be permitted for construction. Therefore, the wetter materials will need to be worked (dried) prior to compaction.
Suitability of fill materials can also be evaluated from the ratio of moisture content to plastic limit. The results for the six sets of unconsolidated-undrained triaxial tests, carried out on soil samples indicate that a ratio of between 1.2 and 1.3 will give an undrained strength of 40kPa or more, the requirement for dump truck operations to prevent severe rutting.
Based on the results, it can be seen that in nearly all cases the samples have water contents below that required to give a strength of 40kPa , i.e. their strengths are higher than required. Also, a small proportion of the light grey silty clay, perhaps 10% to 15%, is too wet to be handled by dumpers and an allowance has been made for this in the calculation of available fill material.
2.5 Estimation of Quantities of Available Fill Materials
2.5.1 Northern Borrow Area
The remaining materials in the northern borrow area are approximately:
• 250,000m3 of Type A1 glacial till material; • 240,000m3 of glacial Type A2 glacial till material; and • 30,000m3 of granular Type A3 glacial till material.
The total volume remaining in the northern borrow area is approximately 520,000m3.
2.5.2 Seven Fields Borrow Area
From the results of the various site investigations and experience from the construction of the Stage I, II and III dams, it is considered that much of the glacial till available within the seven fields area is suitable for use as either Type A1 or Type A2 fill material. Material suitable for use as fill was mainly designated as such on the basis of the soil description with account being taken of the material grading in relation to fines, cobbles and boulders content. With too little fines, soil material becomes weather sensitive and difficult to handle and with too high a proportion of material of cobble size and above there may be difficulties with excavation, placement and compaction.
The materials satisfying the above requirements were divided into Type A1 and Type A2 grades as indicated above. The division between these two grades can best be decided through permeability tests on the re-compacted material; Type A1 material being that which consistently records a permeability less than, say, 10-9 m/s. However, it would have been impractical to carry out sufficient permeability tests to characterise the variable glacial
For
insp
ectio
n pur
pose
s only
.
Conse
nt of
copy
right
owne
r req
uired
for a
ny ot
her u
se.
EPA Export 27-07-2013:00:02:53
March 2009 - 11 - 07514150008 A.2
Golder Associates
deposits in the borrow areas in this way. Material was therefore designated Type A1 or Type A2 on the basis of its plasticity index, a parameter which, when considered in the light of other properties such as the clay content, gives a reasonable indication of the soils likely permeability after compaction. Consideration was also given to the in-situ water content in comparison with that required for optimum compaction. The results of index tests were available for only some of the soil deposits. For the remaining deposits, the soil description was used to classify the material. This was accomplished through assigning each soil to one of the generalized soil categories, for each of which a number of test results was available.
The information available for the generalized descriptions gave an indication of the percentages of Type A1, Type A2 and the reject material consisting of cobbles and boulders each contained. A high percentage of the light grey silty clay is Type A1 grade, the grey-brown silty clay, which generally does not have a distinct boundary with the overlying light grey silty clay, contains percentages of both Type A1 and Type A2 grade material and the blue/grey silty sandy clay generally consists of Type A2 grade material. Without sharp changes in soil colour or obvious soil characteristics which can be used to distinguish between different grades of material, it is likely that even with tight control in the borrow area a significant proportion of the Type A1 material may be lost through mixing with Type A2 material. Also, in some cases it may not be possible to separate Type A1 material from within a mass of Type A2 material, even if it is clearly identifiable.
The estimated proportion of Type A1 and Type A2 material found in each trial pit excavated in the seven fields borrow area was used as a basis for determining the amount of material available in the surrounding area. With this assumption the following quantities of Type A1 and Type A2 material have been estimated as 170,000m3 and 163,000m3 respectively. The glacial deposits are extremely variable and there is therefore some degree of uncertainty associated with this and the other estimates. An allowance has been made for the small quantity of material which presently has too high an in-situ water content. The in-situ water content of the majority of material is close to its optimum water content to permit its immediate use, although de-watering may allow wetter material to be used. There is also 45,000m3 of Type A3 material identified in the seven fields borrow area and the total volume of glacial till materials is approximately 378,000m3.
2.5.3 Clay Fill Requirements
Calculations based on the design work have identified a requirement for 426,000m3 of glacial till in the construction of the Stage 5A dam wall, and a further 299,000m3 of glacial till in the construction of the Stage 5B dam wall. The volumes include an allowance for settlement of the tailings material under the raise. The raise will be zoned with the upstream half comprising the more clayey, and therefore less permeable portion of the fill (Type A1). The less clayey material is termed Type A2 and placed on the downstream sector of the dam wall. This generally conforms with the designations used during construction of the previous dam stages. Approximately 46% of the total requirement for clay fill is for Type A1 material.
For
insp
ectio
n pur
pose
s only
.
Conse
nt of
copy
right
owne
r req
uired
for a
ny ot
her u
se.
EPA Export 27-07-2013:00:02:53
March 2009 - 12 - 07514150008 A.2
Golder Associates
In addition to the clay quantities described above, there is a requirement for a downstream drainage blanket. The natural sands and gravels available in the borrow area and termed Type A3, will form the lower 750mm of the drainage blanket. The volume of Type A3 required is some 72,000m3. If the Type A3 contains to much fine material, it will be replaced with imported mine rock (Type B). The upper 250mm of drainage blanket material will be imported processed mine rock (Type B) from the mine site together with a coarser drainage material (Type C) used for the toe drains. The total volume of Type B and Type C material is approximately 51,500m3.
2.6 Summary and Conclusions
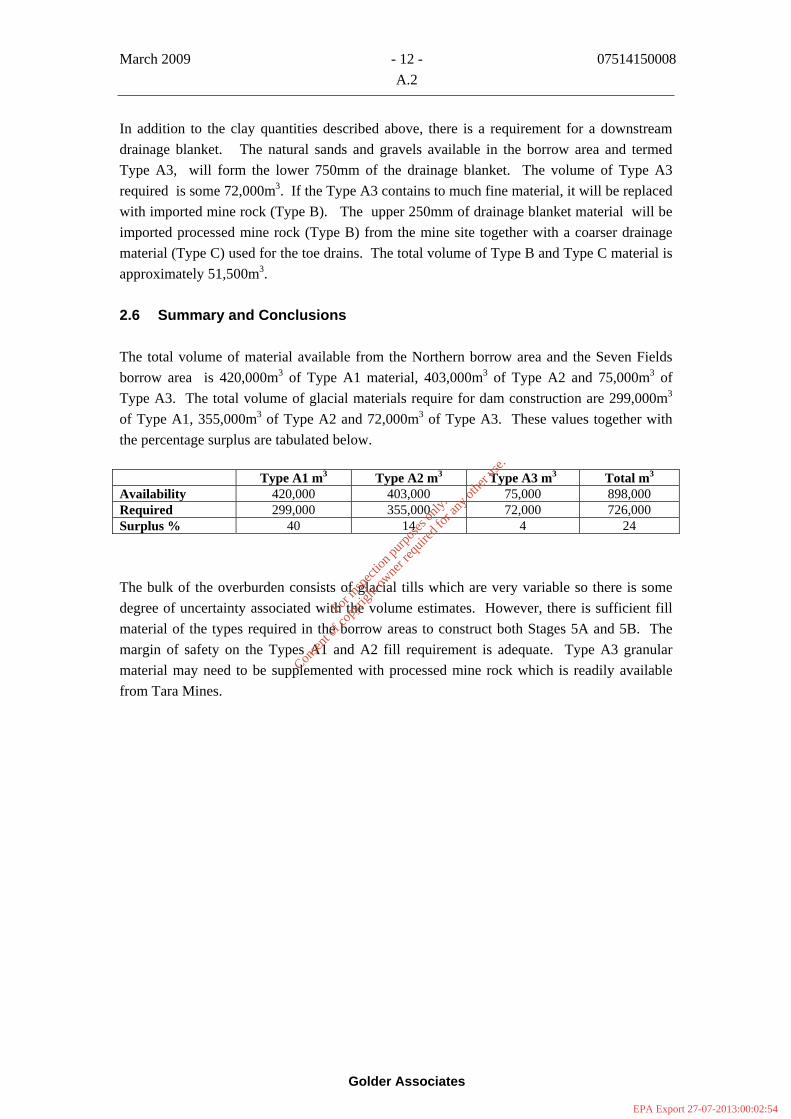
The total volume of material available from the Northern borrow area and the Seven Fields borrow area is 420,000m3 of Type A1 material, 403,000m3 of Type A2 and 75,000m3 of Type A3. The total volume of glacial materials require for dam construction are 299,000m3 of Type A1, 355,000m3 of Type A2 and 72,000m3 of Type A3. These values together with the percentage surplus are tabulated below.
Type A1 m3 Type A2 m3 Type A3 m3 Total m3 Availability 420,000 403,000 75,000 898,000 Required 299,000 355,000 72,000 726,000 Surplus % 40 14 4 24
The bulk of the overburden consists of glacial tills which are very variable so there is some degree of uncertainty associated with the volume estimates. However, there is sufficient fill material of the types required in the borrow areas to construct both Stages 5A and 5B. The margin of safety on the Types A1 and A2 fill requirement is adequate. Type A3 granular material may need to be supplemented with processed mine rock which is readily available from Tara Mines.
For
insp
ectio
n pur
pose
s only
.
Conse
nt of
copy
right
owne
r req
uired
for a
ny ot
her u
se.
EPA Export 27-07-2013:00:02:54
March 2009 - 13 - 07514150008 A.2
Golder Associates
3.0 CURRENT PERFORMANCE OF THE EXISTING TAILINGS FACILITIES
3.1 General
Constructing an embankment dam wall on the Stage 4 tailings and filling with tailings will have an impact on the existing facilities. Therefore, the performance of the existing facilities is important in understanding the impact of raising.
Tara Mines is required under the terms of their IPPC license to monitor the performance of their tailings management facilities on an ongoing basis and to ensure an independent annual audit is carried out.
There are a significant number of monitoring instruments that have been installed into Stages I, II and III consisting of Casagrande standpipe piezometers and Stages 4A and 4B consisting of vibrating wire and Casagrande standpipe piezometers, inclinometer/extensometers, settlement plates and movement monuments. During the construction of Stage 4A and Stage 4B dam walls, the reaction of the foundation tailings was monitored in terms of deformation and pore pressure development in order that the rate of construction could be controlled and the foundation tailings not over stressed. The flow rate and water quality of the perimeter interceptor channel is monitored together with the flow rate and water quality emanating from the internal drainage system on Stages 4A and 4B.
The results of the 2008 audit is presented in Reference 9 and a summary of the findings is given below.
3.2 Piezometric Monitoring Data Stages I, II & III
3.2.1 General
Figure 5 shows the plan location of the piezometers and seepage monitoring points in Stages I, II, and 4A and Figure 6 shows plan locations of piezometers and seepage monitoring points in Stage III and 4B.
3.2.2 Stages I and II
In summary, the piezometric levels recorded by the piezometers in Stages I and II are stable and relatively low. It is apparent that the levels have not been affected by the rise in pond water during the filling of Stage 4A as indicated on Figures 7 to 9. There has only been slight seasonal fluctuations in piezometric level and generally less than 0.5m compared with the rise of pond water level in Stage 4A of 8m. The internal drainage system incorporated in all the dam stages prevents any build up of piezometric pressure in the downstream dam wall and are fully operational.
For
insp
ectio
n pur
pose
s only
.
Conse
nt of
copy
right
owne
r req
uired
for a
ny ot
her u
se.
EPA Export 27-07-2013:00:02:54

March 2009 - 14 - 07514150008 A.2
Golder Associates
3.2.3 Stage III
In Stage III, the piezometers are located in five clusters with six Casagrande piezometers installed in each cluster. A section through cluster 1 is presented in Figure 10. The other clusters have a similar spatial arrangement. In summary, over the last few years, the pond water elevation in Stage III remained around 1580.5mAMD to 1582mAMD. Stage 4B is now in operation and the pond water level has risen to nearly 1584.0mAMD. The piezometers located in the upstream shoulder of the dam and upstream of the internal drainage system have had a varied albeit limited response to the slight pond water increase as shown on Figures 11 to 15. The exception is 3/5/1 (Figure 15) which has risen some 2m. Those piezometers downstream of the internal drainage system are generally dry and are not responding to the rise in pond water indicating that the drainage system is operating as per the design. These piezometers will continue to be monitored on a monthly basis as Stage 4B is filled.
3.2.4 Stage 4A
During the construction of Stage 4A, a considerable amount of instrumentation was installed to monitor the reaction of the tailings to loading and the dam wall. The majority of instrument were installed in six cluster (400, 1000, 1600, 2200, 2800 and 3400) as shown on Figure 5. A typical section through a cluster (400) showing the locations of the instruments is presented in Figure 16. The piezometric elevations monitored in Stages 4A will be discussed in two sections:
• Stage 4A dam fill; and • tailings foundations of the Stage 4A dam raise.
3.2.4.1 Stage 4A dam fill
As shown in Figure 16, one piezometer (A) was installed upstream of the chimney drain, a second piezometer (B) was installed downstream of the chimney drain at the elevation of the top of the drainage blanket, and the third piezometer (C) was installed close to (B) but around 0.7m to 1.5m higher, in the fill. Piezometer (D) was installed on the lower section of the downstream side of the dam wall. It can be expected that piezometer (A), upstream of the chimney drain will indicate high piezometric levels and respond to the rise in pond water level reasonably rapidly. Those piezometers downstream of the chimney drain read low piezometric values, either indicative of residual construction pore pressures or rainfall infiltration. Any seepage through the dam wall will be intercepted by the chimney drain.
In cluster 400 (Figure 17), the upstream piezometer had measured a maximum piezometric head of 1587.7mAMD which is around 0.8m below the water level in Stage 4A which is not an issue to the stability of the dam as the upstream component of the dam wall is buttressed by the tailings and pond water. In cluster 1000 (Figure 18), the upstream piezometric head is currently at 1586.2mAMD and about 1.3m below the water level in Stage 4A The upstream
For
insp
ectio
n pur
pose
s only
.
Conse
nt of
copy
right
owne
r req
uired
for a
ny ot
her u
se.
EPA Export 27-07-2013:00:02:54

March 2009 - 15 - 07514150008 A.2
Golder Associates
piezometric head in cluster 1600 (Figure 19) has been falling from a high value of 1585.1mAMD to its current value at 1584mAMD some 3.5m below the pond water level. In cluster 2200 (Figure 20), the upstream piezometer is currently reading 1583.5mAMD some 4m below the pond water level. In cluster 2800 (Figure 21), the upstream piezometric head is some 2.6m below the pond water level while at cluster 3400 (Figure 22) indicates a piezometric level between 1584.0mAMD and 1585mAMD.
Generally, the piezometric surface upstream of the internal drainage system has varied between 1583.5mAMD 587.7mAMD. The variation in piezometric level upstream of the chimney drain is a function of the piezometric gradient from the pond water level adjacent to the upstream dam wall and the chimney drain. This gradient would be steepening downwards to the chimney drain and therefore the piezometric reading will be dependent on the exact location of the piezometer. Other factors would be the depth of tailings adjacent to the wall and whether the tailings are fine slimes or the coarser total tailings. As discussed previously for cluster 400, the upstream dam wall is buttressed by the tailings and pond water so there are no stability issues.
Nearly all the Casagrande standpipe piezometers installed downstream of the internal drainage system are virtually dry or are impacted by rainfall infiltrating the surface of the dam wall. This indicates that the internal drainage system is operating in accordance with the design. The exceptions are the clusters at 2800 and 3400 on the dividing wall between Stages 4A and 4B where the furthest downstream standpipe is responding to the rise in pond water as a consequence of operating Stage 4B. The rise in piezometric level on the downstream side of the dividing wall will not result in any stability issues as the downstream slope will be buttressed by the water and tailings deposited in Stage 4B.
The downstream stability of the embankment is governed by the piezometric head in the dam wall. A stability sensitivity analysis has been undertaken to determine the acceptable level of head within the embankment for Stage 4A and Stage 4B. The analysis shows that the maximum acceptable level of piezometric head under static conditions is 1587mAMD, for which the corresponding factor of safety is 1.3. This would correspond to a piezometric head in the embankment wall equivalent to 60% of its height. However, this maximum piezometric head relates only to the head that would be read in the Casagrande piezometers B and C located directly downstream of the chimney drain. High piezometric levels in these would indicate that the drain is not functioning properly.
Under current conditions, the piezometric heads monitored in all piezometers in the dam wall of Stage 4A are acceptable in terms of the design criteria for the raise.
3.2.4.2 Tailings foundations of the Stage 4A dam raise
and 1
The vibrating wire piezometers were installed in the foundation tailings to determine the rise in pore pressure during construction of the raise. However, the tailings had been placed
For
insp
ectio
n pur
pose
s only
.
Conse
nt of
copy
right
owne
r req
uired
for a
ny ot
her u
se.
EPA Export 27-07-2013:00:02:54

March 2009 - 16 - 07514150008 A.2
Golder Associates
several years prior to construction and therefore are mature and stronger. The response of the foundation tailings due to loading is discussed in Section 5 for Stage 4B.
Monitoring of the vibrating wire piezometers in the tailings foundations is undertaken to ensure that pore pressures are not excessive beneath the downstream toe of the Stage 4A raise caused by a rising pond water level. If the dam was completely impermeable, a rise in the pond water would result in an equal rise in the piezometric level in the foundation tailings. However, neither the dam raise nor the existing Stages I and II dam walls or basin areas are completely impermeable. Therefore, the actual response and the piezometric elevation are partly dependent on the location of the piezometer in terms of the distance from the upstream toe and hence pond water and the depth of the piezometers e piezometers closest to the upstream toe of the Stage 4A dam wall generally gave higher piezometric levels reflecting the shorter seepage path from the pond water and the influence of the potentially higher horizontal permeability of the tailings. The horizontal permeability of the tailings is anticipated to be at least ten times greater than the vertical permeability due to stratification during deposition. The deeper the piezometers are located, generally the lower expected values of the vertical permeability of the tailings for a given tailings grain size distribution and the potential effects on the piezometric level as a result of a downward hydraulic gradient into the foundations although this is considerably variable.
Cluster 400 (Figure 23) shows a wide range of piezometric values both laterally across the base of the dam wall and vertically into the tailings. Generally, the piezometric levels are falling and following the trend of the fall in the pond water level in Stage4A. The current maximum difference in the piezometric level between the upstream toe piezometer and the deepest downstream piezometer is approximately 2.8m. The lowest piezometric level is currently some 6.25m (1580.5mAMD-400B) below the pond level. The highest 2008 piezometric level recorded was 1584.5mAMD (400A) in the foundation tailings on the upstream dam side and 1582.25mAMD (400D) in the foundation tailings on the downstream side of the dam raise.
The clusters at 1000 (Figure 24), 1600 (Figure 25) and 2200 (Figure 26) also reflect the variable permeability of the tailings, the effectiveness of the internal drainage system in the dam wall and the general impact of a downward hydraulic gradient. The piezometric levels in these three clusters are decreasing slightly from the high achieved at the point where the pond level was at a maximum. In these three clusters, the highest piezometric levels monitored in the foundation tailings, on the downstream side of the dam raise, were generally below 1583mAMD which is considerably below the pond water level at 1587.5m AMD for December 2008.
The clusters at 2800 (Figure 27) and 3400 (Figure 28), located on the dividing wall between Stages 4A and 4B, show similarities to the trends observed in cluster 400, with the highest piezometric levels monitored some 1.75m to 2.25m below the pond water level at its December 2008 level of 1585.75mAMD. Unlike the other piezometers, there has been a
. As a general guide, th
For
insp
ectio
n pur
pose
s only
.
Conse
nt of
copy
right
owne
r req
uired
for a
ny ot
her u
se.
EPA Export 27-07-2013:00:02:54

March 2009 - 17 - 07514150008 A.2
Golder Associates
noticeable increase in the piezometric level reflecting the rise in pond water of Stage 4B which is operational. This is clearly apparent from Figures 27 and 28. The downstream piezometric levels in clusters 2800 and 3400 are at 1584.5mAMD and 1584.75mAMD respectively. As the pond water continues to rise in Stage 4B, it can be expected that the piezometric levels will also increase. However, this will not result in instability of the dam wall as both the upstream and downstream sectors will be supported by the tailings and water.
The piezometric levels in the downstream tailings foundation of the dam wall will affect the long term stability of the dam wall except for the dividing wall between Stages 4A and 4B. The stability analysis indicates that as the piezometric level in the downstream sector of the foundation tailings increases, the factor of safety decreases as illustrated below.
Piezometric Elv.mAMD Factor of Safety (Static) 1588.0 1.08 1587.5 1.20 1587.0 1.31 1586.5 1.40 1586.0 1.78 1584.0 2.00 1583.5 2.25
It is clear that the piezometric elevation in the tailings foundation on the downstream side of the dam wall should not exceed 1587mAMD or approximately 1.5m below the pond water level during operations. The recent monitoring data indicates that the maximum piezometric level in the downstream foundation tailings of the dam raise is less than 1583mAMD (5.5m below the maximum pond level at 1588.5mAMD and 4.5m below the current pond level at 1587.5mAMD) which would indicate a factor of safety greater than 2 which is satisfactory. The same analysis is developed for the Stage 5 dam raise as given in Section 7.3.3.
3.2.5 Stage 4B
During the construction of Stage 4B, a considerable amount of instrumentation was installed to monitor the reaction of the tailings to loading and the dam wall. The majority of the instruments were installed in six clusters (150, 510, 850, 1300, 1750 and 2200) as shown on Figure 6. A typical section through a cluster (510) showing the locations of the instruments is presented in Figure 29.
The majority of the piezometers were installed in the tailings foundation of the Stage 4A dam raise, but a few were installed in the dam fill to measure any construction pore water pressures and the performance of the internal drain. Typically each of the six clusters would consist of five Casagrande piezometers and seven vibrating wire piezometers. The results of the vibrating wire piezometers are presented in Figures 30 to 35 and the results from the Casagrande standpipe piezometers are presented in Figures 36 to 41. The piezometric elevations in Stage 4B will be discussed in two groups.
For
insp
ectio
n pur
pose
s only
.
Conse
nt of
copy
right
owne
r req
uired
for a
ny ot
her u
se.
EPA Export 27-07-2013:00:02:54

March 2009 - 18 - 07514150008 A.2
Golder Associates
• Stage 4B dam fill; and • Tailings foundations for the Stage 4B dam raise.
3.2.5.1 Stage 4B Dam Fill
Vibrating wire piezometers were installed in the fill at Cluster 150 (Figure 30), 850 (Figure 32), 1750 (Figure 34) and 2200 (Figure 35) to measure construction pore pressures. If the fill is partially saturated, then the readings are likely to be erroneous. For VW150H, with a tip level at 1586.5mAMD, the piezometric level measured over the 2008 monitoring period was slightly above this installation elevation. However, for VW850H at an elevation of 1586.6mAMD, VW1750H at an elevation of 1586.5mAMD, VW2200H at an elevation 1586.5mAMD and VW2200G at an elevation 1584.02mAMD, the piezometric levels monitored are below their installation depth. Vibrating wire piezometer VW850G at a tip elevation of 1583.83mAMD is indicating a piezometric level of 1584mAMD. Only VW2200G and VW850G measured any construction pore pressures during construction. During the 2008 monitoring period, the pond water in Stage 4B has risen with a peak August value approaching 1584mAMD. This level will continue to rise as tailings are placed into Stage 4B.
The Casagrande standpipe piezometers installed into the dam fill, SP150D (Figure 36), SP850D (Figure 38), SP1300D (Figure 39), SP1750D (Figure 40), and SP2200D (Figure 41) were dry.
3.2.5.2 Tailings foundations and at the upstream toe of Stage 4B dam raise
The maximum pond water level in Stage 4B was in August 2008 at a level of just below 1584mAMD. As the pond water is rising, the vibrating wire and Casagrande standpipe piezometers installed into the foundation tailings are slowly responding.
Two of the Casagrande F series piezometers indicate perched water in the drainage blanket, SP150F (Figure 36) and SP850F (Figure 38). The others are showing some movement with the fluctuating pond water level although this may become more apparent as the pond water level increases.
It is rather too early to evaluate the response of the vibrating wire and Casagrande piezometers to the rise in the pond water level other than to say they are responding and therefore the instruments are operational. The instruments will continue to be monitored as the facility is filled.
For
insp
ectio
n pur
pose
s only
.
Conse
nt of
copy
right
owne
r req
uired
for a
ny ot
her u
se.
EPA Export 27-07-2013:00:02:54
March 2009 - 19 - 07514150008 A.2
Golder Associates
3.3 Seepage Monitoring
3.3.1 Stages I, II, III
Prior to construction of the Stage 4 raise, seepage emanating through the dam wall and runoff from the dam wall together with groundwater was measured in the eastern and western perimeter interceptor channel which is found on the downstream toe of Stages I, II and III respectively. It is therefore very difficult to attribute the amount of seepage emanating from the internal drainage system of Stages I, II and III by monitoring the perimeter interceptor channel. Flow in the channel is dominated by rainfall as the channel collects all of the surface runoff falling on the downstream slopes of all the dam walls. In a number of localities, the interceptor channels also intercept the ground water table. The western perimeter channel around the Stage III facility is further complicated because some seepage has been pumped back directly to Stage III and now pumped into Stage 4B after the completion of its construction. During construction of Stage 4B, the water was pumped over a high point and back into the interceptor channel. The eastern perimeter interceptor channel also collects seepages from the Stage 4A raise.
From seepage modelling of the tailings (Section 7.5.2) the expected seepage from the base of Stages I, II and III are likely to vary between the order of 0.35l/s and 1.25l/s. Based on the monitoring records in the eastern perimeter interceptor channel (Figure 42 ) of which there are five weirs where flow rates are monitored, the lower bound flow rates recorded per linear m of dam wall are less than 2l/m/hour which equates to a flow rate of 3l/s over the entire dam alignment of Stages I, II and III. This is an over estimate as the monitoring data are affected by the interception of groundwater, surface rainfall runoff and seepage from Stage 4A. The volume of water emanating from the eastern sector at the end weir at chainage 2125-St4A South Wall varies over the year because the flow rate is dominated by rainfall. Typically the variation on the eastern perimeter interceptor channel is between 2l/s during summer to 28l/s in a wet winter. The lowest readings monitored have been approximately 1l/s in June 2008 and zero in June 2003 and August 2006. In very hot and dry conditions evaporation would have a significant effect on any water flowing in the perimeter interceptor channel or from any seepage water emanating from the dam wall internal drainage system. The flow rate of water along western perimeter interceptor channel (Figure 43) are monitored from six weirs. The maximum flow rate is given from the end weir at chainage 2128-Stage 3 South Wall. From this weir, the general minimum summer flow rate is about 1l/s and the winter maximum is 15l/s. The high values recorded during 2008 in the eastern perimeter interceptor channel were not apparent in the western perimeter interceptor channel and these readings are currently affected by pumping back to Stage 4B from a sump at chainage 3610m along the channel after the completion of the Stage 4B dam wall. Also, pumping occurred at this locality before the construction of the Stage 4B wall so care is required in assessing the flow data from the west perimeter interceptor channel.
For
insp
ectio
n pur
pose
s only
.
Conse
nt of
copy
right
owne
r req
uired
for a
ny ot
her u
se.
EPA Export 27-07-2013:00:02:54
March 2009 - 20 - 07514150008 A.2
Golder Associates
Therefore, based on the minimum flow data from the perimeter interceptor channel the seepage flow into the channel is conservatively estimated to be less than 3l/s.
3.3.2 Stages 4A and 4B
For the Stage 4A raise, seepage flowing under and through the dam raise is collected in the downstream toe drain and discharged through 8 V-notch flow monitoring weirs shown in Figure 5, along Stages I and II southern, eastern and northern dam walls. The collected seepages from these 8 weirs are then discharged to the perimeter interceptor channel along the downstream toe of Stages I and II. At the seepage collection points 33 and 37, along the divider dam next to Stage III (Figure 5), pumps have been installed to dispose of the seepage water to Stage 3. For these two seepage points no V-notch weirs were installed and at present an indication of the amount of the seepage flow rate is obtained from monitoring the number of hours that the pumps are in operation.
The flow data from the eight monitoring points in Stage 4A (MH1-Weir 1, MH5-Weir 2, MH9-Weir 3, MH13-Weir 4, MH17-Weir 5, MH21-Weir 6, MH25-Weir 7, MH29-Weir 8) are presented in Figure 44a for the monitoring period of September 2000 to January 2008 together with the rise of the pond water level in Stage 4A. The pond water has risen approximately 6.7m (670cm) to the design level of 1588.5mAMD. Also plotted on the graph is the weekly rainfall data. The sum of the flow rates monitored from the eight weirs given above and the average flow rate of all eight weirs are plotted on 44b. Further analysis of the monitoring data was undertaken by taking the sum and average of the weir flows and plotting these data for the period between September 2000 to September 2002 in Figure 45 (initial period when pond water reached an elevation of the internal drainage system of the Stage 4 dam wall) and for the period June 2006 and January 2008 in Figure 46 (pond water level at its design level 1588.5mAMD). Also plotted on the graphs are the weekly rainfall data and the rise in pond water level in Stage 4A.
From Figure 44b, it is apparent from the trend lines that there is an increase in flow rate (seepage) with rising pond water and then a dramatic decrease in flow rate as the pond water level remains constant. From September 2002 to June 2006, flow rate is increasing. Prior to September 2002 (Figure 45) the majority of seepage is attributed to rainfall onto the dam wall and collected by the internal drainage system. As tailings are discharged into the facility and the pond water rises, the tailings are unconsolidated and have a comparatively high vertical permeability and seepage is at a maximum. As more layers are placed, the tailings consolidate and the vertical permeability decreases reducing the amount of seepage flowing downwards into the drainage system. The seepage starts to decrease further as consolidation of the tailings continues and while the pond water level is at a maximum, the seepage monitored from the weirs is decreasing (Figure 46). After, the filling of Stage 4A, the pond water level is dropping and also the seepage collected into the drainage system. From the latter part of 2008, the pond water level has reduced to its current level of 1587.5mAMD, which is 1m below its operating maximum and the seepage monitored has reduced to
For
insp
ectio
n pur
pose
s only
.
Conse
nt of
copy
right
owne
r req
uired
for a
ny ot
her u
se.
EPA Export 27-07-2013:00:02:54

March 2009 - 21 - 07514150008 A.2
Golder Associates
approximately value of 0.2l/s. Future monitoring of the weirs will establish this reduction in seepage flow.
The sum of all the flow rates and the average of the all the flow rates from the eight weirs, based on actual readings, from the initial and the final periods of filling of Stage 4B are tabulated below for average, maximum and minimum values.
Average Flow Values 8 Weirs l/s Sum of Flow Values 8 Weirs l/s Time Period Average Maximum Minimum Average Maximum Minimum Sept 00 – Sept 02 0.012 0.055 0.000 0.096 0.443 0.003 Jun 06 – Jan 08 0.067 0.144 0.019 0.539 1.155 0.150 Difference 0.055 0.089 0.019 0.443 0.672 0.147
For the equilibrium state, when the pond water and consolidation of the tailings have reached a steady state, seepage through the drainage system should be reasonably constant and any fluctuation would result from rainfall infiltration into the dam wall. Thus, the minimum value monitored from the sum of the eight weirs, 0.15l/s (June 2006 to January 2008, Stage 4A full) which would represent mainly seepage flow from the tailings only with little to no contribution from rainfall infiltration of the dam wall. Potentially, some seepage reduction would have occurred as a result of evaporation and root uptake during dry periods.
The average of the sum of flow ( infiltration only) values measured from the 8 weirs during the initial phases of filling was 0.096l/s (September 2000 to September 2002 Stage 4A empty). The average sum of flow (seepage and infiltration) values measured from the 8 weirs during the latter stages of the life of Stage 4A (June 2006 to January 2008, Stage 4A full) was 0.539l/s. Therefore, the flow attributed to seepage from the tailings only would be 0.44l/s (0.539-0.096) or three times greater than the 0.15l/s recorded for minimum flow conditions. These values are confirmed by using the average weir values and multiplying by eight.
The maximum of the sum of flow ( infiltration only) values measured from the 8 weirs during the initial phases of filling was 0.443l/s (September 2000 to September 2002 Stage 4A empty).The maximum sum of flow (seepage and infiltration) values measured from the 8 weirs during the latter stages of the life of Stage 4A (June 2006 to January 2008, Stage 4A full) was 1.155l/s. Therefore, the flow attributed to seepage from the tailings only would be 0.672l/s (1.155-0.443) four times greater than the minimum flow of 0.15l/s.
A similar exercise was undertaken based on the 2008 flow data which are tabulated below.
Average Flow Values 8 Weirs l/s Sum of Flow Values 8 Weirs l/s Time Period Average Maximum Minimum Average Maximum Minimum Sept 00 – Sept 02 0.012 0.055 0.000 0.096 0.443 0.003 Jan 08 – Jan 09 0.045 0.099 0.021 0.373 0.793 0.004 Difference 0.033 0.044 0.021 0.277 0.350 0.001
For
insp
ectio
n pur
pose
s only
.
Conse
nt of
copy
right
owne
r req
uired
for a
ny ot
her u
se.
EPA Export 27-07-2013:00:02:54

March 2009 - 22 - 07514150008 A.2
Golder Associates
The maximum (0.350l/s) and average (0.277l/s) difference in flow rate for the 2008 data is considerably less than for the period between June 2006 and January 2008. The minimum flow rate difference is only 0.001l/s. These lower seepage values reflect the consolidation of the tailings together with the lower pond water level in 2008.
In view of these uncertainties and variability of flow data, the projected average flow attributed to seepage has been conservatively taken as 0.5l/s representing a length of dam wall of approximately 2400m. Assuming a similar seepage value for Stage 4B, the total seepage from the Stage 4 raise will be of the order of 1l/s.
In terms of linear m of dam length, the flow rate is 0.018m3/m/day (0.75l/m/hr). This is significantly below the design capacity of the Stage 4A drainage system (Reference 4). The design work analysed seepage flow with various widths of a low permeability clay blanket extending from the upstream dam toe and a clay cut off of various depths. The results indicate the seepage flow beneath a 1m cut off and 30m clay blanket is of the order of 0.8m3/m/day. This value is nearly 50 times greater than actual values monitored. Part is due to the high horizontal permeability for the tailings sands of 1E-4m/s assumed in the analysis for the more permeable tailings foundations. After completion of the construction of Stage 4A dam wall, the base of the facility was slimed to allow the build up of low permeability slimes over the base of the embankment wall and any exposed tailings sands. This process would reduce the rate of recharge into the drainage system or more permeable tailings sands.
It is too early to evaluate the seepage data from the five monitoring weirs in Stage 4B (MH44-Weir 1, MH48-Weir 2, MH52-Weir 3, MH56-Weir 4 and MH60-Weir 5). The weirs will be continued to be monitored as Stage 4B is filled to confirm the expected 0.5l/s seepage flow anticipated from this section.
3.4 Water Quality
Water quality is monitored in wells around the perimeter of the facility and in the perimeter interceptor channel and adjacent surface streams. The location of the monitoring wells and surface monitoring points are given on Figure 47.
Sulphate has been, and continues to be, the parameter used to represent water quality trends in and around the TMF, since it is an extremely mobile parameter.
A report of the water quality monitoring data (Reference 10) is produced annually and submitted to the EPA and concludes that sulphate concentrations detected in the groundwater and surface water have decreased since 1996, after deepening the perimeter interceptor channel and appear to have stabilised. Some of the concentrations within the interceptor channel, bedrock and overburden are high and are at a maximum immediately to the south of the Stage III tailings facility.
For
insp
ectio
n pur
pose
s only
.
Conse
nt of
copy
right
owne
r req
uired
for a
ny ot
her u
se.
EPA Export 27-07-2013:00:02:54

March 2009 - 23 - 07514150008 A.2
Golder Associates
Drainage from the tailings facility flows from the toe drain from Stages I, II and III and by concrete chute from Stages 4A and 4B into the perimeter interceptor channel. The quantity and quality of drainage water is monitored at four locations around the tailings facility, as shown in Figure 47. A summary of the water quality recorded in the perimeter interceptor channel is presented in Reference 10 and discussed briefly below in terms of the sulphate ion.
Plots of weekly rainfall and sulphate vs time for both monitoring points I.C.P 1E and I.C.P 1W are presented in Figures 48a and Figures 48b. Both plots show generally low sulphate values for corresponding high weekly rainfall and vice versa. Sulphate vs weekly rainfall for the I.C.P 1E and I.C.P 1W are plotted in Figures 49a and 49b. Both plots show generally decreasing sulphate values with increasing weekly rainfall. Based on the trend lines shown on the figures, the weekly rainfall needs to be between 30mm/week to 55mm/week before sulphate levels meet the EPA guidelines for I.C.P 1E at 200/250mg/l. The average weekly rainfall at the site is approximately 17mm. Similarly for I.C.P 1W, the weekly rainfall would be between 25mm/week and 50mm/week.
Plots of flow rate and sulphate vs time for both I.C.P 1E and I.C.P 1W are presented in Figures 50a and Figures 50b. Both plots show generally low sulphate values for corresponding high flow rate and vice versa. Sulphate vs flow rate for the I.C.P 1E and I.C.P 1W are plotted in Figures 51a and 51b. Both plots show generally decreasing sulphate values with increasing flow rate.
Data from the eastern interceptor channel indicates a slight decline in sulphate values which is not unexpected considering seepage from Stage 4A is decreasing. Sulphate concentration values in the eastern interceptor channel are between 200mg/l to 800mg/l with flow rates between 2l/s and 28l/s. The sulphate values monitored in the western interceptor channel are between 200mg/l and 2000mg/l with flow rates between 1l/s and 15l/s. The concentrations are higher along the western interceptor channel because the flow rate and hence the dilution is less compared to the eastern interceptor channel and also the western interceptor channel intercepts groundwater with elevated sulphate values along the south dam wall of Stage III as discussed later. There appears to be no change in sulphate level prior to commissioning the Stage 4A raise to the post filling stage. During operation of Stage 4A, sulphate values rose and as the tailings consolidated and seepage reduced, the sulphate levels decreased in the eastern interceptor channel.
Based on the trend lines the flow rate needs to be between 20l/s to 30l/s before sulphate levels meet the EPA guidelines for I.C.P 1E. Similarly for I.C.P 1W, the flow rate would be between 9l/s and 14l/s.
The scatter of results given on Figures 48a to 51b reflect the problems of relating rainfall and rainfall period, flow rate, the variation in rainfall during the climatic seasons, the groundwater interception in the perimeter interceptor channel, timing of the various monitoring data with the sulphate values derived from seepage from the facility. The correlation between sulphate
For
insp
ectio
n pur
pose
s only
.
Conse
nt of
copy
right
owne
r req
uired
for a
ny ot
her u
se.
EPA Export 27-07-2013:00:02:54

March 2009 - 24 - 07514150008 A.2
Golder Associates
and flow rate is more pronounced than sulphate and rainfall. The plot of rainfall vs flow rate for both I.C.P 1E and I.C.P 1W are presented in Figures 52a and Figures 52b and indicate the scatter of results.
Stage 4B has yet to impact on the water quality of the western perimeter interceptor channel and in the future both east and west channels will be impacted by the operation of Stage 5.
I.C.P 1E (Figure 53a) indicated lower sulphate values than I.C.P 6 (Figure 53b) which is located mid way along the eastern perimeter interceptor channel confirming surface water dilution within the channel. I.C.P 1W (Figure 54a) indicated higher sulphate values than I.C.P.3 (Figure 54b) which is located mid way along the western perimeter interceptor channel which suggests that the deepened interceptor channel adjacent to the Stage III southern wall is collecting sulphate contaminated ground water.
In 1996, the perimeter interceptor channel was deepened in the southern section of Stage III (Reference 11) to intercept the groundwater with elevated sulphate levels. The success of the operation is discussed in Reference 10 where monitoring has indicated a significant decrease in measured sulphate concentrations with distance from the tailings facility.
Monitoring station T12 measures sulphate values in a surface water stream that is located immediately downstream of the perimeter interceptor channel. The readings indicate (Figure 55) sulphate values generally below 50mg/l.
3.5 Foundation Tailings & Dam Movement Observations
3.5.1 Stage 4A
Figure 56 shows plan locations of ground movement monitoring instruments in Stage 4A. These include the six instrument clusters, settlement plates and monitoring stations. As indicated earlier, Figure 16 represents a typical section through the six instrument clusters which include inclinometers, combined inclinometers/ extensometers and settlement plates.
The horizontal movements by the inclinometers and vertical movements monitored by the extensometers have been very small since completion of the construction of the Stage 4A dam wall and during filling. Horizontal movements were generally less than 10mm and vertical settlements less than 25mm. Horizontal movements monitored by the monitoring stations have indicated very small movements with no discernible trend.
The movements discussed above have no impact on the integrity of the Stage 4A structure.
For
insp
ectio
n pur
pose
s only
.
Conse
nt of
copy
right
owne
r req
uired
for a
ny ot
her u
se.
EPA Export 27-07-2013:00:02:54

March 2009 - 25 - 07514150008 A.2
Golder Associates
3.5.2 Stage 4B
Figure 57 shows plan locations of ground movement monitoring instruments in Stage 4B. These include the six instrument clusters, settlement plates and monitoring pegs installed at the upstream toe of Stage 4B dam raise. Figure 29 shows a typical section for the six instrument clusters which include inclinometers, combined inclinometers/ extensometers and settlement plates.
The horizontal movements by the inclinometers and vertical movements monitored by the extensometers have been very small since completion of the construction of the Stage 4B dam wall. Horizontal movements are generally less than 10mm and vertical settlements less than 15mm. Horizontal movements monitored by the monitoring stations have indicated very small movements with no discernible trend.
The movements discussed above have no impact on the integrity of the Stage 4B structure.
For
insp
ectio
n pur
pose
s only
.
Conse
nt of
copy
right
owne
r req
uired
for a
ny ot
her u
se.
EPA Export 27-07-2013:00:02:54
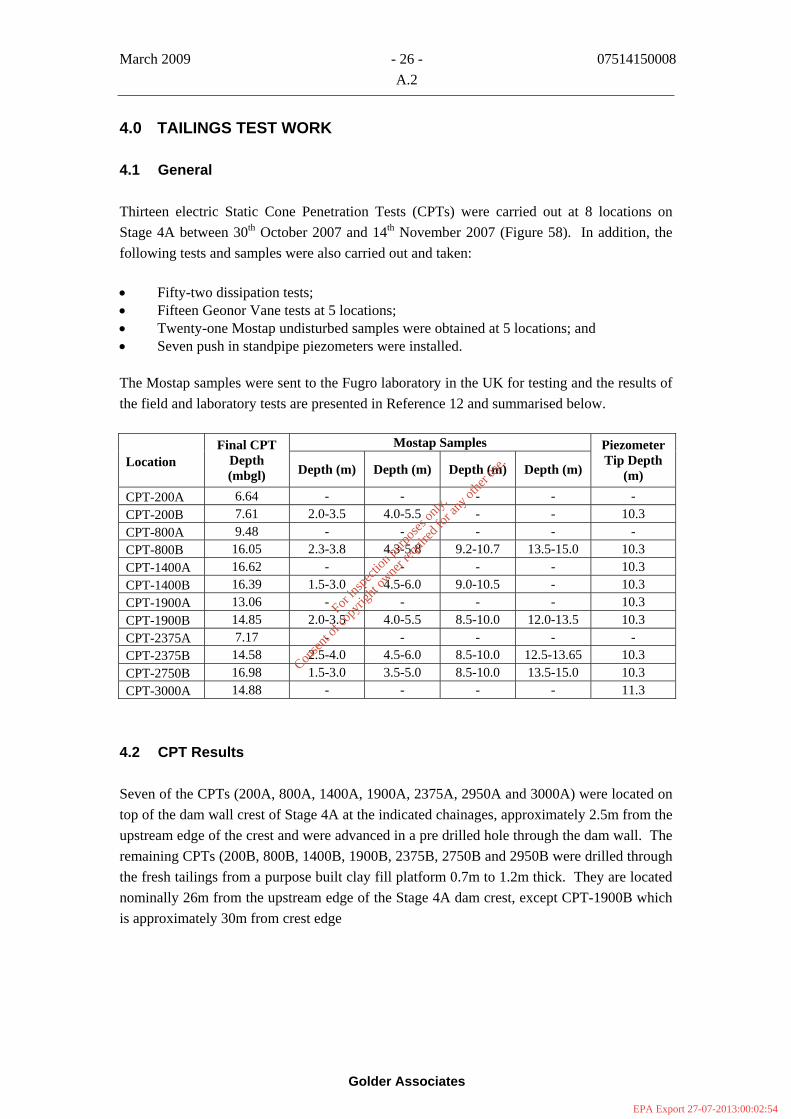
March 2009 - 26 - 07514150008 A.2
Golder Associates
4.0 TAILINGS TEST WORK
4.1 General
Thirteen electric Static Cone Penetration Tests (CPTs) were carried out at 8 locations on Stage 4A between 30th October 2007 and 14th November 2007 (Figure 58). In addition, the following tests and samples were also carried out and taken:
• Fifty-two dissipation tests; • Fifteen Geonor Vane tests at 5 locations; • Twenty-one Mostap undisturbed samples were obtained at 5 locations; and • Seven push in standpipe piezometers were installed.
The Mostap samples were sent to the Fugro laboratory in the UK for testing and the results of the field and laboratory tests are presented in Reference 12 and summarised below.
Mostap Samples Location
Final CPT Depth (mbgl) Depth (m) Depth (m) Depth (m) Depth (m)
Piezometer Tip Depth
(m) CPT-200A 6.64 - - - - - CPT-200B 7.61 2.0-3.5 4.0-5.5 - - 10.3 CPT-800A 9.48 - - - - - CPT-800B 16.05 2.3-3.8 4.3-5.8 9.2-10.7 13.5-15.0 10.3 CPT-1400A 16.62 - - - - 10.3 CPT-1400B 16.39 1.5-3.0 4.5-6.0 9.0-10.5 - 10.3 CPT-1900A 13.06 - - - - 10.3 CPT-1900B 14.85 2.0-3.5 4.0-5.5 8.5-10.0 12.0-13.5 10.3 CPT-2375A 7.17 - - - - - CPT-2375B 14.58 2.5-4.0 4.5-6.0 8.5-10.0 12.5-13.65 10.3 CPT-2750B 16.98 1.5-3.0 3.5-5.0 8.5-10.0 13.5-15.0 10.3 CPT-3000A 14.88 - - - - 11.3
4.2 CPT Results
Seven of the CPTs (200A, 800A, 1400A, 1900A, 2375A, 2950A and 3000A) were located on top of the dam wall crest of Stage 4A at the indicated chainages, approximately 2.5m from the upstream edge of the crest and were advanced in a pre drilled hole through the dam wall. The remaining CPTs (200B, 800B, 1400B, 1900B, 2375B, 2750B and 2950B were drilled through the fresh tailings from a purpose built clay fill platform 0.7m to 1.2m thick. They are located nominally 26m from the upstream edge of the Stage 4A dam crest, except CPT-1900B which is approximately 30m from crest edge
For
insp
ectio
n pur
pose
s only
.
Conse
nt of
copy
right
owne
r req
uired
for a
ny ot
her u
se.
EPA Export 27-07-2013:00:02:54
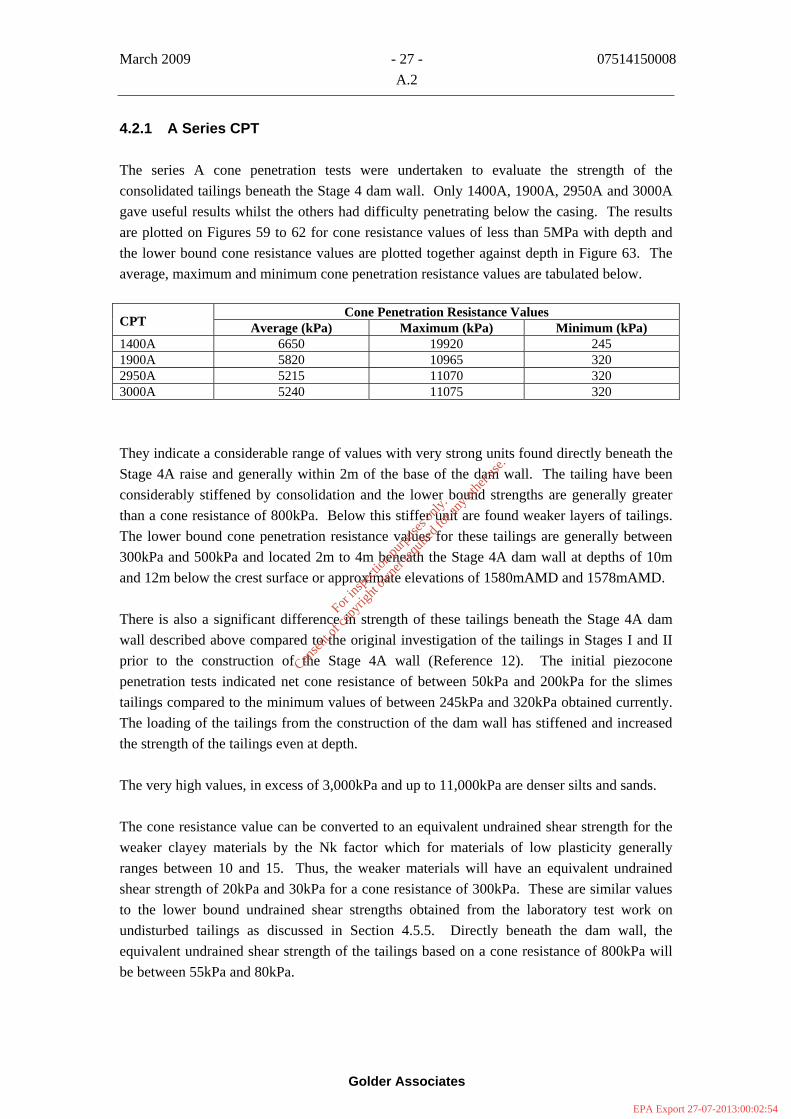
March 2009 - 27 - 07514150008 A.2
Golder Associates
4.2.1 A Series CPT
The series A cone penetration tests were undertaken to evaluate the strength of the consolidated tailings beneath the Stage 4 dam wall. Only 1400A, 1900A, 2950A and 3000A gave useful results whilst the others had difficulty penetrating below the casing. The results are plotted on Figures 59 to 62 for cone resistance values of less than 5MPa with depth and the lower bound cone resistance values are plotted together against depth in Figure 63. The average, maximum and minimum cone penetration resistance values are tabulated below.
Cone Penetration Resistance Values CPT Average (kPa) Maximum (kPa) Minimum (kPa) 1400A 6650 19920 245 1900A 5820 10965 320 2950A 5215 11070 320 3000A 5240 11075 320
They indicate a considerable range of values with very strong units found directly beneath the Stage 4A raise and generally within 2m of the base of the dam wall. The tailing have been considerably stiffened by consolidation and the lower bound strengths are generally greater than a cone resistance of 800kPa. Below this stiffer unit are found weaker layers of tailings. The lower bound cone penetration resistance values for these tailings are generally between 300kPa and 500kPa and located 2m to 4m beneath the Stage 4A dam wall at depths of 10m and 12m below the crest surface or approximate elevations of 1580mAMD and 1578mAMD.
There is also a significant difference in strength of these tailings beneath the Stage 4A dam wall described above compared to the original investigation of the tailings in Stages I and II prior to the construction of the Stage 4A wall (Reference 12). The initial piezocone penetration tests indicated net cone resistance of between 50kPa and 200kPa for the slimes tailings compared to the minimum values of between 245kPa and 320kPa obtained currently. The loading of the tailings from the construction of the dam wall has stiffened and increased the strength of the tailings even at depth.
The very high values, in excess of 3,000kPa and up to 11,000kPa are denser silts and sands.
The cone resistance value can be converted to an equivalent undrained shear strength for the weaker clayey materials by the Nk factor which for materials of low plasticity generally ranges between 10 and 15. Thus, the weaker materials will have an equivalent undrained shear strength of 20kPa and 30kPa for a cone resistance of 300kPa. These are similar values to the lower bound undrained shear strengths obtained from the laboratory test work on undisturbed tailings as discussed in Section 4.5.5. Directly beneath the dam wall, the equivalent undrained shear strength of the tailings based on a cone resistance of 800kPa will be between 55kPa and 80kPa.
For
insp
ectio
n pur
pose
s only
.
Conse
nt of
copy
right
owne
r req
uired
for a
ny ot
her u
se.
EPA Export 27-07-2013:00:02:54
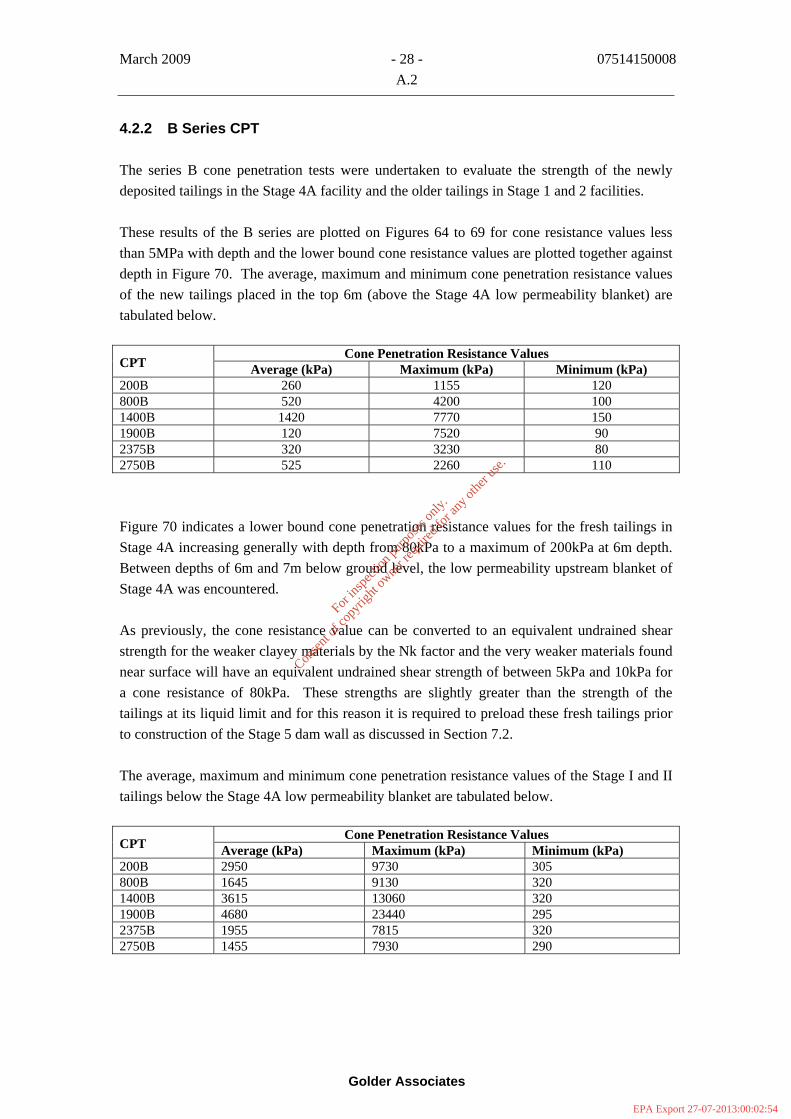
March 2009 - 28 - 07514150008 A.2
Golder Associates
4.2.2 B Series CPT
The series B cone penetration tests were undertaken to evaluate the strength of the newly deposited tailings in the Stage 4A facility and the older tailings in Stage 1 and 2 facilities.
These results of the B series are plotted on Figures 64 to 69 for cone resistance values less than 5MPa with depth and the lower bound cone resistance values are plotted together against depth in Figure 70. The average, maximum and minimum cone penetration resistance values of the new tailings placed in the top 6m (above the Stage 4A low permeability blanket) are tabulated below.
Cone Penetration Resistance Values CPT Average (kPa) Maximum (kPa) Minimum (kPa) 200B 260 1155 120 800B 520 4200 100 1400B 1420 7770 150 1900B 120 7520 90 2375B 320 3230 80 2750B 525 2260 110
Figure 70 indicates a lower bound cone penetration resistance values for the fresh tailings in Stage 4A increasing generally with depth from 80kPa to a maximum of 200kPa at 6m depth. Between depths of 6m and 7m below ground level, the low permeability upstream blanket of Stage 4A was encountered.
As previously, the cone resistance value can be converted to an equivalent undrained shear strength for the weaker clayey materials by the Nk factor and the very weaker materials found near surface will have an equivalent undrained shear strength of between 5kPa and 10kPa for a cone resistance of 80kPa. These strengths are slightly greater than the strength of the tailings at its liquid limit and for this reason it is required to preload these fresh tailings prior to construction of the Stage 5 dam wall as discussed in Section 7.2.
The average, maximum and minimum cone penetration resistance values of the Stage I and II tailings below the Stage 4A low permeability blanket are tabulated below.
Cone Penetration Resistance Values CPT Average (kPa) Maximum (kPa) Minimum (kPa) 200B 2950 9730 305 800B 1645 9130 320 1400B 3615 13060 320 1900B 4680 23440 295 2375B 1955 7815 320 2750B 1455 7930 290
For
insp
ectio
n pur
pose
s only
.
Conse
nt of
copy
right
owne
r req
uired
for a
ny ot
her u
se.
EPA Export 27-07-2013:00:02:54
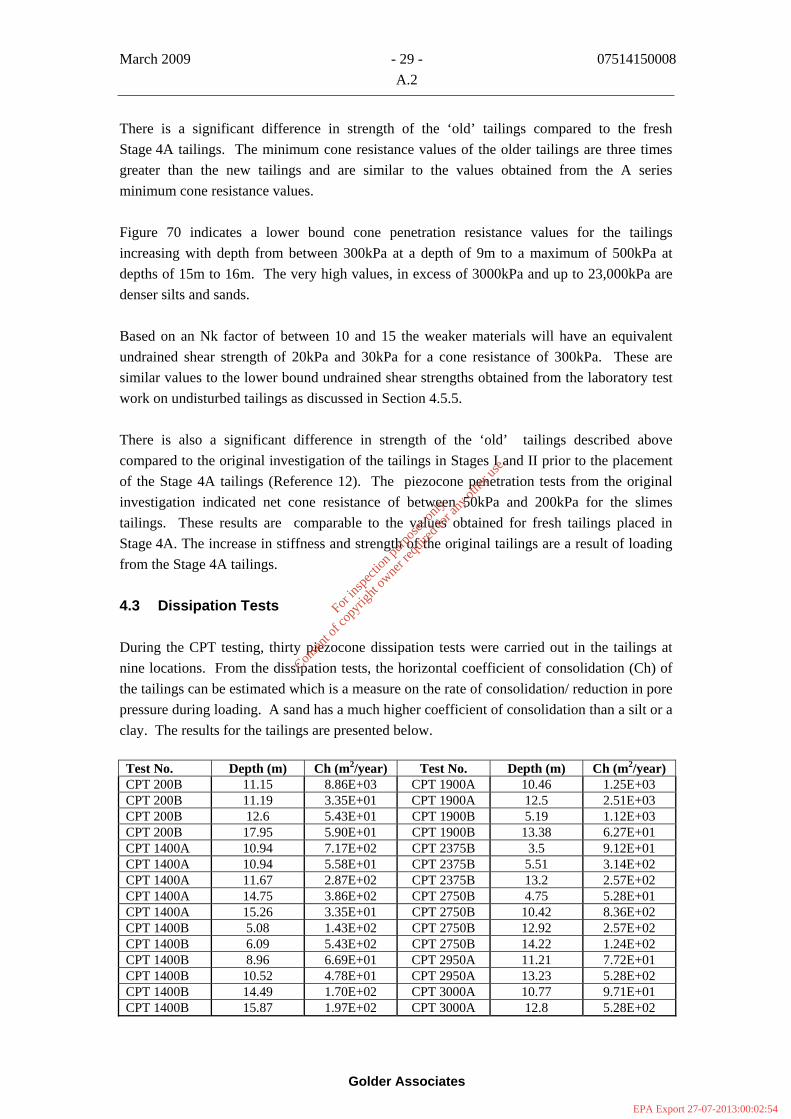
March 2009 - 29 - 07514150008 A.2
Golder Associates
There is a significant difference in strength of the ‘old’ tailings compared to the fresh Stage 4A tailings. The minimum cone resistance values of the older tailings are three times greater than the new tailings and are similar to the values obtained from the A series minimum cone resistance values.
Figure 70 indicates a lower bound cone penetration resistance values for the tailings increasing with depth from between 300kPa at a depth of 9m to a maximum of 500kPa at depths of 15m to 16m. The very high values, in excess of 3000kPa and up to 23,000kPa are denser silts and sands.
Based on an Nk factor of between 10 and 15 the weaker materials will have an equivalent undrained shear strength of 20kPa and 30kPa for a cone resistance of 300kPa. These are similar values to the lower bound undrained shear strengths obtained from the laboratory test work on undisturbed tailings as discussed in Section 4.5.5.
There is also a significant difference in strength of the ‘old’ tailings described above compared to the original investigation of the tailings in Stages I and II prior to the placement of the Stage 4A tailings (Reference 12). The piezocone penetration tests from the original investigation indicated net cone resistance of between 50kPa and 200kPa for the slimes tailings. These results are comparable to the values obtained for fresh tailings placed in Stage 4A. The increase in stiffness and strength of the original tailings are a result of loading from the Stage 4A tailings.
4.3 Dissipation Tests
During the CPT testing, thirty piezocone dissipation tests were carried out in the tailings at nine locations. From the dissipation tests, the horizontal coefficient of consolidation (Ch) of the tailings can be estimated which is a measure on the rate of consolidation/ reduction in pore pressure during loading. A sand has a much higher coefficient of consolidation than a silt or a clay. The results for the tailings are presented below.
Test No. Depth (m) Ch (m2/year) Test No. Depth (m) Ch (m2/year) CPT 200B 11.15 8.86E+03 CPT 1900A 10.46 1.25E+03 CPT 200B 11.19 3.35E+01 CPT 1900A 12.5 2.51E+03 CPT 200B 12.6 5.43E+01 CPT 1900B 5.19 1.12E+03 CPT 200B 17.95 5.90E+01 CPT 1900B 13.38 6.27E+01 CPT 1400A 10.94 7.17E+02 CPT 2375B 3.5 9.12E+01 CPT 1400A 10.94 5.58E+01 CPT 2375B 5.51 3.14E+02 CPT 1400A 11.67 2.87E+02 CPT 2375B 13.2 2.57E+02 CPT 1400A 14.75 3.86E+02 CPT 2750B 4.75 5.28E+01 CPT 1400A 15.26 3.35E+01 CPT 2750B 10.42 8.36E+02 CPT 1400B 5.08 1.43E+02 CPT 2750B 12.92 2.57E+02 CPT 1400B 6.09 5.43E+02 CPT 2750B 14.22 1.24E+02 CPT 1400B 8.96 6.69E+01 CPT 2950A 11.21 7.72E+01 CPT 1400B 10.52 4.78E+01 CPT 2950A 13.23 5.28E+02 CPT 1400B 14.49 1.70E+02 CPT 3000A 10.77 9.71E+01 CPT 1400B 15.87 1.97E+02 CPT 3000A 12.8 5.28E+02
For
insp
ectio
n pur
pose
s only
.
Conse
nt of
copy
right
owne
r req
uired
for a
ny ot
her u
se.
EPA Export 27-07-2013:00:02:54
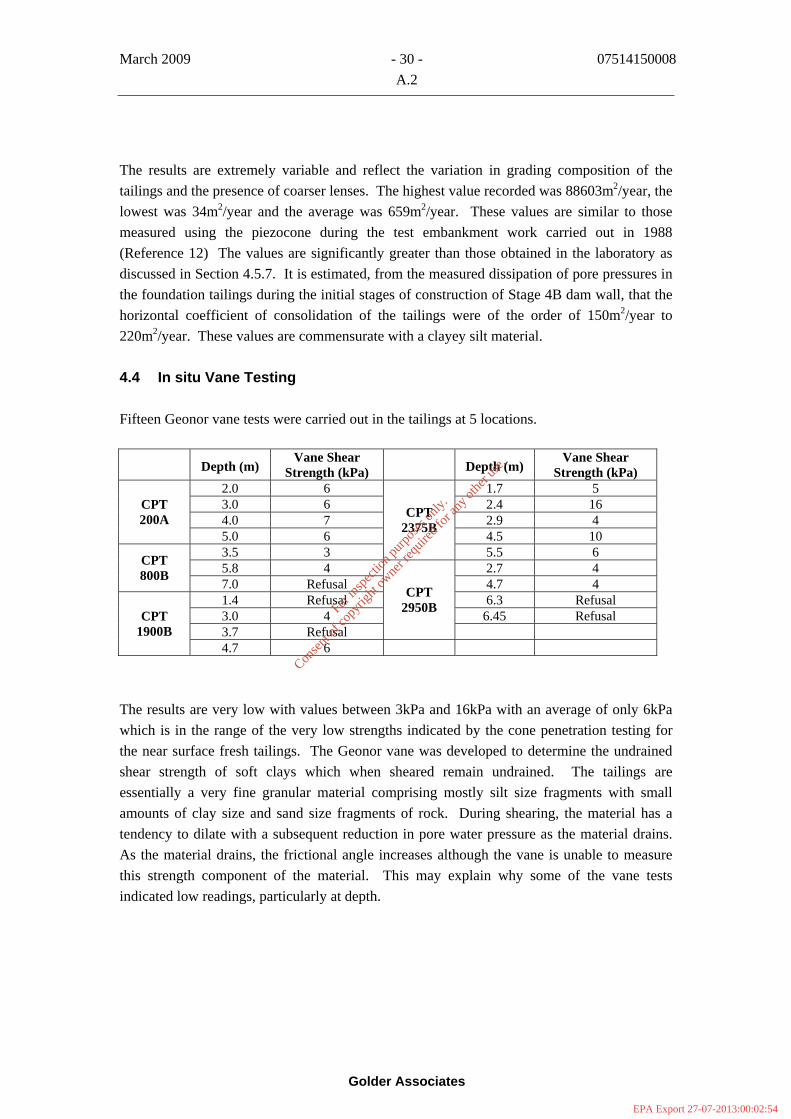
March 2009 - 30 - 07514150008 A.2
Golder Associates
The results are extremely variable and reflect the variation in grading composition of the tailings and the presence of coarser lenses. The highest value recorded was 88603m2/year, the lowest was 34m2/year and the average was 659m2/year. These values are similar to those measured using the piezocone during the test embankment work carried out in 1988 (Reference 12) The values are significantly greater than those obtained in the laboratory as discussed in Section 4.5.7. It is estimated, from the measured dissipation of pore pressures in the foundation tailings during the initial stages of construction of Stage 4B dam wall, that the horizontal coefficient of consolidation of the tailings were of the order of 150m2/year to 220m2/year. These values are commensurate with a clayey silt material.
4.4 In situ Vane Testing
Fifteen Geonor vane tests were carried out in the tailings at 5 locations.
Depth (m) Vane Shear
Strength (kPa) Depth (m) Vane Shear
Strength (kPa) 2.0 6 1.7 5 3.0 6 2.4 16 4.0 7 2.9 4
CPT 200A
5.0 6 4.5 10 3.5 3
CPT 2375B
5.5 6 5.8 4 2.7 4 CPT
800B 7.0 Refusal 4.7 4 1.4 Refusal 6.3 Refusal 3.0 4 6.45 Refusal 3.7 Refusal
CPT 2950B
CPT
1900B 4.7 6
The results are very low with values between 3kPa and 16kPa with an average of only 6kPa which is in the range of the very low strengths indicated by the cone penetration testing for the near surface fresh tailings. The Geonor vane was developed to determine the undrained shear strength of soft clays which when sheared remain undrained. The tailings are essentially a very fine granular material comprising mostly silt size fragments with small amounts of clay size and sand size fragments of rock. During shearing, the material has a tendency to dilate with a subsequent reduction in pore water pressure as the material drains. As the material drains, the frictional angle increases although the vane is unable to measure this strength component of the material. This may explain why some of the vane tests indicated low readings, particularly at depth.
For
insp
ectio
n pur
pose
s only
.
Conse
nt of
copy
right
owne
r req
uired
for a
ny ot
her u
se.
EPA Export 27-07-2013:00:02:54

March 2009 - 31 - 07514150008 A.2
Golder Associates
4.5 Laboratory Testing Tailings
4.5.1 General
A programme of laboratory testing was undertaken to evaluate the geotechnical properties of the tailings. The tests included:
• Moisture content; • Classification tests Atterberg limits and gradings; • Density; • Shear strength; and • Consolidation.
The results of the laboratory testing are discussed briefly below.
4.5.2 Moisture Content
The moisture contents of the tailings were between 17% and 27% with an average of 21%.
4.5.3 Classification test
The results of the Atterberg Limits (Figure 71) indicate that the tailings are clays of low plasticity. Five samples of the eighteen tested were non plastic. The liquid limits ranged from 24% and 34% with an average of 27%. The plastic limits ranged from 14% and 22% with an average of 17%. The average plasticity index was 10%.
Grading analyses were undertaken on eighteen samples. The non plastic samples had generally low clay particle size content between 1% and 3% compared to the plastic tailings with a clay particle size content generally between 9% and 21%. The remaining material was silt, 78% to 91% with sand generally between 0% and 7%. One sample, CPT1900B at 12m indicated a silt content for the tailings of 18% and sand content of 82%. CPT2950B indicated a silt content of 78% and sand content of 20%.
Tara Mines generally discharges slimes into the tailings facility with the coarser fraction used as mine backfill. Therefore the majority of tailings in the facility are slimes tailings which will be a material of low plasticity, consisting of clay size particles between 9% and 21% and an expected low permeability of the order of 1E-8m/s to 1E-9m/s.
Occasionally total tailings are discharged into the facility and in Stages 4A and 4B, this material is discharged into a discrete area via the ‘sand line’. The total tailings segregates on the beach resulting in the coarser material settling out near the spigot points and the slime fraction migrating towards the pond water where the reclaim pumps are located. This coarser fraction is typically fine sand and can be expected to have a permeability in the order of 1E-
For
insp
ectio
n pur
pose
s only
.
Conse
nt of
copy
right
owne
r req
uired
for a
ny ot
her u
se.
EPA Export 27-07-2013:00:02:54

March 2009 - 32 - 07514150008 A.2
Golder Associates
5m/s to 1E-7m/s. Based on Hazens formula (Reference 13) for the fine sand sample quoted above, the permeability is calculated to be 9E-06m/s.
It can be expected that the vertical permeability of the tailings will be controlled by the low permeability slimes and the horizontal permeability by the higher permeable sand bands and lenses.
4.5.4 Density
The particle density (specific gravity) of the tailings varied between 2.85Mg/m3 and 3.11Mg/m3 with an average of 2.96Mg/m3. The dry density of the tailings measured from the in situ Mostap samples was between 1.61Mg/m3 and 1.98Mg/m3 with an average of 1.83Mg/m3. There is little relationship between increase in dry density with depth. The actual dry densities measured appear greater than has been determined historically by storage volume and tonnage throughput into the facility which is about 1.45Mg/m3. This may be a result of sampling disturbance causing densification of the sample during driving the Mostap tube and during transportation. Previous test work (Reference 14) indicated dry densities between 1.48Mg/m3 and 1.93Mg/m3. Also the particle density is slightly higher than expected.
4.5.5 Undrained Shear Strength
Eighteen multi stage undrained shear strength tests were undertaken on undisturbed samples of the tailings at three cell pressures. A considerable variation of undrained shear strengths was obtained between 7kPa and 300kPa with an average of 100kPa. Taking the first stage only, the undrained shear strengths reduce to between 7kPa and 238kPa with an average of 87kPa. These are considerably higher than those obtained from the in situ Geonor vane testing or derived from the cone resistance values. Like the vane testing results, the undrained shear strength test results are impacted by the granular nature of the tailings.
4.5.6 Consolidated Undrained Triaxial Tests with Pore Water Pressure Measurements
Five consolidated undrained triaxial tests with pore water pressure measurements were carried out to determine the long term strength parameters for the tailings. The results indicate effective frictional angles between 41 degrees and 43 degrees. These are considered on the high side and previous frictional values (Reference 14) between 34 degrees and 38 degrees have been obtained albeit from shear box testing.
4.5.7 Consolidation Test
Twelve one dimensional consolidation tests were carried out on samples of tailings. The results indicate a coefficient of volume compressibility of generally between 0.02m2/MN to
For
insp
ectio
n pur
pose
s only
.
Conse
nt of
copy
right
owne
r req
uired
for a
ny ot
her u
se.
EPA Export 27-07-2013:00:02:54

March 2009 - 33 - 07514150008 A.2
Golder Associates
0.1m2/MN over an effective stress level greater than 100kPa indicating a material of low to very low compressibility. At lower stress levels, the coefficient of volume compressibility is higher with values generally ranging between 0.2m2/MN and 1.3m2/MN indicating a material of high compressibility. At low stress levels the tailings are in a very loose state. The vertical coefficient of consolidations are generally between 10m2/year and 30m2/year. These are considerably less than the horizontal values measured in situ with the piezocone due to the anisotropy of the tailings. The vertical permeability of the tailings tends to be at least 10 times less than the horizontal permeability due to coarser lenses in the tailings.
For
insp
ectio
n pur
pose
s only
.
Conse
nt of
copy
right
owne
r req
uired
for a
ny ot
her u
se.
EPA Export 27-07-2013:00:02:54
March 2009 - 34 - 07514150008 A.2
Golder Associates
5.0 DAM FOUNDATION CONDITIONS
5.1 General
There is a considerable amount of information relating to the response to loading of recently placed unconsolidated tailings during the construction of Stage 4B. The upstream shoulder of the Stage 4B raise was preloaded with approximately 2m to 2.5m of rockfill to increase the strength of the foundation tailings prior to placement of the clay fill forming the embankment wall. Vibrating wire piezometers and settlement plates were installed into the foundations and monitored during the preloading stage and during the placement of the fill to form the Stage 4B. Also inclinometers/extensometers and monitoring stations were also installed to monitor movement in the tailings and these together with the piezometric responses are discussed below from the data obtained from three instrument clusters, 150, 1300 and 2200 on Stage 4B which are typical. The location and section through the instrument clusters on Stage 4B were discussed in Section 3 and the three clusters discussed are representative of all the clusters installed.
5.2 Piezometric response
Six instrument clusters were installed in the foundations as discussed in Section 3 and a brief summary of the piezometric response to loading is given below.
5.2.1 Cluster 150.
Figure 72 shows the piezometric response to preloading of the tailings. Immediately the rockfill preload was placed to an elevation of 1584.5mAMD, the vibrating wire piezometers responded. The maximum piezometric level measured was 1587.0mAMD from a background piezometric level of approximately 1582mAMD. The rise in pore water pressure was 5m. The total thickness of rockfill placed including settlement was approximately 2.5m. Thus the ratio of pore pressure increase to stress increase is 1 i.e the pore water pressure ratio B is 1. As a guide, for every 1m of rockfill preload at a rockfill density of 2t/m3 the pore water pressure will rise 2m at a water density of 1t/m3. Substantial dissipation of pore pressures were complete in under 3 weeks. As the pore pressures dissipate, the tailings are consolidating, stiffening and increasing in strength.
The rockfill preload was removed in the beginning of September 2003 which caused some minor response in the vibrating wire piezometers. The Type A1 material was then placed directly on the tailings after the removal of the rockfill preload which resulted in some minor fluctuations in the pore pressures but these were generally less than an elevation of 1584.5mAMD.
Figure 30 shows the piezometric response during the raising of Stage 4B and it is apparent that there was little to no response during the rest of construction.
For
insp
ectio
n pur
pose
s only
.
Conse
nt of
copy
right
owne
r req
uired
for a
ny ot
her u
se.
EPA Export 27-07-2013:00:02:54
March 2009 - 35 - 07514150008 A.2
Golder Associates
5.2.2 Cluster 1300
Figure 73 shows the piezometric response to preload loading of the tailings at Cluster 1300. Immediately the rockfill preload was placed to an elevation of 1584.5mAMD, the vibrating wire piezometers responded. The maximum piezometric level measured was 1587.4mAMD from a background piezometric level of approximately 1581.5mAMD. The rise in pore water pressure was 5.9m. The total thickness of rockfill placed including settlement was approximately 2.5m. Dissipation of pore pressures were complete in under 3 weeks. As the pore pressures dissipate, the tailings are consolidating, stiffening and increasing in strength.
The rockfill preload was removed in April 2004 and the Type A1 material was then placed directly on the tailings. The loading by the Type A1 resulted in some minor fluctuations in the pore pressures but these were less than 1582.5mAMD.
Figure 33 shows the piezometric response during the raising of Stage 4B and it is apparent that there was little to no response during the rest of construction.
5.2.3 Cluster 2200
This cluster is located in the south east sector of the facility and was one of the last areas in Stage III to be filled with tailings.
Figure 74 shows the piezometric response to preload loading of the tailings. Immediately the rockfill preload was placed to an elevation of 1584.0mAMD, the vibrating wire piezometers responded. The maximum piezometric level measured was 1588.0mAMD from a background piezometric level of approximately 1583.5mAMD. The rise in pore water pressure was 4.5m. The total thickness of rockfill placed including settlement was approximately 2.5m. Dissipation of pore pressures were complete in under 3 weeks. As the pore pressures dissipate, the tailings are consolidating and increasing in strength 5m of rockfill was placed in June 2004 which resulted in a 1m increase in pore water pressure.
The rockfill preload was removed in the beginning of September 2004 which caused some minor response in the vibrating wire piezometers. The Type A1 material was then placed directly on the tailings after the removal of the rockfill preload which resulted in some minor fluctuations in the pore pressures but these were less than an elevation of 1584.5mAMD.
Figure 35 shows the piezometric response during the raising of Stage 4B and it is apparent that there was little to no response during the rest of construction.
5.3 Stage 4A
Stage 4A was not preloaded because the surface tailings had been exposed for several years prior to construction. The response to loading of the tailings was slightly different as
. A further 0.
For
insp
ectio
n pur
pose
s only
.
Conse
nt of
copy
right
owne
r req
uired
for a
ny ot
her u
se.
EPA Export 27-07-2013:00:02:54
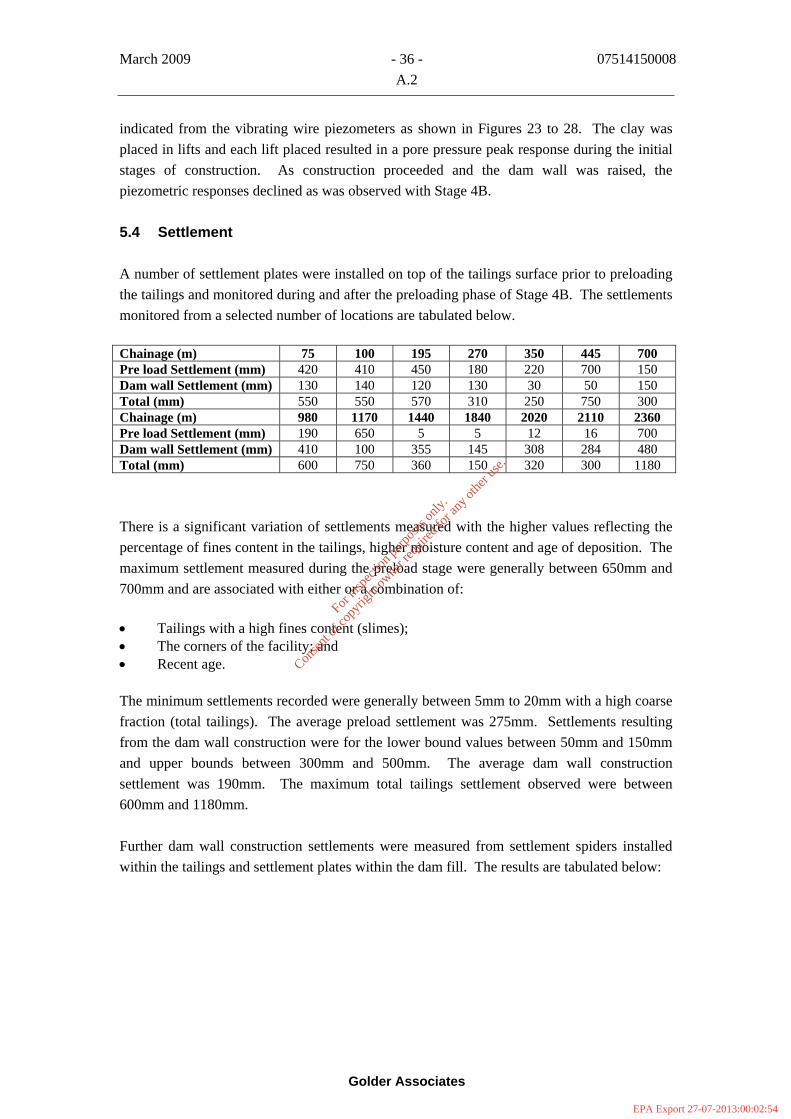
March 2009 - 36 - 07514150008 A.2
Golder Associates
indicated from the vibrating wire piezometers as shown in Figures 23 to 28. The clay was placed in lifts and each lift placed resulted in a pore pressure peak response during the initial stages of construction. As construction proceeded and the dam wall was raised, the piezometric responses declined as was observed with Stage 4B.
5.4 Settlement
A number of settlement plates were installed on top of the tailings surface prior to preloading the tailings and monitored during and after the preloading phase of Stage 4B. The settlements monitored from a selected number of locations are tabulated below.
Chainage (m) 75 100 195 270 350 445 700 Pre load Settlement (mm) 420 410 450 180 220 700 150 Dam wall Settlement (mm) 130 140 120 130 30 50 150 Total (mm) 550 550 570 310 250 750 300 Chainage (m) 980 1170 1440 1840 2020 2110 2360 Pre load Settlement (mm) 190 650 5 5 12 16 700 Dam wall Settlement (mm) 410 100 355 145 308 284 480 Total (mm) 600 750 360 150 320 300 1180
There is a significant variation of settlements measured with the higher values reflecting the percentage of fines content in the tailings, higher moisture content and age of deposition. The maximum settlement measured during the preload stage were generally between 650mm and 700mm and are associated with either or a combination of:
• Tailings with a high fines content (slimes); • The corners of the facility; and • Recent age.
The minimum settlements recorded were generally between 5mm to 20mm with a high coarse fraction (total tailings). The average preload settlement was 275mm. Settlements resulting from the dam wall construction were for the lower bound values between 50mm and 150mm and upper bounds between 300mm and 500mm. The average dam wall construction settlement was 190mm. The maximum total tailings settlement observed were between 600mm and 1180mm.
Further dam wall construction settlements were measured from settlement spiders installed within the tailings and settlement plates within the dam fill. The results are tabulated below:
For
insp
ectio
n pur
pose
s only
.
Conse
nt of
copy
right
owne
r req
uired
for a
ny ot
her u
se.
EPA Export 27-07-2013:00:02:54

March 2009 - 37 - 07514150008 A.2
Golder Associates
Cluster (m) 150 500 850 1300 1750 2220 Settlement (mm) 160 200 230 270 190 310
The average dam wall construction settlement was 225mm and this was similar to the average value obtained from the settlement plates discussed previously. There was very little long term consolidation settlement once construction was completed.
For
insp
ectio
n pur
pose
s only
.
Conse
nt of
copy
right
owne
r req
uired
for a
ny ot
her u
se.
EPA Export 27-07-2013:00:02:54

March 2009 - 38 - 07514150008 A.2
Golder Associates
6.0 DESIGN
6.1 General
The design and construction of the Stage 5 raise will be undertaken in two stages, Stage 5A and Stage 5B. Stage 5 will be constructed on the Stage 4 tailings and the design and construction method will be based on the design of Stage 4B except for some minor modifications to improve stability during construction. The construction and operation of Stage 4A raise and the construction of Stage 4B have been a complete success.
6.2 Design Elements
Valuable lessons have been learnt from the construction of Stage 4A and 4B and these will be put into practise during the construction of Stage 5. Sections through the dam wall at various phases of construction are presented in Figures 75 to 78.
The Stage 5 raise comprises a very low permeability upstream portion ( Type A1 material) separated from a low permeable downstream portion (Type A2 material), by a chimney drain connected to a downstream toe drain by a continuous drainage blanket.
The dam has been located entirely on the tailings deposit to satisfy drainage considerations. This location also prevents problems resulting from excessive differential settlement if, for instance, part of the dam wall was constructed on the existing dam crest and whilst the variable nature of the tailings deposit will lead to some differential settlement within the embankment, monitoring of both Stages 4A and 4B indicates that these are small (Reference 9). The dam has an upstream slope of 1V:2H and downstream slope of 1V:2.25H with a crest width of 6m which together with the 0.75m thick slope protection blanket on the upstream dam face increases the width to 7.2m which is sufficient to accommodate a roadway and tailings delivery pipe.
The dam section is constant except where it forms the divider wall between the Stage 5A and Stage 5B developments. Here, the dam is the same height as the perimeter embankments since Stage 5A will be operated in isolation as an impounding dam facility. Figure 3 shows a plan view of the Stage 5. As with Stage 4, at the connection between the raise divider dam and raise outer perimeter dam, the internal drainage system has been modified. This allows the Stage 5A and 5B dams to be spliced together without forming a preferential seepage path via the downstream drainage blanket of the Stage 5A dividing wall being incorporated in the upstream footprint of Stage 5B. The downstream drainage blanket will not be installed on the Stage 5A dividing wall within the future upstream footprint of the Stage 5B dam wall connection in order to prevent seepage travelling directly through ystem on the downstream side of Stage 5A dividing wall once filling of Stage 5B commences. The downstream section of the drainage blanket of the Stage 5A dividing wall will be in the
the drainage s
For
insp
ectio
n pur
pose
s only
.
Conse
nt of
copy
right
owne
r req
uired
for a
ny ot
her u
se.
EPA Export 27-07-2013:00:02:54

March 2009 - 39 - 07514150008 A.2
Golder Associates
tailings basin of Stage 5B. The downstream drainage blanket of Stage 5A will not be installed along the north and south connections of the dividing wall for a length of 15m.
It would be acceptable to place Type A2 material to form the embankment crest above an elevation of 1593mAMD to the final crest height at an elevation of 1594mAMD. This option will be dependent on the amount of Types A1 and A2 fill materials available from the borrow areas.
The downstream slope of the dam raise will be grassed to prevent surface erosion and gullying of the fill material, and a layer of coarse material will be placed on the upstream side of the raise to protect the slope against wave scour from the ponded water. The coarse material can include boulders removed from the fill and Type D2 material.
The design of the Stage 5 also includes the following key aspects:
a) Preloading the footprint of the A1 and the majority of the A2/ drainage blanket using imported rockfill Figure 75. The grading curve for Type A1 material is presented in Figure 79. Prior to the start of construction of the dam raise, the footprint of the dam will be inspected. The A1 clay fill footprint and 50% of the drainage blanket footprint will be preloaded with approximately 2m thickness of Type D2 (mine rock) material sufficiently to consolidate the tailings surface to facilitate the placement and compaction of the first few layers of A1 clay fill material and placement of the drainage blanket. Preloading will have the added benefit of reducing the settlement of the tailings foundations under the clay fill and drainage blanket. The preloading time for the Stage 4B raise based on the results of pore pressure development and dissipation is generally less than 3 weeks and consolidation will be 90% complete. As with Stage 4B raise, the rate of the dissipation of pore pressures will be monitored during the preloading stage and the period of time for preloading adjusted accordingly.
b) Placement under the footprint of the downstream shoulder of the dam of a minimum of 0.75m layer of Type A3 granular material to form the lower section of the drainage blanket on top of the tailings (to be won from the south western portion of the Northern borrow area) or Type B mine rock imported from the mine. The general grading envelope for the Type A3 material based on the site investigation data (Reference7) is presented in Figure 80. The Type A3 material is separated from the tailings by Terram 2000 geotextile. Type B drainage blanket is placed over the Type A3 material and the grading curve for this material is presented in Figure 81. The Type A3 will provide a more stable surface for the placement of the Type B drainage blanket and will minimise losses of this material. Type C toe drain material which collects seepage from the internal drainage system will consist of processed rockfill with a grading curve as presented in Figure 82 and is essentially relatively uniform gravel.
c) Construction of the downstream toe drain will be undertaken after the completion of the drainage blanket and during the 1st 1.5m of raise. Settlement of the drainage system will be small after the initial loading as indicated from the monitoring of Stages 4A and 4B and the drainage system will always maintain a connection with the downstream toe drain. The installation of the toe drain will assist in the dissipation of pore pressures in the tailings under the footprint of the dam, including the early phases of construction.
For
insp
ectio
n pur
pose
s only
.
Conse
nt of
copy
right
owne
r req
uired
for a
ny ot
her u
se.
EPA Export 27-07-2013:00:02:54

March 2009 - 40 - 07514150008 A.2
Golder Associates
d) Retention of part of the preload to form the rockfill upstream toe berm, 5m top width and a minimum of 2m high to act as an upstream buttress to improve the stability of the dam wall during construction.
e) Type E material which is topsoil stockpiled on site will be used to form a clay blanket at the final location of the ponds adjacent to the dam walls as discussed later.
6.3 Fill Requirements
The total fill requirements for the construction of the Stage 5 raise are tabulated below.
Item Description Phase 5A Phase 5B Total 1 A1 Glacial Till for Embankment 175886 122553 298439 2 A2 Glacial Till for Embankment 208204 146874 355078 3 A3 Glacial Till for Embankment 42060 29306 71366 Total Glacial Till Requirement 426149 298734 724882 Import materials from minesite
4 Preload 83621 58265 141886 5 Type B/C Drainage Material 30241 21071 51313 6 Type D Crest Roads 7647 5328 12976 7 Temp. Works (e.g. Haul Roads) 4200 2100 6300
Total Imported Requirements 125709 86765 212474
A contingency of 10% is to be added to the glacial till materials Types A1, A2, A3 and preload to take into consideration settlement in the tailings. Thus the total of amount of glacial till material required to construct the dam wall from borrow material on site is 724,900m3. The total of imported mine rock required to construct the dam walls is 193,400m3.
The Type A1, Type A2 and Type A3 materials will be obtained from the remaining materials left in the Northern borrow area and the Seven Fields borrow area as discussed in Section 2. Granular Type A3, used to form the base of the drainage blanket, may be in short supply and an alternative material will be Type B.
Tara Mines are producing mine rock in excess of their mine backfilling requirements. Some of this mine rock will be used as material for preloading (142,000m3) which will then be used for the construction (76,000m3) of the upstream toe berm and upstream side slope protection (Type D2). The material will be crushed and screened to produce Types B and C drainage materials as discussed below.
6.4 Internal Drainage System
The stability of the dam raise is a function of the seepage pattern that develops within the body of the dam (Section 7.5). Although the Type A1 and Type A2 glacial till that will be used to construct the dam is relatively impervious, some minimal seepage will occur within the dam following filling with tailings. If seepages were allowed to develop across the full
For
insp
ectio
n pur
pose
s only
.
Conse
nt of
copy
right
owne
r req
uired
for a
ny ot
her u
se.
EPA Export 27-07-2013:00:02:54
March 2009 - 41 - 07514150008 A.2
Golder Associates
width of the dam section such that it emerged on the downstream slope, the stability of the dam would be reduced. As with the existing embankments for the Stages I, II, III, 4A and 4B, a vertical chimney drain has been incorporated into the design to intercept this seepage and depress the phreatic surface within the embankment. The intercepted seepage water is channelled to the base of the chimney drain where it can exit to the toe of the dam through a continuous drainage blanket.
The chimney drain will consist of granular Type B material which is a washed crushed rockfill and extend to an elevation of 1593.5mAMD. The drainage blanket will consist of a 250m layer of Type B material placed on 750mm of Type A3 granular fill. If there is a shortage of Type A3 or the material contains to many fines then it will be replaced by Type B mine rock.
As with Stage 4, the Type B grading is designed to act as a filter to prevent migration of the fines from the Type A materials and has a D15 size smaller than 0.7mm.
The interface between the in situ tailings and the overlying blanket material is more complicated because of the variability of the tailings deposits. The drainage blanket filter material will in some areas take flow from the fine tailings, and in others, from the sand sized tailings. In order to maintain the practical aspects of the design, a filter fabric, Terram 2000, will be used to separate the drainage material and underlying tailings. The fabric will also improve stability during the placement of the initial layers of compacted fill on the underlying tailings.
The drainage system must be able to convey the seepage flows which is easily satisfied by the chimney drain. The embankment consists of relatively uniform sandy to silty clay till placed as a homogeneous mass without segregation of the coarse particles and compacted to at least 95% of the standard Proctor compaction dry unit weight, the upper bound permeability of the fill is unlikely to exceed 1E-9 m/s. The rate of flow through the body of the dam if water (and not tailings) were ponded against its upstream face is calculated as 0.12l/m/day for this permeability. The 1.0m wide chimney drain operating under a vertical hydraulic gradient of 1 and with a permeability of 1E-5m/s can convey flows of 860l/m/day.
The permeability of the drainage blanket is required to be significantly higher than that of the chimney drain because it has to deal with flows from the tailings foundation, wick drains and chimney drain. It also has to operate with a lower hydraulic gradient than the chimney drain because the driving head will be made up exclusively from a potentially destabilising pressure head. Because of the likely settlement profile of the tailings foundation material, the elevation of the blanket drain at the toe is likely to be higher than at the junction with the chimney drain, and the pressure head will have to overcome this also. In order that the blanket can safely deal with the incoming flows a 1 m thick drainage blanket consisting of Type A3 (750mm) overlain by Type B (250 mm) material. The flow through the drainage
For
insp
ectio
n pur
pose
s only
.
Conse
nt of
copy
right
owne
r req
uired
for a
ny ot
her u
se.
EPA Export 27-07-2013:00:02:54
March 2009 - 42 - 07514150008 A.2
Golder Associates
blanket is sufficient to cope with the seepage through the dam wall and beneath the base. The seepage flow rates are discussed in Section 7.
The installation of Casagrande type standpipe piezometers in the drainage blanket to monitor its effectiveness is discussed later in Section 8.
6.5 Toe drain
A toe drain will collect the flow from the drainage blanket. Upstream toe drain collector chambers will be situated at approximately 400m intervals around the perimeter of the downstream toe of the Stage 5 raise and the seepage water collected. Inspection manholes would be installed between the upstream toe drain collector chambers at every 100m. The location of the chambers and details are shown in Figures 83 and 84. The toe drain is typically 0.6m wide and its base level will vary to form the required gradient but would be at about 1588.4mAMD and cut into the upstream slope of the Stage 4 embankment. A 250mm diameter (230mmID) corrugated drainage pipe is placed on a 50mm bedding layer consisting of Type B material. The upper half of the pipe is slotted to permit the entry of water and the pipe is at a gradient of 0.1% from the inspection manholes to the upstream toe drain collector chamber located every 400m. The difference in depth over a distance of 200m is 200mm. The pipe is screened against the entry of fines by a gravel surround (Type C) enclosed in a Terram 2000 geotextile material.
The flow of water would be monitored via a weir in the upstream toe drain collector chamber on Stage 5 and the water would be discharged into the existing upstream toe drain collector chamber on Stage 4 as discussed below.
6.6 Drain Discharge
Seepage flow from the toe drain is directed across the Stage 4 dam crest via the upstream toe collector chamber to the downstream collector chamber located every 400m. The pipe connecting the two chambers is a 250mm diameter non perforated pipe at a gradient of 1%.
The seepage water collected in the downstream collector channel is discharged via a 250mm diameter non perforated pipe located on the downstream slope of Stage 4 and into the existing Stage 4 collector chamber. The pipe would enter the chamber via a newly constructed opening in the side wall of the chamber. From there, the seepage will be mixed with the seepage from Stage 4A and discharged into the perimeter interceptor channel via the existing chutes. The exception, is along the dividing wall between Stages 5A and 5B where the Stage 4A outlets will have been affected by the placement of tailings in Stage 4B. Discharge from the upstream toe collector drain located on the dividing wall during the operation of Stage 5A will discharge into the downstream collector chamber and then directly into Stage 4B.
For
insp
ectio
n pur
pose
s only
.
Conse
nt of
copy
right
owne
r req
uired
for a
ny ot
her u
se.
EPA Export 27-07-2013:00:02:55

March 2009 - 43 - 07514150008 A.2
Golder Associates
6.7 Wick Drains
To reduce pore pressures and seepage forces in the foundation tailings on the downstream side of the Stage 5 raise, vertical wick drains will be installed at 1.5m intervals at the location of the base of the chimney drain as was incorporated for Stage 4B ( Figure 76).
6.8 Decant System
During filling operations in the Stage 5A, the reclaim pumps will be initially located adjacent to and mid way along the divider wall between Stage 5A and Stage 5B. After year 3, the pumps will be located in the south west corner of Stage 5A (Figure 85). A temporary spillway system will be installed during the Stage 5B construction phase which will allow water to spill from Stage 5A to stage 5B.
Once Stage 5A is capped and depending on the quality of water surface water runoff, this water could be spilled into a wet lands directly from Stage 5A without the need to be mixed with Stage 5B water. The final design of the spillway will be completed after the post closure monitoring phase of Stage 5A.
Similarly, for Stage 5B, the initial pond location and reclaim pumps will be adjacent to and mid way along the divider wall between Stage 5A and Stage 5B. After 3 years, the pumps will be located in the south east corner of Stage 5B (Figure 86).
Once tailings has ceased into Stage 5B, the final design of the spillway will be carried out. This allows for some variation in the final tailings elevation at the pond location. The design will be a simple spillway system. The spillway invert level will be fixed once the final tailings elevation is known. The spillway will exit to a concrete cascade chute on the downstream slope of the dam wall and into a stilling basin to reduce the energy of the flow. The spillway will be designed to accommodate normal discharge requirements and those resulting from the most extreme conceivable storm events.
The spillway decant system will come into operation once the deposition of tailings has ceased. However, pumping back to the plant site will continue for a period on cessation of tailings disposal, prior to the spillway system being put to full use. The divider wall may be breached to allow surface runoff from Stage 5A to migrate to Stage 5B prior to discharge although this will be dependent on the quality of the water from each Stage. Up until this time, the precipitation falling on the Stage 5A tailings pond will be pumped into the Stage 5B pond.
For
insp
ectio
n pur
pose
s only
.
Conse
nt of
copy
right
owne
r req
uired
for a
ny ot
her u
se.
EPA Export 27-07-2013:00:02:55
March 2009 - 44 - 07514150008 A.2
Golder Associates
7.0 ANALYSES
7.1 General
Four principal aspects of the Stage 5 raise behaviour have been considered:
1. Foundation settlement; 2. Dam stability; 3. Seepage flows; and 4. Water quality;
The analysis of these involves the consideration of many factors. However, because of the extensive monitoring of Stages 4A and Stage 4B, it is now possible to predict with some degree of certainty the behaviour and performance of Stage 5 during construction and operations.
7.2 Foundation Settlement
Earth structures are primarily designed on stability considerations with secondary regard to the settlement. However, in the case of the raise, it is important to consider the settlements. Firstly, because of the very soft nature of the tailings deposits, the deformation settlements arising from plastic flow of the tailings (these are separate from the consolidation settlements) are likely to be large and significant quantities of additional fill will be required. Secondly the internal drainage system for the dam relies on continuity of the drainage blanket which could be impaired if there were excessive differential settlements. Any reduction in the settlements which can be achieved will, therefore, produce immediate savings in the quantity of fill which has to be placed to bring the raise to its design elevation, and reduce the potential for damaging differential settlement. By preloading the main foot print area of the dam wall, constructing the raise slowly, allowing the tailings to strengthen, and founding the drainage blanket on a geotextile layer, the deformation resulting from plastic flow can be minimised or eliminated. The consolidation settlements cannot be reduced as they are determined by the overall change in effective stress.
The maximum measured settlements/deformation beneath the Stage 4 B dam wall during the preloading phase (Section 5.4) were generally between 650mm and 700mm in tailings slimes and at the corners of the facility or where the tailings were of a younger age. The minimum settlement was generally between 5mm and 20mm for the coarser total tailings. Settlement resulting from the dam wall construction were for the lower bound values between 50mm and 150mm and upper bounds between 300mm and 500mm. The maximum total tailings settlement observed was 1180mm and related to the finest of the tailings and the fact that this was one of the last areas to be filled and the tailings exposed for less than 6 months prior tosurcharging.
For
insp
ectio
n pur
pose
s only
.
Conse
nt of
copy
right
owne
r req
uired
for a
ny ot
her u
se.
EPA Export 27-07-2013:00:02:55

March 2009 - 45 - 07514150008 A.2
Golder Associates
Settlement/deformation monitored during the construction of the trial embankments constructed in 1989 were between 200mm and 1000mm (Reference 12).
By preloading the tailings, the majority of the settlement/deformation can be taken out prior to construction of the dam wall. Preloading induces significant pore pressures in the tailings which dissipate as the tailings settle, stiffen and gain strength. By placing a minimum of 2m of preload constructed of rockfill over Terram 2000 on the tailings, which including settlement and a unit weight of 2.1 t/m3 is equivalent of placing 2.7m of glacial till. Thus the preloading is equivalent to 50% of the final Stage 5 dam loading.
Based on the monitoring, post preload settlements are likely to be of the order of a minimum of between 25mm and 75mm and a maximum of between 150mm and 250mm. The settlements would be substantially completed by the end of completion of the raise and post construction settlement will be small, <50mm.
7.3 Static Stability
7.3.1 General
Checks on the stability of the Stage 5 raise during construction, during filling and long-term conditions for Stage 5 , Stage 4 and Stages I to III have been made using Slope/W (Reference 15). Conservative effective strength parameters were used in the analyses as given below:
Material Type Friction Angle Degrees
Cohesion kPa
Bulk Density t/m3
Glacial Till Fill 30 0 2.0 Foundation Glacial Till 30 0 2.0 Tailings 33 0 1.7
7.3.2 Stability: During Construction
Tara Mines have successfully constructed two 7.5m high embankment dam walls founded on tailings. Both Stages 4A and 4B were constructed in four seasons and in each case the foundation materials and dam walls were continuously monitored over the construction period.
The Stage 5A and Stage 5B embankment walls will be constructed using a multi-stage approach over three construction seasons. The walls are a height of 5.5m above the foundation tailings and as such will be less problematic to construct than Stage 4. The multistage approach is necessary because the current undrained shear strength of the near surface tailings are generally between 5kPa and 30kPa which is insufficient to allow the embankment to be constructed to its full height in a single stage. A multistage strategy allows
For
insp
ectio
n pur
pose
s only
.
Conse
nt of
copy
right
owne
r req
uired
for a
ny ot
her u
se.
EPA Export 27-07-2013:00:02:55
March 2009 - 46 - 07514150008 A.2
Golder Associates
time for construction pore pressures in the foundation tailings material to dissipate, thereby increasing its strength for subsequent loadings. The analysis of the embankment stability during construction has accounted for the multistage procedure through a simulation of the dissipation process.
The transient pore water pressures in the foundation tailings material and the undrained strength of the fill, are the two principal variables to consider when evaluating the stability of the dam raise during and up to the end of construction. The undrained shear strength of the fill is the more straightforward of the two to deal with. The fill material is to be won from local borrow areas and the minimum undrained strength of this material will be 40kPa to prevent severe rutting caused by trafficking of the proposed maximum 30 tonne dumptrucks to be used in construction. The analysis of the effect of different pore water pressure distributions in the underlying tailings deposit has been conducted in the main using this strength for the fill at 40kPa.
The pore water pressure distribution is influenced by numerous factors although the monitoring of Stage 4B indicated that the pore pressures developed during preloading are dissipated reasonably rapidly and generally within a period of three weeks. Once the pore pressures dissipate, the tailings have consolidated, stiffened and the shear strength of the tailings material increased. After placing the 2.0m of rockfill preload on the tailings of the Stage 4B upstream footprint, the material was removed and construction of the dam wall commenced. Further loading of the tailings during construction resulted in only modest increase in subsequent pore water pressures in the tailings and at a height of 3m above the tailings there appeared to be little or no effective pore pressure response to further loading.
Stability analysis have been undertaken using ru values. The ru value is defined as the piezometric pressure divided by the total stress at a given point. Figure 87 shows the variation of factor of safety of the upstream half of the raise with the pore water pressure ratio ru for different embankment heights calculated using the Slope/W program. The upstream half of the raise has been analysed as the downstream half is considered to be less critical because it has a flatter slope, is generally underlain by shallower tailings deposits and is under-drained by a drainage blanket. The factors of safety are tabulated below.
ru values Construction Phase Dam Height (m) 0.5 0.25 0.1 1 1.5 1.01 2.65 3.29 2 3.5 0.84 1.77 2.21 3 5.5 0.75 1.47 1.80
It is apparent that for an ru of 0.5, the preload stability of the rockfill at a height of 2m is marginally stable. In all cases, as the ru value decreases and the pore pressures dissipate, the stability of the structure increases. Dissipation is quite rapid being 90% complete generally within 3 weeks. It has been assumed that the glacial fill used in construction of the dam wall
For
insp
ectio
n pur
pose
s only
.
Conse
nt of
copy
right
owne
r req
uired
for a
ny ot
her u
se.
EPA Export 27-07-2013:00:02:55
March 2009 - 47 - 07514150008 A.2
Golder Associates
does not generate significant construction pore pressures which is the case for low plastic clays placed at a moisture content of within 2% of optimum as measured during the construction of the Stage 4B wall.
Vibrating wire piezometers in the foundation tailings of the raise will be installed and monitored during construction in order for pore pressures not to build up in the tailings. Thus, provided pore water pressures in the tailings do not exceed an ru value of 0.3 at the final dam height then the tailings are unlikely to be overstressed. The ru values at the end of Stage 4A and 4B construction were significantly less than 0.3.
7.3.3 Stability During Filling of Stage 5
Stability analyses were carried out assuming that filling Stage 5 will increase the piezometric pressures in the tailings foundations on the downstream side of both Stages 4 and 5. The analyses included four different piezometric levels in the tailings beneath the Stage 4 dam wall as shown on Figures 88 to 92. The results are tabulated below.
Piezometric Elv. mAMD Stage 4 Tailings Foundations
Factor of Safety (Static)
1592 0.62 1590 0.82 1589 1.13 1588 1.39 1587 1.61
The piezometric elevation in the tailings foundation on the downstream side of the Stage 4 dam wall should not exceed an elevation of 1588.3mAMD or approximately 4.2m below the pond water level to ensure the factor of safety is above 1.3 during operations. This is unlikely to be exceeded due to the effectiveness of the drainage blanket and wick drains. Based on the performance of Stage 4 as outlined in Section 3.2.4, and assuming that the pond level rises 4m as a result of filling Stage 5 and the piezometric level in the tailings increases accordingly, the piezometric level is unlikely to rise above 1587mAMD. The piezometers already installed in the Stage 4 tailings foundations will continue to be monitored during the filling of Stage 5.
If piezometric monitoring of the foundation tailings during the filling of Stage 5, indicates the pore pressure increasing towards a value of 1588.3m AMD (factor of safety of 1.3), due to a malfunction of the drainage blanket, then either a surcharge can be placed on the downstream toe (reducing the slope angle) to improve stability or additional wick drains could be installed through the Stage 4 dam wall and into the foundation tailings to improve stability.
Similarly, the piezometric level in the downstream tailings foundation of the Stage 5 dam wall will affect the stability of the dam wall during filling of the facility with tailings. The stability analysis indicates that as the piezometric head increases, the factor of safety decreases as illustrated below and given in Figures 93 to 95.
For
insp
ectio
n pur
pose
s only
.
Conse
nt of
copy
right
owne
r req
uired
for a
ny ot
her u
se.
EPA Export 27-07-2013:00:02:55

March 2009 - 48 - 07514150008 A.2
Golder Associates
Piezometric Elv. mAMD Stage 5 Tailings Foundations
Factor of Safety (Static)
1592 1.99 1590 2.46 1588 2.64
The stability of the Stage 5 dam wall is satisfactory even if the piezometric level in the tailings foundation on the downstream side of the Stage 5 dam wall exceeds 0.5m below the pond water level. Based on Stage 4 performance, the maximum piezometric level in the downstream foundation tailings of the dam raise was greater than 5.5m below the maximum operating pond water level.
In the long term, after cessation of operations and the facilities are capped and restored, the piezometric surface in the tailing foundation for both Stage 4 and 5 dam walls will reduce as the pond water level drops from a maximum operating level of 1592.5mAMD to a level approaching 1591mAMD. Ponding on the surface of the facility after capping and restoration will be prevented by the spillway system installed in the south west and south east corners of Stage 5A and 5B.
7.3.4 Stability: Long-Term
A series of stability analyses have been carried out to check the long-term stability of the Stage 5 raise.
The geometry of the combined Stage 5 raise, existing embankments and deposited tailings will lead to a somewhat complex steady seepage condition throughout the facility which is difficult to predict reliably. The pore water pressures within the slopes are chiefly affected by the efficiency of the internal drainage in the raise and existing embankments. The chimney, blanket and finger drains have been designed to minimise the water pressures, and evidence from monitoring of the existing dams over the past 20 years suggests that this has been achieved as outlined in Section 3.0. However, unforeseen circumstances may impair the efficiency of the internal drains and this possibility has been investigated. For the maximum height dam section , two phreatic surfaces have been considered. These two phreatic surfaces correspond to the following conditions of the internal drainage systems of the dams:
1. The drains of the Stage 5 and Stage 4 raises and Stages I to III working to specification; and
2. The drains in both the raise and existing dam throttling the flows. The results of the two stability analysis are presented on Figures 96 and 97. As expected, the analyses for the situation where the drainage systems are impaired yield the lowest factors of safety of 1.39 which is satisfactory. The factor of safety for the facility with a fully operational drainage system is 1.53. However, with a drainage malfunction, the piezometric
For
insp
ectio
n pur
pose
s only
.
Conse
nt of
copy
right
owne
r req
uired
for a
ny ot
her u
se.
EPA Export 27-07-2013:00:02:55
March 2009 - 49 - 07514150008 A.2
Golder Associates
pressures in the foundation tailings would increase and the factors of safety as outlined in Section 7.3.3 are applicable.
7.4 Dynamic Stability
7.4.1 General
Future loading on the dam is essentially limited to earthquake loading. Ireland is characterised by low levels of seismic activity; and despite a historical record dating back to approximately 1100 AD there have been no known occurrences of severe earthquakes. The largest seismic event known to have affected Ireland during this time was the 1984 North Wales earthquake which had a magnitude of 5.4 on the Richter scale. It was felt along the east coast of Ireland but no damage resulting from it was recorded. There have been occasional smaller seismic events in or near Ireland. The Dublin Institute of Advanced Studies has compiled a catalogue of Irish seismicity consisting of "felt" reports of events dating from 1750. Based on this data the peak ground acceleration is estimated at 0.04g for an annual probability of 1 in 10,000. More recently the British Geological Survey (Reference 16) has estimated that at a confidence level at 84% the estimated ground acceleration at the site shall not exceed 0.0572g for an annual probability of 1 in 10,000.
There are two conceivable mechanisms by which an earthquake could threaten the integrity of the tailings facility: firstly liquefaction of the tailings which form the foundation of the Stage 4 and 5 raises, and secondly a slope failure of the raise or existing dams as a result of high horizontal ground accelerations. The potential for each of these events has been assessed and is discussed in the following sections.
7.4.2 Liquefaction
Very loose granular materials have the potential to liquefy during shear. The conditional term `very loose' essentially means that the material has an in situ void ratio greater than its critical void ratio. In this state it will have a tendency to decrease in volume during shear generating pore water pressures and reducing its resistance to support further loading.
The cone penetration tests (Section 4.2) and laboratory tests (Section 4.5) generally show that the tailings deposit is in a loose state in that pore pressures are generated during initial shear, though there is some evidence that it also has a tendency to dilate at large strains. It is anticipated that some reduction in void ratio and a corresponding increase in dry density will result from the construction of the dam raise. Nevertheless, based on the existing relative density and gradings for the sands in particular, they appear to be capable of liquefaction in extreme earthquake events. It should be noted, however, that liquefaction has never been reported in similar materials subject to the relatively small ground acceleration design value (0.04g to 0.06g) that is relevant for this location in Ireland. It is therefore considered that liquefaction of the tailings at this site is unlikely.
For
insp
ectio
n pur
pose
s only
.
Conse
nt of
copy
right
owne
r req
uired
for a
ny ot
her u
se.
EPA Export 27-07-2013:00:02:55
March 2009 - 50 - 07514150008 A.2
Golder Associates
7.4.3 Seismic Induced Slope Failure
When a slope is subjected to an earthquake, the shear stresses associated with ground acceleration will add to the shear stresses required for static equilibrium and this may lead to destabilisation of the slope. In Section 7.4.1 it was mentioned that in Ireland the peak ground acceleration for an annual probability of 1 in 10,000 is around 0.049 to 0.057g. The effect of such earthquakes producing 0.06g horizontal ground accelerations on the long term stability of the highest dam section described in Section 7.3.4 has been assessed for the worst case scenario of malfunctioning drain. Again, a number of failure mechanisms have been considered. The analyses indicate that in the event of such an earthquake, the factor of safety of the dam sections would decrease to 1.2. It is considered this factor of safety is still adequate.
Taking all the above mentioned factors into account, it is considered that the risk of the integrity of the dam being endangered through earthquake induced liquefaction or earthquake induced destabilisation is acceptably small.
7.5 Seepage
7.5.1 General
The Stage 5 raise drainage system and wick drains described earlier in Section 6 were designed to accommodate the expected flows under and through the dam wall. These flows would be directed to the toe drain and then piped across Stage 4 and into the existing chambers to the interceptor channel. The quantity of seepage through the Stage 5 dam wall is dependent on the height of the pond water level, the thickness, nature and permeability of the tailings which underlie the dam and the permeability of the upstream dam fill material.
The tailings deposits have been found to consist of interbedded layers of sand, silt and clay-sized tailings. The permeability of the tailings sands and silts are of the order of 1E -5m/s to 1E-7m/s and the permeability of the silty clay tailings is of the order of 1E-8m/s to 1E-9m/s. As a result of the horizontal stratification of the materials, the tailings deposit can be expected to show a considerable degree of anisotropy with respect to permeability; the horizontal permeability being controlled by the layers of relatively permeable sand and the vertical permeability being controlled by the layers of relatively impermeable clay-sized tailings.
Permeability tests were carried out on selected samples of the fill material from the Seven Fields borrow areas. The results of these tests have been described earlier in Section 2.3.10. Very low values were measured for the permeability of the Type A fill samples between 7.6E-10m/s and 1.3E-11m/s. These suggest that even with imperfections in the construction placement, a permeability of around 1E-9m/s can be expected for the material in the upstream shoulder of the dam. This is the same order of permeability as the clay-sized tailings. Seepage under the dam raise will be to some extent controlled by the higher horizontal
For
insp
ectio
n pur
pose
s only
.
Conse
nt of
copy
right
owne
r req
uired
for a
ny ot
her u
se.
EPA Export 27-07-2013:00:02:55

March 2009 - 51 - 07514150008 A.2
Golder Associates
permeability of the tailings, particularly the sands if present, although recharge will be governed by the vertical permeability of the tailings. For this reason, a minimum1m layer of slimes will be placed on the upstream toe of the Stage 5 raise prior to placement of any coarser tailings derived by segregation of the total tailings.
The expected seepage volumes have been evaluated for the following cases:
• Emanating through the dam walls of Stage 5, Stages 4 and Stages I, II and III and collected by the internal drainage system prior to discharges into the perimeter interceptor channel; and
• Emanating through the base of the facility and intercepted by the perimeter interceptor channel.
The pond water level has risen from 1582.5mAMD to 1588.5mAMD after the construction and filling of the Stage 4A raise. The pond water will then rise 4m, from 1588.5mAMD to 1592.5mAMD after the completion of the Stage 5 raise. As the pond water rises so does the tailings level and provided that they rise at the same rate, the hydraulic head across the tailings remains the same and close to unity. If the hydraulic head remains the same then, theoretically, the seepage should be constant and controlled by the vertical permeability of the tailings. Also, as the tailings level increases, consolidation of the lower layers occurs resulting in a decrease in permeability of the tailings at depth and therefore a decrease in vertical seepage.
7.5.2 Seepage Collected from the Internal Drainage Systems.
As previously discussed in Section 3.3, the seepage monitored from raising Stage 4A and excluding rainfall infiltration was of the order of 0.5l/s which was 50 times less than the design value predicted in the Stage 4 design (Reference 4). The total seepage expected from the Stage 4A and Stage 4B raise is 1l/s.
Prior to construction of the Stage 4 raise, seepage emanating through the dam wall and runoff from the dam wall together with groundwater was measured in the eastern and western perimeter interceptor channel which is found on the downstream toe of Stages I, II and III respectively. It is therefore very difficult to attribute the amount of seepage emanating from the internal drainage system of Stages I, II and III by monitoring the perimeter interceptor channel. Flow in the channel is dominated by rainfall as the channel collects all of the surface runoff falling on the downstream side slopes of all the dam walls. The western perimeter channel around the Stage III facility is further complicated because some seepage has been pumped back directly to Stage III in the past and now currently into Stage 4B. During construction of Stage 4B, the water was pumped over a high point and back into the interceptor channel. The eastern perimeter interceptor channel also collects seepages from the Stage 4A raise. Both the eastern and western interceptor channels have been deepened to intercept the groundwater.
For
insp
ectio
n pur
pose
s only
.
Conse
nt of
copy
right
owne
r req
uired
for a
ny ot
her u
se.
EPA Export 27-07-2013:00:02:55
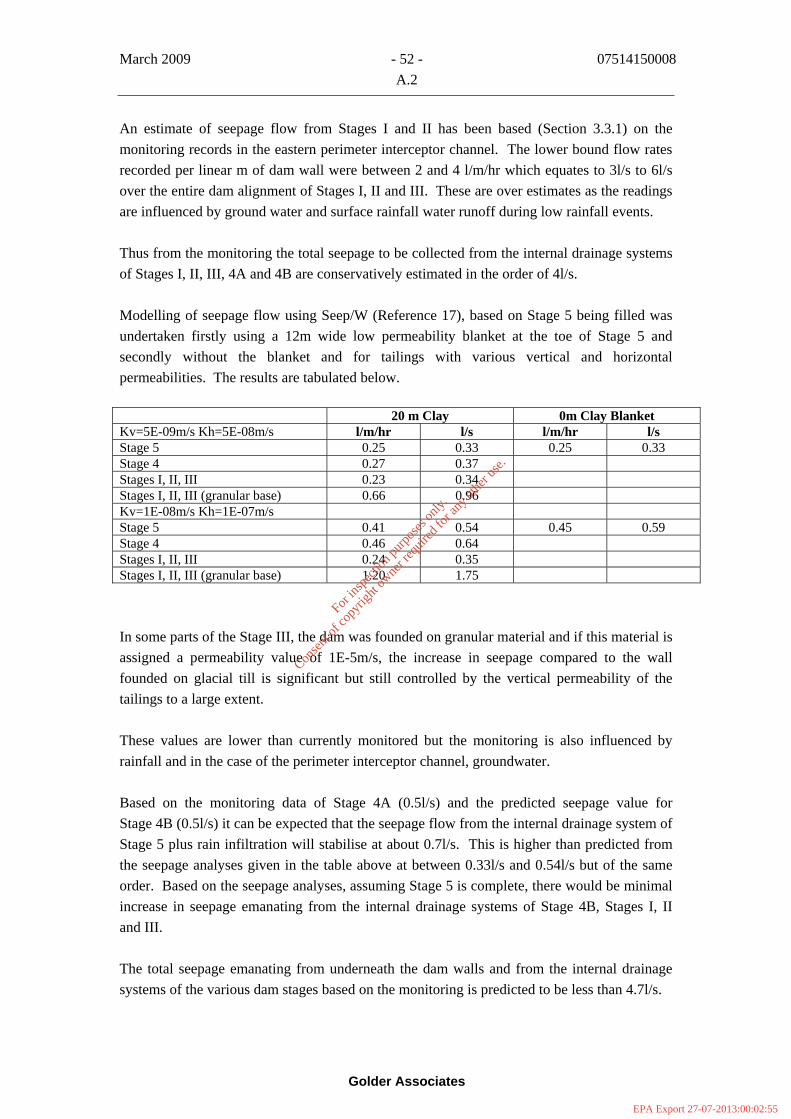
March 2009 - 52 - 07514150008 A.2
Golder Associates
An estimate of seepage flow from Stages I and II has been based (Section 3.3.1) on the monitoring records in the eastern perimeter interceptor channel. The lower bound flow rates recorded per linear m of dam wall were between 2 and 4 l/m/hr which equates to 3l/s to 6l/s over the entire dam alignment of Stages I, II and III. These are over estimates as the readings are influenced by ground water and surface rainfall water runoff during low rainfall events.
Thus from the monitoring the total seepage to be collected from the internal drainage systems of Stages I, II, III, 4A and 4B are conservatively estimated in the order of 4l/s.
Modelling of seepage flow using Seep/W (Reference 17), based on Stage 5 being filled was undertaken firstly using a 12m wide low permeability blanket at the toe of Stage 5 and secondly without the blanket and for tailings with various vertical and horizontal permeabilities. The results are tabulated below.
20 m Clay 0m Clay Blanket Kv=5E-09m/s Kh=5E-08m/s l/m/hr l/s l/m/hr l/s Stage 5 0.25 0.33 0.25 0.33 Stage 4 0.27 0.37 Stages I, II, III 0.23 0.34 Stages I, II, III (granular base) 0.66 0.96 Kv=1E-08m/s Kh=1E-07m/s Stage 5 0.41 0.54 0.45 0.59 Stage 4 0.46 0.64 Stages I, II, III 0.24 0.35 Stages I, II, III (granular base) 1.20 1.75
In some parts of the Stage III, the dam was founded on granular material and if this material is assigned a permeability value of 1E-5m/s, the increase in seepage compared to the wall founded on glacial till is significant but still controlled by the vertical permeability of the tailings to a large extent.
These values are lower than currently monitored but the monitoring is also influenced by rainfall and in the case of the perimeter interceptor channel, groundwater.
Based on the monitoring data of Stage 4A (0.5l/s) and the predicted seepage value for Stage 4B (0.5l/s) it can be expected that the seepage flow from the internal drainage system of Stage 5 plus rain infiltration will stabilise at about 0.7l/s. This is higher than predicted from the seepage analyses given in the table above at between 0.33l/s and 0.54l/s but of the same order. Based on the seepage analyses, assuming Stage 5 is complete, there would be minimal increase in seepage emanating from the internal drainage systems of Stage 4B, Stages I, II and III.
The total seepage emanating from underneath the dam walls and from the internal drainage systems of the various dam stages based on the monitoring is predicted to be less than 4.7l/s.
For
insp
ectio
n pur
pose
s only
.
Conse
nt of
copy
right
owne
r req
uired
for a
ny ot
her u
se.
EPA Export 27-07-2013:00:02:55

March 2009 - 53 - 07514150008 A.2
Golder Associates
Based on the seepage monitoring and seepage analyses, it is not proposed to install a low permeability blanket at the upstream toe of Stage 5 except at the final location of the ponds in the south west corner of Stage 5A and south east corner of Stage 5B. In both areas, the tailings may have a high sand content and it is proposed a 30m clay blanket (Type E), 1m thick, is placed directly on the tailings (Figure 98). As these two areas may have been filled with a high proportion of total tailings, preloading may not be required and the clay blanket could be placed directly on the tailings sands.
The slimes placed during the initial discharge into Stage 5 has a permeability as low as the clay blanket placed and is therefore unnecessary.
7.5.3 Downward Seepage
During the filling of Stage 4A, three vibrating wire piezometers were installed close to the base of the tailings in Stage I. The locations are at chainages 0m, 400m and 1300m (Figure 5) and at depths of 1569.7mAMD, 1572mAMD and 1575mAMD respectively. They have remained relatively constant over the monitoring period and show little response to the fluctuating pond water level. The piezometer at chainage 400 indicates a piezometric level approximately 12m below the pond water level. Similarly, at chainage 0, the piezometric level is approximately 6m below the pond level and at chainage 1300, the piezometric level is approximately 5m below the pond level. The difference between the piezometric level at depth and the pond water level is an indication that there is a component of vertical downwards seepage occurring in the tailings. Increasing the pond water level in Stage 4A has had a limited impact on the piezometric level at depth and hence the volume of downward seepage.
At the filling of Stage 5, the tailing thickness in all stages will vary from 18.5m in the northern areas to 25.5m in the southern areas. The vertical permeability of the tailings will be controlled by the slimes which are likely to be of the order of 1E-9m/s to 1E-8m/s. It should be noted that 10m thickness of tailings at a permeability of 1E-8m/s is equivalent to a 1m thick layer at 1E-9m/s. The coarser material will have greater permeabilities and of the order 1E-7m/s to 1E-5m/s. Based on the low vertical permeabilities, the downward seepage through the base of the facility will likely be of the range from the order of 1.5l/s to 15l/s with a mean value of 8.3l/s (5E-9m/s) and collected in the perimeter interceptor channel.
7.5.4 Total Seepage
The total seepage through the tailings facility will be the sum of the seepages collected within the internal drainage system and seepage migrating through the base of the facility. Both are intercepted by the perimeter interceptor channel. Thus, flow into the tailings facility (infiltration/recharge) will equal flow out of the tailings facility (seepage) as both are controlled by the vertical permeability of the tailings.
For
insp
ectio
n pur
pose
s only
.
Conse
nt of
copy
right
owne
r req
uired
for a
ny ot
her u
se.
EPA Export 27-07-2013:00:02:55
March 2009 - 54 - 07514150008 A.2
Golder Associates
The seepage from the internal drainage systems (Section 7.5.2) for Stages I, II, III, 4 and 5 is estimated to be 4.7l/s and the vertical seepage has been taken as an average value of 8.3l/s (Section 7.5.3) giving a total seepage of 13l/s. However, since total infiltration/recharge is governed by the permeability of the tailings and assuming an average value of 1E-8m/s and equals 8.3l/s then the total seepage from the facility should not exceed 8.3l/s. However, a higher value of 13l/s has been taken for total seepage which is conservative.
7.6 Water Quality
The 2008 audit report on surface and groundwater quality (Reference 10) concludes that sulphate concentrations detected in the groundwater and surface water have generally decreased since 1996, although some of the concentrations within the interceptor channel, bedrock and overburden are high and are at a maximum immediately to the south of the Stage III tailings facility. In this area, monitoring wells OB1-P1 and OB1-P2 and OB3 indicated maximum sulphate values between 1300mg/l and 1400mg/l. The average sulphate values for OB1-P1 and P2 were 1205mg/l and 1102mg/l which are close to the maximum recorded and reflect the nearness of the monitoring wells to the downstream toe of Stage III and the fact that there is little chance of dilution. OB3, which is further out from the toe indicated an average value of 587mg/l. Only four other monitoring wells indicated maximum sulphate values above 250mg/l. These were OB4-P2, OB2, OB6 and OB11.
Prior to construction of Stage 5, a resistivity survey will be undertaken on the downstream toe of the Stages I, II and III dam walls inside and outside of the perimeter interceptor channel. The survey will determine the extent of any contamination plume emanating from the facility. Monitoring wells should be installed every 200m along the toe of Stages I, II and III. Monitoring wells are currently located in selected areas and this needs to be expanded based on the results of the resistivity survey which will assist in the extent of monitoring wells beyond the toe of the dam wall.
Monitoring data from the eastern interceptor channel indicates a slight decline in sulphate values which is not unexpected considering seepage from Stage 4A is decreasing. Sulphate concentration values are between 200mg/l to 800mg/l with flow rates between 2l/s and 28l/s. The sulphate values monitored in the western interceptor channel are between 200mg/l and 2000mg/l with flow rates between 1l/s and 15l/s. The sulphate values in the pond water of Stage 4A and Stage 4B are generally between 500 mg/l and 000mg/l.
Seepage modelling indicates a limited increase in seepage into the interceptor channel by the construction and filling of Stage 5. This increase is less than 20% and it could be expected that sulphate concentration will increase during operation as occurred during the Stage 4 operation and then to decrease as the tailings consolidated. The final sulphate concentration monitored in the perimeter interceptor channel after the completion of Stage 5 will be similar to current values. Any additional seepage will be diluted by surface runoff from the side walls of Stage 5 and infiltration through the dam wall of Stage 5.
2
For
insp
ectio
n pur
pose
s only
.
Conse
nt of
copy
right
owne
r req
uired
for a
ny ot
her u
se.
EPA Export 27-07-2013:00:02:55

March 2009 - 55 - 07514150008 A.2
Golder Associates
8.0 CONSTRUCTION
8.1 General
It is envisaged that construction of the Stage 5A and 5B raises will take 3 construction seasons each including a pre-construction phase. For Stage 5A, the pre construction phase will commence in 2010 and the construction phase will start also in 2010 and be completed by the end of October, 2012. The placement of tailings in Stage 4A was completed at the end of 2006 so the tailings will have been exposed for over 3 years prior to construction of Stage 5. This period will allow the tailings to desiccate, consolidate and gain strength. It is expected that the tailings will be stronger than the foundation tailings for Stage 4B which in some areas was less than 6 months old. The construction of Stage 5B will commence in 2015 and be completed by the end of October 2017.
The requirement for 3 construction seasons for each stage is to overcome the anticipated geotechnical constraints associated with the tailings surface of Stage 4 particularly along the areas where the tailings are predominantly slimes in nature. A useful comparison can be made with the construction programme for Stage 4B, which took around 3.5 construction seasons to complete and was 7.5m high.
The dam raise for Stage 5 will be carried out directly by the site supervisory team from Golder using locally hired plant and labour. This is considered the optimum method to control the rate of construction and was technically successful for the Stage 4B raise.
8.2 Pre Construction Phase: 2010
The following preliminary works are to be undertaken prior to the commencement of the construction of the main dam wall:
a) Dewatering and drainage works in Stage 4A;
b) Installation of a sprinkler system; c) Installation of fencing and gates around the Seven Fields Borrow Area; d) Marking power line protection corridors; e) Preparation of the Seven Fields Borrow Area, including site clearance, drainage works,
top soil strip; f) Commencement of the importation of Type B drainage material and mine rock; and g) Pre-loading of the tailings using mine rock.
For
insp
ectio
n pur
pose
s only
.
Conse
nt of
copy
right
owne
r req
uired
for a
ny ot
her u
se.
EPA Export 27-07-2013:00:02:55

March 2009 - 56 - 07514150008 A.2
Golder Associates
8.3 2010 Construction Season
During the 2010 construction season, approximately 60% of the Stage 5A dam raise is programmed to be constructed to a height of 1.5m, and the preloading extended along 80% of the footprint. A summary of the 2010 construction works are as follows:
a) Sprinkler system in place and operational to suppress dust;
b) Preloading will be carried out in stages, making use of the preload material in subsequent stages;
c) Wick drains will be installed; d) A3 granular material and Terram 2000 will be placed under the footprint of the
downstream shoulder of the dam; e) Type B drainage blanket will be placed; f) Construction of downstream toe drain, including upstream and downstream chambers
and crossings through the existing Stage 4A dam. This task will be carried out in the 4th quarter of 2010 (and the 1st quarter of 2011) when dam fill construction ceases and access along the existing Stage 4A dam crest becomes available for toe drain construction;
g) Removal of preload and placement and compaction of A1 clay fill material; h) Placement and compaction type A2 clay fill material, including the construction of the
chimney drain; i) Installation of 3 clusters of instrumentation; and j) Place Type E blanket material in the south west corner of Stage 5A directly on tailings. 8.4 2011 Construction Season
A summary of the 2011 construction works are as follows:
a) Preloading to be completed and completion of construction to 1.5m height;
b) Completion of the downstream toe drain and crossings through existing Stage 4A dam. This task will be completed during the winter months as in Section 8.3(f);
c) Installation of remaining 3 clusters of instrumentation; d) Raising the dam to a height of 3m for both A1 and A2 sections, including the
construction of the chimney drain with Type B material; e) Forming upstream toe berm for 50% of the length; and f) Construction of A2 clay fill access ramps.
For
insp
ectio
n pur
pose
s only
.
Conse
nt of
copy
right
owne
r req
uired
for a
ny ot
her u
se.
EPA Export 27-07-2013:00:02:55

March 2009 - 57 - 07514150008 A.2
Golder Associates
8.5 2012 Construction Season
A summary of the 2012 construction works are as follows:
a) Raising the dam to final dam height of 5.5m above the tailings level, including construction of chimney drain and completion of the upstream toe berm;
b) Construction of A2 clay fill access ramps; c) Placement and compaction of A2 clay fill over downstream toe drain; d) Placement of D3 road material on the crest of the dam raise and ramps, and regrading
of other access roads; e) Trim side slopes and place D2 protection material on upstream slope; and f) Install standpipe piezometers in the dam raise and foundation tailings. 8.6 Instrumentation
Information pertaining to the performance and condition of the raise will be required during and after its construction as was undertaken for the Stage 4 raise. This information - pore pressures, movements and settlements will be gathered by means of extensive instrumentation. Essentially three sets of instrumentation are required:
• The first set to collect data relevant to the pre loading phase;
• The second during the construction phase; and • The third set to collect data relevant to the filling of the facility and long-term
performance of the dam walls and seepage.
As with Stage 4, the first phase of instrumentation, the vibrating wire piezometers and settlement plates (Figure 99) would be placed into and on the tailings prior to preloading. The frequency of instrumentation will be the same as Stage 4B i.e six clusters of instruments as shown in section in Figures 16 and 29. Settlement plates would be installed every 100m along the dam alignment plus surface movement pegs installed along the toe of the embankment.
The instrumentation required to monitor the filling stage and long-term performance of the raise consists of Casagrande standpipe piezometers installed in the downstream and upstream body of the raise, and in the drainage blanket to ensure it is working effectively. A typical section through the dam showing the location of this additional instrumentation are shown in Figure 29.
For
insp
ectio
n pur
pose
s only
.
Conse
nt of
copy
right
owne
r req
uired
for a
ny ot
her u
se.
EPA Export 27-07-2013:00:02:55

March 2009 - 58 - 07514150008 A.2
Golder Associates
9.0 REFERENCES
1. Golder Associates. Report to Kilborn Engineering Ltd, Geotechnical Investigation Tara Mines Ltd, Tailings Dam, Vol. 2, H.Q.Golder Associates Ltd, May 1974, Report No. L73074/2.
2. Golder Associates. Report to Tara Mines Ltd, on Design Recommendations, Stage II Tailings Disposal Area. Golder Hoek and Associates Ltd, December 1978, Report No. L78026/3.
3. Golder Associates. Report to Tara Mines Ltd, on Design and Construction Recommendations Stage III Tailings Dam. Vol. 1, Golder Associates, October 1982, Report No. 8151014.
4 Golder Associates. Draft Report to Outokumpu Tara Mines on the Design of the Stage 4 Dam Raise, 1996 Report No. 93512044/6.
5 Golder Associates. Draft Report to Outokumpu Tara Mines on the Proposed Construction Programme Stage 4B Tailings Dam Raise Tara Mines August 2002 Report No. 02511524.
6 Golder Associates. Report to Tara Mines Limited on the proposed Design Changes, Construction Programme and Designer Risk Assessment Stage 4B Tailings Dam Raise. August 2003 Report No. 035111315/2.
7 Golder Associates. Draft Report to Outokumpu Tara Mines on the Assessment of the Northern Borrow Property and Construction of Stage 4B, 2001.
8 Golder Associates. Report to Outokumpu Zinc Tara Mines on Additional Site Investigation Adjacent to the Northern Borrow Area for Purpose of Tailings Dam Raise. March 1996 Report No. 95512098.
9 Golder Associates. Report to Boliden Tara Mines Ltd Annual Safety Inspection and Monitoring of Tailings Dam Stages I, II, III, 4A and 4B, 2008.
10 Scott Wilson. Review of 2008 Hydro-Environmental Monitoring Data.
11 Outokumpu Tara Mines (1996) Internal Memo. Deepening Perimeter Interceptor Channel.
12 Fugro Ltd. Static ConePenetration Tests Soil Investigation No. IRE075004. 2007
For
insp
ectio
n pur
pose
s only
.
Conse
nt of
copy
right
owne
r req
uired
for a
ny ot
her u
se.
EPA Export 27-07-2013:00:02:55
March 2009 - 59 - 07514150008 A.2
Golder Associates
13 Hazen H. L. Some Physical Properties of Sand and Gravels with Special Reference to their use in Filtration 24th Annual Report. State Board of Health, Massachusetts. 1892.
14 Golder Associates. Report to Outokumpu Zinc Tara Mines Ltd on a dam raise scheme to increase the storage capacity of the existing tailings ponds, February 1990, Report no. 8751030
15 GEO-SLOPE/W International Ltd. Stability Modelling with SLOPE/W May 2004.
16 British Geological Survey. Global Seismology research Group, Edinburgh.
17 GEO-SLOPE/W International Ltd. Seepage Modelling with SEEP/W May 2004
18 Golder Associates. Report to Outokumpu, Tara mines Ltd on assessment of palaeokarstic features in relation to the tailings impoundment, June 1996, Report no. 95512034 / 96512012
19 Golder Associates. Report to Outokumpu, Tara Mines Ltd on probabilistic risk assessment, June 1996, Report no. 96521001.
For
insp
ectio
n pur
pose
s only
.
Conse
nt of
copy
right
owne
r req
uired
for a
ny ot
her u
se.
EPA Export 27-07-2013:00:02:55

March 2009 - 1 - 07514150008 A.2
Golder Associates
FIGURES
For
insp
ectio
n pur
pose
s only
.
Conse
nt of
copy
right
owne
r req
uired
for a
ny ot
her u
se.
EPA Export 27-07-2013:00:02:55

For
insp
ectio
n pur
pose
s only
.
Conse
nt of
copy
right
owne
r req
uired
for a
ny ot
her u
se.
EPA Export 27-07-2013:00:02:55
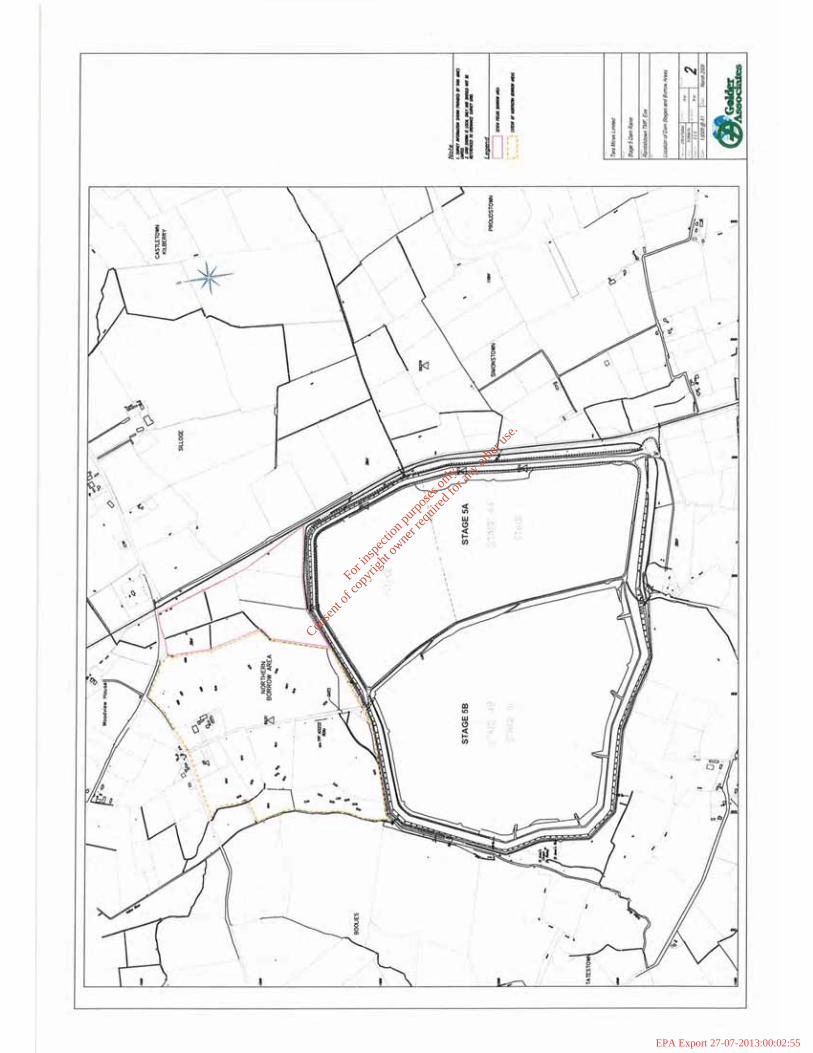
For
insp
ectio
n pur
pose
s only
.
Conse
nt of
copy
right
owne
r req
uired
for a
ny ot
her u
se.
EPA Export 27-07-2013:00:02:55

For
insp
ectio
n pur
pose
s only
.
Conse
nt of
copy
right
owne
r req
uired
for a
ny ot
her u
se.
EPA Export 27-07-2013:00:02:55
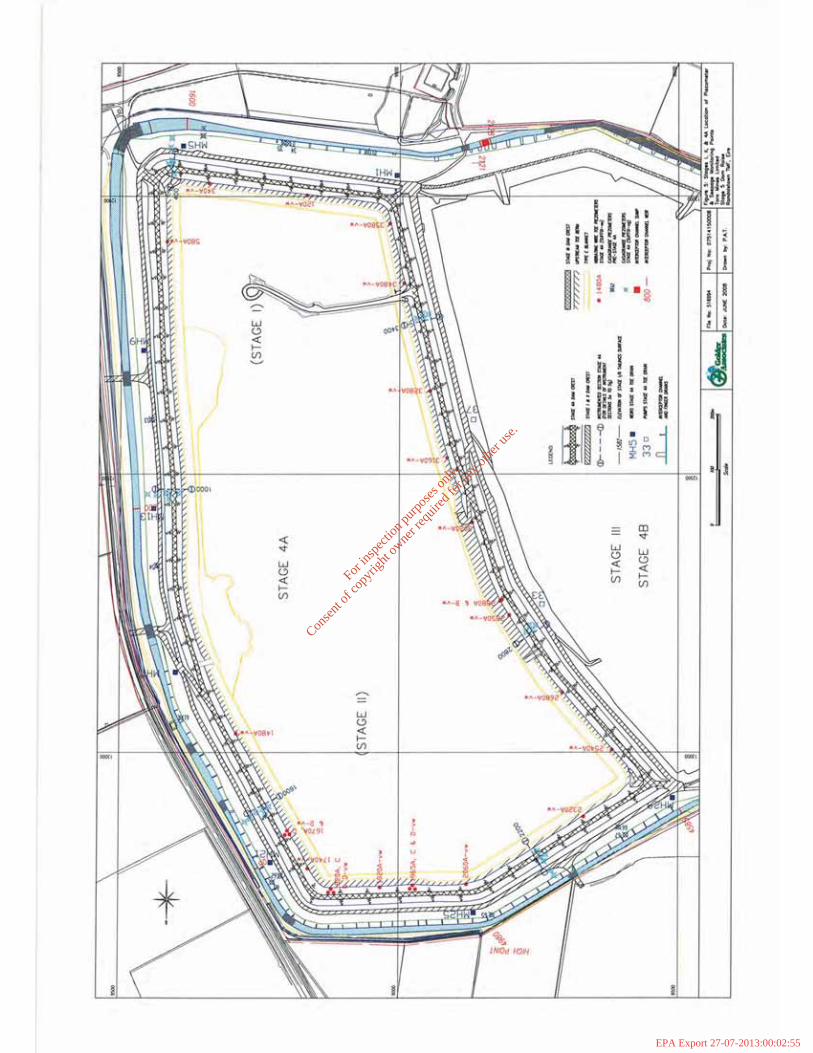
For
insp
ectio
n pur
pose
s only
.
Conse
nt of
copy
right
owne
r req
uired
for a
ny ot
her u
se.
EPA Export 27-07-2013:00:02:55
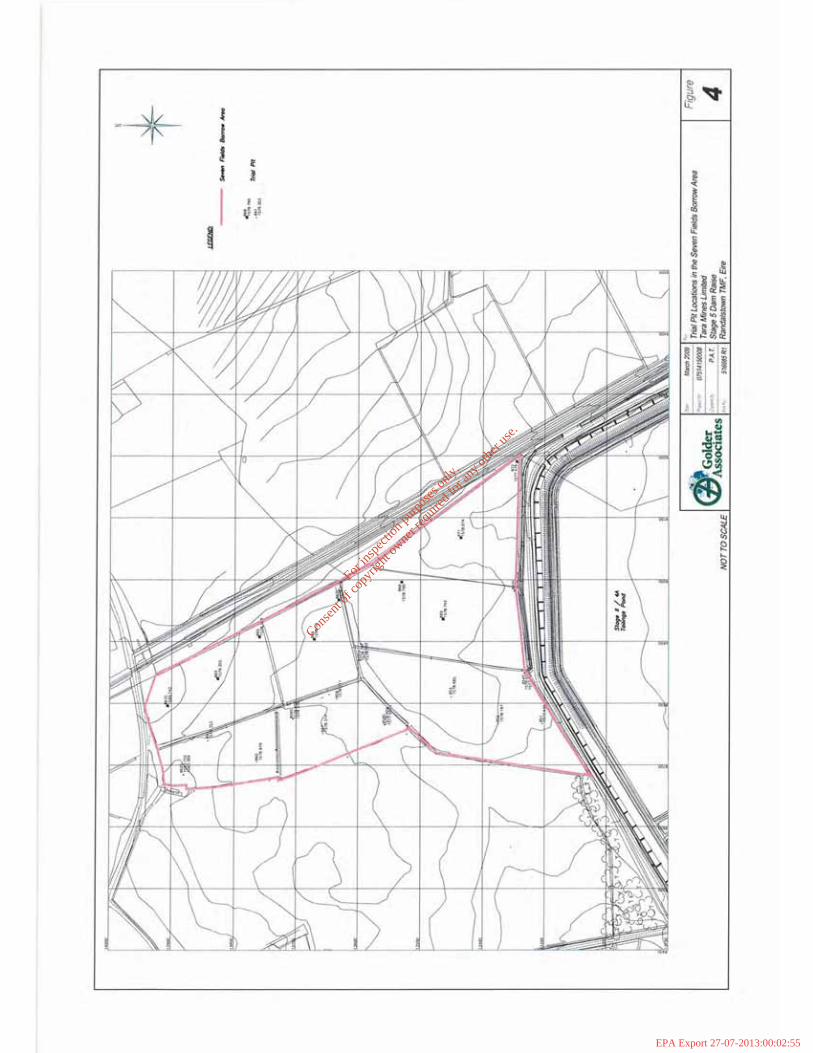
For
insp
ectio
n pur
pose
s only
.
Conse
nt of
copy
right
owne
r req
uired
for a
ny ot
her u
se.
EPA Export 27-07-2013:00:02:55
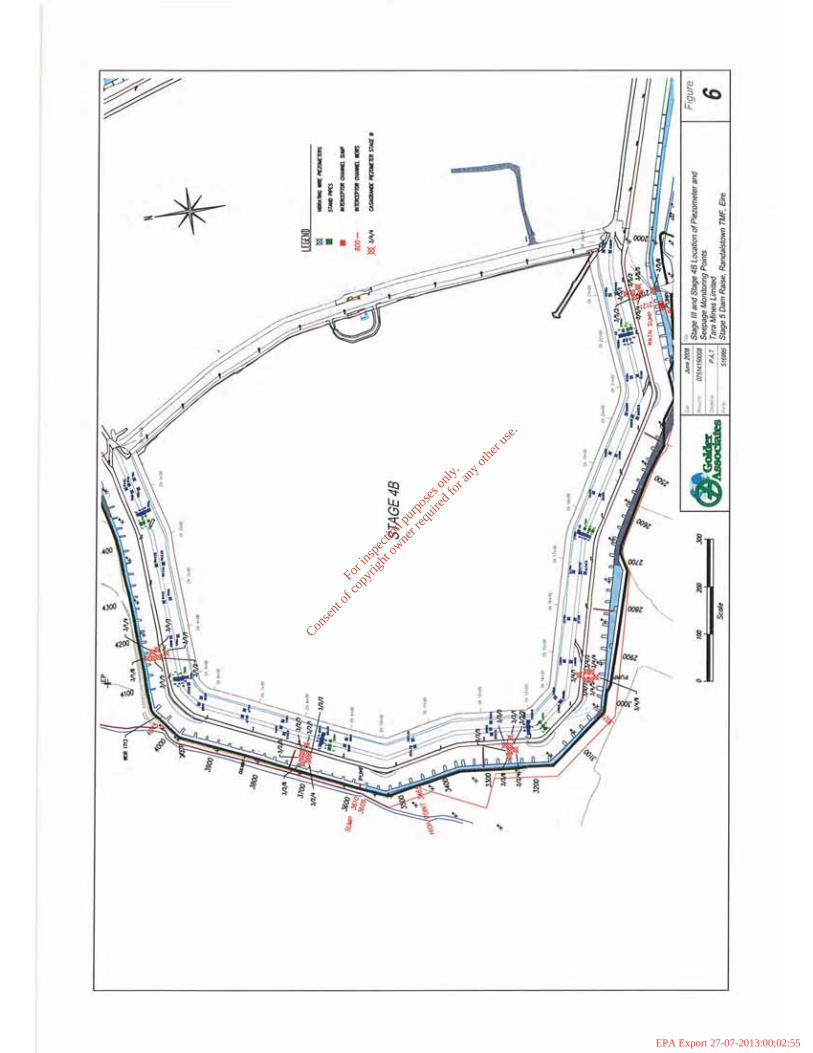
For
insp
ectio
n pur
pose
s only
.
Conse
nt of
copy
right
owne
r req
uired
for a
ny ot
her u
se.
EPA Export 27-07-2013:00:02:55
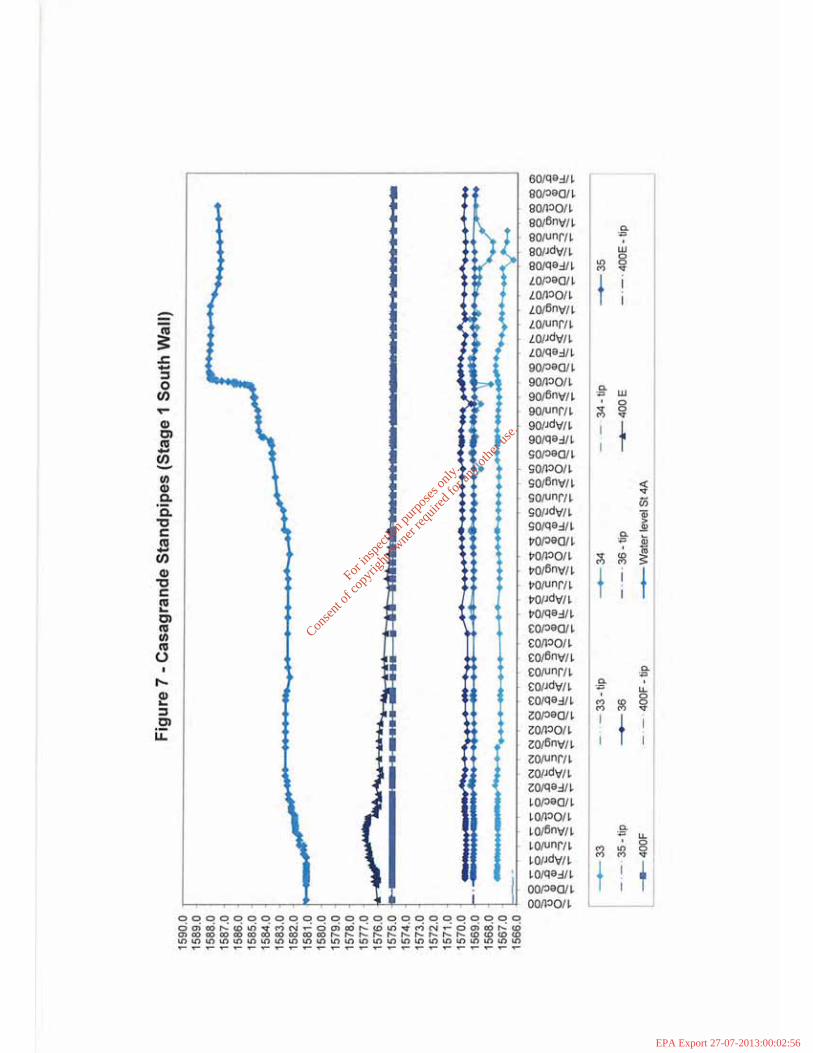
For
insp
ectio
n pur
pose
s only
.
Conse
nt of
copy
right
owne
r req
uired
for a
ny ot
her u
se.
EPA Export 27-07-2013:00:02:56
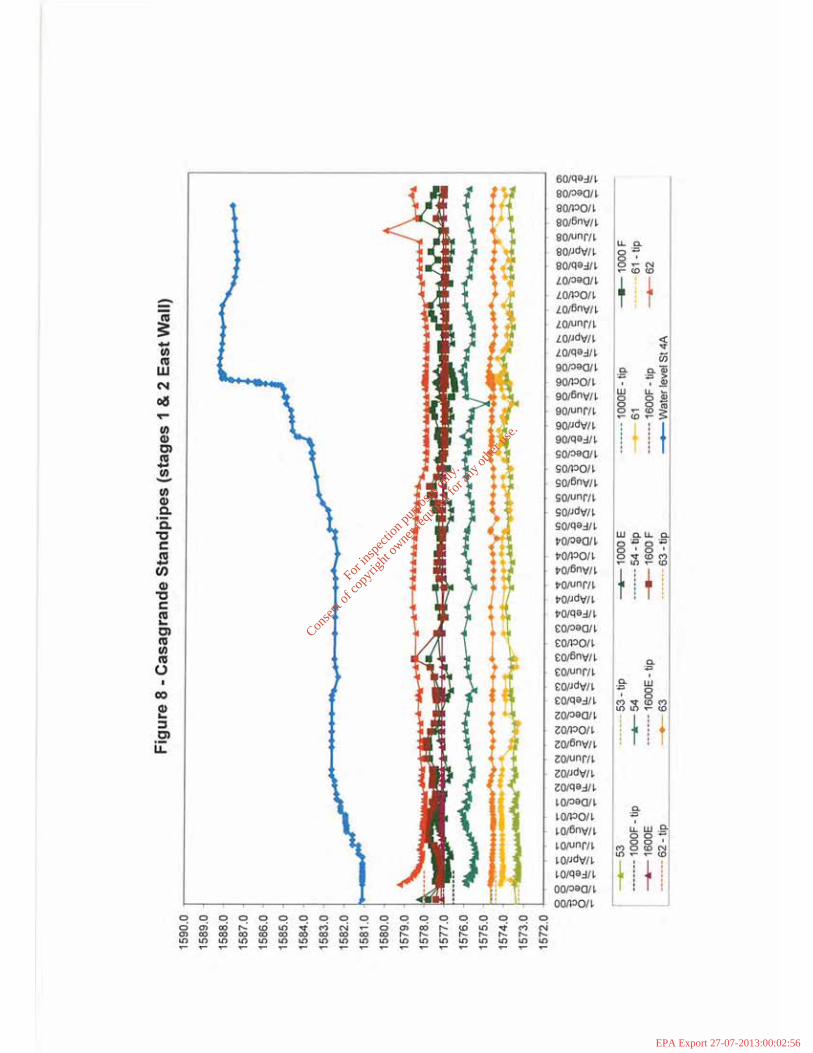
For
insp
ectio
n pur
pose
s only
.
Conse
nt of
copy
right
owne
r req
uired
for a
ny ot
her u
se.
EPA Export 27-07-2013:00:02:56
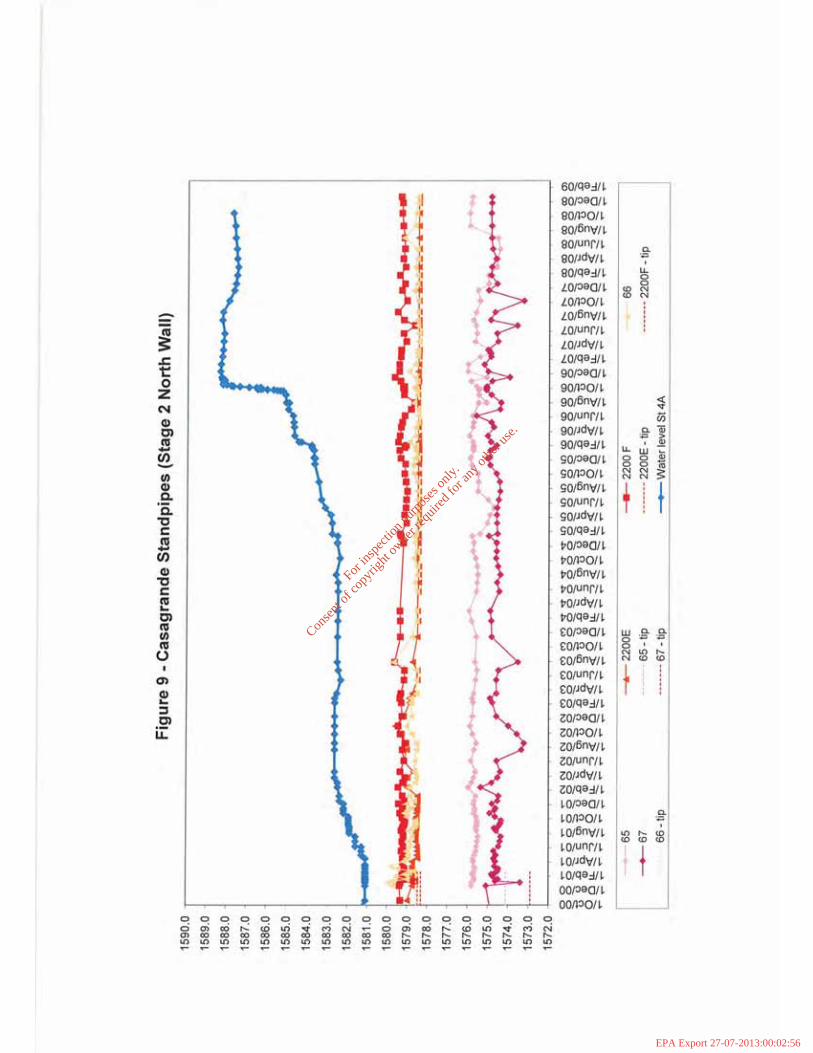
For
insp
ectio
n pur
pose
s only
.
Conse
nt of
copy
right
owne
r req
uired
for a
ny ot
her u
se.
EPA Export 27-07-2013:00:02:56
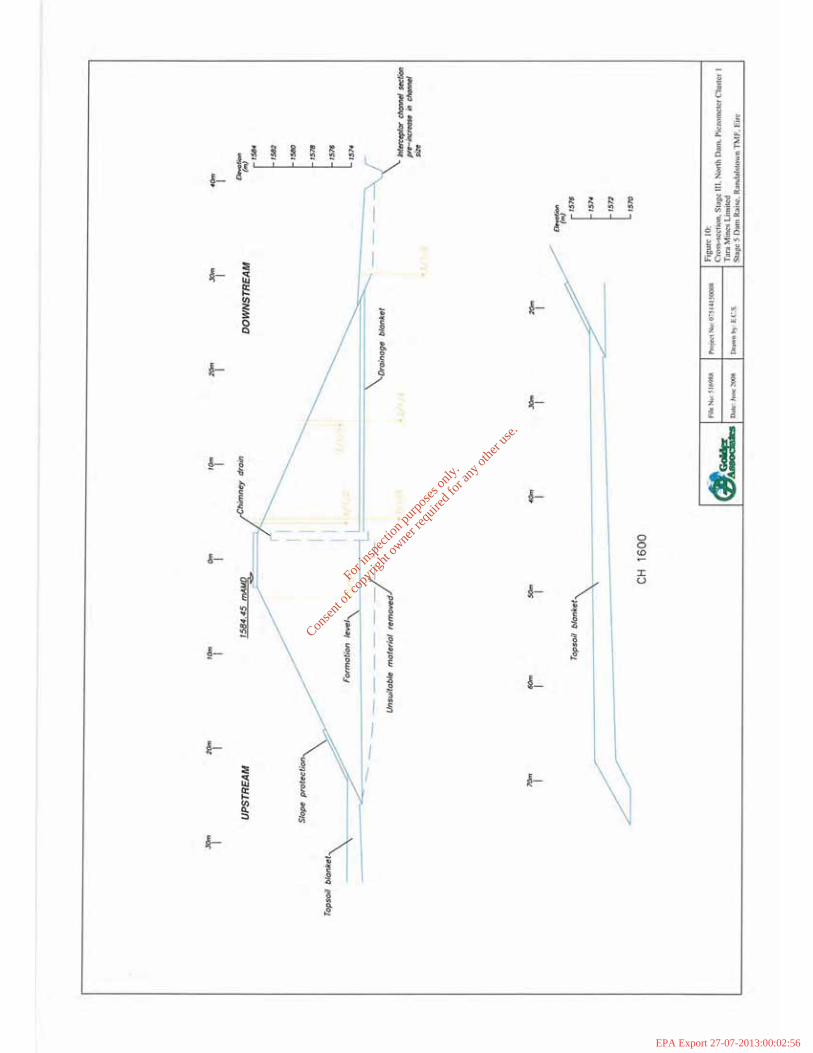
For
insp
ectio
n pur
pose
s only
.
Conse
nt of
copy
right
owne
r req
uired
for a
ny ot
her u
se.
EPA Export 27-07-2013:00:02:56
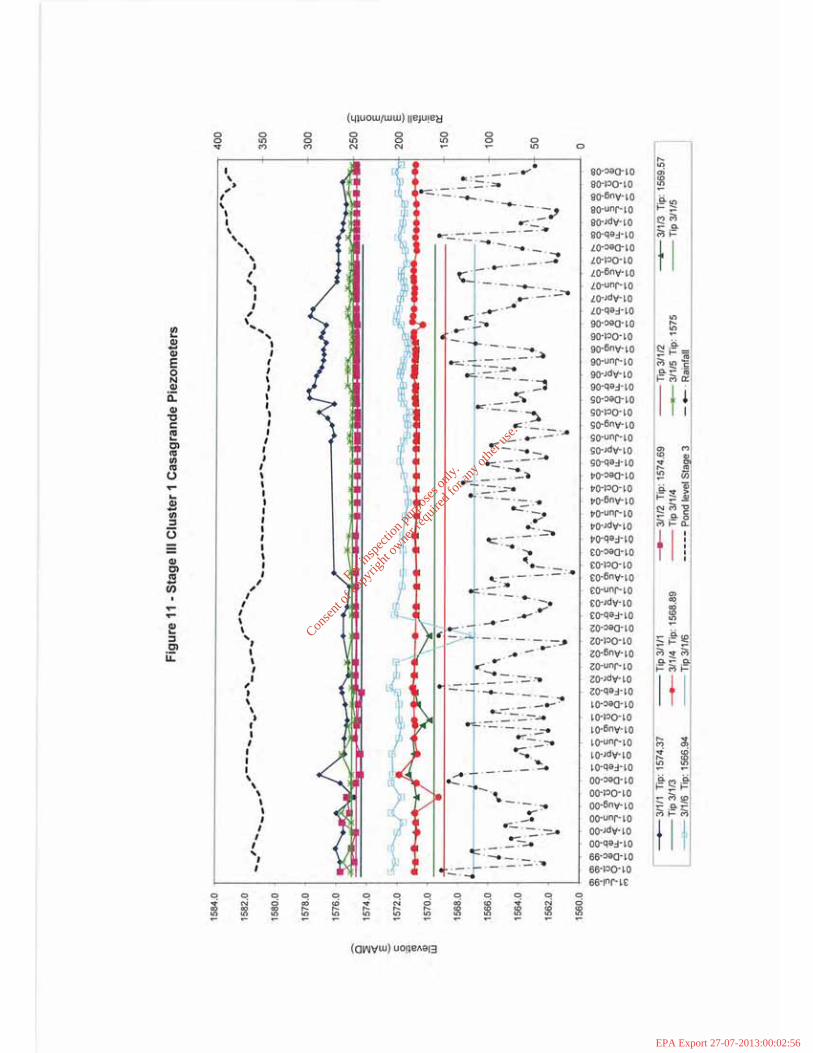
For
insp
ectio
n pur
pose
s only
.
Conse
nt of
copy
right
owne
r req
uired
for a
ny ot
her u
se.
EPA Export 27-07-2013:00:02:56

For
insp
ectio
n pur
pose
s only
.
Conse
nt of
copy
right
owne
r req
uired
for a
ny ot
her u
se.
EPA Export 27-07-2013:00:02:56

For
insp
ectio
n pur
pose
s only
.
Conse
nt of
copy
right
owne
r req
uired
for a
ny ot
her u
se.
EPA Export 27-07-2013:00:02:56

For
insp
ectio
n pur
pose
s only
.
Conse
nt of
copy
right
owne
r req
uired
for a
ny ot
her u
se.
EPA Export 27-07-2013:00:02:56

For
insp
ectio
n pur
pose
s only
.
Conse
nt of
copy
right
owne
r req
uired
for a
ny ot
her u
se.
EPA Export 27-07-2013:00:02:56

For
insp
ectio
n pur
pose
s only
.
Conse
nt of
copy
right
owne
r req
uired
for a
ny ot
her u
se.
EPA Export 27-07-2013:00:02:56

For
insp
ectio
n pur
pose
s only
.
Conse
nt of
copy
right
owne
r req
uired
for a
ny ot
her u
se.
EPA Export 27-07-2013:00:02:56

For
insp
ectio
n pur
pose
s only
.
Conse
nt of
copy
right
owne
r req
uired
for a
ny ot
her u
se.
EPA Export 27-07-2013:00:02:56

For
insp
ectio
n pur
pose
s only
.
Conse
nt of
copy
right
owne
r req
uired
for a
ny ot
her u
se.
EPA Export 27-07-2013:00:02:56
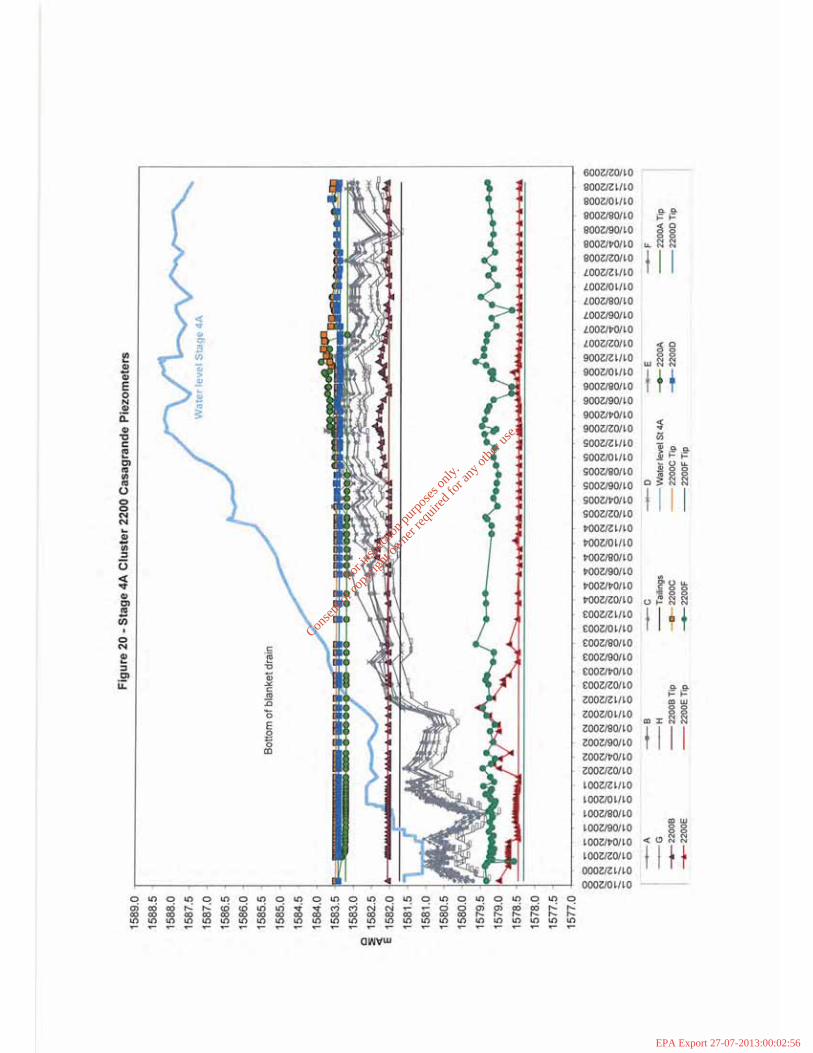
For
insp
ectio
n pur
pose
s only
.
Conse
nt of
copy
right
owne
r req
uired
for a
ny ot
her u
se.
EPA Export 27-07-2013:00:02:56

For
insp
ectio
n pur
pose
s only
.
Conse
nt of
copy
right
owne
r req
uired
for a
ny ot
her u
se.
EPA Export 27-07-2013:00:02:56
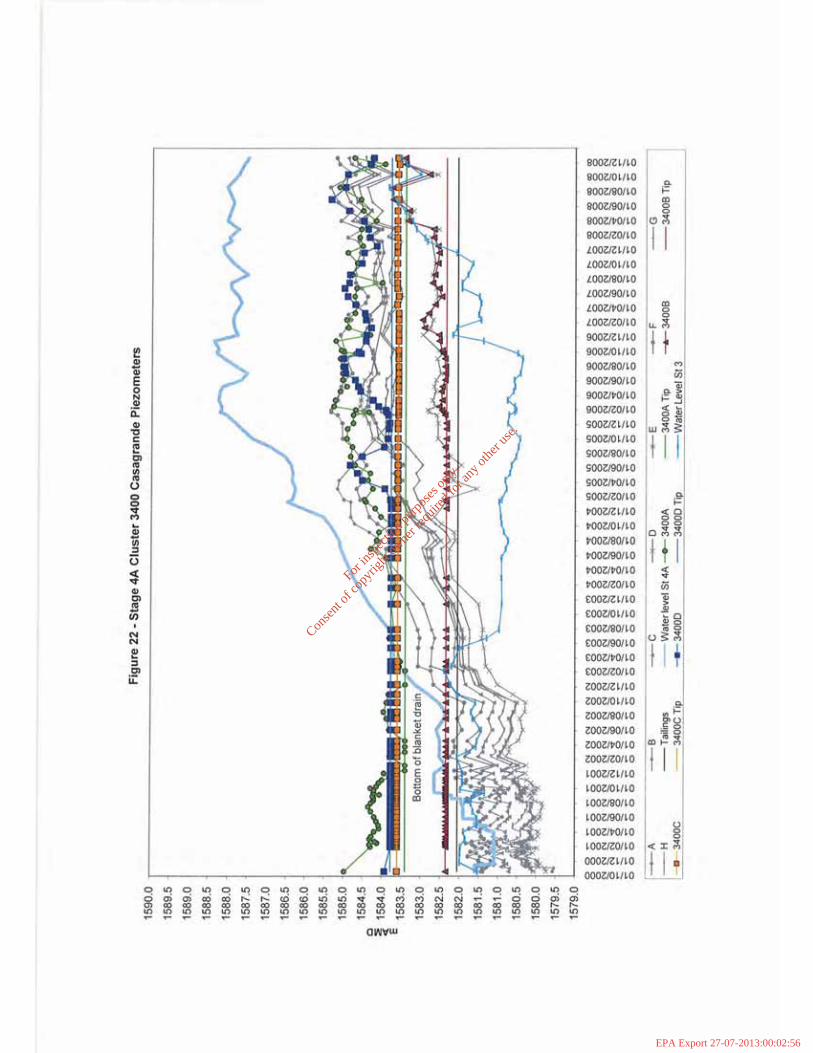
For
insp
ectio
n pur
pose
s only
.
Conse
nt of
copy
right
owne
r req
uired
for a
ny ot
her u
se.
EPA Export 27-07-2013:00:02:56

For
insp
ectio
n pur
pose
s only
.
Conse
nt of
copy
right
owne
r req
uired
for a
ny ot
her u
se.
EPA Export 27-07-2013:00:02:56
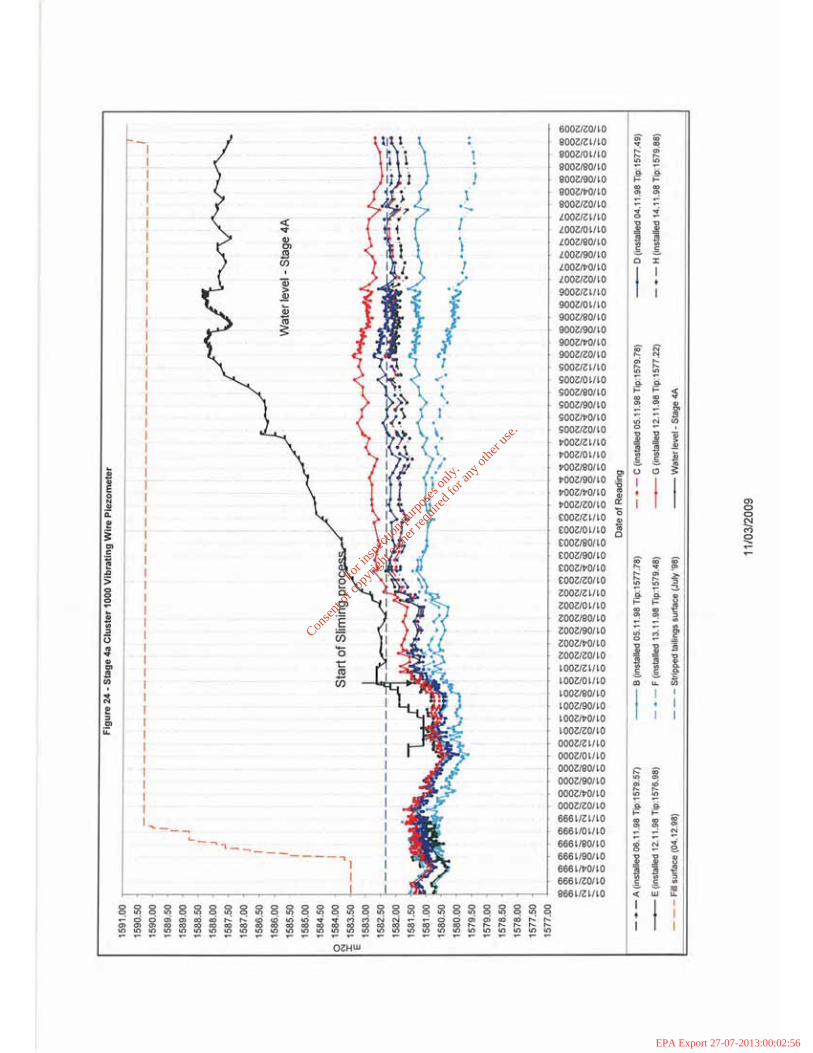
For
insp
ectio
n pur
pose
s only
.
Conse
nt of
copy
right
owne
r req
uired
for a
ny ot
her u
se.
EPA Export 27-07-2013:00:02:56

For
insp
ectio
n pur
pose
s only
.
Conse
nt of
copy
right
owne
r req
uired
for a
ny ot
her u
se.
EPA Export 27-07-2013:00:02:56

For
insp
ectio
n pur
pose
s only
.
Conse
nt of
copy
right
owne
r req
uired
for a
ny ot
her u
se.
EPA Export 27-07-2013:00:02:56

For
insp
ectio
n pur
pose
s only
.
Conse
nt of
copy
right
owne
r req
uired
for a
ny ot
her u
se.
EPA Export 27-07-2013:00:02:56

For
insp
ectio
n pur
pose
s only
.
Conse
nt of
copy
right
owne
r req
uired
for a
ny ot
her u
se.
EPA Export 27-07-2013:00:02:56
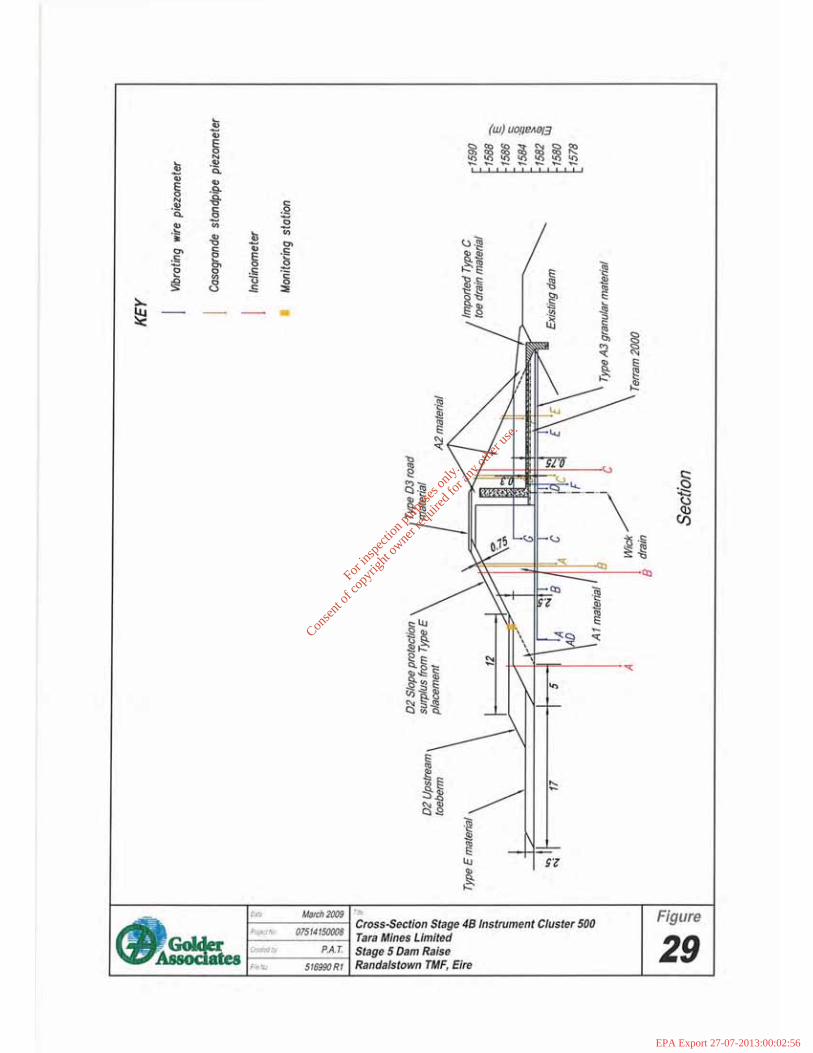
For
insp
ectio
n pur
pose
s only
.
Conse
nt of
copy
right
owne
r req
uired
for a
ny ot
her u
se.
EPA Export 27-07-2013:00:02:56

For
insp
ectio
n pur
pose
s only
.
Conse
nt of
copy
right
owne
r req
uired
for a
ny ot
her u
se.
EPA Export 27-07-2013:00:02:56
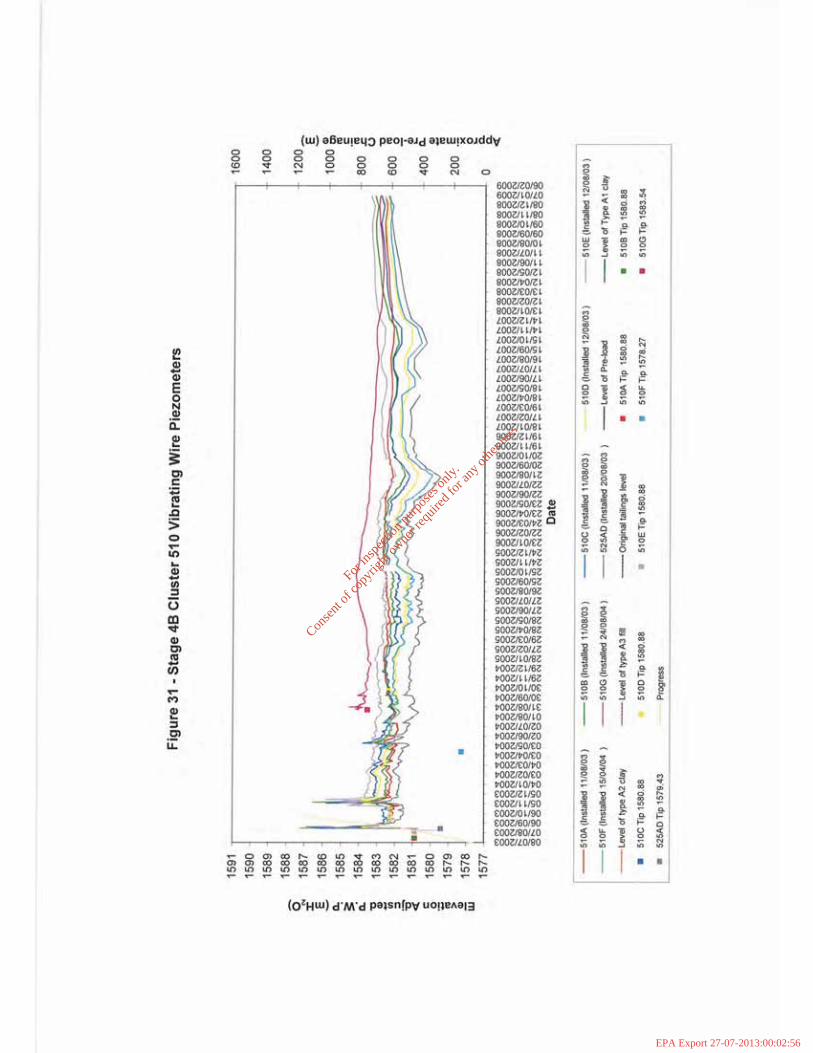
For
insp
ectio
n pur
pose
s only
.
Conse
nt of
copy
right
owne
r req
uired
for a
ny ot
her u
se.
EPA Export 27-07-2013:00:02:56

For
insp
ectio
n pur
pose
s only
.
Conse
nt of
copy
right
owne
r req
uired
for a
ny ot
her u
se.
EPA Export 27-07-2013:00:02:57

For
insp
ectio
n pur
pose
s only
.
Conse
nt of
copy
right
owne
r req
uired
for a
ny ot
her u
se.
EPA Export 27-07-2013:00:02:57

For
insp
ectio
n pur
pose
s only
.
Conse
nt of
copy
right
owne
r req
uired
for a
ny ot
her u
se.
EPA Export 27-07-2013:00:02:57
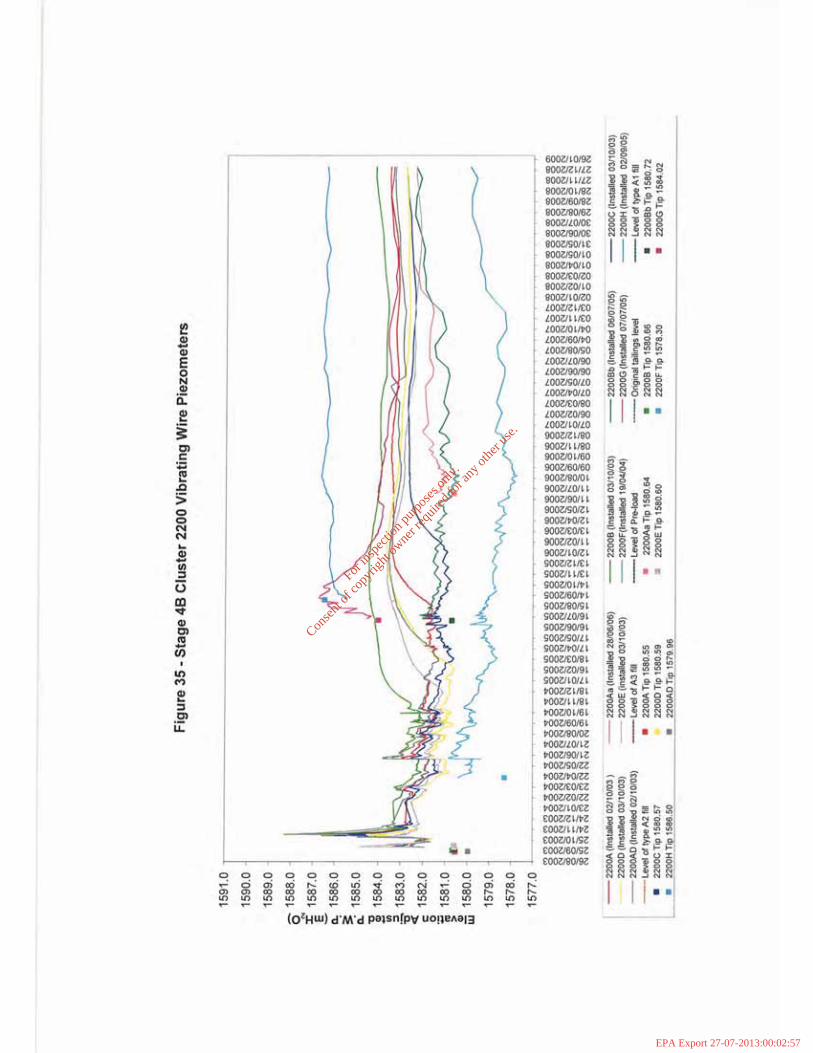
For
insp
ectio
n pur
pose
s only
.
Conse
nt of
copy
right
owne
r req
uired
for a
ny ot
her u
se.
EPA Export 27-07-2013:00:02:57

For
insp
ectio
n pur
pose
s only
.
Conse
nt of
copy
right
owne
r req
uired
for a
ny ot
her u
se.
EPA Export 27-07-2013:00:02:57

For
insp
ectio
n pur
pose
s only
.
Conse
nt of
copy
right
owne
r req
uired
for a
ny ot
her u
se.
EPA Export 27-07-2013:00:02:57
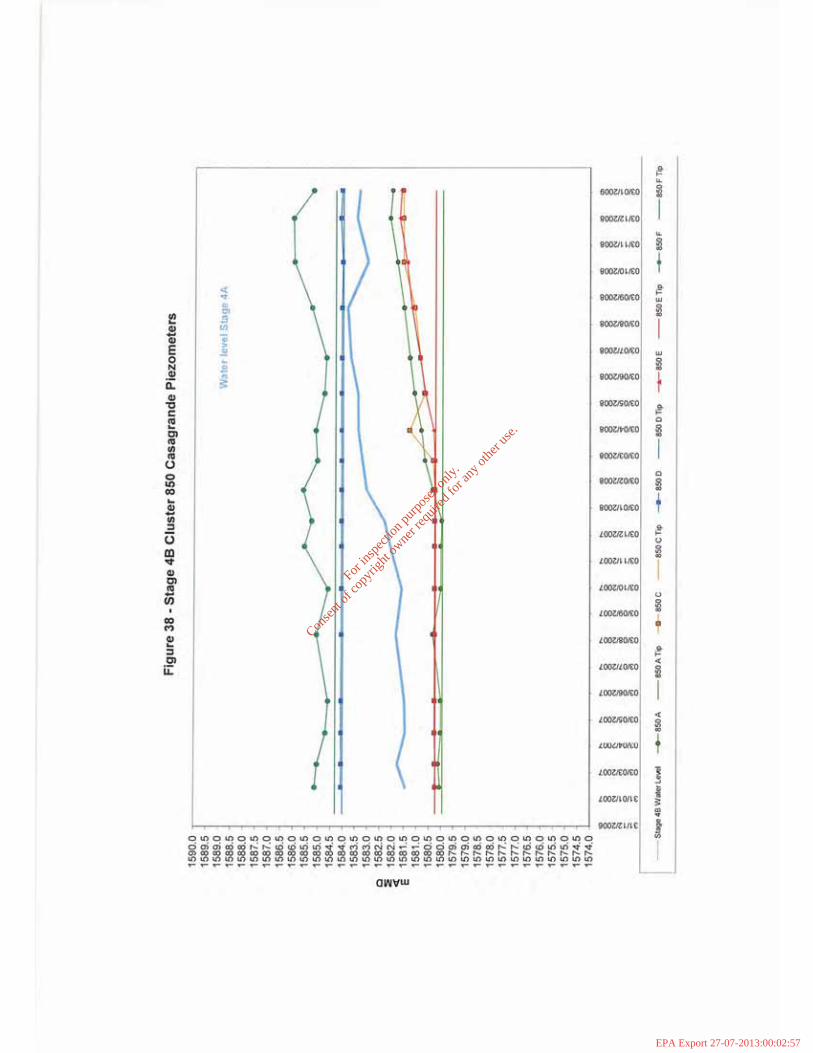
For
insp
ectio
n pur
pose
s only
.
Conse
nt of
copy
right
owne
r req
uired
for a
ny ot
her u
se.
EPA Export 27-07-2013:00:02:57

For
insp
ectio
n pur
pose
s only
.
Conse
nt of
copy
right
owne
r req
uired
for a
ny ot
her u
se.
EPA Export 27-07-2013:00:02:57

For
insp
ectio
n pur
pose
s only
.
Conse
nt of
copy
right
owne
r req
uired
for a
ny ot
her u
se.
EPA Export 27-07-2013:00:02:57
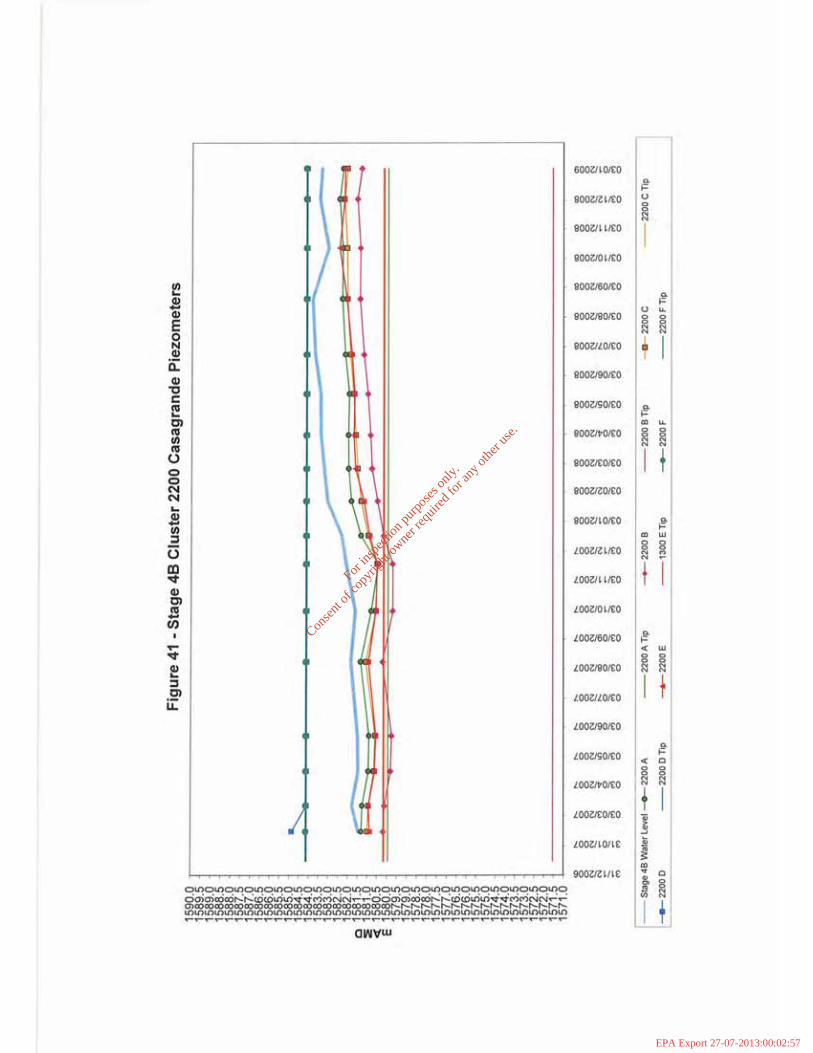
For
insp
ectio
n pur
pose
s only
.
Conse
nt of
copy
right
owne
r req
uired
for a
ny ot
her u
se.
EPA Export 27-07-2013:00:02:57

For
insp
ectio
n pur
pose
s only
.
Conse
nt of
copy
right
owne
r req
uired
for a
ny ot
her u
se.
EPA Export 27-07-2013:00:02:57
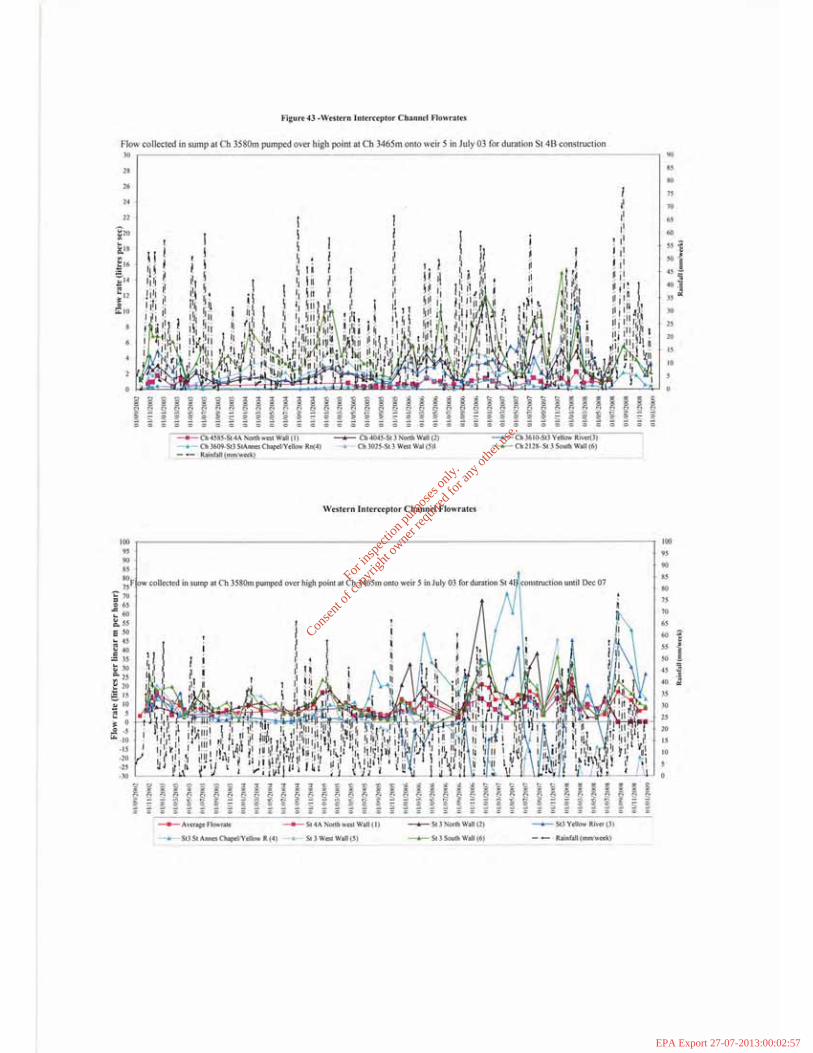
For
insp
ectio
n pur
pose
s only
.
Conse
nt of
copy
right
owne
r req
uired
for a
ny ot
her u
se.
EPA Export 27-07-2013:00:02:57
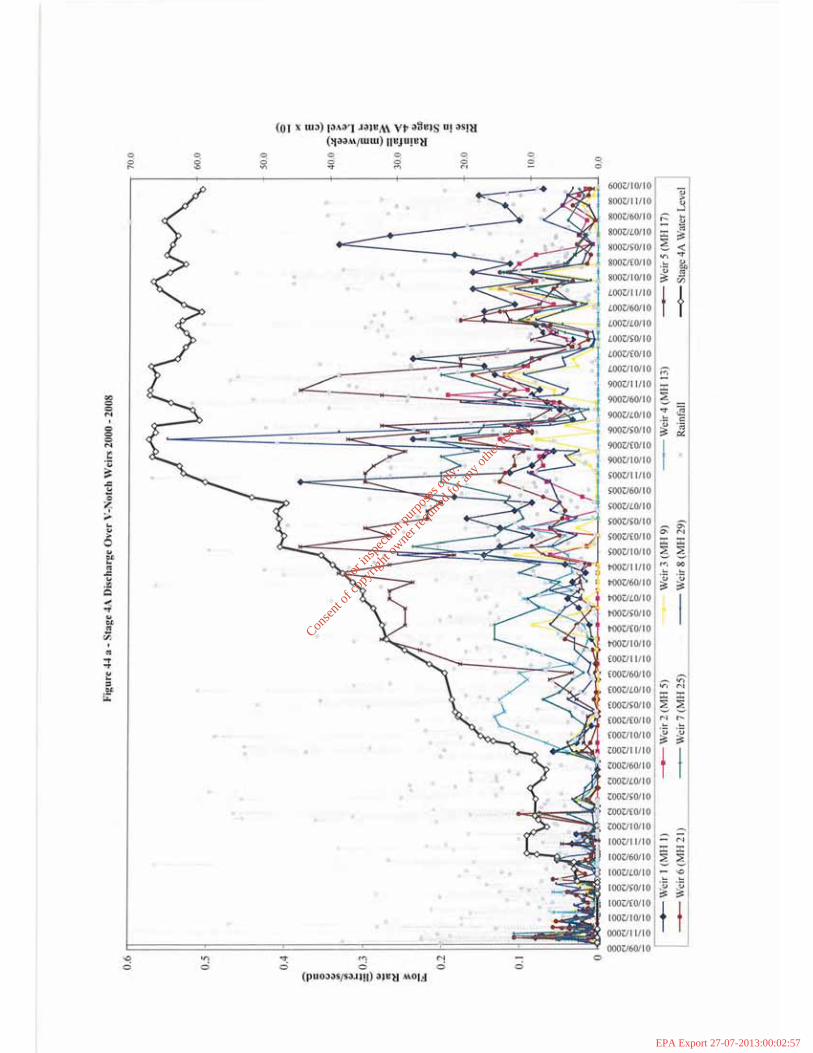
For
insp
ectio
n pur
pose
s only
.
Conse
nt of
copy
right
owne
r req
uired
for a
ny ot
her u
se.
EPA Export 27-07-2013:00:02:57

For
insp
ectio
n pur
pose
s only
.
Conse
nt of
copy
right
owne
r req
uired
for a
ny ot
her u
se.
EPA Export 27-07-2013:00:02:57

For
insp
ectio
n pur
pose
s only
.
Conse
nt of
copy
right
owne
r req
uired
for a
ny ot
her u
se.
EPA Export 27-07-2013:00:02:57

For
insp
ectio
n pur
pose
s only
.
Conse
nt of
copy
right
owne
r req
uired
for a
ny ot
her u
se.
EPA Export 27-07-2013:00:02:57

For
insp
ectio
n pur
pose
s only
.
Conse
nt of
copy
right
owne
r req
uired
for a
ny ot
her u
se.
EPA Export 27-07-2013:00:02:57
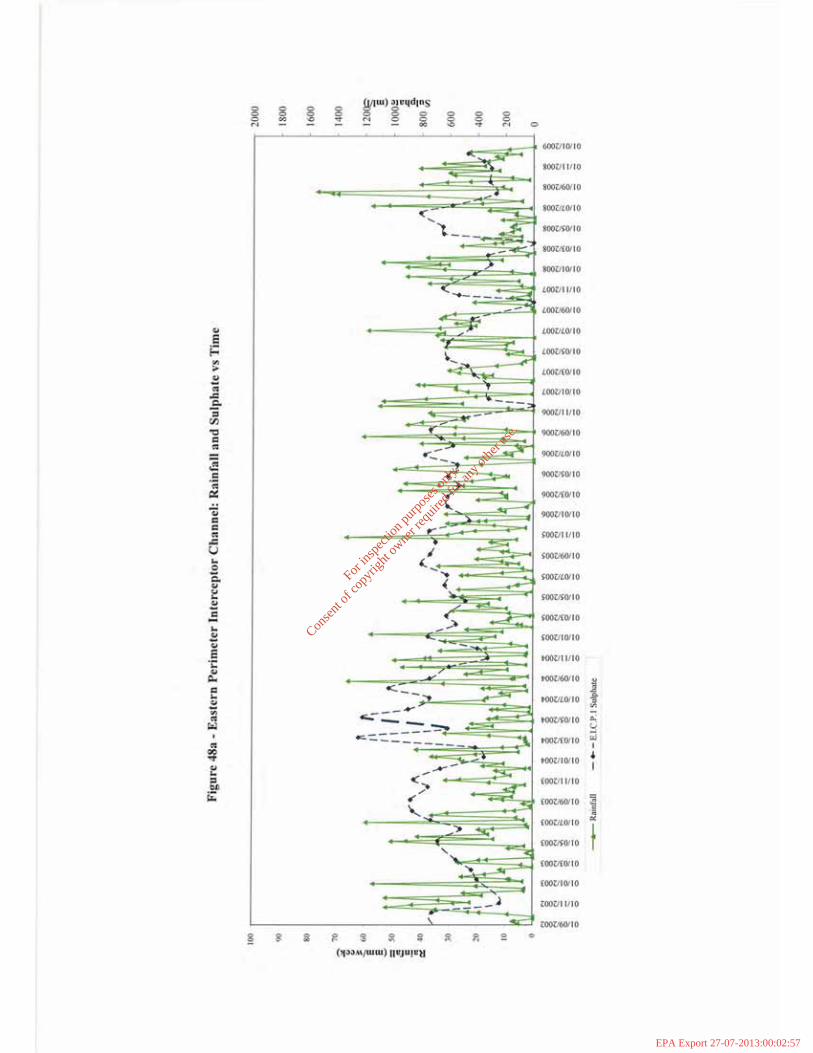
For
insp
ectio
n pur
pose
s only
.
Conse
nt of
copy
right
owne
r req
uired
for a
ny ot
her u
se.
EPA Export 27-07-2013:00:02:57
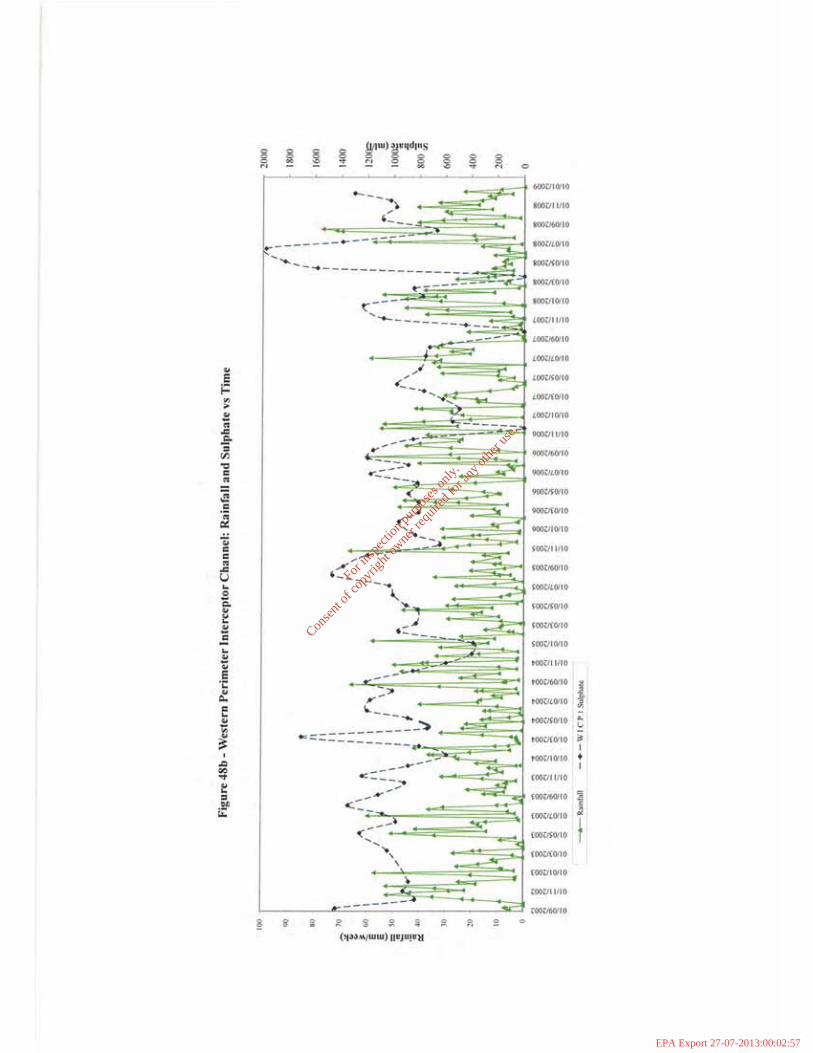
For
insp
ectio
n pur
pose
s only
.
Conse
nt of
copy
right
owne
r req
uired
for a
ny ot
her u
se.
EPA Export 27-07-2013:00:02:57

For
insp
ectio
n pur
pose
s only
.
Conse
nt of
copy
right
owne
r req
uired
for a
ny ot
her u
se.
EPA Export 27-07-2013:00:02:57
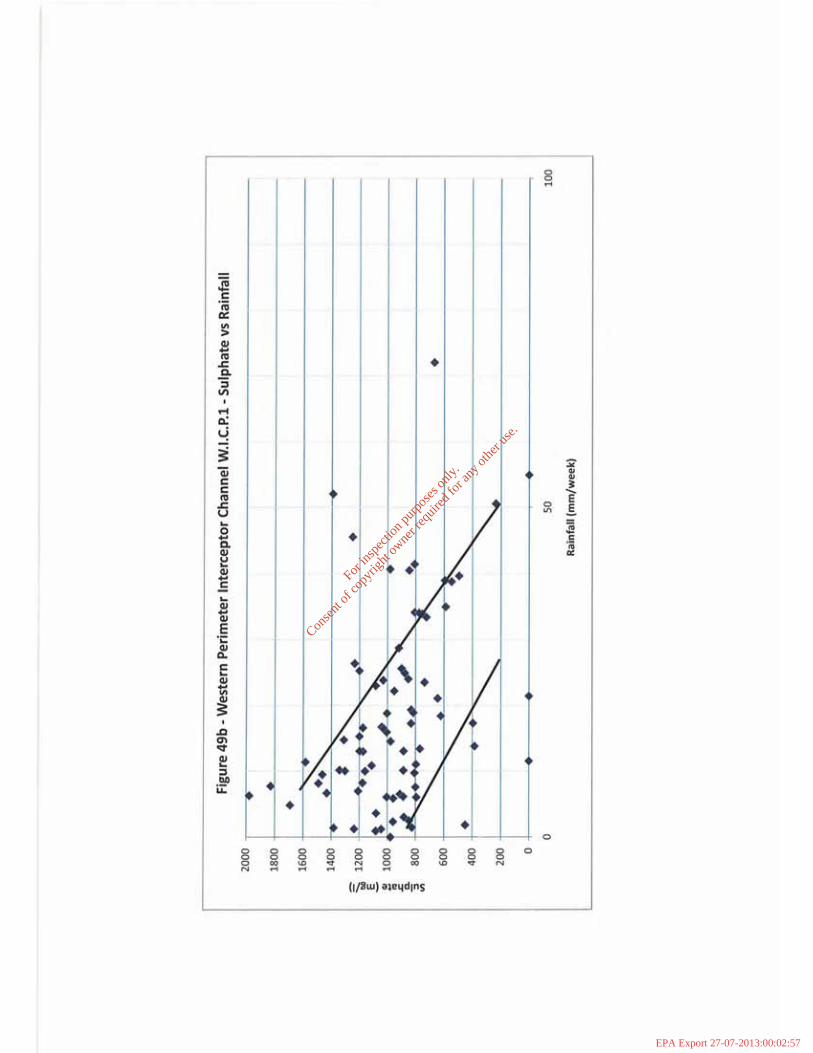
For
insp
ectio
n pur
pose
s only
.
Conse
nt of
copy
right
owne
r req
uired
for a
ny ot
her u
se.
EPA Export 27-07-2013:00:02:57
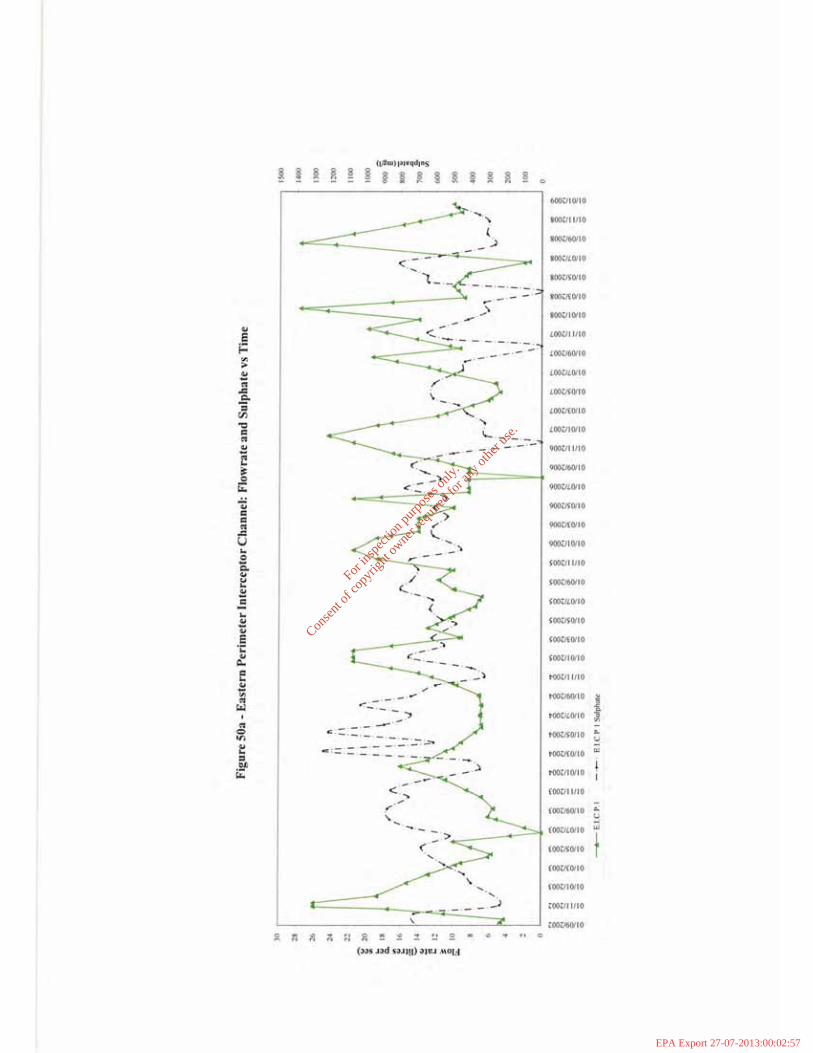
For
insp
ectio
n pur
pose
s only
.
Conse
nt of
copy
right
owne
r req
uired
for a
ny ot
her u
se.
EPA Export 27-07-2013:00:02:57
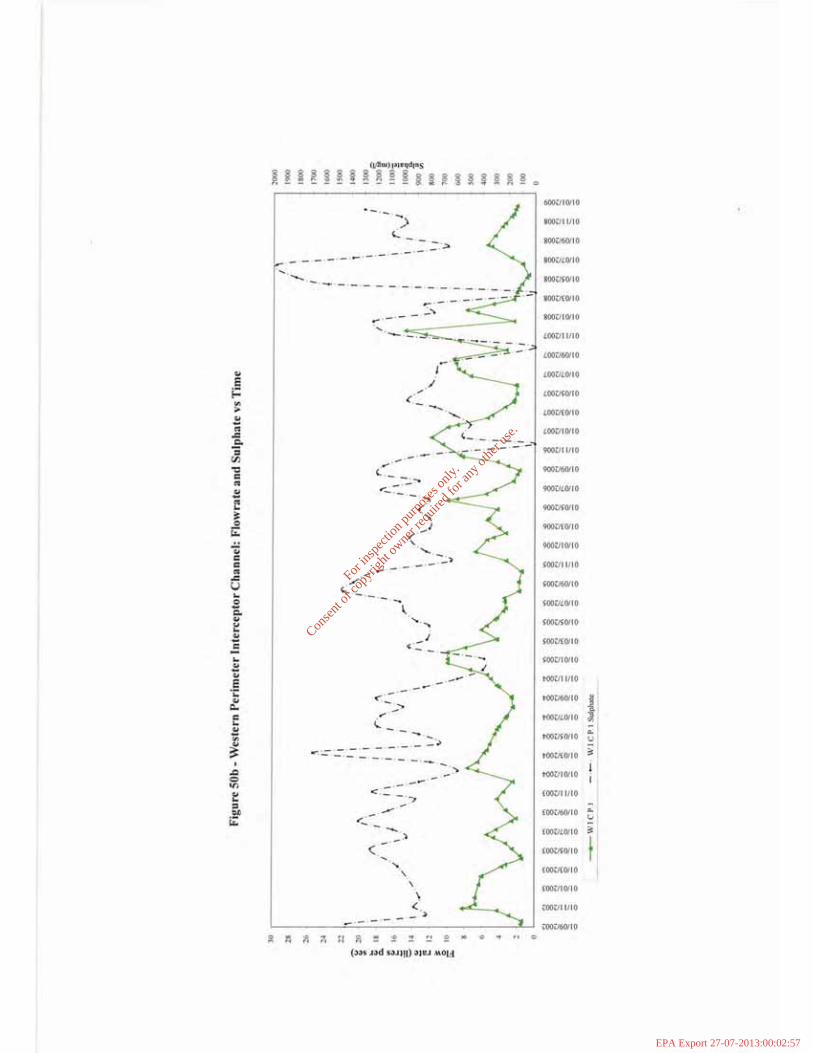
For
insp
ectio
n pur
pose
s only
.
Conse
nt of
copy
right
owne
r req
uired
for a
ny ot
her u
se.
EPA Export 27-07-2013:00:02:57

For
insp
ectio
n pur
pose
s only
.
Conse
nt of
copy
right
owne
r req
uired
for a
ny ot
her u
se.
EPA Export 27-07-2013:00:02:57

For
insp
ectio
n pur
pose
s only
.
Conse
nt of
copy
right
owne
r req
uired
for a
ny ot
her u
se.
EPA Export 27-07-2013:00:02:58

For
insp
ectio
n pur
pose
s only
.
Conse
nt of
copy
right
owne
r req
uired
for a
ny ot
her u
se.
EPA Export 27-07-2013:00:02:58

For
insp
ectio
n pur
pose
s only
.
Conse
nt of
copy
right
owne
r req
uired
for a
ny ot
her u
se.
EPA Export 27-07-2013:00:02:58
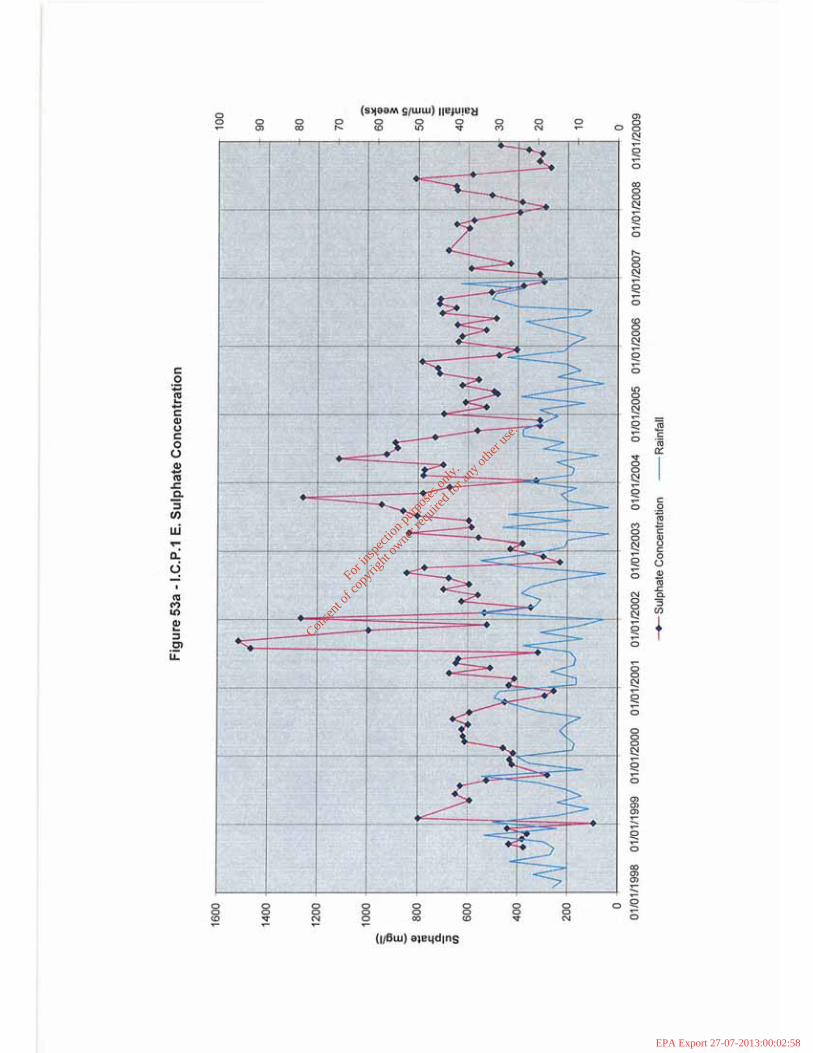
For
insp
ectio
n pur
pose
s only
.
Conse
nt of
copy
right
owne
r req
uired
for a
ny ot
her u
se.
EPA Export 27-07-2013:00:02:58
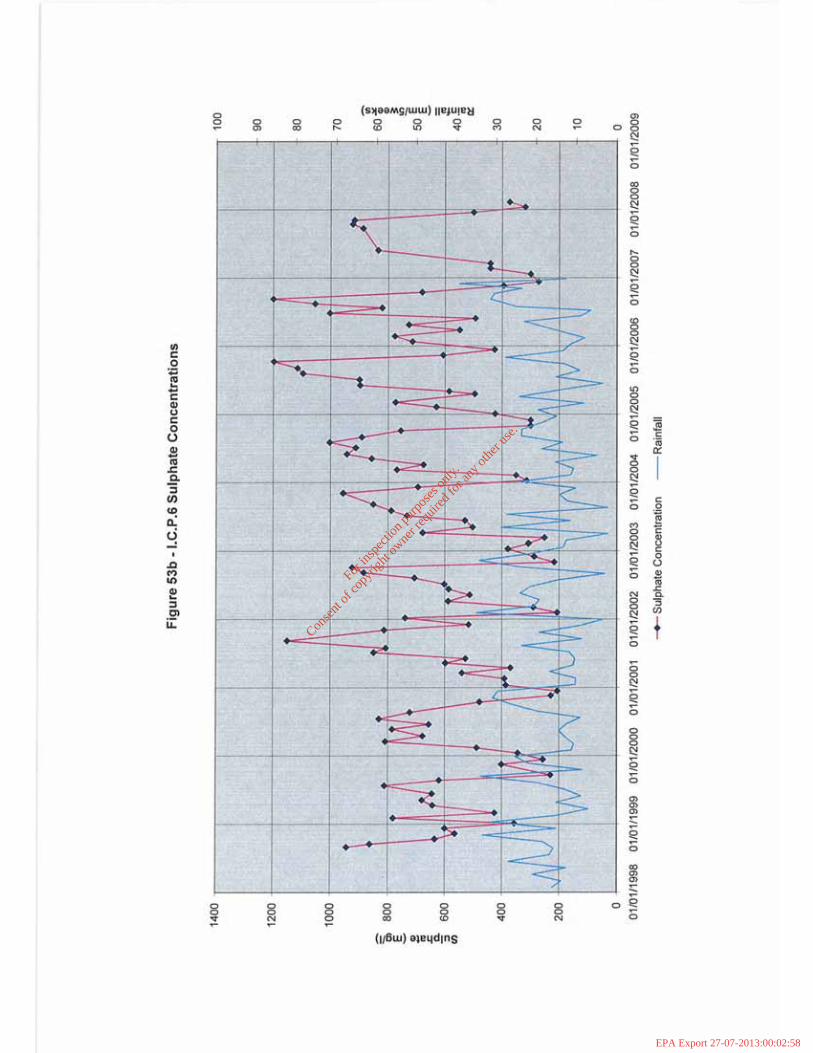
For
insp
ectio
n pur
pose
s only
.
Conse
nt of
copy
right
owne
r req
uired
for a
ny ot
her u
se.
EPA Export 27-07-2013:00:02:58

For
insp
ectio
n pur
pose
s only
.
Conse
nt of
copy
right
owne
r req
uired
for a
ny ot
her u
se.
EPA Export 27-07-2013:00:02:58

For
insp
ectio
n pur
pose
s only
.
Conse
nt of
copy
right
owne
r req
uired
for a
ny ot
her u
se.
EPA Export 27-07-2013:00:02:58
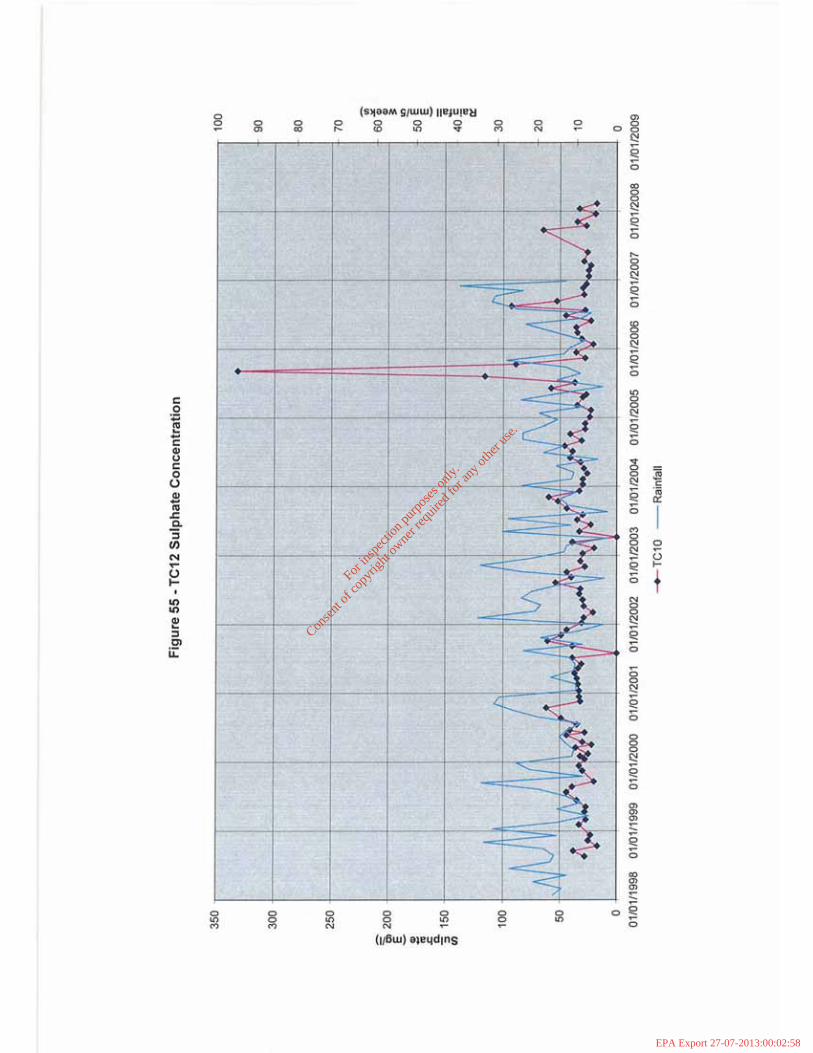
For
insp
ectio
n pur
pose
s only
.
Conse
nt of
copy
right
owne
r req
uired
for a
ny ot
her u
se.
EPA Export 27-07-2013:00:02:58
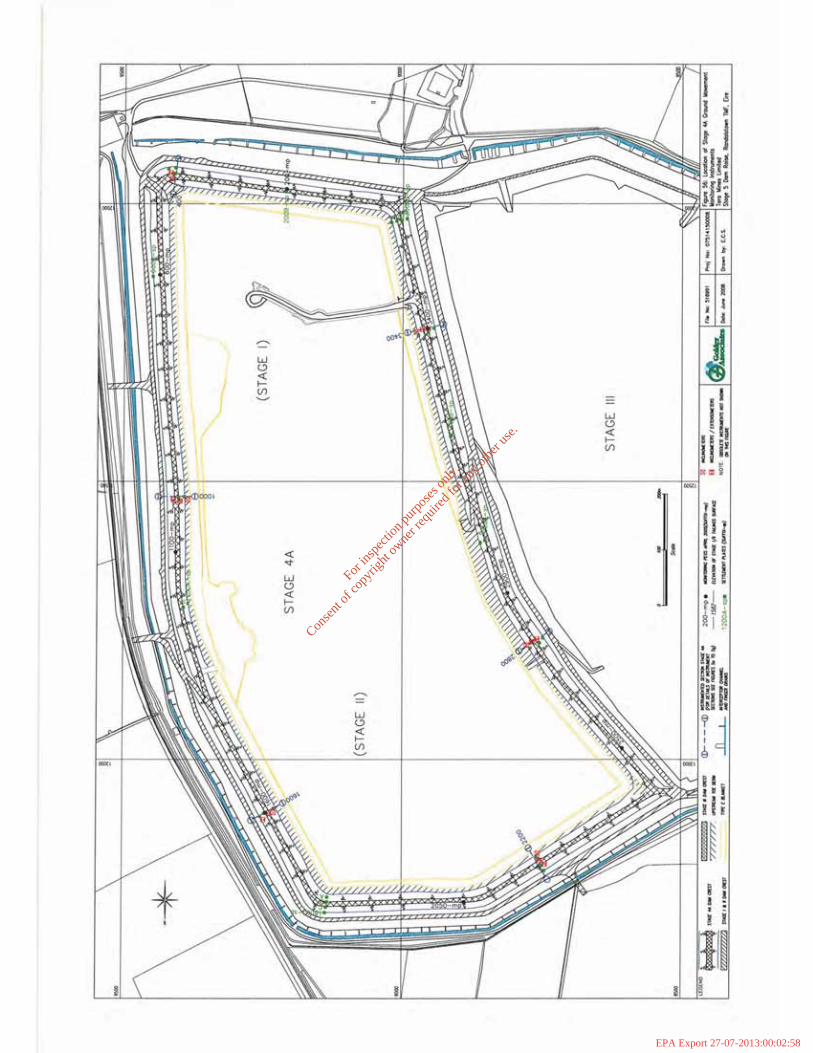
For
insp
ectio
n pur
pose
s only
.
Conse
nt of
copy
right
owne
r req
uired
for a
ny ot
her u
se.
EPA Export 27-07-2013:00:02:58

For
insp
ectio
n pur
pose
s only
.
Conse
nt of
copy
right
owne
r req
uired
for a
ny ot
her u
se.
EPA Export 27-07-2013:00:02:58

For
insp
ectio
n pur
pose
s only
.
Conse
nt of
copy
right
owne
r req
uired
for a
ny ot
her u
se.
EPA Export 27-07-2013:00:02:58
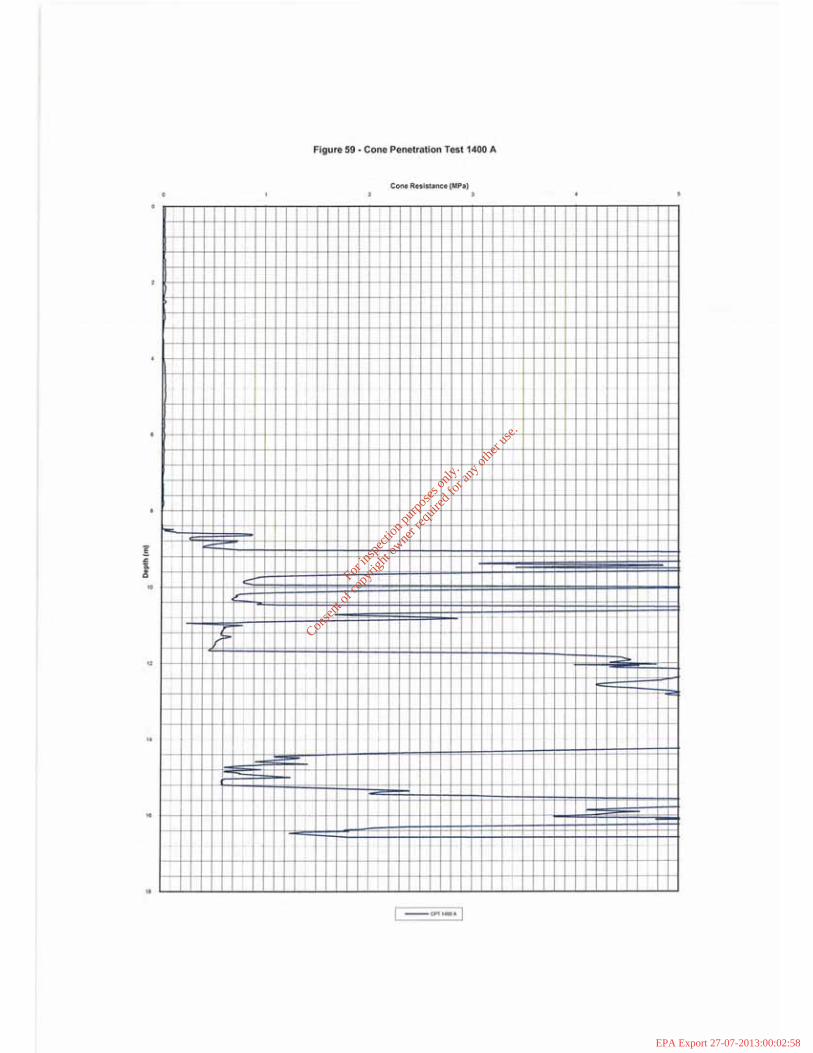
For
insp
ectio
n pur
pose
s only
.
Conse
nt of
copy
right
owne
r req
uired
for a
ny ot
her u
se.
EPA Export 27-07-2013:00:02:58
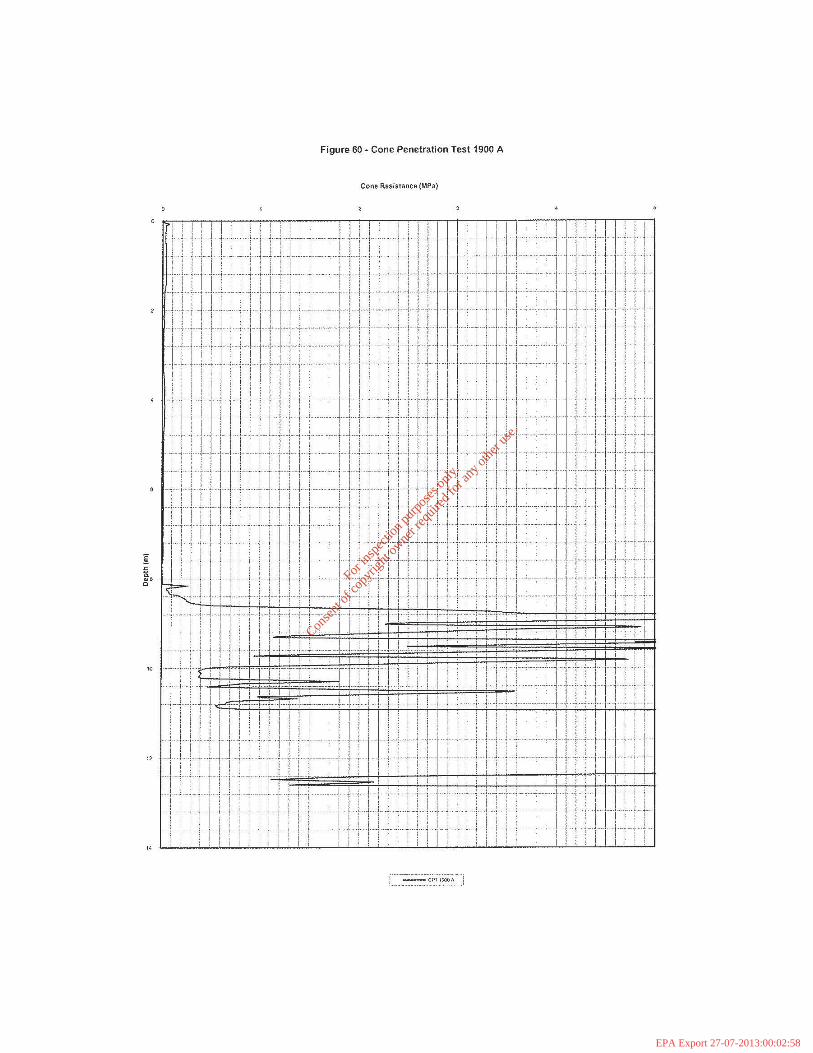
For
insp
ectio
n pur
pose
s only
.
Conse
nt of
copy
right
owne
r req
uired
for a
ny ot
her u
se.
EPA Export 27-07-2013:00:02:58
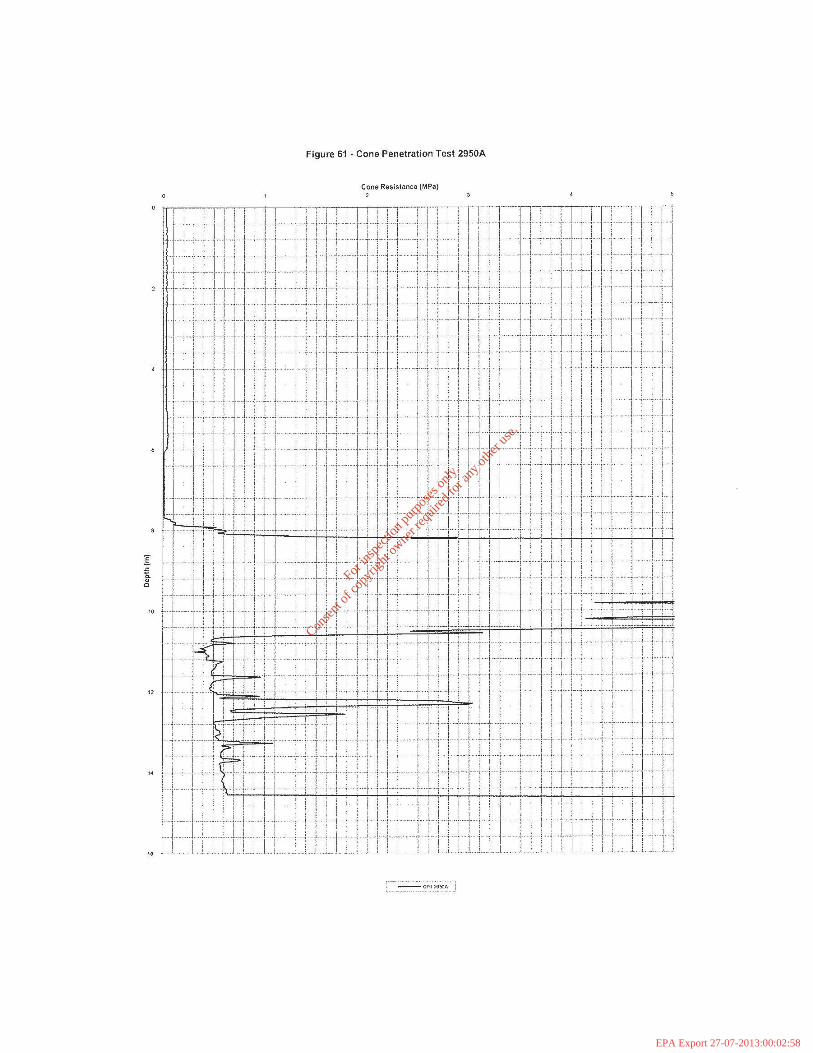
For
insp
ectio
n pur
pose
s only
.
Conse
nt of
copy
right
owne
r req
uired
for a
ny ot
her u
se.
EPA Export 27-07-2013:00:02:58

For
insp
ectio
n pur
pose
s only
.
Conse
nt of
copy
right
owne
r req
uired
for a
ny ot
her u
se.
EPA Export 27-07-2013:00:02:58
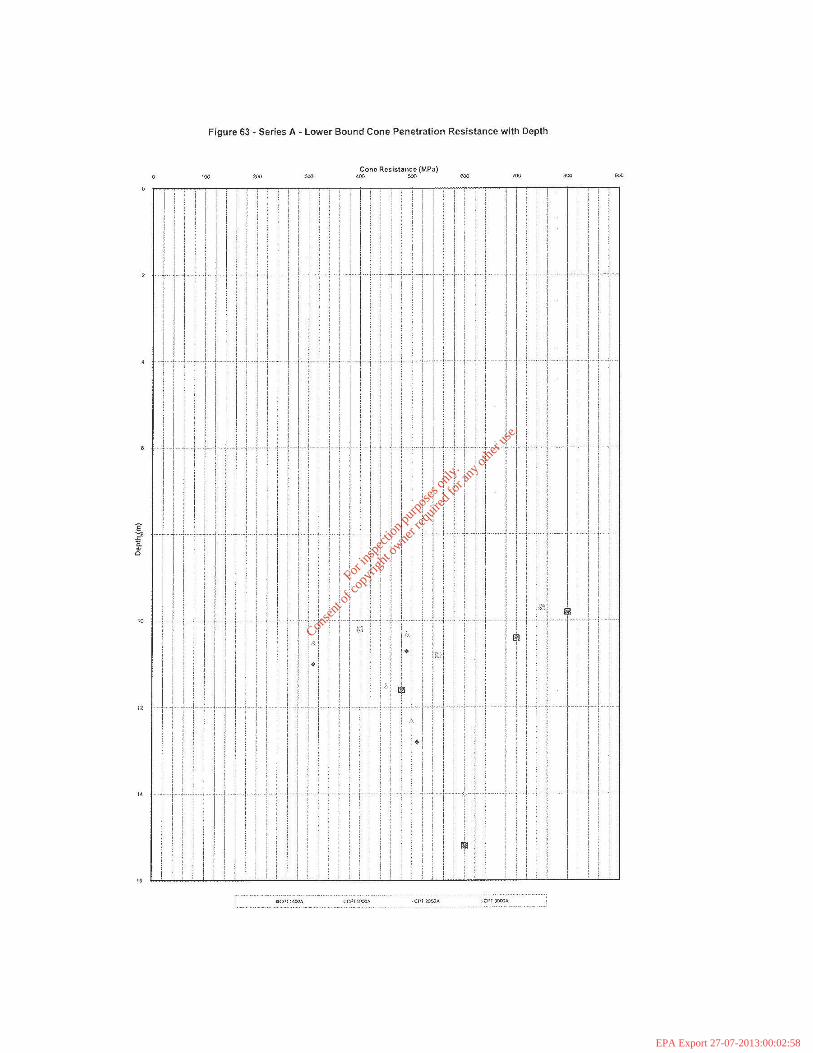
For
insp
ectio
n pur
pose
s only
.
Conse
nt of
copy
right
owne
r req
uired
for a
ny ot
her u
se.
EPA Export 27-07-2013:00:02:58

For
insp
ectio
n pur
pose
s only
.
Conse
nt of
copy
right
owne
r req
uired
for a
ny ot
her u
se.
EPA Export 27-07-2013:00:02:58
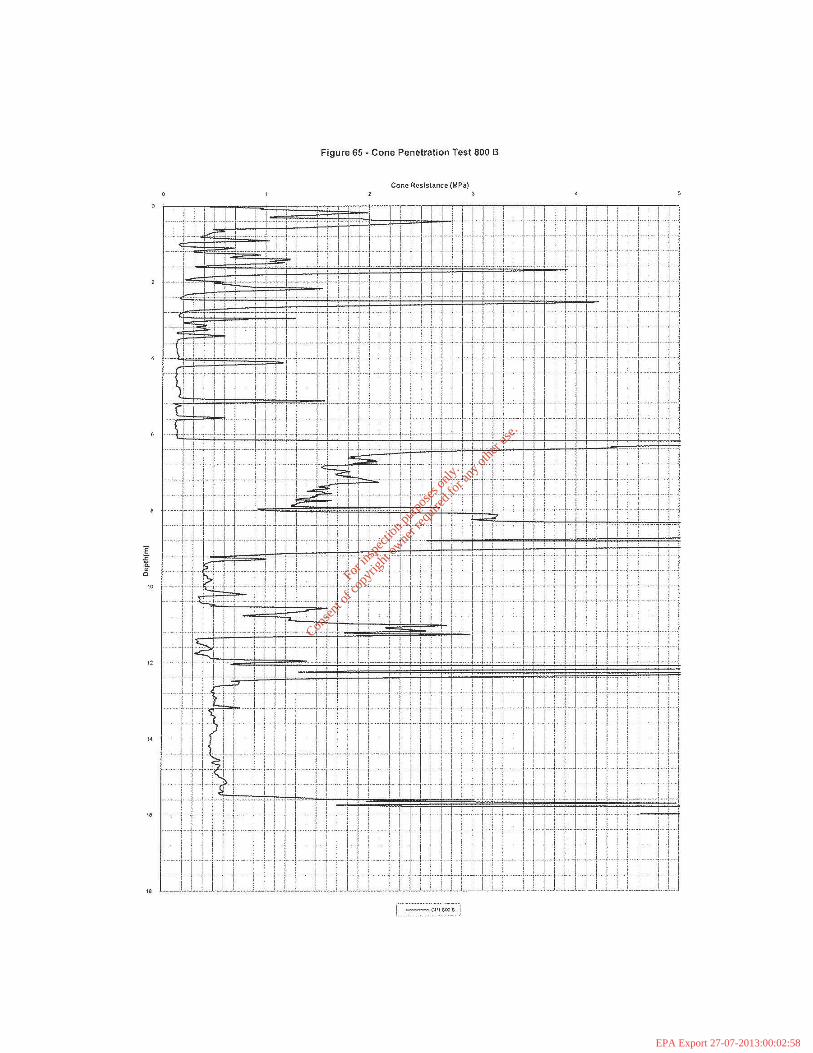
For
insp
ectio
n pur
pose
s only
.
Conse
nt of
copy
right
owne
r req
uired
for a
ny ot
her u
se.
EPA Export 27-07-2013:00:02:58
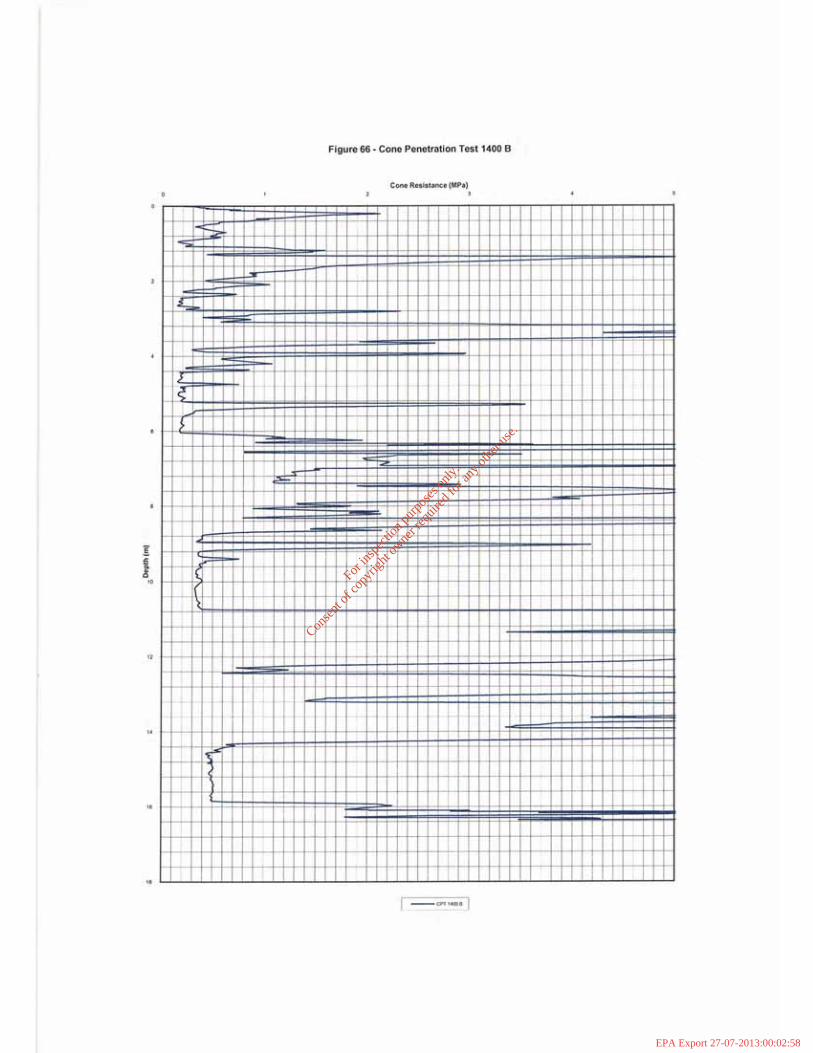
For
insp
ectio
n pur
pose
s only
.
Conse
nt of
copy
right
owne
r req
uired
for a
ny ot
her u
se.
EPA Export 27-07-2013:00:02:58
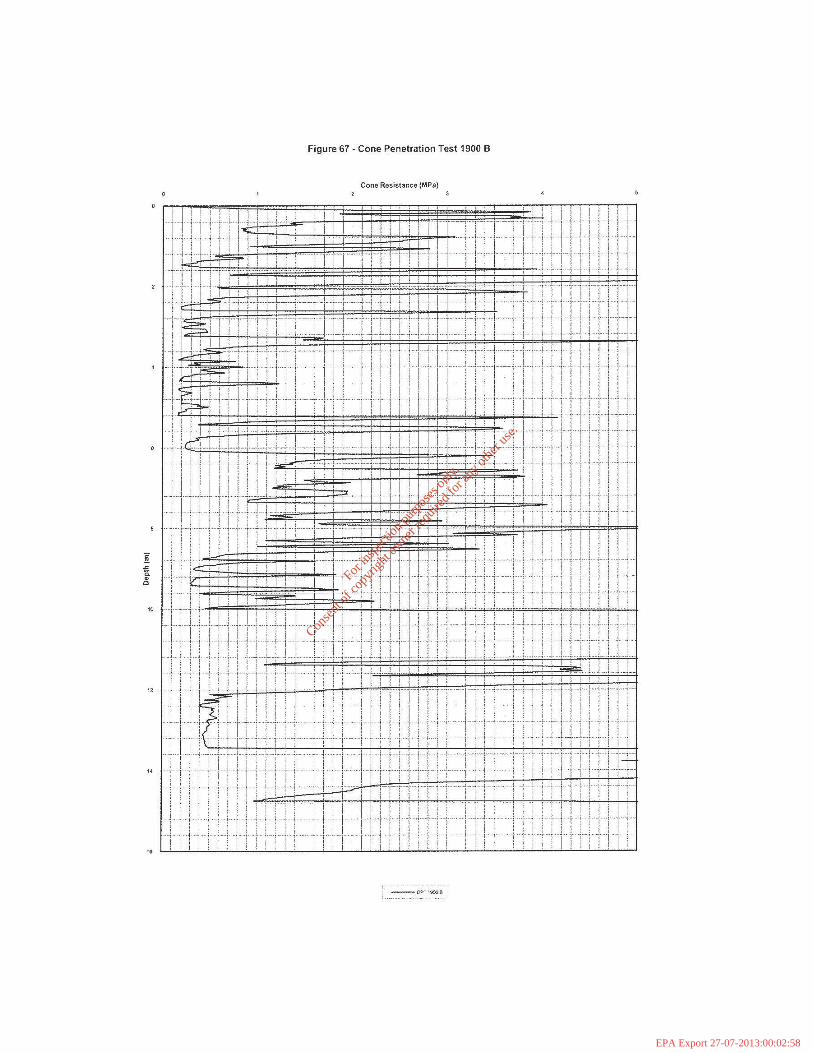
For
insp
ectio
n pur
pose
s only
.
Conse
nt of
copy
right
owne
r req
uired
for a
ny ot
her u
se.
EPA Export 27-07-2013:00:02:58
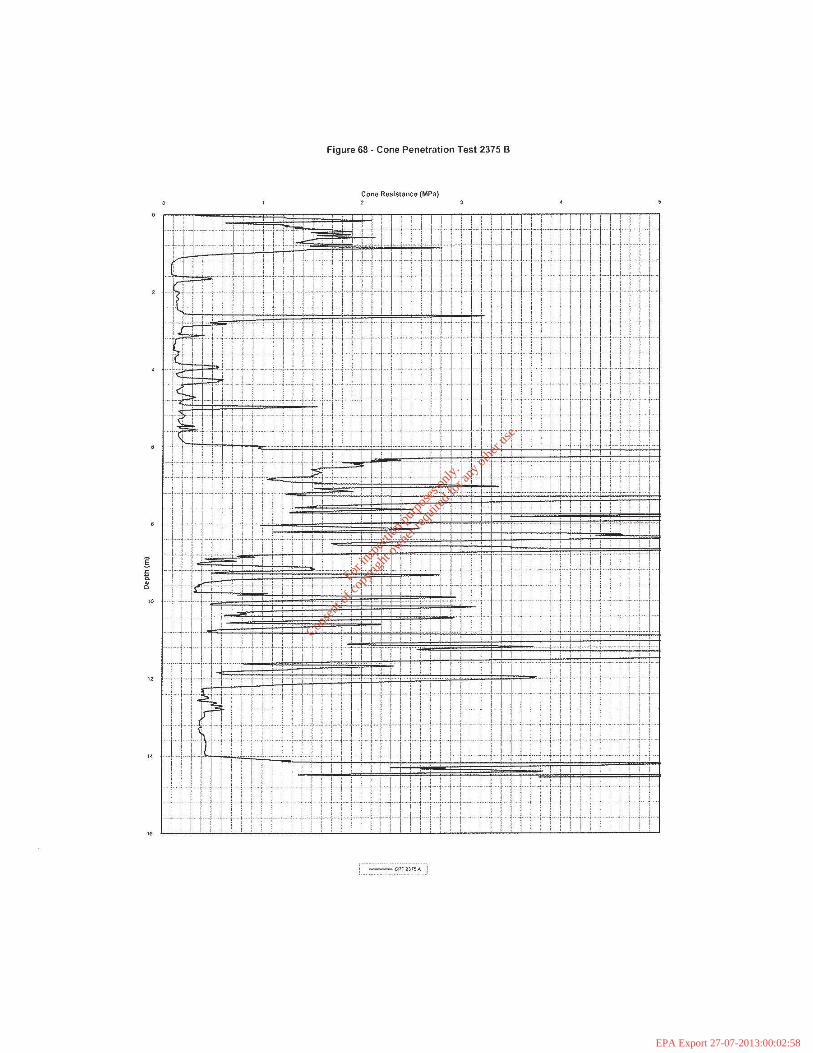
For
insp
ectio
n pur
pose
s only
.
Conse
nt of
copy
right
owne
r req
uired
for a
ny ot
her u
se.
EPA Export 27-07-2013:00:02:58

For
insp
ectio
n pur
pose
s only
.
Conse
nt of
copy
right
owne
r req
uired
for a
ny ot
her u
se.
EPA Export 27-07-2013:00:02:58

For
insp
ectio
n pur
pose
s only
.
Conse
nt of
copy
right
owne
r req
uired
for a
ny ot
her u
se.
EPA Export 27-07-2013:00:02:58
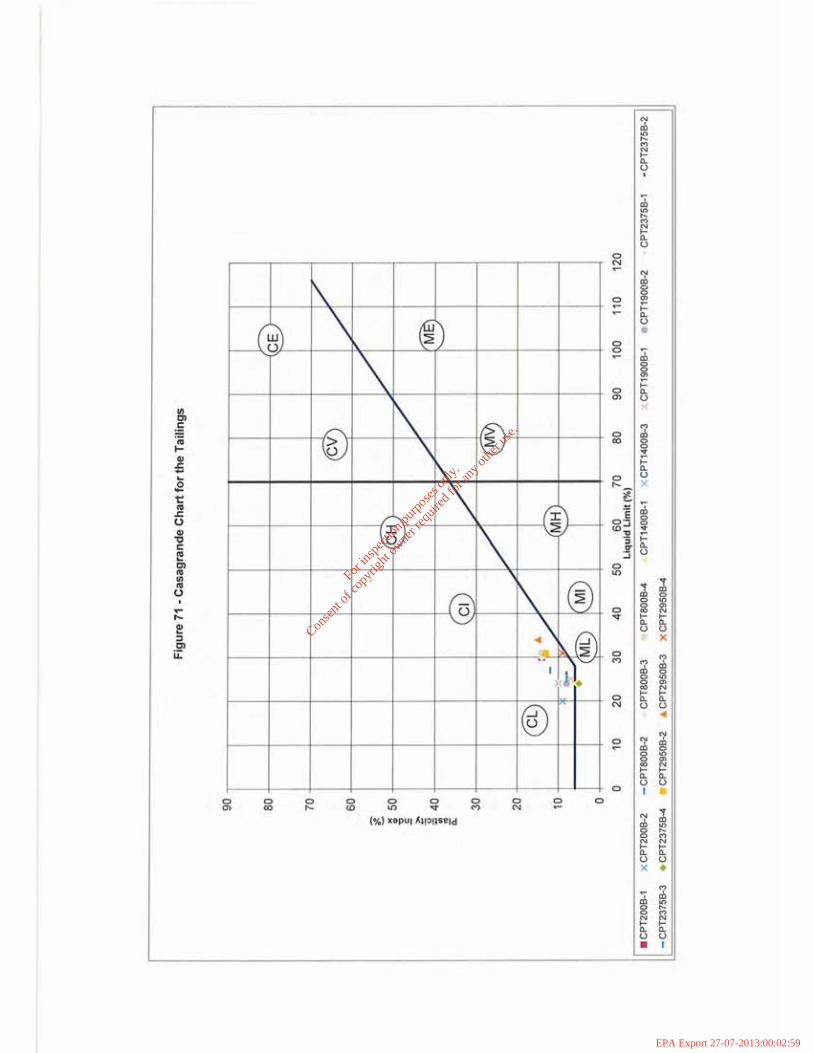
For
insp
ectio
n pur
pose
s only
.
Conse
nt of
copy
right
owne
r req
uired
for a
ny ot
her u
se.
EPA Export 27-07-2013:00:02:59

For
insp
ectio
n pur
pose
s only
.
Conse
nt of
copy
right
owne
r req
uired
for a
ny ot
her u
se.
EPA Export 27-07-2013:00:02:59

For
insp
ectio
n pur
pose
s only
.
Conse
nt of
copy
right
owne
r req
uired
for a
ny ot
her u
se.
EPA Export 27-07-2013:00:02:59
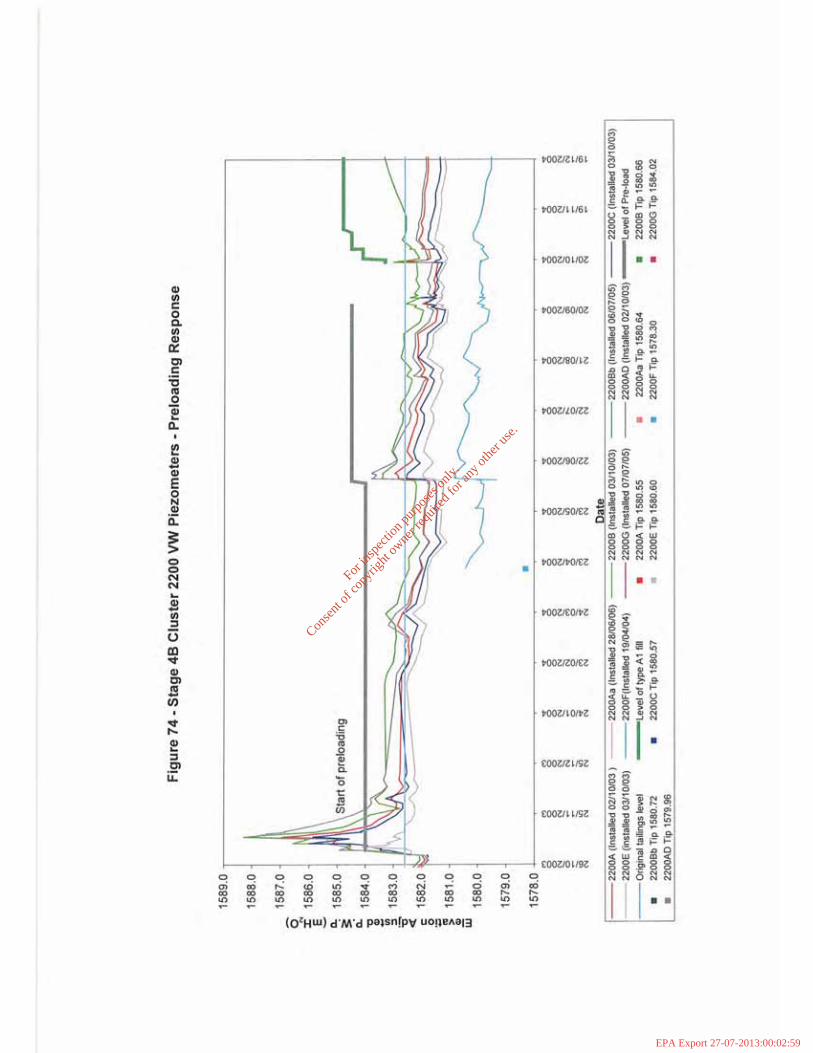
For
insp
ectio
n pur
pose
s only
.
Conse
nt of
copy
right
owne
r req
uired
for a
ny ot
her u
se.
EPA Export 27-07-2013:00:02:59
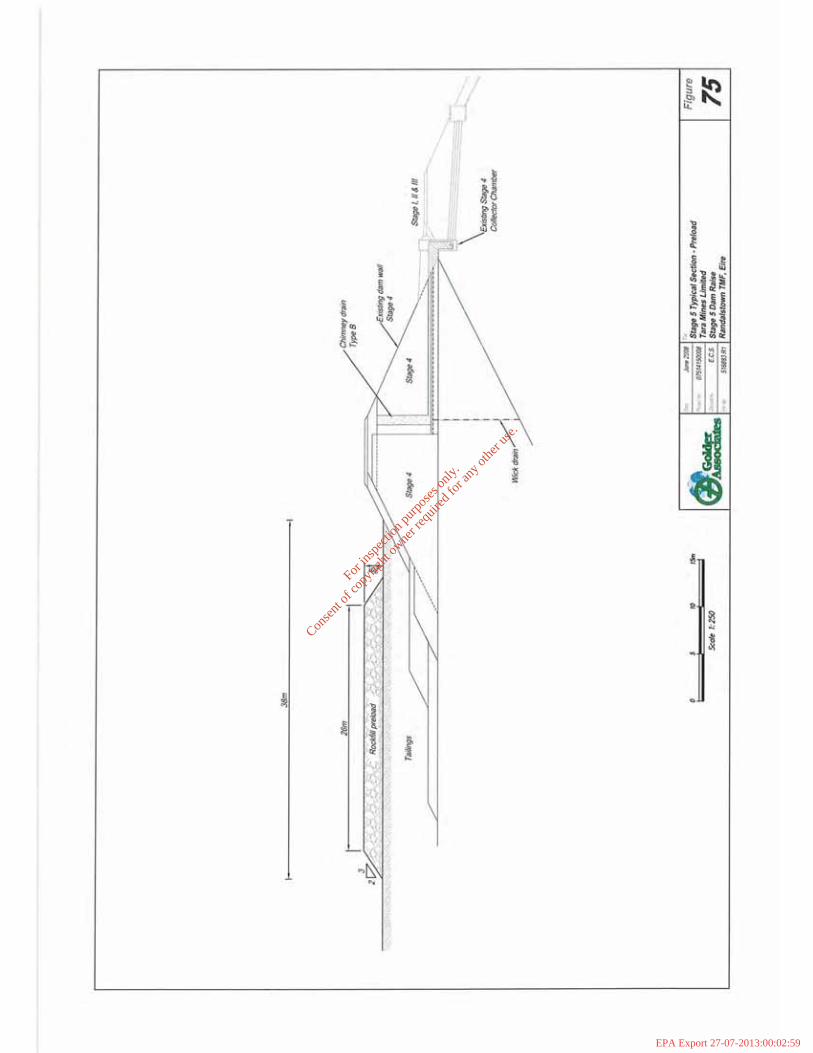
For
insp
ectio
n pur
pose
s only
.
Conse
nt of
copy
right
owne
r req
uired
for a
ny ot
her u
se.
EPA Export 27-07-2013:00:02:59
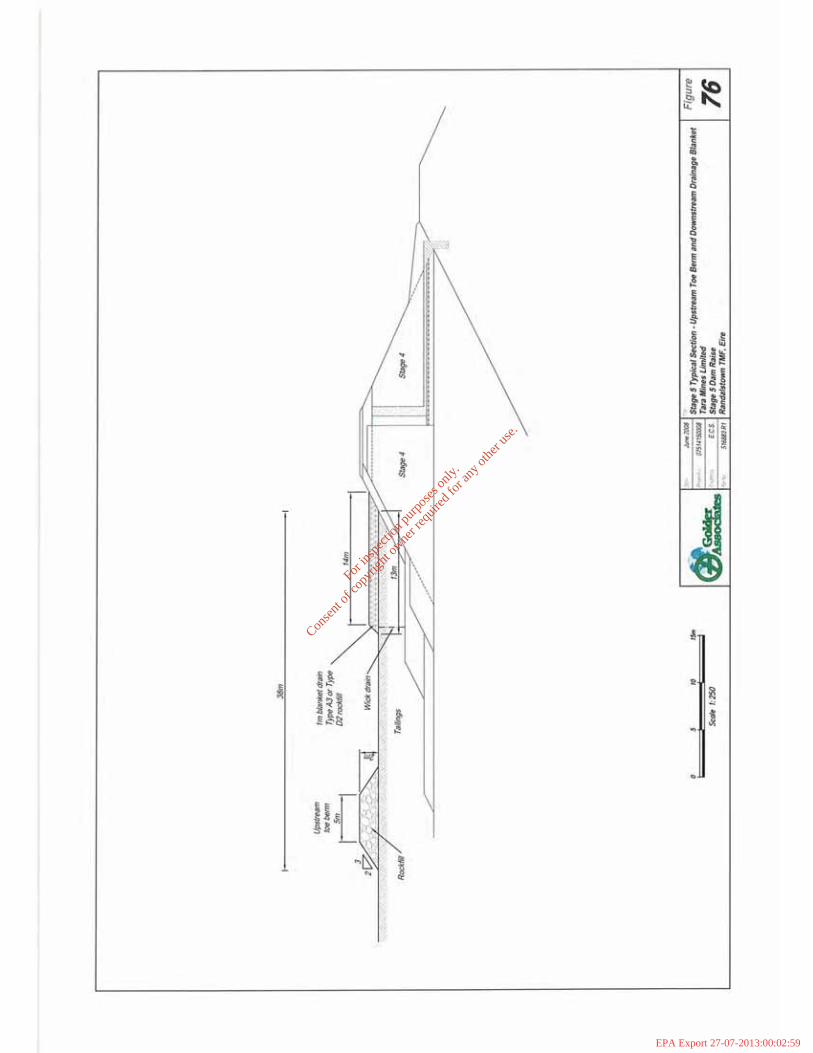
For
insp
ectio
n pur
pose
s only
.
Conse
nt of
copy
right
owne
r req
uired
for a
ny ot
her u
se.
EPA Export 27-07-2013:00:02:59

For
insp
ectio
n pur
pose
s only
.
Conse
nt of
copy
right
owne
r req
uired
for a
ny ot
her u
se.
EPA Export 27-07-2013:00:02:59
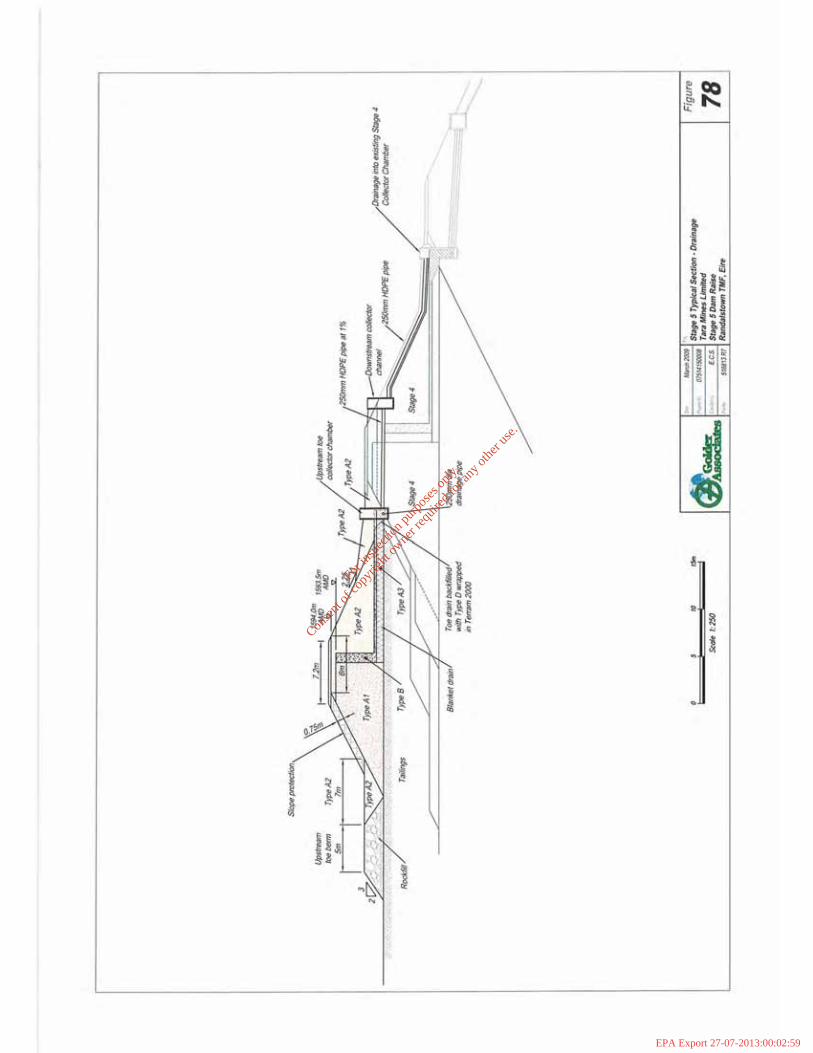
For
insp
ectio
n pur
pose
s only
.
Conse
nt of
copy
right
owne
r req
uired
for a
ny ot
her u
se.
EPA Export 27-07-2013:00:02:59

For
insp
ectio
n pur
pose
s only
.
Conse
nt of
copy
right
owne
r req
uired
for a
ny ot
her u
se.
EPA Export 27-07-2013:00:02:59

For
insp
ectio
n pur
pose
s only
.
Conse
nt of
copy
right
owne
r req
uired
for a
ny ot
her u
se.
EPA Export 27-07-2013:00:02:59

For
insp
ectio
n pur
pose
s only
.
Conse
nt of
copy
right
owne
r req
uired
for a
ny ot
her u
se.
EPA Export 27-07-2013:00:02:59
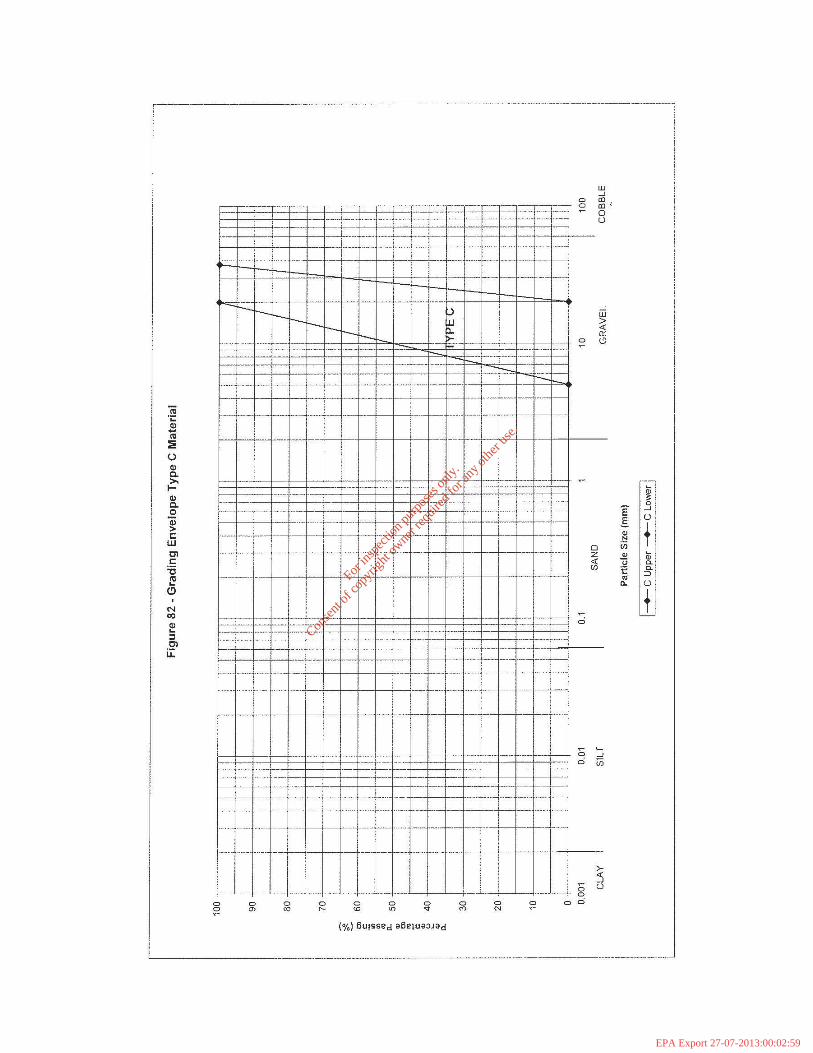
For
insp
ectio
n pur
pose
s only
.
Conse
nt of
copy
right
owne
r req
uired
for a
ny ot
her u
se.
EPA Export 27-07-2013:00:02:59
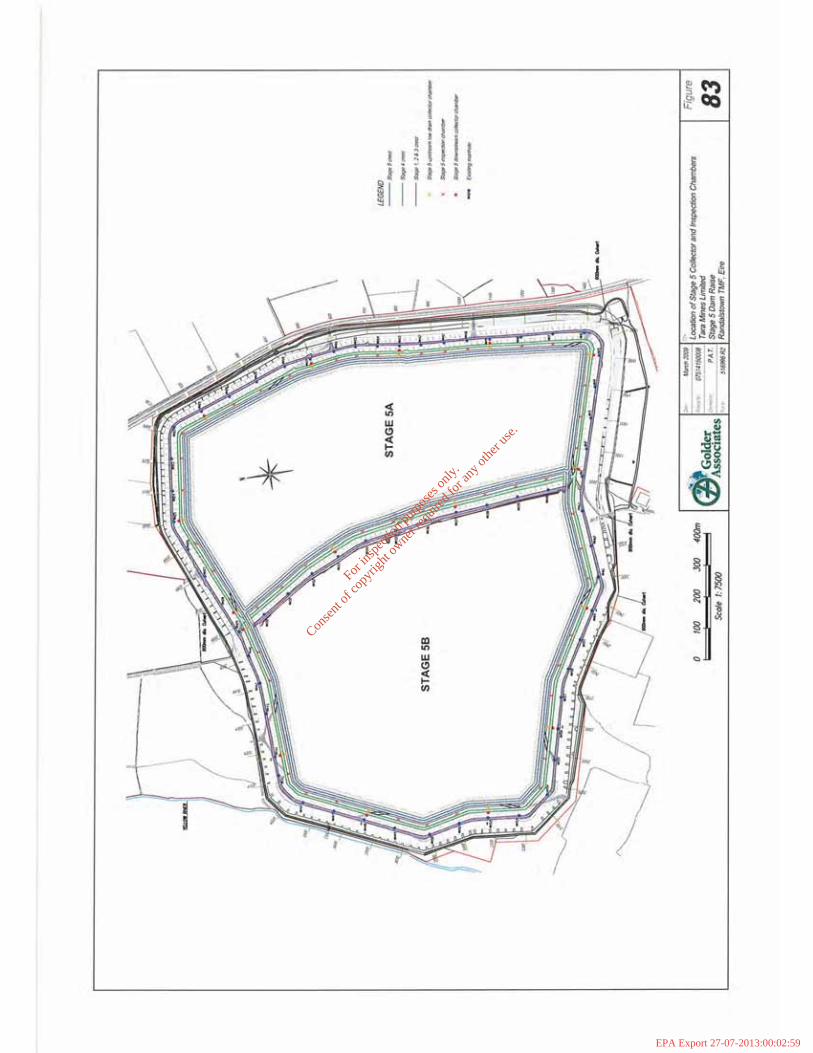
For
insp
ectio
n pur
pose
s only
.
Conse
nt of
copy
right
owne
r req
uired
for a
ny ot
her u
se.
EPA Export 27-07-2013:00:02:59
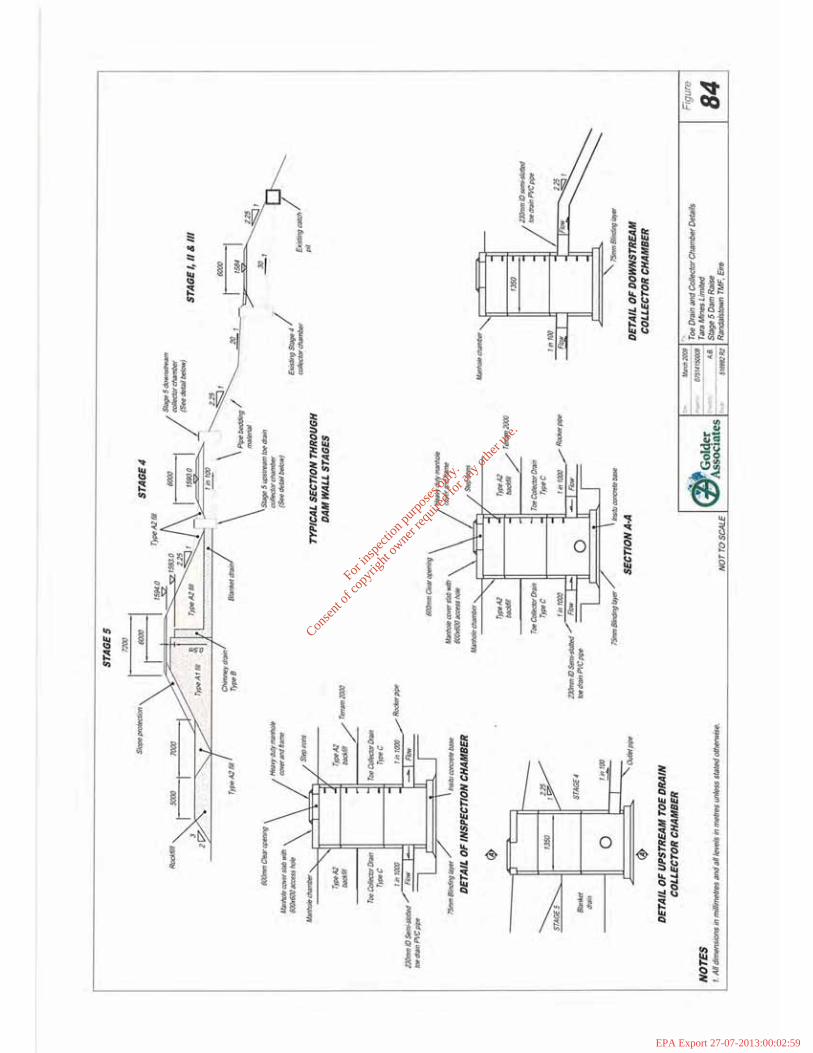
For
insp
ectio
n pur
pose
s only
.
Conse
nt of
copy
right
owne
r req
uired
for a
ny ot
her u
se.
EPA Export 27-07-2013:00:02:59

For
insp
ectio
n pur
pose
s only
.
Conse
nt of
copy
right
owne
r req
uired
for a
ny ot
her u
se.
EPA Export 27-07-2013:00:02:59
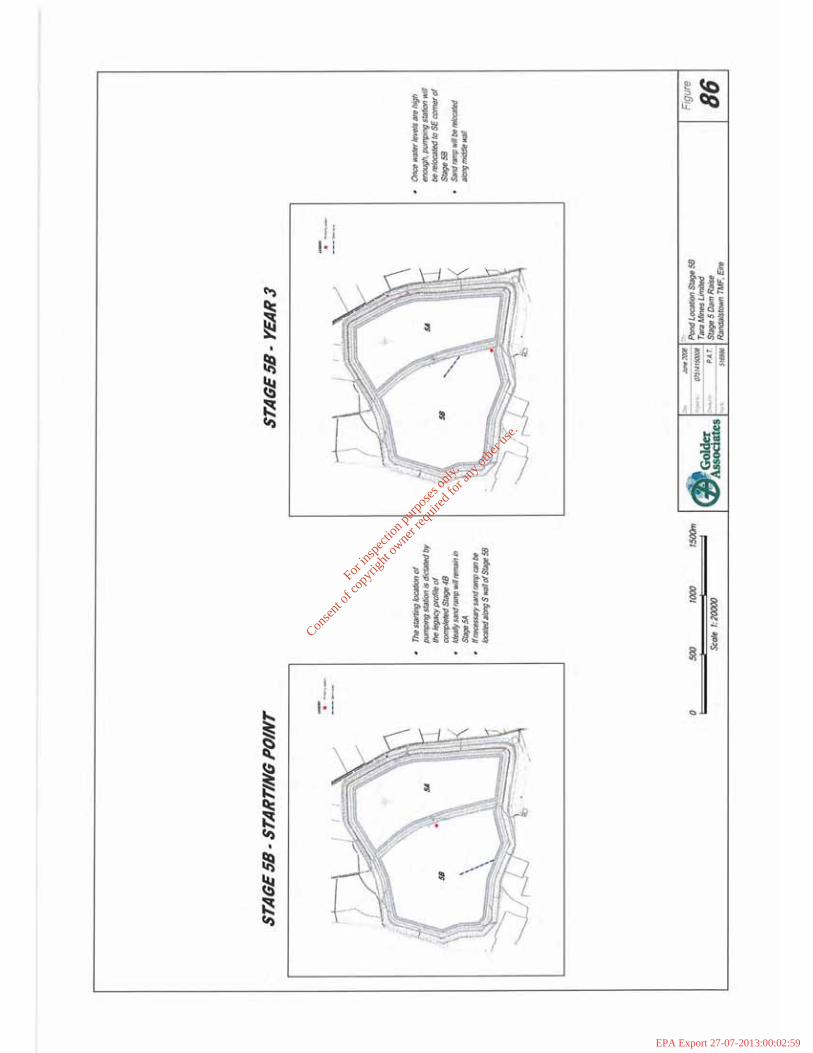
For
insp
ectio
n pur
pose
s only
.
Conse
nt of
copy
right
owne
r req
uired
for a
ny ot
her u
se.
EPA Export 27-07-2013:00:02:59

For
insp
ectio
n pur
pose
s only
.
Conse
nt of
copy
right
owne
r req
uired
for a
ny ot
her u
se.
EPA Export 27-07-2013:00:02:59

For
insp
ectio
n pur
pose
s only
.
Conse
nt of
copy
right
owne
r req
uired
for a
ny ot
her u
se.
EPA Export 27-07-2013:00:02:59

For
insp
ectio
n pur
pose
s only
.
Conse
nt of
copy
right
owne
r req
uired
for a
ny ot
her u
se.
EPA Export 27-07-2013:00:02:59

For
insp
ectio
n pur
pose
s only
.
Conse
nt of
copy
right
owne
r req
uired
for a
ny ot
her u
se.
EPA Export 27-07-2013:00:02:59
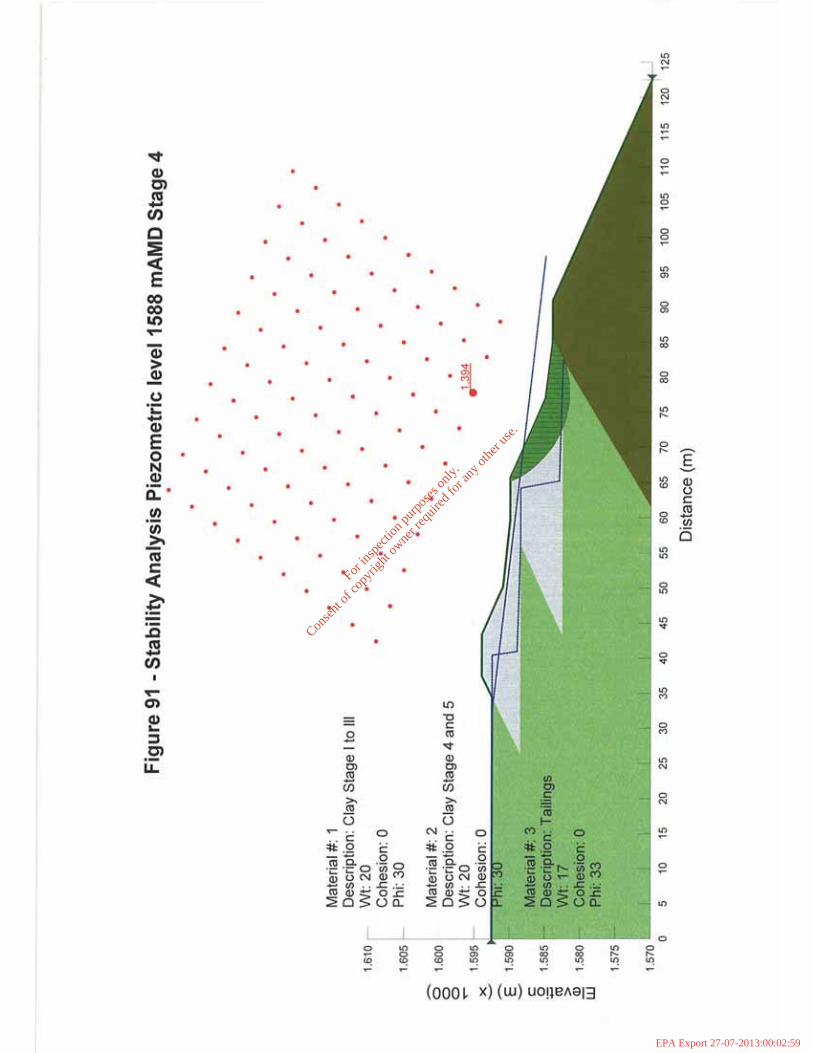
For
insp
ectio
n pur
pose
s only
.
Conse
nt of
copy
right
owne
r req
uired
for a
ny ot
her u
se.
EPA Export 27-07-2013:00:02:59

For
insp
ectio
n pur
pose
s only
.
Conse
nt of
copy
right
owne
r req
uired
for a
ny ot
her u
se.
EPA Export 27-07-2013:00:02:59

For
insp
ectio
n pur
pose
s only
.
Conse
nt of
copy
right
owne
r req
uired
for a
ny ot
her u
se.
EPA Export 27-07-2013:00:02:59

For
insp
ectio
n pur
pose
s only
.
Conse
nt of
copy
right
owne
r req
uired
for a
ny ot
her u
se.
EPA Export 27-07-2013:00:02:59

For
insp
ectio
n pur
pose
s only
.
Conse
nt of
copy
right
owne
r req
uired
for a
ny ot
her u
se.
EPA Export 27-07-2013:00:02:59

For
insp
ectio
n pur
pose
s only
.
Conse
nt of
copy
right
owne
r req
uired
for a
ny ot
her u
se.
EPA Export 27-07-2013:00:02:59

For
insp
ectio
n pur
pose
s only
.
Conse
nt of
copy
right
owne
r req
uired
for a
ny ot
her u
se.
EPA Export 27-07-2013:00:02:59

For
insp
ectio
n pur
pose
s only
.
Conse
nt of
copy
right
owne
r req
uired
for a
ny ot
her u
se.
EPA Export 27-07-2013:00:02:59
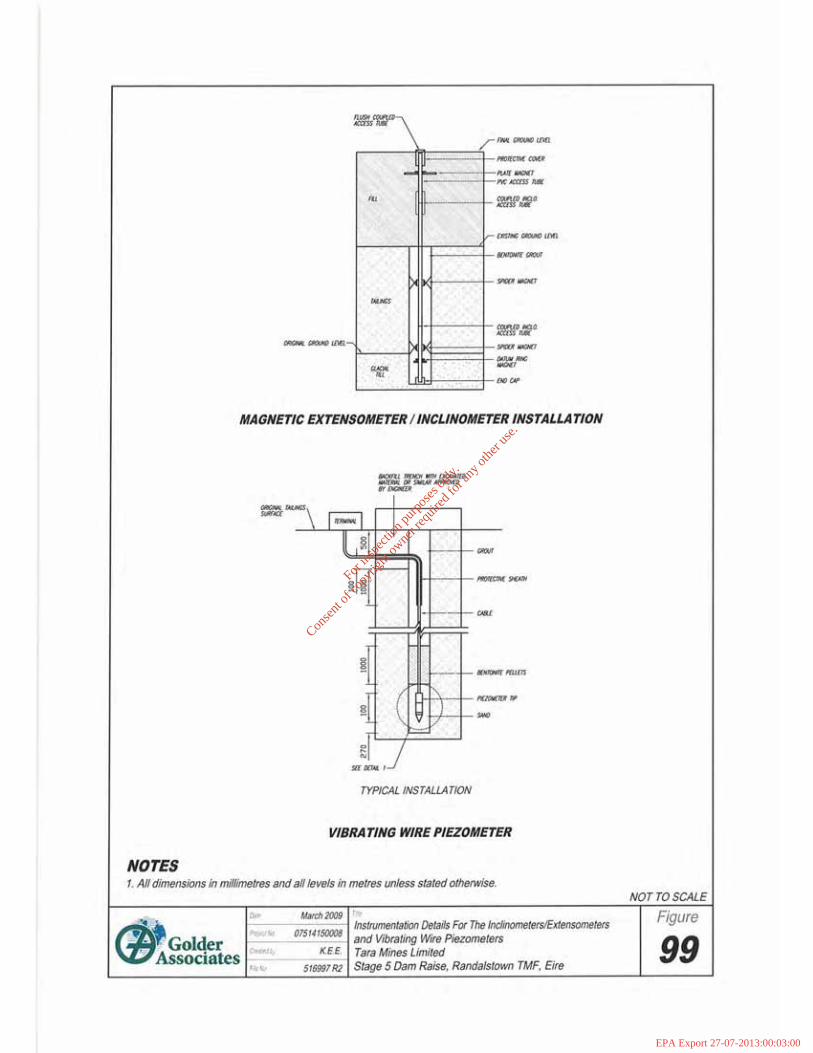
For
insp
ectio
n pur
pose
s only
.
Conse
nt of
copy
right
owne
r req
uired
for a
ny ot
her u
se.
EPA Export 27-07-2013:00:03:00