golden mile strategic case refresh - final june 2020 · 2020-06-24 · golden mile strategic case...
TRANSCRIPT

Golden Mile Strategic CaseJune 2020Golden Mile Single Stage Business Case | Contract No. 1851
Supported by

This document has been prepared for the benefit of Waka Kotahi NZ Transport Agency. No liability is accepted by this company or any employee or sub-consultant of this company with respect to its use by any other person.
This disclaimer shall apply notwithstanding that the report may be made available to other persons for an application for permission or approval to fulfil a legal requirement.
QUALITY STATEMENT PROJECT MANAGER PROJECT TECHNICAL LEAD
Graeme Stanton FutureGroup
PREPARED BY 8/6/2020
Roger Burra
CHECKED BY
FutureGroup
8/6/2020 REVIEWED BY
Selwyn Blackmore
8/6/2020 APPROVED FOR ISSUE BY
Graeme Stanton
WELLINGTON
Level 13, 80 The Terrace, Wellington 6011 PO Box 13-052, Armagh, Christchurch 8141
TEL +64 4 381 6700
REVISION SCHEDULE
Rev No.
Date Description
Signature or Typed Name (documentation on file)
Prepared by
Checked by
Reviewed by
Approved by
1 16 January 2020
Version 1 Roger Burra LGWM
Selwyn Blackmore LGWM
2 17 April 2020
Final Roger Burra
LGWM Selwyn Blackmore
LGWM
3 8 June 2020
Final Incorporates Client Feedback
Roger Burra
LGWM Selwyn Blackmore
LGWM

June 2020│ Status: FINAL│ Futuregoup ref: Golden Mile: Strategic Case FINAL
Page 3
Executive Summary ........................................................................................................................ 6
Strategic Case .................................................................................................................................. 8
1. Introduction ...................................................................................................................... 8
2. Background ..................................................................................................................... 8
2.1. The Golden Mile 8
2.2. Vision for the Golden Mile 9
2.3. Growth Context 9
2.4. Travel Demand is Expected to Grow 10 Existing Transport Network Cannot Accommodate the Forecast Future Demand ........................ 12
2.5. Investment is Part of a Wider Programme for Wellington 13
2.6. Golden Mile Investment is Linked and Dependent on Other Projects 14
3. Strategic Context .......................................................................................................... 16
3.1. Let’s Get Wellington Moving is managed by a Partnership Board 16
3.2. Overview of Partner Organisations 16 Wellington City Council ........................................................................................................................... 16 Greater Wellington Regional Council ................................................................................................... 16 Waka Kotahi NZ Transport Agency ...................................................................................................... 17 Functions of the Let’s Get Wellington Moving partners ..................................................................... 17
3.3. LGWM is aligned to National, Regional and Local Policy and Plans 18 LGWM Vision ........................................................................................................................................... 19 LGWM Objectives .................................................................................................................................... 20
4. The Need for Investment ............................................................................................. 21
4.1. The Golden Mile Needs to Change to Enable the City to Grow 21
4.2. What do we need to Change? 21
4.3. Slow and unpredictable bus travel times reduce the attractiveness of travel by bus 23 Bus travel times are slow and unpredictable ....................................................................................... 23 Travel Time and Reliability Affects the Attractiveness of Travel by Bus ......................................... 29
4.4. Inadequate Provision for Pedestrians Along and Across the Golden Mile Reduces Convenience of Walking 30 There is not enough space for pedestrians using the Golden Mile .................................................. 30 Parts of the Golden Mile are Inconvenient (Provide a Poor Level of Service) for Pedestrians ... 31
4.5. Street Layout Limits the Attractiveness of The Golden Mile as a Place in which to Spend Time and Move Through 35 Factors Affecting the Amenity of the Golden Mile .............................................................................. 36 Built Edge ................................................................................................................................................. 39
4.6. Provision for People on Bikes in the Central City 40 Riding Bikes in Bus Lanes and Bus Only Streets Can be Dangerous, ........................................... 41
June 2020│ Status: FINAL│ Futuregoup ref: Golden Mile: Strategic Case FINAL
Page 4
Interested but Concerned Cyclists will be Largely Accommodated on Parallel Corridors ............ 42 Philosophy for Accommodating Cyclists and Users of Faster Mobility Devices ............................ 42
4.7. Root Cause Summary 43
5. Outcomes Sought ......................................................................................................... 45
5.1. Outcomes and Key Performance Indicators 45
5.2. Golden Mile Investment Objectives 45
5.3. Alignment with Let’s Get Wellington Moving Programme 47
6. Partners and Stakeholders ......................................................................................... 48
6.1. Engagement on the Let’s Get Wellington Moving Programme 48
6.2. Partners and Stakeholders for the Golden Mile Project 49
6.3. Approach to Golden Mile Engagement 50 Strategic approach .................................................................................................................................. 50 Engagement approach ........................................................................................................................... 50
6.4. 2019 Golden Mile Engagement 50
Appendix A – Problem Trajectories .............................................................................................. 51
Appendix B – Golden Mile Problem Definition and Case for Change .................................... 55
Appendix C – Golden Mile Preliminary Analysis - Pedestrian Link + Place Qualities .......... 56
FIGURES Figure 1 – Modelled Change in PT and car metrics, 2013 base, 2036 Do Minimum Trend, 2036 Do Minimum Balanced .......................................................................................................................................................................................... 11 Figure 2 – Modelled Public Transport Passengers Entering Wellington Central City (Trend Scenario) ............................ 11 Figure 3 - Investment Logic Map ...................................................................................................................................... 22 Figure 4 - Average bus speeds between stops (km/h) ...................................................................................................... 23 Figure 5 – Northbound Travel times on Golden Mile by time of day (average and standard deviation) ......................... 24 Figure 6 - Six Buses Queued on Manners Street Northbound Bus Only approach to Willis Street .................................. 26 Figure 7 - Bus Stop Spacing Along the Golden Mile .......................................................................................................... 26 Figure 8 - 5 Minute Walking Catchments Northbound Bus Stops .................................................................................... 27 Figure 9 - Bus Stopped at Plimmer Steps / Grey Street Signal-controlled Crossing ......................................................... 27 Figure 10 - Potential Delay to Buses resulting from Illegal Parking / Loading .................................................................. 28 Figure 11 -Weaving on the Northbound Approach to the Taranaki Street Intersection .................................................. 29 Figure 12 -Weaving on the Northbound Approach to the Bowen Street Intersection ..................................................... 29 Figure 13 - User views on important features of a good public transport system ........................................................... 30 Figure 14 - Midblock Pedestrian LOS ................................................................................................................................ 32 Figure 15 - Pedestrian Crossing (Controlled) LOS ............................................................................................................. 32 Figure 16 - Pedestrian Congestion at Manners / Willis Street Intersection ..................................................................... 33 Figure 17 – Reported Crashes on the Golden Mile 2009 - 2018 ....................................................................................... 34 Figure 18 - Reported No. Crashes involving Pedestrians and a Vehicle (2000 - 2018) ..................................................... 34 Figure 19 - Pedestrian Crash History by Location and Severity 2000 - 2019 .................................................................... 35 Figure 20 - Mercer St looking towards the Waterfront .................................................................................................... 37 Figure 21 - Unofficial Crossing Point ................................................................................................................................. 37 Figure 22 – Opportunity to Respect the Heritage of the Golden Mile ............................................................................. 38 Figure 23 - Dwelling Spaces are Far and Few Between .................................................................................................... 38

June 2020│ Status: FINAL│ Futuregoup ref: Golden Mile: Strategic Case FINAL
Page 5
Figure 24 - Example of Unattractive Built Edge near Te Aro Park .................................................................................... 39 Figure 25 - Potential for New Dwelling Space at End of Bond Street ............................................................................... 39 Figure 26 - Restrictions on Cycling within the Golden Mile .............................................................................................. 40 Figure 27 - Golden Mile Cyclist Crash Nos by Location and Severity ................................................................................ 41 Figure 28 - Planned Central City Cycling Network ............................................................................................................ 42 Figure 29 – Investment Logic Map .................................................................................................................................... 46 Figure 30 - IAP2 public participation spectrum ................................................................................................................ 50
Tables Table 1 - Linked or Dependent Projects ............................................................................................................................ 14 Table 2 – Relevant Functions of the Let’s Get Wellington Moving Partners .................................................................... 17 Table 3 – Alignment to Guiding Policy and Plans .............................................................................................................. 18 Table 4 - Factors Influencing Bus Dwell Times on The Golden Mile ................................................................................. 24 Table 5 – Footway Width and Approximate Daily Footfall ............................................................................................... 31 Table 6 – Root Cause Summary ........................................................................................................................................ 44 Table 7 – Outcomes Sought and Key Performance Indicators ......................................................................................... 45 Table 8 – Alignment of Problem Statements to LGWM Programme Business Case ........................................................ 47 Table 9 - Alignment of Golden Mile Investment Objectives with LGWM Programme Business Case .............................. 48

June 2020│ Status: FINAL│ Futuregoup ref: Golden Mile: Strategic Case FINAL
Page 6
EXECUTIVE SUMMARY The Golden Mile, in our capital city, is the region’s prime employment, shopping and entertainment destination. It already accommodates very high pedestrian volumes and is the main bus corridor for moving people to destinations in the central city as well as through the city to other destinations such as the regional hospital and airport. Since most of the city’s core bus routes pass along all or part of the Golden Mile, the performance of this corridor affects journeys across the whole city.
This Strategic Case highlights the need for improvements that improve the movement of buses within the corridor and make the Golden Mile a safer, more pleasant place in which to walk and spend time. The Golden Mile investment is one part of the Let’s Get Wellington Moving (LGWM) programme and is included within the early intervention package. The image below summarises the vision for this important part of Wellington City.
Wellington region is growing. Over the next 30 years the population is forecast to grow by 15%, which equates to 75,000 extra residents 0F
1. While the future is uncertain forecasts suggest the population increase will be between 50,000 to 80,000. Much of this population growth is expected in the central city itself and in locations to the north. With Wellington continuing to be a regional employment hub, most new jobs are expected to be centred on the central city.
With this development pattern we can expect increased demand for travel between the central city and the north. The demand for travel to and from the city centre by public transport is expected to grow by between 35% and 50%. While much of this new demand will be for travel by rail, the location of the railway station on the northern edge of the city centre means that passengers will either walk or catch the bus along the Golden Mile to their ultimate destination.
Analysis by the LGWM team suggests that the current transport system cannot accommodate this increase in demand. They have identified that a second public transport spine through the central city is needed to increase public transport capacity to support growth, and to further improve service reliability. The LGWM programme therefore includes a project to deliver Mass Rapid Transit (MRT) along the waterfront and parallel to the Golden Mile in 2036. Until MRT is operational, the Golden Mile must be optimised for people that travel by bus and on foot. Benefits derived from improvements to the Golden Mile also need to be realised quickly. After MRT is
1 Refer Let’s Get Wellington Moving Programme Business Case – Draft Released 21 June 2019

June 2020│ Status: FINAL│ Futuregoup ref: Golden Mile: Strategic Case FINAL
Page 7
operating, the Golden Mile will continue to perform an important role as a central city destination, as a corridor for moving people on buses and on foot.
The Golden Mile is an important place in its own right. A place with history, a place with culture, a place to shop, a place to work. It is therefore vital that improvements for movement are not made at the expense of the urban experience. Changes that target improvements for movement may also create opportunities for enhancements to the public realm. The outcomes sought from investment in the Golden Mile are: a faster, more reliable bus system; improved pedestrian safety; improved pedestrian convenience; and increased amenity value.
This strategic case demonstrates that these outcomes are fully aligned to those agreed for the LGWM Programme and overarching strategies of the partners. Any investment in the Golden Mile must therefore seek to achieve the following objectives:
1. improve bus travel times and travel time reliability along the Golden Mile (40%); 2. improve convenience and comfort of people waiting for, boarding and alighting buses along
the Golden Mile (15%); 3. reduce the number of crashes within the Golden Mile that result in pedestrian injury (15%); 4. increase the capacity for pedestrians to move through the corridor by improving walking level
of service along and across Golden Mile (15%); and 5. improve the place quality of the Golden Mile (15%).
The percentage shown above provides an indication of the relative importance of each investment objective. These investment objectives will be used to evaluate the appropriateness of alternative improvement options. Other important considerations that will enable alternative improvement options to be compared include: ability to provide safe and convenient journeys by bike; ability to demonstrate tangible improvements within the 2018-21 / 2021-24 period; impact of implementation on businesses in the Golden Mile; and positive economic impact on businesses in the Golden Mile.
Investment in the Golden Mile is part of a wider LGWM programme. Critical interfaces with other projects include: City streets and development of a central city cycle network - the Golden Mile project
needs to be developed with an understanding of the proposed provision for cyclists on parallel or intersecting streets. For example, Courtenay Place is an important link in the central city cycling network. The planned provision of a protected facility for cyclists on Featherston Street may influence the level to of provision for cyclists that is needed on Lambton Quay.
Mass Rapid Transit - the route from the Waterfront towards Newtown is yet to be confirmed and could pass down Taranaki Street or Kent / Cambridge Terrace. Easy interchange between MRT and the Golden Bus Corridor is essential. This interface may also affect the treatment of these intersections proposed as part of the Golden Mile project.
The Strategic Case will be finalised as subsequent sections of the business case are completed.

June 2020│ Status: FINAL│ Futuregoup ref: Golden Mile: Strategic Case FINAL
Page 8
STRATEGIC CASE
1. Introduction This section of the business case outlines the strategic context and the need for investment to improve journeys by bus and on foot through and within the Golden Mile. Let’s Get Wellington Moving (LGWM) has developed this strategic case to clearly define and validate the need to invest in change that will: improve bus travel times and travel time reliability along the Golden Mile; improve convenience and comfort of people waiting for, boarding and alighting buses along the
Golden Mile; reduce the number of crashes within the Golden Mile that result in pedestrian injury; increase the capacity for pedestrians to move through the corridor by improving walking level of
service along and across Golden Mile; and improve the place quality of the Golden Mile.
This strategic case shows that investment is needed to support and enable the sustainable growth of Wellington while preserving the characteristics that make the capital city a great place to live. Ultimately, investment in the Golden Mile seeks to make travel by bus and on foot within the corridor more convenient and more attractive. This strategic case: outlines the strategic context and alignment of the investment with the LGWM Programme; identifies the key investment drivers, in terms of the outcomes and benefits that are sought;
and confirms the need for investment.
2. Background
2.1. The Golden Mile
The Golden Mile is a 2.3km long series of streets, each with different characteristics, issues and opportunities. The Golden Mile is made up of Lambton Quay, the Old Bank Arcade loop, part of Willis Street, Manners Street and Courtenay Place. The Golden Mile is a prime employment, shopping and entertainment destination for the region with very high pedestrian volumes. It is also the main bus corridor for moving people to destinations in the central city as well as through the city to other destinations such as the regional hospital and airport. Most of Wellington City’s high frequency bus services travel along all or part of the Golden Mile. This means improvements to the Golden Mile corridor have the potential to deliver benefits across the whole city. Travel time reliability benefits delivered by the Golden Mile improvements will be particularly useful for helping cross city services, that traverse the Golden Mile, to operate “on time”. Lambton Quay is the centre of employment and retail activity in Wellington City. It is surrounded by high rise office buildings with the highest employment concentration in New Zealand, as well as a large number of retail shopfronts and eateries. The street space along Lambton Quay is heavily used, with over 63,000 people using each block each day. Willis Street is also a busy hub of employment and retail activity. It is surrounded by high rise office buildings, as well as retail shopfronts and eateries. The street space along Willis Street is the busiest section of the Golden Mile, with just under 70,000 people using each block each day. Manners Street represents a transition point between Wellington Central, which is dominated by a high density high rise office buildings and supporting activities, and Te Aro, which is characterised

June 2020│ Status: FINAL│ Futuregoup ref: Golden Mile: Strategic Case FINAL
Page 9
by a mix of residential, entertainment, and office activities, mostly accommodated in low to medium rise buildings. Manners Street is used by around 40,000 people each day. Courtenay Place is Wellington’s centre of entertainment activity, and has a variety of restaurants, bars, cinemas, and theatres. It is surrounded by offices and apartments. The street space along Courtenay Place is used by over 40,000 people each day.
2.2. Vision for the Golden Mile
The purpose of the Vision 2036 is to communicate the aspirations for the future of the Golden Mile. The purpose of the Vision is to guide the development of the early interventions and Single Stage Business Case. The Vision is supported by Design Principles that provide direction for specific elements of the design. Both the Vision and Design Principles provide a point of reference by which to evaluate options for the Golden Mile. The Vision will also be used to articulate the future for this important part of the city to the community and stakeholders with an interest in the whole of this route, or in various specific places along its length.
2.3. Growth Context
Wellington’s transport system enables movement of people, goods and services. It is multi-modal in nature, encompassing walking, cycling, micro-mobility, public transport (buses, trains, ferries, cable cars), rail freight, and motor vehicles (including taxis and ride-sharing). Land use, urban form and the economy are the primary drivers of demand for transport services in the Greater Wellington region and in the central city area in particular. Wellington is small compared to other cities in Australasia but has a world-class quality of life, a physical environment of outstanding beauty, a highly skilled population, high incomes, healthy communities, and a reputation for creativity and quality events. What a city can offer, in terms of quality of life and quality of jobs, is driving the decisions of mobile, skilled populations about where they want to live. There is a need for Wellington to constantly improve itself to continue competing internationally. It is important that quality of life is not eroded by the growth of the city. The population of the Wellington Region currently stands at around 510,000 people. Under medium projections the population is forecast to grow by 15% over the next 30 years, equating to
June 2020│ Status: FINAL│ Futuregoup ref: Golden Mile: Strategic Case FINAL
Page 10
75,000 extra residents1F
2. While the future is uncertain, forecasts suggest the population increase will be between 50,000 to 80,000. The distribution of this growth is estimated to be: 30% focused around Wellington’s central city and inner suburbs; 20% in Wellington City’s northern suburbs; and 13% in other areas of Wellington City.
The remaining 37% of expected growth will be around urban centres outside and north of Wellington City including the Kapiti Coast, Porirua, Upper Hutt and Lower Hutt. Over 40% of the current 235,000 jobs in the Wellington region are in the central city. The high concentration of employment in the central city attracts commuters from the wider Wellington region. Given the high concentration of offices and shops accessed from the Golden Mile means that the route is well used for journeys to work. The employment projections show regional employment growing by between 15% and 20% over the next 30 years. The employment projections suggest that between 55% and 60% of future growth in employment is likely to be focused in the central city, potentially increasing the number of jobs there from the current 99,000 to between 114,000 and 131,000 over the next 30 years. The Golden Mile’s role as a key bus corridor and pedestrian route means that, in future, we can expect greater numbers of people moving within the corridor because of this growth.
2.4. Travel Demand is Expected to Grow
The previous section highlighted that: most of Wellington Region’s residential growth occurring around, or north of, the city centre; more than half of new jobs are expected to be based in the central city; and with this development pattern, increased demand for travel can be expected between the
central city and the north.
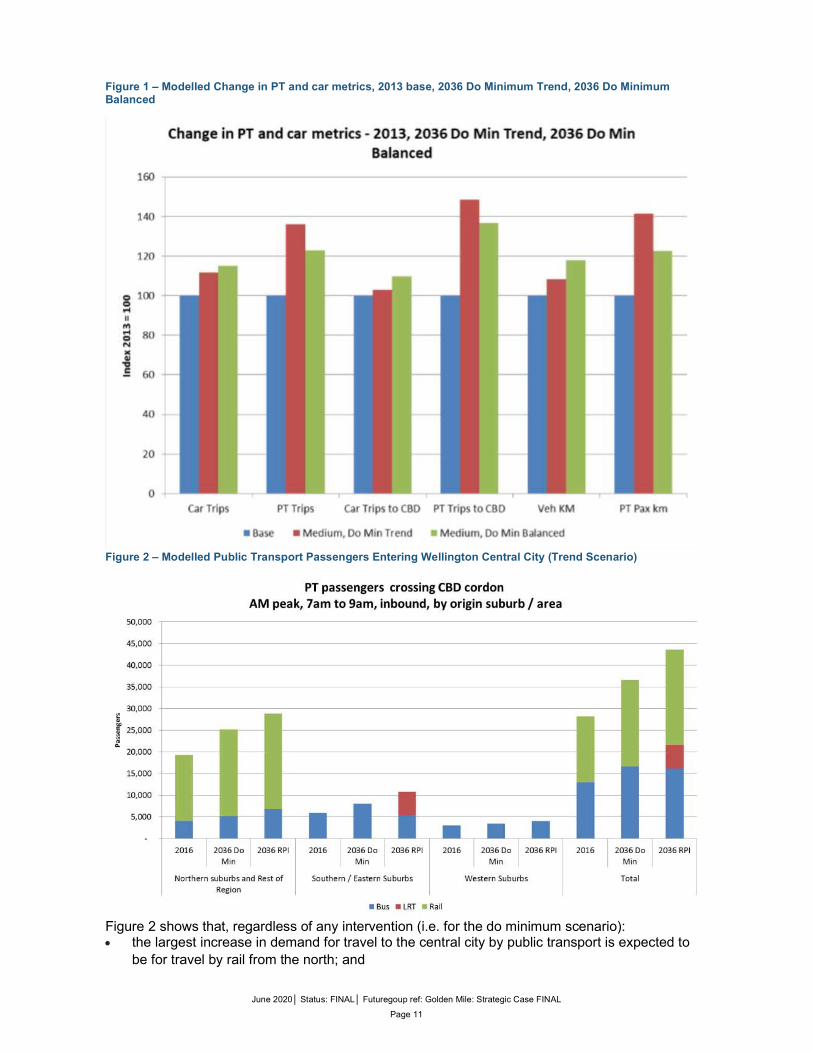
Figure 12F
3, below shows that, regardless of any intervention, the demand for travel to and from the city centre by public transport is expected to grow by between 35% and 50%. The higher increase is for a scenario where recent trends in the uptake of public transport and active travel modes continues3F
4. The corresponding increases in demand for driving into the city centre are forecast to be between 10%-12%. Figure 22 shows the increased levels of public transport patronage that are possible from each part of the city (with and without intervention). This figure reflects the availability of different forms of transport (i.e. eastern, southern and western suburbs are not served by rail). It is also focused on the primary form of transport and makes no account for rail and bus interchange.
2 Refer Let’s Get Wellington Moving Programme Business Case – Draft Released 21 June 2019 3 Reproduced from Let’s Get Wellington Moving RPI and Indicative Package Modelling Report – Draft 7th June 2019 4 The lower increase represents a scenario where the increasing uptake of public transport and active modes does not continue.
June 2020│ Status: FINAL│ Futuregoup ref: Golden Mile: Strategic Case FINAL
Page 11
Figure 1 – Modelled Change in PT and car metrics, 2013 base, 2036 Do Minimum Trend, 2036 Do Minimum Balanced
Figure 2 – Modelled Public Transport Passengers Entering Wellington Central City (Trend Scenario)
Figure 2 shows that, regardless of any intervention (i.e. for the do minimum scenario): the largest increase in demand for travel to the central city by public transport is expected to
be for travel by rail from the north; and

June 2020│ Status: FINAL│ Futuregoup ref: Golden Mile: Strategic Case FINAL
Page 12
the demand for travel to the central city by bus is also expected to increase, particularly from the eastern and southern suburbs.
Figure 2 makes no account for interchange and does not reflect that most journeys involve more than one form of transport. Some of the people entering the central city by train, may need to continue their journey by bus to major destinations, such as, the Wellington Regional Hospital and Wellington International Airport. Many of those travelling by rail to work in the central city will walk to reach their destination from the Wellington Station. Given that the Golden Mile is the main bus corridor for moving people to and through the central city, the growth in travel demand will mean that the Golden Mile will need to accommodate increased pedestrian throughput and if possible increase its capacity to carry people on buses.
Existing Transport Network Cannot Accommodate the Forecast Future Demand
The LGWM team used transportation models to test the ability for the existing transport network to accommodate additional public transport demand. This work found that without intervention, the public transport network (rail and buses) cannot accommodate the demand forecast for 2036. Without the interventions identified within the LGWM Programme, assumed growth (in population and jobs) could be deferred or occur instead in other areas of the region. The increased bus patronage signalled in the LGWM modelling report will not be realised without an increase in capacity. Most bus users would agree that peak hour services travelling on the Golden Mile operate at or close to capacity as evidenced by the occupancy of buses used to deliver the service. In recent years, growth in bus patronage has been accommodated by peak spreading: where people travel slightly before or slightly after the “peak-of-the-peak” to avoid travel on congested buses. The Golden Mile, in its current configuration, cannot accommodate an increase in bus throughput without a decline in level of service (i.e. more variable travel times). Any decline in the performance of bus services would be felt across the city as currently most core routes travel along all or part of the Golden Mile. Reconfiguration of the corridor may enable some increase in peak hour bus throughput. The LGWM programme however signals that ultimately a second public transport spine through the central city is recommended to increase the public transport capacity needed to support growth and to further improve service reliability. The establishment of a second public transport spine will enable mass transit to be introduced.
June 2020│ Status: FINAL│ Futuregoup ref: Golden Mile: Strategic Case FINAL
Page 13
2.5. Investment is Part of a Wider Programme for Wellington
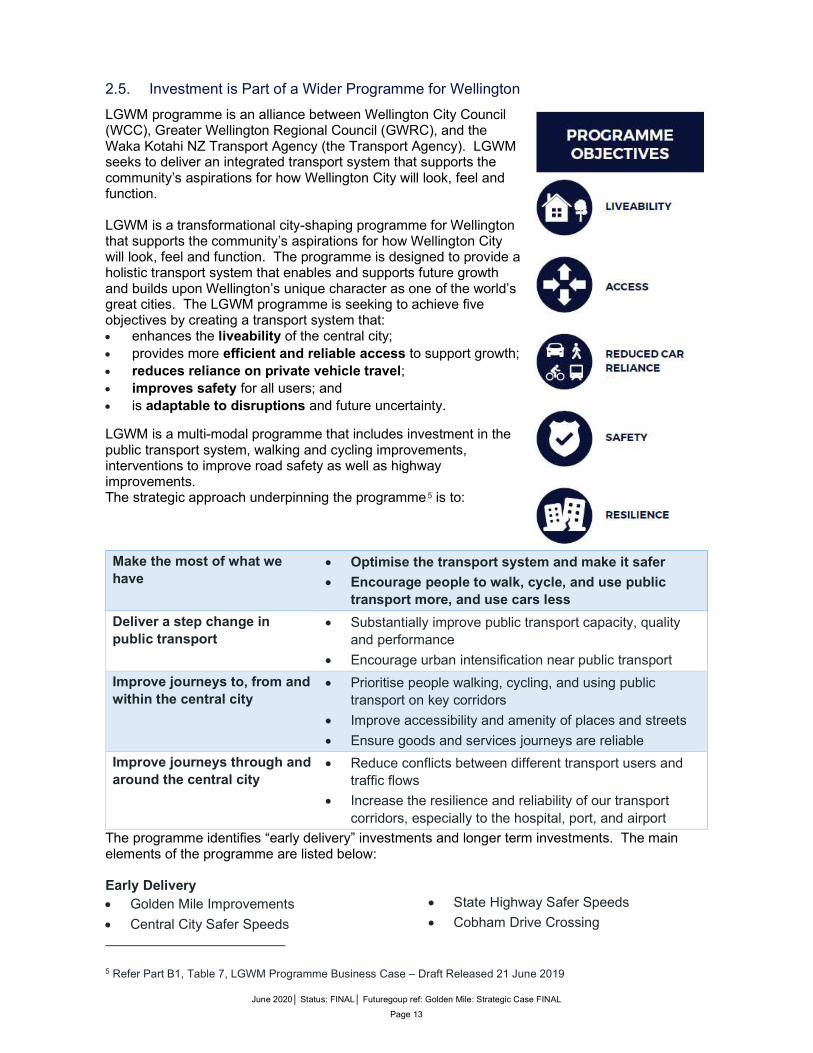
LGWM programme is an alliance between Wellington City Council (WCC), Greater Wellington Regional Council (GWRC), and the Waka Kotahi NZ Transport Agency (the Transport Agency). LGWM seeks to deliver an integrated transport system that supports the community’s aspirations for how Wellington City will look, feel and function. LGWM is a transformational city-shaping programme for Wellington that supports the community’s aspirations for how Wellington City will look, feel and function. The programme is designed to provide a holistic transport system that enables and supports future growth and builds upon Wellington’s unique character as one of the world’s great cities. The LGWM programme is seeking to achieve five objectives by creating a transport system that: enhances the liveability of the central city; provides more efficient and reliable access to support growth; reduces reliance on private vehicle travel; improves safety for all users; and is adaptable to disruptions and future uncertainty.
LGWM is a multi-modal programme that includes investment in the public transport system, walking and cycling improvements, interventions to improve road safety as well as highway improvements. The strategic approach underpinning the programme 4F
5 is to:
Make the most of what we have
Optimise the transport system and make it safer
Encourage people to walk, cycle, and use public transport more, and use cars less
Deliver a step change in public transport
Substantially improve public transport capacity, quality and performance
Encourage urban intensification near public transport
Improve journeys to, from and within the central city
Prioritise people walking, cycling, and using public transport on key corridors
Improve accessibility and amenity of places and streets
Ensure goods and services journeys are reliable
Improve journeys through and around the central city
Reduce conflicts between different transport users and traffic flows
Increase the resilience and reliability of our transport corridors, especially to the hospital, port, and airport
The programme identifies “early delivery” investments and longer term investments. The main elements of the programme are listed below: Early Delivery Golden Mile Improvements
Central City Safer Speeds
5 Refer Part B1, Table 7, LGWM Programme Business Case – Draft Released 21 June 2019
State Highway Safer Speeds
Cobham Drive Crossing

June 2020│ Status: FINAL│ Futuregoup ref: Golden Mile: Strategic Case FINAL
Page 14
Thorndon Quay & Hutt Road Improvements
Central City Pedestrian Improvements
Medium – Long Term Mass Transit - Wellington Station to
Newtown and The Airport
City Streets
Improving the Basin
Mt Victoria Tunnel Duplication and Ruahine Street Widening
2.6. Golden Mile Investment is Linked and Dependent on Other Projects
Table 1, below highlights links or dependencies between the Golden Mile investment and other projects within the LGWM programme. Table 1 - Linked or Dependent Projects
Programme Element
Years to Complete
Links or Dependencies with Golden Mile Investment
Early Improvements - Central City Safer Speeds
1 Minimal impact – this project is reviewing the speed environment and regulation of speed on central city streets;
A 30kmph speed limit is already in place for the Golden Mile; and
Bus operating speeds along the golden mile tend to be less than 20kmph.
Thorndon Quay & Hutt Road Improvements
3 – 4 Minimal impact – this project is to deliver priority for buses with improvements for walking and cycling; and
Some bus services that use Thorndon Quay and the Hutt Road continue along the Golden Mile.
Central City Pedestrian Improvements
1 Minimal impact – this project is to make walking safer and faster for pedestrians through adjustments to traffic signals and other relatively small changes to improve pedestrian safety.
City Streets 3 – 10 Significant impact – this project involves reallocation of road space on streets in the central city to enable the transport system to move more people with fewer vehicles and to improve access for all modes. The Golden Mile project needs to be developed with an understanding of the proposed provision for cyclists on parallel or intersecting streets. For example:
provision for cyclists on Featherston Street; and
importance of Courtenay Place in the city cycling network.
Mass Transit 10 – 15 Significant impact – this project is to deliver an MRT system between Wellington Railway Station and Wellington Airport via Newtown (the final route is still to be confirmed). Key working assumptions for the Golden Mile project are as follows:
potential for additional pressure on the bus network during construction of mass transit

June 2020│ Status: FINAL│ Futuregoup ref: Golden Mile: Strategic Case FINAL
Page 15
Programme Element
Years to Complete
Links or Dependencies with Golden Mile Investment
delivery of mass transit is expected to relieve pressure on bus services that operate along the Golden Mile in the years following its opening
MRT stop spacing in the central city will be at least 800m. This means that those who are unable or disinclined to walk far will need to interchange and travel for the last part of their journey on buses that operate along the Golden Mile; and
the likely need to consider or allow for MRT / bus interchange along the Golden Mile (e.g. at Taranaki Street or at Courtenay Place)
Urban Design / Place-Making Initiatives
Ongoing Moderate impact – the Wellington City Council are considering several urban regeneration projects as part of LGWM5F
6 and a north Lambton Quay Central City Framework6F
7, some of which overlap with the Golden Mile. The Golden Mile and place-making projects need to be co-ordinated to ensure that they are planned and designed holistically.
Railway Precinct Strategy
1 – 2 Minimal impact – The area around the northern end of Lambton Quay and the Railway Station is a very important part of the “Golden Mile”. It is home to a high concentration of office workers and central government departments but currently lacks the street vitality of other parts of the Golden Mile. This project is about improving street life in this area through localised pedestrian and amenity improvements. The Gooden Mile project needs to be integrated with the plans for the emerging Railway Precinct.
National Integrated Ticketing Programme
2 Minor impact – this project is to establish a nationally consistent integrated ticketing system for public transport. A new ticketing system would supersede the Snapper cards currently used for cashless boarding along the Golden Mile. A new ticketing system may further improve the efficiency of passenger boarding along the Golden Mile and increase public transport patronage.
6 $122M budget in 10 year plan https://10yearplan.wellington.govt.nz/assets/April15docs/ee4d06f086/capital-project-budget.pdf 7 $0.9M budget in 10 year plan https://10yearplan.wellington.govt.nz/assets/April15docs/ee4d06f086/capital-project-budget.pdf

June 2020│ Status: FINAL│ Futuregoup ref: Golden Mile: Strategic Case FINAL
Page 16
3. Strategic Context The strategic context provides an overview of the organisations promoting this investment and the outcomes they seek to achieve, or contribute to, through their operations. The purpose of this section is to explain how the proposed investment is aligned with the existing business strategies of each organisation.
3.1. Let’s Get Wellington Moving is managed by a Partnership Board
As noted above, the LGWM programme is an alliance between WCC, GWRC and the Transport Agency. LGWM is managed by a Partnership Board. The members of the Board are: Chief Executive Officer - Wellington City Council Chief Executive - Greater Wellington Regional Council General Manager for System Design and Delivery – Transport Agency General Manager Rail and Mass Transit Services – Transport Agency
The LGWM Programme Director, is appointed by the Partnership Board, and is responsible for delivering the programme. The programme director is supported by a management team drawn from the partner organisations. The LGWM Management Team is supported by a Programme Steering Group and a technical advisory group.
3.2. Overview of Partner Organisations
Wellington City Council
WCC is the local authority responsible for Wellington City. Its purpose is to enable democratic local decision-making and action by, and on behalf of, communities. It seeks to promote the social, economic, environmental, and cultural well-being of people that live, work or visit Wellington now and in the future. WCC invests to make Wellington more resilient, vibrant and competitive, and makes sure residents continue to have a high quality of life. The strategy and vision for Wellington (Towards 2040: Smart Capital) is built on its current strengths but also recognises the challenges the city faces now and over the medium to long term. The Towards 2040: Smart Capital goals 7F
8 for Wellington are: a people centred city; a connected city; an eco-city; and a dynamic central city.
Greater Wellington Regional Council
Greater Wellington is responsible for a wide range of activities that contribute to the overall wellbeing of the Wellington region and the following outcomes: strong economy; connected community; resilient community; healthy environment; and engaged community.
8 https://wellington.govt.nz/your-council/structure-and-vision/vision-2040/towards-2040-smart-capital

June 2020│ Status: FINAL│ Futuregoup ref: Golden Mile: Strategic Case FINAL
Page 17
Greater Wellington manages the Metlink public transport network and delivers public transport services to the regional population. GW provide bus, rail and harbour ferry services and are responsible for developing and maintaining public transport infrastructure including railway stations, train maintenance depot, bus and ferry shelters, signs, and Park & Ride facilities.
Waka Kotahi NZ Transport Agency
The Transport Agency is the crown entity responsible for planning and investing in the land transport system and managing the state highway network. The Transport Agency administers the National Land Transport Fund (NLTF). Their primary objective is to contribute to an effective, efficient and safe land transport system that is in the public interest. Through its various functions the Transport Agency is responsible for delivering on the Government’s Transport Sector Outcomes 8F
9 to create a transport system that: provides inclusive access; supports economic prosperity; is resilient and secure; provides environmental sustainability; and supports healthy and safe people.
Functions of the Let’s Get Wellington Moving partners
Table 2 summarises the functions of each partner that are relevant to the Golden Mile project. Table 2 – Relevant Functions of the Let’s Get Wellington Moving Partners
Partners Functions
Wellington City Council (WCC)
Planning land use and managing urban growth Provision and operation of walking, cycling and local
road networks Managing and regulating kerbside controls (i.e. parking,
loading, bus stops) Traffic Management (i.e. intersection controls, road
stopping, road space allocation) Street operations and maintenance Part funding local road development, operations and
maintenance using rates contributions
Greater Wellington Regional Council
(GWRC)
Strategic transport planning for the region (e.g. Wellington Regional Land Transport Plan)
Provision of public transport services (bus, ferry and passenger rail)
Part funding public transport operations using rates contributions and fare revenue
Waka Kotahi - New Zealand Transport Agency
(the Transport Agency)
Investor in land transport system through allocation of the NLTF
Provision and operation of the state highway network Regulator of access to and use of the land transport
system
9 https://www.transport.govt.nz/multi-modal/keystrategiesandplans/transport-outcomes-framework/

June 2020│ Status: FINAL│ Futuregoup ref: Golden Mile: Strategic Case FINAL
Page 18
3.3. LGWM is aligned to National, Regional and Local Policy and Plans
The vision and objectives for the LGWM programme were informed following substantial community engagement and are designed to be aligned with the relevant national, regional and local policies and plans. Chapter 2 of the draft LGWM Programme Business Case (June 2019) describes the degree to which the programme is aligned with these policies and plans. This section provides a summary showing the alignment of the Golden Mile project with the guiding national, regional and local policy and planning framework is provided in Table 3, below. Table 3 – Alignment to Guiding Policy and Plans
Policy / Plan Alignment with Investment in the Golden Mile
Government Policy Statement for Land Transport 2018
create a transport system that is a safe system, free of death and serious injury increased access to economic and social opportunities enables transport choice and access reduces greenhouse gas emissions, as well as adverse
effects on the local environment and public health
Wellington Regional Land Transport Plan 2015
invest in the regional transport system to deliver: a high quality, reliable public transport network a safe system for all users of the regional transport
network a well-planned, connected and integrated transport
network an attractive and safe walking and cycling network an efficient and optimised transport system that
minimises the impact on the environment
Ngauranga to Airport Plan 2008
invest in the city transport system to deliver:
a high quality and high frequency passenger transport ‘spine’
inter-connected, safe, and convenient local street, walking, cycling and passenger transport networks
highly accessible and attractive ‘activity’ or shopping streets
Wellington Urban Growth Plan: Urban Development and Transport Strategy 2014-43
invest in the city to deliver a: compact city, liveable city, and city set in nature

June 2020│ Status: FINAL│ Futuregoup ref: Golden Mile: Strategic Case FINAL
Page 19
Policy / Plan Alignment with Investment in the Golden Mile
Towards 2040: Smart Capital, 2011
position Wellington as an internationally competitive city with a strong and diverse economy, a high quality of life and healthy communities. Seek to make Wellington: a people-centred city a connected city an eco-city a dynamic central city
The vision would see the central city as a vibrant and creative place offering the lifestyle, entertainment and amenities of a much bigger city, and that the central city will continue to drive the regional economy.
Te Atakura First to Zero, Wellington’s blueprint for
a Zero Carbon Capital
The six big moves for a Zero Carbon Wellington: shaping our plan for a growing city getting us moving in all the right ways becoming a leader in high performing buildings giving shared mobility options a lift building a wellington climate lab going for a zero emissions transport fleet
The need to increase transport resilience and preserve the flexibility to adapt to an uncertain future is expressed in the Government Policy Statement for Land Transport, the Regional Land Transport and the Wellington Urban Growth Plan.
LGWM Vision
The vision for the LGWM Programme is for a great harbour city: that is accessible to all; with attractive places; with shared streets; and efficient local and regional journeys.
Realising this vision will involve moving more people with fewer vehicles. The vision for the Golden Mile has been designed to be aligned with, and to be a subset of, the LGWM Programme vision. The Golden Mile vision has also been developed based on other “city shaping” policy and plans.

June 2020│ Status: FINAL│ Futuregoup ref: Golden Mile: Strategic Case FINAL
Page 20
LGWM Objectives
The objectives for the programme are a:
The objectives for the Golden Mile project are designed to be aligned with the objectives for the overarching programme. This is shown in section 5.3, below.

June 2020│ Status: FINAL│ Futuregoup ref: Golden Mile: Strategic Case FINAL
Page 21
4. The Need for Investment
4.1. The Golden Mile Needs to Change to Enable the City to Grow
The Wellington Region is growing. Between 50,000 and 80,000 extra residents are expected to call the region home within the next 30 years. Residential growth is expected to be accommodated largely within the central city area and in areas north of the city in the emerging growth areas of Lincolnshire Farm and Upper Stebbings Valley. Significant growth is also expected in Porirua City which has large areas of greenfield development land available to accommodate to new residents. Currently 40% of all jobs in the region are located within the central city. This is not expected to change in the future. In fact, around 60% of the 15,000 to 30,000 new jobs anticipated to be created over the next 30 years are expected to be based in the central city. The number of people travelling to and from the central city will continue to be high. The largest growth in travel demand will be for trips between the central city and locations to the north. The Golden Mile is a prime employment, shopping and entertainment destination for the region. It plays a vital role in providing an attractive quality of life for the city’s inhabitants, workers and visitors. As well as being a key destination, the Golden Mile is also important as a route for passing through the central city and as a location for interchanging between services. Trains, which provide a significant amount of movement capacity, stop at the northern edge of the central city. The existing public transport network cannot accommodate the demand forecasted for 2036. The LGWM programme has identified the ways in which the increased travel demand will be met. There is limited space, so accommodating this growth will require the region to move more people, safely using fewer vehicles. Rail and buses will be key tools for accommodating the increasing numbers of people moving efficiently in and out of Wellington City. In the longer term, it is expected that a new MRT system will transport large numbers of people from the Wellington Station into the central city and the southern and eastern suburbs of Wellington City. In the short to medium term, until a MRT system becomes operational, the Golden Mile will continue to be a vital transport route for moving people on foot and in buses to, within and through the central city. When another faster, higher capacity public transport spine is eventually provided, the Golden Mile will continue to be important as a secondary public transport spine serving the central city. Given that most core bus routes travel along all or part of the Golden Mile, unreliable travel times in the central city affect the whole city. Encouraging people to travel using trains, by bus and on foot will require an increase in the attractiveness these forms of travel. This will involve improving the performance of the Golden Mile both as a corridor for moving people who access nearby employment, retail and cultural opportunities and as a place to enjoy and spend time in. It is important that movement is not allowed to dominate place or erode the amenity value of the Golden Mile.
4.2. What do we need to Change?
Figure 3 summarises the logic for investment in the Golden Mile. It highlights the problems that need to be addressed and the benefits sought from any investment. The first column presents the problems that are limiting the attractiveness of travel by bus or on foot within the Golden Mile.

June 2020│ Status: FINAL│ Futuregoup ref: Golden Mile: Strategic Case FINAL
Page 22
Figure 3 - Investment Logic Map
June 2020│ Status: FINAL│ Futuregoup ref: Golden Mile: Strategic Case FINAL
Page 23
The second column presents the benefits (or outcomes) that are sought from addressing the problems. More granular logic maps highlighting the cause and effect of the problems associated with the Golden Mile are included as Appendix A. The rest of this strategic case seeks to respond to the following questions: what are the problems? how big are the problems? do the benefits of addressing the problem warrant investment?
The following sections provide evidence for the causes and consequences of the problems identified in Figure 3. The Golden Mile Problem Definition and Case for Change document (Appendix B) is referenced where relevant.
4.3. Slow and unpredictable bus travel times reduce the attractiveness of travel by bus
This section provides evidence for the first problem statement shown in Figure 3.
Bus travel times are slow and unpredictable
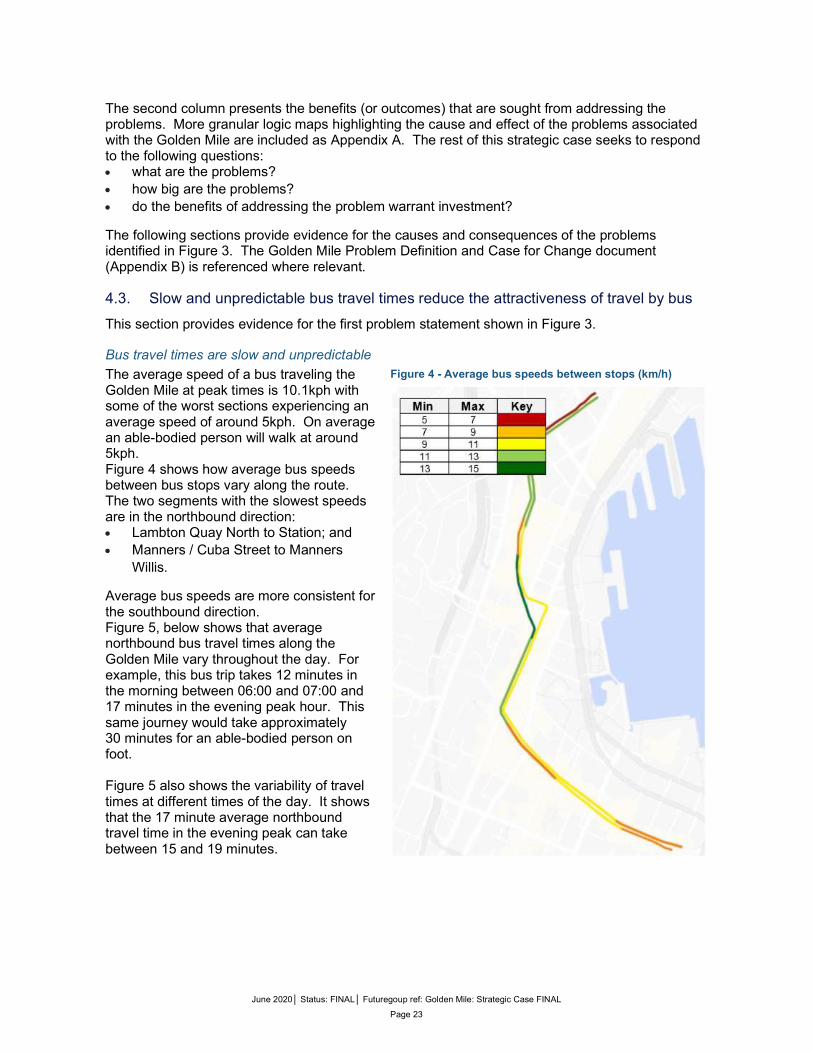
The average speed of a bus traveling the Golden Mile at peak times is 10.1kph with some of the worst sections experiencing an average speed of around 5kph. On average an able-bodied person will walk at around 5kph. Figure 4 shows how average bus speeds between bus stops vary along the route. The two segments with the slowest speeds are in the northbound direction: Lambton Quay North to Station; and Manners / Cuba Street to Manners
Willis.
Average bus speeds are more consistent for the southbound direction. Figure 5, below shows that average northbound bus travel times along the Golden Mile vary throughout the day. For example, this bus trip takes 12 minutes in the morning between 06:00 and 07:00 and 17 minutes in the evening peak hour. This same journey would take approximately 30 minutes for an able-bodied person on foot. Figure 5 also shows the variability of travel times at different times of the day. It shows that the 17 minute average northbound travel time in the evening peak can take between 15 and 19 minutes.
Figure 4 - Average bus speeds between stops (km/h)

June 2020│ Status: FINAL│ Futuregoup ref: Golden Mile: Strategic Case FINAL
Page 24
Average travel times for the southbound direction are 13.5 minutes, but demonstrate a similar pattern. In the southbound direction, the longest average travel times are also in the evening peak hour. There are many factors influencing bus travel times. The two most influential factors are: bus stops; and signal-controlled intersections and pedestrian crossings.
Preliminary analysis indicates that the additional time it takes buses to be driven along the Golden Mile, (relative to free
flow) is approximately: 1/3 attributable to bus stop dwell time 1/3 attributable to signal controlled intersections 1/3 attributable to other factors such as interaction with other vehicles using the corridor
The following paragraphs describe the cause of long and variable travel times. Bus Stops Factors influencing bus dwell times are listed in Table 4. The time a bus spends at each bus stop is influenced by the numbers of people boarding or alighting, as well as the proportion of people boarding and alighting. When there are similar numbers of people boarding and alighting at the same time, this contributes to congestion at bus doors and on the footway. Patronage increases that increase bus occupancy as well as the numbers of people boarding and alighting will exacerbate delays and unreliability associated with dwell times. Table 4 - Factors Influencing Bus Dwell Times on The Golden Mile
Factor Impact on dwell times Current State
Passenger boarding and alighting volumes and proportions
the more people served, the longer it takes to serve them.
very high numbers of boarding and alighting along the length of route, particularly on Lambton Quay
Fare payment method
some fare payment methods require more time (e.g. cash) than others (e.g. Snapper).
tag on / tag off fare payment method used for 82.5% 9F10 of passengers and cash payment used for 7.5% of passengers.
Vehicle type, size passengers spend less time boarding and alighting when boarding is level or near-level.
tag on / tag off fare payment method currently requires boarders to use front door.
10 During peak periods a higher proportion of passengers use tag on / tag off fare payment (i.e. snapper)
Figure 5 – Northbound Travel times on Golden Mile by time of day (average and standard deviation)

June 2020│ Status: FINAL│ Futuregoup ref: Golden Mile: Strategic Case FINAL
Page 25
Factor Impact on dwell times Current State
multiple or wide doors that allow
several people to board or alight simultaneously help expedite passenger movement
tag on / tag off fare payment
delays alighting and can delay boarding when passengers alight via front door.
wide doors allow for card
users to pay while cash payment is in progress.
In-vehicle circulation (internal layout)
boarding and alighting occurs more slowly when there are people standing.
the amount of space between people standing, as well as the aisle width, also influences how easily passengers circulate within the vehicle.
most buses have standees present at peak times.
double decker buses increase in-vehicle circulation time.
There is a large variation in dwell times along the corridor. The variation is linked to the numbers boarding and alighting at each stop. There is also a strong correlation with the balance between boarding and alighting numbers. Bus stops where there are similar numbers of passengers boarding and alighting at the same time experience greater delays than those where passengers are mostly boarding or mostly alighting. Stopping time is also affected by bus stop capacity (for buses) – that is, the maximum number of buses that can use a stop in any given time. At sections on the Golden Mile where buses are unable to pass, it is common to see four of five buses stopping in a series. At these locations, buses that are ready to move off may be delayed while they wait for the bus or buses ahead to finish boarding or alighting. Stops where it is common to observe platoons of buses are: Northbound Manners Cuba
Manners Willis
Grand Arcade
Southbound Lambton at Hunter
Willis Bank
Manners Cuba
The bus stop capacity for these sections of the Golden Mile is limiting the ability to increase the numbers of bus throughput along the corridor. Initial analysis of the corridor shows that hourly bus throughput does not exceed the maximum capacity for the Manners and Willis Street bus stops (60 – 90 buses per hour). These stops, that don’t allow buses to pass other buses, have the smallest capacity along the route. Bus stop capacity, as well as traffic intersections are the two main factors limiting the ability for the Golden Mile to accommodate the forecast increase in bus patronage. Each time a bus decelerates to stop and then accelerates to move off from a stop this adds time to the journey. Consquently, the closer the bus stop spacing (and greater the number of stops), the more time is added to a bus journey along the Golden Mile.

June 2020│ Status: FINAL│ Futuregoup ref: Golden Mile: Strategic Case FINAL
Page 26
This issue is exacerbated when bus stops are located close to signal-controlled intersections, as buses may move off from a stop only to then be stopped by a red traffic signal. Figure 6 shows six buses queued on Manners Street at a red traffic signal. Buses need to stop again before entering the intersection if there are passengers that wish to board. Drivers of the fourth, fifth and sixth buses are required to stop at the head of the stop, regardless of the traffc signals, to ensure that passengers do not miss their bus. International best practice indicates a minimum bus stop spacing of 500m. For the 2.3km long Golden Mile that would suggest five stops for each direction. Figure 7 shows that there are nine northbound stops and eight southbound stops mostly spaced 250m to 300m apart. An able-bodied person would be able to walk between these stops in about three to four minutes. Figure 7 - Bus Stop Spacing Along the Golden Mile
Figure 6 - Six Buses Queued on Manners Street Northbound Bus Only approach to Willis Street
June 2020│ Status: FINAL│ Futuregoup ref: Golden Mile: Strategic Case FINAL
Page 27
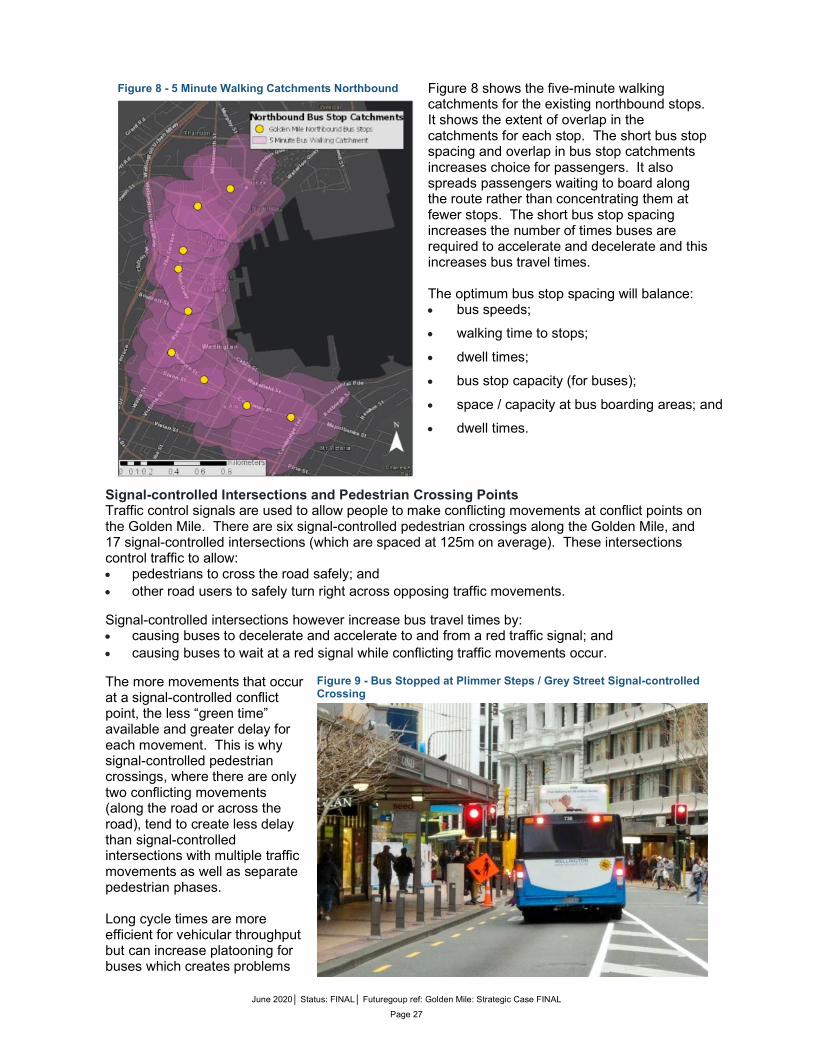
Figure 8 shows the five-minute walking catchments for the existing northbound stops. It shows the extent of overlap in the catchments for each stop. The short bus stop spacing and overlap in bus stop catchments increases choice for passengers. It also spreads passengers waiting to board along the route rather than concentrating them at fewer stops. The short bus stop spacing increases the number of times buses are required to accelerate and decelerate and this increases bus travel times. The optimum bus stop spacing will balance: bus speeds;
walking time to stops;
dwell times;
bus stop capacity (for buses);
space / capacity at bus boarding areas; and
dwell times.
Signal-controlled Intersections and Pedestrian Crossing Points Traffic control signals are used to allow people to make conflicting movements at conflict points on the Golden Mile. There are six signal-controlled pedestrian crossings along the Golden Mile, and 17 signal-controlled intersections (which are spaced at 125m on average). These intersections control traffic to allow: pedestrians to cross the road safely; and other road users to safely turn right across opposing traffic movements.
Signal-controlled intersections however increase bus travel times by: causing buses to decelerate and accelerate to and from a red traffic signal; and causing buses to wait at a red signal while conflicting traffic movements occur.
The more movements that occur at a signal-controlled conflict point, the less “green time” available and greater delay for each movement. This is why signal-controlled pedestrian crossings, where there are only two conflicting movements (along the road or across the road), tend to create less delay than signal-controlled intersections with multiple traffic movements as well as separate pedestrian phases. Long cycle times are more efficient for vehicular throughput but can increase platooning for buses which creates problems
Figure 8 - 5 Minute Walking Catchments Northbound Bus Stops
Figure 9 - Bus Stopped at Plimmer Steps / Grey Street Signal-controlled Crossing

June 2020│ Status: FINAL│ Futuregoup ref: Golden Mile: Strategic Case FINAL
Page 28
for downstream bus stops. The expected increase in pedestrian movements within the central city means that it will be important to reduce cycle times to avoid footway overcrowding at signal controlled crossing points. Traffic signal control systems also tend to be established to optimise the movement of vehicles and are not always calibrated to optimise the movement of people through an intersection. For example, the traffic control system is not able to distinguish between a turning vehicle carrying two people and a bus with 50 people on board. On any journey a bus may be held at a red light at several intersections with the stopped time at red lights adding to the overall travel time. The intersections that create the most average delay for buses also provide the lowest proportion of the cycle time for bus movements. These are: 1. Lambton/Bowen/Whitmore Northbound - average delay 47.9 seconds 2. Brandon/Lambton Quay -Northbound - average delay 35.1 seconds 3. Willis/Lambton Quay/Customhouse Quay Northbound - average delay 25.5 seconds 4. Manners/Willis/Boulcott Northbound - average delay 43.5 seconds 5. Manners/Courtenay/Taranaki Northbound - average delay 24.2 seconds 6. Manners/Courtenay/Taranaki Southbound - average delay 24.2 seconds
The proximity of signal-controlled intersections to adjacent bus stops on the Golden Mile limits the stop capacity. This occurs because bus arrivals and departures are metered by traffic signals. Merging, Weaving and Side Friction Interaction with other road users contributes to long travel times and poor reliability for buses on the Golden Mile. The additional time and variability is caused by: buses waiting to pass vehicles manoeuvring into car-parks or loading bays that are adjacent to
the bus or traffic lane; buses waiting to manoeuvre around parked cars that extend into an adjacent bus or traffic
lane; and buses waiting to weave or merge with adjacent traffic flows.
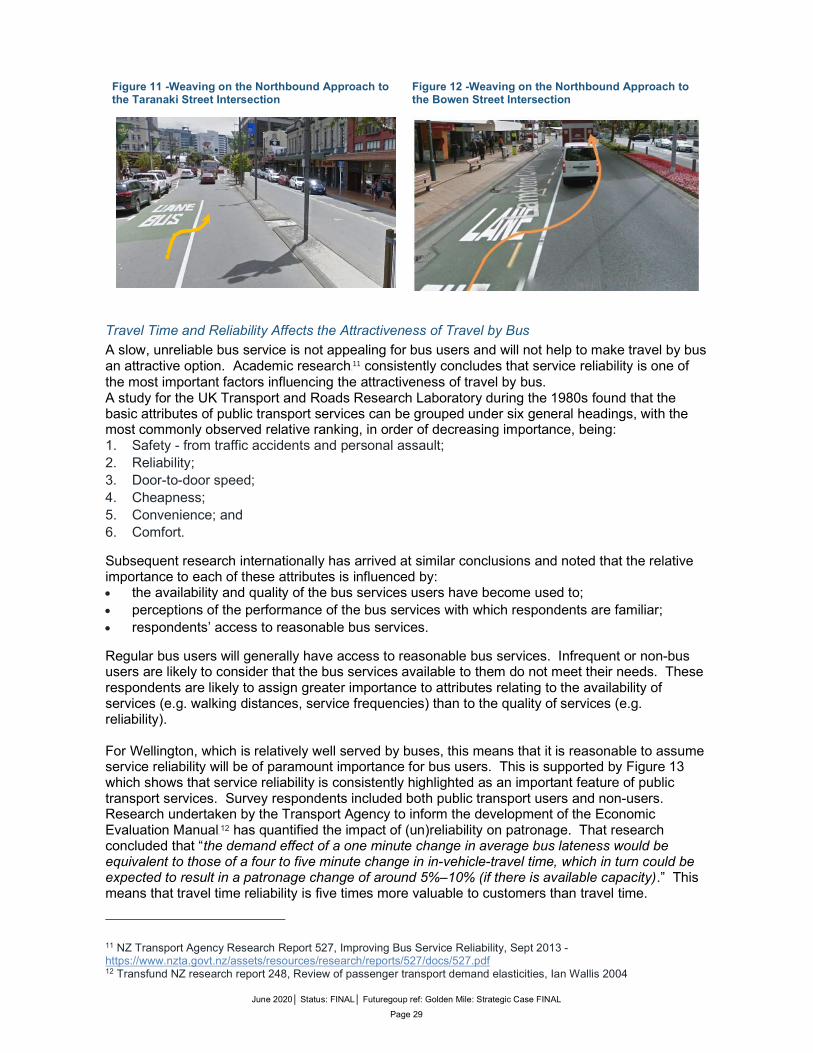
Delays associated with kerbside facilities are caused by their location and design. The red truck in Figure 10 is illegally parked opposite the Lambton Quay / Hunter Street Southbound stop. It shows northbound buses forced to cross the centre line. When southbound buses are waiting at the stop, northbound buses would be delayed. Delays associated with weaving or merging are created when buses must change their position in the road carriageway to allow provision for other traffic at signal-controlled intersections. For example, on the Courtenay Place northbound approach to Taranaki Street, buses must weave from a near side bus lane to a middle lane approach to the intersection (see Figure 11). Queues from the intersection often impede this manoeuvre resulting in an average 10 – 15 second delay for each bus. Similarly, buses weaving from the near side bus lane on the Lambton Quay’s northbound approach to the Bowen Street intersection (Figure 12) are delayed on average by 20 – 30 seconds each.
Figure 10 - Potential Delay to Buses resulting from Illegal Parking / Loading
June 2020│ Status: FINAL│ Futuregoup ref: Golden Mile: Strategic Case FINAL
Page 29
Figure 11 -Weaving on the Northbound Approach to the Taranaki Street Intersection
Figure 12 -Weaving on the Northbound Approach to the Bowen Street Intersection
Travel Time and Reliability Affects the Attractiveness of Travel by Bus
A slow, unreliable bus service is not appealing for bus users and will not help to make travel by bus an attractive option. Academic research10F
11 consistently concludes that service reliability is one of the most important factors influencing the attractiveness of travel by bus. A study for the UK Transport and Roads Research Laboratory during the 1980s found that the basic attributes of public transport services can be grouped under six general headings, with the most commonly observed relative ranking, in order of decreasing importance, being: 1. Safety - from traffic accidents and personal assault; 2. Reliability; 3. Door-to-door speed; 4. Cheapness; 5. Convenience; and 6. Comfort.
Subsequent research internationally has arrived at similar conclusions and noted that the relative importance to each of these attributes is influenced by: the availability and quality of the bus services users have become used to; perceptions of the performance of the bus services with which respondents are familiar; respondents’ access to reasonable bus services.
Regular bus users will generally have access to reasonable bus services. Infrequent or non-bus users are likely to consider that the bus services available to them do not meet their needs. These respondents are likely to assign greater importance to attributes relating to the availability of services (e.g. walking distances, service frequencies) than to the quality of services (e.g. reliability). For Wellington, which is relatively well served by buses, this means that it is reasonable to assume service reliability will be of paramount importance for bus users. This is supported by Figure 13 which shows that service reliability is consistently highlighted as an important feature of public transport services. Survey respondents included both public transport users and non-users. Research undertaken by the Transport Agency to inform the development of the Economic Evaluation Manual11F
12 has quantified the impact of (un)reliability on patronage. That research concluded that “the demand effect of a one minute change in average bus lateness would be equivalent to those of a four to five minute change in in-vehicle-travel time, which in turn could be expected to result in a patronage change of around 5%–10% (if there is available capacity).” This means that travel time reliability is five times more valuable to customers than travel time.
11 NZ Transport Agency Research Report 527, Improving Bus Service Reliability, Sept 2013 - https://www.nzta.govt.nz/assets/resources/research/reports/527/docs/527.pdf 12 Transfund NZ research report 248, Review of passenger transport demand elasticities, Ian Wallis 2004

June 2020│ Status: FINAL│ Futuregoup ref: Golden Mile: Strategic Case FINAL
Page 30
Figure 13 also shows that service frequency is highly valued by Wellingtonians. Increasing service frequency along the Golden Mile will require the ability to accommodate a higher hourly bus throughput at peak hours. Bus throughput is currently constrained by bus stop capacity on Willis and Manners Street due to the inability to pass, the proximity to and priority at the traffic signals and the passenger demands and dwell times (see Figure 13). GWRC officers expect that within the next five years, peak hour bus throughput will increase by almost 30%. Constraints associated with Willis and Manners Street mean that this increase will be expected to result in an increase in (un)reliability. This not only limits the ability to increase the attractiveness of bus services but is impacting on the ability to grow the city in a way that is aligned to the LGWM Vision. Figure 13 - User views on important features of a good public transport system 12F
13
4.4. Inadequate Provision for Pedestrians Along and Across the Golden Mile Reduces Convenience of Walking
This section provides evidence for the second problem statement shown in Figure 3. Providing adequate pedestrian space is essential to realising vibrant, safe, liveable cities. In central city environments, walking is a key travel mode, whether it constitutes an entire journey or is the beginning and end of journeys by bike, public transport, or private vehicle. Walking is the most space efficient travel mode which makes it important for high density central city areas such as the Golden Mile.
There is not enough space for pedestrians using the Golden Mile
The Golden Mile is a busy place for pedestrians. Lambton Quay is reputed to be one of the country’s busiest streets for pedestrians. Space on the footway is taken up by street furniture such as seats, signs and rubbish bins. This limits the space which is available for pedestrians. In the
13 NZ Transport Agency Research Report 531, Experience with value for money urban public transport enhancement - reproduction of Figure 4.2 - https://www.nzta.govt.nz/assets/resources/research/reports/531/docs/531.pdf

June 2020│ Status: FINAL│ Futuregoup ref: Golden Mile: Strategic Case FINAL
Page 31
evening peak hour, the passengers waiting at bus stops also limits the space available for pedestrians walking along the street. The lack of space and high demands leads to the following: Travel time reduction with the associated reduction in productivity and agglomeration benefits; Safety concerns associated with crowding and people walking on the carriageway; and Access issues for people with reduced mobility or those accompanying children caused by
crowding.
Pedestrian counts across the central city undertaken by LGWM in 2016 found that the areas with the highest pedestrian volumes are the Golden Mile and the Waterfront. The numbers of pedestrians are different in each section of the Golden Mile. Footway widths also vary along the route. Where the number of people wanting to move along the footway exceeds the available space, walking becomes uncomfortable and sometimes unsafe. Table 5 shows the footway width (distance between kerb and property boundary) and the approximate daily footfall. Due to the adjacent land use and numbers of intersecting side roads, the levels of pedestrians may not be distributed evenly between each side of the street. Not all the width between the kerb and buildings is available for walking with street furniture, bus stops, vegetation, sandwich boards and other items constraining the available width. Therefore, in reality, the widths listed below are the best case scenario and generally the available footway width is significantly less. Table 5 – Footway Width and Approximate Daily Footfall
Street Footway Width on Each Side Approximate Daily Footfall13F
14
Lambton Quay14F
15 2 - 7m 29,000
Willis Street15F
16 4 – 5m 31,500
Manners Street 16F
17 3 – 5m 13,000
Courtenay Place 17F
18 >3m 13,000
The times when footways are busiest are: the morning and evening peak hours when people are travelling to and from work; and lunchtimes, when central city workers leave their workplace to buy lunch or visit the shops.
The demands in the morning peak hour reach 5,000 18F
19 pedestrians per hour (~80 pedestrians per minute) on the west side of Lambton Quay between Waring Taylor and Johnston Streets. The Pedestrian Planning and Design Guide 19F
20 recommends a clear footpath width of 2.4m or wider for a demand of 80 pedestrians per minute. The growth of the city and prospect of an additional 5000 people arriving at the Wellington Station in the morning peak hour means that footways on Lambton Quay and in other central city streets will come under further pressure and increasingly be unable to accommodate the demand. As well as making it uncomfortable and inconvenient to walk along the Golden Mile, this could also increase the number of crashes involving pedestrians.
Parts of the Golden Mile are Inconvenient (Provide a Poor Level of Service) for Pedestrians
There are different ways to measure pedestrian levels of service:
14 From Case for Change 15 Narrowest section at Hunter Street bus stop. 16 Narrowest sections adjacent to loading zones 17 Narrowest section on north side west of Taranaki Street 18 Narrowest section at Courtenay Central bus stop 19 Wellington City Council 2019 Monitoring Surveys 20 https://www.nzta.govt.nz/assets/resources/pedestrian-planning-guide/docs/chapter-14.pdf

June 2020│ Status: FINAL│ Futuregoup ref: Golden Mile: Strategic Case FINAL
Page 32
Midblock pedestrian LOS - a measure of pedestrian crowding and is a function of the available pedestrian width and the pedestrian flow; and
Pedestrian Crossing LOS – a measure of pedestrian delay at formal crossing points which can be a function of pedestrian green time at signal-controlled crossings or vehicle headways for uncontrolled crossings.
Midblock Pedestrian Level of Service Figure 14 shows the midblock pedestrian LOS calculated by the LGWM team 20F
21. It shows that midblock pedestrian LOS is poor on Willis Street and Lambton Quay. These sections of the Golden Mile have the greatest pedestrian volumes and serve land with the highest employment density and concentration of retail. Willis Street and Lambton Quay carry twice as many pedestrians as Manners Street and Courtenay Place which provide a good level of service. Figure 14 shows that the footway widths provided on Lambton Quay and Willis Street are insufficient for the demand.
Figure 14 - Midblock Pedestrian LOS
Figure 15 - Pedestrian Crossing (Controlled) LOS
Street furniture, much of which is provided to enhance the amenity of the Golden Mile, can also contribute to pedestrian overcrowding. In places, poorly located seating, rubbish bins, signs and planting reduces the effective width of the footway so the full width is not useable. moveable advertising (sandwich” boards/signs) also reduce the effective width available for pedestrians. Interaction between Bus Passengers and Pedestrians As well as reducing efficiency and slowing bus boarding and alighting (see page 14), the interaction between pedestrians and bus passengers also impacts on the midblock pedestrian level of service. The level of service may be reduced because footway space is taken up with street
21 Refer Appendix B - Golden Mile Problem Definition and Case for Change, LGWM, 2019
June 2020│ Status: FINAL│ Futuregoup ref: Golden Mile: Strategic Case FINAL
Page 33
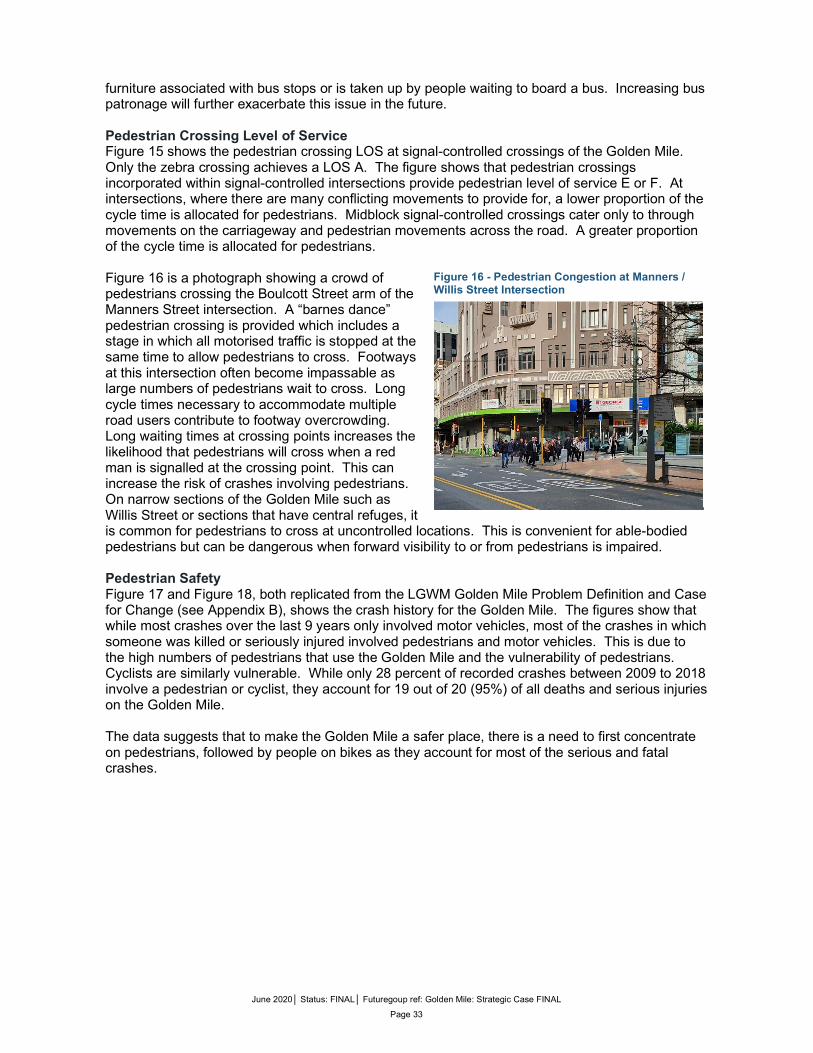
furniture associated with bus stops or is taken up by people waiting to board a bus. Increasing bus patronage will further exacerbate this issue in the future. Pedestrian Crossing Level of Service Figure 15 shows the pedestrian crossing LOS at signal-controlled crossings of the Golden Mile. Only the zebra crossing achieves a LOS A. The figure shows that pedestrian crossings incorporated within signal-controlled intersections provide pedestrian level of service E or F. At intersections, where there are many conflicting movements to provide for, a lower proportion of the cycle time is allocated for pedestrians. Midblock signal-controlled crossings cater only to through movements on the carriageway and pedestrian movements across the road. A greater proportion of the cycle time is allocated for pedestrians. Figure 16 is a photograph showing a crowd of pedestrians crossing the Boulcott Street arm of the Manners Street intersection. A “barnes dance” pedestrian crossing is provided which includes a stage in which all motorised traffic is stopped at the same time to allow pedestrians to cross. Footways at this intersection often become impassable as large numbers of pedestrians wait to cross. Long cycle times necessary to accommodate multiple road users contribute to footway overcrowding. Long waiting times at crossing points increases the likelihood that pedestrians will cross when a red man is signalled at the crossing point. This can increase the risk of crashes involving pedestrians. On narrow sections of the Golden Mile such as Willis Street or sections that have central refuges, it is common for pedestrians to cross at uncontrolled locations. This is convenient for able-bodied pedestrians but can be dangerous when forward visibility to or from pedestrians is impaired. Pedestrian Safety Figure 17 and Figure 18, both replicated from the LGWM Golden Mile Problem Definition and Case for Change (see Appendix B), shows the crash history for the Golden Mile. The figures show that while most crashes over the last 9 years only involved motor vehicles, most of the crashes in which someone was killed or seriously injured involved pedestrians and motor vehicles. This is due to the high numbers of pedestrians that use the Golden Mile and the vulnerability of pedestrians. Cyclists are similarly vulnerable. While only 28 percent of recorded crashes between 2009 to 2018 involve a pedestrian or cyclist, they account for 19 out of 20 (95%) of all deaths and serious injuries on the Golden Mile. The data suggests that to make the Golden Mile a safer place, there is a need to first concentrate on pedestrians, followed by people on bikes as they account for most of the serious and fatal crashes.
Figure 16 - Pedestrian Congestion at Manners / Willis Street Intersection

June 2020│ Status: FINAL│ Futuregoup ref: Golden Mile: Strategic Case FINAL
Page 34
Figure 17 – Reported Crashes on the Golden Mile 2009 - 2018
Figure 18 - Reported No. Crashes involving Pedestrians and a Vehicle (2000 - 2018)
Figure 19, below shows which streets pedestrian crashes have occurred in over the last 20 years. It shows significantly more pedestrian crashes occur on Courtenay Place. Further interogation of the data shows that 54% of crashes on Courtenay Place have historically occurred between 6:00pm and 6:00am at night. Just under 20% occur between 12:00am and 2:00am. If the late night and early morning crashes on Courtenay Place are disregarded, then Courtenay Place has a similar number of crashes to the other streets on the Golden Mile.

June 2020│ Status: FINAL│ Futuregoup ref: Golden Mile: Strategic Case FINAL
Page 35
Figure 19 - Pedestrian Crash History by Location and Severity 2000 - 2019
4.5. Street Layout Limits the Attractiveness of The Golden Mile as a Place in which to Spend Time and Move Through
This section provides evidence for the second problem statement shown in Figure 3. Pedestrian street audits applying the Health Street index found that the Golden Mile is well provided for in terms of shade, shelter, places to stop and rest. Attributes of the Golden Mile which were not scored as well were: feeling relaxed; air quality; interesting / things to see and do; and feeling safe.
Frustration and Anxiety Pedestrian overcrowding and long waiting times at crossings may contribute to feelings of frustration and anxiety. The proximity of footways to large moving buses may also impact on the ambience of the Golden Mile and the ability for people to feel relaxed within it. Poor Air Quality It was recently reported (Dominion Post 21F
22, 29 December 2019) that local air pollution on Lambton Quay and Courtenay Place was getting close to some of the most polluted areas in New Zealand despite accommodating around 10% of the traffic flows of the worst polluting roads. NIWA researcher Dr Ian Longley is quoted as saying that “most polluted areas in New Zealand were the places where there was lots of traffic with stop-start driving” and suggested that diesel buses would be contributing to the air pollution. The Air quality monitoring programme: Annual data report 2018, GWRC identifies that the three passive NO2 monitoring sites on the Golden Mile are some of the highest recorded in the region 22F
23. Feeling Unsafe Crime or the fear of crime influences the feeling of safety. The Golden Mile has also historically been a hotspot for crime, particularly in the evenings and on weekends. In 2012, 5753 reported crimes were on the Golden Mile, out of 16,627 across the city 23F
24. Sexual assaults, fights, thefts and
22 https://www.stuff.co.nz/dominion-post/news/wellington/118509781/diesel-vehicles-keeping-wellington-from-worldbeating-air-quality--niwa 23 https://www.gw.govt.nz/assets/Our-Environment/Environmental-monitoring/Environmental-Reporting/Air-quality-monitoring-programme-Annual-Data-Report-2018.pdf 24 http://www.stuff.co.nz/national/7530325/Crackdown-on-Wellingtons-Golden-Mile
0 10 20 30 40 50 60 70 80 90 100
Courtenay Place
Manners Street
Willis Street
Lambton Quay
Number of crashes
Pedestrian crashes by location and severity 2000 - 2019
Fatal Crash Serious Crash Minor Crash Non-injury Crash

June 2020│ Status: FINAL│ Futuregoup ref: Golden Mile: Strategic Case FINAL
Page 36
alcohol-fuelled disorder make up the large proportion of the incidents police attend in the central city between Parliament and the end of Courtenay Place. The number of crimes and the times of day when they occur differ according to the section of the Golden Mile. The 2014-2017 NZ Crime Maps show that most assaults in the central city occur in Courtenay Place area. In this area, there were around 1050 over three years, most of which occurred between 2am and 5am. In comparison, there was only 280 assault crimes reported in the Lambton Quay Area over the same period in the hours before midnight. Personal safety can be affected by the environment design. Where there are opportunities for concealment or poor sight lines (e.g. where people may be obscured by shrubs or other obstructions) this may contribute to people feeling unsafe. Other factors that influence feelings of safety include lack of passive surveillance, low levels of weekend and night time activity or drunk or otherwise chemically impaired people. Most of these factors apply to one or more parts of the Golden Mile at different times of the day.
Factors Affecting the Amenity of the Golden Mile
There have been several studies investigating the quality of the public realm in Wellington and along the Golden Mile. In 2004, Gehl Architects completed a study and more recently, a review was completed to inform the business case for investing in the Golden Mile. Some of Gehl Architects’ observations on the factors affecting the amenity of the Golden Mile were: pedestrian movements are not sufficiently prioritised compared with other traffic; lack of a coherent design for walking routes along the Golden Mile affected wayfinding; insufficient footway width on Lambton Quay; inadequate provision for disabled people; sandwich boards along the Golden Mile create visual and physical clutter; pedestrian waiting times at traffic lights are too long; there need to be more places to rest in squares and along streets at reasonable intervals; there needs to be a greater sense of pedestrian connection between Golden Mile and the
waterfront with streets providing visual connections and increased pedestrian priority; and there needs to be a greater sense of pedestrian connection between Lambton Quay and the
Parliamentary precinct.
Many of these suggestions would help to improve the experience of people using the Golden Mile. A more recent24F
25 review of the street environment identified similar issues that are limiting the attractiveness of the Golden Mile: insufficient space for pedestrians leads to overcrowding at busy times of the day; street clutter and footway reduces the useable space exacerbating overcrowding; bus stop waiting areas are overcrowded and uncomfortable; poor quality connections to, from and across the Golden Mile impacts on legibility; few public spaces within which to comfortably dwell; and poor amenity in public spaces that are provided.
Each of these factors reduces the attractiveness of the Golden Mile as a place within which to spend time and move through. Many of the factors that affect amenity of the Golden Mile also affect the attractiveness of walking and have been described in the preceding section (4.4). Opportunities to Improve Connectivity There are long standing aspirations to improve the connections between the Waterfront and the Golden Mile (refer to Central City Framework 2040 and Preliminary Place Movement Framework 2019). There are also opportunities to improve the quality and convenience of connections
25 Golden Mile Preliminary Analysis - Pedestrian Link + Place Qualities, FutureGroup, 2019

June 2020│ Status: FINAL│ Futuregoup ref: Golden Mile: Strategic Case FINAL
Page 37
between segments of the Golden Mile and the Terrace. Other opportunities include the connection between Lambton Quay and the Wellington Station via Stout Street. While the streets exist, the quality of the connectivity is variable in terms of the wayfinding, the comfort and ease of use. The best streets for connection to the Waterfront are Grey Street and Mercer Street (see Figure 20). The attractiveness of connections to and from the Golden Mile is also affected by the ease of crossing the road (Refer section 4.4, above). In some locations, there are clear pedestrian crossing desire lines that are not catered for. This can be seen in Figure 21 that shows one example of an unofficial crossing point on Lambton Quay close to Panama Street. The figure also shows strategically placed street furniture which suggest attempts have been made to discourage crossing at this location. This is likely to be because a pedestrian crossing from west to east would not be seen by any vehicle passing a bus stationary in the stop.
Figure 20 - Mercer St looking towards the Waterfront
Figure 21 - Unofficial Crossing Point
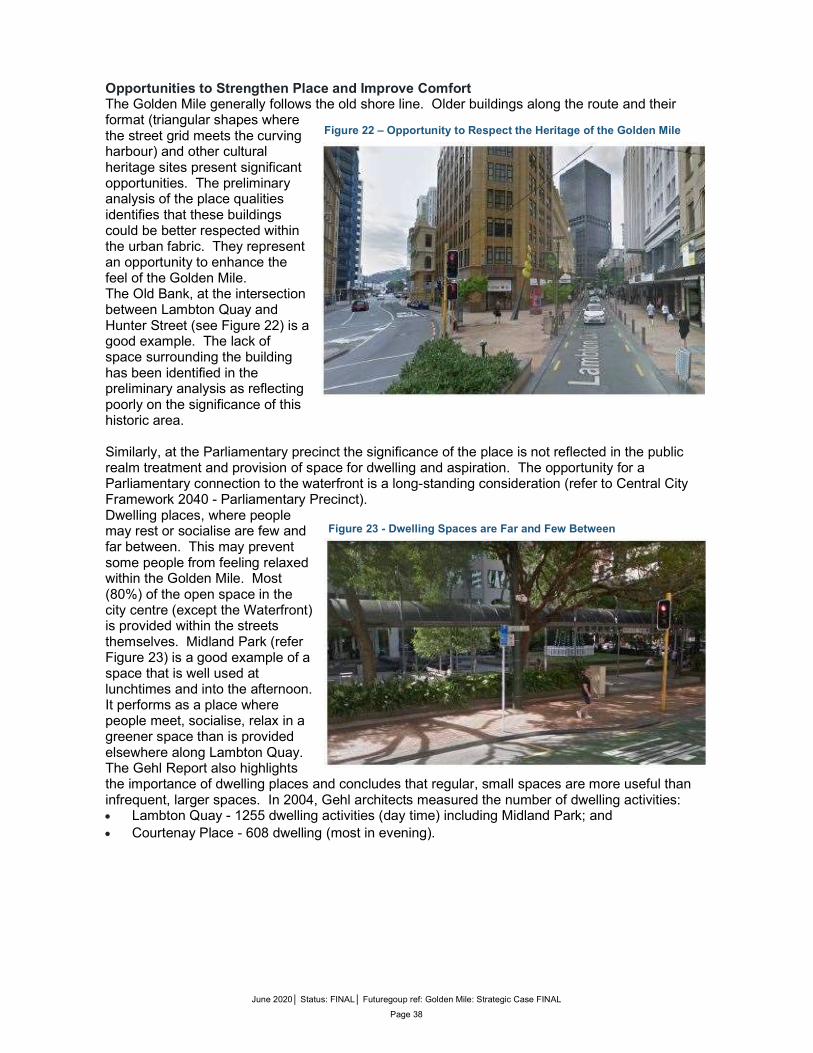
June 2020│ Status: FINAL│ Futuregoup ref: Golden Mile: Strategic Case FINAL
Page 38
Opportunities to Strengthen Place and Improve Comfort The Golden Mile generally follows the old shore line. Older buildings along the route and their format (triangular shapes where the street grid meets the curving harbour) and other cultural heritage sites present significant opportunities. The preliminary analysis of the place qualities identifies that these buildings could be better respected within the urban fabric. They represent an opportunity to enhance the feel of the Golden Mile. The Old Bank, at the intersection between Lambton Quay and Hunter Street (see Figure 22) is a good example. The lack of space surrounding the building has been identified in the preliminary analysis as reflecting poorly on the significance of this historic area. Similarly, at the Parliamentary precinct the significance of the place is not reflected in the public realm treatment and provision of space for dwelling and aspiration. The opportunity for a Parliamentary connection to the waterfront is a long-standing consideration (refer to Central City Framework 2040 - Parliamentary Precinct). Dwelling places, where people may rest or socialise are few and far between. This may prevent some people from feeling relaxed within the Golden Mile. Most (80%) of the open space in the city centre (except the Waterfront) is provided within the streets themselves. Midland Park (refer Figure 23) is a good example of a space that is well used at lunchtimes and into the afternoon. It performs as a place where people meet, socialise, relax in a greener space than is provided elsewhere along Lambton Quay. The Gehl Report also highlights the importance of dwelling places and concludes that regular, small spaces are more useful than infrequent, larger spaces. In 2004, Gehl architects measured the number of dwelling activities: Lambton Quay - 1255 dwelling activities (day time) including Midland Park; and Courtenay Place - 608 dwelling (most in evening).
Figure 22 – Opportunity to Respect the Heritage of the Golden Mile
Figure 23 - Dwelling Spaces are Far and Few Between

June 2020│ Status: FINAL│ Futuregoup ref: Golden Mile: Strategic Case FINAL
Page 39
Built Edge
The Golden Mile is generally framed by continuous building frontages. The quality of these frontage is influential to the experience for people within the street. Gehl’s 2004 report describes the condition along the Golden Mile as generally ‘Attractive or Pleasant (on a 5-step scale of Attractive to Unattractive). However, the edges of Te Aro Park and along the south side of Courtenay Place were seen to be Unattractive or Dull which still holds true today.
Careful investment in the public realm to enable movement outcomes can influence the response of private landowners to the street built edge. New public realm dwelling spaces should generally be developed only if there are built edges and ground levels uses that have the potential to respond to the space (such as at the Bond Street cul-de-sac shown in Figure 25).
Figure 25 - Potential for New Dwelling Space at End of Bond Street
Figure 24 - Example of Unattractive Built Edge near Te Aro Park

June 2020│ Status: FINAL│ Futuregoup ref: Golden Mile: Strategic Case FINAL
Page 40
4.6. Provision for People on Bikes in the Central City
The needs and provision for people on bikes and people that use e-scooters or other fast mobility vehicles are similar. Pedestrians travel more slowly and have different needs. E-scooters are not currently permitted to be ridden or parked on footways on the Golden Mile. They may be ridden on the carriageway on some sections of the Golden Mile. Within the Golden Mile, there is currently no road space allocated to people on bikes or users of fast mobility devices. Advance stop boxes are provided at signal-controlled intersections. Sharrow road markings25F
26 are also provided at some locations. Figure 26 shows the sections of the Golden Mile where bicycles or fast mobility devices are permitted to be used (blue arrows). While permitted to use general traffic lanes on Lambton Quay, Willis Street and Courtenay Place, cyclists and fast mobility devices are prohibited from using many of the bus lanes within the Golden Mile. The red lines in Figure 26 show the sections of the Golden Mile in which people are not permitted to cycle at any time. These prohibitions coincide with locations that have the least corridor width (i.e. Willis Street and Manners Street). Figure 17, in section 4.4, shows the reported crashes on the Golden Mile between 2009 and 2018. It shows that while only 28 percent of recorded crashes between 2009 to 2018 involve a pedestrian or someone on a bike, they account for 19 out of 20 (95%) of all deaths and serious injuries on the Golden Mile. The figure shows that pedestrians and people on bikes are more at risk than other road users. Whilst it is known that in general cyclists are more likely than motorists to be killed or seriously injured when they are involved in a crash, Figure 17 shows that, when compared with pedestrians, people on bikes are involved in fewer of the reported crashes (6%) on the Golden Mile and represent a
26 Sharrows are a road marking that seek to increase driver awareness that cyclists may be present. They can also be used to guide cyclists’ road position
Figure 26 - Restrictions on Cycling within the Golden Mile
Cycling Permitted
Cycling Restricted

June 2020│ Status: FINAL│ Futuregoup ref: Golden Mile: Strategic Case FINAL
Page 41
smaller proportion of the serious injuries (13%). Over the last 20 years there have been no deaths in a crash involving a cyclist on the Golden Mile. In part, the lower number of crashes involving people on bikes compared with pedestrians is likely to reflect the restrictions on cycling in parts of the Golden Mile. Figure 27 shows that over the last decade there have been fewer crashes involving cyclists on Willis and Manners Street, within which for much of their length cycling is restricted. Figure 27 - Golden Mile Cyclist Crash Nos by Location and Severity
There were no discernible trends in the manoeuvres associated with, or causation factors, for cycle crashes within the Golden Mile. Across the corridor, collisions with car doors, or vehicles manoeuvring to or from car parks, appeared as likely as crashes associated with people and other vehicles overtaking, turning or crossing the Golden Mile. Undoubtedly a reduction in conflicts with other road users in the Golden Mile would reduce the risk to people on bikes. The crash history does not however signal there is a “silver bullet” and careful design will be needed to address all the safety risks posed to people who cycle.
Riding Bikes in Bus Lanes and Bus Only Streets Can be Dangerous 26F
27, 27F
28
The relative safety of people riding bikes or using faster mobility devices in bus lanes and bus only streets is influenced by: the width of the bus lane or bus only street and the ability for buses and cyclists to pass each
other; the speed and volume of buses in the lane relative to traffic in any adjacent lane; and the provision of safe and direct facilities on alternative streets.
The UK government suggests that where roads are wide enough, bus lanes should be 4.25m wide or 4m as a preferred minimum. Bus lanes that are this wide allow buses to overtake cyclists safely and reduces the likelihood of interference from general traffic in the adjacent or opposing lane. Bus lanes that are narrower than 3.5m will mean that cyclists wishing to pass a stopped bus (~2.5m wide) will need to will need to leave the lane to pass and overtake. The flow and speed of traffic in an adjacent lane will determine the safety risk to cyclists associated with this manoeuvre. Sufficiently wide bus only streets and contraflow bus lanes can be safe for people on bikes if the junctions at either end remove or reduce conflicts. Between junctions the crash risk for people on bikes tends to be low if sufficient width is provided.
27 UK Department for Transport, Local Government and the Regions – Local Transport Note 1/97 – Keeping Buses Moving 28 UK Department for Transport, Local Transport Note 2/08 - Cycle Infrastructure Design
0 10 20 30 40 50 60 70 80 90 100
Courtenay Place
Manners Street
Willis Street
Lambton Quay
Cycle crashes by severity and location 2000-2019
Fatal Crash Serious Crash Minor Crash Non-injury Crash

June 2020│ Status: FINAL│ Futuregoup ref: Golden Mile: Strategic Case FINAL
Page 42
The width of Willis and Manners Streets means that to protect their safety, all road users are discouraged from crossing the centre of the road through the provission of the double yellow “no overtaking” centre line. Bus only lanes in these streets are approximately 3.3m to 3.4m wide which means that to pass each other, buses or cyclists must cross the centreline into the path of vehicles travelling in the opposite direction. The narrow overall carriageway width means that there is little space to avoid a collision should a bus driver or cyclist make a dangerous decision. For someone on a bike, such a mistake is likely to lead to serious injury if not death.
Interested but Concerned Cyclists will be Largely Accommodated on Parallel Corridors
Figure 28 shows the proposed central city cycling network. The network will be developed by the City Council as part of the City Streets programme. The network may be revised as costs, benefits and feasibility is better understood. It may also be influenced by projects such as MRT. The cycle network will be designed for the “interested but concerned”. This part of the community are people that may own a bicycle, would like to cycle, but are concerned about safety and do not feel comfortable riding in or close to traffic. This group can include beginner adults and younger children. Encouraging this group of people to ride bikes more is likely to involve full separation from motor vehicles if travelling along busier roads and traffic signals for crossing them. Figure 28 shows that: the cycle network crosses the
Golden Mile at Taranaki Street and Victoria Street;
Courtenay Place and a segment of Willis Street, both part of the Golden Mile, are part of the proposed central city cycle network; and
Dixon Street and Mercer Street connect to parts of the cycle network that correspond with the Golden Mile.
Philosophy for Accommodating Cyclists and Users of Faster Mobility Devices
Courtenay Place and parts of Willis Street are important components of the central city cycling network. Changes to these sections will seek to cater to the “interested but concerned”. On these streets the project will seek to enhance conditions (safety and comfort) for people on bikes. Mercer Street and Dixon Street also form part of the proposed central city cycling network. Changes to the Golden Mile will be designed to enable connections with these streets are safe and attractive for less confident cyclists. For other sections of the Golden Mile it is assumed that the “interested but concerned” will be accommodated on parallel routes. More confident cyclists will still be accomodated in parts of the Golden Mile that they are currently able to access. Where opportunities arise, conditions for people on bikes will be enhanced. This may not be possible in the narrower sections of the Golden Mile. For sections of the Golden Mile that do not correspond with the central city cycling network, providing enhancements for bus users and people that walk will take priority. As a minimum, the design will seek to maintain current levels of service and access for people on bikes. Changes to the Golden Mile must not increase the risk of death or serious injury for people on bikes.
Figure 28 - Planned Central City Cycling Network

June 2020│ Status: FINAL│ Futuregoup ref: Golden Mile: Strategic Case FINAL
Page 43
It is expected that some of the initiatives proposed to improve the movement of buses (such as reducing side friction, reducing / removing general traffic, reducing weaving) will improve cycling safety.
4.7. Root Cause Summary
The problems associated with travel on foot or by bus along and across the Golden Mile are: slow and unpredictable bus travel times reduce the attractiveness of travel by bus; inadequate provision for pedestrians along and across the golden mile reduces convenience
of walking; and street layout limits the attractiveness of the golden mile as a place in which to spend time and
move through.
Of the additional the additional time it takes buses to be driven along the Golden Mile, (relative to free flow), approximately 1/3 is attributable to bus stop dwell times, 1/3 to signal controlled intersections and 1/3 to various other factors such as interaction with other vehicles in the corridor. The table overleaf summarises the key issues for buses and active modes along the route.
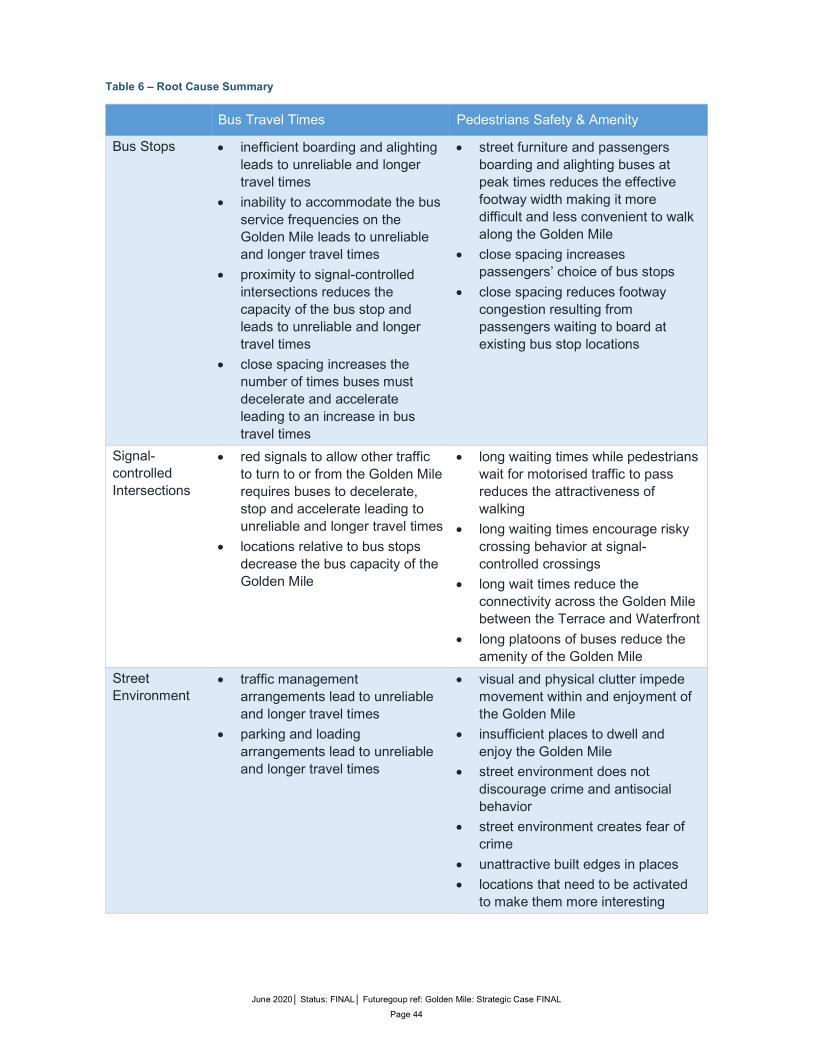
June 2020│ Status: FINAL│ Futuregoup ref: Golden Mile: Strategic Case FINAL
Page 44
Table 6 – Root Cause Summary
Bus Travel Times Pedestrians Safety & Amenity
Bus Stops inefficient boarding and alighting leads to unreliable and longer travel times
inability to accommodate the bus service frequencies on the Golden Mile leads to unreliable and longer travel times
proximity to signal-controlled intersections reduces the capacity of the bus stop and leads to unreliable and longer travel times
close spacing increases the number of times buses must decelerate and accelerate leading to an increase in bus travel times
street furniture and passengers boarding and alighting buses at peak times reduces the effective footway width making it more difficult and less convenient to walk along the Golden Mile
close spacing increases passengers’ choice of bus stops
close spacing reduces footway congestion resulting from passengers waiting to board at existing bus stop locations
Signal-controlled Intersections
red signals to allow other traffic to turn to or from the Golden Mile requires buses to decelerate, stop and accelerate leading to unreliable and longer travel times
locations relative to bus stops decrease the bus capacity of the Golden Mile
long waiting times while pedestrians wait for motorised traffic to pass reduces the attractiveness of walking
long waiting times encourage risky crossing behavior at signal-controlled crossings
long wait times reduce the connectivity across the Golden Mile between the Terrace and Waterfront
long platoons of buses reduce the amenity of the Golden Mile
Street Environment
traffic management arrangements lead to unreliable and longer travel times
parking and loading arrangements lead to unreliable and longer travel times
visual and physical clutter impede movement within and enjoyment of the Golden Mile
insufficient places to dwell and enjoy the Golden Mile
street environment does not discourage crime and antisocial behavior
street environment creates fear of crime
unattractive built edges in places
locations that need to be activated to make them more interesting

June 2020│ Status: FINAL│ Futuregoup ref: Golden Mile: Strategic Case FINAL
Page 45
5. Outcomes Sought This section identifies the outcomes sought from investment in the Golden Mile, how these outcomes may be measured and their alignment to the LGWM programme.
5.1. Outcomes and Key Performance Indicators
Table 7 lists the outcomes sought from investment in the Golden Mile and key performance indicators (KPIs) for each. Figure 29, overleaf is the investment logic map (ILM) which shows how the outcomes are linked to each problem that needs to be addressed. The KPIs listed in Table 7 were selected from the LGWM Monitoring Plan 28F
29. They are indicators for which LGWM have already established a baseline and committed to monitor. Table 7 – Outcomes Sought and Key Performance Indicators
Investment Benefit / Outcome Key Performance Indicator
Faster, more reliable bus system KPI 1: bus travel time reliability
KPI2: bus speeds
KPI3: system occupancy
KPI4: customer satisfaction
Improved pedestrian safety KPI 1: walking safety
Improved pedestrian convenience KPI 1: pedestrian flow
KPI 2: LOS walking
Increased amenity value KPI 1: amenity index
5.2. Golden Mile Investment Objectives
The project investment objectives are to: improve bus travel times and travel time reliability along the Golden Mile (40%); improve convenience and comfort of people waiting for, boarding and alighting buses along
the Golden Mile (15%); reduce the number of crashes within the Golden Mile that result in pedestrian injury (15%); increase the capacity for pedestrians to move through the corridor by improving walking LOS
along and across Golden Mile (15%); and improve the place quality of the Golden Mile (15%).
These objectives were chosen to be specific, measurable and attributable to any investment in the Golden Mile. As the options for achieving these objectives are developed, targets and delivery timetable will be identified. This will enable the objectives to become SMART 29F
30. The investment logic map (Figure 29) shows how the investment objectives relate to the problems to be addressed and outcomes sought from investing.
29 LGWM Programme Business Case, Appendix M – Monitoring Plan https://lgwm.nz/assets/Documents/Programme-Business-Case/APPENDIX-M-MONITORING-PLAN.PDF 30 SMART = Specific, Measurable, Attributable, Realistic and Timely

June 2020│ Status: FINAL│ Futuregoup ref: Golden Mile: Strategic Case FINAL
Page 46
Figure 29 – Investment Logic Map

June 2020│ Status: FINAL│ Futuregoup ref: Golden Mile: Strategic Case FINAL
Page 47
5.3. Alignment with Let’s Get Wellington Moving Programme
The Golden Mile project is part of the LGWM programme. It is therefore important that the project is well aligned to the programme. Table 8 shows the problems identified within the LGWM Programme that are common to the Golden Mile project. Table 9, overleaf, shows the alignment of the Golden Mile investment objectives with the LGWM programme objectives. The table shows the project is highly aligned with the project. Table 8 – Alignment of Problem Statements to LGWM Programme Business Case
Problems identified by the Let’s Get Wellington Moving Programme
Golden Mile Problems
Bu
s T
rav
el
Tim
es
Pro
vis
ion
fo
r P
ede
stri
an
s
Am
en
ity
CA
US
E
Growing demand for travel to, from, through and within the central city
Transport modes competing for limited space on constrained corridors
Cross-directional movements creating conflicts between movements and modes
EF
FE
CT
Poor and declining levels of service Increasing congestion and unreliable journey times Vulnerability to disruption from unplanned events
Safety issues especially for active modes
CO
NS
EQ
UE
NC
E
Reduced amenity (e.g. noise, pollution, and severance) for people living, visiting and working in the central city
Lack of transport system capacity, particularly on rail and bus services, constraining Wellington’s growth
Slower and less predictable travel time for journeys to, from, within and through the central city
Increase in disrupted journeys for people and freight and slower recovery
Deaths and serious injuries, especially for pedestrians and cyclists
Table 9 shows that the Golden Mile investment objectives are aligned to every programme objective except “is adaptable to disruptions and future uncertainty”. While this is not a project objective, it will be treated as an important consideration. This means that any proposed investment that is adaptable to change may be viewed more favourably than inflexible investment proposals. Other important considerations that can be used to evaluate improvement options are: ability to demonstrate tangible improvements within the 2018-21 / 2021-24 period; limit impact of implementation on businesses in the Golden Mile; and positive economic impact on businesses in the Golden Mile.

June 2020│ Status: FINAL│ Futuregoup ref: Golden Mile: Strategic Case FINAL
Page 48
Table 9 - Alignment of Golden Mile Investment Objectives with LGWM Programme Business Case
Golden Mile Investment Objective
Let’s Get Wellington Moving Objectives
Enh
ance
s th
e li
vea
bilit
y o
f th
e ce
ntra
l city
Pro
vid
es m
ore
eff
icie
nt a
nd
re
liabl
e a
cces
s to
su
ppo
rt
Re
duc
es r
elia
nce
on
pri
vate
ve
hicl
e t
rave
l
Impr
ove
s sa
fety
for
all
use
rs
Is a
dap
tab
le t
o d
isru
ptio
ns a
nd
futu
re u
nce
rta
inty
improve bus travel time reliability along the Golden Mile reduce average bus travel times along Golden Mile improve convenience and comfort of travel by bus reduce the number of crashes within the Golden Mile that result in pedestrian injury
increase the capacity for pedestrians to move through the corridor by improving walking LOS along and across Golden Mile
improve the place quality of the Golden Mile Option evaluation may also be guided by the community’s urban design and transport principles. The Golden Mile project is strongly linked to the City Streets initiative. Any changes to the cycling hierarchy that underpins the City Streets initiative are likley to impact on the Golden Mile project. While improved level of service for cyclists is not included as an investment objective for the Golden Mile, provision for cyclists is an important consideration. Provision for cyclists will also be treated as an important consideration when evaluating options. Key assumptions relating to cycling on the Golden Mile include: Courtenay Place is an important part of the city cycling network - cycling Level of Service
needs to be protected and enhanced in this section of the Golden Mile; and City Streets will deliver a northbound protected contraflow cycle lane on Featherston Street
(parallel to Lambton Quay). The Golden Mile project will seek to enhance cycling level of service on the Golden Mile, except where this is at the expense of pedestrian or bus level of service.
6. Partners and Stakeholders This section presents a summary of the stakeholder and community engagement that has been undertaken to date as part of developing the LGWM programme. It highlights the critical partners and stakeholders for the Golden Mile project and their interests in the project. A Golden Mile Communications and Stakeholder Engagement Plan includes a detailed analysis of stakeholders who have an interest in the Golden Mile project. The plan summarises their likely interest, as well as communication tools and activities that may be employed to effectively engage with them.
6.1. Engagement on the Let’s Get Wellington Moving Programme
When developing the programme, the LGWM team have worked with stakeholders to agree how they will be engaged as the programme is delivered. The LGWM team has engaged with stakeholders and the community several times since April 2016. Engagement activities have
June 2020│ Status: FINAL│ Futuregoup ref: Golden Mile: Strategic Case FINAL
Page 49
included market research, interactive workshops and public consultation. To date, most stakeholder and community engagement has focused on the overall programme. To this end, key feedback from stakeholder and community engagement undertaken to date includes: support for better public transport - now and long-term; universal support for less congestion; widespread support for walking and cycling improvements and priority; opposition to new infrastructure that encourages car use; a view that a regional, integrated approach is required; a view that it is time to act, while being mindful of cost; a view that future-proofed solutions are required; a view that basin traffic flow issues need to be solved, but diverse views are held; and a view that Wellington-specific solutions are required.
There is general support for the need to change the way people move about within Wellington. Much of the future engagement associated with the Golden Mile project will be focused on how change is designed and how to maximise the benefits for stakeholders and avoid or minimise any negative effects.
6.2. Partners and Stakeholders for the Golden Mile Project
Partners and stakeholders that have a particular interest in the outcomes for the Golden Mile include: Mana whenua –engagement with mana whenua will be informed by conversations currently
being held between iwi and LGWM as to how iwi wish to be engaged in the overall programme;
Utilities – changes to the Golden Mile may impact on utilities. Discussions with utilities will seek to understand any impacts and ensure they are taken into consideration;
Emergency Services – it is important to understand the needs of emergency services along the Golden Mile to ensure their ability to respond along or through the Golden Mile is protected;
Retailers along the Golden Mile – there are four distinct sections of the Golden Mile – Lambton Quay, Willis Street, Manners Street and Courtenay Place. Changes have the potential to affect their business or the way goods are delivered;
Road maintenance and operations providers – improvements can impact on how our roads are maintained and serviced. It is important to understand the implications for activities like road maintenance, refuse collection, and building servicing;
Bus operators – have a unique understanding of the issues that affect bus travel times and reliability. Their input is invaluable.
Living Streets Aotearoa – enabling a better understanding of how improvements can improve the safety and walkability of the Golden Mile for pedestrians;
Cycle Aware Wellington – enabling the project team to better understand how conditions for cyclists accessing the Golden Mile can be improved;
AA Wellington – providing insights on how improvements might be viewed by motorists; Taxi federation and Ride Sharing Services (Uber and Ola) – understanding how changes may
affect the provision of these services and the implications for customers and drivers; Couriers – understanding courier drop off requirements and usual routes to understand any
implications of change; Central City Interest Groups - in addition to retailers there are several organisations that
represent different business sectors, residential interests in the Golden Mile; Business owners and developers – several groups who have business interests in the
Golden Mile, such as, Argosy, First Retail Group and the Wellington Company Ltd; and CCS Disability Action – enabling a better understanding of how improvements can improve
the safety and accessibility of the Golden Mile for the mobility and sensory impaired.

June 2020│ Status: FINAL│ Futuregoup ref: Golden Mile: Strategic Case FINAL
Page 50
6.3. Approach to Golden Mile Engagement
Strategic approach
Meaningful engagement must be people focused. The project’s success is heavily dependent on the active participation and trust of Wellington’s diverse communities. People and communities will be put at the centre of the project’s engagement approach. Communication and engagement on the Golden Mile project will be guided by the integrated approach and principals outlined in the Early Delivery Programme Communications and Engagement Strategy.
Engagement approach
Engaging early with stakeholders will help to make the process transparent and inclusive. It will allow stakeholders to participate in the overall process and gradually build an understanding of the project, its benefits and any constraints. The project’s approach to public participation will reflect the core values of the International Association for Public Participation (IAP2). It will use the IAP2 public participation spectrum, aiming to inform, consult and involve stakeholders, where appropriate (refer to Figure 30). Figure 30 - IAP2 public participation spectrum
Communications and engagement action plans will be developed for specific engagement activities associated with discrete elements of the Golden Mile project.
6.4. 2019 Golden Mile Engagement
In late 2019 the LGWM team used an online map-based engagement tool, Social Pinpoint, to capture the comments, ideas and suggestions from the public on changes for the Golden Mile. Feedback was also sought from bus drivers. The engagement website had 10,686 visits from 3,475 unique users. 1,312 comments were received from 392 people. There were 279 contact form submissions, and 8 submissions from stakeholder groups/organisations. In total, 660 people gave feedback. In addition there were approximately 250 Golden Mile related comments posted on Facebook. From the feedback received, the most common suggestions were: Remove private vehicles from the Golden Mile entirely [around 240 or 25% of comments]; Remove private vehicles some of the time (e.g. peak only) [around 50 or 5% of comments]; Increased bus priority [around 130 or 13% of comments]; More cycle lanes [around 120 or 12% of comments]; Closure of streets adjacent to the Golden Mile and slip roads [around 90 or 9% of comments]; Remove bikes and e-scooters from Golden Mile footpaths [around 80 or 8% of comments];
and Reduce footpath overcrowding and footpath clutter [around 70 or 7% of comments].

AProblem Trajectories

June 2020│ Status: FINAL│ Futuregoup ref: Golden Mile: Strategic Case FINAL
Page 52

June 2020│ Status: FINAL│ Futuregoup ref: Golden Mile: Strategic Case FINAL
Page 53

June 2020│ Status: FINAL│ Futuregoup ref: Golden Mile: Strategic Case FINAL
Page 54

BGolden Mile Problem Definition and Case for Change

Problem Definition and Case for Change
June 2019

2
Golden Mile Improvements ...........................................................................................................................1
Executive Summary .........................................................................................................................................3
Part 1: The Context .........................................................................................................................................5
Part 2: Bus Levels of Service ...................................................................................................................... 16
Part 2: Pedestrian Levels of Service ......................................................................................................... 49
Part 3: Other uses ......................................................................................................................................... 62
Part 4: Problem definition .......................................................................................................................... 79

3
Wellington’s ‘Golden Mile’ plays a vital role in the success of Wellington’s transport system,
regional economy and sense of place. Transecting central Wellington, it provides the core
spine to the city’s bus network and enables thousands of people to access employment, do
business, shop, dine and access other central city destinations each day. It has the highest
pedestrian volumes in New Zealand, enabling connectivity and agglomeration that drives
Wellington’s productivity and vibrancy. Due to these critical functions, the Golden Mile must
perform at a high level, both as a transport asset that safely and efficiently moves people
and goods, and as an important place for people that is pleasant, safe and attractive.
Delivering a high level of service for people on buses and people walking is therefore a high
priority for the Golden Mile.
While people on buses and people walking represent the majority of users on the Golden
Mile, this is not reflected in the allocation of street space. People driving and parking are
allocated a disproportionate amount of space on the Golden Mile and represent a small
proportion of users.
Over 15,000 people use buses traveling on the Golden Mile each day. Golden Mile bus
stops provide easy access to a wide variety of central city destinations and the concentration
of bus services on the Golden Mile means that people can easily travel from the central city
to most suburbs of the city.
However, despite a high concentration of bus services on the Golden Mile, evidence
indicates that bus travel times are lengthy and bus capacity is limited. Slow services reduce
the attractiveness of buses as a transport mode and encourage people to choose alternative
transport modes, such as private vehicles, to ensure they can reliably reach their
destinations.
The Golden Mile plays a fundamental role in supporting the growth of the city. Over the next
thirty years, Wellington is projected to become home to 50,000-80,000 more residents. As
the population increases, the Golden Mile’s limited capacity to accommodate additional
buses will ultimately limit access to employment in the central city, adversely impacting the
regional economy.
The most influential factors on bus travel times on the Golden Mile are traffic signals and bus
stop spacing. Collectively, all signalised intersections along the Golden Mile increase travel
times by more than three minutes. The next most influential factor is the spacing of bus
stops along the route. On average, there is an average walking distance between stops of
3.5 minutes. While this provides a high level of accessibility for customers, it increases the
baseline bus travel times by about two minutes. Additionally, buses face delays from general
traffic travelling along and parking on the Golden Mile.
Over 20,000 people walk on the Golden Mile each day and in many ways, the Golden Mile
provides pedestrians with a comfortable and attractive street environment. A high density of
potential employment, retail, service and food/beverage destinations is on offer, as is
extensive active frontages, high quality paving, verandahs for shelter and street vegetation.

4
However, pedestrians also face less than ideal conditions that include congestion in some
mid-block sections and unacceptably high delays at traffic signals. High numbers of
pedestrians in areas with insufficient space reduces levels of service by reducing walking
speeds, limiting cross-flow movements, and making it difficult for certain segments of the
population, such as pedestrians with reduced mobility and adults with small children and
prams. In addition, the configuration of intersections with adjoining streets means that
pedestrians face significant delays when waiting to cross. Along the Golden Mile, at the
majority of intersections, pedestrians must wait for 20 seconds or more; this translates into a
level of service of E or F.
High volumes of both pedestrians and motor vehicles will create the potential for conflict on
any street. On the Golden Mile, pedestrian and motor vehicle conflict has resulted in several
pedestrian deaths and serious injuries in recent years.
Current conditions on the Golden Mile for people walking and people in buses are less than
ideal, reducing the attractiveness of buses as a transport mode and the attractiveness of the
Golden Mile as a place to be and walk around. Improvements to the Golden Mile can
substantially support sustainable transport modes, enable growth, and increase the
liveability of Wellington’s central city.

5
Background
Let’s Get Wellington Moving (LGWM) is a joint initiative between Wellington City Council,
Greater Wellington Regional Council, and the New Zealand Transport Agency. LGWM seeks
to deliver an integrated transport system that support the community’s aspirations for how
Wellington City will look, feel and function. The LGWM focus is the area from Ngauranga
Gorge to the airport, including the Wellington Urban Motorway and connections to the central
city, hospital, and the eastern and southern suburbs.
The Early Delivery workstream is tasked with developing and implementing components of
the LGWM programme that are capable of progressing in the short-term (up to five years),
ahead of the more complex components of the wider programme of investment.
The purpose of the Early Delivery workstream is to demonstrate to the community and our
stakeholders the direction of the wider programme and to pave the way for the larger
programme components that may be several years away from implementation.
LGWM Programme Objectives
Liveability – enhancing liveability in the central city
Access – providing more efficient and reliable access
Multimodal – reducing reliance on private vehicle travel
Safety – improving safety for all users
Resilience – Adapting to disruptions and future uncertainty
Our strategic approach
We’re focused on moving more people with fewer vehicles and encouraging urban
development alongside transport investment. Before doing anything else we will:
Find ways to get more out of the existing transport system and make it safer to use
Encourage people to walk, use public transport, and cycle for more trips, and make
fewer trips by car
We will do this by delivering on our strategic interventions:
Encourage mode shift to walking, cycling, and public transport
Enable mode shift with key changes to walking, cycling and public transport
infrastructure, and land use policies
Create dedicated/priority routes to support key changes
Reduce road space for general traffic on dedicated/priority routes
Manage the network to limit increases in general traffic and operate the network
safely and efficiently
Relocate general traffic away from the central city to an improved bypass route
The Golden Mile project is one of the Early Delivery projects. Improvements to the Golden
Mile can make bus travel, walking and cycling more attractive, and can also enhance the
liveability of the central city..
6
The Golden Mile
The importance of the Golden Mile to the city and region
The central city is an area characterised by a mix of residential, commercial, retail and
education activities. It is the primary location of jobs within the city and the wider region. It is
a key regional hub for retail, entertainment, and food/beverage services. The central city has
the fastest growing population of any part of the city. The population grew from 7,000
residents in 1990 to 21,000 in 2013 and is expected to continue to grow substantially. The
Golden Mile is at the heart of the central city’s activity. It is the core bus route in the city, has
the highest levels of pedestrians in New Zealand, and is the focus of retail, entertainment,
and employment activity in the city. Due to these factors, delivering a high level of service on
the Golden Mile for people on buses and people walking is a high priority.
The role of the Golden Mile in the LGWM programme
The LGWM programme recommends that to cater for growth, the transport system needs to
move more people with fewer vehicles coming into the central city. For short distance, this
means making it easier for people to walk or cycle. For longer distance, the main way to
achieve this will be through increasing the numbers of people travelling by public transport. A
step change in public transport will require a significant increase in public transport capacity.
To ensure that public transport provides an attractive travel choice, services will need to be
more reliable and this will require increased priority on congested parts of the network,
particularly in the central city. Two dedicated public transport spine routes are recommended
through the CBD - Golden Mile and Waterfront - with high levels of priority and segregation.
In addition to enabling mode shift, the LGWM programme also aims to enhance the
liveability of the central city. This involves improving the walkability and amenity of places
and streets for residents, businesses, workers and visitors. Improving pedestrian level of
service along the Golden Mile and designing any physical changes to deliver high quality
places are core components of the LGWM programme. Other ways to improve street level
amenity along the Golden Mile include reducing general traffic levels, reducing transport-
related noise and air pollution, and making the Golden Mile safer and more pleasant for
people.
The Golden Mile in detail
The Golden Mile can be broadly divided into four areas based on street layouts and
surrounding land uses: Lambton Quay, Willis Street, Manners Street, and Courtenay Place
(Figure 1). Street design and usage are outlined for representative sections of these four
areas.

7
Figure 1: Golden Mile sections
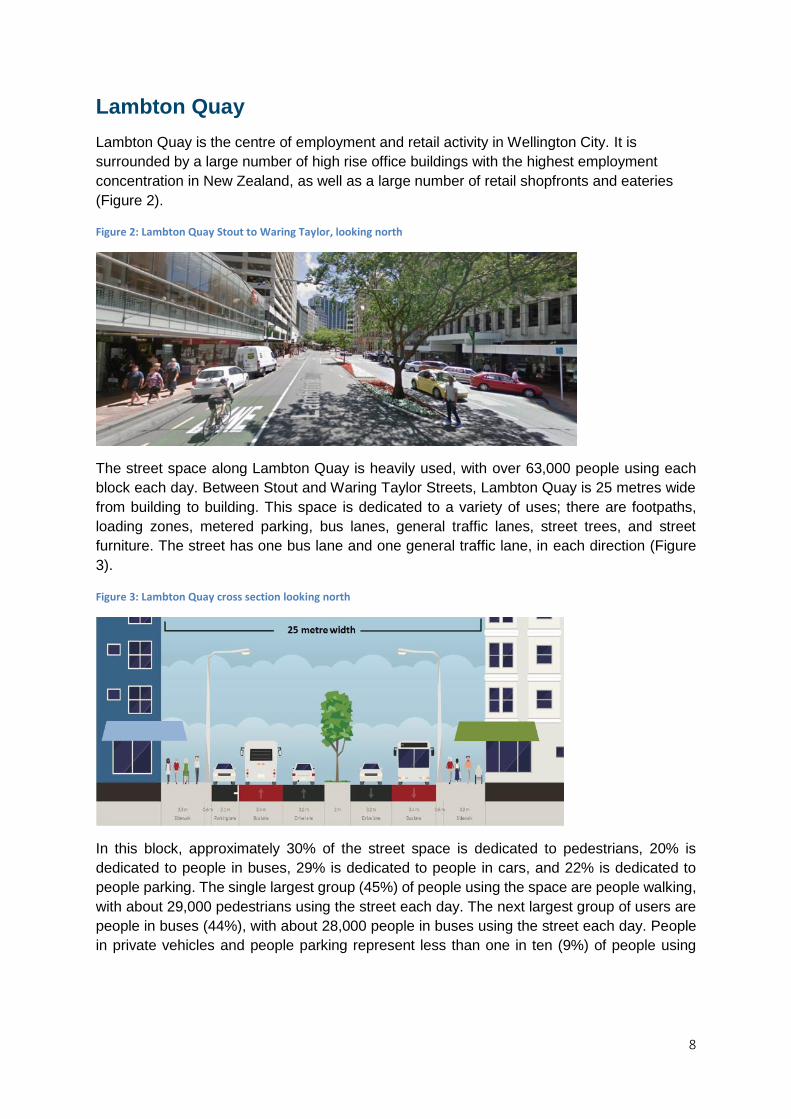
8
Lambton Quay
Lambton Quay is the centre of employment and retail activity in Wellington City. It is
surrounded by a large number of high rise office buildings with the highest employment
concentration in New Zealand, as well as a large number of retail shopfronts and eateries
(Figure 2).
Figure 2: Lambton Quay Stout to Waring Taylor, looking north
The street space along Lambton Quay is heavily used, with over 63,000 people using each
block each day. Between Stout and Waring Taylor Streets, Lambton Quay is 25 metres wide
from building to building. This space is dedicated to a variety of uses; there are footpaths,
loading zones, metered parking, bus lanes, general traffic lanes, street trees, and street
furniture. The street has one bus lane and one general traffic lane, in each direction (Figure
3).
Figure 3: Lambton Quay cross section looking north
In this block, approximately 30% of the street space is dedicated to pedestrians, 20% is
dedicated to people in buses, 29% is dedicated to people in cars, and 22% is dedicated to
people parking. The single largest group (45%) of people using the space are people walking,
with about 29,000 pedestrians using the street each day. The next largest group of users are
people in buses (44%), with about 28,000 people in buses using the street each day. People
in private vehicles and people parking represent less than one in ten (9%) of people using

9
Lambton Quay, with around 6100 people in private vehicles using the street each day1 (Figure
4).
Figure 4: Current users of space on Lambton Quay, looking north
1 For the purposes of these counts, daily movements reflect travel from 6:00am to 7:00pm, as this is the timeframe for which there is data available for all travel modes.
30%
45%
20%
44%
29%
8%
22%Allocation of space
Percent of users
Northbound Southbound

10
Willis Street
Willis Street is a busy hub of employment and retail activity. It is surrounded by a large
number of high rise office buildings, as well as retail shopfronts and eateries (Figure 5).
Figure 5: Willis St Boulcott to Mercer, looking north
The street space along Willis Street is the busiest section of the Golden Mile, with just under
70,000 people in each block each day. Between Boulcott and Mercer Streets, Willis Street is
18 metres wide from building to building. This space is dedicated to a variety of uses; there
are footpaths, bus lanes, general traffic lanes, street trees, and street furniture. The street has
one ‘bus only’ lane going southbound and has one general traffic lane going northbound
(Figure 6).
Figure 6: Willis St cross section looking north
In this block, approximately 40% of the street space is dedicated to pedestrians, 20% is
dedicated to people in buses, and 40% is dedicated to people in cars. The single largest group
(45%) of people using the space are people walking, with about 31,500 pedestrians using the
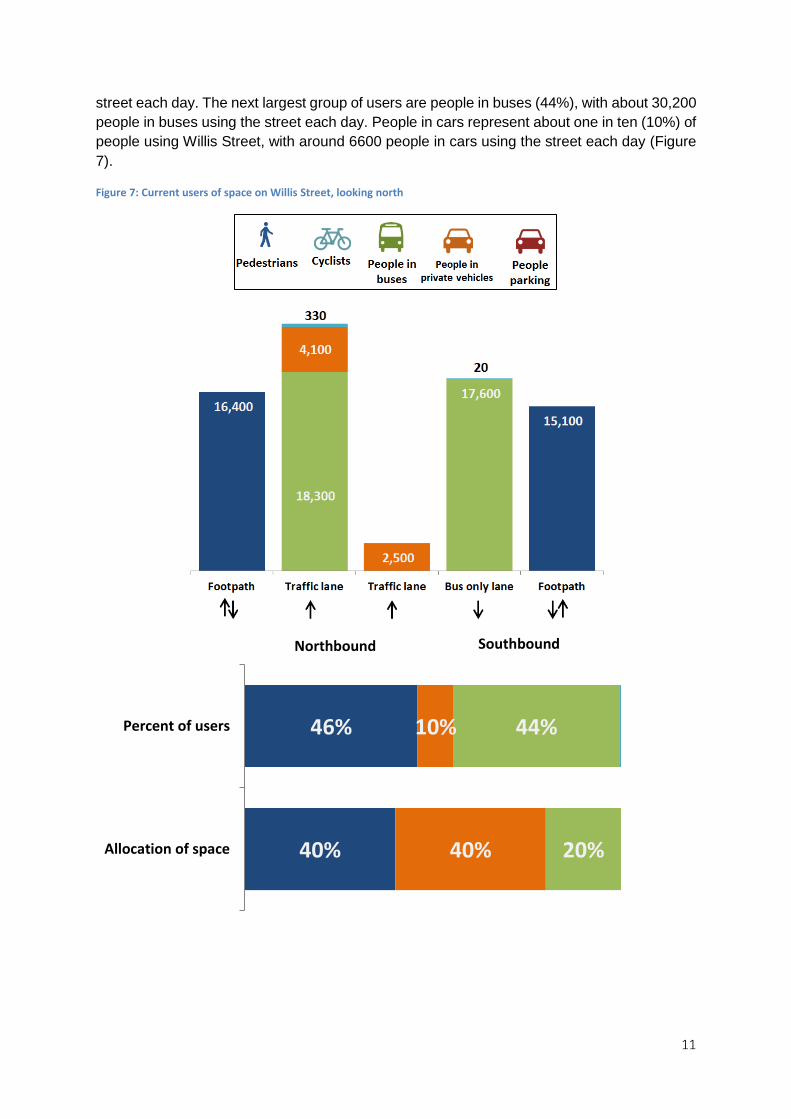
11
street each day. The next largest group of users are people in buses (44%), with about 30,200
people in buses using the street each day. People in cars represent about one in ten (10%) of
people using Willis Street, with around 6600 people in cars using the street each day (Figure
7).
Figure 7: Current users of space on Willis Street, looking north
40%
46%
40%
10%
20%
44%
Allocation of space
Percent of users
Northbound Southbound
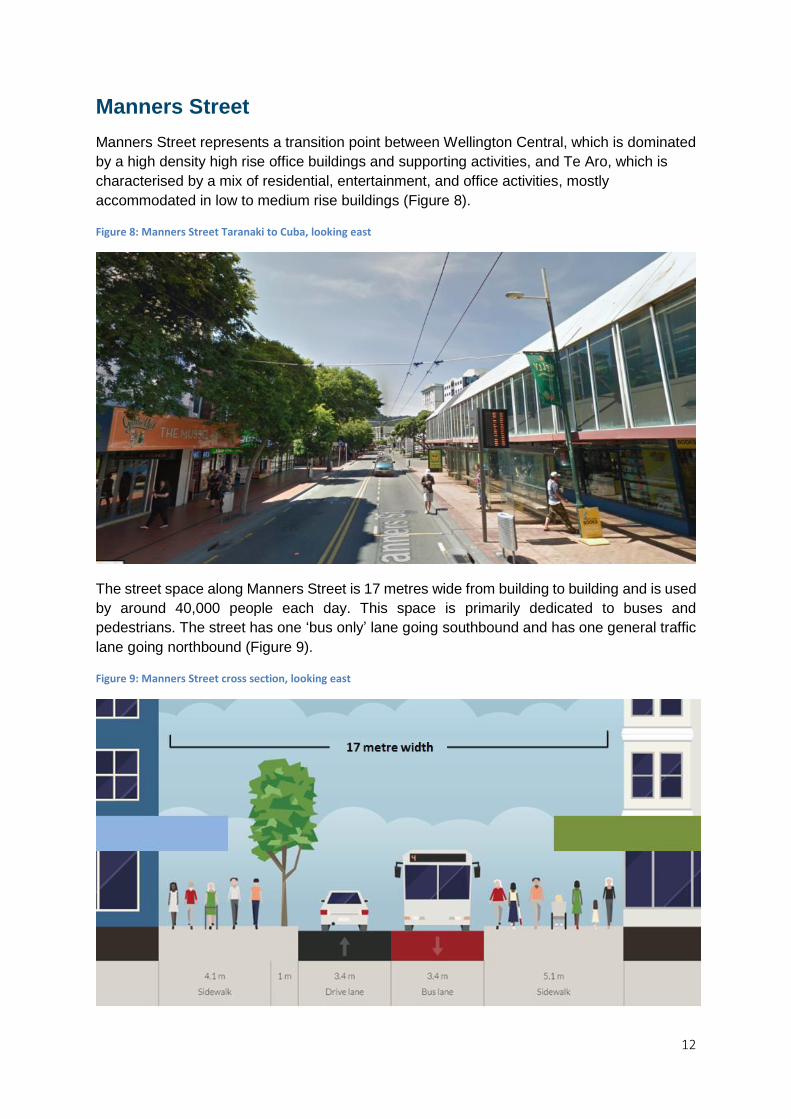
12
Manners Street
Manners Street represents a transition point between Wellington Central, which is dominated
by a high density high rise office buildings and supporting activities, and Te Aro, which is
characterised by a mix of residential, entertainment, and office activities, mostly
accommodated in low to medium rise buildings (Figure 8).
Figure 8: Manners Street Taranaki to Cuba, looking east
The street space along Manners Street is 17 metres wide from building to building and is used
by around 40,000 people each day. This space is primarily dedicated to buses and
pedestrians. The street has one ‘bus only’ lane going southbound and has one general traffic
lane going northbound (Figure 9).
Figure 9: Manners Street cross section, looking east

13
Approximately 60% of the street space is dedicated to pedestrians, 20% is dedicated to people
in buses, and 20% is for general traffic. About two thirds (66%) of people using the space are
people in buses, with around 26,000 people in buses using the street each day. The next
largest group of users are pedestrians (32%), with around 13,000 pedestrians using the street
each day. People in cars represent less than one in 50 (1.7%) of people using Manners Street,
with around 700 people in cars using the street each day (Figure 10).
Figure 10: Current users of space on Manners Street, looking east
60%
31%
20%
67%
20%
2%
Allocation of space
Percent of users
Eastbound Westbound
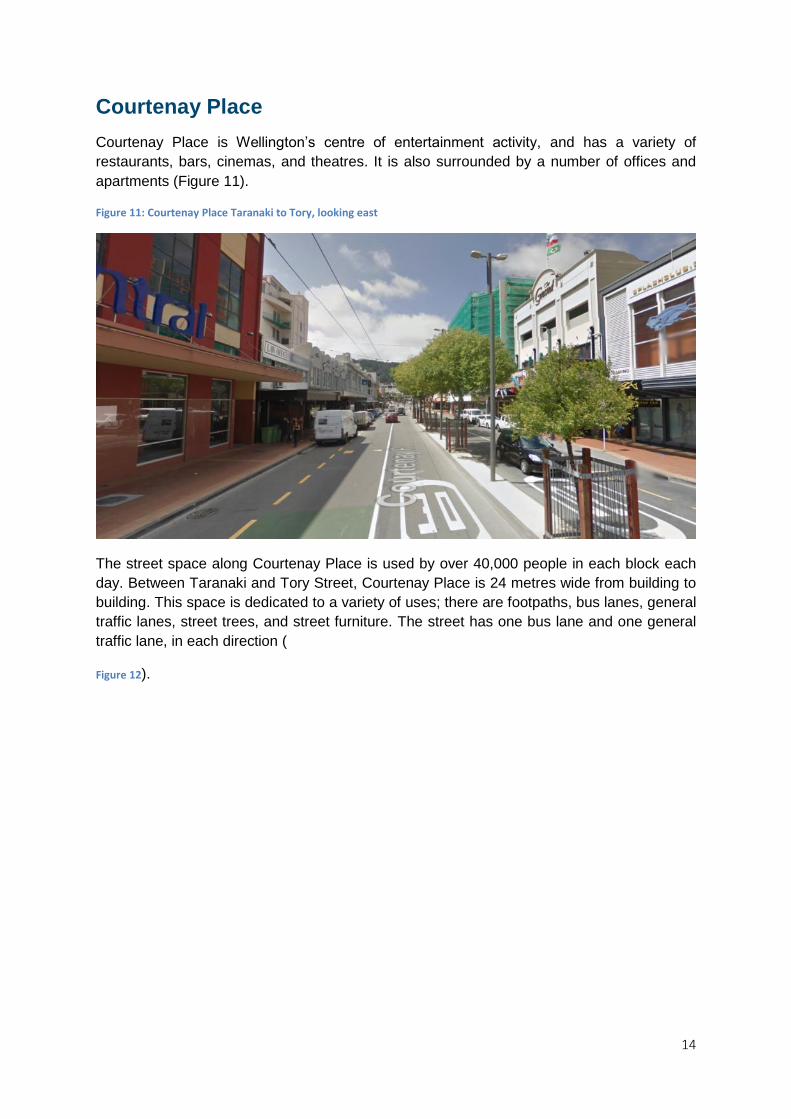
14
Courtenay Place
Courtenay Place is Wellington’s centre of entertainment activity, and has a variety of
restaurants, bars, cinemas, and theatres. It is also surrounded by a number of offices and
apartments (Figure 11).
Figure 11: Courtenay Place Taranaki to Tory, looking east
The street space along Courtenay Place is used by over 40,000 people in each block each
day. Between Taranaki and Tory Street, Courtenay Place is 24 metres wide from building to
building. This space is dedicated to a variety of uses; there are footpaths, bus lanes, general
traffic lanes, street trees, and street furniture. The street has one bus lane and one general
traffic lane, in each direction (
Figure 12).

15
Figure 12: Courtenay place cross section, looking east
In this block, approximately 34% of the street space is dedicated to pedestrians, 24% is
dedicated to people in buses, and 42% is dedicated to people in cars and people parking. The
largest group (48%) of people using the space are people in buses, with about 20,400 people
in buses using the street each day. The next largest group of users are pedestrians (31%),
with around 13,000 pedestrians using the street each day. People in cars and people parking
represent one in five (20%) of people using Courtenay Place, with around 8600 people in cars
using the street each day (Figure 13).
Figure 13: Current users of space on Courtenay Place, looking east

16
Wellington’s City to Waterfront Study
In 2004, Gehl Architects’ completed a report investigating the quality of the urban realm in
Wellington. It focused on the pedestrian experience on the Golden Mile, the waterfront, and
the streets connecting these areas. The report made several recommendations relevant to
the Golden Mile:
Limit the Golden Mile to pedestrian and bus traffic only
Stepping up pedestrian priority
Develop a distinct coherent design for walking routes, especially the Golden Mile
Provide wider footpaths and improved disabled access on central city streets including Lambton Quay
34%
31%
24%
48%
24%
20%
19%Allocation of space
Percent of users
Eastbound Westbound
17
Remove sandwich boards from streets to reduce visual and physical clutter
Create good walking routes with few interruptions and short waiting times at traffic lights
Provide places to rest in squares and along streets at reasonable intervals.
Introduce pedestrian priority streets
Take footpaths across under-used side streets and delivery lanes in main streets
Improve the connection from the Golden Mile to the waterfront with streets providing visual connections and increased pedestrian priority
Improve the connection from Lambton Quay to the Parliamentary precinct
Ensure more attractive and lively street frontages
Integrate the Parliamentary Precinct with the city
Previous Actions Taken
A number of actions have been taken over the last two decades to improve the levels of
service for pedestrians and buses on the Golden Mile. These changes have delivered safety,
pedestrian amenity and bus priority improvements.
In the late 1980s the Willis/Victoria one way system was implemented with the first bus lanes
installed on Lambton Quay and Willis Street which allowed buses to keep to their traditional
route through the CBD. In 2006 the Lambton Quay section of the Golden Mile was
designated as 30 km/h. In 2008 the construction of the Courtenay Place Park removed
parking spaces and roadway, and replaced it with a pedestrian plaza. The 30 km/h speed
zone was extended along Willis Street, Manners Street and Courtenay Place in 2010.
A number of actions have been taken in recent years to improve bus levels of service on the
Golden Mile. Bus and bus only lanes have progressively been added to segments of the
route. The restoring the Golden Mile project was designed to restore the central city bus
route back on to Manners Street/Manners Mall where it had been when trams were
operating. This project also installed traffic signals on three pedestrian crossings in
Courtenay Place which limit the delay faced to buses from pedestrians crossing the route.
In 2012, a pedestrian crash reduction study was completed for Wellington City Council. The
study analysed crash rates, identified issues, and proposed possible treatments. Safety
improvements on the Golden Mile have included pedestrian countdown timers, introduction
of barriers and street furniture to prevent pedestrians from crossing in high risk areas, and
advisory signs. Pedestrian safety and levels of service have been improved with additional
crossing points and reduced wait times at signals for pedestrians.
People in buses make up a large portion of travellers using the Golden Mile. The design of
the city’s bus network means most bus routes travel along the Golden Mile. This bus
network is critical to supporting the central city as the economic hub of the region because it

18
enables thousands of people to commute into the central city each day. This level of
connectivity could not easily be provided by other modes because there is not enough space
in the central city to accommodate more private vehicles and because walking and cycling
are not viable modes for people commuting to the central city from more distant locations.
Improving bus levels of service will support patronage growth and improve accessibility to
the central city.
This section of the report investigates the possible causes of bus delay along the Golden
Mile and assesses the bus capacity of the route. Travel times along the Golden Mile are
influenced by mixing with general traffic, bus stop spacing, dwell times, delays due to traffic
signals and right-turning traffic, stop operations, and interferences between buses operating
in the lane.

19
Passenger volumes
Error! Not a valid bookmark self-reference. shows average daily weekday bus passenger
volumes on streets in the central city. It shows that the Golden Mile forms the central spine of
Wellington City’s bus system and facilitates around 30,000 bus trips per day. Willis Street and
Lambton Quay have the highest number of bus passengers, as these streets are used by all
bus routes that go through the central city.
Figure 14: Daily weekday bus passenger volumes

20
Travel times
Travel times and speeds fluctuate considerably across segments of the Golden Mile due to
variable street layouts and bus operating conditions. Figure 15 shows the average bus speeds
between bus stops on the Golden Mile, a distance of 2.3km. Along the whole route, buses
have an average speed of 10.1 km/h2. The two worst performing segments are Lambton North
to Station, with an average speed of 5 km/h, and Manners Cuba to Manners Willis, with an
average speed of 7.4 km/h. The two best performing sections are Grand Arcade to Cable Car,
with an average speed of 13.8 km/h and Wellington Station to Lambton Quay North, with an
average speed of 12.6 km/h.
Figure 15: Average bus speeds between stops (km/h)
2 Estimated using 4120 journeys from 1/09/2018 to 31/10/2018 on the number 1 route.
Min Max Key5 7
7 9
9 11
11 13
13 15

21
Travel times on the Golden Mile vary by time of day and from bus to bus. Figure 16 shows
average northbound bus travel times from one end of the Golden Mile to the other by time of
day. Across the day, it takes an average of 14.9 minutes for a bus to travel northbound on the
Golden Mile, with two thirds of bus journeys within 2.2 minutes of this average. Travel speeds
are fastest from 6:00-7:00am (12 minutes on average) and are slowest from 4:00-6:00pm (17
minutes on average).
Figure 17 shows average southbound bus travel times from one end of the Golden Mile to the
other by time of day. Across the day, it takes an average of 13.5 minutes for a bus to travel
southbound on the Golden Mile, with two thirds of bus journeys within 2 minutes of this
average. Travel speeds are fastest from 6:00-7:00am and 11:00pm-12:00am (less than 11
minutes on average) and are slowest from 4:00-6:00pm (15 minutes or longer).
Figure 16: Northbound travel times on Golden Mile by time of day (average and standard deviation)
0
2
4
6
8
10
12
14
16
18
20
Tim
e (
min
ute
s)

22
Figure 17: Southbound travel times on Golden Mile by time of day (average and standard deviation)
Stop Spacing
Stop spacing, along with speed limit, are the main determinants of baseline bus travel speed
i.e. the travel speed a bus would experience if there were no delays from other sources such
as traffic signals. Each bus stop decreases the baseline travel speed because a bus loses
time decelerating before the stop, pulling into the bus stop, and accelerating after the stop.
Furthermore, when stops are very close together, a bus may be unable to reach the
maximum allowed speed before it has to decelerate again for the next stop. Therefore, the
choice of speed limit and stop spacing together determine the baseline travel times
achievable along a bus route.
Determining optimal bus stop spacing requires striking a balance between walking distances
to bus stops, which reduces walking time for passengers, and stop spacing to maximise bus
speeds, which reduced travel times on the bus for passengers. While it reduces bus speeds,
more frequent bus stops increases accessibility to public transport services and reduces
walking times for passengers.
Greater Wellington Regional Council currently has a target of maximising the number of
people within a 5 minute walk of a bus stop as a key performance indicator of the bus
network. This is in alignment with studies that have demonstrated that a stop spacing of 400
metres (about a 5 minute walk) maximises benefits and minimises costs.
However, given the high density of destinations along the Golden Mile, it may be more
appropriate in this environment to aim for a lower target walking time to bus stops,
0.0
2.0
4.0
6.0
8.0
10.0
12.0
14.0
16.0
18.0
20.0
Tim
e (
min
ute
s)

23
somewhere in the range of two to four minute walking catchments. When examining stop
spacing on the Golden Mile, it is also necessary to give consideration to the queuing area
capacity of the footpath by location, given the very high number of boardings at linear bus
stops.
With a best practice 400 metre stop spacing, there would be a need for five stops along the
Golden Mile. Using a 400 metre stop spacing would allow for a baseline travel time
northbound of 5.7 minutes and a baseline southbound travel time of 5.3 minutes.
There are currently nine northbound bus stops on the Golden Mile, with an average stop
spacing of 244 meters and an average walking time between stops of 3.33 minutes (Figure
18). Current stop spacing allows for a baseline travel time of 7.4 minutes for buses traveling
northbound on the Golden Mile4.
There are currently eight southbound bus stops on the Golden Mile, with an average stop
spacing of 286 meters and an average walking time between stops of 3.9 minutes (Figure 18).
Current stop spacing allows for a baseline travel time of 7.3 minutes for buses traveling
southbound on the Golden Mile.
Figure 18: Bus stop spacing along the Golden Mile
Figure 20 shows the 3 minute walking catchments of northbound bus stops on the Golden
Mile. It shows that the current bus stop spacing allows easy access to a Golden Mile bus
stop for a sizeable portion of the central city. It also shows that due to stops being close
together, 3 minute walking catchments often overlap with one another. This means that for
people within the direct vicinity of the Golden Mile, the actual time to walk to a bus stop is
considerably less than 3 minutes. The catchment of the Cable Car stop is fully overlapping
with the catchments of the two adjacent stops, suggesting that if the stop was removed the
3 This assumes an average walking speed of 1.4 meters per second. 4 This assumes an average acceleration rate of 0.85 meters per second and an average deceleration rate of 1.2 meters per second and a minumum dwell time of 10 seconds.

24
same number of people would be within a 3 minute walk of a northbound bus stop. There is
potential for two or more stops to be removed without substantially reducing the number of
people along the Golden Mile within 3 minutes of a bus stop, as shown in .
Figure 21 shows the 5 minute walking catchments of northbound bus stops on the Golden
Mile. It shows that the current bus stop spacing allows easy access to a Golden Mile bus stop
for most of Lambton and sizeable parts of Thorndon and Te Aro. It also shows that due to
stops being close together, 5 minute walking catchments overlap significantly with one
another, with most locations on the Golden Mile being within a 5 minute walk of three or more
bus stops. Up to four bus stops could be removed without reducing the number of people
within a 5 minute walking catchment of a Golden Mile bus stop, as shown in Figure 22.
Bus stop spacing plays a key role in determining bus travel times. Bus stops are placed
relatively close together on the Golden Mile, increasing journey times by 1 to 2 minutes for
passengers. Increasing stop spacing on bus routes can improve journey times.
Considerations for bus stop spacing needs to strike a balance between bus speeds and
walking time to stops, while also taking account of other factors, such as bus loading zone
capacity and bus boarding area capacity. It is also important to note that reducing the
number of bus stops with an exceptionally high number of boarding and alighting
passengers may only moderately reduce overall travel times. Displaced passengers will use
adjacent stops which may lead to longer dwell times at nearby stops. This may result in bus
stop overcrowding and increased bus-bus congestion.

25
Figure 20: Current Northbound Bus Stop 3 Minute Walking Catchments Figure 19: Possible Northbound 3 minute walking catchments

26
Figure 21: Current Northbound Bus Stop 5 Minute Walking Catchments
Figure 22: Possible Northbound 5 minute walking catchments
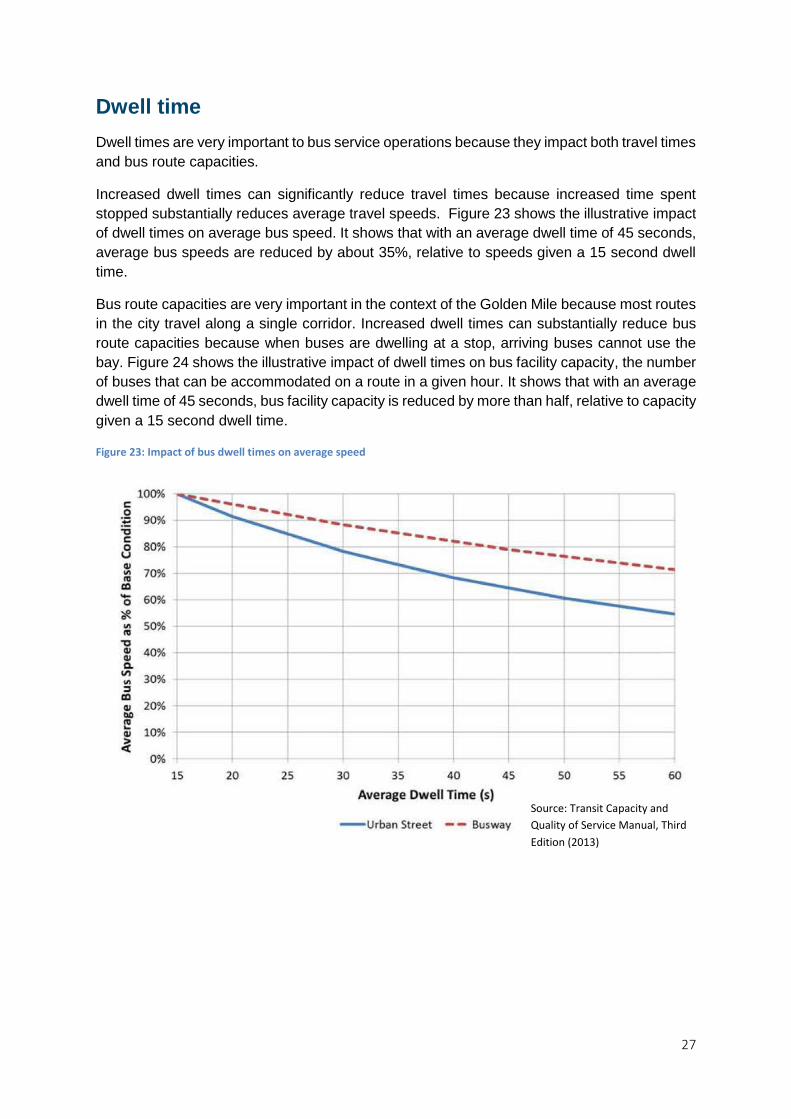
27
Dwell time
Dwell times are very important to bus service operations because they impact both travel times
and bus route capacities.
Increased dwell times can significantly reduce travel times because increased time spent
stopped substantially reduces average travel speeds. Figure 23 shows the illustrative impact
of dwell times on average bus speed. It shows that with an average dwell time of 45 seconds,
average bus speeds are reduced by about 35%, relative to speeds given a 15 second dwell
time.
Bus route capacities are very important in the context of the Golden Mile because most routes
in the city travel along a single corridor. Increased dwell times can substantially reduce bus
route capacities because when buses are dwelling at a stop, arriving buses cannot use the
bay. Figure 24 shows the illustrative impact of dwell times on bus facility capacity, the number
of buses that can be accommodated on a route in a given hour. It shows that with an average
dwell time of 45 seconds, bus facility capacity is reduced by more than half, relative to capacity
given a 15 second dwell time.
Figure 23: Impact of bus dwell times on average speed
Source: Transit Capacity and
Quality of Service Manual, Third
Edition (2013)
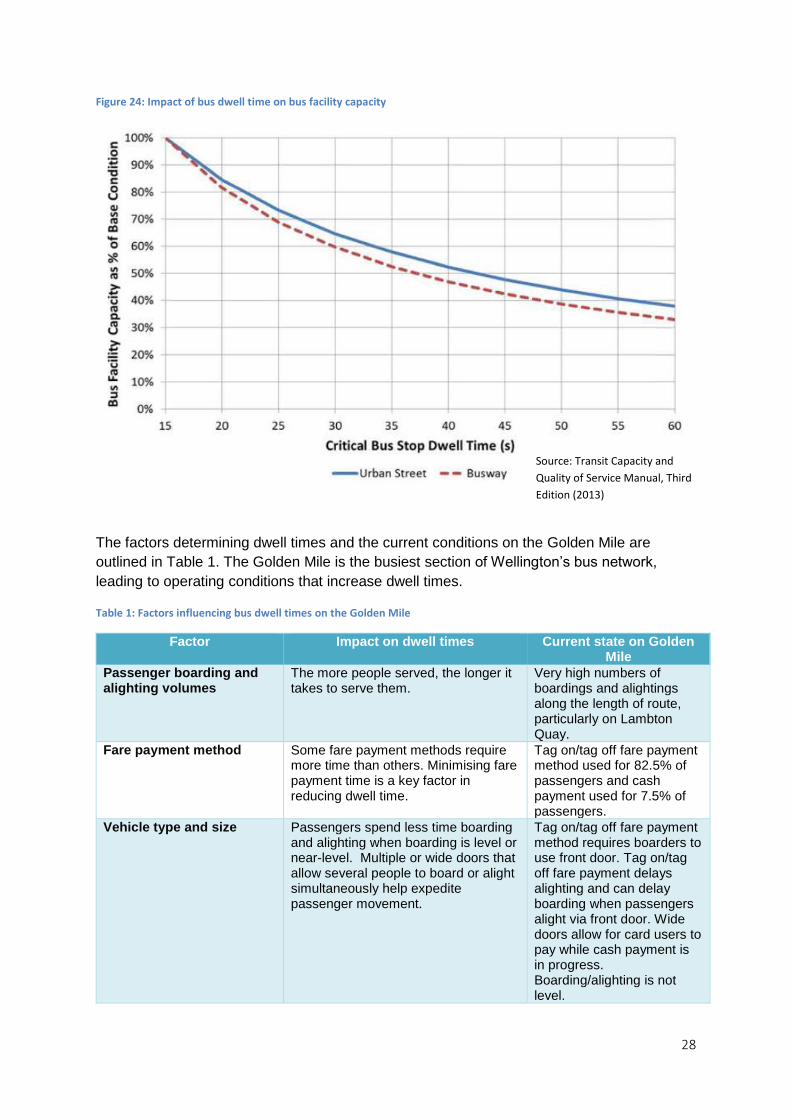
28
Figure 24: Impact of bus dwell time on bus facility capacity
The factors determining dwell times and the current conditions on the Golden Mile are
outlined in Table 1. The Golden Mile is the busiest section of Wellington’s bus network,
leading to operating conditions that increase dwell times.
Table 1: Factors influencing bus dwell times on the Golden Mile
Factor Impact on dwell times Current state on Golden Mile
Passenger boarding and alighting volumes
The more people served, the longer it takes to serve them.
Very high numbers of boardings and alightings along the length of route, particularly on Lambton Quay.
Fare payment method Some fare payment methods require more time than others. Minimising fare payment time is a key factor in reducing dwell time.
Tag on/tag off fare payment method used for 82.5% of passengers and cash payment used for 7.5% of passengers.
Vehicle type and size Passengers spend less time boarding and alighting when boarding is level or near-level. Multiple or wide doors that allow several people to board or alight simultaneously help expedite passenger movement.
Tag on/tag off fare payment method requires boarders to use front door. Tag on/tag off fare payment delays alighting and can delay boarding when passengers alight via front door. Wide doors allow for card users to pay while cash payment is in progress. Boarding/alighting is not level.
Source: Transit Capacity and
Quality of Service Manual, Third
Edition (2013)

29
In-vehicle circulation Boarding and alighting occurs more slowly when there are people standing. The amount of space between people standing, as well as the aisle width, also influences how easily passengers circulate within the vehicle.
Most buses have standees present at peak times. Double decker buses increase in-vehicle circulation time.
Figure 25 shows estimated average dwell times for northbound bus stops and Figure 26 shows
estimated average dwell times for southbound bus stops. The bar shows the all-day average
and the error bar shows the standard deviation of hourly average dwell times across the day.
Dwell time statistics are derived from real time information data. It is important to note these
dwell time figures are estimates only, and due to data collection methods actual dwell times
may vary from estimates.5
The data on dwell times show that there is a wide degree of variation in average dwell times
across stops on the Golden Mile. Some stops, such as Lambton Quay at Cable Car (5010),
have very short dwell times given patronage levels. Other stops have dwell times approaching
or exceeding 30 seconds, indicating that dwell times may be having a substantial impact on
bus speeds and Golden Mile bus capacity. Further work is needed to investigate bus stops
with high dwell times to determine the sources of delay and isolate intersection delays from
dwell times.
5 For bus stops that are within 50 metres of a traffic signal, it is likely that the raw bus stop dwell time
also includes traffic signal delays. This has been accounted for to the extent possible by crosschecking traffic signal delay data against dwell times and boarding and alightings per stop, and making adjustments as necessary.

30
Figure 25: Estimated dwell times at northbound bus stops
Figure 26: Estimated dwell times at southbound bus stops
0 10 20 30 40 50 60
WgtnStn-D (5016)
LambtonQyN-D (5502)
LambtonCtrl-B (5506)
LambtonQy at Hunter (5508)
WillisSt at Willban (5510)
MannersSt at Cuba-B (5513)
CourtenayPl at Cour (5514)
CourtenayPl-C (5516)
Dwell times (seconds)
0 10 20 30 40 50 60
CourtenayPl-A (5000)
CourtenayPl at StJa (5002)
MannersSt at Cuba-A (5515)
MannersSt at Willis (5006)
WillisSt at GrandAr (5008)
LambtonQy at CableC (5010)
LambtonCtrl-A (5012)
LambtonQyN-B (5014)
Dwell times (seconds)

31
Intersections
Figure 27: Traffic lights and pedestrian crossings

32
While signalised traffic intersections are key to pedestrian connectivity and managing traffic
flows, they can substantially reduce both the average speed and the capacity of public
transport corridors. A traffic signal located immediately before or after a bus stop will serve to
meter the number of buses that can enter or exit the stop, reducing the hourly capacity of the
bus stop. Bus stops further distances away (up to 400m) from signals will also be influenced
by signals to some extent, with that influence growing weaker with increasing distance from
the signal. Due to the high density of traffic signals and bus stops along the Golden Mile, all
bus stops along the corridor are likely to experience some level of capacity reduction due to
traffic signals.
Figure 27 shows the current placement of full intersections, pedestrian intersections, and
zebra crossings along the Golden Mile. There are a total of 17 traffic signals along the Golden
Mile, an average of one every 125 meters. There are a total of 11 signalised traffic crossings,
six pedestrian intersections, and one zebra crossing.
Traffic signals can have a considerable impact on bus travel speeds, increasing bus travel
times due to time spent waiting at signals, as well as time spent decelerating and accelerating
before and after the lights.
Table 2 shows current green time ratios and average delays for buses moving along the
Golden Mile. The data shows that the delay faced by buses due to traffic signals varies widely
across the Golden Mile. This is due to variability in intersection complexity and movement
volumes along the corridor. In general, pedestrian signals provide much lower levels of delay
than full traffic signals.
Table 2: Indicative Intersection Delays
Intersection Bus
Direction of travel
Green time ratio
Average delay for
buses (seconds)
Bus stop capacity
% of baseline
Brandon/Lambton Quay Northbound 34% 35.1 n/a
Courtenay/Tory St Northbound 54% 7.1 n/a
Grey St pedestrian crossing Northbound 44% 8.7 n/a
Lambton/Bowen/Whitmore Northbound 27% 47.9 35%
Lambton/Stout St Northbound 65% 3.3 n/a
Manners/Courtenay/Taranaki St Northbound 27% 24.2 n/a
Manners/Cuba Northbound 47% 15.3 64%
Manners/Victoria St Northbound 39% 13.7 n/a
Manners/Willis/Boulcott Northbound 26% 43.5 41%
Midland Park pedestrian crossing Northbound 53% 12.3 69%
Willis/Chews Lane pedestrian crossing Northbound
51% 6.6 n/a
Willis/Lambton Quay/Customhouse Quay Northbound
38% 25.5 53%
Brandon/Lambton Quay Southbound 34% 17.6
50%
Courtenay/Tory St Southbound 54% 7.1 n/a
Grey St pedestrian crossing Southbound 44% 8.7 n/a

33
Hunter pedestrian crossing Southbound 71% 5.5 83%
Lambton/Stout St Southbound 65% 3.3 n/a
Manners/Courtenay/Taranaki St Southbound 27% 24.2 n/a
Manners/Cuba Southbound 47% 15.3 64%
Manners/Victoria St Southbound 39% 13.7 n/a
Willis/Chews Lane pedestrian crossing Southbound
51% 6.6 n/a
Willis/Mercer Southbound 53% 18.1 68%
The effect of traffic signals on bus operations is quantified by calculating the green time ratio
(g/C ratio) and cycle length. The green time ratio describes the average amount of effective
green time for bus traffic movement, divided by the total traffic signal cycle length (the time
required to display a complete signal cycle). Green time ratios and bus stop capacities, along
with other sources of delay, are used to determine the overall hourly bus capacity on a given
route.6 It should also be noted that while shorter signal cycle lengths reduce overall green
time, they can improve bus LOS as the wait time is reduced.
When traffic signals are in the direct vicinity of a bus stop, they reduce bus stop capacity by
limiting the number of buses that can enter and exit the stop in a given hour. Figure 28 shows
the estimated impact of traffic signals on southbound bus stop capacity along the Golden Mile
during the evening peak7. Four bus stops are in the immediate vicinity of a traffic signal,
reducing the number of buses than can move along the Golden Mile in a given hour. Figure
29 shows the impact of traffic signals on northbound bus stop capacity along the Golden Mile
during the evening peak. Eight bus stops are in the immediate vicinity of a traffic signal,
reducing the number of buses than can move along the Golden Mile in a given hour.
These reduced capacities are due to two factors: bus stops are within the direct vicinity of
signals, meaning that bus arrivals and departures are metered by the signals. Secondly, many
of these intersections provide too little green time for buses.
The data shows that, in general, pedestrian crossings have a relatively minor impact on bus
stop capacity because they have short signal cycles and high green time ratios for buses. For
example, the pedestrian crossing outside St James theatre on Courtenay place provides green
time for northbound buses 90% of the time, and reduces the bus capacity of the St James bus
stop by 5%, from 114 to 108 buses per hour (Figure 28). In contrast, full traffic intersections,
with multiple vehicular turning with multiple vehicular turning movements, have a substantial
impact on the bus capacity of the Golden Mile. For example, the intersection of Willis, Boulcott,
and Manners Street provides green time for buses 26% of the time, and reduces the bus
capacity of the Manners at Willis bus stop by 59%, from 134 to 55 buses per hour.
6 Calculated using Transit Capacity and Quality of Service Manual Equation 6-6

34
Figure 28: Impact of Traffic Signals on Southbound Bus Stop Capacity
Figure 29: Impact of Traffic Signals on Northbound Bus Stop Capacity
Lambton/Brandon
Lambton/Hunter pedestrian crossing
Willis/Mercer
Manners/Cuba
St James Pedestrian crossing
0
0.1
0.2
0.3
0.4
0.5
0.6
0.7
0.8
0.9
1
0% 10% 20% 30% 40% 50% 60% 70% 80% 90% 100%
Bu
s fa
cilit
y ca
pac
ity
as %
of
bas
elin
e
Intersection green time ratio
St James pedestrian crossing
Manners/Cuba
Manners/Willis
Willis /LambtonCustomhouse
Cable Car pedestrian crossing
Midland Park pedestrian crossing
Lambton/Bowen
0%
10%
20%
30%
40%
50%
60%
70%
80%
90%
100%
0% 10% 20% 30% 40% 50% 60% 70% 80% 90% 100%
Bu
s fa
cilit
y ca
pac
ity
as %
of
bas
elin
e
Intersection green time ratio

35
Other sources of bus delay
The level of priority given to buses plays an important role in determining bus travel times and
operating conditions. Figure 30 shows the current level of bus priority along the Golden Mile.
Buses experience a range of prioritisation along the length of the Golden Mile. For
approximately 25% of the length of the route, buses share lanes with general traffic. For about
35% of the length of the route, buses have bus lanes, which are available for use by buses,
motorbikes, bicycles, and taxis. Bus lanes usually have parking on the left side and a general
traffic lane on the right side of the bus lane. For about 40% of the length of the route, buses
have a ‘bus only’ lane, reserved exclusively for buses.
While in general buses face a degree of prioritisation on the Golden Mile, for about 25% of the
route buses mix with general traffic. This can cause delays for buses, especially in situations
where buses must enter a flow of moving vehicles, either because they were stopped at a bus
stop or because they must execute a lane change to follow their designated route. Where bus
lanes are present, buses may still experience delays from general traffic due to interactions
with parking vehicles and general traffic in adjacent lanes. These delays may be particularly
pronounces around bus stops or where bus lane widths are insufficient. The bus delay caused
by mixing with general traffic has been quantified at selected sites, outlined below. As
northbound buses approach the Bowen/Lambton/Whitmore intersection, they must
manoeuvre from a bus stop in a left side kerbside bus lane across a lane of general traffic to
a right side bus lane (Figure 31). Given current traffic volumes and the timing of the
intersection, each bus faces an average delay of 24 seconds from 7:00am to 7:00pm due to
mixing with general traffic8.
8 Re-entry delay calculated using Transit Capacity and Quality of Service Manual Equations 6-9, 6-10, 6-11, 6-12 and 6-13.
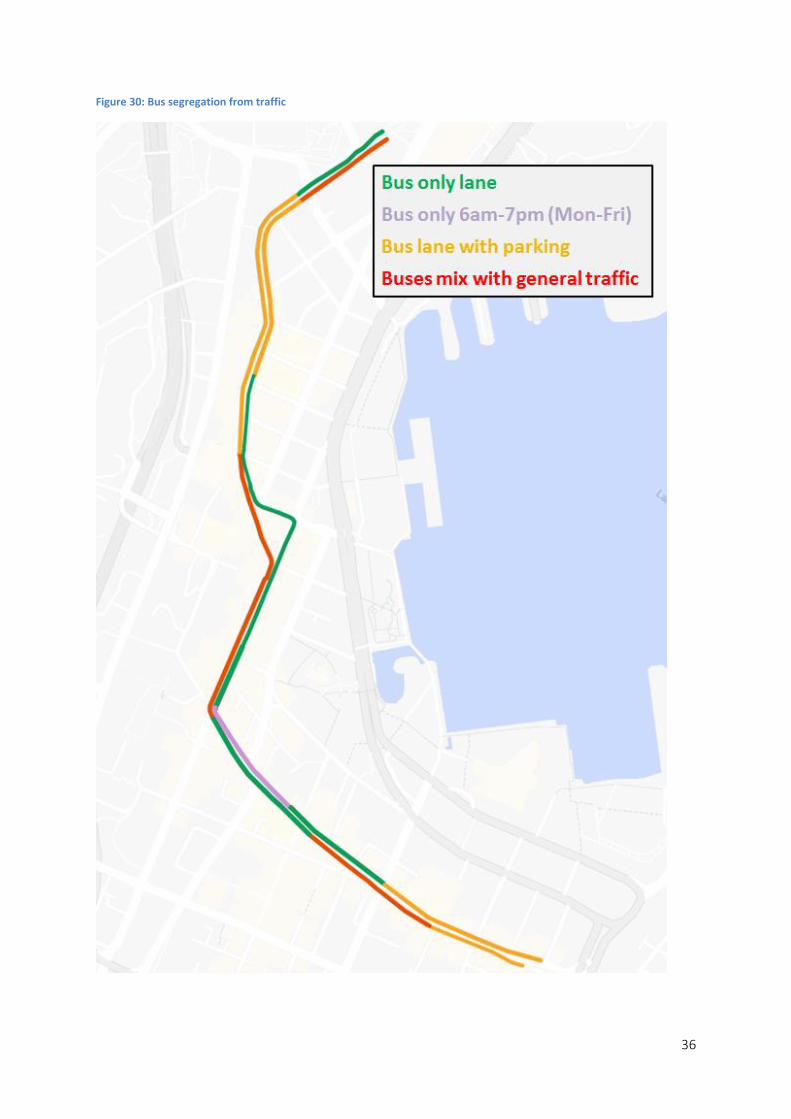
36
Figure 30: Bus segregation from traffic
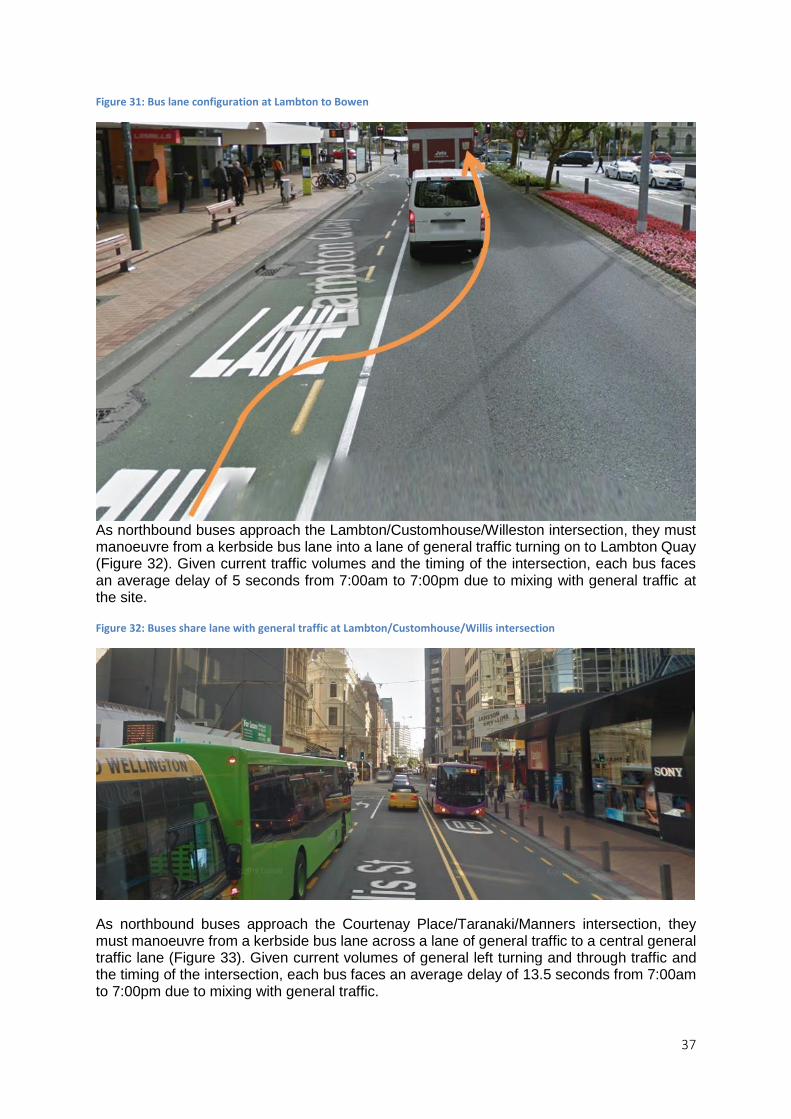
37
Figure 31: Bus lane configuration at Lambton to Bowen
As northbound buses approach the Lambton/Customhouse/Willeston intersection, they must manoeuvre from a kerbside bus lane into a lane of general traffic turning on to Lambton Quay (Figure 32). Given current traffic volumes and the timing of the intersection, each bus faces an average delay of 5 seconds from 7:00am to 7:00pm due to mixing with general traffic at the site.
Figure 32: Buses share lane with general traffic at Lambton/Customhouse/Willis intersection
As northbound buses approach the Courtenay Place/Taranaki/Manners intersection, they must manoeuvre from a kerbside bus lane across a lane of general traffic to a central general traffic lane (Figure 33). Given current volumes of general left turning and through traffic and the timing of the intersection, each bus faces an average delay of 13.5 seconds from 7:00am to 7:00pm due to mixing with general traffic.

38
Figure 33: Bus lane merges with general traffic approaching Taranaki St
Average delay by time of day for each of these selected sites is outlined in Figure 34. General
traffic causes the most delays for buses at the Lambton/Bowen site, with especially high
delays in the morning and evening peak when traffic volumes are high.
Figure 34: Delay per bus due to general traffic on Golden Mile at selected sites
Across many sections of the route, while buses do have a bus lane, there is parallel parking
on the left side of the bus lane. This means that when a car is arriving or departing from one
of these spaces, buses are delayed as the car manoeuvres from the parking space and across
the bus lane into the general traffic lane. During the parking manoeuvre, the bus will face a
0.0
5.0
10.0
15.0
20.0
25.0
30.0
35.0
40.0
De
lay
pe
r b
us
(se
con
ds)
Courtenay/Taranaki Willis/Lambton/Customhouse Lambton/Bowen
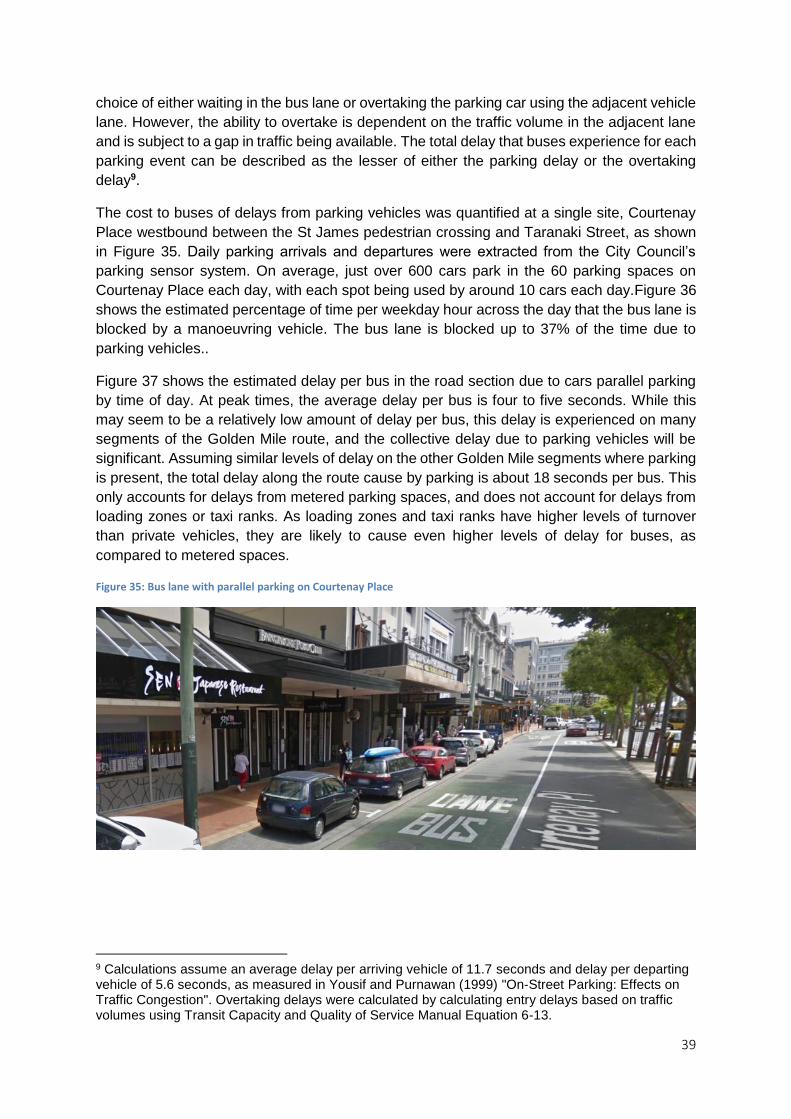
39
choice of either waiting in the bus lane or overtaking the parking car using the adjacent vehicle
lane. However, the ability to overtake is dependent on the traffic volume in the adjacent lane
and is subject to a gap in traffic being available. The total delay that buses experience for each
parking event can be described as the lesser of either the parking delay or the overtaking
delay9.
The cost to buses of delays from parking vehicles was quantified at a single site, Courtenay
Place westbound between the St James pedestrian crossing and Taranaki Street, as shown
in Figure 35. Daily parking arrivals and departures were extracted from the City Council’s
parking sensor system. On average, just over 600 cars park in the 60 parking spaces on
Courtenay Place each day, with each spot being used by around 10 cars each day.Figure 36
shows the estimated percentage of time per weekday hour across the day that the bus lane is
blocked by a manoeuvring vehicle. The bus lane is blocked up to 37% of the time due to
parking vehicles..
Figure 37 shows the estimated delay per bus in the road section due to cars parallel parking
by time of day. At peak times, the average delay per bus is four to five seconds. While this
may seem to be a relatively low amount of delay per bus, this delay is experienced on many
segments of the Golden Mile route, and the collective delay due to parking vehicles will be
significant. Assuming similar levels of delay on the other Golden Mile segments where parking
is present, the total delay along the route cause by parking is about 18 seconds per bus. This
only accounts for delays from metered parking spaces, and does not account for delays from
loading zones or taxi ranks. As loading zones and taxi ranks have higher levels of turnover
than private vehicles, they are likely to cause even higher levels of delay for buses, as
compared to metered spaces.
Figure 35: Bus lane with parallel parking on Courtenay Place
9 Calculations assume an average delay per arriving vehicle of 11.7 seconds and delay per departing vehicle of 5.6 seconds, as measured in Yousif and Purnawan (1999) "On-Street Parking: Effects on Traffic Congestion". Overtaking delays were calculated by calculating entry delays based on traffic volumes using Transit Capacity and Quality of Service Manual Equation 6-13.

40
Figure 36: Impact of parking vehicles on bus lane operations at Courtenay Place
Figure 37: Delay per bus due to parallel parking on Courtenay Place
While buses on the Golden Mile have bus lanes or bus only lanes for most of the route, they
still face substantial delays from general traffic travelling and parking on the Golden Mile.
Parallel parking blocks traffic lanes, reducing the effectiveness of bus lanes. General traffic
0%
5%
10%
15%
20%
25%
30%
35%
40%
Pe
rce
nta
ge o
f h
ou
r
Percentage of hour bus lane blocked by parking vehicles
0.0
1.0
2.0
3.0
4.0
5.0
6.0
Seco
nd
s o
f d
ela
y p
er
bu
s

41
traveling on the Golden Mile causes delays for buses, especially at sites where bus must
manoeuvre across traffic lanes.
Bus stop capacity
The number of buses that can be moved through the Golden Mile in a given hour is an
important metric as bus patronage continues to increase and the majority of bus routes in the
city use the Golden Mile route to travel through the central city. Capacity is influenced by the
number of bus bays, bus bay design, bus dwell times, intersection delays, interference from
traffic, and roadway capacity.
The capacity of a bus facility, such as the Golden Mile, is determined by the capacity of the
bus stop with the lowest capacity. The capacity of an individual bus stop is determined by the
number of bus bays, bus bay design, bus dwell times, intersection delays, interference from
traffic, and roadway capacity. Figure 38 shows the relative impact of each of dwell times,
intersections, and loading areas on bus stop capacity. Longer dwell times substantially reduce
the capacity of bus stops because the longer a bus is using a stop, the longer the stop is
unavailable for arriving buses. Reduced intersection green time ratios have a similar impact;
they reduce bus stop capacity by limiting the ability of buses to clear the bus stop and be
replaced by arriving buses.
Figure 38: Relative impact of dwell time, g/c ratio, and number of loading areas on bus stop maximum capacity
Figure 39 and Figure 40 show current bus stop lengths along the Golden Mile. There is a wide
variety in bus stop lengths along the Golden Mile, from a low of 24 metres to a high of 73
metres. This results in a high degree of variability in bus stop capacity along the corridor.
Source: Transit
Capacity and Quality of
Service Manual, Third
Edition (2013)

42
Figure 39: Northbound Bus Stop Lengths
Figure 40: Southbound Bus Stop Lengths
For linear on-line bus stops, which are used on the Golden Mile, the relationship between
loading bays and bus stop capacity is non-linear. Each additional loading bay provides
diminishing additional capacity because the greater the number of bays, the greater probability
that one or more loading areas will be blocked or will block other loading areas. Because of
0
10
20
30
40
50
60
70
80
CourtenayPl-A(5000)
CourtenayPl atStJa (5002)
MannersSt atCuba-A (5515)
MannersSt atWillis (5006)
WillisSt atGrandAr (5008)
LambtonQy atCableC (5010)
LambtonCtrl-A(5012)
LambtonQyN-C(5015)
LambtonQyN-B(5014)
LambtonQyN-All
Len
gth
(m
)
0
10
20
30
40
50
60
70
80
WgtnStn-C (5500) LambtonQyN-D(5502)
LambtonCtrl-B(5506)
LambtonQy atHunter (5508)
WillisSt at Willban(5510)
MannersSt atCuba-B (5513)
CourtenayPl atCour (5514)
CourtenayPl-C(5516)
Len
gth
(m
)

43
this, providing more than five bus bays at a single bus stop provides little to no additional bus
stop capacity.
Figure 41 shows estimated maximum capacity for bus stops along the Golden Mile, drawing
on the number of bays, dwell times intersection green time ratios, and traffic congestion
effects10.
It is important to note that calculations are based on estimated average dwell times, and due
to data collection methods actual dwell times may vary from estimated averages. Changes in
estimated dwell times can substantially change estimated bus stop capacity. Variability in
dwell times will also reduce bus stop capacity below average levels.
There is a wide degree of variability in bus stop capacity, from a low of 75 buses per hour to
a high of 295 buses per hour [please check this figure – seems too high]. This variability is
due to:
green time ratios at traffic signals ranging from 0.9 to 0.3, as detailed in Figures Figure 28 and Figure 29
the number of bus bays ranging from a minimum of 2 to a maximum of 6 depending on the bus stop (Figure 39 and Figure 40)
dwell times, ranging from a minimum of 10 seconds at Lambton Central B to a maximum of 51 seconds at Wellington Station (Figure 25 and Figure 26)
traffic congestion effects which are non-existent at most bus stops but are significant at Courtenay Place-St James, Willis St at Grand Arcade, and Lambton Quay North (Figure 34).
10 Calculated using Transit Capacity and Quality of Service Manual Bus Capacity Methodology (Chapter 6, Section 5). On-line loading areas with random arrivals have been assumed.

44
Figure 41: Estimated bus stop capacity along the Golden Mile
Figure 42 and Figure 43 show estimated design capacity and maximum capacity for bus stops
along the Golden Mile, relative to current AM and PM peak bus volumes per hour. Design
capacity refers to the maximum number of buses per hour that can use a stop without causing
substantial speed, reliability and operational issues11. Once the design capacity is exceeded,
queues of buses frequently form behind bus stops and bus operating speeds deteriorate by
20% or more. Maximum capacity refers to the maximum possible throughput without regard
for reliability or operational issues.
For northbound bus stops (Figure 42), the data indicates that the Manners Street and Willis
Street sections of the Golden Mile are approaching capacity constraints in both the AM and
PM peaks. The Manners at Cuba Stop (5515) currently has bus volumes that are equivalent
to the design capacity during the AM peak, while the Manners St at Willis (5006) and Willis St
at Grand Arcade (5008) stops currently have bus volumes that exceed the design capacity
during the AM peak and are approaching maximum capacities. This means that the Manners
Street and Willis Street sections of the Golden Mile are causing speed, reliability and
operational issues for bus operations along the Golden Mile and are limiting the ability to
provide additional bus services in response to patronage growth. In contrast, the Courtenay
Place and Lambton Quay sections of the Golden Mile have considerable levels of spare bus
capacity, as hourly bus volumes are much lower than design capacity levels.
11 For the purposes of calculating design capacity, a 15% design failure rate has been assumed.

45
Figure 42: Northbound Bus Stops - Capacity vs volumes
For southbound bus stops (Figure 43), the data indicates that the Lambton Central stop and
the Willis Street section of the Golden Mile are approaching capacity constraints, particularly
in the PM peak. For both of these stops, PM peak bus volumes are equivalent to the design
bus stop capacity. This means that these stops are causing speed, reliability and operational
issues for bus operations along the Golden Mile and are limiting the ability to provide additional
bus services in response to patronage growth. In contrast, other southbound stops on the
Golden Mile have some degree of spare bus capacity, with hourly bus volumes that are lower
than design capacity levels.
0
50
100
150
200
250
300
CourtenayPl-A(5000)
Courtenay Pl atStJa (5002)
Manners St atCuba (5515)
Manners St atWillis (5006)
Willis St atGrandAr (5008)
Lambton CableCar (5010)
LambtonCentral (5012)
Lambton North(5011, 5014,
5015)
Bu
ss p
er
ho
ur
AM peak bus volumes PM peak bus volumes Design capacity Maximum capacity

46
Figure 43: Southbound Bus Stops - Capacity vs volumes
The capacity of a bus corridor is determined by the capacity of the bus stop (or group of
stops) used by all buses that has the lowest capacity. In the case of the Golden Mile,
analysis indicates that hourly bus capacities are currently 55-75 for a stable flow and 80-100
for a forced flow, unstable operation.
The number of buses that can be moved through the Golden Mile in a given hour could be
increased by increasing the capacity of the lowest capacity stops. This could be achieved
through a number of measures, including:
giving buses greater priority at traffic lights
removing general traffic from sections where they are reducing bus capacity
removing traffic intersections
increasing the number of bus bays at stops with two bays
splitting bus stops with four to six bays into A and B stops with two to three bays each
reducing the number of phases at intersections by eliminating turning movements on and off the Golden Mile, and
reducing dwell times at bus stops
0
50
100
150
200
250
300
WgtnStn-C(5500)
LambtonQyN-D(5502)
LambtonCtrl-B(5506)
LambtonQy atHunter (5508)
WillisSt atWillban (5510)
MannersSt atCuba-B (5513)
CourtenayPl atCour (5514)
CourtenayPl-C(5516)
Bu
ss p
er
ho
ur
AM peak bus volumes PM peak bus volumes
Design capacity Maximum capacity

47
Overall bus travel times
Figure 44 and 45 show estimated current northbound bus travel times along the Golden Mile
and the main factors contributing to actual travel times. These are calculated bus speeds
based on actual operating conditions using Transit Capacity and Quality of Service Manual
methodology. It is important to note that this is an initial estimate only and is subject to
further refinement. The average northbound operating speed for buses on the Golden Mile is
around 10 kilometres per hour and the average travel time is 13-17 minutes, depending on
time of day. The main contributing factors to current bus operating speeds are stop spacing,
dwell times and intersection delays.
Figure 44: Current Northbound bus travel times
5.7
2.0
1.7
1.6
1.50.5 0.3 13.2
2.8 16.0
0
2
4
6
8
10
12
14
16
18
Tim
e (
min
ute
s)
Current - Northbound Bus Travel Times

48
Figure 45: Current Southbound bus travel times
The evidence indicates that bus speeds along the Golden Mile are low and bus capacity is limited. This is a concern because slow services reduce the attractiveness of buses as a transport mode. The Golden Mile’s limited capacity to accommodate additional buses reduces the ability of the city to grow, as at a certain point it will limit access to jobs in the central city.
There are many factors contributing to lengthy bus travel times on the Golden Mile. The two most influential factors on baseline bus travel times on the Golden Mile are traffic intersections and bus stop spacing. A total of 11 traffic intersections add about 2 minutes to bus journey times and a total of six pedestrian intersections add about 1.6 minutes to bus journey times.
An average 400m stop spacing would allow for a baseline 5.7 minute travel time, and the current average stop spacing of under 300 metres adds an additional 1.7 minutes to the baseline travel time. Peak time congestion adds about 2.8 minutes to travel time.
5.3
1.5
1.3
1.1
1.00.2 0.1 10.5
3.0 13.5
0
2
4
6
8
10
12
14
16
Tim
e (
min
ute
s)
Current - Southbound Bus Travel Times

49
Providing high quality pedestrian spaces is essential to realising vibrant, safe, liveable cities.
In central city environments, walking is a key travel mode, whether it constitutes an entire
journey or is the beginning and end of journeys by bike, public transport, or private vehicle.
Because it is the most space efficient travel mode, walking is critical in high density central
city areas that do not have the space to support a high proportion of trips being made by
private vehicle. Encouraging more people to walk for transport is also important for public
health because walking for transport provides significant health, environmental, and well-
being benefits.
Pedestrian space is not only important from a transport perspective, but also from a place
perspective. High quality pedestrian spaces provide a public realm suitable for public
events, recreation, socialisation, relaxation, and dining. They can also contribute to the
economy by increasing opportunities for retail, hospitality, and tourism offerings.
There are several different approaches to determining levels of service for pedestrians as
the experience of people on a street is influenced by many factors.
Factors that influence the pedestrian experience include:
levels of footpath crowding
density and distance between crossing points
crossing facilities provided
noise and pollution
shelter from wind and rain
presence of street trees and plantings
form and usage of surrounding buildings
width of the street and footpath
volumes of vehicle traffic
quality of footpath surface
Because the pedestrian experience is influenced by so many factors, providing a high quality
pedestrian experience requires a multi-disciplinary approach that takes into account both
transport and place.
Figure 46 shows nine hour pedestrian volumes on street segments in the central city12. It
shows that the areas in Wellington City with the highest pedestrian volumes are the Golden
Mile and the Waterfront. The high concentration of pedestrians along the Golden Mile means
that it is important to provide a high level of service for pedestrians.
12 Pedestrian volumes are based on pedestrian counts undertaken in 2016.

50
Current Pedestrian Volumes
Figure 46: Pedestrian volumes (8am-5pm)

51
Pedestrian Level of Service Overview
The “Healthy Streets Index”, developed by Transport for London, focuses on making streets
healthy, safe and welcoming for everyone. The index is based on 10 indicators that focus on
the experience of people using the street and gives a high level indication of a streets’
attractiveness to pedestrians.
Figure 47 shows the current rating of Lambton Quay using the Healthy Streets Index. Lambton
Quay scores highest in the ‘Shade and Shelter’ and ‘Places to Stop and Rest’ categories, as
there is near continuous coverage by verandas and street furniture at sufficient intervals. The
presence of street trees, plantings, good lighting, and paved footpaths improves the
attractiveness of the area. High levels of noise from vehicles, high traffic volumes, a high
percentage of heavy vehicles, and delays at traffic lights reduce scores across a number of
categories. Assessments of Willis Street, Manners Street, and Courtenay Place show similar
patterns. This similarity in scoring reflects the high bus volumes and similar footpath provisions
across the Golden Mile.
Figure 47: Lambton Quay Health Streets Index
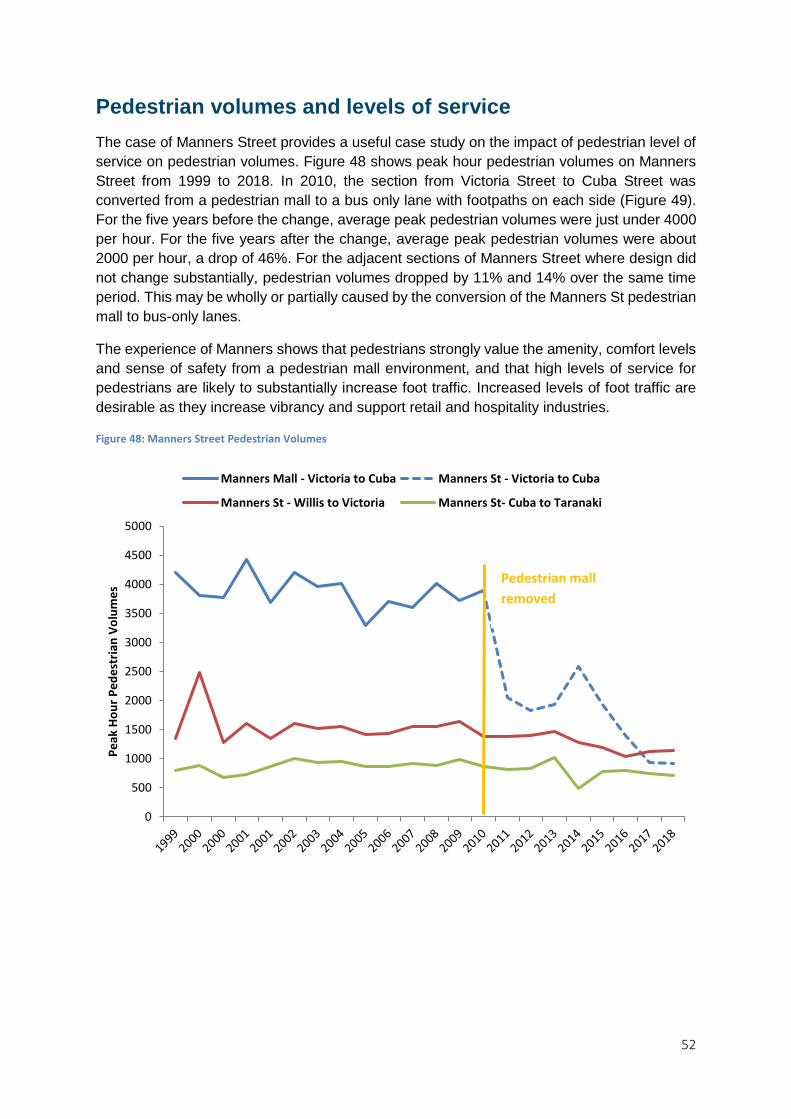
52
Pedestrian volumes and levels of service
The case of Manners Street provides a useful case study on the impact of pedestrian level of
service on pedestrian volumes. Figure 48 shows peak hour pedestrian volumes on Manners
Street from 1999 to 2018. In 2010, the section from Victoria Street to Cuba Street was
converted from a pedestrian mall to a bus only lane with footpaths on each side (Figure 49).
For the five years before the change, average peak pedestrian volumes were just under 4000
per hour. For the five years after the change, average peak pedestrian volumes were about
2000 per hour, a drop of 46%. For the adjacent sections of Manners Street where design did
not change substantially, pedestrian volumes dropped by 11% and 14% over the same time
period. This may be wholly or partially caused by the conversion of the Manners St pedestrian
mall to bus-only lanes.
The experience of Manners shows that pedestrians strongly value the amenity, comfort levels
and sense of safety from a pedestrian mall environment, and that high levels of service for
pedestrians are likely to substantially increase foot traffic. Increased levels of foot traffic are
desirable as they increase vibrancy and support retail and hospitality industries.
Figure 48: Manners Street Pedestrian Volumes
0
500
1000
1500
2000
2500
3000
3500
4000
4500
5000
Pe
ak H
ou
r P
ed
est
rian
Vo
lum
es
Manners Mall - Victoria to Cuba Manners St - Victoria to Cuba
Manners St - Willis to Victoria Manners St- Cuba to Taranaki
Pedestrian mall
removed

53
Figure 49: Manners Street in 2008 and 2017
Pedestrian crowding
In busy environments, crowded footpaths can reduce pedestrian levels of service (LOS)
because it reduces the personal space available per person and because walking speeds
reduce as pedestrian density increases, causing delays for pedestrians. It can also be a
particular concern for certain groups of people, such as those with reduced mobility, people
with prams or small children, and people who use wheelchairs or other mobility assistance
devices.
Figure 50 shows the relationship between pedestrian flow rates, walking speeds and level of
service13. Mid-block level of service is determined by the pedestrian unit flow rate, which is a
function of effective walkway width and the number of pedestrians passing per 15 minute
interval.
13 Adapted from the Highway Capacity Manual (2010). Transportation Research Council.

54
Figure 50: Pedestrian Crowding and Levels of Service
At Level of service A and B there is sufficient area for pedestrians to select walking speeds
freely, bypass other pedestrians, and to avoid conflicts. At LOS C, space is sufficient for a
normal walking speed, but reverse direction or crossing movements cause minor conflicts and
speeds are somewhat reduced. At LOS D, freedom to choose individual walking speed is
restricted and crossing or reverse flow movements cause significant conflicts. At LOS E and
F, walking speeds are severely restricted and there are frequent, unavoidable conflicts
between pedestrians.
When pedestrian levels of service are E to F, it can pose a safety risk because pedestrians
may be induced to walk in the roadway, putting them in conflict with vehicles. This is a
particular concern in an environment like the Golden Mile because there is a minimal shoulder
between the footpath and moving vehicles and there are high volumes of heavy vehicles.
Figure 51 shows the calculated mid-block pedestrian level of service for the eleven segments
of the Golden Mile where pedestrian counts are undertaken. It is important to note that these
pedestrian counts are undertaken from 11:00am to 2:00pm so these calculations are likely to
under-estimate pedestrian crowding in parts of the Golden Mile that are busiest at other times
of day, such as Courtenay Place. It also does not take into account reductions in effective
walkway width due to bus stops or other obstructions, such as sandwich boards, street trees,
or street furniture.
Mid-block levels of service are currently A or B on Courtenay Place and Manners Street, where
pedestrian flows are lower and footpaths are relatively wide. Mid-block levels of service are
currently C through E on Willis Street and Lambton Quay due to higher pedestrian volumes,
especially on the western side where pedestrian numbers are greatest.

55
Figure 51: Mid-block pedestrian level of service

56
Figure 52 shows the estimated annual cost of crowding delay on eleven street segments of
the Golden Mile at midday (11:00am to 2:00pm). The combined annual cost of delay at these
sites is $1.8 million per year14. This figure will be a substantial underestimate of the cost of
crowding on the Golden Mile because it is only a measurement of a portion of the route for a
small portion of the day.
Figure 52: Annual Cost of Midday Pedestrian Crowding
Effective walkway width describes the width of the footpath that can be used for people walking
after allowing for barriers such as signs and sandwich boards. Effective walkway widths were
measured at five bus stops to estimate the impact of bus stops on footpath levels of service.
This exercise showed that, at peak times, bus stops can substantially reduce the width
available for pedestrians travelling along the footpath (Figure 53 and Figure 54). At these sites,
effective footpath width was reduced by an average of 65%, compared to the full footpath
width, due to bus shelters, seating, bus signs, and queuing bus passengers. These reduced
14 Calculated using NZ Economic Evaluation Manual (2018) methodology. 80% of pedestrians have been assumed to have a work travel purpose and 20% have been assumed to have a non-work travel purpose.
$- $100,000 $200,000 $300,000 $400,000 $500,000
Lambton Quay - Whitmore toBallance
Lambton Quay - W Taylor toJohnston
Lambton Quay - Brandon toPanama
Lambton Quay - Grey to Hunter
Willis Street - Sth of Williston
Willis Street - Nth of Mercer
Manners Street - Willis to Victoria
Manners Street - Victoria to Cuba
Manners Street - Cuba to Taranaki
Courtenay Place - Taranaki to Tory
Courtenay Place - Tory toCambridge
Annual cost of crowding delay
North/East Side South/West Side

57
widths, shown in Figure 53, resulted in a level of service reduction of one to two levels, as
shown in Table 3.
Figure 53: Effective footpath widths at selected bus stops
Figure 54 illustrates the impact of a bus stop on effective walkway width at one site, Lambton
Quay at Cable Car. It shows that bus stops use a substantial amount of footpath space,
reducing level of service for both people walking along the street and people queuing at the
bus stop. Increasing the amount of space allocated to pedestrians can improve levels of
service for people walking and taking the bus.
Table 3: Midblock pedestrian level of service at selected sites
Location LOS - no bus stop LOS with bus stop
Manners St 5006 C D
Willis St @ Unity 5510 A C
Lambton Quay 5508 E F
Lambton Quay 5010 C E
Willis St @ Grand Arcade 5008 A C
0
1
2
3
4
5
6
7
8
Manners St 5006 Willis St @ Unity5510
Lambton Quay5508
Lambton Quay5010
Willis St @ GrandArcade 5008
Foo
tpat
h w
idth
-m
etr
es
Total width Effective width - no bus stop Effective width - with bus stop

58
Figure 54: Illustrative impact of bus stops on effective footpath width

59
Intersections
Pedestrians cross streets an average of two to three times on every walking trip. Perceived
ease of crossing roads plays a large role in perceptions of the walking experience, and also
influences risk of conflicts between pedestrians and vehicles15.
Long wait times at traffic signals can increase the probability that pedestrians will violate traffic
rules and make unsafe crossings. One Canadian study showed that a 10% increase in wait
times is associated with an 8% increase in crossing violations and a 2.1% increase in
dangerous crossing violations16.
Research shows that the location of official crossing points, relative to the origin and
destination of pedestrians, is the single most important factor for pedestrians choosing to cross
at a designated location17. Therefore, to improve pedestrian safety, it is important that
pedestrian facilities are placed as close as possible to major pedestrian desire lines.
Improved crossings for pedestrians not only increases safety, but can also increase the
number of pedestrian trips, allowing for health benefits from increased physical activity. A
study of eight sites in New Zealand showed that the implementation of new or improved
facilities led to increased pedestrian volumes and an improved perception of the sites by
users18.
There are a total of 18 formal crossing points for pedestrians along the Golden Mile, an
average of one crossing every 125 metres. Courtenay Place is the area with the most
convenient spacing of crossing points for pedestrians, with a formal crossing point every 74
metres. Lambton Quay is the area with the least convenient spacing of crossing points for
pedestrians, with up to 240 metres between formal crossing points. In many sections of
Lambton Quay, a raised median facilitates informal crossings by providing a pedestrian refuge.
Figure 55 shows the level of service for pedestrians at traffic lights on the Golden Mile, based
on average delay per person during the evening peak. All full traffic intersections on the
Golden Mile provide pedestrians with a LOS E or F, meaning that on average, a person must
wait 20 seconds or more at a crossing. Pedestrian intersections provide a LOS C, with an
average wait of 10 to 15 seconds, due to shorter signal cycles and longer green times for
pedestrians as compared to full traffic intersections. Maximum wait times occur when a
pedestrian arrives at the end of the pedestrian phase and must wait a full cycle phase to cross,
and are considerably longer than average wait time.
15 Pedestrian planning and design guide, NZTA 16 Brosseau, Zangenehpour, Saunier and Miranda-Moreno (2013). The impact of waiting time and other factors on dangerous pedestrian crossings and violations at signalized intersections: A case study in Montreal 17 Sisiopiku and Akin (2003). Pedestrian behaviors at and perceptions towards various pedestrian facilities: an examination based on observation and survey data 18 Turner, Singh, Quinn, and Allat (2011) Benefits of new and improved pedestrian facilities – before and after studies. NZTA Research Report 436.
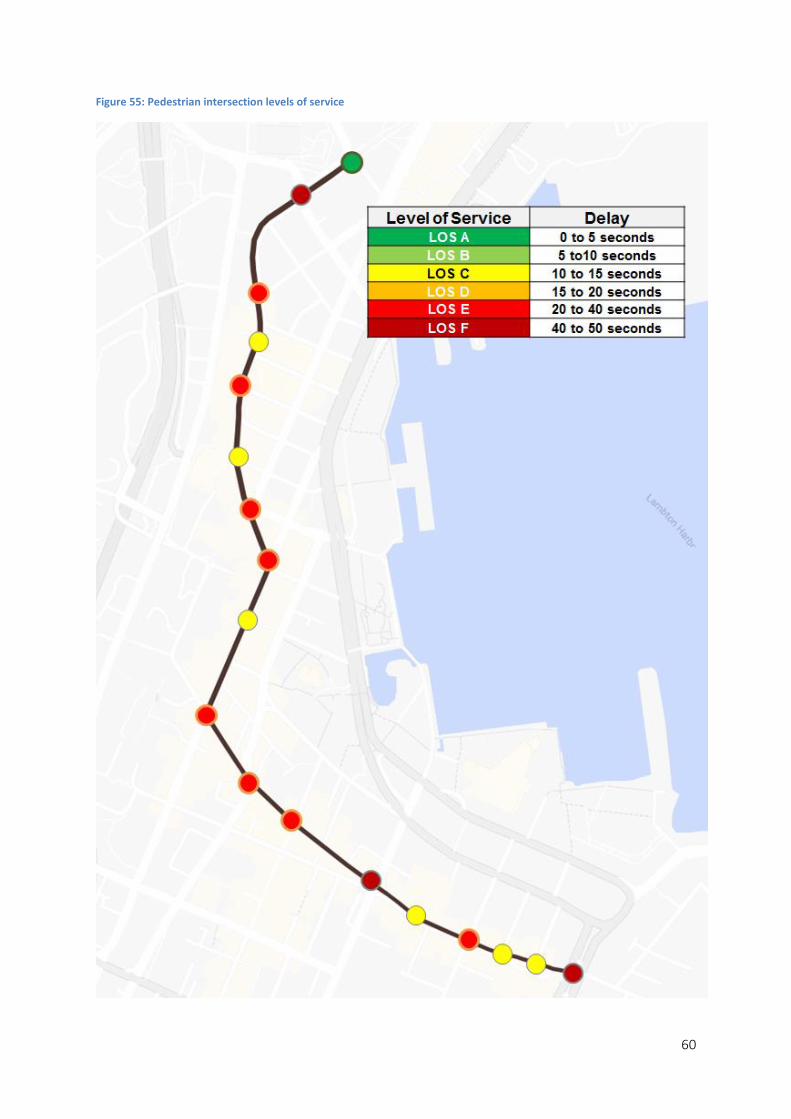
60
Figure 55: Pedestrian intersection levels of service

61
Pollution
Air pollution from motor vehicles is a significant public health problem, and results in
substantial social costs from premature deaths, morbidity, hospital admissions, restricted
activity, and reduced productivity (Kuschel et al., 2012).
The only air pollutant that is monitored along the Golden Mile is nitrogen dioxide, although
other air pollutants, such as PM10, and PM2.5, are also closely linked to vehicle traffic,
particularly heavy vehicle traffic, and have arguably worse health impacts than nitrogen
dioxide.
Nitrogen dioxides are associated with respiratory disease and asthma, and high
concentrations can lead to respiratory infections, increases in mortality and hospital
admissions, and poorer lung function later in life for children who are exposed. New Zealand
national standards for air quality dictate a maximum nitrogen dioxide concentration of
200μg/m3 in a one hour period, while World Health Organisation (WHO) guidelines dictate a
maximum annual average nitrogen dioxide concentration of 40μg/m3.
Nitrogen dioxide concentrations on the Golden Mile are shown in Figure 56. At Manners
Street, annual average nitrogen dioxide concentrations are 42.7μg/m3, exceeding WHO
guideline levels. At Lambton Quay, annual average nitrogen dioxide concentrations are
40.1μg/m3, slightly exceeding WHO guideline levels. At Courtenay Place, annual average
nitrogen dioxide concentrations are 37.4μg/m3, slightly below WHO guideline levels (Figure
51). No sites are exceeding NZ air quality standards for nitrogen dioxides.
Nitrogen dioxide concentrations suggest that pollution is impacting the pedestrian
experience on the Golden Mile and may be resulting in adverse health impacts. Although
they are not measured, concentrations of other pollutants are likely to be elevated due to the
high volumes of heavy vehicle traffic in the area
The extent to which private vehicles and buses contribute to air pollution on the Golden Mile
has not been measured. Light petrol vehicles outnumber heavy diesel vehicles on the
Golden Mile. However, heavy diesel powered vehicles generally emit greater concentrations
of particulates and nitrogen dioxide than light petrol vehicles19.
Reducing private vehicle traffic, improving bus travel times (therefore reducing idling time),
and a transition to lower emission buses could improve air quality along the Golden Mile.
19 Bluett, Jeff, Maria de Aguiar, and Robin Smit. 2016. “Understanding Trends in Roadside Air Quality.” Research Report NZ Transport Agency. Golder Associates.

62
Figure 56: Average monthly Nitrogen dioxide concentrations on the Golden Mile (2017/18)
Pedestrian Safety
Safety for people walking on the Golden Mile is a concern due to the high concentrations of
people walking and motor vehicles causing potential for conflict.
Figure 57 shows the distribution of all reported crashes across modes for the Golden Mile over
the past decade (2009 to 2018)20. There have been just fewer than 500 recorded crashes on
the Golden Mile during that time period. Crashes involving a single or multiple vehicles account
for 72% of all crashes and crashes between vehicles and pedestrians or cyclists account for
27% of all crashes. Crashes between pedestrians and cyclists account for 1% of all crashes.
Figure 57 also shows the distribution of crashes resulting in a death or serious injury across
modes for the central city. From 2009 to 2018, there have been 40 recorded death and serious
injury crashes on the Golden Mile. The data shows that crashes involving pedestrians and
people on bikes are much more likely to result in a death or serious injury as compared to
crashes between motor vehicles. While only 28 percent of recorded crashes involve a
pedestrian or cyclist, they account for 19 out of 20 (95%) of all deaths and serious injuries on
the Golden Mile.
Figure 58 shows reported injury crashes between vehicles and pedestrians 2000 to 2018. It
shows that pedestrian injury crashes peaked in 2005 at 22 crashes, including 7 serious injury
crashes. Crashes between vehicles and pedestrians have modestly declined from an average
of 12 per year between 2000 and 2004 to an average of 9 per year between 2014 and 2018.
20 Source: New Zealand Crash Analysis System (2009-2018).
0
10
20
30
40
50
60
Jan Feb Mar Apr May Jun Jul Aug Sep Oct Nov Dec
Nit
roge
n d
ioxi
de
μg/
m3
Lambton Quay Courtenay Place Manners St WHO Annual Guideline
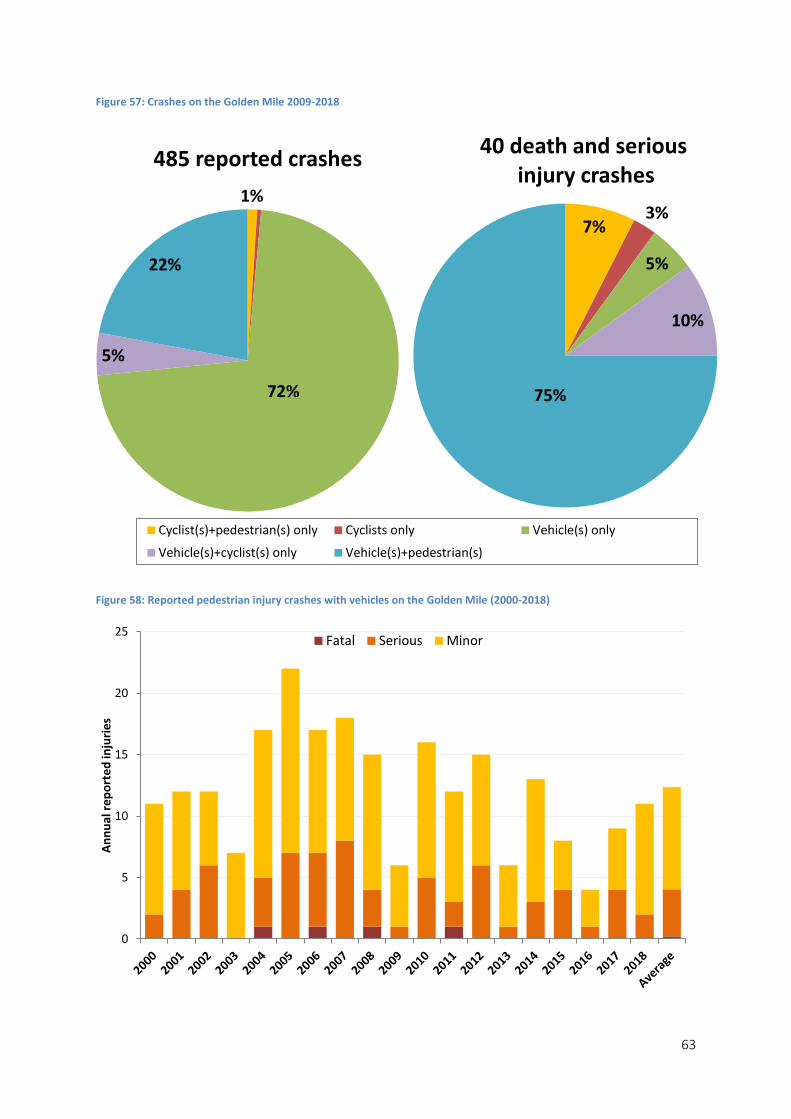
63
Figure 57: Crashes on the Golden Mile 2009-2018
Figure 58: Reported pedestrian injury crashes with vehicles on the Golden Mile (2000-2018)
7%3%
5%
10%
75%
40 death and seriousinjury crashes
Cyclist(s)+pedestrian(s) only Cyclists only Vehicle(s) only
Vehicle(s)+cyclist(s) only Vehicle(s)+pedestrian(s)
0
5
10
15
20
25
An
nu
al r
ep
ort
ed
inju
rie
s
Fatal Serious Minor
1%
72%
5%
22%
485 reported crashes

64
On average, 68% of crashes involving pedestrians and vehicles have resulted in a minor
injury, 30% have resulted in a serious injury, and 2% have resulted in a fatality over the past
19 years. Figure 59 shows the average social cost per year of crashes between pedestrians
and vehicles on the Golden Mile. The total combined social cost of all pedestrian injury crashes
from 2000 to 2019 is $57.4 million dollars.
Figure 59: Social cost of pedestrian crashes with vehicles on the Golden Mile (3-year rolling average)
The data shows that to make the Golden Mile a safer place, we need to concentrate firstly on
pedestrians, followed by people on bikes as they account for the vast majority of serious and
fatal injuries.
$-
$1,000,000
$2,000,000
$3,000,000
$4,000,000
$5,000,000
$6,000,000
2000 2002 2004 2006 2008 2010 2012 2014 2016
An
nu
al s
oci
al c
ost
of
cras
he
s

65
Bicycles on the Golden Mile
People on bikes currently represent less than one percent of users of the Golden Mile (0.7%
of users Lambton Quay, 0.4% of users on Willis Street, 0.7% of users on Courtenay Place).
Crashes involving a cyclist are more likely than crashes between vehicles to result in a death
or serious injury. People on bikes are only involved in 6% of crashes, but these crashes
represent 20% of death and serious injury crashes.
The Let’s Get Wellington Moving (LGWM) programme has identified a number of routes
throughout the central city to be developed as part of a safe and connected cycling network,
as shown in Figure 60. The street sections of the Golden Mile included are:
Willis Street – Boulcott Street to Mercer Street
Courtenay Place – Cambridge Terrace to Taranaki Street
The following map shows the proposed cycling network and the current bicycle level of service
on that network. Level of service is a measure of mid-block quality which has been calculated
using a Danish methodology21. The calculation primarily takes account of lane widths, traffic
speeds and traffic volumes. Courtenay Place shows LOS B (good) and Willis Street shows
LOS C (adequate).
21 Jensen, S. U. (2007). Pedestrian and bicyclist level of service on roadway segments.
Transportation Research Record, 2031(1), 43-51.

66
Figure 60: Central city cycleway network concept
Figure 61 shows recommended types of facilities considered appropriate under varying traffic
speeds and volumes. Essentially people on bikes are comfortable to share with traffic if
volumes are low and speeds are slow. However, as volumes and speeds increase, higher
degrees of physical separation are appropriate. While speeds on the Golden Mile sections are
30 km/h or less, volumes are quite high so separate lanes for people on bikes become
necessary.

67
Figure 61: Cycle levels of service
Areas such as Lambton Quay and Willis Street will be destinations for a significant number of
cyclists. Wellington City Council’s vision for accommodating this demand is bicycle parking in
adjacent areas, such as Grey Street. This will allow people on bikes to access the Golden Mile
by using the cycleway network and then walking for the last segment of the journey.
Although most of the Golden Mile has not been designated as part of the strategic cycling
network, increasing cycling on that network will lead to higher numbers on the Golden Mile. In
a dense urban environment such as the Golden Mile, it is important to plan for bicycles on all
streets.
Bikes in bus lanes
While Wellington City Council has a vision for a central city cycleway network that is largely
not on the Golden Mile, it is worth considering whether people on bikes should be allowed to
use bus lanes on the Golden Mile as it would improve accessibility and permeability for people
on bikes. Currently much of the Golden Mile has bus only lanes, which do not legally allow
bicycles.

68
Two issues must be considered with regard to allowing bikes to mix with buses on the Golden
Mile: safety for people on bikes and potential delays for people on buses. In narrow sections
which contain a bus stop, cyclists might be tempted to pass a stopped bus without sufficient
room, potentially leading to a crash between a bus and bike. Potential delays for people on
buses due to bikes are dependent on relative speeds and volumes of the two types of traffic.
The Golden Mile has a mix of Bus Lanes and Bus Only lanes. Bus lanes may be used by
cyclists, motorcyclists and taxis whereas only buses are permitted to use Bus Only lanes. The
following table lists the 17 bus lane restrictions along the Golden Mile.
Table 4: Bus lane restrictions on the Golden Mile
Street Section Restriction Application Width (m)
Lambton Quay Southbound Mulgrave St to Bunny St
Bus only At all times
Lambton Quay Southbound Whitmore St to Brandon St
Bus lane (buses, bicycles and motorcycles)
At all times
Lambton Quay Southbound Brandon St to Hunter St
Bus only At all times 3.9 with bus stop
Lambton Quay Northbound Grey St to Bowen St
Bus lane (buses, bicycles and motorcycles)
At all times
Lambton Quay Northbound Bowen St to Mulgrave St
Bus only At all times 3.8
Hunter St Eastbound Lambton Quay to Customhouse Quay
Bus only At all times 3.3
Customhouse Quay
Southbound Hunter St to Williston St
Bus only At all times 4.0
Willis St Southbound Willeston St to Manners St
Bus only At all times 3.6 with bus stop
Manners St Westbound Cuba to Victoria St
Bus only At all times 3.2
Manners St Westbound Victoria St to Willis St
Bus only At all times 3.3 with bus stop
Manners St Eastbound Willis St to Victoria St
Bus only 6am-7pm Mon-Fri
3.3
Manners St East bound Victoria St to Cuba St
Bus only At all times 3.2 with bus stop
Manners St Eastbound Cuba St past Opera House/Lukes Lane to Taranaki St
Bus only At all times 3.7
Courtenay Place
Eastbound from Taranaki St to near Tory St
Bus Lane (buses, bicycles and motorcycles)
4-6pm Mon-Fri

69
There is also an issue with the comprehension of the current bus lane marking system to
users. Due to reported issues with incorrect vehicles using the ‘Bus only’ lanes across the city,
Wellington City Council conducted research22 on peoples’ understanding of bus lane
markings. It was unclear whether this was due to a lack of understanding of the rules for the
lanes or was a result of intentional behaviour. A survey was conducted that looked at the first
of these aspects by testing understanding of the two existing bus lane types and two proposed
new lane markings for these. It did not explore attitudes towards the lane rules or intentions to
abide by these. Figure 62 shows the bus lane signage examples used in the survey.
22 Public Understanding of bus lane markings,WCC, July 2017.
Courtenay Place
Eastbound from Tory St to Blair St
Bus Lane (buses, bicycles and motorcycles)
At all times
Courtenay Place
Westbound from Cambridge Tce to opposite Allen St
Bus Lane (buses, bicycles and motorcycles)
At all times
Courtenay Place
Westbound from Tory St to near Taranaki St
Bus Lane (buses, bicycles and motorcycles)
At all times

70
Figure 62: Bus lane marking examples used in the survey
Survey items exploring understanding of the four marking variations were included in the
2016/2017 Wellington City Council Residents Monitoring Survey. This is an annual survey of
Wellington residents that is representative of the wider population on age, gender and ward
(to achieve this, the data was post-weighted). A separate item for each image was included in
the survey. To ensure participants were not cued with possible answers, each item and image
was presented on a separate page with the question “What can travel in the lane pictured?”
with an open-ended text box for their response. Each participant was also presented with the
images in the same order: 1) Current ‘Bus Lane’ markings, 2) Current ‘Bus Only’ lane
markings, 3) proposed ‘Bus Lane’ markings and 4) proposed ‘Bus Only’ lane markings.
Every participant listed buses when asked what could travel on roads painted with the existing
‘Bus Lane’ markings, as shown in Figure 63. However only one quarter listed cyclists, one in
ten listed taxis and less than 10% listed motorbikes. When presented with the proposed new
‘Bus Lane’ markings featuring the ‘sharrow’ symbol, the proportion of respondents who listed
cyclists as being allowed to travel in the lane increased by more than 60 percentage points, to
86% of the total sample.

71
Figure 63: Comparison of Bus Lane markings
Every participant listed buses when asked what could travel on roads marked with both the
existing ‘Bus only’ lane markings and the proposed new markings (see Figure 64). Only a
small proportion of the sample (4%) listed cyclists when presented with the image depicting
the existing markings, however this dropped to 1% when presented with the proposed new
markings.
Figure 64: Comparison of Bus Only Lane markings
The evidence suggests that including the sharrow symbol on the markings for bus lanes in the
city would dramatically improve understanding that cyclists are allowed to travel on these. The
2%
2%
4%
7%
86%
99%
2%
3%
6%
10%
25%
0% 10% 20% 30% 40% 50% 60% 70% 80% 90% 100%
Private vehicles
Emergency vehicles
Motorbike or moped
Taxis
Cyclists
Bus
Existing 'Bus Lane' signage Proposed 'Bus Lane' signage
0%
0%
0%
2%
1%
0%
0%
2%
2%
4%
0% 10% 20% 30% 40% 50% 60% 70% 80% 90% 100%
Motorbike or moped
Private vehicles
Taxis
Emergency vehicles
Cyclists
Bus
Existing 'Bus Only' lane signage Proposed 'Bus Only' lane signage

72
flip side of this is that understanding that other vehicle types who are also allowed to use these
lanes (i.e. taxis and motorbikes) may slightly decrease and remain very low.
It appears that changing the lane colour for ‘bus only’ lanes from green to red would help to
differentiate the two different lane types and improve understanding that they have a different
set of rules from bus lanes (and therefore that other types of road users are not permitted to
use these).
If the new proposed markings were installed across the city, the data suggests it would likely
result in more cyclists using the ‘bus lanes’ and slightly less using the ‘bus only’ lanes (as the
proportion of respondents who believed cyclists could travel in the ‘bus only’ lanes with the
existing markings was very low to begin with). It is important to note that as the research did
not explore attitudes towards the bus lane rules or intentions to abide by these it is difficult to
ascertain the full impact that changing the markings would have on behaviour.
In the Courtenay Place section of the Golden Mile, a high level of service for people on bikes
should be developed as it is required as a link in the strategic central city cycleway network.
In the remaining sections of the Golden Mile, consideration should be given to allow people
on bikes to use the road to facilitate access to local destinations. This will require further
analysis regarding potential conflicts between buses and bikes.

73
General parking
Short-term metered parking facilitates access to local destinations, such as retail,
entertainment, and medical or professional services23. There are currently a total of 99
metered parking spaces along the Golden Mile. These parking spaces are currently
managed with a combination of time limits and charges. Stays are limited to two hours or
less and there is an hourly charge of $3.50-4.50, depending on location.
Provision of mobility parking spaces is important to ensure access to the central city for all
people. Currently there are no mobility parking spaces on the Golden Mile, although there
are mobility spaces in the direct vicinity of the Golden Mile, including on Taranaki St (one
space) and Allen St (two spaces), near Courtenay Place and Brandon St (two spaces) and
Balance St (one space) near Lambton Quay.
There are a total of 60 metered two-hour parking spaces on Courtenay Place; they are
located over 400 metres between Taranaki St and Cambridge Tce. There are many more
short-term car parks on surrounding streets in the area, including 73 parks on Allen St and
46 parks on Blair St.
Figure 65 shows the average daily number of cars parking in short-term metered parking
spaces on Courtenay Place by length of stay24. On average, just over 600 cars park in the
60 parking spaces on Courtenay Place each day, with each spot being used by around 10
cars each day. Around 850 people use metered parking facilities to access Courtenay Place
each day. Usage is relatively evenly split between people staying under 30 minutes (42% of
cars) and people staying between 30 minutes and 2 hours (49% of visitors). About 9% of
cars exceed the 2 hour time limit. Overall, people parking represent about 1% of people
using the street space, while parking uses about 19% of the street space on Courtenay
Place (Figure 13).
23 Provision of parking by Wellington City Council is set within the coxtent of the Parking Policy (2007),
which is currently under review. 24 Based on parking sensor data from 1 to 31 March 2019.

74
Figure 65: Daily number of cars parking on Courtenay Place by stay length
There are a total of 39 metered two-hour parking spaces on Lambton Quay; they are located
over 600 metres between Panama St and Bunny St. There are many more short-term car
parks on surrounding streets in the area, including 92 parks on Stout St and 63 parks on
Balance St.
Figure 66 shows the average daily number of cars parking in short-term metered parking
spaces on Lambton Quay by length of stay25. On average, around 300 cars park in the 39
parking spaces on Lambton Quay each day, with each space being used by around seven
cars each day. Around 400 people use metered parking facilities to access Lambton Quay
each day. The majority of visitors (54%) stay between 30 minutes and 2 hours, with a
minority (37%) staying under 30 minutes. About 9% of cars exceed the 2 hour time limit. In
sections of Lambton Quay with metered parking, people parking represent about 1% of
people using the street space, and parking uses about 19% of the street space (Figure 4).
25 Based on parking sensor data from 1 to 31 March 2019.
0
20
40
60
80
100
120
140
160
180
10 to 15 minutes 15 to 30 minutes 30 minutes to 1 hour 1 to 2 hours More than 2 hours
Nu
mb
er
of
cars
par
ked
pe
r d
ay

75
Figure 66: Daily number of cars parking on Lambton Quay by stay length
Short-term metered parking uses a disproportionate amount of space and is only used by a
very small proportion of people who use the Golden Mile each day. People walking and on
buses represent the large majority of users and there is a desire to improve the levels of
service for these modes. Provision of parking for general users should only be considered
after pedestrians, people on buses, servicing, and mobility users have been accommodated.
Taxis on the Golden Mile
Taxis and other passenger service vehicles (e.g. Uber and Ola) play a role in providing
access to the central city26. There are currently a total of 21 taxi parking spaces on the
Golden Mile. Of these spaces, nine are located on Lambton Quay (Figure 67) and 12 are
located on Courtenay Place (Figure 68). On Courtenay Place, most of these spaces serve
as loading zones during the day and taxi stands at night (Figure 68). There are also taxi
parking spaces on surrounding streets in the area, including on Mercer St, Whitmore St, and
Dixon St. Unlike metered spaces, Wellington City Council does not have parking sensors
installed in taxi parking spaces, so little is known on the usage patterns of these spaces.
26 Other lighter passengers vehicles such as Uber are permitted to use taxi parking spaces under the
Land Transport Amendment Act 2017
0
10
20
30
40
50
60
70
80
90
100
10 to 15 minutes 15 to 30 minutes 30 minutes to 1hour
1 to 2 hours More than 2 hours
Nu
mb
er
of
cars
par
ked
pe
r d
ay

76
Figure 67: Taxi stands and loading zones on Willis St and Lambton Quay

77
Figure 68: Taxi stands and loading zones on Manners St and Courtenay Place
Crowding and illegal parking by taxis has been an ongoing issue and a significant problem for
Council’s parking services team. This is especially problematic in Courtenay Place during
weekend evenings when illegal parking by taxis is often impacting on bus stop access.
Wellington City Council has introduced ‘taxi restricted parking areas’ at several locations to
prevent taxis parking in metered spaces near taxi stands. These have been useful but taxis
continue to park illegally when they can and enforcement of these areas is challenging.
Taxis and other passenger service vehicles will continue to play a role in providing access to
the central city, and are a particularly important component of the transport system around
specific types of destinations, such as hotels, entertainment, and food/beverage services.
Consideration should be given to the appropriate location and provision of taxi stands, and the
extent to which these should be located on the Golden Mile itself, or on adjacent streets.
Service Vehicles on the Golden Mile
On-street servicing is required for many commercial businesses along the Golden Mile which
do not have off-street loading areas. To date, Wellington City Council practice has been to

78
provide these sparingly because the District Plan requires premises to provide for their goods
servicing needs on-site rather than kerbside. There are currently a total of 21 loading zone
parking spaces on the Golden Mile. Of these spaces, 14 are located on Willis Street and
Lambton Quay (Figure 67) and 7 are located on Manners Street and Courtenay Place (Figure
68).
In the case of Lambton Quay, the majority of buildings are modern and are able to be serviced
away from Lambton Quay. The major buildings on the west side with few exceptions have
service access from The Terrace. On the Willis, Manners and Courtenay sections of the
Golden Mile, there is a mix of newer and larger buildings which have good on-site servicing
and do not need to use the Golden Mile for servicing directly, and older buildings which have
less satisfactory servicing arrangements and where kerbside servicing is required.
A more recent servicing issue is the move to just-in-time servicing and the growth in the use
of courier type vehicles. This has put pressure on local streets and requests for more kerbside
loading zones, and the Council needs to carefully validate such requests against the ability of
businesses to use an on-site facility.
Servicing is necessary for many commercial businesses along the Golden Mile. The utility and convenience of providing on-street loading zones on the Golden Mile itself should be considered both against other priorities and the feasibility of alternative arrangements, including on-site servicing, servicing from adjacent streets, and time of day restrictions for servicing. Any recommendations for interventions will need to determine how service vehicles and deliveries will continue to be accommodated.

79
The large majority of users along the Golden Mile are people in buses and pedestrians. Both
of these types of users currently face delays and low levels of service. Significant
improvements in levels of service for both people in buses and pedestrians are highly
desirable, and will provide benefits to both the transport system and to Golden Mile as a place
to live, work, and play.
Although people in buses and pedestrians represent the majority of users of street space on
the Golden Mile, this is not reflected in the allocation of street space. On average, 50% of
space is allocated to private vehicles although they represent a small minority (10% or less)
of users of the Golden Mile.
Bus services on the Golden Mile face slow operating speeds and bus volumes are
approaching maximum capacity levels. For buses, improvements should seek to improve
speeds and reliability to improve current levels of service. Improvements should also seek to
improve bus capacity along the Golden Mile to accommodate patronage growth and improve
bus operations.
Pedestrians walking along the Golden Mile face amenity and safety issues. Footpaths are
often over-crowded (particularly at pinch points such as bus stops) pedestrians face long
delays at traffic signals, and conflicts between people walking and motor vehicles have
resulted in serious injuries and fatalities.
To a certain extent, pedestrians and buses are incompatible so must be physically separated
to minimise safety risks. In some cases, there will be inherent conflicts between pedestrian
and bus levels of service, such as at traffic lights.

CGolden Mile Preliminary Analysis - Pedestrian Link + Place Qualities

GOLDEN MILE PRELIMINARY ANALYSIS - PEDESTRIAN LINK + PLACE QUALITIES
LETS GET WELLINGTON MOVING
DRAFT 16 DECEMBER 2019

SUMMARY
The following document presents a preliminary stocktake of ‘place’ quality for Golden Mile. The place quality includes both the ‘linking or movement function of the space, and the dwelling function. The document is preliminary as there is a more full-some analysis to be pro-vided as further observations and evaluations are undertaken.
SPACE ALLOCATION
The extent of the street width allocated to people
moving or dwelling in the space varies across the
length of Golden Mile.
In several places the width of space allocated
to volumes of people moving is insufficient. Pedestrian volumes for Lambton Quay are over
63,000 people per day (refer LGWM Problem
Definition) - 30% of space is for pedestrians and 45% of the people using the space are pedestrians. 29% of the space is allocated to people in cars and only 9% of the people moving within the street are in cars. The allocation is
also a problem in Willis Street . The allocation
is better balanced in Courtenay Place for
pedestrians.
Pedestrian crowding is also an issue as a
function of space allocation. The LGWM Problem
Definition details.
Pedestrian volumes are responsive to amenity
and studies (eg Auckland Council in response
to shared street spaces being formed and in
Manners Street Wellington) show that amenity provision increased foot traffic and leads to increased vibrancy and prosperity.
In 2004 Gehl Architects recommended limiting
Golden Mile to pedestrian and bus traffic only with wider footpaths. Car parking in the Golden
Mile also takes up space that could otherwise
provide for the larger proportion of people using
the space for walking or dwelling. In 2004 at
the time of Gehl’s report there were close to
16,000 car parks in the city (not all on the street) compared to Copenhagen (3100) or Oslo (4800) - cities with more prioritisation to public transport, walking and cycle modes of movement.
OBSTRUCTIONS
There is a cluttered street environment through
Golden Mile. The proliferation of poles (some
redundant), bins, signs, sandwich boards, advertising billboard panels, bollards, seats etc
impacts on the available space for pedestrian
movements, affects functionality of the space for users - issues observed for example of bus unloading onto places where there are bins etc.
Some of these items have been placed to reduce
the risk of pedestrians crossing into path of
buses post changes to the bus network through
Manners Street.
Gehls 2004 report recommended removing
sandwich boards from streets.
CONNECTIVITY
There are long standing aspirations to link
Golden Mile to waterfront (refer to Central City
Framework 2040 _Waterfront Connections) and (Preliminary) Place Movement Framework (2019).
The streets are there, but the quality of the
connectivity is variable in terms of the wayfinding from LQ, and across the various north/south
streets.
The best streets for connection are Grey Street
and Mercer Street in terms of relative numbers of
pedestrian connection movements.
The settings by which crossings are controlled
in influential to the quality of the public realm amenity. There are relatively low levels of
service at these crossings (most are LOS C to F).
There are also desire lines for crossing the
Golden Mile side to side. These can be observed
as tracking across medians and on street
observations of informal crossings. The kerb
heights in some places such as at bus stop
locations also affects the connectivity across the street as an informal movement.
Connections to The Terrace as well as along
popular routes such as Stout Street to the
Railways Station need to be considered.
PLACE/COMFORT
The Golden Mile follows the old harbour shore
line. The older buildings along the route and
their format (triangular shapes as grid meeting
curving harbour) and cultural heritage sites are significant. There is an opportunity for these to be better respected/reflected.
For example at LQ/Old BNZ and Hunter Street the tightness of space reflects poorly on the significance of this area for history of the city. Similarly at the Parliamentary precinct
the significance of the place is not reflected in the public realm treatment and relative
allocation of vehicle provision versus dwelling
and appreciation space. The opportunity for
a Parliamentary connection to waterfront is a
long standing consideration (refer to Central City
Framework 2040_Parliamentary Precinct).
Dwelling places are few and far between and
most (80%) of the open space in the city centre (except the waterfront) is actually the streets themselves. The opportunity to create more
dwelling places that are sunny at the times
of day they are needed (like Midland Park) is important to consider. The Gehl Report also
makes this recommendation (and measures
dwelling activities in Lambton Quay (1255
dwelling day time inc Midland Park) Courtenay Place 608 dwelling (most in evening). Climatic responsiveness is important (wind/shelter) - small spaces rather than larger ones are needed.
More such spaces that also enable refuge in
disaster events is a consideration. Improved
place value may also enable a more diverse
land use. Residential (or even hotel) uses in Lambton Quay would encourage more social
uses (food/beverage support services) that will work to provide a higher use of this part of the
city after hours and generate increase business
prosperousness..
BUILT EDGE
The Golden Mile id generally framed by
continuous building frontages. The quality of
these frontage is influential to the experience for people within the street. Gehls 2004 report
describes the condition along the Golden Mile
as generally ‘Attractive or Pleasant (on a 5 step
scale of Attractive to Unattractive). The edges of Te Aro Park and along the south side of
Courtenay Place were seen to be Unattractive or
Dull which hold true today.
There is a limit to Golden Mile’s LGWM direct
investment influence to built edges. However, the way the investment in the public realm to enable
movement outcomes is made can influence the response of private landowners to the street built
edge.
New public realm dwelling spaces (such as cul-de-sac side streets) should be developed generally only if there are built edges and ground
levels uses that have the potential to respond to
the space (determined through engagement with
building owners).
SAFETY
Pedestrian safety is a function of the public
realm design and the conflict between people and vehicles within the street space. 28% of the crashes are between pedestrians and cyclists
and vehicles but account for 95% of the deaths and serious injuries (refer LGWM Problem
Definition).
Personal safety is also a factor of the
environment design - opportunities for concealment or poor sight lines (such as by
shrubs or obstructions are an issue in places.
The assault crime reported in the Lambton Area
(which is most of the north part of the city centre) is 280 and significantly less than Courtenay Place area (which is most of Te Aro) with over 1050) assaults (2014-2017: NZ Crime Maps).
Most assaults in the Courtenay Place area occur
between 2am and 5am, and Lambton Quay is
more late evening.
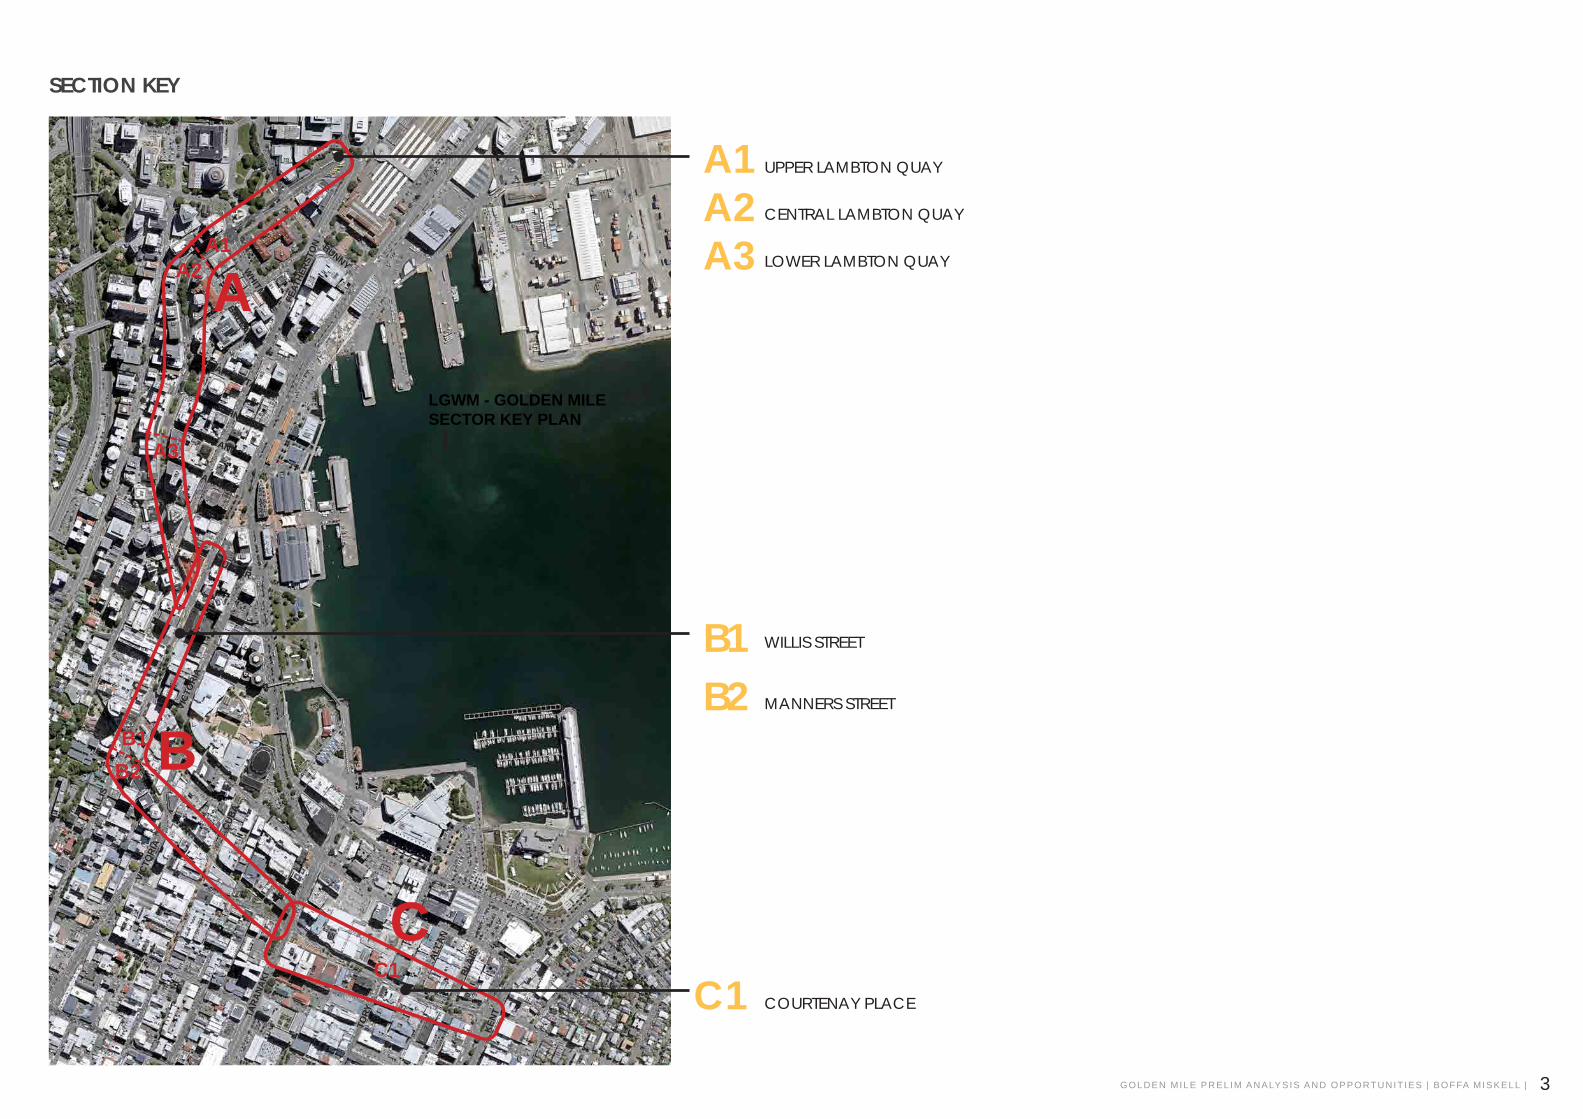
UPPER LAMBTON QUAY
CENTRAL LAMBTON QUAY
LOWER LAMBTON QUAY
WILLIS STREET
MANNERS STREET
COURTENAY PLACE
3GOLDEN MILE PREL IM ANALYSIS AND OPPORTUNIT IES | BOFFA MISKELL |
SECTION KEY
A1
A2
A3
B1
A
BB2
CC1
TA
RA
NA
KI
KE
NT
TO
RY
ALLA
N
BLA
IR
CU
BA
VIC
TO
RIA
WIL
LIS
FE
ATH
ER
STO
N
LGWM - GOLDEN MILE
SECTOR KEY PLAN
BUNNY
BA
LLA
NC
E
WARING TAYLOR
JOHNSTON
BRANDON
PANAMA
GREY
HUNTER
HARRIS
WH
ITM
OR
E
VIC
TO
RIA
A1A2A3
B1B2
C1

CONNECTIVITY BUILT EDGE CONDITION OBSTRUCTIONS
UPPER LAMBTON QUAYBUS STATION TO BALLANCE ST
4 GOLDEN MILE PREL IM ANALYSIS AND OPPORTUNIT IES | BOFFA MISKELL |
COURTENAY P
L
MANNERS ST WILLIS ST
LAMBTON QUAY
TARANAKI
KENT
UPPER LAMBTON QUAYBUS STATION TO BALLANCE ST
ANALYSIS
The side street option to waterfront and up to
The Terrace are multiple. Important connection
too along Stout Street to railway station as direct
route for pedestrians. Whitmore St - although a strong connection to waterfront is a traffic dominated space.
Bunny Street is important connector from Parliament to waterfront via station and
more pedestrian enabled (although room for
improvement).
Not so easy getting across the LQ road given width and intersections (like Bowen Street) challenging given the free turn lane. Other places too - like Stout and Ballance St cars turning have to be watched out for.
ANALYSIS
The street edge at the Parliamentary end of LQ
is different than most of The Golden Mile being an open more campus like form. The railway
station is similar with its garden-esque forecourt. The landscape of parliament and old Government
buildings are reasonably ‘defensive’ with wall/
fences around.
From Bowen Street south the street edge revert to typical with buildings to the back of the footpath
and display windows mostly. Some places like
Old Bailey pub have an outdoor seating area arrangement.
ANALYSIS
Clutter and placement of objects like bus shelters
(eg outside Supreme Court) together with sign/advertising displays affect quality of space for movement and simplicity/sight lines. Space is
squeezed at some locations (like outside Old Bailey pub)
OPPORTUNITIES
Increasing the ease of crossing of LQ with
median/footpath widening. Claiming more of
Stout St as a strong ped connection with removal
or reconfiguration of parking.
Making a big public space boulevard on Bunny Street to recognise significance of parliament hill to waterfront.
Connections up to Terrace could be better made,
but challenging given built edges. Probably needs
new building to make this work.
OPPORTUNITIES
heritage values suggest that the open landscape
and buildings sitting within them is important to
retain. The uniting of the landscape via the street
plane is an opportunity.
OPPORTUNITIES
Decluttering and rationalisation of stops/poles,
bins, seats. Making a better crossing point
through the median would be useful desire line.
A1

COURTENAY P
L
MANNERS ST WILLIS ST
LAMBTON QUAY
TARANAKI
KENT
OVERVIEW OF ANALYSIS AND OPPORTUNITIES
PLACE/COMFORTSPACE ALLOCATION SAFETY
UPPER LAMBTON QUAYBUS STATION TO BALLANCE ST
5GOLDEN MILE PREL IM ANALYSIS AND OPPORTUNIT IES | BOFFA MISKELL |
ANALYSIS
Strong sense of place at the government end - Parliament/Old Government Buildings, cenotaph and grounds - campus. Courts also reflect the government function. The Stout Street area also
strong heritage (old State Insurance and Public
Trust, Missions to Seamen, and old Defence
building. Street trees in median are of a good
size and condition in LQ where they have had
space to grow.
As with most of Golden Mile the frequency and
dominance of bus movements in the space
affects the comfort of the place. Its possibly a bit better here than where more confined.
ANALYSIS
Wide space in this area and much of it allocated
to vehicle movement - turning lanes and through lane for buses, to Molesworth Street and Bowen Street.
ANALYSIS
Lanes that connect up to Terrace are challenging
- not so comfortable at night. The lack of people in this part of town at night reduces the perceived
sense of safety. Not sure about current bus station - secluded places
OPPORTUNITIES
Stout Street and tie back to government area as
heritage precinct - link also to railway station for walking connection.
Allocating space as noted to allow a united
ground plane that link elements in the
government precinct .
Reflecting on the old streams from Bowen St and thinking about stormwater design would be
possible in this wider public realm.
OPPORTUNITIES
Rationalise the space to connect the street plane
across between parliament and old government
buildings - buses still track through. Reduce the traffic throughput to Molesworth St?
On LQ make wide ‘promenade’ public realm that runs on east side of street all the way from bus
station to midland park (can take up street space
to current median - buses on the west side in two lanes - alight bus from current median position which is new edge to promenade.
OPPORTUNITIES
Maybe difficult but opening up the lane connections to The Terrace would assist - these are generally attached to buildings so may not be
so easy.
A1
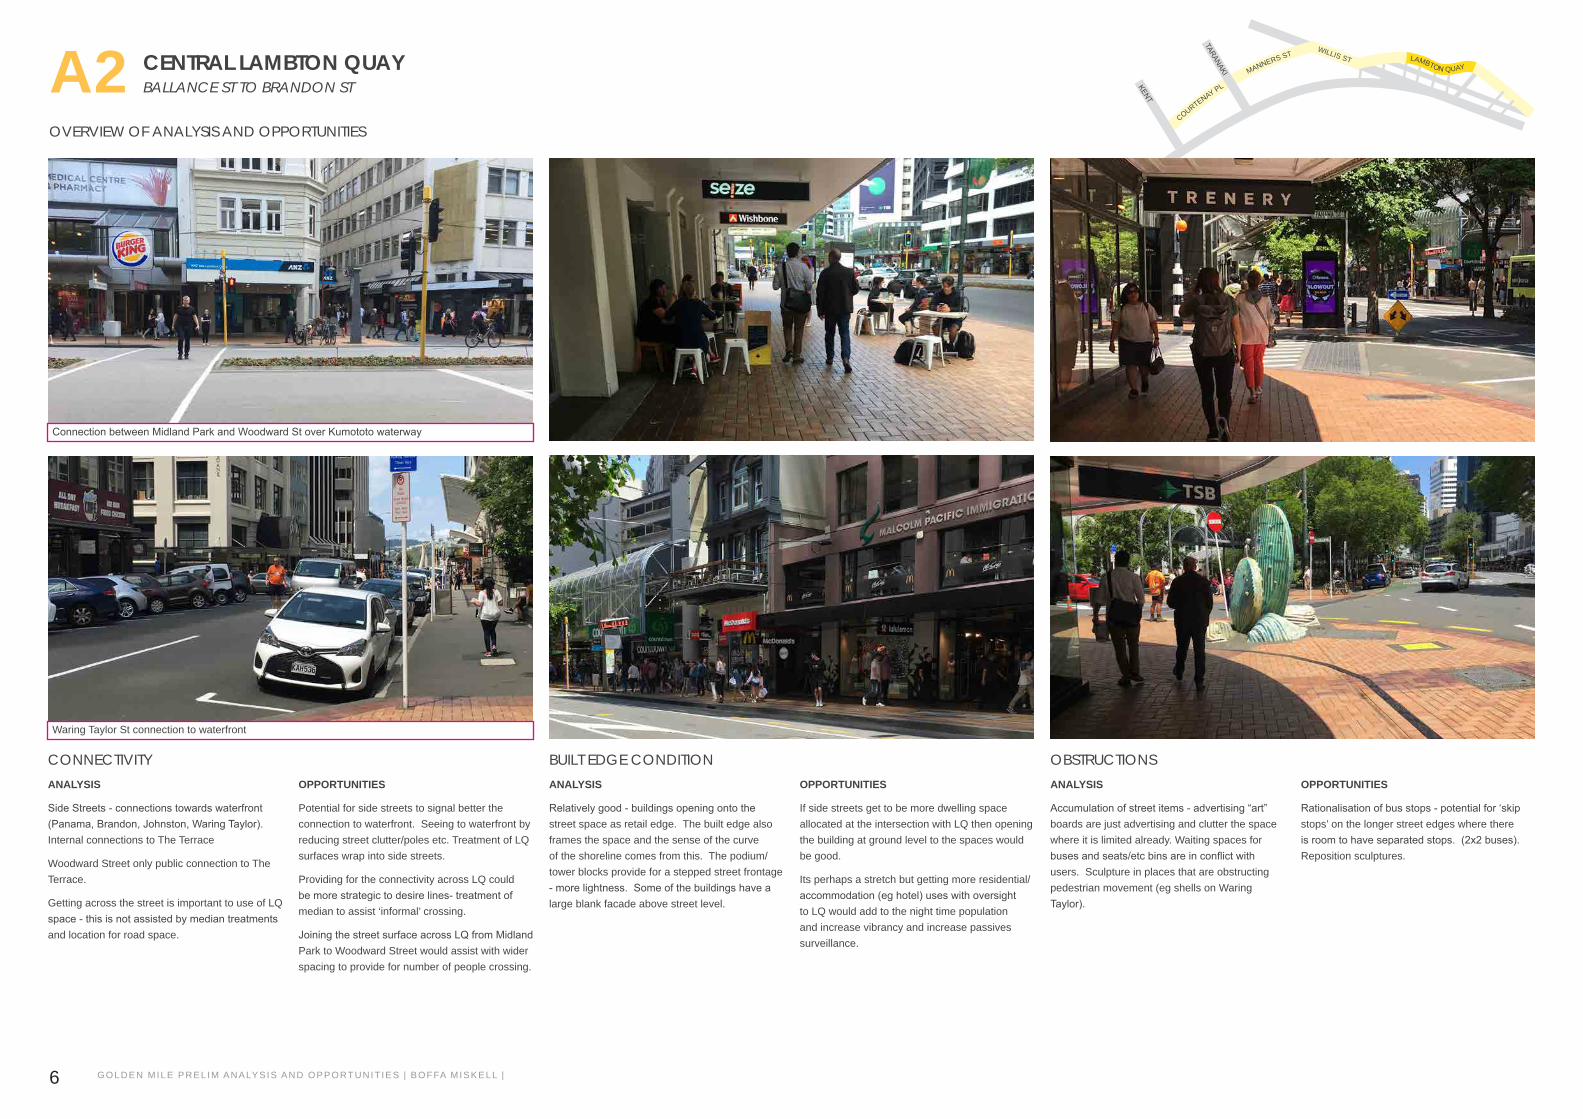
OVERVIEW OF ANALYSIS AND OPPORTUNITIES
CONNECTIVITY BUILT EDGE CONDITION OBSTRUCTIONS
6 GOLDEN MILE PREL IM ANALYSIS AND OPPORTUNIT IES | BOFFA MISKELL |
COURTENAY P
L
MANNERS ST WILLIS ST
LAMBTON QUAY
TARANAKI
KENT
ANALYSIS
Side Streets - connections towards waterfront (Panama, Brandon, Johnston, Waring Taylor). Internal connections to The Terrace
Woodward Street only public connection to The
Terrace.
Getting across the street is important to use of LQ
space - this is not assisted by median treatments and location for road space.
ANALYSIS
Relatively good - buildings opening onto the street space as retail edge. The built edge also
frames the space and the sense of the curve
of the shoreline comes from this. The podium/
tower blocks provide for a stepped street frontage
- more lightness. Some of the buildings have a large blank facade above street level.
ANALYSIS
Accumulation of street items - advertising “art” boards are just advertising and clutter the space
where it is limited already. Waiting spaces for
buses and seats/etc bins are in conflict with users. Sculpture in places that are obstructing
pedestrian movement (eg shells on Waring
Taylor).
OPPORTUNITIES
Potential for side streets to signal better the
connection to waterfront. Seeing to waterfront by
reducing street clutter/poles etc. Treatment of LQ
surfaces wrap into side streets.
Providing for the connectivity across LQ could
be more strategic to desire lines- treatment of median to assist ‘informal’ crossing.
Joining the street surface across LQ from Midland Park to Woodward Street would assist with wider
spacing to provide for number of people crossing.
OPPORTUNITIES
If side streets get to be more dwelling space
allocated at the intersection with LQ then opening
the building at ground level to the spaces would
be good.
Its perhaps a stretch but getting more residential/
accommodation (eg hotel) uses with oversight to LQ would add to the night time population
and increase vibrancy and increase passives
surveillance.
OPPORTUNITIES
Rationalisation of bus stops - potential for ‘skip stops’ on the longer street edges where there
is room to have separated stops. (2x2 buses). Reposition sculptures.
BALLANCE ST TO BRANDON STCENTRAL LAMBTON QUAYA2
Waring Taylor St connection to waterfront
Connection between Midland Park and Woodward St over Kumototo waterway

OVERVIEW OF ANALYSIS AND OPPORTUNITIES
PLACE/COMFORTSPACE ALLOCATION SAFETY
7GOLDEN MILE PREL IM ANALYSIS AND OPPORTUNIT IES | BOFFA MISKELL |
COURTENAY P
L
MANNERS ST WILLIS ST
LAMBTON QUAY
TARANAKI
KENT
ANALYSIS
As with most of the confined part of Golden Mile the frequency and dominance of bus movements
in the space affects the comfort of the place.
Curving nature of LQ can be read - building frontages and position assist this. Some lighter
spaces where sun access mid day.
Midland Park provides high quality amenity mid
day and assisted by green and cafe edges.
There is reasonably substantial tree planting in
median improve amenity - flower beds are also present and add colour but may not be a long
term sustainable approach given maintenance
needs and limiting to informal crossing positions.
ANALYSIS
The footpath here is some of the widest on
Golden mile and provides one of the best places
for a bus stop (David Jones) where the canopy provides shelter.
ANALYSIS
People take risks to cross through planted
median. Protecting the footpath from vehicles
(bollards) signals to drivers to have right of way and entitlement within road space.
Cycles share the road with vehicles which
generates at least discomfort for cyclists using
road space .
OPPORTUNITIES
Better balance of bus activity to street space by detuned buses to alternative routes.
Sense of place from Midland Park potential to be
extended to Johnston St - also in sun - Waring Taylor more shaded. The closure of Johnston St would reduce side friction to Quay for buses.
Can provide for loading and taxi waits.
Potential to reflect more of Kumutoto Stream presence. Perhaps water sensitive urban design
approach?
OPPORTUNITIES
LQ widens in this section and opportunity to
reallocate space on the east side (waterfront
side) to a wide promenade space - push buses to the west side of current median. Enables the side
streets to be reconfigured - potential to remove side street vehicle traffic (eg like Grey St) to make spaces for dwelling and to assist legibility
to waterfront
OPPORTUNITIES
Reduced bus frequency/speeds, proximity to
footpath/dwelling spaces would provide more
safety.
BALLANCE ST TO BRANDON STCENTRAL LAMBTON QUAYA2

OVERVIEW OF ANALYSIS AND OPPORTUNITIES
CONNECTIVITY BUILT EDGE CONDITION OBSTRUCTIONS
8 GOLDEN MILE PREL IM ANALYSIS AND OPPORTUNIT IES | BOFFA MISKELL |
TARANAKI
KENT
ANALYSIS
Important connectivity/heritage legibility up to
Boulcott/The Terrace via Plimmers Steps. Grey St to waterfront. Cable car significant
ANALYSIS
Removing loading zones and widening the
footpath - making the footpath a consistent width. Alternatively removing all traffic (Willis to will free up space for pedestrian movement and spending
time (dwelling). If buses were diverted then could also reduce the space that disconnected
MLC corner from old ANZ (Hunter St) where the Nespresso coffee place is) - this would make a good sunny dwelling space.
OPPORTUNITIES
Improved legibility to connectors - declutterring and providing more space to enable way finding decision making and visibility.
Improve crossing between Grey St and Cable car,
opening up to match demand.
OPPORTUNITIES
Lots of obstructions - factor of tightness of space too - bollards, seats, signage. At MLC end of the block also obstructions that are to separate the
bus lane south (Hunter St).
Bus waiting spot outside Nespresso is very tight and compromises movement and comfort of
users.
BRANDON ST TO OLD BANK CORNERLOWER LAMBTON QUAYA3
ANALYSIS
Relatively good - buildings opening onto the space. AMI centre not the best. Not good fit with heritage context and internal space connecting
to Plimmers Steps. Some buildings like MLC
re difficult to open up to space given form and heritage values (ie high windows and single door)
Question future of old BNZ basement edge - is this viable or can it be reconsidered?
OPPORTUNITIES
An opportunity if AA Centre building redeveloped
to make Plimmers Steps more legible. Old BNZ basement - will this stay - is the space under there viable? If no longer needed can make a wider street public realm.
Space on Grey Street works pretty well as is.
Grey St/Post Office Square could do with some street edge building to provide separation from
Jervois Quay traffic and make the square feel enclosed.
COURTENAY P
L
MANNERS ST WILLIS ST
LAMBTON QUAY

OVERVIEW OF ANALYSIS AND OPPORTUNITIES
PLACE/COMFORTSPACE ALLOCATION SAFETY
9GOLDEN MILE PREL IM ANALYSIS AND OPPORTUNIT IES | BOFFA MISKELL |
TARANAKI
KENT
ANALYSIS
Strong sense of place - BNZ/Plimmers Steps, Clay Point/Stuart Dawsons Corner and MLC/
Cable Car - form triangles as grid meets shoreline. As with most of the confined part of Golden Mile the frequency and dominance of bus
movements in the space affects the comfort of the place.
Note that Stuart Dawsons Corner under redevelopment.
Relatively shaded space - also reasonably sheltered - less windy than some spots
ANALYSIS
Narrow section of LQ. Limited space for movement BNZ/AA given proximity of buildings to street edge and allocation of space to traffic. Bus scale to human makes space feel even tighter and less comfortable. Loading zones and
multiple surfaces adds to tightness.
ANALYSIS
Personal safety feel ok - lots of people around. Tightness against road and scale of buses is
intimidating
OPPORTUNITIES
Allocate more street space for dwelling and
interpretation (see spatial allocation).
OPPORTUNITIES
Reduce traffic through this section and loading zone - or even remove all traffic and divert buses down Customhouse Quay.
OPPORTUNITIES
Removing traffic and increasing space for pedestrians will assist sense of safety. Also
enabling bikes through this narrow part without
traffic would help
BRANDON ST TO OLD BANK CORNER LOWER LAMBTON QUAYA3
COURTENAY P
L
MANNERS ST WILLIS ST
LAMBTON QUAY

OVERVIEW OF ANALYSIS AND OPPORTUNITIES
CONNECTIVITY BUILT EDGE CONDITION OBSTRUCTIONS
10 GOLDEN MILE PREL IM ANALYSIS AND OPPORTUNIT IES | BOFFA MISKELL |
ANALYSIS
Difficult to cross outside of signalled crossings - given the volumes of vehicle movement. Chews
Lane is a good example of a lane redevelopment
with views to waterfront and activated building
ground levels. Residential uses in this area
contribute life to the street.
Connection on Mercer Street is important to civic
centre and waterfront bridge.
ANALYSIS
Pretty good and consistent along the length - new development is good and residential above adds
to the vibrancy and activity on the street.
ANALYSIS
Cycle stands, signs, bollards, and seats are more
of a barrier than located for function. Sandwich
boards are a problem.
OPPORTUNITIES
Mercer Street as a walking street- closed off to vehicles - will also assist to simply design of the Victoria Street intersection and Wakefield Street which is also poor for ped connectivity
OPPORTUNITIES
Continue to support positive building edges to
street. If Mercer Street becomes a space with
no vehicle through put then the opportunities to
encourage buildings to colonise the edge will be
good and should be encouraged.
OPPORTUNITIES
Wider footpath with zone for street furniture and
signs, clear of movement area. Ban sandwich boards from all streets (even playing field)
Utilise Mercer Street for bike parking and remove
on street edge.
WILLIS STB1 OLD BANK CORNER TO MANNERS ST
COURTENAY P
L
MANNERS ST WILLIS ST
LAMBTON QUAY
TARANAKI
KENT

OVERVIEW OF ANALYSIS AND OPPORTUNITIES
PLACE/COMFORTSPACE ALLOCATION SAFETY
11GOLDEN MILE PREL IM ANALYSIS AND OPPORTUNIT IES | BOFFA MISKELL |
ANALYSIS
As with most of the confined part of Golden Mile the frequency and dominance of bus movements
in the space affects the comfort of the place.
Minimal opportunities to pause and rest.
Some pockets of space developing where minor
roads join.
ANALYSIS
Vehicle dominant with heavily congested
footpaths.
Bus stop volume conflicts with pedestrian movement.
Loading bays and vehicle stopping spaces affect the movement and passage of buses
ANALYSIS
Tightness of space and buses, cycles, walking
and micro mobility make challenging mix.
OPPORTUNITIES
The Bond Street space is a missed opportunity currently - container in best spot - cafe spill out into space. Service access to internal parking
required but can be shared street space?
Mercer Street as noted can be used as a space
too if traffic removed?
OPPORTUNITIES
Opportunities from closing of Mercer Street to reduce lane width and widening of footpath
In the interim Mercer St can have some
reallocation of space for bike parking (and its
removal from Willis Street)
Remove loading zones from Willis Street and
place elsewhere (Customhouse Quay)
OPPORTUNITIES
Re-allocate road reserve for active modes.
Widen footpaths
Reduce clutter
WILLIS STB1 OLD BANK CORNER TO MANNERS ST
COURTENAY P
L
MANNERS ST WILLIS ST
LAMBTON QUAY
TARANAKI
KENT
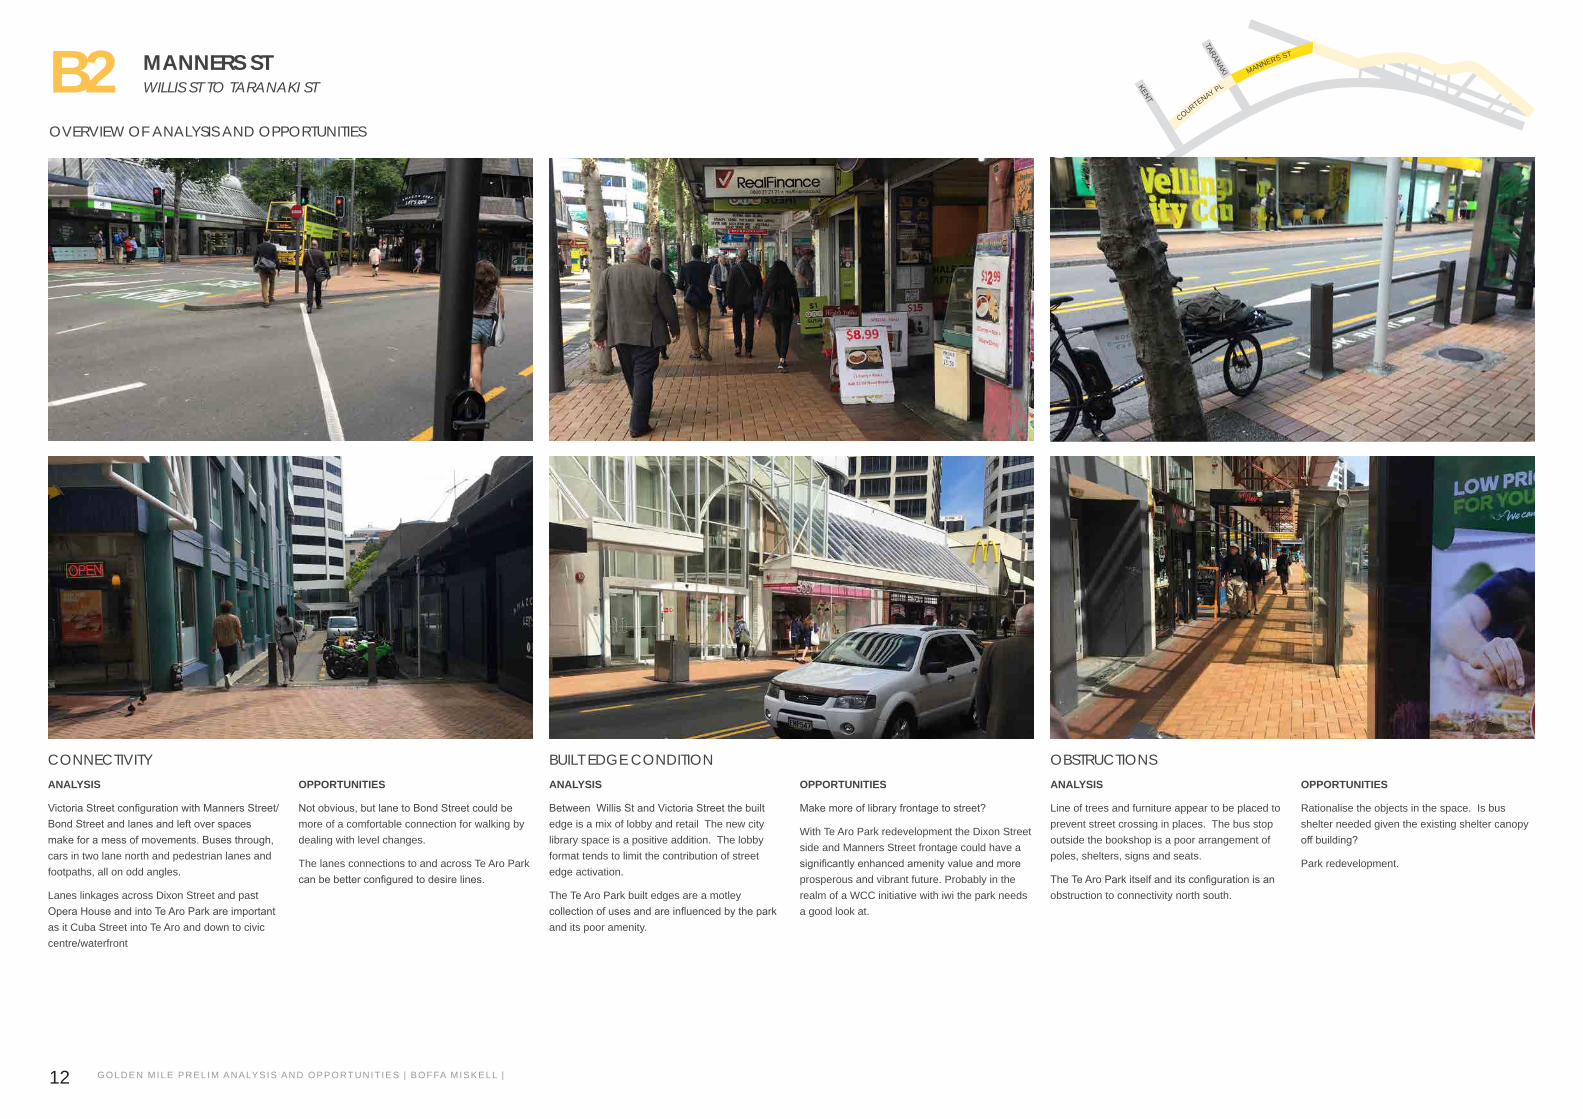
OVERVIEW OF ANALYSIS AND OPPORTUNITIES
CONNECTIVITY BUILT EDGE CONDITION OBSTRUCTIONS
12 GOLDEN MILE PREL IM ANALYSIS AND OPPORTUNIT IES | BOFFA MISKELL |
COURTENAY P
L
MANNERS ST WILLIS ST
LAMBTON QUAY
ANALYSIS
Victoria Street configuration with Manners Street/Bond Street and lanes and left over spaces make for a mess of movements. Buses through, cars in two lane north and pedestrian lanes and
footpaths, all on odd angles.
Lanes linkages across Dixon Street and past
Opera House and into Te Aro Park are important as it Cuba Street into Te Aro and down to civic
centre/waterfront
ANALYSIS
Between Willis St and Victoria Street the built edge is a mix of lobby and retail The new city
library space is a positive addition. The lobby
format tends to limit the contribution of street
edge activation.
The Te Aro Park built edges are a motley
collection of uses and are influenced by the park and its poor amenity.
ANALYSIS
Line of trees and furniture appear to be placed to
prevent street crossing in places. The bus stop
outside the bookshop is a poor arrangement of
poles, shelters, signs and seats.
The Te Aro Park itself and its configuration is an obstruction to connectivity north south.
OPPORTUNITIES
Not obvious, but lane to Bond Street could be more of a comfortable connection for walking by
dealing with level changes.
The lanes connections to and across Te Aro Park
can be better configured to desire lines.
OPPORTUNITIES
Make more of library frontage to street?
With Te Aro Park redevelopment the Dixon Street
side and Manners Street frontage could have a
significantly enhanced amenity value and more prosperous and vibrant future. Probably in the
realm of a WCC initiative with iwi the park needs
a good look at.
OPPORTUNITIES
Rationalise the objects in the space. Is bus
shelter needed given the existing shelter canopy
off building?
Park redevelopment.
MANNERS STB2 WILLIS ST TO TARANAKI ST
TARANAKI
KENT

OVERVIEW OF ANALYSIS AND OPPORTUNITIES
PLACE/COMFORTSPACE ALLOCATION SAFETY
13GOLDEN MILE PREL IM ANALYSIS AND OPPORTUNIT IES | BOFFA MISKELL |
COURTENAY P
L
MANNERS ST WILLIS ST
LAMBTON QUAY
ANALYSIS
As with most of the confined part of Golden Mile the frequency and dominance of bus movements
in the space affects the comfort of the place.
The two parts of Manners Street - the open part at Te Aro Park and enclosed part - have different comfort. Te Aro Park edge is a poor quality place
with a high cultural heritage value. Large tree is
important. The Opera House opposite should be better celebrated.
The confined Manners Street ha s mature trees which add amenity, but most of its lengths feels
like a bus channel and there is little or no dwelling
comfort.
ANALYSIS
Generally good proportional balance, some areas
restricted. Space to pull out of movement zone for
a conversation. However, feels less like a place to spend time as bus noise/dominance makes
uncomfortable.
ANALYSIS
Te Aro Park feels uncomfortable as space - poor configuration and toilets and ‘unloved’ appearance makes it hang out and anti social
behaviour. The perception of personal safety is
poor.
The speed of buses moving through the confined space is an issue. The closeness of moving bus
to kerb edge is uncomfortable.
OPPORTUNITIES
Te Aro Park being integrated into an improved
bus facility (link with MRT Taranaki St?). Redevelopment of Te Aro Park as new green
public space, toilets and interface with The Oaks (or even its removal!) to clear space to Cuba Street.
OPPORTUNITIES
Not obvious given bus function. The section along Te Aro Park is biggest opportunity to
reconsider street cross section - removal of cars from this space (Taranaki - Cuba) which would allow easier movement for buses and allow
lane widths to be further narrowed with more
pedestrian space.
OPPORTUNITIES
Park and toilets facility redevelopment.
Bus lane configuration and speed environment design.
MANNERS STB2 WILLIS ST TO TARANAKI ST
TARANAKI
KENT

OVERVIEW OF ANALYSIS AND OPPORTUNITIES
CONNECTIVITY BUILT EDGE CONDITION OBSTRUCTIONS
14 GOLDEN MILE PREL IM ANALYSIS AND OPPORTUNIT IES | BOFFA MISKELL |
ANALYSIS
Important connections across north/south
- Taranaki, Tory, Allen, Blair, Cambridge to waterfront. The direction/crossing Taranaki Street
better configured to suit desire lines.
Width of C.Place also important to enable
connectivity across from one side to the other
- relatively poor in many places. Some median provision that assists, but desire lines not
enabled. Widths of break in median not matched
to volume of people crossing.
Important connectivity point for future MRT.
ANALYSIS
Generally continuous built edges - Hospitality with limited outdoor dining. Several important
buildings - St James, Embassy and potentially Reading that generate large numbers of people
into the space.
Mixed quality, some closed for EQ repairs
(Reading)
ANALYSIS
Clutter of street furniture and signage. Crossing
points for median breaks not well enabled for
pedestrian volumes. Obstructions also obstruct desire lines.
Bus shelters obstructing the business frontage (Hummingbird) and passage for pedestrians - crowding
OPPORTUNITIES
Improved crossings at desire lines.
Joined up plan for MRT and BRT system
Potential for mid block connectivity through
Reading to Te Papa? (outside scope of LGWM)
OPPORTUNITIES
Allocated more space the building users and
owners show a willingness to colonise the street
edge.
OPPORTUNITIES
Declutter, improve crossings to desire lines.
C1 COURTENAY PLACETARANAKI ST TO KENT TERRACE
TARANAKI
KENT
COURTENAY P
L
MANNERS ST WILLIS ST
LAMBTON QUAY
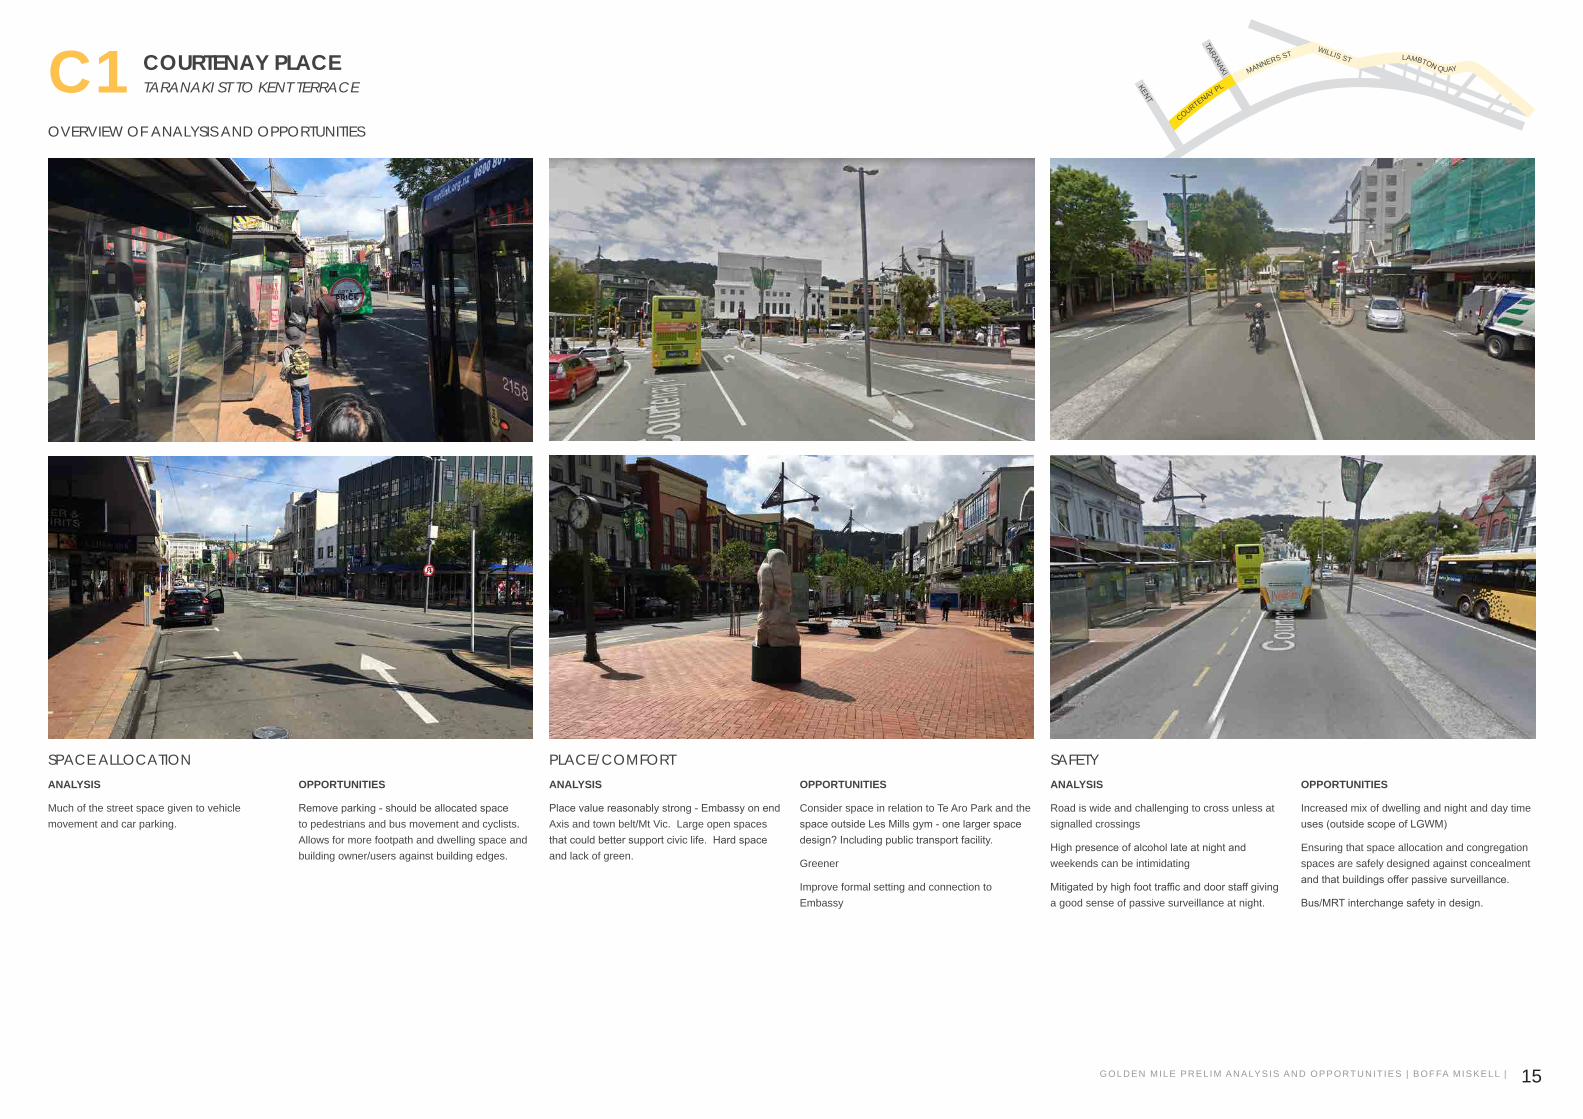
OVERVIEW OF ANALYSIS AND OPPORTUNITIES
PLACE/COMFORTSPACE ALLOCATION SAFETY
15GOLDEN MILE PREL IM ANALYSIS AND OPPORTUNIT IES | BOFFA MISKELL |
ANALYSIS
Place value reasonably strong - Embassy on end Axis and town belt/Mt Vic. Large open spaces
that could better support civic life. Hard space and lack of green.
ANALYSIS
Much of the street space given to vehicle
movement and car parking.
ANALYSIS
Road is wide and challenging to cross unless at
signalled crossings
High presence of alcohol late at night and weekends can be intimidating
Mitigated by high foot traffic and door staff giving a good sense of passive surveillance at night.
OPPORTUNITIES
Consider space in relation to Te Aro Park and the
space outside Les Mills gym - one larger space design? Including public transport facility.
Greener
Improve formal setting and connection to
Embassy
OPPORTUNITIES
Remove parking - should be allocated space to pedestrians and bus movement and cyclists.
Allows for more footpath and dwelling space and
building owner/users against building edges.
OPPORTUNITIES
Increased mix of dwelling and night and day time
uses (outside scope of LGWM)
Ensuring that space allocation and congregation
spaces are safely designed against concealment
and that buildings offer passive surveillance.
Bus/MRT interchange safety in design.
C1 COURTENAY PLACETARANAKI ST TO KENT TERRACE
TARANAKI
KENT
COURTENAY P
L
MANNERS ST WILLIS ST
LAMBTON QUAY

ContactLevel 13, 80 The TerraceWellington, 6011
+64 4 381 6700