gold supported on tungstated zirconia: synthesis ... · gold supported on tungstated zirconia:...
TRANSCRIPT

GOLD SUPPORTED ON TUNGSTATED ZIRCONIA: SYNTHESIS,
CHARACTERIZATION and IN SITU FT-IR INVESTIGATION of
NOx+C3H6 SURFACE REACTIONS
A THESIS
SUBMITTED TO THE DEPARTMENT OF CHEMISTRY AND
THE GRADUATE SCHOOL OF ENGINEERING AND SCIENCES OF
BILKENT UNIVERSITY
IN PARTIAL FULFILLMENT OF THE REQUIREMENTS
FOR THE DEGREE
OF
MASTER OF SCIENCE
By
SERDAR MAMETSHERIPOV
MAY 2012

II
I certify that I have read this thesis and in my opinion it is fully adequate, in scope and in
quality, as a thesis of the degree of Master of Science
__________________________________
Assoc. Prof. Dr. Margarita Kantcheva (Supervisor)
I certify that I have read this thesis and in my opinion it is fully adequate, in scope and in
quality, as a thesis of the degree of Master of Science
__________________________________
Prof. Dr. Şefik Süzer
I certify that I have read this thesis and in my opinion it is fully adequate, in scope and in
quality, as a thesis of the degree of Master of Science
__________________________________
Prof. Dr. Gürkan Karakaş

III
I certify that I have read this thesis and in my opinion it is fully adequate, in scope and in
quality, as a thesis of the degree of Master of Science
__________________________________
Prof. Dr. Ömer Dağ
I certify that I have read this thesis and in my opinion it is fully adequate, in scope and in
quality, as a thesis of the degree of Master of Science
__________________________________
Assist. Prof. Dr. Emrah Özensoy
Approved for the Institute of Engineering and Sciences __________________________________
Prof. Dr. Levent Onural
Director of Institute of Engineering and Sciences

IV
ABSTRACT
GOLD SUPPORTED ON TUNGSTATED ZIRCONIA: SYNTHESIS,
CHARACTERIZATION and IN SITU FT-IR INVESTIGATION of
NOx+C3H6 SURFACE REACTIONS
Serdar Mametsheripov
M.Sc in Chemistry
Supervisor: Assoc. Prof. Dr. Margarita Kantcheva
May 2012
The potential of gold supported on tungstated zirconia as a catalyst for selective
catalytic reduction of NOx with propene (C3H6-SCR) was investigated by in situ FT-IR
spectroscopy. Samples of tungstated zirconia were prepared by both impregnation and
coprecipitation methods using ammonium metatungstate (AMT) as a precursor. Gold was
deposited on the supports via cationic adsorption from aqueous solution of [Au(en)2]Cl3
complex (en = ethylenediamine). The samples were characterized by XRD, XPS, BET, DR-
UV-vis, ICP-MS and FT-IR spectroscopy of adsorbed CO. The results show that the samples
consist of tetragonal zirconia crystallites hosting uniform layer of polytungstate species. The
gold particles occupy preferentially the WOx-free zirconia surface and the dispersion of gold
depends on the amount of coodinatively unsaturated (cus) Zr4+
ions. The modification of
zirconia by tungsten facilitates the gold uptake but at the same time causes decrease in the
concentration of (cus) Zr4+
ions thus lowering the despersion of gold clusters.
The interaction of gold supported on WOx-free (Au/ZrO2) and WOx-modified zirconia
samples (Au/xWZ-I, where “I” denotes the incorporation of WO3 by impregnation and x = 5,
12, and 20 wt % of WO3) with NO+O2 gas mixture shows that the W-containing samples
promote the formation of NO2 at room temperature. The FT-IR spectra obtained at room
V
temperature during the contact of CO with gold samples containing pre-adsorbed NOx species
reveal the formation of isocyanates (NCO) coordinated to gold sites. The generation of
Au NCO species in the ad-NOx+CO reaction is confirmed by using 13
CO and treatment of the
adsorbed isocyanates with water vapor. The gold isocyanates display high thermal stability.
However, they react readily with NO2 at room temperature. This finding suggests that gold
supported on tungstated zirconia could be of interest as a low-temperature catalyst for CO-
SCR of NOx.
The FT-IR spectra recorded during the contact of C3H6 and O2 gas mixture with
Au/ZrO2 and Au/xWZ-I samples lead to the conclusion that the WOx-free sample catalyzes
the complete oxidation of propene. The Au-promoted tungstated samples, which contain
redox (W=O groups) and Brønsted acid sites, favor the partial oxidation of the hydrocarbon.
The results of a detailed mechanistic investigation show that the activation of propene
in the presence of NOx species adsorbed on Au/xWZ-I samples takes place at room
temperature producing surface isopropoxides. The interaction of the latter species with the
surface nitrate complexes leads to the formation of nitroacetone [CH3C(O)CH2NO2]. It is
proposed that at higher temperatures (e.g. 150oC) the nitroacetone coordinated to gold
particles transforms through an internal redox process producing surface acetates and
Au NCO species. The isocyanates react with the NO3 /NO2 surface complex formed by
oxidation of NO yielding molecular nitrogen, N2O and COx as reaction products. The gold-
free samples do not cause the formation of NCO species under the same experimental
conditions. This experimental fact suggests that the Au particles play fundamental role in the
formation of the NCO species. The amount of Au-NCO species produced is the highest on
ZrO2-based catalyst containing 1.8 wt % of gold and 12 wt % of WO3 (Au/12WZ-I sample).
This material combines better gold dispersion with sufficient amount of Brønsted acid sites
necessary for the activation of propene to hydrocarbon oxygenates leading to the formation of
nitroacetone. Based on the catalytic activity measurements, it is concluded that among the
materials studied, the Au/12WZ-I catalyst could be promising in the C3H6-SCR of NOx.
Keywords: In situ FT-IR; Au supported on tungstated zirconia; Selective catalytic reduction
of NOx with propene; Mechanism, Reactive intermediates.
VI
ÖZET
TUNGSTENLENMİŞ ZİRKONİYA DESTEKLİ ALTIN: SENTEZ,
NİTELEME ve NOx+C3H6 YÜZEY TEPKİMELERİN YERİNDE FT-IR
İLE İNCELENMESİ
Serdar Mametsheripov
Kimya Bölümü Yüksek Lisans
Danışman: Doç. Dr. Margarita Kantcheva
Mayıs 2012
Tungstenlenmiş zirkoniya destekli altının azot oksitlerin (NOx) propenle seçici
katalitik indirgenmesini (SKİ) katalizleme potansiyeli yerinde FT-IR spektroskopisiyle
incelenmiştir. Tungstenlenmiş zirkoniya numuneleri hem doyurulma hem ortak çöktürme
yöntemleriyle amonyum metatungstat (AMT) öncülünden sentezlendi. Altın, destek
malzemeleri üzerine (Au(en)2]Cl3 kompleksin (en=etilendiamin) sulu çözeltisinden katyonik
adsorpsiyon yöntemiyle depolandı. Numunelerin yapısal ve yüzey özellikleri XRD, XPS,
BET, DR-UV-Vis, ICP-MS ve FTIR spektroskopisi yöntemleriyle incelendi. Alınan sonuçlara
göre, numuneler politungstat türlerin tek katman tabakasını barındıran tetragonal zirkoniya
kristalitlerinden oluşmaktadır. Altın parçacıkları, tercihen WOx-içermeyen zirkoniya
yüzeyinde yerleşmekte ve altının dağılımı doymamış koordinasyona sahip Zr4+
iyonların
miktarına bağlıdır. Zirkoniyanın tungstenle değiştirilmesi altının depolanmasını
kolaylaştırmakta ancak aynı zamanda doymamış koordinasyona sahip Zr4+
iyonların miktarını
azaltarak altın kümelerinin dağılımını azaltmaktadır.
WOx-içermeyen (Au/ZrO2) ve WOx-içeren zirkoniya destekli altın (Au/xWZ-I, “I”
doyurulma yöntemiyle WO3’nın eklenmesini ve x = 5,12, ve 20 WO3’nın kütlesel yüzdesini
simgelemekte) numunelerinin NO+O2 gaz karışımıyla olan etkileşimi göstermektedirki, WOx-
içeren numuneler oda sıcaklığında NO2 oluşumunu sağlamaktadır. Oda sıcaklığında CO’nun
VII
önceden adsorplanmış NOx türlerini içeren altın numuneleri ile teması sonrası elde edilen FT-
IR sonuçları altına koordine olmuş izosiyanür (NCO) oluşumunu açığa çıkarmaktadır. Ads-
NOx+CO tepkimesi sonucu Au NCO türlerinin oluşumu 13
CO kullanarak ve adsorplanmış
izosiyanürlerin su buharı ile etkileşimini kullanarak ile teyit edilmiştir. Altın izosiyanürleri
yüksek ısıl kararlılık göstermekte, ancak NO2 ile oda sıcaklığında kolayca tepkimeye
girmektedir. Bu bulgular, tungstenlenmiş zirkoniya destekli altının NOx’ın CO-SKİ’si için
düşük-sıcaklık katalizatörü olması açısından umut verici olduğuna işaret etmektedir.
C3H6 ve O2 gaz karışımının Au/ZrO2 ve Au/xWZ-I numuneleriyle teması sırasında
kaydedilen FT-IR verileri Au/ZrO2 numunesinin propenin derin yükseltgenmesini
katalizlediği sonucuna varmamızı sağlamaktadır. Yükselgeme-indirgeme (W=O grupları) ve
Brønsted asit bölgeleri içeren altın depolanmış tungstenlenmiş numuneler hidrokarbonun
kısmi yükseltgenmesini sağlamaktadırlar.
Detaylı bir mekanistik inceleme sonucuna göre, Au/xWZ-I numunelerine
adsorplanmış NOx türleri ortamında, propen, oda sıcaklığında izopropoksite dönüşmesi
suretiyle aktif hale gelmektedir. İzopropoksidin yüzey nitrat kompleksleriyle etkileşimi
nitroaseton [CH3C(O)CH2NO2] oluşumuna neden olmaktadır. Daha yüksek sıcaklıklarda
(150oC) altın parçacıklarına koordine olmuş nitroasetonun içsel bir yükseltgenme-indirgenme
süreciyle yüzey asetat ve Au NCO türlerine dönüştüğü önerilmektedir. İzosiyanürler NO
yükseltgenmesi sonucu oluşan yüzey NO3 /NO2 kompleksleriyle tepkimeye girerek moleküler
azot, N2O ve COx’u oluşturur. Aynı deneysel koşullar altında altınsız numuneler NCO türlerin
oluşumuna neden olmamaktadır. Bu deneysel gerçek, Au parçacıklarının NCO türlerin
oluşumunda önemli bir rol oynadığını göstermektedir. Au NCO türlerinin miktarının en çok
olduğu durum kütlece %1.8 altın ve %12 WO3 (Au/12WZ-I numunesi) içeren ZrO2-bazlı
katalizatör yüzeyindedir. Bu malzeme iki önemli özelliğe sahip. Birincisi, yüzeyinde altın
parçacıkların çok iyi bir şekilde dağılmış olması, ikincisi ise yüzeyinde yeteri miktarda
Brønsted asit bölgelerini bulundurmasıdır (propenin aktif hale gelmesi için gerekli). Katalitik
etkinlik ölçümlerine dayanılarak, incelenilen maddeler arasında Au/12WZ-I katalizatörünün
NOx’ın C3H6-SKİ’si için gelecek vaadettiği sonucuna varılmıştır.
Anahtar Kelimeler: Yerinde FT-IR; Tungstenlenmiş zirkoniya destekli altın; NOx’ın
propenle seçici katalitik indirgenmesi; Mekanizma, Reaktif araürünler.

VIII
ACKNOWLEDGEMENT
I would like to express my sincere thanks and gratitude to my supervisor, Assoc. Prof.
Margarita Kantcheva for all her guidance and encouragement she has offered me throughout
the period of this research.
I am also very much grateful to Dr. Margarita Milanova for her help, support and
friendship.
I would like to thank Bilkent University and the Scientific and Technical Research
Council of Turkey for the financial support.
I would like to thank Dr. Ivalina Avramova for XPS measurements and Ing. Guiseppe
Pantaleo for catalytic activity measurements.

IX
TABLE OF CONTENTS
1. INTRODUCTION 1
1.1 Environment pollution and exhaust emissions.......................................................1
1.2 Catalytic techniques for NOx post-combustion abatement
under lean conditions.............................................................................................1
1.2.1 NOx storage and Reduction..........................................................................1
1.2.2 Urea- Selective Catalytic Reduction.............................................................3
1.2.3 Hydrocarbon (HC) - Selective Catalytic Reduction......................................4
1.3 Mechanism of HC-SCR of NOx on non-zeolitic oxide-based catalysts.................7
1.4 Aim of Study...........................................................................................................9
2. EXPERIMENTAL 11
2.1. Sample preparation..............................................................................................11
2.2. Sample characterization.......................................................................................12
2.3 FT-IR Spectroscopy..............................................................................................13
2.3.1 Experimental Setup for in situ FT-IR measurements..................................14
2.4 Catalytic activity measurements...........................................................................14
3. RESULTS AND DISCUSSIONS 15
3.1. Characterization of [Au(en)2]Cl3 precursor solutions.........................................16
3.2. Structural characterization..................................................................................18
3.3. DR-UV-vis spectra..............................................................................................21
3.4. XPS analysis.......................................................................................................23
3.5. In situ FT-IR spectroscopy..................................................................................26
3.5.1. FT-IR spectra of the activated samples....................................................26
3.5.2. Adsorption of CO at room temperature...................................................27
3.5.3. In situ FT-IR spectroscopic investigation of the

X
NO+O2+C3H6 reaction on the surface of gold catalysts
supported on zirconia and tungstated zirconia..........................................30
3.5.3.1. NO+O2 surface reaction................................................................30
3.5.3.2 Co-adsorption of C3H6+O2 mixture on the Au/ZrO2
and Au/xWZ-I catalysts at various temperatures...........................41
3.5.3.3. Reactivity of the surface species formed upon
room-temperature adsorption of NO+C3H6+O2
mixture on Au/xWZ-I catalysts....................................................45
3.5.3.4. Adsorption of acetone and its interaction with
NO2 over the Au/12WZ-I catalyst................................................54
3.6 Catalytic activity..................................................................................................59
4. CONCLUSIONS 60
5. REFERENCES 62

XI
LIST OF TABLES
1. Sample notation, BET surface areas, nominal tungsten and analytical gold
contents.........................................................................................................................19
2. Binding energies, surface composition and gold particle size for the
samples..........................................................................................................................24
3. Integrated areas of the gold carbonyl bands recorded at room temperature
and PCO=10 Torr............................................................................................................30
4. Assignments of the adsorption bands in the spectra observed during
the high-temperature adsorption of C3H6 + O2 mixture on the Au/ZrO2
catalyst..........................................................................................................................42
5. Assignments of the adsorption bands in the spectra observed during
the high-temperature adsorption of C3H6 + O2 mixture on the
Au/xWZ-I catalysts…………………………………………………………………...43
6. Assignment of the absorption bands observed during the investigation
of the reactivity of surface species formed upon room-temperature
adsorption of NO+C3H6+O2 mixture on the Au/12WZ-I and Au/20WZ-I
samples in the 25 – 2500C temperature range………………………………………...50
7. Assignments of the absorption bands in the spectra observed during
the high-temperature adsorption of acetone and its coadsorption with
NO2 on the Au/12WZ-I catalyst...................................................................................56
XII
LIST OF FIGURES
1. DR-UV-vis spectrum of [Au(en)2]Cl3...........................................................................17
2. Raman spectrum of [Au(en)2]Cl3………………………………..................................17
3. UV-vis spectra of aqueous solutions of [Au(en)2]Cl3 at different pH values………...19
4. XRD patterns of the samples studied…………………………………........................20
5. Optical spectra of 18WZ-CP, Au/18WZ-CP, Au/ZrO2, 20WZ-I,
Au/20WZ-I, 12WZ-I, Au/12WZ-I , 5WZ-I and Au/5WZ-I.........................................22
6. XPS spectra...................................................................................................................23
7. W/Zr surface ratios as a function of WO3 content in Au/xWZ-I……………………..25
8. FT-IR spectra of the activated samples.........................................................................26
9. FT-IR spectra of CO adsorbed at room temperature on the samples studied………...28
10. Gas phase spectra recorded at room temperature after 20 min of the
admission of a (10 Torr NO+25 Torr O2) mixture to the IR cell containing
Au/ZrO2 and Au/12WZ-I samples...............................................................................31
11. FT-IR spectra of the Au/18WZ-CP , 18WZ-CP , Au/12WZ-I and Au/ZrO2
samples taken after the introduction of a (10 Torr NO+25 Torr O2) mixture
to the IR cell for 10 min at room temperature followed by evacuation for 20
min, and after heating the isolated IR cell for 10 min at 1000C , 200
0C and
3000C . Panels A , B , C and D : Gas phase spectra over the samples
collected at 1000C , 200
0C and 300
0C ………………………………………………..33
12. FT-IR spectra of the Au/18WZ-CP catalyst collected after the adsorption of
a (10 Torr NO + 25 Torr O2) mixture for 10 min at room temperature
followed by evacuation for 20 min at room temperature and adsorption
of 10 Torr CO at room temperature for 5 min and 10 min…………………………...34
13. FT-IR spectra of the Au/18WZ-CP sample collected after the adsorption of
a (10 Torr NO + 25 Torr O2) mixture for 30 min at 3000C followed by dynamic
evacuation from 2000C to room temperature and subsequent adsorption of 10
Torr of CO for 10 min and evacuation for 15 min at room temperature,
500C and 100
0C……………………………………………………………………….34
14. FT-IR spectra of 10 Torr of CO and 10 Torr of 13
CO adsorbed at room
temperature on the Au/18WZ-CP sample containing pre-adsorbed NOx species……36
15. FT-IR spectra of the Au/18WZ-CP catalyst collected after the adsorption

XIII
of a (10 Torr NO + 25 Torr O2) mixture for 10 min at room temperature
followed by evacuation for 20 min at room temperature, adsorption of 10
Torr CO at room temperature for 10 min and evacuation of the gaseous
CO for 15 min, and subsequent addition of 0.1 Torr of water vapor for
10 min at room temperature and 1000C. Panel B: Gas phase spectra
corresponding to the sample spectra………………………………………………….37
16. FT-IR spectra of the Au/18WZ-CP catalyst collected after the adsorption
of a (10 Torr NO + 25 Torr O2) mixture for 10 min at room temperature
followed by evacuation for 20 min at room temperature, adsorption of 10
Torr CO at room temperature for 10 min and evacuation of the gaseous
CO for 15 min at various temperatures……………………………………………….39
17. FT-IR spectra of the Au/18WZ-CP catalyst collected after the generation
of the Au NCO species and subsequent addition of 0.4 Torr of NO2 for
10 min at 250C , 50
0C , 100
0C, 150
0C, 200
0C and 250
0C…………………………….39
18. FT-IR spectra of the samples collected after the adsorption of a (10 Torr
NO + 25 Torr O2) mixture for 10 min at room temperature followed by
evacuation for 20 min at room temperature and adsorption of 10 Torr CO
at 500C for 10 min……………………………………………………………………40
19. FT-IR spectra collected during the exposure of the Au/ZrO2, Au/5WZ-I,
Au/12WZ-I and Au/20WZ-I catalysts to a (3 Torr C3H6 +25 Torr O2)
mixture for 10 min at room temperature followed by heating the isolated
IR cell for 10 min at 1500C, 200
0C, 250
0C and 300
0C ………………………………44
20. FT-IR spectra collected during the exposure of the Au/12WZ-I catalyst
to a (10 Torr NO +3 Torr C3H6+25 Torr O2) mixture at room temperature
for 15 min followed by evacuation for 20 min and heating the isolated
IR cell for 15 min at 1000C, 150
0C, 200
0C and 250
0C. Panel B: gas phase
spectra at 1000C, 150
0C, 200
0C and 250
0C…………………………………………...48
21. FT-IR spectra collected during the exposure of the Au/20WZ-I catalyst
to a (10 Torr NO +3 Torr C3H6+25 Torr O2) mixture at room temperature
for 15 min followed by evacuation for 20 min and heating the isolated IR
cell for 15 min at 1000C, 150
0C, 200
0C and 250
0C. Panel B: gas phase
spectra at 1000C, 150
0C, 200
0C and 250
0C…………………………………………49
22. FT-IR spectra collected during the exposure of the samples to a (10 Torr
NO +3 Torr C3H6+25 Torr O2) mixture at room temperature for 15 min
XIV
followed by evacuation for 20 min and heating the isolated IR cell for
15 min at 2000C. ...........................................................................................................51
23. FT-IR spectra of the Au/12WZ-I and 12WZ-I samples in the
2300 – 1000 cm1 region obtained in the presence of a gaseous mixture
of 10 Torr NO + 3 Torr C3H6 + 25 Torr O2 and upon heating for
10 min at various temperatures……………………………………………………….53
24. FT-IR spectra of acetone (12.8 Torr) adsorbed on the Au/12WZ-I sample
for 10 min at room temperature followed by evacuation for 10 min and
after heating the isolated IR cell for 10 min at 1000C, 150
0C, 200
0C,
2500C, 300
0C, and 350
0C……………………………………………………………..55
25. FT-IR spectra of adsorbed acetone (12.8 Torr) on the Au/12WZ-I catalyst
for 10 min at room temperature followed by evacuation for 10 min and
addition of 2 Torr NO2 and after heating the isolated IR cell for 10 min at
1000C, 150
0C, 200
0C, 250
0C, 300
0C, and 350
0C……………………………………58
26. Catalytic activity for NO reduction with propene over Au/ZrO2
and Au/12WZ-I catalysts. Regent gas mixture: 1400 ppm of propene,
300 ppm of NO, 4 vol. % of O2 in He; WHSV = 30000 ml/g h……………………..59
XV
LIST OF ABBREVIATIONS
BE: binding energy, page 13
cus: coordinatively unsaturated site(s), page 27
DP: deposition precipitation, page 15
en: ethylenediamine, page III
HC: hydrocarbon, page 1
IEP: isoelectric point, page 10
LMCT: ligand to metal charge transfer, page 21
RT: room temperature, page 14
SCR: selective catalytic reduction, page 1
TWC: three way catalyst, page 1
WHSV: weight hourly space velocity, page 15
WGS: water gas shift reaction, page 12
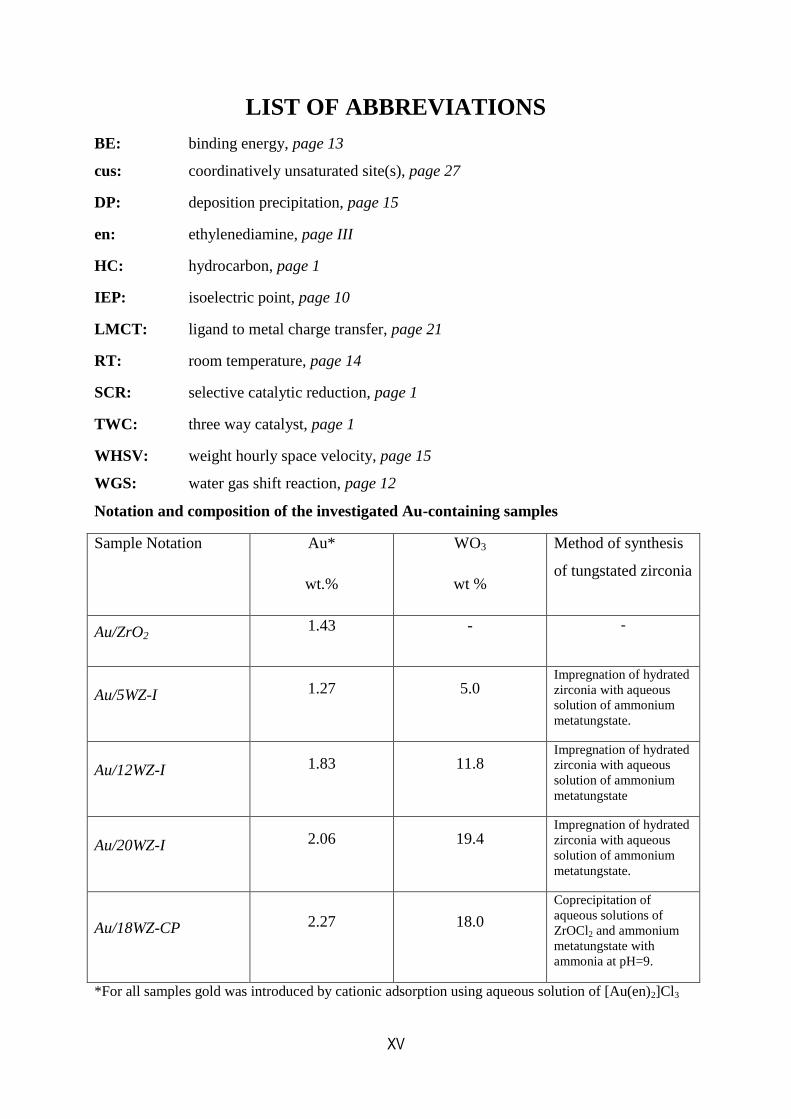
Notation and composition of the investigated Au-containing samples
Sample Notation Au*
wt.%
WO3
wt %
Method of synthesis
of tungstated zirconia
Au/ZrO2 1.43 - -
Au/5WZ-I 1.27 5.0 Impregnation of hydrated
zirconia with aqueous
solution of ammonium
metatungstate.
Au/12WZ-I 1.83 11.8 Impregnation of hydrated
zirconia with aqueous
solution of ammonium
metatungstate
Au/20WZ-I 2.06 19.4 Impregnation of hydrated
zirconia with aqueous
solution of ammonium
metatungstate.
Au/18WZ-CP 2.27 18.0
Coprecipitation of
aqueous solutions of
ZrOCl2 and ammonium
metatungstate with
ammonia at pH=9.
*For all samples gold was introduced by cationic adsorption using aqueous solution of [Au(en)2]Cl3
1
1. INTRODUCTION
1.1 Environment pollution and exhaust emissions
It is now widely believed that global warming is caused by deforestation and burning
of the fossil fuels [1]. These fossil fuels when burned produce green house gases such as CO2,
CH4 etc [2]. Greenhouse gases and other air pollutants mainly originate from stationary (e.g.
industrial power plants etc) and mobile (cars, trucks etc) sources. Main pollutants in the
vehicle exhaust gases are unburned hydrocarbons (HC), CO and NOx (NO and NO2). To
prevent the pollution, rules and regulations which control and limit the amounts of pollutants
have been set. In Europe for passenger cars which use diesel Euro 5, NOx emission standard
was 0.180 g/km by 2009 [3]. Various technologies have been developed and applied to meet
these standards. Perhaps the most known among them are the Three Way Catalytic (TWC)
converters for the internal combustion gasoline engines. This system consists of catalysts
which promote oxidation of CO, HC and reduction of NOx to N2 simultaneously [4]. Even if
this system proved to be useful for gasoline engines, it can not supply efficient control of NOx
emissions for diesel and lean-burn engines (they operate at air to fuel ratio of 17-26) [4]. To
overcome this problem various catalytic techniques have been proposed.
1.2 Catalytic techniques for NOx post-combustion abatement
under lean conditions
There are three main catalytic technologies used for removal of NOx from the exhaust
gases of lean burn and diesel vehicles [5-8]. These are 1) NOx storage; 2) urea-selective
catalytic reduction (urea-SCR) and 3) hydrocarbon-selective reduction (HC-SCR). All of
these techniques mentioned above have important drawbacks.
1.2.1 NOx storage and Reduction
This process consists of two steps [5-9]: 1) NOx storage over the Ba sites (which are in
the form of BaCO3 due to presence of CO2 in the exhaust gas phase). This step occurs during
2
the normal operation of the engine under lean conditions. 2) Regeneration and cleaning up of
the catalyst surface via desorption and reduction of NOx with the help of a noble metal.
Generally a NOx storage catalyst has two noble metal components Pt or Pd, that will help
oxidation of NO, CO and hydrocarbons (HC) under lean operating conditions and Rh for the
purpose of reducing the NOx by CO under reach regeneration conditions [7-9]. The NOx
storage technology is commercialized in Japan.
Major disadvantages of a NOx storage system for diesel engines can be listed as fuel
over-consumption during the regeneration phase (to supply enough amount of reductant
engine control systems are mounted and this leads to over-consumption), methane emission,
sulfur sensitivity, difference in performance of NOx removal system at low and high
temperatures, thermal deactivation of the catalyst, high cost of the system.
At the onset of the catalyst regeneration step significant amount of reductants (CO, H2,
hydrocarbons including methane) are produced in the engine. All of the reductants but
methane are consumed by adsorbed NOx. Methane (a greenhouse gas) leaves the NOx storage
system intact and contributes to the overall hydrocarbon emission from the vehicle exhaust.
This extra content of HC challenges the emission standard set by Diesel Euro standards [9].
To overcome this problem sometimes cars are designed in such a way that they have special
injector in the exhaust line that provides the necessary reductants directly from the fuel tank
and prevents the release of methane. This application obviously results in higher fuel
consumption [9].
The NOx storage system cannot be used for fuels with high concentration of sulfur [5-
9]. Nowadays it is used in Japan where vehicle are loaded with low sulfur content fuels [6].
Gasoline used in US and Europe has high sulfur content and during engine operation acidic
sulfur oxides form and they adsorb stronger than NOx on the catalyst surface in this way
poisoning the catalyst (especially alkaline earth metal component). Using low-content sulfur
(<10 ppm) fuel is not an option because lubricant also contains sufficient amount of sulfur to
cause the deactivation of the NOx storage catalyst. The sulfur concentration in lubricant
cannot be reduced because it determines the lubrication property [9].
To be suitable for application in light duty diesel vehicles the activity window of the
NOx storage catalyst must be in the range of 150-350oC [10] which is much lower when
compared to gasoline engine. Because at low temperatures oxidation of NO to NO2 becomes
the controlling factor, separation of NOx storage property from the NO oxidation property is
necessary [10]. At low temperature and rich conditions the overall activity of the catalyst is
determined by decomposition rate of stored nitrates and reduction rate of NOx. Temperatures

3
as high as 6000C can be reached in heavy duty diesel systems. At high temperatures
thermodynamic stability of stored nitrates may be an important problem. This can result in
insufficient adsorption of NOx and NOx slip may occur during the lean periods [10].
The NOx storage catalyst can get thermally deactivated through the sintering of barium
species and formation of barium aluminates [5-9].
High content of precious metals (Pt and Rh) in the catalyst makes the NOx storage
system application costly. So far rhodium price has been incessantly increasing and in 2006
price of it reached more than three times the price in previous year [9]. By March 2012 its
price was about 1500$ per ounce (www.kitco.com) and of Pt was 1600$ per troy ounce
(money.cnn.com).
1.2.2 Urea- Selective Catalytic Reduction
The urea-SCR has been used as a NOx removal technology for heavy-duty trucks and
buses in Europe since 2005 [11]. However it has been used in industrial stationary
applications since 1970s and has evolved a lot since then [12]. This system exploits
interaction of ammonia with NOx over the catalyst (vanadia supported on titania with WO3
and MoO3 as promoters). Aqueous urea solution is used as a source of ammonia because
ammonia is toxic and corrosive and a gas difficult to handle [11]. The urea-SCR system
occupies a lot of volume onboard because it consists of large number of parts [9]:
Urea injector and a control unit for adjustment of quantity injected.
Additional tank to store urea solution.
A mixer at the catalyst inlet to provide a uniform ammonia concentration in
exhaust gas.
A catalyst to facilitate hydrolysis of urea to ammonia.
SCR catalyst for NOx reduction.
A clean-up catalyst for maintaining proper amount of ammonia (10 ppm) released
from exhaust.
NOx sensor to control the amount of ammonia injected and for diagnosis of the
urea-SCR system
The urea-SCR is most efficient in the temperature range 250 – 4000C [9,11,12]. Before the
operation the SCR and the urea catalysts must be pre-heated. NOx conversion is dependent on
NO to NO2 ratio and optimum conversion is achieved when this ratio is 1. Thus a NO

4
oxidation catalyst is needed to be installed upstream of the system [9]. Installation of the urea-
SCR system into the passenger cars is not feasible due to unavailability of enough space [9].
Deficiency in infrastructure in terms of availability of urea along with fuel is yet another
setback [5, 9]. Moreover urea solution has freezing point of -110C making application of this
system in cold countries impossible [9]. In high oxidative conditions sulfur from the diesel
fuel is oxidized to sulfur dioxide which can react with ammonia to produce ammonium
sulfate. Build up of this compound on catalyst surface can cause irreversible deactivation
[13]. Besides this at low temperatures (100-2000C) ammonia and nitrogen dioxide together
can form ammonium nitrate, the explosive which can also temporarily deactivate the catalyst
via accumulation inside the pores of the catalyst in solid or liquid form [12]. Finally it should
be noted that an effective urea injection system is not available so far and this complicates the
control of ammonia slip and secondary emissions [5-9].
1.2.3 Hydrocarbon (HC) - Selective Catalytic Reduction
In HC-SCR system either hydrocarbon that already exists in the exhaust is used
(passive control) or it is added as a fuel upstream of catalytic converter (active control) to
reduce NOx [5,7]. In 1990 two groups (Held et al. [14] and Iwamoto et al. [15]) independently
discovered that Cu/ZSM-5 is active for SCR of NO with alkanes and alkenes in the presence
of oxygen. Since then much work was done on this subject and a lot of catalysts both zeolitic
and non-zeolitic have been proposed [7,8,16,17]. However it was found out that zeolite-based
catalysts did not have hydrothermal stability making them inapplicable to real exhaust
conditions [7,8]. Thus focus was shifted to metal oxide catalysts. In literature there are several
review papers dealing with oxide based HC-SCR [8,16,17]. Metals Mn, Fe, Co, Ni, Cu, Sn,
Ga, In and Ag (promoters) when combined with Al2O3, TiO2, ZrO2, MgO are catalytically
active in the selective reduction of NOx with hydrocarbons. Silica is not active itself but can
be used as a support. Under lean conditions the promoter metals tend to exist in oxidized state
[17]. The performance of these oxide based HC-SCR catalysts strongly depends on
functionality of the hydrocarbon (alkane, alkene, alcohol) and the carbon number. The higher
the carbon number in the reducer, the lower the activity temperature range [8,16,17].
Nevertheless C2-C3 alkenes and alkanes have been extensively tested because these
hydrocarbons are present in the automobile exhaust gas mixture [17].
In HC-SCR of NOx, the extent of reduction of NOx is determined by type of the metal
and the hydrocarbon used. Among the noble metals, platinum is the most active and selective

5
metal [8,17]. Depending on the type of the hydrocarbon present Pt can exist in either oxidized
or reduced state during the selective oxidation of NO in excess oxygen atmosphere [17]. In
the presence of strongly adsorbing hydrocarbons like propene and lighter alkanes, the excess
oxygen cannot oxidize the platinum because it is covered with hydrocarbonaceous residues.
Whereas methane and propane cannot prevent the oxidation of platinum. The reduction of NO
takes place on the surface of reduced Pt covered with hydrocarbonaceous residues [17].
Despite the fact that non-zeolitic catalysts are hydrothermally stable they cannot be used at
low temperatures because they generally show activity at high temperatures (above 3000C)
[7,8,16,17]. Platinum supported on alumina however is an exception with the maximum
activity attained at 2500C. Unfortunately the activity temperature range is narrow and has low
N2 selectivity producing significant amount of byproduct N2O at low temperatures [7,8,17].
Investigations with Zr6Nb2O17 solid solution have shown that maximum activity is reached
already at 2200C in the selective catalytic reduction of NOx with propene [18].
Lately, silver supported on alumina in low loadings attracted much attention as a
catalyst for HC-SCR of NOx [5,8,19]. In the presence of various hydrocarbons as reductants
these catalysts are active and selectively promote the formation of N2. However they have the
same disadvantages as other oxide based catalysts: narrow temperature window and low
activity in low temperature region (150-3500C, the diesel exhaust conditions) [5-8,10,19].
One way of overcoming this problem can be adding of H2 to the feed [5,8,19]. The activity of
catalysts improves a great deal especially when a reactive reductant such as octane is used. In
the absence of hydrogen activity begins to increase at 3500C and becomes maximum at
approximately 5000C before going downhill again. However when only 0.72 % H2 is added to
the feed reaction begins at 1000C and conversion has a peak value already at 200
0C. The
effect of hydrogen on the activity of Ag/Al2O3 catalysts is especially interesting because it is
believed that it offers a promising way for continuous reduction of NOx emissions under lean
conditions using diesel added prior to the catalyst (active NOx control) [5]. In order to make
this strategy competitive, further development is needed regarding on-board production of H2.
In addition, the extensive sintering of supported silver and sulfur poisoning may represent an
important drawback for practical application [7].
Literature review reveals that gold supported on ZnO, MgO, TiO2, ZrO2, Al2O3, Fe2O3
[20,21] is fairly active in selective reduction of NOx to N2 with propene in the presence of
oxygen in the temperature range 200-5000C. The activity temperature is dictated by the type
of the support used. Au/ZnO shows activity at 2500C with the NO to N2 conversion of 32-49

6
% [20,21]. At 2500C nanosized gold supported on zirconia can achieve 32 % of NO
conversion in the reduction with propene in excess oxygen atmosphere [20]. Gold supported
on alumina is even better, resulting in 80 % NO to N2 conversion, however at 4500C [20,21].
On the other hand Au on TiO2 is active at 3500C [20]. A mechanism in which NO is first
oxidized to NO2 which is then reduced to molecular nitrogen by an activated propene species
have been proposed for this catalytic systems [20,21]. According to the kinetic data [20-23]
collected for reduction of NO catalyzed by gold supported on alumina and titania, the
oxidation of NO to NO2 is rate-determining step. Mechanical mixtures with Mn2O3 or CeO2
(to boost the oxidation of NO) increase the catalytic activity by pulling down the temperature
of maximum conversion of NO to N2 to 225-3000C range [20,22,23]. This effect is attributed
to bifunctional mechanism in these systems [24,25]. In this mechanism NO is oxidized with
molecular oxygen over Mn2O3 to form NO2 in gas phase, which then reacts with propene
adsorbed on the surface of gold particles [20,22]. It should be noted that the gold deposited on
solely Mn2O3 or CeO2 is not good for SCR of NO with propene because it completely
oxidizes the hydrocarbon to CO2 [22,26]. This is also supported by the fact that gold
dispersed on easily reducible supports is not active for partial oxidation of propene [27].
However, when gold is supported on less reducible oxides like V2O5 and MoO3 , the propene
is partially oxidized to propanal, acetone, ethanal and acetic acid [27]. It is known that V2O5
and MoO3 supported on silica have Brønsted acid sites on their surfaces [28]. FT-IR
spectroscopic research has revealed that the activation process of propene over the catalysts
which have Brønsted acid sites consists of formation of isopropoxide species on the catalyst
surface and then with the increase in temperature further oxidation to acetone and acetate
species takes place [18,29,30]. In SCR of NOx with propene, these products of partial
oxidation are key intermediates and they form nitrogen containing organic compounds which
then react with NO+O2/NO2 at high temperatures to produce N2. Brønsted acids like
WO3/ZrO2 and Zr6Nb2O17 can catalyze the oxidation of NO by O2 already at room
temperature and W6+
and Nb5+
ions are responsible for this [18,31]. It can be concluded that
oxide systems which have strong Brønsted acid sites like WO3 supported on zirconia can
provide both oxidation of NO and activation of propene. The bifunctional property of these
oxides makes them potential component of gold containing catalysts for the low temperature
DeNOx. It is proposed [32] that dispersed gold can promote the activity of the support for the
oxidation of NO to NO2 in the wide temperature range. Moreover when compared with the
amphoteric zirconia the acidic tungstated zirconia should show more resistance to SO2
poisoning which could be one of the reasons for deactivation of catalysts.
7
1.3 Mechanism of HC-SCR of NOx on non-zeolitic oxide-
based catalysts
In order to be able to properly design and apply the SCR technology it is important to
understand the chemistry of this process in terms of mechanism. In the review made by Burch
et al. [8,17] for non-zeolitic oxide based catalysts it is reported that over oxide-supported
platinum group metals NOx reduction consists of two steps. First, NO is dissociatively
adsorbed on reduced noble metal and second, two adsorbed nitrogen atoms recombine to form
molecular nitrogen [33]. Hydrocarbon maintains the removal of atomic oxygen (coming from
NO dissociation) and dissociation of O2 to regenerate the reduced metal surface [33]. Even if
for noble metal catalysts the above explained mechanism was proven, it was also shown that
mechanisms observed in the case of metal-free oxide catalysts may also operate for metal-
promoted catalysts [8,17 and references therein].
For noble metal-free oxide based catalysts two different DeNOx mechanisms have
been proposed regardless of the nature of the catalyst and the reductant used [8,17]. In the
first mechanism, the so called NO reaction pathway [8,17], gaseous or adsorbed NOx species
interacts with hydrocarbons (HC) [34-53] forming organic nitro compounds (R-NO2) as
intermediates [18,34-51]. These intermediates may produce molecular nitrogen directly [35-
37] or decompose into other intermediates like isocyanates [18,34,36,38-47], ammonia
[40,41,44,45,47], oximes [43], nitriles [46,47], hydrocarbon oxygenates and adsorbed NO
[50-53]. It was suggested by Thomas et al. [50,51] that the hydrocarbon oxygenates reduce
the adsorbed oxygen produced by decomposition of NO to N2 as a result regenerating the
corresponding catalytic sites. Kantcheva and Cayirtepe [52] detected the formation of methyl
nitrite (which originates from nitromethane intermediate) as a result of interaction of methane
with NOx species adsorbed on the surface of Pd-promoted tungstated zirconia. The organic
nitrite decomposed to adsorbed NO and formates which reacted further to molecular nitrogen.
The same pathway is suggested in the case of CH4-SCR of NO over Pd/Zr2Nb6O17 catalyst
[53]. The DRIFT studies carried on Au/γ-Al2O3 [54] revealed that the selective reduction of
NO with propene consisted of oxidation of NO to NO2 and interaction of NO2 or its adsorbed
species (nitrates or nitrites) with activated propene to form R-NOx adsorbed on the support.
Although the latter surface compound was not detected, it is thought that it experienced an
internal rearrangement and decomposition to NCO and CN species which further reacted with
NO+O2 or NO2 to form nitrogen. The observation that model nitroorganic compounds

8
produced similar products as a result of decomposition during the SCR reactions supports the
importance of nitroorganic compounds as intermediates [35,40-42,45-49,52].
The second so called hydrocarbon pathway [8,17] takes into account the presence of
two possible oxidants, O2 and NOx, in the reaction gas mixture or strongly adsorbed NOx
species (nitrites and/or nitrates) on the catalyst surface, which can activate the HC producing
oxygenates [55-59]. These compounds reduce the surface NOx species to molecular nitrogen.
Increase in DeNOx activity when oxygenates are used as reductants supports this mechanism
proposal [34,42,60-66].
Scheme 1 (adopted from references [8,17]) summarizes all of the proposed
mechanisms for SCR of NOx on oxide based catalysts. It can be concluded that there is no
general agreement about the actual mechanism [8,16,17].

9
Scheme 1. Reaction scheme of the HC-SCR of NO over oxide catalysts
1.4 Aim of Study
The objectives of the investigation are to develop an efficient synthetic approach for
the deposition of nanosized gold particles on WOx-modified zirconia and to evaluate the
potential of the gold-promoted solid acids as catalysts for the low-temperature C3H6-SCR of
NOx by using in situ FT-IR spectroscopy. To the best of our knowledge, the performance of
gold supported on WOx-modified zirconia in the SCR of NOx with hydrocarbons has not been
investigated to date.
Before the use of new catalysts in the C3H6-SCR of NOx, it is important to know
whether all reagents, such as NO, reductant and O2, are chemisorbed on the catalyst surface
and which kinds of intermediates are formed. For that purpose the adsorption and co-
NO(g)+O2(g)+CxHy(g)
Nitroorganic
compounds, R-NO2 (g or ads)
Organic nitrite,
R-ONO (g or ads)
CxOyOz(ads)
(alkoxides, carboxylates)
Inorganic NOx (ads)
(nitrites and/or nitrates)
R-CN
R-NCO
R-NH2
NH3
NO2(g)
N2(g)
NOx(g)
NO(ads)
carboxylate

10
adsorption of the reagents is investigated by means of in situ FT-IR spectroscopy followed by
their interaction at various temperatures. Other techniques, including UV-Visible
spectroscopy, XRD, XPS, BET are used to complete the characterization of the catalyst
structures. The localization of the WOx and gold species (including the oxidation state of the
latter) on the surface of zirconia is investigated by FT-IR spectroscopy of adsorbed CO. The
amount of deposited gold and tungsten is determined by chemical analysis. The activity of
selected samples is tested in the C3H6-SCR of NO.
11
2. EXPERIMENTAL
2.1. Sample preparation
Two different procedures were used for preparation of hydrated zirconia. According to
procedure 1, hydrated zirconia (denoted as HZ-1) was prepared by hydrolysis of 0.3 M
solution of zirconyl chloride (ZrOCl2 H2O, Aldrich) with concentrated (25%) ammonia
solution at pH 9. The slurry of the precipitated material was kept for aging at room
temperature for 12 h. Then the product was separated by vacuum filtration, redispersed in
deionized water, washed thoroughly to remove the chloride ions and dried at 1000C. The
crystallographic structure of the material obtained after calcination at 6000C was
predominantly monoclinic zirconia. Tungstated zirconia was synthesized by coprecipitation
[67] with nominal content of 18 wt % WO3 and by impregnation of HZ-1 with aqueous
solution of ammonium metatungstate (AMT, Fluka) using the method proposed by Martinez
et al. [68]. This procedure consisted of impregnation of HZ-1 with aqueous solution (3 mL/g
hydrated zirconia) containing the required amount of AMT to obtain WO3 loadings
corresponding to 5, 12 and 20 wt%. The final calcination temperature of all tungstated
zirconias was 6000C. Gold was deposited by cation adsorption for 2 h from aqueous solution
of [Au(en)2]3+
complex (5.85x10³ M) at pH=9.6 and room temperature. After the separation
of the gold complex solution by filtration, the solid was washed by deionized water until
negative test for chloride ions. The samples were dried at 800C for 48 h and calcined for 1 h at
4000C. The cationic gold precursor was prepared following the procedure of Block and Bailar
[69]. The obtained materials were labeled as Au/xWZ-CP or I, where x stands for the WO3
nominal content in wt %. CP and I denote co-precipitation and impregnation, respectively
(see Table 1).
In order to study the effect of tungsten, gold was deposited also on zirconia by cation
adsorption of [Au(en)2]3+
complex using the same conditions applied to the W-containing
samples. Since the incorporation of WOx species stabilizes the tetragonal phase of zirconia
[68,70-76], WOx-free tetragonal zirconia was used for the preparation of ZrO2-supported gold
sample. The goal was to eliminate the effect of crystal phase on the interaction of gold
precursor with the support because there are differences in the acid-base properties [77], and
types and concentration of the surface hydroxyl groups [78] of zirconia polymorphs. In
addition, the CO adsorption capacity of monoclinic zirconia is larger than that of the

12
tetragonal phase [77] which may affect the CO+O2 surface reaction. Li et al. [79] have found
that Au supported on monoclinic zirconia exhibited much higher activity in the low-
temperature WGS reaction than the catalyst supported on tetragonal zirconia. Tetragonal
phase of zirconia was prepared by a method similar to that described by Jung and Bell [78]
denoted as procedure 2. The synthesis consisted of hydrolysis of 0.6 M solution of
ZrO2Cl2.8H2O with concentrated ammonia solution (25 %) at pH = 9 and room temperature.
The obtained precipitate was washed several times with deionized water until negative test for
Cl ions. Then the washed precipitate was aged in aqueous solution of ammonia (with pH=9)
at 100ºC for 48 h under reflux and periodical supplement of NH3(aq) in order to keep constant
pH of 9. The resultant hydrated zirconia was dried at 100ºC for 24 h. The material was
denoted as HZ-2. Tetragonal zirconia was obtained by calcination of the hydrated zirconia
HZ-2 at 6000C for 6 h.
2.2. Sample characterization
XRD analysis was performed on a Rigaku Miniflex diffractometer with Ni-filtered Cu
K radiation (λ= 1.5405 Å). The DR-UV-Vis spectra were obtained under ambient conditions
with a fiber optic spectrometer AvaSpec-2048 (Avantes) using WS-2 as a reference. The BET
surface area measurements were performed with a TriStar 3000 automated gas adsorption
analyzer (Micrometrics). The samples were dehydrated under vacuum (10−2
Torr) for 3 h at
250°C before the measurements in order to remove adsorbed water and volatile compounds.
The XRD, DR-UV-vis and BET measurements were performed in the Department of
Chemistry, Bilkent University.
The micro-Raman spectra were recorded on a LabRam confocal Raman microscope
with a 300 mm focal length (Department of Chemistry, Bilkent University). The spectrometer
is equipped with a Ventus LP 532 50 mW diode-pumped solid state laser operated at 20 mW,
with a polarization ratio on of 100:1 and a wavelength of a 532 nm and a 1024 x 256 element
CCD camera. The signal collected was transmitted via fiber optic cable into a spectrometer
with 1800 g/mm grating. The Raman spectra were collected by manually placing the probe tip
near the desired point of the sample on a silicon wafer.
13
The content of gold was determined by ICP-MS analysis in Middle East Technical
University, Central Laboratory. The tungsten content in the samples was calculated as
difference between the nominal content in the solid and the concentration of tungsten in the
filtrate produced during the deposition of gold from the gold precursor. The tungsten content
in the filtrate was determined spectrophotometrically by the thiocyanate method at λ = 410
nm [74,80,81].
The X-ray Photoelectron spectra were obtained using unmonochromatized Al Kα
(1486.6 eV) radiation in a VG ESCALAB MK II electron spectrometer (Institute of General
and Inorganic Chemistry, Bulgarian Academy of Sciencies) under base pressure of 1x10⁻⁸
Pa.
The spectrometer resolution was calculated from the Ag 3d5/2 line with the analyzer
transmission energy of 20 eV. The half-width of this line was 1 eV. The spectrometer was
calibrated against the Au 4f7/2 line (84.0 eV) and the sample charging was estimated from C1s
(285 eV) peak from natural hydrocarbon contaminations on the surface. The accuracy of the
binding energy (BE) measured was 0.2 eV. The photoelectron spectra of C 1s, O 1s, Zr 3d, W
4f and Au 4f were recorded and corrected by subtracting a Shirley-type background and
quantified using the peak area and Scofield’s photoionization cross-sections. The Au particle
size was obtained from the XPS peak intensity treated according to the Kerkhof-Moulijn
model [82,83].
2.3 FT-IR Spectroscopy
The FT-IR spectra were recorded using a Bomem Hartman & Braun MB-102 model
FT-IR spectrometer (Department of Chemistry, Bilkent University) with a liquid-nitrogen
cooled MCT detector at a resolution of 4 cm1 (100 scans). The self-supporting discs (~0.01
g/cm2) were activated in the IR cell by heating for 1 h in a vacuum at 400
0C, and in oxygen
(100 Torr, passed through a trap cooled in liquid nitrogen) at the same temperature, followed
by evacuation for 1 h at 4000C. The spectra of activated sample were taken at high
temperature and room temperature (RT), which were used as background references. The
spectra of the samples that were subjected to heat treatments at elevated temperatures were
recorded at those temperatures. The high temperature background reference was used in the
subtraction of the spectra taken at high temperatures and correspondingly the room
temperature background reference was used for the spectra registered below 500C.
14
2.3.1 Experimental Setup for in situ FT-IR measurements
The IR cell (with BaF2 windows) temperature can be adjusted to high temperatures by
electric heater. The sample holder of the cell can be moved vertically with respect to light
beam allowing to record also the gas phase spectra (needed for gas phase correction of sample
spectra). The IR cell is connected to a vacuum/adsorption apparatus.
2.4 Catalytic activity measurements
The catalytic activity of selected samples in NO reduction by propene was tested in
Institute of Nanostructured Materials, CNR, Palermo, Italy using a quartz glass U-shaped
reactor, equipped with a temperature programmed controller. All the reactants and products
were monitored by IR and UV analyzers. The MS analysis of the reaction products was also
performed using online Pfeiffer quadrupole mass spectrometer and Balzers Quadstar
software. The steady-state tests were made upon increasing the reaction temperature, waiting
at each temperature for a constant conversion value. The catalysts were tested in a wide
temperature interval charging 0.100 g of the sample and flow rate of 50 ml/min (STP)
corresponding to WHSV of 30000 ml/g h. Prior to the catalytic testing, the samples were
treated “in situ” for 45 min under flowing O2 (5 vol.% in He, 50 ml/min) at 3500C followed
by heating for 45 min in He flow at the same temperature. The standard reagent gas mixture
contained 1400 ppm of propene, 300 ppm of NO, 4 vol. % of O2 in He.

15
3. RESULTS AND DISCUSSIONS
It is well known that the activity of the supported Au catalysts strongly depends on the
method of preparation [84-86]. The use of careful procedures is critical in order to obtain
small gold crystallites well dispersed on the support. It has been found that an optimal gold
particle size is between 2 and 5 nm [84,85], although Kung et al. [87,88] reported that
maximum activity in the SCR of NOx with propene over Au/ -Al2O3 catalyst was observed in
the 15 to 30 nm particle range. According to Kung et al. [87,88], smaller Au particles appear
to favor the combustion of propene lowering the NOx activity. Also, Seker and Gulari [89]
reported very active Au/ -Al2O3 catalyst (~90% of NOx conversion at ~4000C) prepared by a
sol-gel method and using gold acetate as a precursor. The gold particles in the fresh catalyst
had a crystallite size of 37 nm, whereas the size of the gold crystallites in the activated
catalyst decreased to 9 nm. This shows that redispersion occurred during the activation step
[89].
The simple impregnation of oxide supports with aqueous solutions of HAuCl4 is
considered to be an inappropriate path to achieve highly active catalyst. This method results
in the formation of large and therefore catalytically inactive gold particles after thermal
treatment. Such large particles arise from the too high amount of chlorine residues present in
the solids after impregnation, which induce sintering of gold during the activation procedure
[90-92].
Among the procedures employed, the deposition-precipitation (DP) method allowed
the production of small gold particles and highly active gold catalysts in the extensively
studied CO oxidation and WGS reactions [84-86]. An important requirement is that the
support materials should have high specific surface area, preferably larger than 50 m2/g. The
DP method enables selective deposition of Au(OH)3 only on the surfaces of the support
without precipitation in the liquid phase. Due to the amphoteric properties of Au(OH)3, the
pH of aqueous HAuCl4 solution (used as precursor of gold) is adjusted at fixed point in the
range of values between 6 and 10 at temperature 50 – 900C. This method, however, is not
applicable to metal oxides with isoelectric points (IEP) below 5 [84-86]. Highly dispersed
gold nanoparticles (2 – 5 nm) cannot be deposited on SiO2 (IEP = 2 [93]), SiO2-Al2O3 (IEP =
1 [93]), WO3 (IEP << 3 [93]) or Nb2O5 (IEP = 4.1 [93]). The difficulty arises from the
tendency of the gold hydroxide species toward agglomeration because of weak interaction of
the anionic complex [Au(OH)xCl4-x] with the negatively charged surfaces of oxides with low

16
IEPs [94]. Especially in solution phase, this weak interaction of gold precursor species with
the oxide support surfaces is accompanied by a redox reaction under basic conditions [95].
The reduced gold nanoparticles provide the “catalytic” seeds for the uncontrolled aggregation
of the gold species.
To overcome the weak interaction of gold species with oxide surfaces having low
IEPs, equilibrium adsorption of cationic gold precursor, such as [Au(en)2]3+
, has been used to
deposit gold on H0.8Na0.2Y zeolite [96,97] and silica [98-100]. The adsorption mechanism of
the [Au(en)2]3+
ions involves deprotonated surface hydroxyl groups as anchoring sites [96-
100]. The extent of deprotonation depends on the pH of the solution and determines the gold
uptake. Maximum gold loading on silica has been achieved at pH = 10.5 resulting in metal
particle size of 1.5 – 3.8 nm [98,100].
The analysis of synthetic conditions for the preparation of highly dispersed gold
catalysts leads to the conclusion that the best strategy for the design of gold catalysts
supported on tungstated zirconia is to use adsorption of cationic gold precursor.
3.1. Characterization of [Au(en)2]Cl3 precursor solutions
According to Block and Bailar [69] the positive charge density of Au(III) can enhance
the acidity of the ethylenediamine ligand (en) and the proton of the amine group can be easily
deprotonated under basic conditions. This conclusion is supported by the fact that in the
titration of [Au(en)2]Cl3 with dilute NaOH solution, one equivalent of NaOH was consumed
per gold atom, and the solution changed from colorless to yellow above pH of 8 [99,69].
Based on this result Block and Bailer [69] and Zhu et al. [99] concluded that the [Au(en)2]3+
ion undergoes deprotonation under basic conditions as follows:
Fig. 1 shows the DR-UV-vis spectrum of the solid [Au(en)2]Cl3. The strong band with
maximum at 302 nm is assigned to the ligand-to-metal charge transfer transition [101,102].
The high intensity of the band suggests that this signal cannot be attributed to the symmetry
forbidden d-d transitions [101,102]. The synthesized [Au(en)2]Cl3 sample was characterized
by Raman spectroscopy (Fig. 2). The observed spectrum agrees with that reported by Zanella
et al. [98] for the same complex. The bands at 1322 and 1205 cm1 correspond to the (C N)
stretching modes. The weak signals between 1000 and 800 cm1 are characteristic to the NH2
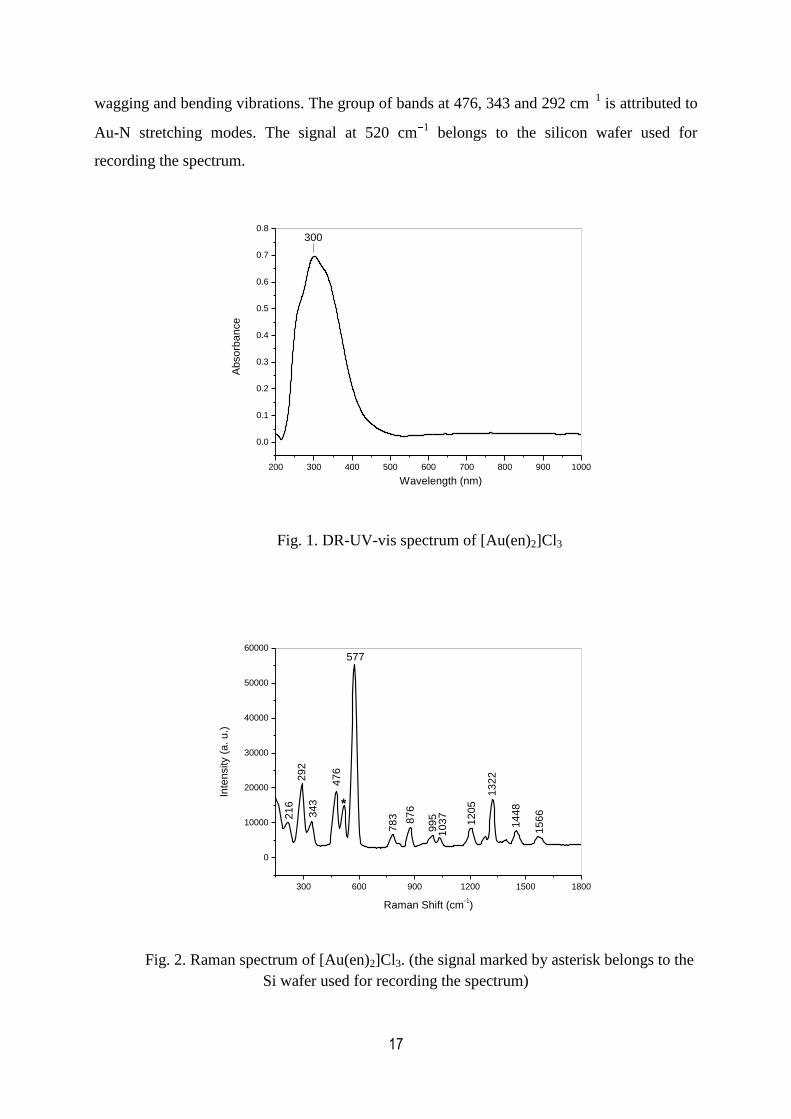
17
wagging and bending vibrations. The group of bands at 476, 343 and 292 cm1 is attributed to
Au-N stretching modes. The signal at 520 cm1 belongs to the silicon wafer used for
recording the spectrum.
200 300 400 500 600 700 800 900 1000
0.0
0.1
0.2
0.3
0.4
0.5
0.6
0.7
0.8A
bso
rba
nce
Wavelength (nm)
300
Fig. 1. DR-UV-vis spectrum of [Au(en)2]Cl3
300 600 900 1200 1500 1800
0
10000
20000
30000
40000
50000
60000
15
66
14
48
13
22
12
05
10
37
99
587
6
78
3
577
47
6
34
32
92
Inte
nsity (
a. u
.)
Raman Shift (cm-1)
21
6 *
Fig. 2. Raman spectrum of [Au(en)2]Cl3. (the signal marked by asterisk belongs to the
Si wafer used for recording the spectrum)

18
The behavior of the [Au(en)2]Cl3 precursor solutions at different pH values has been
studied and the obtained spectra were compared with those reported by Zhu et al. [99]. Fig. 3
shows that with the increase of the pH from 5.5 to 12.5 a new band at 330 nm appears at
lower values of pH which grows in intensity and shifts to approximately 302 nm at pH
between 9.6 and 12.5. At the same time the solution changes from colorless to yellow. The
appearance of a band at 330 nm is associated with the change of the geometry of [Au(en)2]3+
ion from square planar to pseudo-octahedral due to the formation of axial dative bond with
the OH ions [99,102,103]. The high-energy shift of the absorption from 330 to 302 nm is
caused by the formation of the yellow [Au(en)(en )L]+ ion (en = H2NCH2CH2NH and L =
Cl or OH ) [99,104]. Chloride ions could be further replaced by hydroxyl groups with
increase in the pH. The absorption at 330 nm could be attributed to a d-d transition in a weak
ligand field. The spectra shown in Fig. 3 agree well with those reported in the literature [99]
and indicate that one hydrogen atom from the [Au(en)2]3+
complex is removed above pH of
8.0 [69,99]. The concentration of the deprotonated gold complex increases with the pH which
is evident from the increase in the intensities of the absorption bands. It becomes the
dominant species at pH higher than 8. The deprotonated [Au(en)(en )L]+ complex at pH = 9.6
has been chosen as precursor for the deposition of gold on the tungstated zirconia because it is
expected that the surface concentration of (M O ) groups (M = Zr, W) to increase with the
pH of the deposition solution.
3. 2. Structural characterization
According to the XRD data (Fig. 4) all of the samples studied (except Au/5WZ-I) have
the structure of tetragonal zirconia (ICDD Cart No 04-005-4479). The Au/5WZ-I sample
contains small amount of monoclinic zirconia (ICDD Cart No 00-013-030).
With increase in the tungsten loading, the analytical content of gold increases (Table
1). It is well known that tungstated zirconia contains acidic protons and their amount
increases with the surface density of the WOx species [67,70,71-74,105]. It is reasonable to
propose that as higher the concentration of acidic hydroxyls on the support surface as larger
the amount of deprotonated M O surface sites (M = W and Zr) thus leading to greater
number of anchoring sites for the [Au(en)2]3+
complex resulting in higher surface
concentration of gold. The average size of gold particles, calculated by using Scherrer

19
equation and the main gold diffraction line of 2θ = 38.20 (ICDD Cart No 00-004-0784),
increases with the W content (Table 1).
The basic medium used for the [Au(en)2]3+
adsorption caused some leaching of WOx
species only in the case of Au/12WZ-I and Au/20WZ-I samples. After the deposition of gold,
the tungsten loss amounts to 0.20 0.05 and 0.61 0.02 wt % of WO3 for Au/12WZ-I and
Au/20WZ-I, respectively.
Table 1. Sample notation, BET surface areas, nominal tungsten and analytical gold contents
Sample SBET
(m2/g)
WO3
(wt %)
W*
(at/nm2)
Au loading
(wt %)
Au loading
(at %)
Au particle
size (nm)**
Au/ZrO2 143 - - 1.43 0.03 0.30 8
Au/5WZ-I 116 5.0 1.2 1.27 0.01 0.27 8
Au/12WZ-I 115 11.8 3.0 1.83 0.01 0.40 9
Au/20WZ-I 140 19.4 4.5 2.06 0.03 0.44 10
Au/18WZ-CP 118 18.0 4.8 2.27 0.01 0.48 10
*The W surface density is calculated based on the weight of zirconia; **According to XRD
250 275 300 325 350 375 400 425 450
0.0
0.5
1.0
1.5
2.0
2.5
3.0
3.5
Abso
rba
nce
Wavelenght (nm)
a
b
c
de
h
i
330
302
Fig. 3. UV-vis spectra of aqueous solutions of [Au(en)2]Cl3 (10 4 M) at different pH values:
5.5 (a); 6.0 (b); 7.0 (c); 8.0 (d); 9.6 (e); 11.0 (f); 11.5 (g); 12.0 (h); i (12.5).

20
20 30 40 50 60 70 80
0
1000
2000
3000
4000
20 30 40 50 60 70 80
0
1000
2000
3000
4000
20 30 40 50 60 70 80
0
1000
2000
3000
4000
20 30 40 50 60 70 80
0
1000
2000
3000
4000
20 30 40 50 60 70 80
0
1000
2000
3000
4000
t
t
t t
t t
tt
tt
t
Au/ZrO2
Au (111)
t tt t
Au/18WZ-CP
Au (111)
t
t
t
Au/20WZ-I
Inte
nsity (
cp
s)
Au (111)
tt
tt
t
Au/12WZ-I
mm mm
Au (111)
Au (111)
m
t
t
tt
t t
t
2 (degree)
Au/5WZ-I
36,5 37,0 37,5 38,0 38,5 39,0 39,5 40,0
300
400
500
36,5 37,0 37,5 38,0 38,5 39,0 39,5 40,0
300
400
500
36,5 37,0 37,5 38,0 38,5 39,0 39,5 40,0
300
400
500
36,5 37,0 37,5 38,0 38,5 39,0 39,5 40,0
300
400
500
36,5 37,0 37,5 38,0 38,5 39,0 39,5 40,0
300
400
500
Au/ZrO2
Au (111) Au/18WZ-CP
Au (111) Au/20WZ-I
Inte
nsity (
cps)
Au (111) Au/12WZ-I
Au (111)
Au (111)
2 (degree)
Au/5WZ-I
Fig.4. XRD patterns of the samples studied. (t: tetragonal; m: monoclinic)

21
3.3. DR-UV-vis spectra
Fig. 5 compares the optical spectra of the samples studied. The absorption band at 293
– 270 nm with a shoulder at 260 nm observed in the spectra of the Au-free samples (Fig. 5,
spectra (a)) corresponds to LMCT (O2
W6+
) transition in oligomeric WOx species with
different degree of polymerization [68,71-75]. The introduction of gold causes drastic change
in the optical spectra (Fig. 5 spectra (b)). The broad absorption with maximum at 550 nm
observed on the gold-containing samples is characteristic of the plasmonic oscillation mode of
nanosized gold particles [98,106,107]. The strong band at 270 – 293 nm has disappeared and
weak signals at 225 – 230 and 260 – 275 nm are observed instead. Based on the spectrum of
Au/ZrO2 sample (Fig. 5A, spectrum (c)), the former band is attributed to the O2
Zr4+
CT
transition. The spectra of the Au-containing samples indicate that gold hinders the detection
of LMCT transitions. Due to the high absorption coefficient of gold particles [108], they mask
the absorption peaks of support. Consequently, the fundamental bands of tungstated zirconia
are detected with significantly lower intensities.

22
200 400 600 800 1000
0.0
0.2
0.4
0.6
0.8
1.0
1.2
1.4
c
b
Absorb
ance
(A)
293
550
a
200 400 600 800 1000
0.0
0.2
0.4
0.6
0.8
1.0
1.2
1.4
a
b
(B)
290
260
550
200 400 600 800 1000
0.0
0.2
0.4
0.6
0.8
1.0
1.2
1.4
aa
b
(D)(C)
Absorb
ance
Wavelength (nm)
285
550
200 400 600 800 1000
0.0
0.2
0.4
0.6
0.8
1.0
1.2
1.4
b
Wavelength (nm)
270
550
Fig.5. Panel A: Optical spectra of powder samples, 18WZ-CP (a), Au/18WZ-CP (b) and
Au/ZrO2 (c). Panel B: Optical spectra of 20WZ-I (a) and Au/20WZ-I (b). Panel C: Optical
spectra of 12WZ-I (a) and Au/12WZ-I (b). Panel D: Optical spectra of 5WZ-I (a) and
Au/5WZ-I (b).
23
3.4. XPS analysis
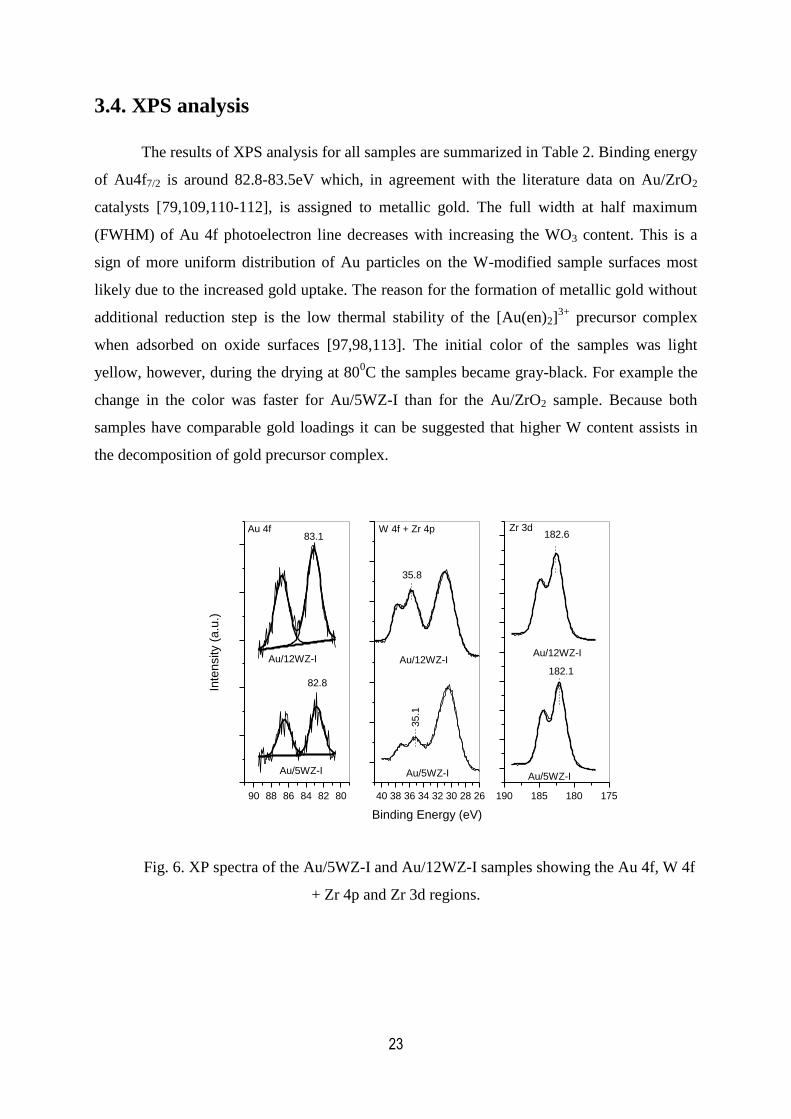
The results of XPS analysis for all samples are summarized in Table 2. Binding energy
of Au4f7/2 is around 82.8-83.5eV which, in agreement with the literature data on Au/ZrO2
catalysts [79,109,110-112], is assigned to metallic gold. The full width at half maximum
(FWHM) of Au 4f photoelectron line decreases with increasing the WO3 content. This is a
sign of more uniform distribution of Au particles on the W-modified sample surfaces most
likely due to the increased gold uptake. The reason for the formation of metallic gold without
additional reduction step is the low thermal stability of the [Au(en)2]3+
precursor complex
when adsorbed on oxide surfaces [97,98,113]. The initial color of the samples was light
yellow, however, during the drying at 800C the samples became gray-black. For example the
change in the color was faster for Au/5WZ-I than for the Au/ZrO2 sample. Because both
samples have comparable gold loadings it can be suggested that higher W content assists in
the decomposition of gold precursor complex.
90 88 86 84 82 80
Inte
nsity (
a.u
.)
Au 4f
Au/12WZ-I
Au/5WZ-I
83.1
82.8
40 38 36 34 32 30 28 26
Au/5WZ-I
Au/12WZ-I
Binding Energy (eV)
W 4f + Zr 4p
35.1
35.8
190 185 180 175
Au/12WZ-I
Au/5WZ-I
Zr 3d
182.1
182.6
Fig. 6. XP spectra of the Au/5WZ-I and Au/12WZ-I samples showing the Au 4f, W 4f
+ Zr 4p and Zr 3d regions.
24
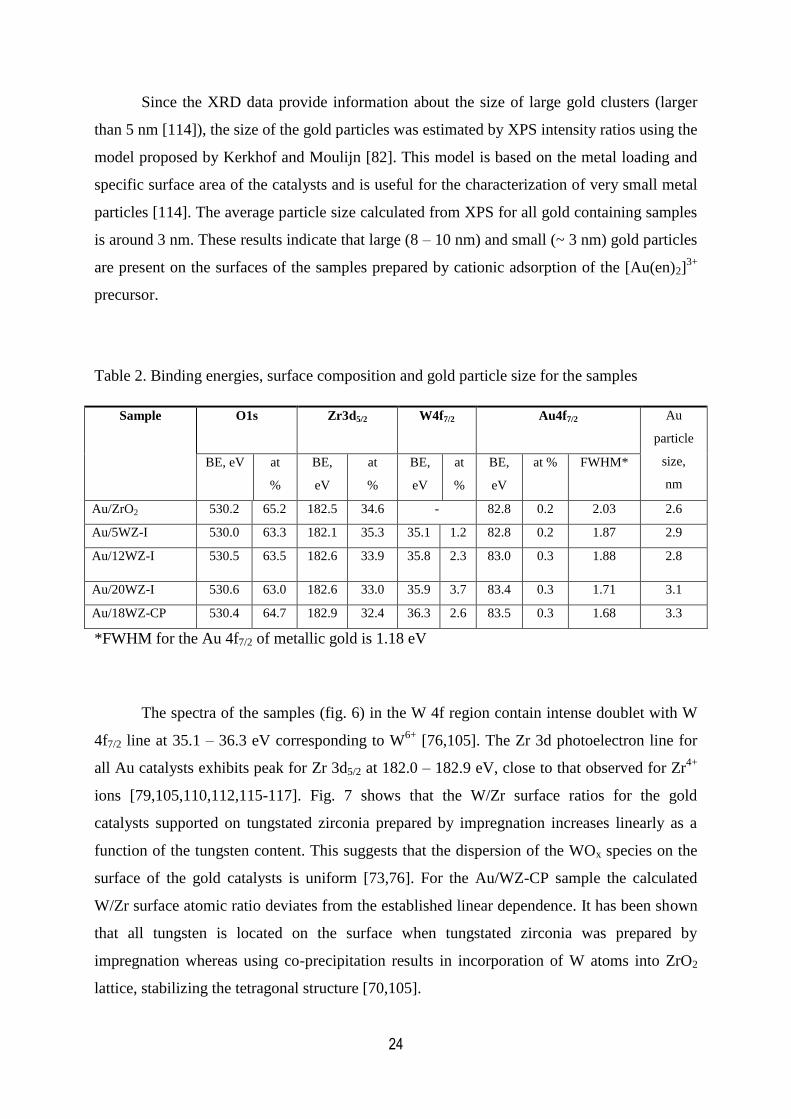
Since the XRD data provide information about the size of large gold clusters (larger
than 5 nm [114]), the size of the gold particles was estimated by XPS intensity ratios using the
model proposed by Kerkhof and Moulijn [82]. This model is based on the metal loading and
specific surface area of the catalysts and is useful for the characterization of very small metal
particles [114]. The average particle size calculated from XPS for all gold containing samples
is around 3 nm. These results indicate that large (8 – 10 nm) and small (~ 3 nm) gold particles
are present on the surfaces of the samples prepared by cationic adsorption of the [Au(en)2]3+
precursor.
Table 2. Binding energies, surface composition and gold particle size for the samples
*FWHM for the Au 4f7/2 of metallic gold is 1.18 eV
The spectra of the samples (fig. 6) in the W 4f region contain intense doublet with W
4f7/2 line at 35.1 – 36.3 eV corresponding to W6+
[76,105]. The Zr 3d photoelectron line for
all Au catalysts exhibits peak for Zr 3d5/2 at 182.0 – 182.9 eV, close to that observed for Zr4+
ions [79,105,110,112,115-117]. Fig. 7 shows that the W/Zr surface ratios for the gold
catalysts supported on tungstated zirconia prepared by impregnation increases linearly as a
function of the tungsten content. This suggests that the dispersion of the WOx species on the
surface of the gold catalysts is uniform [73,76]. For the Au/WZ-CP sample the calculated
W/Zr surface atomic ratio deviates from the established linear dependence. It has been shown
that all tungsten is located on the surface when tungstated zirconia was prepared by
impregnation whereas using co-precipitation results in incorporation of W atoms into ZrO2
lattice, stabilizing the tetragonal structure [70,105].
Sample
O1s Zr3d5/2
W4f7/2
Au4f7/2
Au
particle
size,
nm
BE, eV at
%
BE,
eV
at
%
BE,
eV
at
%
BE,
eV
at % FWHM*
Au/ZrO2 530.2 65.2 182.5 34.6 - 82.8 0.2 2.03 2.6
Au/5WZ-I 530.0 63.3 182.1 35.3 35.1 1.2 82.8 0.2 1.87 2.9
Au/12WZ-I 530.5 63.5 182.6 33.9 35.8 2.3 83.0 0.3 1.88 2.8
Au/20WZ-I 530.6 63.0 182.6 33.0 35.9 3.7 83.4 0.3 1.71 3.1
Au/18WZ-CP 530.4 64.7 182.9 32.4 36.3 2.6 83.5 0.3 1.68 3.3

25
In the O 1s XPS region an intensive peak at ~530.4 eV is observed for all investigated
catalysts. Small asymmetry at higher binding energy side is detected too. This second peak
can be related to the existence of O ions [118]. This suggests the presence in the subsurface
of oxygen ions that bear lower electron density than the “O2
” ions; formally these oxide ions
could be described as “O ” species. They could be associated with sites having higher
covalence of the M O bonds and smaller coordination number of oxygen ions than a regular
site. A reasonable hypothesis is to consider the existence, in variable proportions, of defects in
the subsurface.
0 5 10 15 20
0.00
0.02
0.04
0.06
0.08
0.10
0.12
W/Z
r su
rfa
ce
ra
tio
WO3 (wt %)
Fig.7. W/Zr surface ratios as a function of WO3 content in Au/xWZ-I (x = 0, 5, 12 and 20
wt% WO3) () and Au/18WZ-CP samples ().
The results in Table 2 show that the method of introduction of WOx species to zirconia
(coprecipitation versus impregnation) does not affect the surface concentration of gold.
However, in agreement with the chemical analysis, the amount of gold on the surface
increases with the WO3 loading.

26
3.5. In situ FT-IR spectroscopy
3.5.1. FT-IR spectra of the activated samples
Fig. 8 compares the spectra of the activated Au-free and Au-containing xWZ-I
samples. In the OH stretching region all samples of tungstated zirconia contain a band at 3640
– 3635 cm1 which is attributed to W OH groups [74]. The broad absorption at approximately
3445 cm1 indicates the presence of H-bonded hydroxyls. The spectra in the fundamental
W=O stretching region show a sharp band at 1008 – 1002 cm1 typical of W=O species
[71,73-75]. The deposition of gold does not cause perturbation of the W=O band. However,
compared to the xWZ-I supports, all Au-containing samples display bands in the OH
stretching region with lower intensities. This is associated with the involvement of the surface
hydroxyls of W-containing supports in the deposition process of gold precursor.
4000 3000 2000 1000
Ab
so
rba
nce
0.2
5
5WZ-I
Au/5WZ-I
1008
3640
3445
4000 3000 2000 1000
Au/12WZ-I
20WZ-I12WZ-I
0.2
5
Wavenumber (cm-1)
1004
3640
3445
4000 3000 2000 1000
Au/20WZ-I
0.2
51002
3635
3445
Fig. 8. FT-IR spectra of the activated samples.

27
3.5.2. Adsorption of CO at room temperature
The analysis of the FT-IR spectra of CO (99.95%, BOS) adsorbed at room temperature
on the samples can be very useful to obtain qualitative information on the nature of supported
gold species. Fig. 9A displays the FT-IR spectra in the carbonyl region of CO (10 Torr)
adsorbed on the zirconia samples obtained after the calcination at 6000C of hydrated zirconias
prepared by procedures 1 and 2. The figure shows also the spectra of CO adsorbed on the
calcined supports prepared by impregnating the HZ-1 precursor with AMT solution and by
coprecipitation. As mentioned above, the samples of zirconia obtained using as precursors
hydrated zirconias HZ-1 and HZ-2 crystallize after the calcination at 6000C in monoclinic and
tetragonal structure, respectively. A strong band at 2196 cm1 with a poorly resolved shoulder
is observed in the spectrum of CO adsorbed on monoclinic zirconia (Fig. 9A) which
corresponds to two types of Zr4+
CO carbonyls [71,74,77,106,119-122]. For the pure
tetragonal zirconia sample the CO adsorption yields also one asymmetric band at 2194 cm1
with shoulder at around 2188 cm1 which are ascribed to two types of Lewis acid sites
[77,123]. The spectra clearly show that the population of the coordinatively unsaturated (cus)
Zr4+
sites on monoclinic zirconia is larger than on the tetragonal zirconia. This experimental
fact is in agreement with the results of Morterra and coworkers [77] who concluded that
morphological and structural reasons are responsible for the different concentration of (cus)
Zr4+
sites on the surfaces of the two crystallographic modifications of zirconia. Compared to
the m-ZrO2, the tungstated samples prepared from the HZ-1 precursor are characterized by
lower intensity of the Zr4+
CO band (Fig. 9B) due to saturation of coordinative positions of
Zr4+
ions in the surface layer by the WOx species. The intensity of the Zr4+
CO band
decreases gradually with increase in the tungsten loading. The high-frequency shift of the
carbonyl band exhibited in the WOx-containing zirconia samples is associated with the
increased acidity of the (cus) Zr4+
sites caused by the electron-withdrawing WOx groups
[71,74]. The intensity of the Zr4+
CO band in all xWZ-I samples (having a tetragonal
structure) is significantly higher than that in the pure tetragonal zirconia. This difference can
be ascribed to the application of two different procedures for the preparation of the hydrated
zirconia used as precursor leading to different morphology of the t-ZrO2 and xWZ-I samples,
i.e. different size and shape of the particles, and different amounts of structural defects. In
addition, the acidity of the (cus) Zr4+
ions located in the proximity of the WOx domains is
enhanced resulting in increased amount of (cus) Zr4+
ions detectable by CO adsorption at
room temperature.
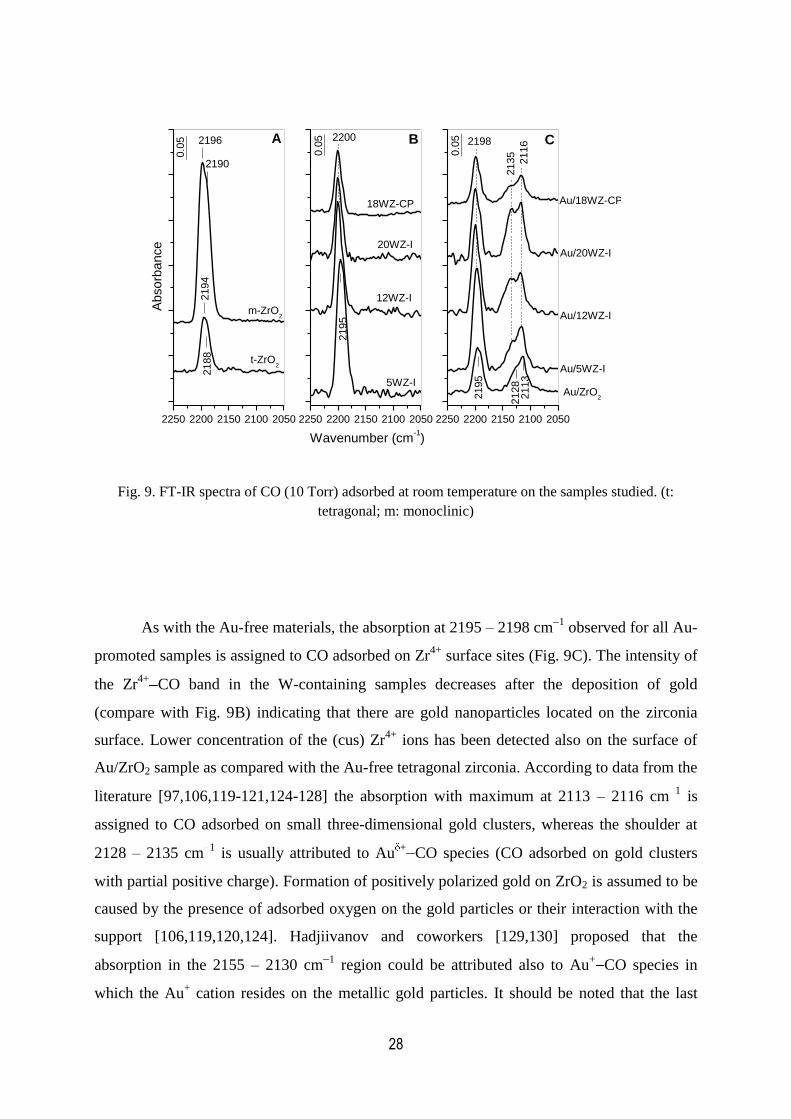
28
2250 2200 2150 2100 2050
t-ZrO2
Ab
so
rba
nce
Wavenumber (cm-1)
m-ZrO2
0.0
5 2196
2194
2190
2188
A
2250 2200 2150 2100 2050
Au/18WZ-CP
Au/20WZ-I
Au/12WZ-I
Au/5WZ-I
B
0.0
5
2195
2200
5WZ-I
12WZ-I
20WZ-I
18WZ-CP
Au/ZrO2
2250 2200 2150 2100 2050
C
0.0
5
2195
2198
2128
2113
2116
2135
Fig. 9. FT-IR spectra of CO (10 Torr) adsorbed at room temperature on the samples studied. (t:
tetragonal; m: monoclinic)
As with the Au-free materials, the absorption at 2195 – 2198 cm1 observed for all Au-
promoted samples is assigned to CO adsorbed on Zr4+
surface sites (Fig. 9C). The intensity of
the Zr4+
CO band in the W-containing samples decreases after the deposition of gold
(compare with Fig. 9B) indicating that there are gold nanoparticles located on the zirconia
surface. Lower concentration of the (cus) Zr4+
ions has been detected also on the surface of
Au/ZrO2 sample as compared with the Au-free tetragonal zirconia. According to data from the
literature [97,106,119-121,124-128] the absorption with maximum at 2113 – 2116 cm1 is
assigned to CO adsorbed on small three-dimensional gold clusters, whereas the shoulder at
2128 – 2135 cm1 is usually attributed to Au
+CO species (CO adsorbed on gold clusters
with partial positive charge). Formation of positively polarized gold on ZrO2 is assumed to be
caused by the presence of adsorbed oxygen on the gold particles or their interaction with the
support [106,119,120,124]. Hadjiivanov and coworkers [129,130] proposed that the
absorption in the 2155 – 2130 cm1 region could be attributed also to Au
+CO species in
which the Au+ cation resides on the metallic gold particles. It should be noted that the last

29
activation step of the investigated samples consisted of evacuation at 4000C and adsorbed
oxygen cannot be expected under these conditions. Moreover, after the reduction of the
samples at 4000C with CO, the absorption at 2128 – 2135 cm
1 is still present in the spectra of
CO adsorbed at room temperature. Recently, absorption band at 2130 – 2140 cm1 observed
during the CO adsorption on Au/Nb2O5 has been attributed to CO coordinated to larger gold
nanoparticles [131]. Therefore, based on the latter interpretation the feature at 2128 – 2135
cm1 (Fig. 9C) is assigned tentatively to CO coordinated to larger gold nanoparticles. This
proposition is supported by the estimates of gold particle sizes from XRD and XPS data
showing that the samples have at least two fractions of crystallites, large (~8 – 10 nm) and
small (~3 nm). For convenience, the absorptions at 2128 – 2135 cm1 and 2113 – 2116 cm
1
are denoted as high-frequency (HF) and low-frequency (LF) gold carbonyls, respectively. The
bands corresponding to the Zr4+
CO and Au CO species are removed upon dynamic
evacuation at room temperature.
According to the chemical analysis the Au loading on Au/ZrO2 and Au/5WZ-I
samples is very close, 1.43 and 1.27 wt %, respectively. However, the intensities of the bands
due to CO adsorbed on the gold sites are higher for the W-containing sample (Fig. 9C)
suggesting higher gold dispersion. Using the same arguments (Au loading and intensities of
the Au carbonyl bands), better gold dispersion can be deduced for the Au/20WZ-I (2.06 wt%
Au) when compared with the Au/18WZ-CP sample (2.27 wt% Au). The spectra of CO
adsorbed on the Au-free supports show that the amount of (cus) Zr4+
ions is higher on the
5WZ-I sample than on t-ZrO2. Likewise, the surface concentration of (cus) Zr4+
ions on the
20WZ-I sample is higher than that on the 18WZ-CP sample. It can be proposed that the
dispersion of gold depends on the amount of (cus) Zr4+
ions. This assumption can be
supported by the results of Chen and Goodman [132] who showed by using HREELS and CO
adsorption that Au bonds directly to coordinatively unsaturated Ti atom on TiO2 (110).
For the Au/xWZ-I sample series, the increase in the intensities of Au carbonyl bands
with the amount of tungsten is associated with the increase in the Au loading. According to
the results of curve fitting of the gold carbonyl bands (Table 3), the fraction of larger gold
particles giving rise to the HF carbonyl band increases with the W loading by larger extent
than the fraction of the smaller gold particles characterized by the LF carbonyl band. This
experimental fact could be explained by the assumption that in the case of W-containing
samples the gold particles formed during the calcination occupy preferentially the WOx-free

30
zirconia surface. The modification of zirconia by tungsten facilitates the gold uptake but at the
same time causes decrease in the concentration of (cus) Zr4+
ions. The decrease in the amount
of nucleation sites for gold particles with increase in the W loading lowers the dispersion.
Table 3. Integrated areas of the gold carbonyl bands recorded at room temperature and
PCO=10 Torr (see Fig. 8)
Sample HF Band*
(cm-1
)
IHF
(a. u.)
LF Band** (cm-
1)
ILF
(a.u.)
IHF/ILF
Au/ZrO2 2128 0.78 2113 0.97 0.80
Au/5WZ-I 2132 1.28 2115 1.35 0.95
Au/12WZ-I 2136 1.79 2116 1.38 1.30
Au/20WZ-I 2136 2.66 2116 1.53 1.74
Au/18WZ-CP 2134 0.84 2115 0.73 1.15
*HF band corresponds to CO adsorbed on large Au particles;
**LF band corresponds to CO adsorbed on small gold particles.
3.5.3. In situ FT-IR spectroscopic investigation of the NO+O2+C3H6
reaction on the surface of gold catalysts supported on zirconia and
tungstated zirconia
In order to evaluate the potential of a new material as catalyst in the process of SCR of
NOx, it is important to investigate the interaction of the reactants (C3H6, O2 and NO) with the
catalyst surface.
3.5.3.1. NO+O2 surface reaction
Solid Brønsted acids, such as WO3/ZrO2 (~19 % WO3), catalyze the oxidation of NO
by molecular oxygen even at room temperature [31]. Fig. 10 shows the spectrum of the gas
phase detected at room temperature after 20 min of the admission of a (10 Torr NO (99.9%,
Air Products)+25 Torr O2) gas mixture to the IR cell containing Au/ZrO2 sample. Gaseous
NO2 (band at 1617 cm−1
) and N2O4 (bands at 1758 and 1264 cm−1
) are formed by the reaction
of NO with O2 in the gas phase (2NO + O2 = 2NO2/N2O4). The exposure of the Au/12WZ-I
sample at room temperature to the same gas mixture (Fig. 10) leads to strong increase in the
amounts of NO2 and N2O4, which shows that the tungstated zirconia promotes the oxidation
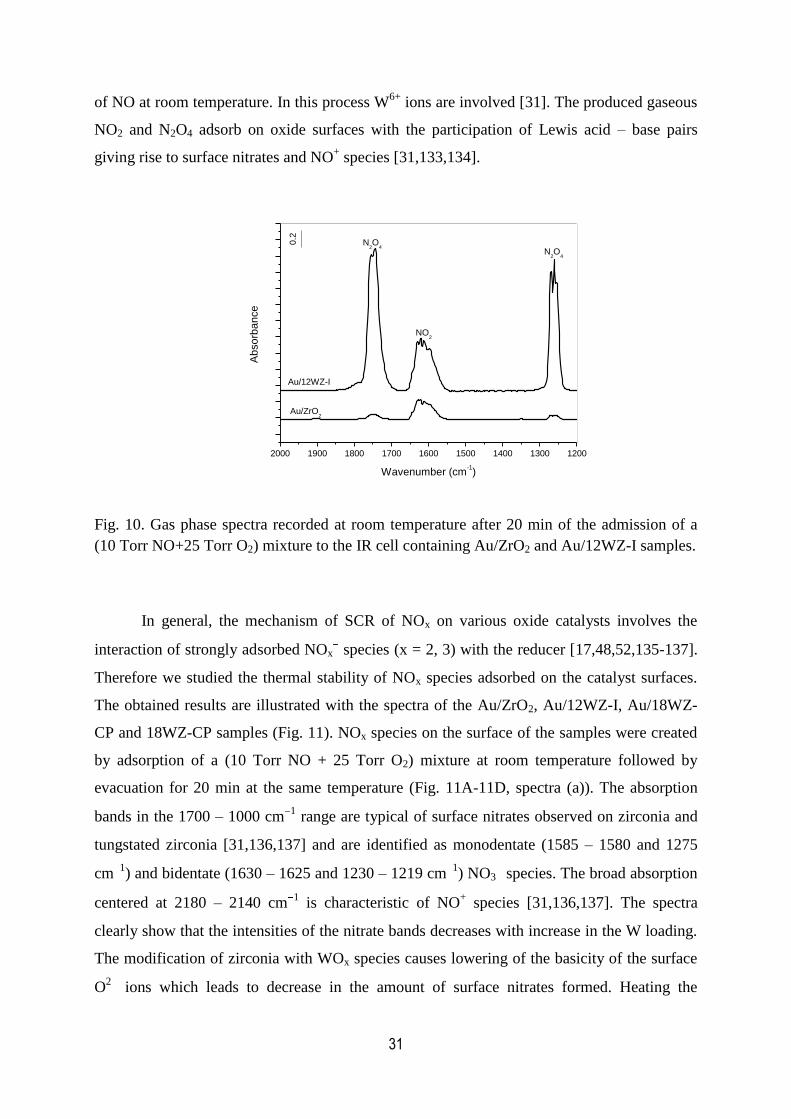
31
of NO at room temperature. In this process W6+
ions are involved [31]. The produced gaseous
NO2 and N2O4 adsorb on oxide surfaces with the participation of Lewis acid – base pairs
giving rise to surface nitrates and NO+ species [31,133,134].
2000 1900 1800 1700 1600 1500 1400 1300 1200
N2O
4A
bso
rba
nce
Wavenumber (cm-1)
Au/ZrO2
Au/12WZ-I
0.2
N2O
4
NO2
Fig. 10. Gas phase spectra recorded at room temperature after 20 min of the admission of a
(10 Torr NO+25 Torr O2) mixture to the IR cell containing Au/ZrO2 and Au/12WZ-I samples.
In general, the mechanism of SCR of NOx on various oxide catalysts involves the
interaction of strongly adsorbed NOx species (x = 2, 3) with the reducer [17,48,52,135-137].
Therefore we studied the thermal stability of NOx species adsorbed on the catalyst surfaces.
The obtained results are illustrated with the spectra of the Au/ZrO2, Au/12WZ-I, Au/18WZ-
CP and 18WZ-CP samples (Fig. 11). NOx species on the surface of the samples were created
by adsorption of a (10 Torr NO + 25 Torr O2) mixture at room temperature followed by
evacuation for 20 min at the same temperature (Fig. 11A-11D, spectra (a)). The absorption
bands in the 1700 – 1000 cm1 range are typical of surface nitrates observed on zirconia and
tungstated zirconia [31,136,137] and are identified as monodentate (1585 – 1580 and 1275
cm1) and bidentate (1630 – 1625 and 1230 – 1219 cm
1) NO3 species. The broad absorption
centered at 2180 – 2140 cm1 is characteristic of NO
+ species [31,136,137]. The spectra
clearly show that the intensities of the nitrate bands decreases with increase in the W loading.
The modification of zirconia with WOx species causes lowering of the basicity of the surface
O2
ions which leads to decrease in the amount of surface nitrates formed. Heating the
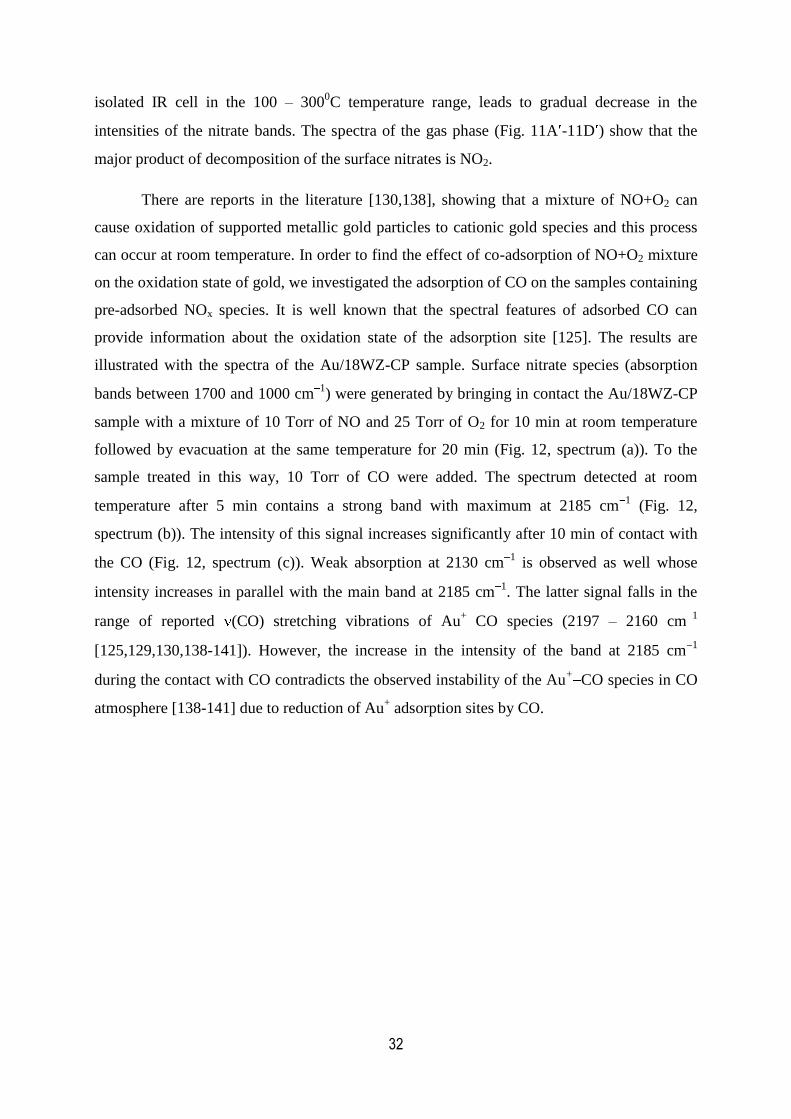
32
isolated IR cell in the 100 – 3000C temperature range, leads to gradual decrease in the
intensities of the nitrate bands. The spectra of the gas phase (Fig. 11A -11D ) show that the
major product of decomposition of the surface nitrates is NO2.
There are reports in the literature [130,138], showing that a mixture of NO+O2 can
cause oxidation of supported metallic gold particles to cationic gold species and this process
can occur at room temperature. In order to find the effect of co-adsorption of NO+O2 mixture
on the oxidation state of gold, we investigated the adsorption of CO on the samples containing
pre-adsorbed NOx species. It is well known that the spectral features of adsorbed CO can
provide information about the oxidation state of the adsorption site [125]. The results are
illustrated with the spectra of the Au/18WZ-CP sample. Surface nitrate species (absorption
bands between 1700 and 1000 cm1) were generated by bringing in contact the Au/18WZ-CP
sample with a mixture of 10 Torr of NO and 25 Torr of O2 for 10 min at room temperature
followed by evacuation at the same temperature for 20 min (Fig. 12, spectrum (a)). To the
sample treated in this way, 10 Torr of CO were added. The spectrum detected at room
temperature after 5 min contains a strong band with maximum at 2185 cm1 (Fig. 12,
spectrum (b)). The intensity of this signal increases significantly after 10 min of contact with
the CO (Fig. 12, spectrum (c)). Weak absorption at 2130 cm1 is observed as well whose
intensity increases in parallel with the main band at 2185 cm1. The latter signal falls in the
range of reported (CO) stretching vibrations of Au+
CO species (2197 – 2160 cm1
[125,129,130,138-141]). However, the increase in the intensity of the band at 2185 cm1
during the contact with CO contradicts the observed instability of the Au+
CO species in CO
atmosphere [138-141] due to reduction of Au+ adsorption sites by CO.

33
2500 2250 2000 1750 1500 1250 1000
d
c
Ab
so
rba
nce
Wavenumber (cm-1)
a
b
0.5 1629 1582
1275
1219
2140
(A)
2500 2250 2000 1750 1500
(A')
NO2
b
c
d
0.0
25
2400 2100 1800 1500 1200
Ab
so
rba
nce
Wavenumber (cm-1)
1625
1570
1220
1275
0.5
a
b
c
d
2180
(C)
2200 2000 1800 1600 1400
(C')
b
c
d
NO2
0.0
25
2500 2250 2000 1750 1500 1250 10002500 2250 2000 1750 1500
Ab
so
rba
nce
Wavenumber (cm-1)
0.5
2140
1625
1580
1222
1275
(B)
a
b
c
d
(B')
NO2
b
c
d
0.0
25
2500 2250 2000 1750 1500 1250 1000
Ab
so
rba
nce
Wavenumber (cm-1)
0.5
a
b
c
d
(D)1630
1585
1275
1230
2200 2000 1800 1600 1400
(D')
b
c
d
NO2
0.0
25
Fig. 11. FT-IR spectra of the Au/18WZ-CP (panel A), 18WZ-CP (panel B), Au/12WZ-I (panel C) and Au/ZrO2 (panel D) samples taken after the introduction
of a (10 Torr NO+25 Torr O2) mixture to the IR cell for 10 min at room temperature followed by evacuation for 20 min (a), and after heating the
isolated IR cell for 10 min at 1000C (b), 200
0C (c) and 300
0C (d). Panels A , B , C and D : Gas phase spectra over the samples collected at 100
0C (b),
2000C (c) and 300
0C (d).
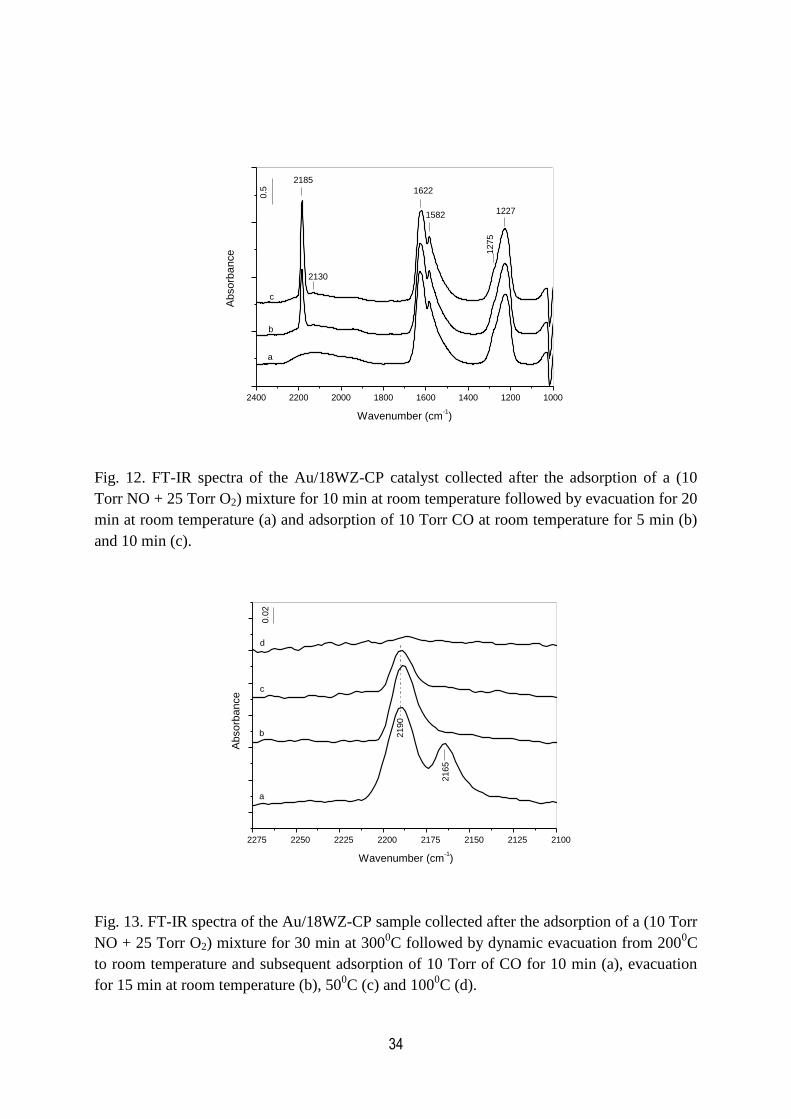
34
2400 2200 2000 1800 1600 1400 1200 1000
Ab
so
rba
nce
Wavenumber (cm-1)
a
b
c
2185
1622
1582
1275
1227
0.5
2130
Fig. 12. FT-IR spectra of the Au/18WZ-CP catalyst collected after the adsorption of a (10
Torr NO + 25 Torr O2) mixture for 10 min at room temperature followed by evacuation for 20
min at room temperature (a) and adsorption of 10 Torr CO at room temperature for 5 min (b)
and 10 min (c).
2275 2250 2225 2200 2175 2150 2125 2100
Ab
so
rba
nce
Wavenumber (cm-1)
2190
2165
a
b
c
d
0.0
2
Fig. 13. FT-IR spectra of the Au/18WZ-CP sample collected after the adsorption of a (10 Torr
NO + 25 Torr O2) mixture for 30 min at 3000C followed by dynamic evacuation from 200
0C
to room temperature and subsequent adsorption of 10 Torr of CO for 10 min (a), evacuation
for 15 min at room temperature (b), 500C (c) and 100
0C (d).

35
In order to ensure more efficient oxidation of gold, the catalyst pellet was treated with
a (10 Torr NO + 25 Torr O2) mixture at 3000C for 30 min. Then the temperature was lowered
to 2000C and the gas mixture was removed from the IR cell upon dynamic evacuation while
cooling to room temperature. Subsequent adsorption of CO (10 Torr) at room temperature
results in the formation of weak absorption bands at 2190 and 2165 cm1 (Fig. 13, spectrum
(a)). The spectrum in the nitrate region (not shown) displays the same set of nitrate bands as
shown in Fig. 11A, although with weaker intensity. The band at 2190 cm1 resists the
evacuation at room temperature (Fig. 13, spectrum (b)) and disappears upon out-gassing at
1000C (Fig. 13, spectrum (d)). The observed behavior of the absorption at 2190 cm
1 is
typical of Au+
CO species [125]. The CO adsorbed on Au+ sites is stabilized by the
synergism between the -dative and π back-bonding components of the Au+
CO bond
[125,129,130,138] and the carbonyl complex can be destroyed at temperature higher than
250C. The absorption at 2165 cm
1 disappears upon evacuation at room temperature (Fig. 13,
spectrum (b)) and could be attributed to Auδ+
CO species or CO adsorbed on large gold
particles. This band is found at higher frequency than the corresponding band observed on the
activated Au/18WZ-CP sample (see Fig. 9C) indicating that either the Auδ+
sites bear a
greater positive charge or there is agglomeration of the gold particles after the high-
temperature treatment with NO+O2 mixture. It is likely that the species giving rise to the band
at 2165 cm1 could be Au
+ adsorption sites dispersed on the surface of metallic gold particles
as proposed in [129,130].
Spectrum (a) in Fig. 13 differs from the spectrum of adsorbed CO on the sample
treated with NO+O2 mixture at room temperature (Fig. 12, spectrum (c)). It seems that the
oxidation of gold particles by the NO+O2 mixture takes place at higher temperature (3000C)
and the absorption band at 2185 cm1 detected during the CO adsorption on the sample treated
with NO+O2 mixture at room temperature (Fig. 12, spectra (b) and (c)) cannot be ascribed to
Au+
CO species. This conclusion is supported also by the fact that the color of the Au/18WZ-
CP sample after the pre-treatment with NO+O2 mixture at room temperature remained the
same as that of the activated sample, i.e. gray-black. However, the treatment with NO+O2
mixture at 3000C causes changes in the color of the sample from gray-black to pale-violet
(Au+).
Taking into account that the compounds adsorbed at room temperature on the
Au/18WZ-CP sample are CO and NOx species, it could be proposed that the strong band at
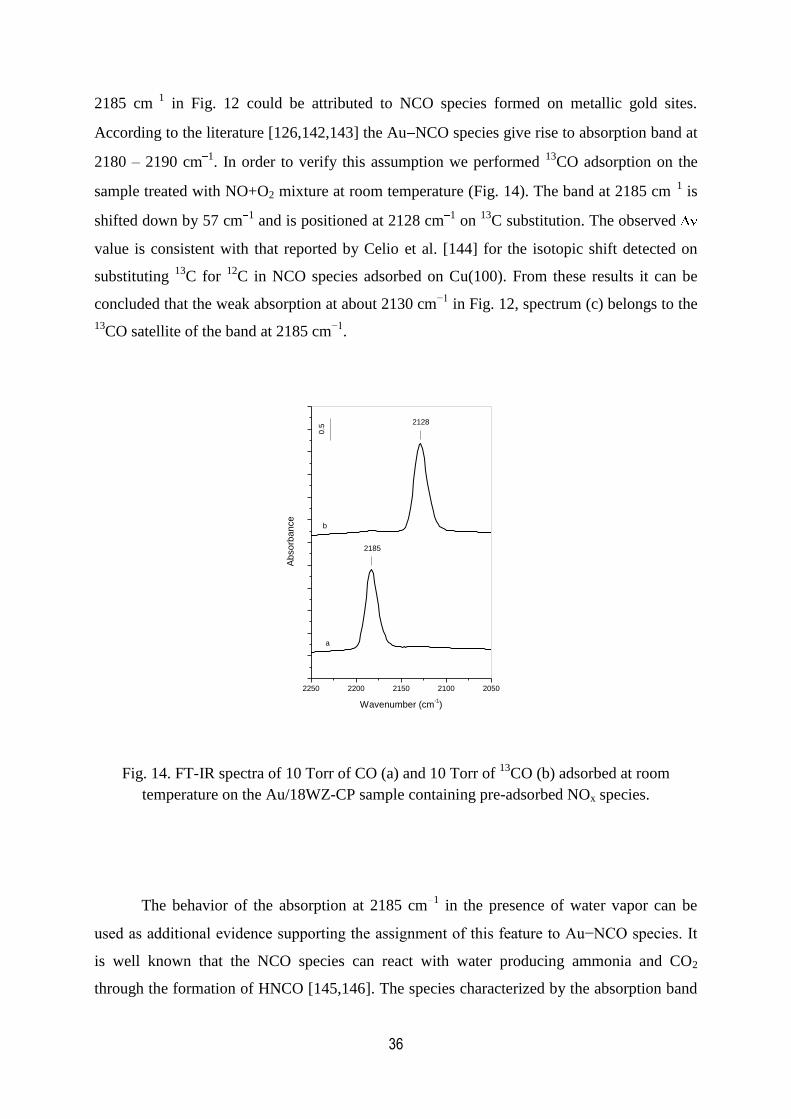
36
2185 cm1 in Fig. 12 could be attributed to NCO species formed on metallic gold sites.
According to the literature [126,142,143] the Au NCO species give rise to absorption band at
2180 – 2190 cm1. In order to verify this assumption we performed
13CO adsorption on the
sample treated with NO+O2 mixture at room temperature (Fig. 14). The band at 2185 cm1 is
shifted down by 57 cm1 and is positioned at 2128 cm
1 on
13C substitution. The observed
value is consistent with that reported by Celio et al. [144] for the isotopic shift detected on
substituting 13
C for 12
C in NCO species adsorbed on Cu(100). From these results it can be
concluded that the weak absorption at about 2130 cm−1
in Fig. 12, spectrum (c) belongs to the
13CO satellite of the band at 2185 cm
−1.
2250 2200 2150 2100 2050
Ab
so
rba
nce
Wavenumber (cm-1)
2185
2128
a
b
0.5
Fig. 14. FT-IR spectra of 10 Torr of CO (a) and 10 Torr of 13
CO (b) adsorbed at room
temperature on the Au/18WZ-CP sample containing pre-adsorbed NOx species.
The behavior of the absorption at 2185 cm1 in the presence of water vapor can be
used as additional evidence supporting the assignment of this feature to Au−NCO species. It
is well known that the NCO species can react with water producing ammonia and CO2
through the formation of HNCO [145,146]. The species characterized by the absorption band
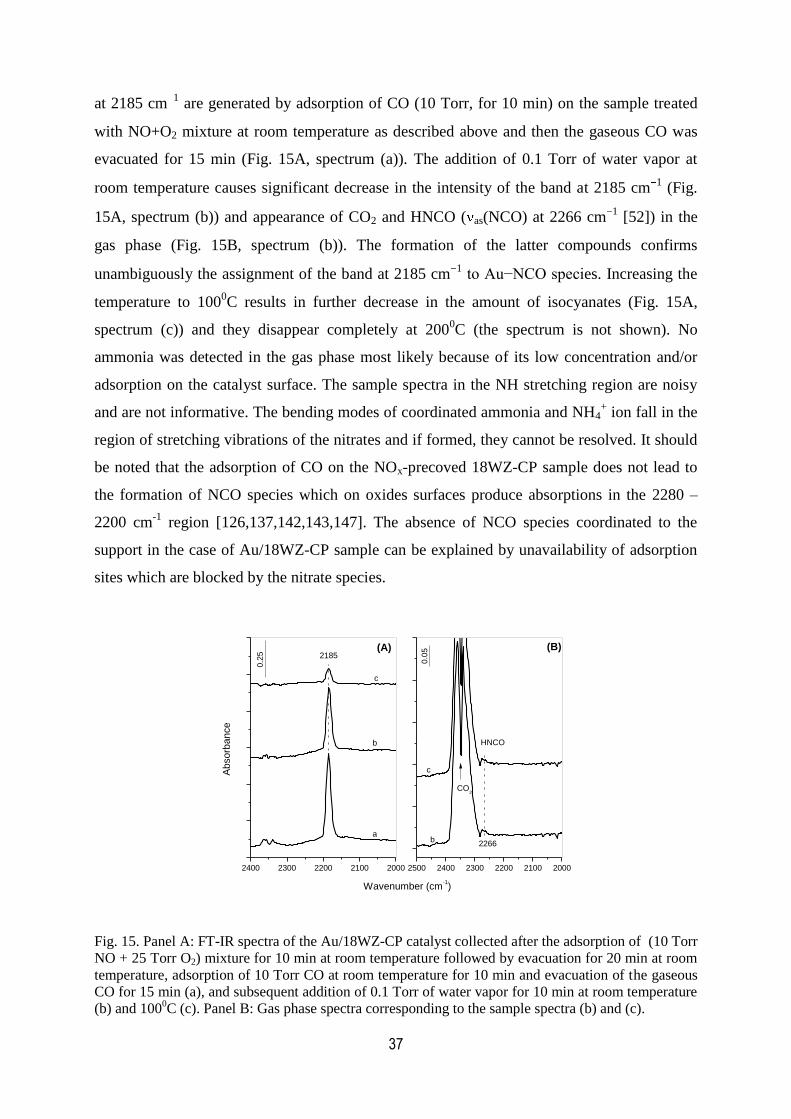
37
at 2185 cm1 are generated by adsorption of CO (10 Torr, for 10 min) on the sample treated
with NO+O2 mixture at room temperature as described above and then the gaseous CO was
evacuated for 15 min (Fig. 15A, spectrum (a)). The addition of 0.1 Torr of water vapor at
room temperature causes significant decrease in the intensity of the band at 2185 cm1 (Fig.
15A, spectrum (b)) and appearance of CO2 and HNCO ( as(NCO) at 2266 cm1 [52]) in the
gas phase (Fig. 15B, spectrum (b)). The formation of the latter compounds confirms
unambiguously the assignment of the band at 2185 cm1 to Au−NCO species. Increasing the
temperature to 1000C results in further decrease in the amount of isocyanates (Fig. 15A,
spectrum (c)) and they disappear completely at 2000C (the spectrum is not shown). No
ammonia was detected in the gas phase most likely because of its low concentration and/or
adsorption on the catalyst surface. The sample spectra in the NH stretching region are noisy
and are not informative. The bending modes of coordinated ammonia and NH4+ ion fall in the
region of stretching vibrations of the nitrates and if formed, they cannot be resolved. It should
be noted that the adsorption of CO on the NOx-precoved 18WZ-CP sample does not lead to
the formation of NCO species which on oxides surfaces produce absorptions in the 2280 –
2200 cm-1
region [126,137,142,143,147]. The absence of NCO species coordinated to the
support in the case of Au/18WZ-CP sample can be explained by unavailability of adsorption
sites which are blocked by the nitrate species.
2400 2300 2200 2100 2000
Ab
so
rba
nce
Wavenumber (cm-1)
0.2
5
(A)2185
a
b
c
2500 2400 2300 2200 2100 2000
(B)
2266
CO2
0.0
5
b
c
HNCO
Fig. 15. Panel A: FT-IR spectra of the Au/18WZ-CP catalyst collected after the adsorption of (10 Torr
NO + 25 Torr O2) mixture for 10 min at room temperature followed by evacuation for 20 min at room
temperature, adsorption of 10 Torr CO at room temperature for 10 min and evacuation of the gaseous
CO for 15 min (a), and subsequent addition of 0.1 Torr of water vapor for 10 min at room temperature
(b) and 1000C (c). Panel B: Gas phase spectra corresponding to the sample spectra (b) and (c).
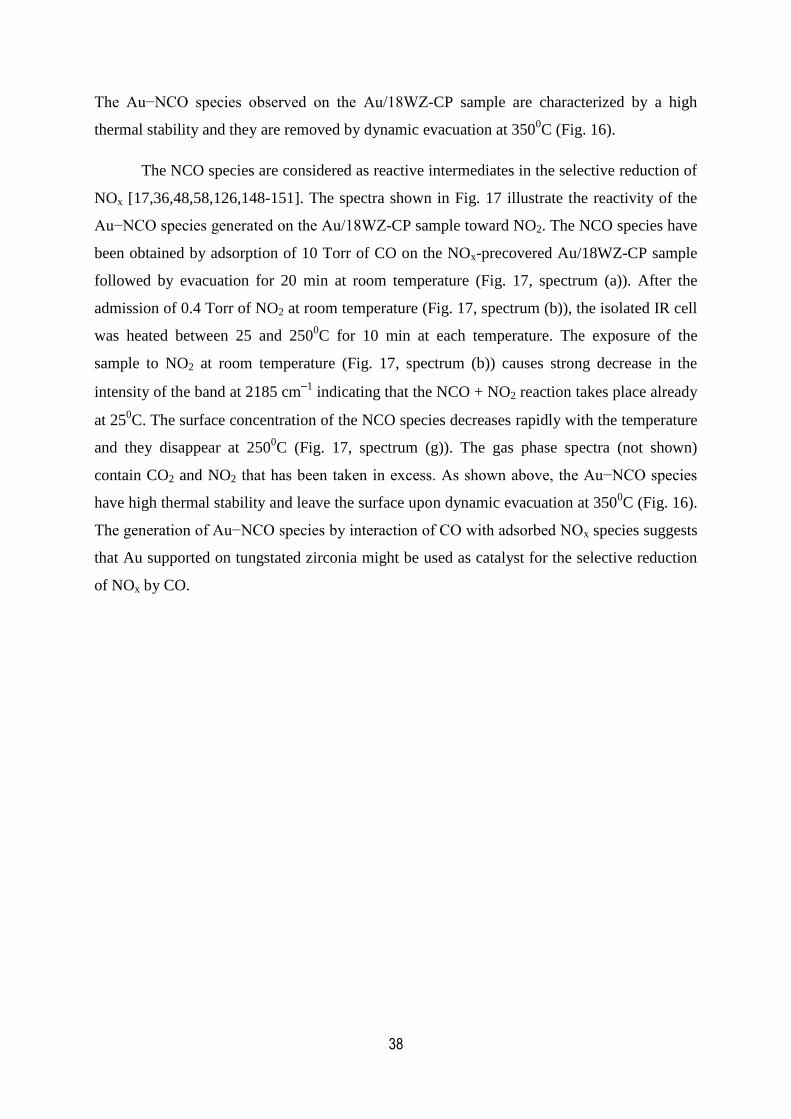
38
The Au−NCO species observed on the Au/18WZ-CP sample are characterized by a high
thermal stability and they are removed by dynamic evacuation at 3500C (Fig. 16).
The NCO species are considered as reactive intermediates in the selective reduction of
NOx [17,36,48,58,126,148-151]. The spectra shown in Fig. 17 illustrate the reactivity of the
Au−NCO species generated on the Au/18WZ-CP sample toward NO2. The NCO species have
been obtained by adsorption of 10 Torr of CO on the NOx-precovered Au/18WZ-CP sample
followed by evacuation for 20 min at room temperature (Fig. 17, spectrum (a)). After the
admission of 0.4 Torr of NO2 at room temperature (Fig. 17, spectrum (b)), the isolated IR cell
was heated between 25 and 2500C for 10 min at each temperature. The exposure of the
sample to NO2 at room temperature (Fig. 17, spectrum (b)) causes strong decrease in the
intensity of the band at 2185 cm1 indicating that the NCO + NO2 reaction takes place already
at 250C. The surface concentration of the NCO species decreases rapidly with the temperature
and they disappear at 2500C (Fig. 17, spectrum (g)). The gas phase spectra (not shown)
contain CO2 and NO2 that has been taken in excess. As shown above, the Au−NCO species
have high thermal stability and leave the surface upon dynamic evacuation at 3500C (Fig. 16).
The generation of Au−NCO species by interaction of CO with adsorbed NOx species suggests
that Au supported on tungstated zirconia might be used as catalyst for the selective reduction
of NOx by CO.
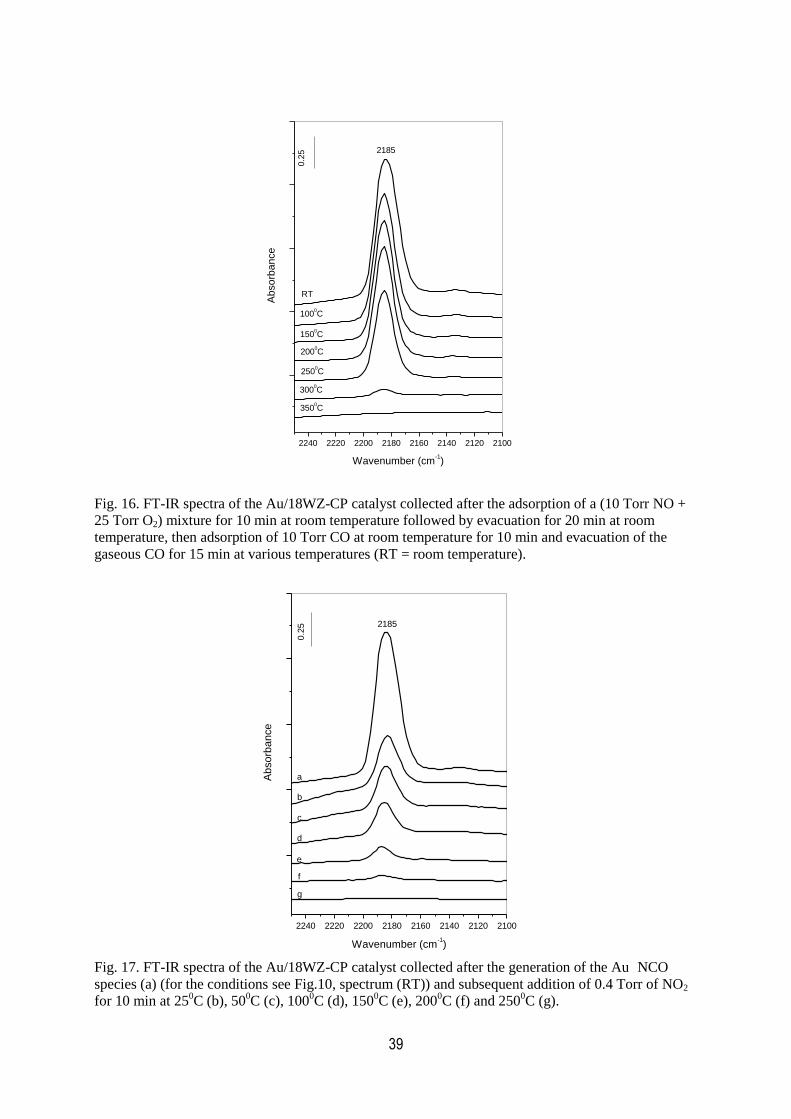
39
Fig. 16. FT-IR spectra of the Au/18WZ-CP catalyst collected after the adsorption of a (10 Torr NO +
25 Torr O2) mixture for 10 min at room temperature followed by evacuation for 20 min at room
temperature, then adsorption of 10 Torr CO at room temperature for 10 min and evacuation of the
gaseous CO for 15 min at various temperatures (RT = room temperature).
Fig. 17. FT-IR spectra of the Au/18WZ-CP catalyst collected after the generation of the Au NCO
species (a) (for the conditions see Fig.10, spectrum (RT)) and subsequent addition of 0.4 Torr of NO2
for 10 min at 250C (b), 50
0C (c), 100
0C (d), 150
0C (e), 200
0C (f) and 250
0C (g).
2240 2220 2200 2180 2160 2140 2120 2100
3500C
3000C
2500C
2000C
1500C
1000C
Ab
so
rba
nce
Wavenumber (cm-1)
RT0.2
5 2185
2240 2220 2200 2180 2160 2140 2120 2100
Ab
so
rba
nce
Wavenumber (cm-1)
a
b
c
d
e
f
g
0.2
5 2185

40
The adsorption of CO on gold catalysts supported on tungstated zirconia obtained by
impregnation (Au/xWZ-I samples, x = 5, 12 and 20 wt % WO3) and containing pre-adsorbed
NOx species leads also to the formation of NCO species coordinated to gold particles. As with
the Au/18WZ-CP sample, surface nitrates on the Au/xWZ-I samples were created by
adsorption of mixture of 10 Torr NO and 25 Torr O2 at RT for 10 min followed by evacuation
for 20 min at RT. Fig. 18 compares the FT-IR spectra obtained during the CO adsorption for
10 min at 500C over the NOx-pretreated Au/xWZ-I and Au/18WZ-CP samples. This
temperature has been chosen because under these conditions the Au NCO band at 2185 cm1
observed on all of the samples reaches maximum intensity. The spectra clearly show that the
intensities of the nitrate bands at 1625, 1583, 1275 and 1225 cm1 decreases with increase in
the W loading which is consistent with the reduced surface basicity. The lower intensity of the
Au NCO band on the samples with higher tungsten content is associated with the decrease in
the gold dispersion.
2200 2000 1800 1600 1400 1200
Au/20WZ-I
Ab
so
rba
nce
Wavenumber (cm-1)
Au/18WZ-CP
Au/12WZ-I
Au/5WZ-I
0.52185
15831625
1225
1275
Fig. 18. FT-IR spectra of the samples collected after the adsorption of a (10 Torr NO + 25
Torr O2) mixture for 10 min at room temperature followed by evacuation for 20 min at room
temperature and adsorption of 10 Torr CO at 500C for 10 min.
41
It is difficult to propose unambiguous mechanism for the formation of NCO species on
the gold-containing catalysts. Jugnet et al. [152] reported that CO undergoes
disproportionation on Au(110) surface at room temperature. We believe that this process is
also occurring on the Au/xWZ-I samples. The produced carbon can interact with the surface
nitrates leading to the formation of NCO species attached to the gold sites.
3.5.3.2 Co-adsorption of C3H6+O2 mixture on the Au/ZrO2 and Au/xWZ-I
catalysts at various temperatures
In this investigation we used the gold catalysts supported on tungstated zirconia
prepared by impregnation. In order to find information about the effect of tungsten, the
C3H6+O2 reaction has been studied on the Au/ZrO2 sample as well.
Fig. 19 shows the spectra in the 25 – 3000C temperature range obtained during the
contact of the Au/ZrO2 and Au/xWZ-I catalysts with a gas mixture containing 3 Torr of C3H6
and 25 Torr of O2. The spectrum of the Au/ZrO2 sample taken at room temperature (Fig. 19A,
spectrum (a)) contains absorptions at 1620 and 1453 cm1 characteristic of adsorbed propene
[18,153]. Heating the closed IR cell at 1500C causes oxidation of the hydrocarbon leading to
formation of polydentate carbonates at 1445 and 1420 cm1 [154,155] and most likely HCO3
species at 1610 and 1270 cm1 [154,155]. Small amounts of adsorbed acetone at 1670
cm1[18,29,30,156-158] and most likely acetates at 1562 and 1368 cm
1 [18,29,30] are
detected as well. At 2500C the adsorbed acetone disappears and the predominant adsorbed
species are the acetates at 1562, 1445 and 1368 cm1. The experimental results lead to the
conclusion that the W-free Au/ZrO2 sample catalyzes the deeper oxidation of propene. The
assignment of the absorption bands is given in Table 4.
The spectra of the Au/xWZ-I samples (Figs. 19B-19D) taken at room temperature
contain also bands at 1620, 1454 – 1450 and 1375 cm1 corresponding to adsorbed propene.
The weak absorption at 1090 cm1 detected in the spectrum of the Au/20WZ-I sample (Fig.
19D, spectrum (a)) indicates the presence of isopropoxy species which are produced by
interaction of propene with the surface OH groups [18,29,30,156,157,159-161]. The
absorption at 1540 cm1 (Fig. 19D, spectrum (a)) is best assigned to acetone enolate anion
[29]. Formation of partially oxidized hydrocarbons on the Au/20WZ-I sample at room
temperature indicates that the activation of propene takes place easy on this material. Heating
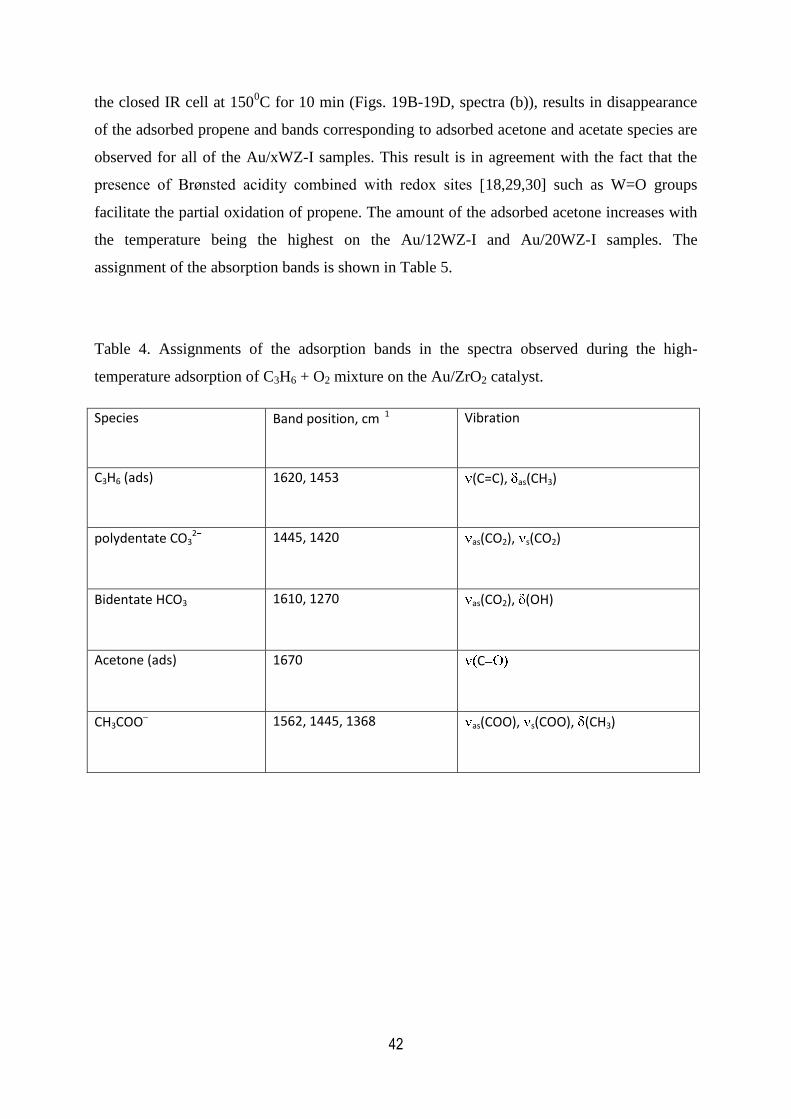
42
the closed IR cell at 1500C for 10 min (Figs. 19B-19D, spectra (b)), results in disappearance
of the adsorbed propene and bands corresponding to adsorbed acetone and acetate species are
observed for all of the Au/xWZ-I samples. This result is in agreement with the fact that the
presence of Brønsted acidity combined with redox sites [18,29,30] such as W=O groups
facilitate the partial oxidation of propene. The amount of the adsorbed acetone increases with
the temperature being the highest on the Au/12WZ-I and Au/20WZ-I samples. The
assignment of the absorption bands is shown in Table 5.
Table 4. Assignments of the adsorption bands in the spectra observed during the high-
temperature adsorption of C3H6 + O2 mixture on the Au/ZrO2 catalyst.
Species Band position, cm 1 Vibration
C3H6 (ads) 1620, 1453 (C=C), as(CH3)
polydentate CO32 1445, 1420 as(CO2), s(CO2)
Bidentate HCO3 1610, 1270 as(CO2), (OH)
Acetone (ads) 1670 C
CH3COO 1562, 1445, 1368 as(COO), s(COO), (CH3)
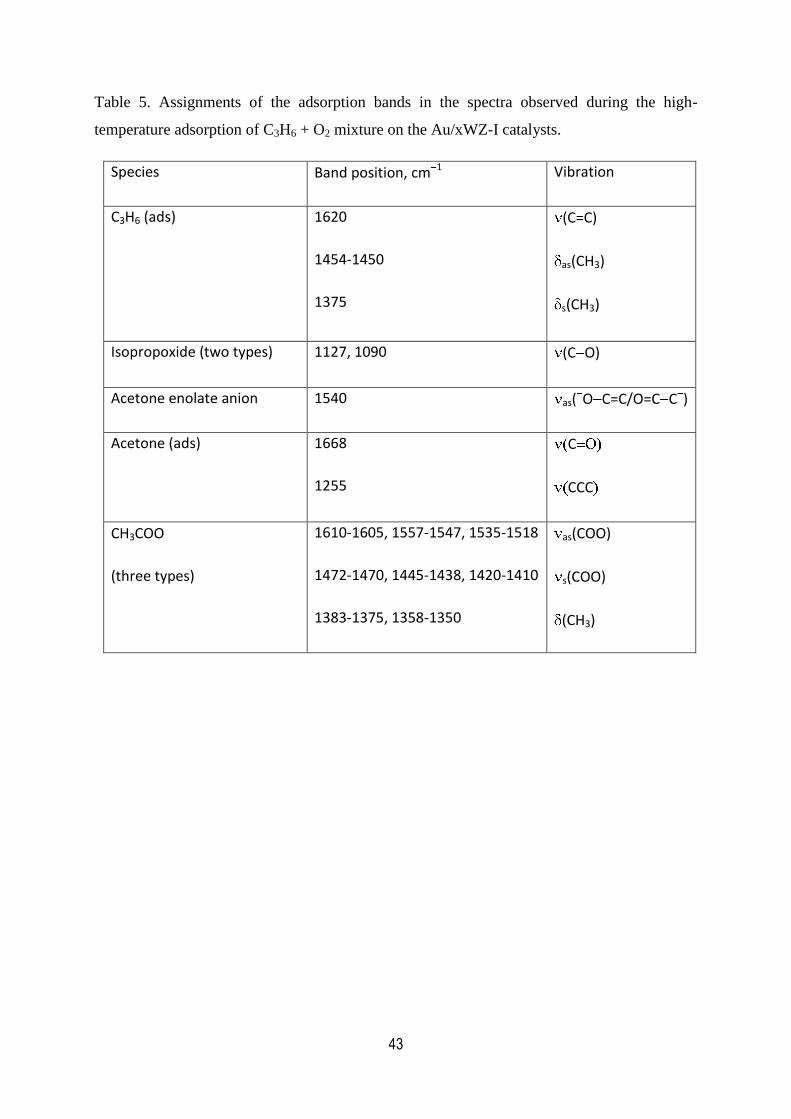
43
Table 5. Assignments of the adsorption bands in the spectra observed during the high-
temperature adsorption of C3H6 + O2 mixture on the Au/xWZ-I catalysts.
Species Band position, cm 1 Vibration
C3H6 (ads) 1620
1454-1450
1375
(C=C)
as(CH3)
s(CH3)
Isopropoxide (two types) 1127, 1090 (C O)
Acetone enolate anion 1540 as( O C=C/O=C C )
Acetone (ads) 1668
1255
C
CCC
CH3COO
(three types)
1610-1605, 1557-1547, 1535-1518
1472-1470, 1445-1438, 1420-1410
1383-1375, 1358-1350
as(COO)
s(COO)
(CH3)

44
2000 1800 1600 1400 1200 1000
Ab
so
rba
nce
Wavenumber (cm-1)
1620 1453
1670
1562
1445
14201368
0.1
(A)
1610
1270
a
b
c
d
e
2000 1800 1600 1400 1200 1000
e
d
c
b
Ab
so
rba
nce
Wavenumber (cm-1)
16201453
1668
1610
1535
1443
1380
0.2
1375
1557
1358
1410
1472
(C)
a
2000 1800 1600 1400 1200 1000
Ab
so
rba
nce
Wavenumber (cm-1)
1620 1454
1668
1610
1557
1438
1383
1350
0.2
1526
1375
1470
1415
(B)
a
b
c
d
e
2000 1800 1600 1400 1200 1000
Ab
sorb
an
ce
Wavenumber (cm-1)
1620
1450
1668
1090
1127
1605
1547
1445
1375
1255
0.2
1375
1518
1420
1358
1540
(D)
a
b
c
d
e
Fig. 19. FT-IR spectra collected during the exposure of the Au/ZrO2 (Panel A), Au/5WZ-I (Panel B),
Au/12WZ-I (Panel C) and Au/20WZ-I (Panel D) catalysts to a (3 Torr C3H6 +25 Torr O2) mixture for
10 min at room temperature (a) followed by heating the isolated IR cell for 10 min 1500C (b), 200
0C
(c), 2500C (d) and 300
0C (e).

45
3.5.3.3. Reactivity of the surface species formed upon room-temperature adsorption of
NO+C3H6+O2 mixture on Au/xWZ-I catalysts
It has been shown previously that the conversion of propene to acetone in the presence
of acidic catalyst is important step in the SCR of NOx by propene [18]. Therefore, here we
will describe the results of in situ FT-IR spectroscopic investigation of the NOx+C3H6 surface
reaction over the Au/12WZ-I and Au/20WZ-I catalysts.
Fig. 20A shows the spectrum of the Au/12WZ-I sample exposed to a gaseous mixture
containing 10 Torr NO + 3 Torr C3H6 + 25 Torr O2 at room temperature for 15 min followed
by evacuation for 20 min (spectrum (a)). The broad absorption between 3550 and 3000 cm1
is typical of H-bonded hydroxyls and indicates that the oxidation of propene has occurred
already at room temperature. The weak bands at 3006 and 2990 cm1 are assigned to the
(CH) and s(CH2) modes of adsorbed propene [18,153] while the absorptions at 2938 and
2875 cm1 are attributed to the as(CH3) and s(CH3) stretching vibrations of adsorbed
propene [18,153] and partially oxidized derivatives of the hydrocarbon [18,29,30,
156,157,159-161]. The bands in the 1800 – 1000 cm1 region differ from that observed upon
NO+O2 adsorption (see Fig. 11) which suggests that the presence of adsorbed propene and its
products of oxidation influence the mode of coordination of the nitrate species. The bands at
1654 and 1255 cm1 are assigned to bridged nitrates whereas the bands at 1605, 1577 and
1278 cm1 are attributed to bidentate nitrates. The weak absorptions at 1138 and 1090 cm
1
reveal the presence of isopropoxides and correspond to their (C O) modes [18,29,30,
156,157,159-161]. The unresolved absorption at 1680 cm1 belongs to the (C=O) stretching
vibration of adsorbed acetone [18]. The fact that no partially oxidized hydrocarbon species
were observed at room temperature during the C3H6+O2 experiment (Fig. 19C, spectrum (a)),
indicates that the formation of surface nitrates and/or gaseous NO2 during the room-
temperature adsorption of NO+C3H6+O2 mixture facilitates the activation of propene.
Heating the sample for 15 min at 1000C leads to the appearance of a shoulder at 1730
cm1 which has been attributed previously [18] to the (C=O) mode of adsorbed nitroacetone.
This compound is formed most likely by interaction of the isopropoxides with the NO3 /NO2
species. The appearance of weak bands at 1470, 1440, 1380 and 1350 cm1 indicate the
formation of two types of acetate species [18,30,156-158]. The concentration of the surface

46
nitrates has decreased and the amount of NO2 evolved in the gas phase (Fig. 20B, spectrum
(b)) is much smaller than that produced in the absence of propene (Fig. 11C , spectrum (b)).
Some amounts of N2O and CO2 are formed as well. The presence of CO2 in the gas phase
indicates that complete oxidation of propene takes place to some extent at 1000C. At 150
0C
(Fig. 20, spectra (c)), the intensities of the nitrate bands at 1278 and 1255 cm1 and the
amount of gaseous NO2 decrease significantly. At the same time, there is increase in the
amounts of adsorbed nitroacetone (1730 cm1), acetone (shoulder at 1680 cm
1) and acetates
(absorptions between 1500 and 1300 cm1). The lowering of the concentrations of the
isopropoxides (1138 and 1090 cm1) and gaseous NO2 indicates that they are involved in the
formation of the carbonyl compounds, which are further oxidized to acetates. The weak band
at 2182 cm1 detected at 150
0C is attributed to NCO species coordinated to gold particles
[126,142,143]. Increasing the temperature to 2000C leads to broadening of the Au NCO band
and unresolved shoulder at ~2150 cm1 is observed. It can be proposed that the NCO species
coordinated to small and large gold particles produce as(NCO) vibrations at different
frequencies. Assuming that the larger gold particles are less reactive, the low-frequency
Au NCO band at 2150 cm1, which appears at higher temperature, can be attributed to NCO
species coordinated to larger metal clusters. The spectrum taken at 2000C indicates that the
amount of adsorbed nitroacetone decreased relative to that at 1500C. This leads to the
conclusion that the generation of Au NCO species takes place through transformation of
nitroacetone. Allesandrini et al. [162] have shown that complexes of Pt(II) and Pt(0) can
cause cleavage of -nitroketones resulting in metal complexes containing fulminato and
carboxylato groups. The coordinated fulminato (CNO) species can undergo isomerization to
isocyanates (NCO). It can be proposed that Au particles are involved in a similar internal
redox process of nitroacetone resulting in Au NCO species formation:
The surface isocyanates react readily with NO+O2 mixtures and/or NO2 yielding
molecular nitrogen, N2O and CO2 as reaction products [17,18,42,43,137,149,151,163,164].
This fact can account for the disappearance of the NCO species and strong decrease in the

47
amount of surface nitrates (which are source of NO2) at 2500C. The spectrum detected at
3000C contains bands at 1535, 1440 and 1350 cm
1 due to surface acetates and carbonates.
The carbonates are formed by readsorption of the CO2 which is supported by the observed
lowering of its concentration in the gas phase at 3000C (Fig. 20B, spectrum (f)). The
assignment of the absorption bands is given in Table 6.
Fig. 21 shows the results of the reactivity of surface species formed upon room-
temperature adsorption of (NO+O2+C3H6) mixture on the Au/20WZ-I catalyst in the 25 –
2500C temperature range. The experimental conditions are the same as those for the Au
sample containing 12 wt % of WO3. The gas phase spectra and the band envelope in the 1800
– 1000 cm-1
range at different temperatures (Fig. 21) are similar to those observed for the
Au/12WZ-I sample. The assignment of the absorption bands is shown in Table 6. The
following differences should be noted:
1. The spectra in the (OH) stretching region are practically unperturbed, which indicates
that complete oxidation of propene does not take place. This conclusion is supported
by the fact that CO2 is detected in the gas phase at 2000C and higher temperatures
when the interaction between the surface nitrates, respectively activated NO2, and the
Au NCO species takes place.
2. The amount of isopropoxide species (observed at 1138 and 1090 cm-1
) formed at room
temperature is significantly larger on the sample containing 20 wt % WO3 than on the
Au/12WZ-I catalyst. In addition, the spectrum taken at room temperature (Fig. 21A,
spectrum (a)) shows the presence of nitroacetone. These observations are in agreement
with the conclusion made above that the high WO3 content facilitates the partial
oxidation of propene.
3. The surface nitrates of the Au/20WZ-I catalyst disappear at 2000C whereas in the case
of the Au/12WZ-I sample they vanish at 3000C.

48
4000 3600 3200 2800 2400 2000 1600 1200
Ab
so
rba
nce
Wavenumber (cm-1)
0.5
x3
x3
2990 2875
2182
1730
1680
1654
1255
1278
1138
1090
1470
1380
1535 1440
1350
3760
3670 1
577
2938 1605
2150
(A)
3006
2400 2200 2000 1800 1600 1400
Ab
so
rba
nce
Wavenumber (cm-1)
CO2
N2O
NO2
0.0
25 (B)
Fig. 20. Panel A: FT-IR spectra collected during the exposure of the Au/12WZ-I catalyst to a (10 Torr
NO +3 Torr C3H6+25 Torr O2) mixture at room temperature for 15 min followed by evacuation for 20
min (a) and heating the isolated IR cell for 15 min at 1000C (b), 150
0C (c), 200
0C (d), 250
0C (e) and
300oC (f),. Panel B: gas phase spectra at 100
0C (b), 150
0C (c), 200
0C (d), 250
0C (e) and 300
oC (f).
b
a
c
d
e
f
b
c
d
e
f

49
4000 3600 3200 2800 2400 2000 1600 1200
Ab
so
rba
nce
Wavenumber (cm-1)
0.5
x3
x3
1725
1658
1574
1610
1276
1255
1138 1090
1680
1542
1605
1460
1354
1422
1385
21823003
2930
(A)
2150
2400 2200 2000 1800 1600 1400
Ab
so
rba
nce
Wavenumber (cm-1)
CO2
N2O
NO2
0.0
2
(B)
Fig. 21. Panel A: FT-IR spectra collected during the exposure of the Au/20WZ-I catalyst to a (10 Torr
NO +3 Torr C3H6+25 Torr O2) mixture at room temperature for 15 min followed by evacuation for 20
min (a) and heating the isolated IR cell for 15 min at 1000C (b), 150
0C (c), 200
0C (d), 250
0C (e),
300oC (f). Panel B: gas phase spectra at 100
0C (b), 150
0C (c), 200
0C (d), 250
0C (e), 300
oC (f).
b
c
d
e
f
b
a
c
d
e
f

50
Table 6. Assignment of the absorption bands observed during the investigation of the
reactivity of surface species formed upon room-temperature adsorption of NO+C3H6+O2
mixture on the Au/12WZ-I and Au/20WZ-I samples in the 25 – 2500C temperature range.
Species Band position, cm 1 Vibration
C3H6 (ads) 3006-3003, 2990
2938-2930, 2875
(CH), s(CH2)
as(CH3), s(CH3)
Au0 NCO (two types) 2182, 2150 as(NCO)
Isopropoxide
(two types)
2938-2930, 2875
1138, 1090
as(CH3), s(CH3)
(C O)
Acetone (ads) 2938-2930, 2875
1680
as(CH3), s(CH3)
C
Nitroacetone (ads) 2938-2930, 2875
1730-1725
as(CH3), s(CH3)
C
Bridged NO3
Bidentate NO3
(two types)
1658-1654, 1255
1610-1605, 1574
1278-1276
(N=O), as(NO2)
(N=O)
as(NO2)
CH3COO
(two types)
1470-1460, 1440-1422
1385-1380, 1354-1350
s(COO)
(CH3)
These differences suggest that the best candidate for catalyst for the C3H6-SCR of NOx
could be the Au/20WZ-I sample. However, the catalyst efficiency for NOx reduction should
depend on the productivity of NCO species. The amount of NCO species produced on gold
catalysts based on tungstated zirconia could be influenced at least by two factors: the gold
dispersion and the ability of the catalyst to generate nitroacetone. Fig. 22 compares the
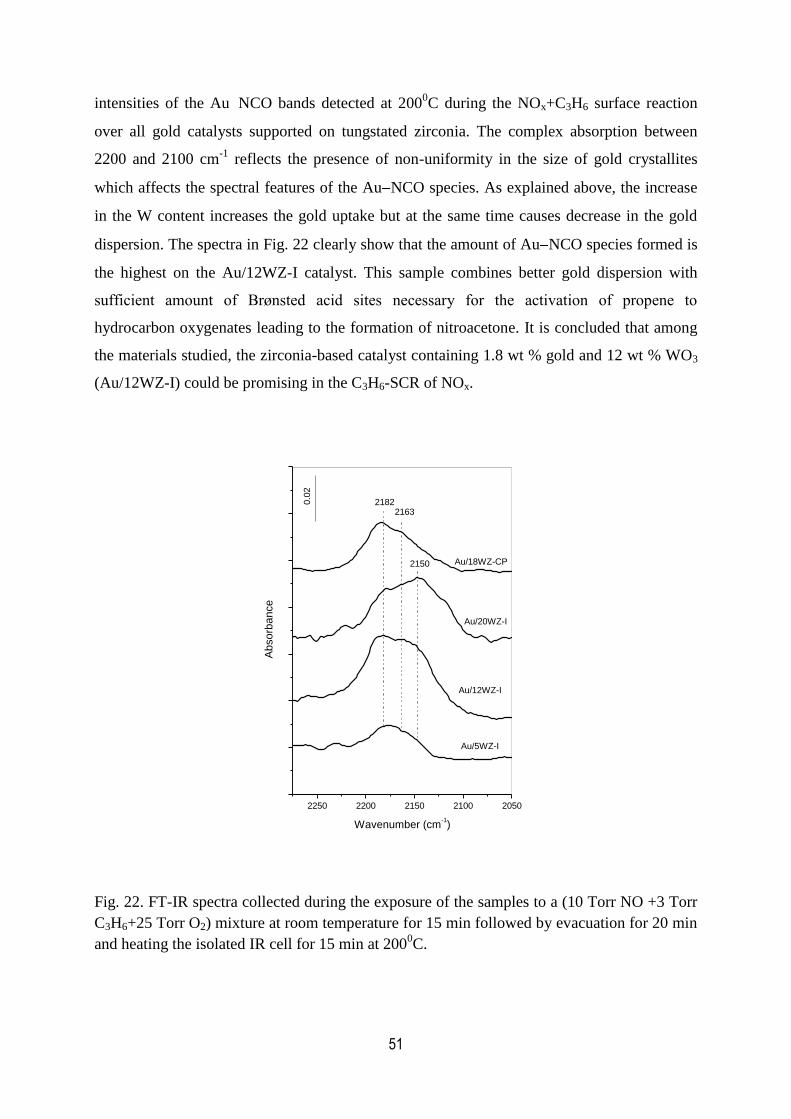
51
intensities of the Au NCO bands detected at 2000C during the NOx+C3H6 surface reaction
over all gold catalysts supported on tungstated zirconia. The complex absorption between
2200 and 2100 cm-1
reflects the presence of non-uniformity in the size of gold crystallites
which affects the spectral features of the Au NCO species. As explained above, the increase
in the W content increases the gold uptake but at the same time causes decrease in the gold
dispersion. The spectra in Fig. 22 clearly show that the amount of Au NCO species formed is
the highest on the Au/12WZ-I catalyst. This sample combines better gold dispersion with
sufficient amount of Brønsted acid sites necessary for the activation of propene to
hydrocarbon oxygenates leading to the formation of nitroacetone. It is concluded that among
the materials studied, the zirconia-based catalyst containing 1.8 wt % gold and 12 wt % WO3
(Au/12WZ-I) could be promising in the C3H6-SCR of NOx.
2250 2200 2150 2100 2050
Au/18WZ-CP
Au/20WZ-I
Ab
so
rba
nce
Wavenumber (cm-1)
Au/5WZ-I
Au/12WZ-I
0.0
2
21822163
2150
Fig. 22. FT-IR spectra collected during the exposure of the samples to a (10 Torr NO +3 Torr
C3H6+25 Torr O2) mixture at room temperature for 15 min followed by evacuation for 20 min
and heating the isolated IR cell for 15 min at 2000C.

52
Fig. 23 shows the development of the FT-IR spectra of the Au/12WZ-I and 12WZ-I
samples in the 2300 – 1000 cm1 region obtained in the presence of a gaseous mixture of 10
Torr NO + 3 Torr C3H6 + 25 Torr O2 upon heating for 10 min at various temperatures. For
both samples the predominant species observed at 1000C are the bridged nitrates at 1651 and
1275 cm1, and bidentate nitrates at 1605, 1577-1573 and 1236 cm
1. The signals at 1138 and
1090 cm1 reveal the presence of isopropoxide species, whereas the band at 1735 – 1730 cm
1
belongs to adsorbed nitroacetone. The weak absorptions between 1500 and 1300 cm1
correspond to different vibrational modes of the oxygenated derivatives of propene. At 1500C
the amount of adsorbed nitroacetone increases significantly which is accompanied by
lowering of the concentration the surface nitrates and isopropoxides. The absorption at 1680
cm1 clearly shows the formation of acetone as well. In the case of the Au-containing sample
(Fig. 23A) weak unresolved absorption is detected at 2202 and 2175 cm1. The latter
component corresponds to the as(NCO) mode of NCO species coordinated to the gold
particles [126,142,143]. The position of the Au NCO band at lower wavenumber (2175 cm1)
as compared with that in Fig. 20 (2182 cm1) can be associated with the increased
concentration of the NCO species produced in the presence of C3H6+NO+O2 gas mixture. The
maximum at 2202 cm1 (Fig. 22A) is attributed to NCO species adsorbed on the support.
Most likely the corresponding isocyanates are attached to coordinatively unsaturated Zr4+
ions. This assignment is supported by the fact that the as(NCO) stretching vibration of the
complex ion [Zr(NCO)6]2
is found at 2205 cm1 [165].
The concentration of the NCO species on the surface of the Au/12WZ-I sample
reaches maximum at 2500C. This is accompanied by disappearance of the adsorbed
nitroacetone (1730 cm1) and acetone (1680 cm
1) and increase in the amount of the surface
acetates with bands at 1555, 1534, 1450, 1425, 1380 and 1345 cm1 (Fig. 23A). The NCO
species disappear at 3500C. This indicates that the isocyanates react with the NO3
− species or
activated NO2 leading to disappearance of the surface nitrates.
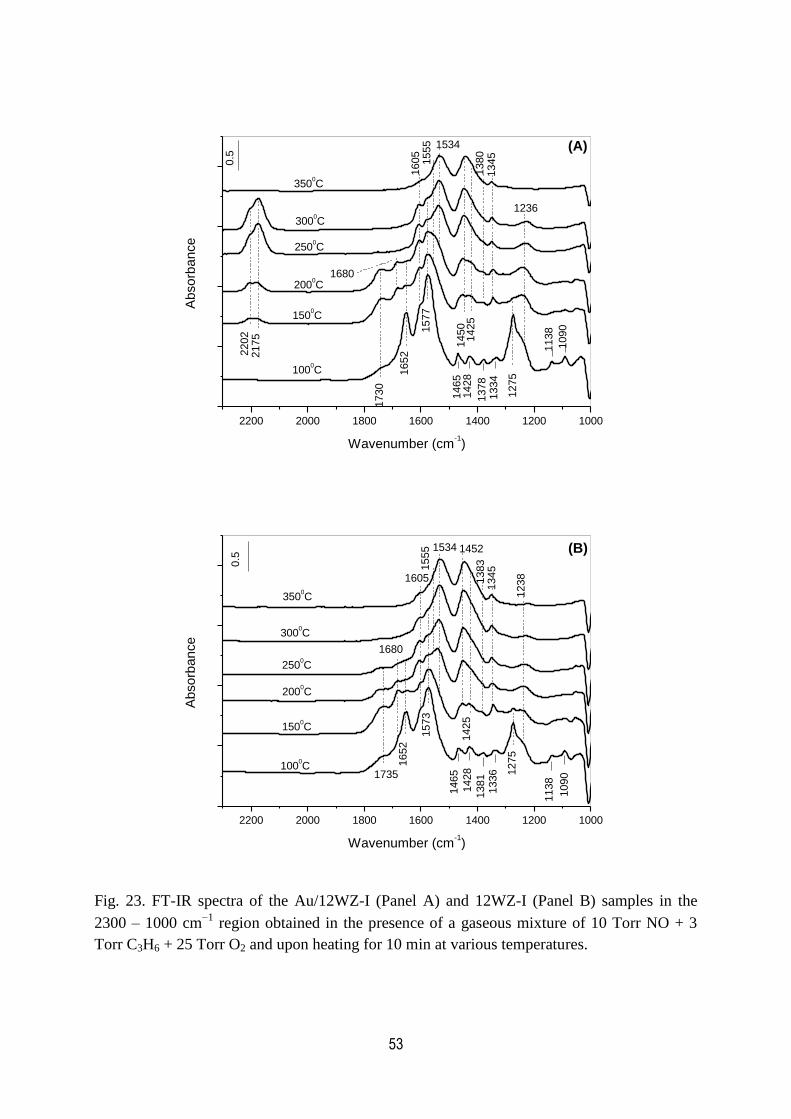
53
2200 2000 1800 1600 1400 1200 1000
3500C
3000C
2500C
2000C
1500C
Ab
so
rba
nce
Wavenumber (cm-1)
1000C
2202
2175
1730
1652
1680
1605
1577
1534
1450
1425
1345
1275
1236
1138
1090
0.5
1380
1465
1428
1378
1334
1555 (A)
2200 2000 1800 1600 1400 1200 1000
3500C
3000C
2500C
2000C
1500C
Ab
so
rba
nce
Wavenumber (cm-1)
1735
1680
1652
1573
1605
1534 1452
1425
1383
1345
1275
1238
1138
1090
1465
1428
1381
1336
0.5
1000C
1555 (B)
Fig. 23. FT-IR spectra of the Au/12WZ-I (Panel A) and 12WZ-I (Panel B) samples in the
2300 – 1000 cm1 region obtained in the presence of a gaseous mixture of 10 Torr NO + 3
Torr C3H6 + 25 Torr O2 and upon heating for 10 min at various temperatures.

54
In contrast to the Au/12WZ-I sample, at 2500C nitroacetone and acetone are present on
the surface of the support 12WZ-I (Fig. 23B). They disappear at 3000C as a result of their
further oxidation to acetates (bands at 1555, 1534, 1452, 1425, 1383 and 1345 cm1).
Formation of NCO species is not detected in the 100 – 3500C temperature range and surface
nitrates at 1605 and 1238 cm1 are observed at 350
0C. This experimental fact suggests that the
Au particles play fundamental role in the formation of the NCO species as proposed by
reaction (1) and once formed on the metal particles they migrate on the support. In the case of
the support (12WZ-I sample), the surface nitrates, respectively activated NO2, are involved
only in the formation of nitroacetone and acetone. The nitroketone undergoes thermal
transformation to acetates and NOx species at 2000C and above, while the acetone is oxidized
to acetates. This allows to conclude that the 12WZ-I sample does not catalyze the SCR of
NOx with propene.
3.5.3.4. Adsorption of acetone and its interaction with NO2 over the Au/12WZ-I catalyst
The experimental results show that nitroacetone appears to be the key intermediate
being the precursor of the NCO species. In order to confirm the assignment of the absorption
band at 1730- 1735 cm1 to adsorbed nitroacetone, we studied the adsorption of acetone and
its interaction with NO2 at various temperatures.
The adsorption of 12.8 Torr of acetone on the Au/12WZ-I sample at room temperature
followed by evacuation for 10 min, produced the spectrum (a) in Fig. 24. The band at 1690
cm1 is characteristic of the (C=O) stretching vibration of acetone coordinated to a Lewis
acid site [29,30,156-158]. The intensities of the bands at 1420, 1368, 1242 and 1170 cm1
decrease with the temperature simultaneously with the absorption at 1690 cm1. Based on this
behavior, all these bands are attributed to various vibrational modes of adsorbed acetone (see
Table 7). The bands at 1598 and 1443 cm1 correspond to the as(COO) and s(COO) modes
of acetate species, respectively. This experimental fact indicates that the Au/12WZ-I catalyst
is able to oxidize the adsorbed acetone already at room temperature. Heating the isolated IR
cell between 100 and 2500C for 10 min at each temperature (Fig. 24, spectra (b) to (e)) leads
to increase in the amount of the acetates (absorption bands at 1598, 1540, 1443, 1420, 1387
and 1315 cm-1
) at the expense of adsorbed acetone. The acetone disappears completely at
3500C (spectrum (g)). The latter heat treatment does not lead to complete removal of the
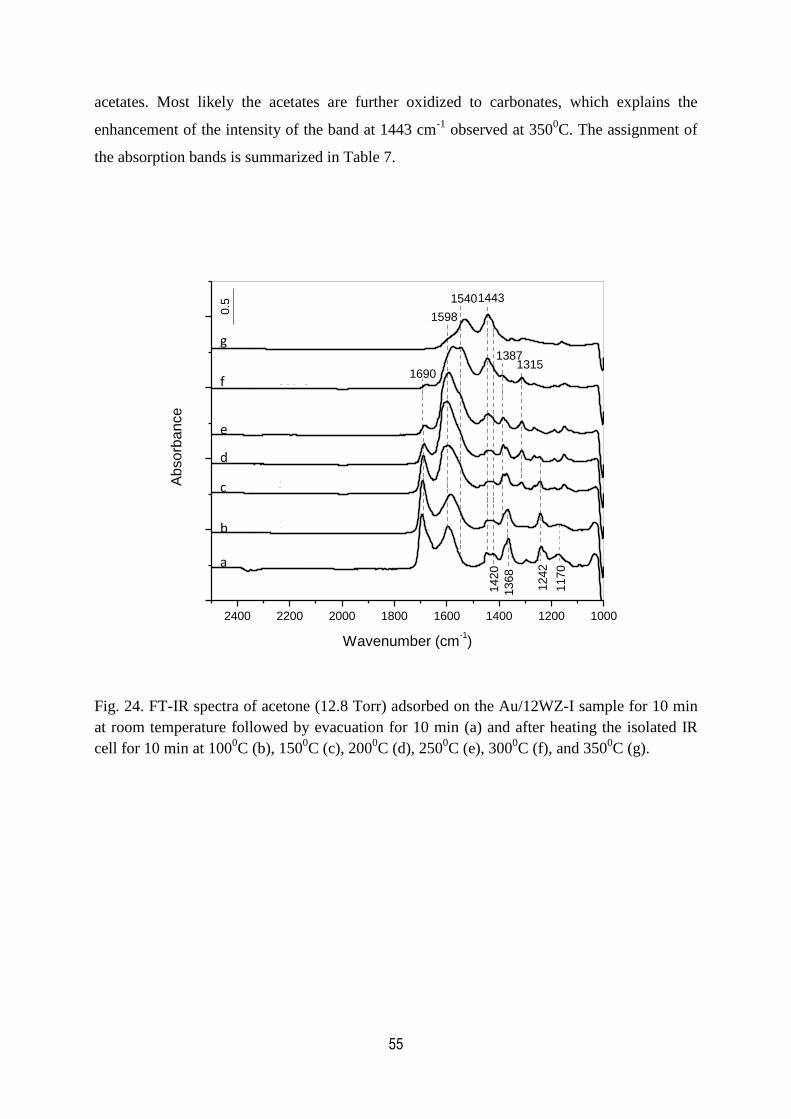
55
acetates. Most likely the acetates are further oxidized to carbonates, which explains the
enhancement of the intensity of the band at 1443 cm-1
observed at 3500C. The assignment of
the absorption bands is summarized in Table 7.
2400 2200 2000 1800 1600 1400 1200 1000
3500C
3000C
2500C
2000C
1500CA
bso
rba
nce
Wavenumber (cm-1)
1690
1242
1170
1368
1420
14431540
1598
13151387
RT
1000C
0.5
Fig. 24. FT-IR spectra of acetone (12.8 Torr) adsorbed on the Au/12WZ-I sample for 10 min
at room temperature followed by evacuation for 10 min (a) and after heating the isolated IR
cell for 10 min at 1000C (b), 150
0C (c), 200
0C (d), 250
0C (e), 300
0C (f), and 350
0C (g).
b
a
c
d
e
f
g
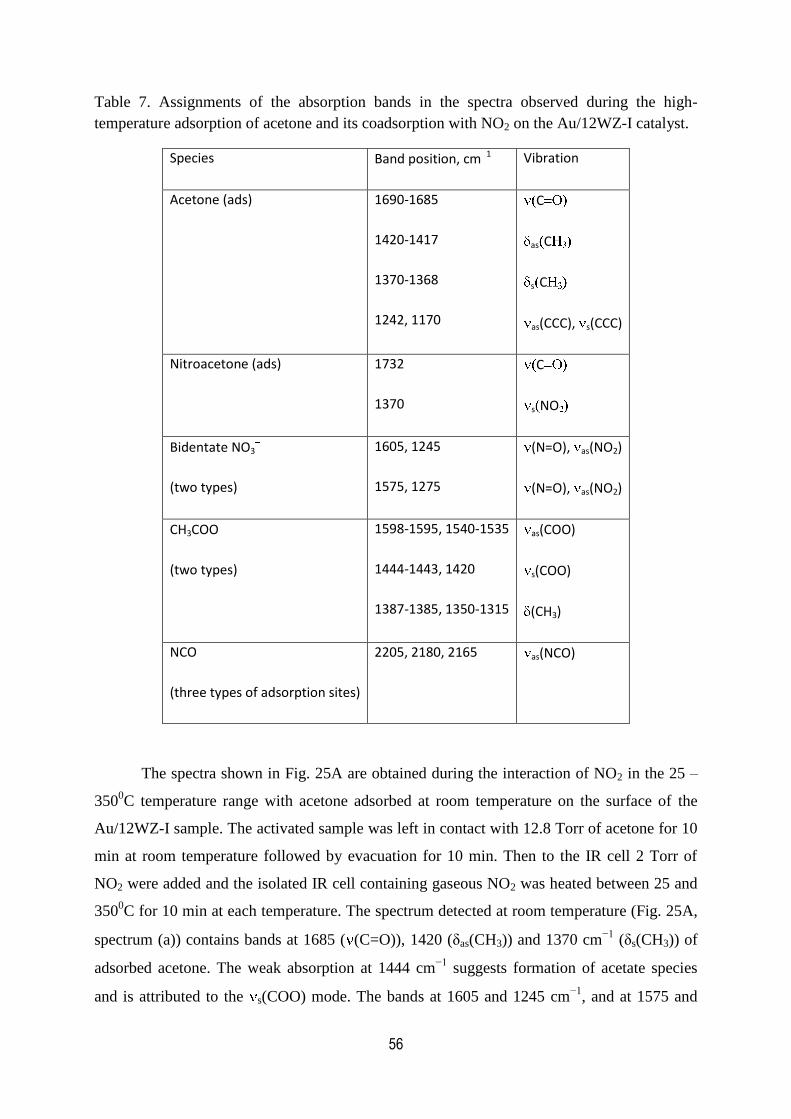
56
Table 7. Assignments of the absorption bands in the spectra observed during the high-
temperature adsorption of acetone and its coadsorption with NO2 on the Au/12WZ-I catalyst.
Species Band position, cm 1 Vibration
Acetone (ads) 1690-1685
1420-1417
1370-1368
1242, 1170
C
as C
s C
as(CCC), s(CCC)
Nitroacetone (ads) 1732
1370
C
s NO
Bidentate NO3
(two types)
1605, 1245
1575, 1275
(N=O), as(NO2)
(N=O), as(NO2)
CH3COO
(two types)
1598-1595, 1540-1535
1444-1443, 1420
1387-1385, 1350-1315
as(COO)
s(COO)
(CH3)
NCO
(three types of adsorption sites)
2205, 2180, 2165 as(NCO)
The spectra shown in Fig. 25A are obtained during the interaction of NO2 in the 25 –
3500C temperature range with acetone adsorbed at room temperature on the surface of the
Au/12WZ-I sample. The activated sample was left in contact with 12.8 Torr of acetone for 10
min at room temperature followed by evacuation for 10 min. Then to the IR cell 2 Torr of
NO2 were added and the isolated IR cell containing gaseous NO2 was heated between 25 and
3500C for 10 min at each temperature. The spectrum detected at room temperature (Fig. 25A,
spectrum (a)) contains bands at 1685 ( (C=O)), 1420 (δas(CH3)) and 1370 cm−1
(δs(CH3)) of
adsorbed acetone. The weak absorption at 1444 cm−1
suggests formation of acetate species
and is attributed to the s(COO) mode. The bands at 1605 and 1245 cm−1
, and at 1575 and
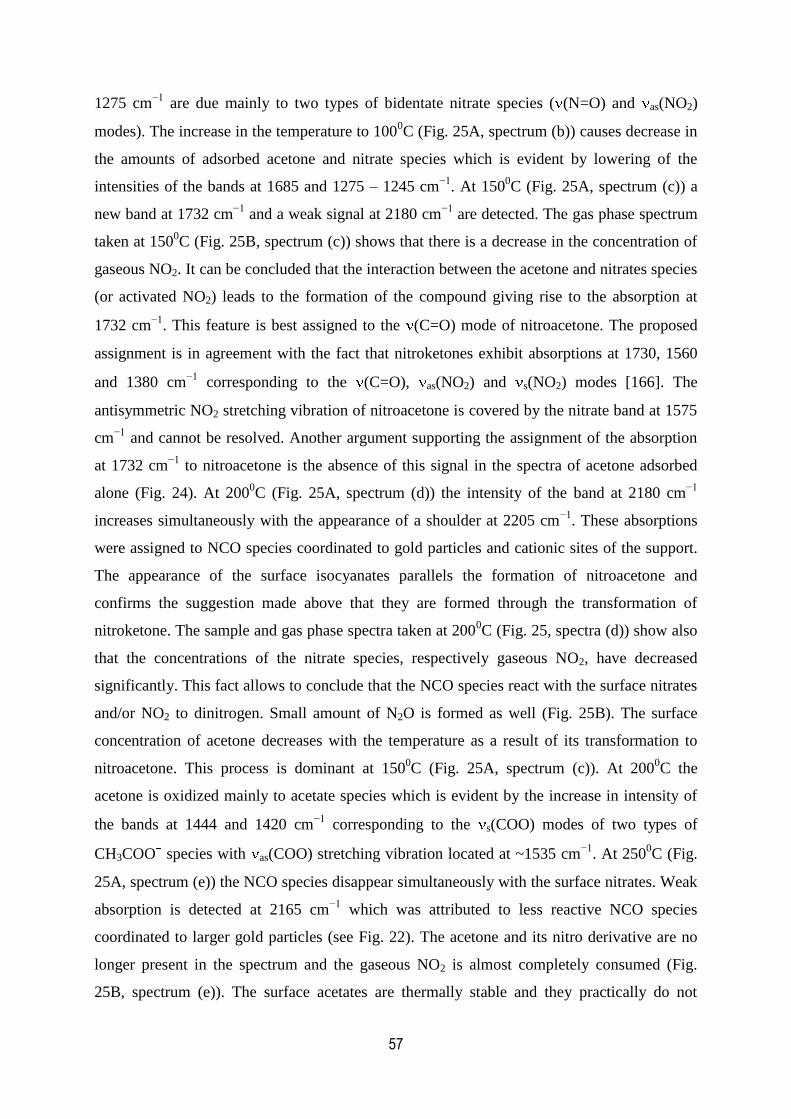
57
1275 cm−1
are due mainly to two types of bidentate nitrate species ( (N=O) and as(NO2)
modes). The increase in the temperature to 1000C (Fig. 25A, spectrum (b)) causes decrease in
the amounts of adsorbed acetone and nitrate species which is evident by lowering of the
intensities of the bands at 1685 and 1275 – 1245 cm−1
. At 1500C (Fig. 25A, spectrum (c)) a
new band at 1732 cm−1
and a weak signal at 2180 cm−1
are detected. The gas phase spectrum
taken at 1500C (Fig. 25B, spectrum (c)) shows that there is a decrease in the concentration of
gaseous NO2. It can be concluded that the interaction between the acetone and nitrates species
(or activated NO2) leads to the formation of the compound giving rise to the absorption at
1732 cm−1
. This feature is best assigned to the (C=O) mode of nitroacetone. The proposed
assignment is in agreement with the fact that nitroketones exhibit absorptions at 1730, 1560
and 1380 cm−1
corresponding to the (C=O), as(NO2) and s(NO2) modes [166]. The
antisymmetric NO2 stretching vibration of nitroacetone is covered by the nitrate band at 1575
cm−1
and cannot be resolved. Another argument supporting the assignment of the absorption
at 1732 cm−1
to nitroacetone is the absence of this signal in the spectra of acetone adsorbed
alone (Fig. 24). At 2000C (Fig. 25A, spectrum (d)) the intensity of the band at 2180 cm
−1
increases simultaneously with the appearance of a shoulder at 2205 cm−1
. These absorptions
were assigned to NCO species coordinated to gold particles and cationic sites of the support.
The appearance of the surface isocyanates parallels the formation of nitroacetone and
confirms the suggestion made above that they are formed through the transformation of
nitroketone. The sample and gas phase spectra taken at 2000C (Fig. 25, spectra (d)) show also
that the concentrations of the nitrate species, respectively gaseous NO2, have decreased
significantly. This fact allows to conclude that the NCO species react with the surface nitrates
and/or NO2 to dinitrogen. Small amount of N2O is formed as well (Fig. 25B). The surface
concentration of acetone decreases with the temperature as a result of its transformation to
nitroacetone. This process is dominant at 1500C (Fig. 25A, spectrum (c)). At 200
0C the
acetone is oxidized mainly to acetate species which is evident by the increase in intensity of
the bands at 1444 and 1420 cm−1
corresponding to the s(COO) modes of two types of
CH3COO species with as(COO) stretching vibration located at ~1535 cm−1
. At 2500C (Fig.
25A, spectrum (e)) the NCO species disappear simultaneously with the surface nitrates. Weak
absorption is detected at 2165 cm−1
which was attributed to less reactive NCO species
coordinated to larger gold particles (see Fig. 22). The acetone and its nitro derivative are no
longer present in the spectrum and the gaseous NO2 is almost completely consumed (Fig.
25B, spectrum (e)). The surface acetates are thermally stable and they practically do not

58
undergo decomposition at 300 and 3500C. This is the reason for the absence of CO2 in the gas
phase. Table 7 shows the assignment of the absorptions bands in the spectra detected during
the adsorption of acetone and its coadsorption with NO2 on the Au/12WZ-I sample.
2400 2200 2000 1800 1600 1400 1200 1000
x2
x2
x2
g
f
e
d
c
Abso
rba
nce
Wavenumber (cm-1)
a
b
0.5
2180
1732
1595
1685
1535
1605
1575
1444
13851420
1350
1245
1275
1370
2205
2165x2
(A)
2400 2200 2000 1800 1600 1400
(B)
g
f
e
d
Ab
sorb
an
ce
Wavenumber (cm-1)
a
b
c
N2O NO
2
0.0
5
Fig. 25. FT-IR spectra of adsorbed acetone (12.8 Torr) on the Au/12WZ-I catalyst for 10 min at room
temperature followed by evacuation for 10 min and addition of 2 Torr NO2 (a) and after heating the
isolated IR cell for 10 min at 1000C (b), 150
0C (c), 200
0C (d), 250
0C (e), 300
0C (f), and 350
0C (g).
Panel A is sample and panel B is gas phase.
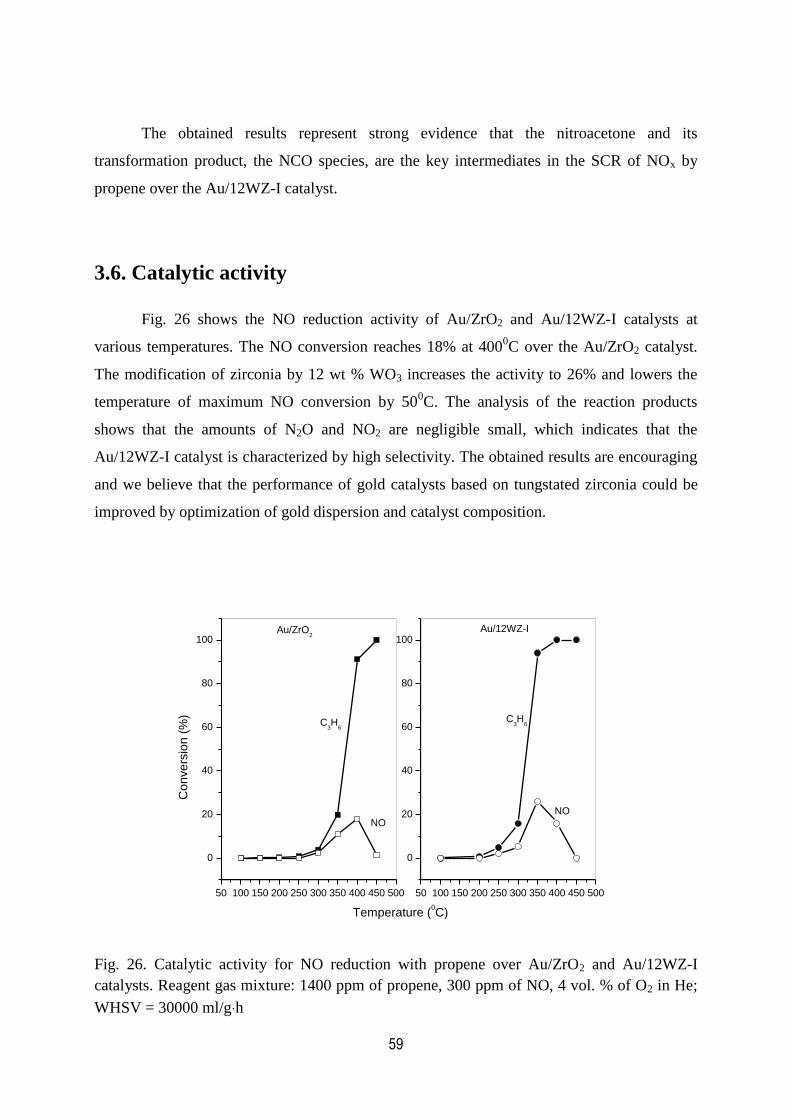
59
The obtained results represent strong evidence that the nitroacetone and its
transformation product, the NCO species, are the key intermediates in the SCR of NOx by
propene over the Au/12WZ-I catalyst.
3.6. Catalytic activity
Fig. 26 shows the NO reduction activity of Au/ZrO2 and Au/12WZ-I catalysts at
various temperatures. The NO conversion reaches 18% at 4000C over the Au/ZrO2 catalyst.
The modification of zirconia by 12 wt % WO3 increases the activity to 26% and lowers the
temperature of maximum NO conversion by 500C. The analysis of the reaction products
shows that the amounts of N2O and NO2 are negligible small, which indicates that the
Au/12WZ-I catalyst is characterized by high selectivity. The obtained results are encouraging
and we believe that the performance of gold catalysts based on tungstated zirconia could be
improved by optimization of gold dispersion and catalyst composition.
50 100 150 200 250 300 350 400 450 500
0
20
40
60
80
100
Co
nve
rsio
n (
%)
Temperature (0C)
NO
C3H
6
Au/ZrO2
50 100 150 200 250 300 350 400 450 500
0
20
40
60
80
100
C3H
6
NO
Au/12WZ-I
Fig. 26. Catalytic activity for NO reduction with propene over Au/ZrO2 and Au/12WZ-I
catalysts. Reagent gas mixture: 1400 ppm of propene, 300 ppm of NO, 4 vol. % of O2 in He;
WHSV = 30000 ml/g h

60
4. CONCLUSIONS
Gold catalysts supported on tungstated zirconia (containing 5 – 20 wt % WO3) can be
prepared by cationic adsorption from aqueous solution of [Au(en)2]Cl3 complex. According to
XRD and XPS data large (8 – 10 nm) and small (~ 3 nm) gold particles are present on the
catalyst surfaces.
The FT-IR spectra of adsorbed CO show the formation of two types of Au CO bands,
at 2128 – 2135 cm1 (high-frequency band) and 2113 – 2116 cm
1 (low-frequency band),
which are attributed to CO coordinated to large and small gold particles, respectively. It is
concluded that the gold particles occupy preferentially the WOx-free zirconia surface and the
dispersion of gold depends on the amount of coodinatively unsaturated (cus) Zr4+
ions.
Modification of zirconia by WO3 increases the gold uptake but at the same time causes
decrease in the concentration of (cus) Zr4+
ions. Consequently, the fraction of large gold
particles increases.
The interaction of Au/ZrO2 and Au/ZrO2-WOx samples with NO+O2 gas mixture
shows that the W-containing samples promote the formation of NO2 at room temperature. The
amount of the surface nitrates produced during the NO+O2 co-adsorption decreases with
increase in the W loading due to lowering of the basicity of the surface O2
ions. The major
product of decomposition of the adsorbed NO3 species is NO2.
Contrary to some reports in the literature, we have found that the treatment of gold
supported on tungstated zirconia with NO+O2 mixture at room temperature does not cause
oxidation of the gold particles. However, the subsequent adsorption of CO on NOx-
precovered Au/ZrO2-WOx catalyst leads to the formation of NCO species coordinated to gold
particles. The generation of NCO species at low temperature offers the possibility for
development of low-temperature catalyst for selective reduction of NOx with CO. The NCO
species are considered to be reactive intermediates in this reaction.
The analysis of FT-IR spectra recorded during the oxidation of propene over the
Au/ZrO2 catalyst indicates that this sample catalyzes the deeper oxidation of the hydrocarbon.
In the case of WOx-containing gold catalysts, the amount of partially oxidized hydrocarbons
produced during the C3H6 + O2 reaction increases with increase in the tungsten content. This

61
result is in agreement with the fact that the presence of Brønsted acidity combined with redox
sites such as W=O groups facilitate the partial oxidation of propene.
The results of detailed mechanistic investigation show that the activation of propene in
the presence of NOx species adsorbed on Au/ZrO2-WOx samples takes place at room
temperature producing surface isopropoxides. The interaction of the latter species with the
surface nitrate complexes leads to the formation of nitroacetone. It is proposed that at higher
temperature (1500C) the nitroacetone transforms through an internal redox process producing
NCO species and surface acetates. The fact that no surface isocyanates are observed over Au-
free ZrO2-WOx samples leads to the conclusion that this process is catalyzed by the gold
nanoparticles. The NCO species react with the NO3 /NO2 surface complex formed by
oxidation of NO yielding molecular nitrogen, N2O and CO2 as reaction products.
The amount of NCO species produced on the gold catalysts supported on tungstated
zirconia depends on the gold dispersion and it is the highest in the case of a catalyst
containing 1,8 wt % Au and 12 wt % WO3. The modification of zirconia by 12 wt % of WO3
increases the activity of the gold catalyst in the reaction of selective NO reduction with
propene and lowers the temperature of maximum NO conversion by 500C. The analysis of the
reaction products shows that the amounts of N2O and NO2 are negligibly small, which
indicates that the catalyst is characterized by high selectivity.
The obtained results are encouraging and confirm the hypothesis that gold supported
on tungstated zirconia can act as a bifunctional catalyst in the selective reduction of NO by
propene. The WOx species facilitate the process of NO oxidation and ensure significant
amount of oxygenated derivatives of the hydrocarbon (nitroacetone), whereas the gold
particles play fundamental role in the conversion of nitroketone to NCO species, the reactive
intermediates of the reaction.

62
5. REFERENCES
1. www.ipcc.ch
2. www.epa.gov
3. ec.europa.eu
4. M.D. Amiridis, T. Zhang, R.J. Farrauto, Appl. Catal. B, 10, (1996), 2
5. F. Klinstedt, K. Arve, K. Eranen, D. Yu. Murzin, Acc. Chem. Res, 39 (2006) 273.
6. R.M. Heck, R.J. Farrauto, Appl. Catal. A, 221 (2001) 443.
7. J. Kaspar, P. Fornasiero, N. Hickey, Catal. Today, 77 (2003) 419.
8. R. Burch, Catal. Rev. 46 (2004) 271.
9. J. M. Trichard, Stud. Surf. Sci. Catal., 171 (2007) 211.
10. L. J. Gill, Ph. G. Blakeman, M.V. Twigg, A. P. Walker. Topics Catal., 28 (2004) 157.
11. J. A. Sullivan, J. A. Doherty, Appl. Catal. B, 55 (2005) 185.
12. P. Forzatti, Appl. Catal. A, 222 (2001) 221.
13. M. Koebel, G. Madia, M. Elsener, Catal. Today, 73 (2002) 239.
14. W. Held, A. Koenig, T. Richter, L. Puppe, SAE paper, 1990, 900496, 13.
15. M. Iwamoto, H. Yahiro, S. Shundo, Y. Yu-u, N. Mizuno, Shokubai, 32 (1990) 430.
16. M. C. Kung, H. H. Kung, Top. Catal. 28 (2004) 105.
17. R. Burch, J. P. Breen, F.C. Meunier, Appl. Catal. B, 39 (2002) 283.
18. I. Cayirtepe, A. Naydenov, G. Ivanov, M. Kantcheva, Catal Lett., 438-449 (2009) 132.
19. R. Burch, J. P. Breen, C.J. Hill, B. Krutzsch, B. Konrad, E. Jobson, L. Cider, K.
Eranen, F. Klingstedt, L.-E. Lindfors, Top. Catal., 30-31 (2004) 19.
20. A. Ueda, M. Haruta, Gold Bulletin 32 (1999) 3.
21. A. Ueda, T. Oshima, M. Haruta, Appl. Catal. B 12 (1997) 81.
22. A. Ueda, M. Haruta, Appl. Catal B 18 (1998) 115.
23. L. Q. Nguyen, C. Salim, H. Hinode, Top. Catal. 52 (2009) 779.

63
24. M. Misono, Y. Hirao, Ch. Yokoyama, Catal. Today 38 (1997) 157.
25. Ch. Yokoyama, M. Misono, Catal. Lett. 29 (1994) 1.
26. N. Le To Nga, Cl. Potvin, G. Djega-Mariadassou, L. Delannoy, C. Louis, Top. Catal.
42-43 (2007) 91.
27. B. Grzybowska-Swierkosz, Catal. Today 112 (2006) 3.
28. G. Busca, Phys. Chem. Chem. Phys. 1 (1999) 723.
29. V. Sanches Escibano, G. Busca, V. Lorenzelli, J. Phys. Chem. 94 (1990) 8939.
30. E. Finocchio, G. Busca, V. Lorenzelli, V. Sanches Escibano, J. Chem. Soc. Faraday
Trans. 92 (1996) 1587.
31. M. Kantcheva, I. Cayirtepe, J.Mol. Catal. A, 247 (2006) 88.
32. G. R Bamwenda, A. Obuchi, A. Ogata, J. Oi, S. Kushiyama, K. Mizuno, J. Mol. Catal.
A 126 (1997) 151.
33. R. Burch, P. J. Millington, A. P. Walker, Appl. Catal. B, 4 (1994) 65.
34. T. Chafik, S. Kameoka, Y. Ukisu and T. Miyadera, J. Mol. Catal. A 136 (1998) 203.
35. T. Tanaka, T. Okuhara and M. Misono, Appl. Catal. B, 4 (1994) L1.
36. T. Okuhara, Y. Hasada and M. Misono, Catal. Today, 35 (1997) 83.
37. K. A. Bethke, C. Li, M.C. Kung, B. Yang and H.H. Kung, Catal. Lett. 31 (1995) 287.
38. Y. Ukisu, S. Sato, A. Abe and K. Yoshida, Appl. Catal. B 2 (1993) 147.
39. B. Djonev, B. Tsyntsarski, D. Klissurski and K. Hadjiivanov, J. Chem. Soc., Faraday
Trans. 93 (1997) 4055.
40. M. Yamaguchi, J. Chem. Soc., Faraday Trans. 93 (1997) 3581.
41. A.D. Cowan, N.W. Cant, B.S. Haynes and P.F. Nelson, J. Catal. 176 (1998) 329.
42. S. Kameoka, T. Chafik, Y. Ukisu and T. Miyadera, Catal. Lett. 51 (1998) 11.
43. M. Haneda, Y. Kintaichi, M. Inaba and H. Hamada, Catal. Today 42 (1998) 127.

64
44. F.C. Meunier, J.P. Breen, V. Zuzaniuk, M. Olsson and J.R.H. Ross, J. Catal. 187
(1999) 493.
45. V. Zuzaniuk, F.C. Meunier and J.R.H. Ross, J. Catal. 202 (2001) 340.
46. M. Haneda, E. Joubert, J.-C. Menezo, D. Duprez, J. Barbier, N. Bion, M. Daturi, J.
Saussey, J.-C. Lavalley and H. Hamada, J. Mol. Catal. A 175 (2001) 179.
47. V. A. Sadykov, S.L. Baron, V.A. Matyshak, G.M. Alikina, R.V. Bunina, A.Y.
Rozovskii, V.V. Lunin, E.V. Lunina, A.N. Kharlanov, A.S. Ivanova, S.A.
Veniaminov, Catal. Lett. 37 (1996) 157.
48. V. A. Sadykov, V.V. Lunin, V.A. Matyshak, E. A. Paukshtis, A. Y. Rozovskii, N.N.
Bulgakov, J. R. H. Ross, Kinet. Katal., 44 (2003) 379.
49. V.A. Matyshak, V. F. Tret’yakov, K. A. Chernishev, T. N. Burdeinaya, V. N.
Korchak, V. A. Sadykov, Kinet. Katal., 47 (2006) 747.
50. O. Gorce, F. Baudin, C. Thomas, P. Da Costa, G. Djega-Mariadassou, Appl. Catal. B,
54 (2004) 69.
51. N. El Kolli, C. Potvin, C. Thomas, J. Catal., 259 (2008) 240.
52. M. Kantcheva, I. Cayirtepe, Catal. Lett., 115 (2007) 148.
53. M. Kantcheva, H. Budunoglu and O. Samarskaya, Catal. Commun., 9 (2008) 874.
54. G. R. Bamwenda, A. Obuchi, S. Kushiyama, K. Mozono, Stud. Surf. Sci. Catal 130
(2000) 1271.
55. K.-I. Shimizu, H. Kawabata, A. Satsuma and T. Hattori, J. Phys. Chem. B 103 (1999)
5240.
56. K.-I. Shimizu, J. Shibata, H. Yoshida, A. Satsuma and T. Hattori, Appl. Catal. B 30
(2001) 151.
57. J.-H. Lee, A. Yezerets, M.C. Kung and H.H. Kung, Chem. Commun. 15 (2001) 1404.
58. M. Kantcheva, J. Catal., 204 (2001) 479.
65
59. M. Kantcheva, Appl. Catal. B, 42 (2003).
60. H. Hamada, Y. Kintaichi, M. Sasaki and T. Ito, Appl. Catal. 75 (1991) L1.
61. H. Hamada, Y. Kintaichi, M. Sasaki, T. Ito and T. Yoshinari, Appl. Catal. A, 88
(1992) L1.
62. T. Miyadera, Appl. Catal. B 2 (1993) 199.
63. M. Tabata, H. Tsuchida, K. Miyamoto, T. Yoshinari, H. Yamazaki, H. Hamada, Y.
Kintaichi, M. Sasaki and T. Ito, Appl. Catal. B 6 (1995) 169.
64. Y. Ukisu and T. Miyadera, Catal. Lett. 39 (1996) 265.
65. R. Burch, E. Halpin and J.A. Sullivan, Appl. Catal. B 17 (1998) 115.
66. T.J. Toops, A.B. Walters and M.A. Vannice, Catal. Lett. 64 (2000) 65.
67. J.G. Santiesteban, J. V. Vartuli, S. Han, R. D. Bastian, C. D. Chang, J. Catal. 168
(1997) 431.
68. A. Martinez, G. Prieto, M. A. Arribas, P. Concepcion, J. F. Sanchez-Royo, J. Catal.
248 (2007) 288.
69. B. P. Block, J. C. Bailar, Jr., J. Am. Chem. Soc. 73 (1951) 4722.
70. R. A. Boyse, E. Ko, J. Catal. 171 (1997) 191.
71. M. Scheithauer, R. K. Grasselli, H. Knozinger, Langmuir 14 (1998) 3019.
72. D. G. Barton, M. Shtein, R. D. Wilson, S. T. Soled, E. Iglesia, J. Phys. Chem B 103
(1999) 630.
73. E. I. Ross-Medgaarden, W. V. Knowles, T. Kim, M. S. Wong, W. Zhou, C. J. Kiely, I.
E. Wachs, J. Catal. 256 (2008) 108.
74. M. Kantcheva, C. Koz, J. Mater. Sci. 42 (2007) 6074.
75. E. I. Ross-Medgaarden, I. E. Wachs, J. Phys. Chem. C 111 (2007) 15089.
76. F. Di Gregorio, V. Keller, J. Catal. 225 (204) 45.
77. V. Bolis, G. Cerrato, G. Magnaca, C. Morterra, Thermochim. Acta 312 (1998) 63.
66
78. K. T. Jung, A. T. Bell, J. Mol. Catal. A 163 (2000) 27.
79. J. Li, J. Chen, W. Song, J. Liu, W. Shen, Appl. Catal. A 334 (2008) 321.
80. C. E. Crouthamel, C. E. Johnson, Anal. Chem. 26 (1954) 1284.
81. D. F. Wood, R. T. Clark, Analyst 83 (1958) 326.
82. F. P. J. M. Kerkhof, J. A. Moulijn, J. Phys. Chem. 83 (1979) 1612.
83. V. Leon, Surf. Sci. 339 (1995) L931.
84. M. Haruta, Catal. Surv. Japan 1 (1997) 61.
85. M. Haruta, Gold Bulletin 37 (2004) 27.
86. G. C. Bond, D. T. Thompson, Catal. Rev.-Sci. Eng. 41 (1999) 319.
87. M. C. Kung, J.-H. Lee, Chu Kung, H.H. Kung, Stud. Surf. Sci. Catal. 101 (1996) 701.
88. M. C. Kung, K. A. Bethke, J. Yan, J.-H. Lee, H.H. Kung, Appl. Surf. Sci. 121/122
(1997) 261.
89. E. Seker, E. Gulari, Appl. Catal. A 232 (2002) 203.
90. G. Hutchings, Catal. Today 100 (2005) 55.
91. E. D. Park, J. S. Lee, J. Catal. 186 (1999) 1.
92. A. P. Kozlova, A. I. Kozlov, S. Sugiyama, Y. Matsui, K. Asakura, Y. Iwasawa, J.
Catal. 181 (1999) 37.
93. M. Kosmulski, J. Colloid Interface Sci. 253 (2002) 77.
94. S. Ivanova, C. Petit, V. Pitchin, Appl. Catal. A 267 (2004) 191.
95. P. Mukherjee, C. R. Patra, A. Ghosh, R. Kumar, M. Sastry, Chem. Mater. 14 (2002)
1678.
96. D. Guillemot, M. Polisset-Thfoin, J. Fraissard, Catal. Lett. 41 (1996) 143.
97. D. Guillemot, V. Yu. Borovkov, V. B. Kazansky, M. Polisset-Thfoin, J. Fraissard, J.
Chem. Soc. Faraday Trans. 93 (1997) 3587.

67
98. R. Zanella, A. Sandoval, P. Santiago, V. A. Basink, J. M. Saniger, J. Phys. Chem. B
110 (2006) 8559.
99. H. Zhu, C. Liang, W. Yan, S. H. Overbury, S. Dai, J. Phys. Chem. B 110 (2006)
10842.
100. H. Zhu, Zh. Ma, J. C. Clark, Zh. Pan, St. H. Overbury, Sh. Dai, Appl. Catal A 326
(2007) 89.
101. A. A. Isab, M. N. Shaikh, M. Monim-ul-Mehbood, B. A. Al-Maythalony, M. I. M.
Wazeer, S. Altuwaijri, Spectrochim. Acta A, 79 (2011) 1196.
102. B. A. Al- Maythalony, M. I. M. Wazeer, A. A. Isab, Inorg. Chim. Acta 362 (2009)
3109.
103. E. V. Makotchenko, Russ. J. Coord. Chem. 29 (2003) 778.
104. E. V. Makotchenko, V. I. Malkova, Russ. J. Coord. Chem. 31 (2005) 703.
105. M. A. Cortes-Jacome, C. Angeles-Chavez, E. Lopez-Salinas, J. Navarrete, P. Toribo,
J. A. Toledo, Appl. Catal. A 318 (2007) 178.
106. F. Boccuzzi, G. Cerrato, F. Pinna, G. Strukul, J. Phys. Chem B 102 (1998) 5733.
107. R. Kydd, J. Scott, W. Y. Teoh, K. Chiang, R. Amal, Langmiur 26 (2010) 2099.
108. S. Eustis, M. A. El-Sayed, Chem. Soc. Rev. 35 (2006) 209.
109. X. Zhang, H. Wang, Bo-Q. Xu, J. Phys. Chem B 109 (2005) 9678.
110. Y. Azizi, C. Petit, V. Pitchon, J. Catal. 269 (2010) 26.
111. S. Schimpf, M. Lucas, C. Mohr, U. Rodemerck, A. Bruckner, J. Radnik, H.
Hofmeister, P. Claus, Catal. Today 72 (2002) 63.
112. L. Ilieva, J. W. Sobczak, M. Manzoli, B. L. Su, D. Andreeva, Appl. Catal. A 291
(2005) 85.
113. R. Zanella, L. Dellanoy, C. Louis, Appl. Catal. A 291 (2005) 62.

68
114. R. Wojcieszak, M. J. Genet, P. Eloy, P. Ruiz, E. M. Gaigneaux, J. Phys. Chem. 114
(2010) 16677.
115. S. Velu, K. Suzuki, Chinnakonda S. Gopinath, H. Yoshidac, T. Hattori, Phys. Chem.
Chem. Phys. 4 (2002) 1990.
116. L.-C. Wang, Q. Liu, M. Chen, Y.-M. Liu, Y. Cao, He-Y. He, K.-N. Fan, J. Phys.
Chem. C 111 (2007) 16549.
117. R. Grabowski, J. Sloczynski, M. Sliwa, D. Mucha, R. P. Socha, ACS Catal. 1 (2011)
266.
118. J.C. Dupin, D. Gonbeau, P. Vinatier, A. Levasseur, Phys. Chem. Chem. Phys. 2
(2000) 1319.
119. J.-D. Grunwald, M. Macviejewski, O. S. Becker, P. F. Fabrizioli, A. Baiker, J. Catal.
186 (1999) 458.
120. M. Maciejewski, P. Fabrizioli, J.-D. Grunwald, O. S. Becker, A. Baiker, Phys. Chem.
Chem. Phys. 3 (2001) 3846.
121. M. Manzoli, A. Chiorino, F. Boccuzzi, Surf. Sci. 532-535 (2003) 377.
122. M. Kantcheva, E. Z. Ciftlikli, J. Phys. Chem. B 106 (2002) 3941.
123. C. Morterra, G. Cerrato, V. Bolis, C. Lamberti, L. Ferroni, L. Montanaro, J. Chem.
Soc. Faraday Trans. 91 (1995) 113.
124. F. Boccuzzi, A. Chiorino, J. Phys. Chem. B 104 (2000) 5414.
125. K. I. Hadjiivanov, G. N. Vayssilov, Adv. Catal. 47 (2002) 307.
126. M. Kantcheva, O. Samarskaya, L. Ilieva, G. Pantaleo, A. M. Venezia, D. Andreeva,
Appl. Catal. B 88 (2009) 113.
127. D. Andreeva, M. Kantcheva, I. Ivanov, L. Ilieva, J. W. Sobczak, W. Lisowski, Catal.
Today 158 (2010) 69.
128. F. Vindigni, M. Manzolli, A. Chiorino, F. Boccuzzi, Gold Bull. 42 (2009) 106.

69
129. M. A. Centeno, K. Hadjiivanov, T. Venkov, H. Klimev, J. A. Odriozola, J. Mol.
Catal. A: Chem. 252 (2006) 142.
130. M. Mihaylov, B. C. Gates, J. F. Fierro-Gonzales, K. Hadjiivanov, H. Knözinger, J.
Phys. Chem. C 111 (2007) 2548.
131. K. Musialska, E. Finocchio, I, Sobczak, G. Busca, R. Wojcieszak, E. Gaigneaux, M.
Ziolek, Appl. Catal. A 384 (2010) 70.
132. M. S. Chen, D. W. Goodman, Science 306 (2004) 252.
133. M.M. Kantcheva, V.P. Bushev, K.I. Hadjiivanov, J. Chem. Soc., Faraday Trans. 88
(1992) 3087.
134. K. Hadjiivanov, V. Bushev, M. Kantcheva, D. Klissurski, Langmuir 10 (1994) 464.
135. M. Kantcheva, A.S. Vakkasoglu, J. Catal. 223 (2004) 364.
136. B. Tsyntsarski, V. Avreyska, H. Kolev, T. Marinova, D. Klissurski, K. Hadjiivanov, J.
Mol. Catal. A: Chem. 193 (2003) 139.
137. T. Weingand, S. Kuba, K. Hadjiivanov and H. Knözinger, J. Catal. 209 (2002) 539.
138. Tz. Venkov, K. Fajerwerg, L. Delannoy, Hr. Klimev, K. Hadjiivanov, C. Louis, Appl.
Catal. A 301 (2006) 106.
139. S. Minico, S. Scire, C. Crisafulli, A. M. Visco, S. Galvagno, Catal. Lett. 47 (1997)
273.
140. M. Li, Z. Wu, Z. Ma, V. Schwartz, D. R. Mullins, S. Dai, S. H. Overbury, J. Catal.
266 (2009) 98.
141. M. A. Dekkers, M. J. Lippits, B. N. Nieuwenhuys, Catal. Lett. 56 (1998) 195.
142. F. Solymosi, T. Bansagi, T. Suli Zakar, Phys. Chem. Chem. Phys. 5 (2003) 4724.
143. F. Solymosi, T. Bansagi, T. Suli Zakar, Catal. Lett. 87 (2003) 7.
144. H. Celio, K. Mudalige, P. Mills, M. Trenary, Surf. Sci. 394 (1997) L168.
70
145. T. Nanba, K.-ichi Wada, S. Masukawa, J. Uchisawa, A. Obuchi, Appl. Catal. A 380
(2010) 66.
146. G. Piazzesi, O. Kröcher, M. Elsener, A. Wokaun, Appl. Catal. B 65 (2006) 55.
147. F. Solymosi and T. Bánsági, J. Phys. Chem. 83 (1979) 552.
148. C. Li, K. A. Bethke, H. H. Kung and M. C. Kung, J. Chem. Soc. – Chem. Commun.
(1995) 813.
149. S. Sumiya, H. He, A. Abe, N. Takezawa and K. Yoshida, J. Chem. Soc. Faraday
Trans. 94 (1998) 2217.
150. K. Shimizu, H. Kawabata, H. Maeshima, A. Satsuma and T. Hattori, J. Phys. Chem. B
104 (2000) 2885.
151. Y. Chi and S. S. C. Chuang, J. Catal. 190 (2000) 75.
152. Y. Jugnet, F. J. Cadete Santos Aires, C. Deranlot, L. Piccolo, J. C. Bertolini, Surf. Sci.
521 (2002) L639
153. G. Busca, G. Ramis, V. Lorenzelli, A. Janin and J. C. Lavalley, Spectrochim. Acta
43A (1987) 489.
154. B. Bachiller-Baeza, I. Rodriguez-Ramos, A. Guerrero-Ruiz, Langmuir 14 (1998)
3556.
155. K. Pokrovski, K. T. Jung, A. T. Bell, Langmuir 17 (2001) 4297.
156. E. Finocchio, R. J. Willey, G. Busca and V. Lorenzelli, J. Chem. Soc. Faraday Trans.
93 (1997) 175.
157. G. Busca, E. Finocchio, V. Lorenzelli, G. Ramis and M. Baldi, Catal. Today 49 (1999)
453.
158. M. A. Hasan, M. I. Zaki and L. Pasupulety, Appl. Catal. A 243 (2003) 81.
159. P. F. Rossi, G. Busca, V. Lorenzelli, O. Saur and J. C. Lavalley, Langmuir 3, (1987)
52.

71
160. Y. Toda, T. Ohno, F. Hatayama and H. Miyata, Phys. Chem. Chem. Phys. 1 (1999)
1615.
161. M. I. Zaki, M. A. Hasan and L. Pasupulety, Langmuir 17 (2001) 4025.
162. S. Alessandrini , I. Collamati and C. Ercolani J. Chem. Soc., Dalton Trans., 1973,
2409.
163. Y. Ukisu, S. Sato, G. Muramatsu and K. Yoshida, Catal. Lett. 16 (1992) 11.
164. A. Satsuma, A. D. Cowan, N. W. Cant and D. L. Trimm, J. Catal. 181 (1999) 165.
165. K. Nakomoto, Infrared and Raman Spectra of Inorganic and Coordination
Compounds Part B, 6th
ed. p. 127 New Jersey; Wiley (2009).
166. L. L Adams, F. A. Luzzio, J. Org. Chem. 54 (1989) 5387.

72
Some parts of this thesis are in press as:
1. M. Kantcheva, M. Milanova, I. Avramova, S. Mametsheripov, Spectroscopic characterization
of gold supported on tungstated zirconia, Catal. Today (2012),
doi:10.1016/j.cattod.2012.02.027
2. M. Kantcheva, M. Milanova, S. Mametsheripov, In situ FT-IR spectroscopic investigation of
gold supported on tungstated zirconia as catalyst for CO-SCR of NOx, Catal. Today (2012),
http://dx.doi.org/10.1016/j.cattod.2012.03.058