gold coast tourism industry report coast tourism industry report year ending june 2015. 1. ... 2...
TRANSCRIPT
Page 1 of 3
Gold Coast Tourism Industry ReportYEAR ENDING JUNE 2015
1. Executive Summary
2. Gold Coast Travel Trends
3. Gold Coast Competitiveness Analysis
4. Gold Coast Industry Indicators
5. Australian Travel Trends
6. Global Travel Trends
7. Tourism Insights: New Experiences for young Chinese travellers
8. Data Tables
9. Data sources and timeline of release
01030709131517
20
About this report: This Gold Coast Year Ending June 2015 Tourism Industry Report provides a consistent collation and analysis of macro and micro tourism statistics, research and trends.
The ongoing bi-annual series of Gold Coast Financial-Year and Full-Year Tourism Industry Reports are commissioned by the Gold Coast Tourism Corporation and the City of Gold Coast, and prepared independently by the Griffith Institute for Tourism.
These Reports are produced for, and provided to, the Gold Coast tourism industry and general public as a reliable source of tourism intelligence.
Disclaimer: Information is provided in good faith based on information sourced from government or reputable companies. By using this information you acknowledge that this information is provided by Griffith Institute for Tourism (GIFT), Gold Coast Tourism Corporation (GCT), and the City of Gold Coast (CoGC) to you without any responsibility on behalf of GIFT, GCT, CoGC. You agree to release and indemnify GIFT, GCT, CoGC for any loss or damage that you may suffer as a result of your reliance on this information. GIFT, GCT, CoGC does not represent or warrant that this information is correct, complete or suitable for the purpose for which you wish to use it. The information is provided to you on the basis that you will use your own skill and judgement, and make your own enquiries to independently evaluate, assess and verify the information’s correctness, completeness and usefulness to you before you rely on the information.
In January 2014, Tourism Research Australia (TRA) introduced mobile phone interviewing on the National Visitor Survey to supplement existing residential fixed line interviewing in order to provide better coverage of the Australian population. This has resulted in a break in series because the travel patterns of people interviewed on mobile phones differ from those of people interviewed on residential fixed lines. Consequently, readers of this report are advised that the domestic visitor results should be interpreted with caution. For further information please refer to: http://www.tra.gov.au/Fact-sheet-2014-Updates-to-the-IVS-NVS.html
Note: The International and National Visitor Surveys are conducted separately with their own methodologies; therefore care should be taken when considering their combined results.
Griffith University is a top ranking University based in South East Queensland, Australia. Griffith University hosts the Griffith Institute for Tourism, a world-leading institute for quality research into tourism. Through its activities and an external Advisory Board, the Institute links university-based researchers with the business sector and organisations, as well as local, state and federal government bodies. For more information, visit www.griffith.edu.au/griffith-institute-tourism.
Acknowledgements Dr Char-Lee McLennan, Griffith University
Ms Alexandra Bec, Griffith University
Ms Cassie Wardle, Griffith University
Professor Susanne Becken, Griffith University
Griffith Institute for Tourism Research Report No 07 October 2015
ISSN 2203-4862 (Print) ISSN 2203-4870 (Online) ISBN 978-1-922216-36-6
Griffith University, Queensland, Australia
© Griffith Institute for Tourism, Griffith University 2015
This information may be copied or reproduced electronically and distributed to others without restriction, provided the Griffith Institute for Tourism (GIFT) is acknowledged as the source of information. Under no circumstances may a charge be made for this information without the express permission of GIFT, Griffith University, Queensland, Australia.
32
1. Executive Summary
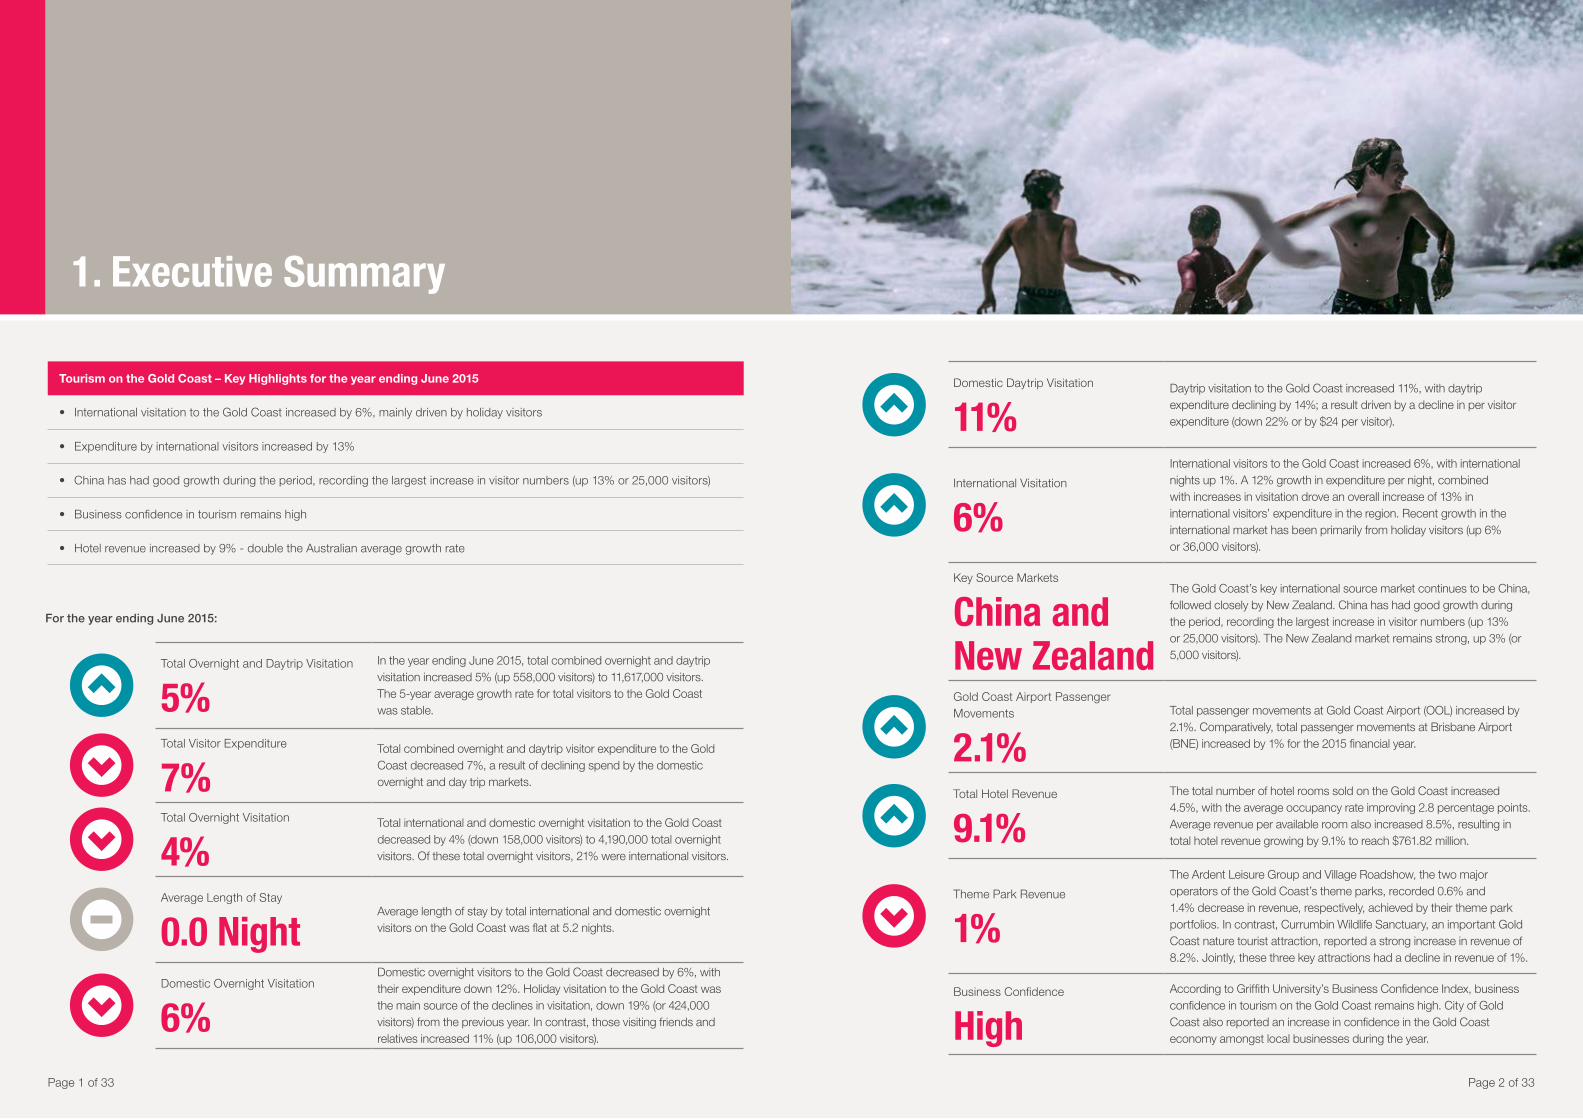
Tourism on the Gold Coast – Key Highlights for the year ending June 2015
• International visitation to the Gold Coast increased by 6%, mainly driven by holiday visitors
• Expenditure by international visitors increased by 13%
• China has had good growth during the period, recording the largest increase in visitor numbers (up 13% or 25,000 visitors)
• Business confidence in tourism remains high
• Hotel revenue increased by 9% - double the Australian average growth rate
Total Overnight and Daytrip Visitation
5%In the year ending June 2015, total combined overnight and daytrip visitation increased 5% (up 558,000 visitors) to 11,617,000 visitors. The 5-year average growth rate for total visitors to the Gold Coast was stable.
Total Visitor Expenditure
7%Total combined overnight and daytrip visitor expenditure to the Gold Coast decreased 7%, a result of declining spend by the domestic overnight and day trip markets.
Total Overnight Visitation
4%Total international and domestic overnight visitation to the Gold Coast decreased by 4% (down 158,000 visitors) to 4,190,000 total overnight visitors. Of these total overnight visitors, 21% were international visitors.
Average Length of Stay
0.0 NightAverage length of stay by total international and domestic overnight visitors on the Gold Coast was flat at 5.2 nights.
Domestic Overnight Visitation
6%Domestic overnight visitors to the Gold Coast decreased by 6%, with their expenditure down 12%. Holiday visitation to the Gold Coast was the main source of the declines in visitation, down 19% (or 424,000 visitors) from the previous year. In contrast, those visiting friends and relatives increased 11% (up 106,000 visitors).
Domestic Daytrip Visitation
11%Daytrip visitation to the Gold Coast increased 11%, with daytrip expenditure declining by 14%; a result driven by a decline in per visitor expenditure (down 22% or by $24 per visitor).
International Visitation
6%
International visitors to the Gold Coast increased 6%, with international nights up 1%. A 12% growth in expenditure per night, combined with increases in visitation drove an overall increase of 13% in international visitors’ expenditure in the region. Recent growth in the international market has been primarily from holiday visitors (up 6% or 36,000 visitors).
Key Source Markets
China and New Zealand
The Gold Coast’s key international source market continues to be China, followed closely by New Zealand. China has had good growth during the period, recording the largest increase in visitor numbers (up 13% or 25,000 visitors). The New Zealand market remains strong, up 3% (or 5,000 visitors).
Gold Coast Airport Passenger Movements
2.1%Total passenger movements at Gold Coast Airport (OOL) increased by 2.1%. Comparatively, total passenger movements at Brisbane Airport (BNE) increased by 1% for the 2015 financial year.
Total Hotel Revenue
9.1%The total number of hotel rooms sold on the Gold Coast increased 4.5%, with the average occupancy rate improving 2.8 percentage points. Average revenue per available room also increased 8.5%, resulting in total hotel revenue growing by 9.1% to reach $761.82 million.
Theme Park Revenue
1%
The Ardent Leisure Group and Village Roadshow, the two major operators of the Gold Coast’s theme parks, recorded 0.6% and 1.4% decrease in revenue, respectively, achieved by their theme park portfolios. In contrast, Currumbin Wildlife Sanctuary, an important Gold Coast nature tourist attraction, reported a strong increase in revenue of 8.2%. Jointly, these three key attractions had a decline in revenue of 1%.
Business Confidence
HighAccording to Griffith University’s Business Confidence Index, business confidence in tourism on the Gold Coast remains high. City of Gold Coast also reported an increase in confidence in the Gold Coast economy amongst local businesses during the year.
Page 1 of 33 Page 2 of 33
For the year ending June 2015:
2. Gold Coast Travel TrendsCelebrate Festival
2.1. Context
The last twelve months saw a general increase in consumer confidence globally (Nielsen, 2015), which coupled with the weakening Australian dollar generated positive impacts on both international and domestic tourism. Whilst business confidence in Australia is somewhat lower than the previous year (Roy Morgan, 2015)1, confidence on the Gold Coast remains high, according to local research by both City of Gold Coast and Griffith University.
Confidence has been boosted by ongoing strength in the Chinese market, including additional visitation during Chinese New Year due to charter flights to Gold Coast Airport provided by China Southern and Cathay Pacific. Further growth in the Chinese market is expected in 2016, when Hong Kong Airlines begin operations to the Gold Coast with a series of charter flights and Jetstar begins direct flights between Wuhan and the Gold Coast.
The Gold Coast tourism industry also benefitted from major events, including the Lions Rugby Tour, Cricket World Cup, Opera on the Beach, the Gold Coast Airport Marathon, amongst others. The next Australian Tourism Exchange (ATE) taking place on the Gold Coast in 2016 is expected to bring substantial economic benefits, directly and longer term due to exposure of the Gold Coast tourism product portfolio.
Already strong investment into new infrastructure and products on the Gold Coast continues with the recent announcement that ASF Consortium has been invited to present detailed project plans for an integrated resort on a site between Sea World and the Gold Coast Fishermen’s Co-operative on the Spit.
The Mayor’s International Student Ambassador Program was launched in 2014, which is a new program designed to build relationships between the Gold Coast and international
students studying here while promoting the city as a destination to live, study and visit. The initiative is a partnership between Study Gold Coast and the City of Gold Coast.
During the year ending June, the Gold Coast recorded above average annual rainfall, particularly in January and February when the region received an extra 571mms above the long-term average of 373mms in these two months (131 years). This was associated with Ex-Tropical Cyclone Marcia tracking past the Gold Coast in February. Reportedly, a key reason for the decline in domestic overnight and daytrip visitation was due to this above average rainfall during the peak season.
1 See: http://www.roymorgan.com/morganpoll/consumer-confidence/roy-morgan-business-confidence
2 Note: Tourism Research Australia (TRA) only collects expenditure data at the national level. To estimate expenditure at the state and regional level, TRA employs the Regional Expenditure Model (REX). However, the REX model only provides limited top-line information for regional areas and is not disaggregated by purpose of visit or source market.
The number of total visitor nights spent in Brisbane and the Gold Coast is forecast to increase by 3.5% over the next 10 years, above the 2.7% average predicted for Queensland (Tourism Research Australia, 2014).
Page 3 of 33
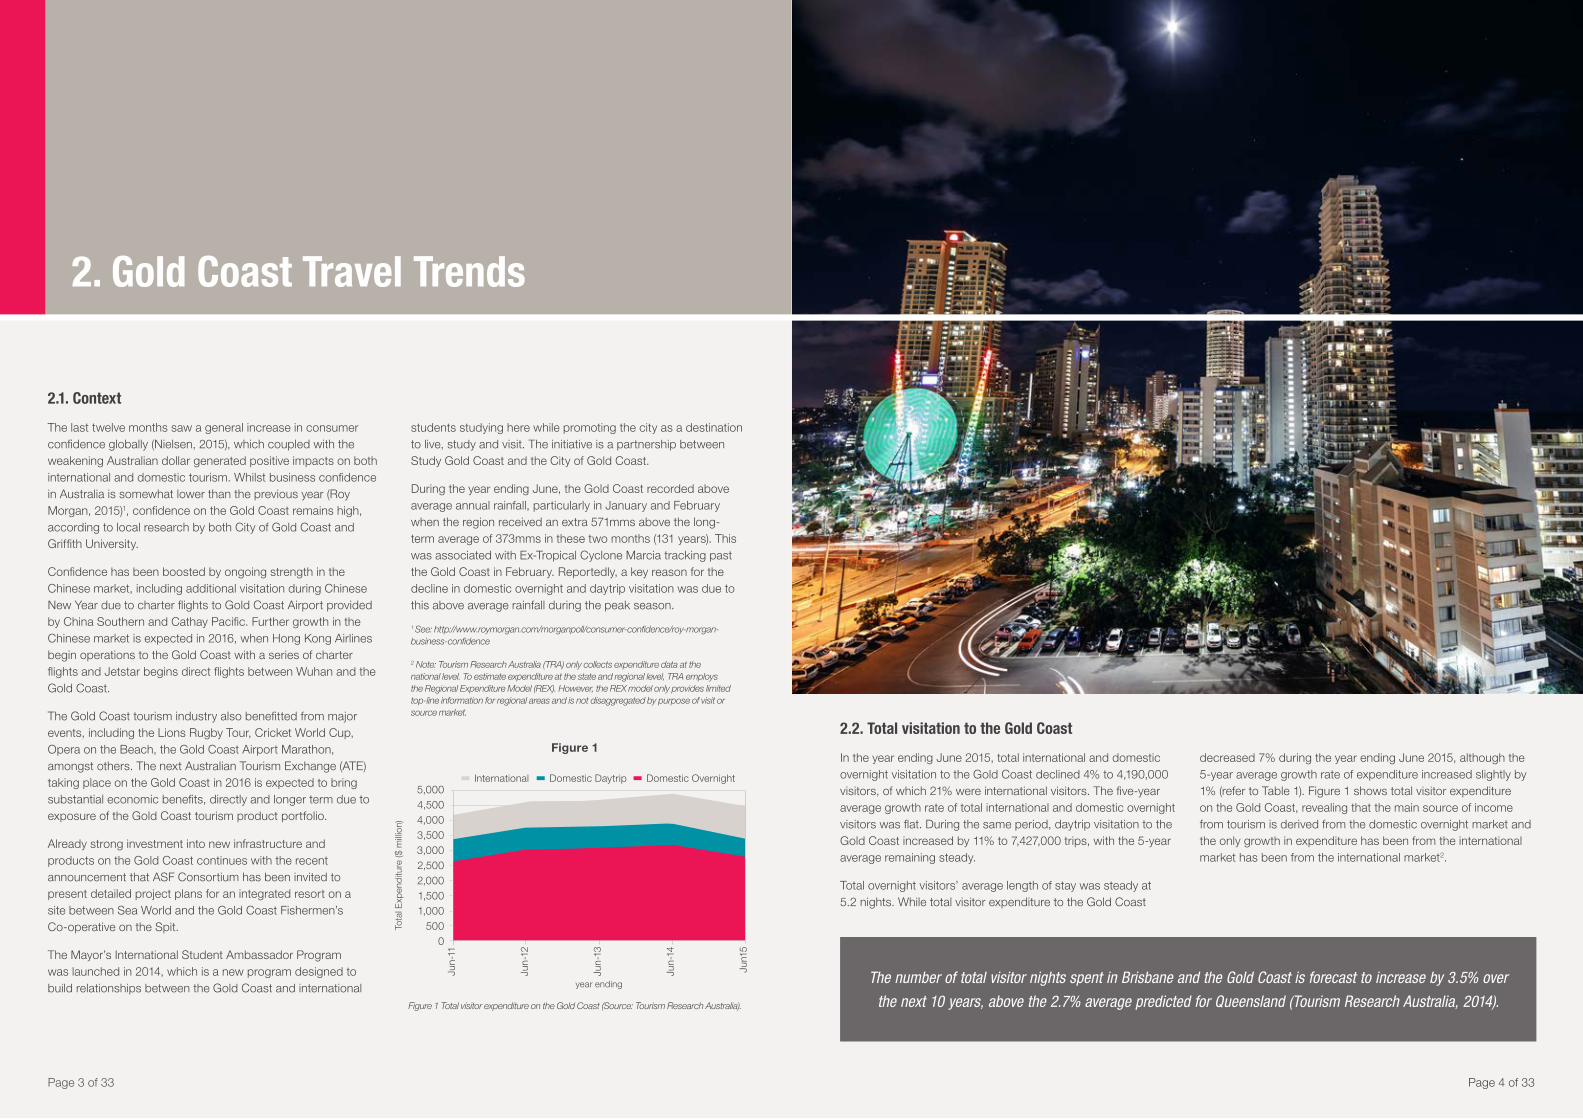
2.2. Total visitation to the Gold Coast
In the year ending June 2015, total international and domestic overnight visitation to the Gold Coast declined 4% to 4,190,000 visitors, of which 21% were international visitors. The five-year average growth rate of total international and domestic overnight visitors was flat. During the same period, daytrip visitation to the Gold Coast increased by 11% to 7,427,000 trips, with the 5-year average remaining steady.
Total overnight visitors’ average length of stay was steady at 5.2 nights. While total visitor expenditure to the Gold Coast
decreased 7% during the year ending June 2015, although the 5-year average growth rate of expenditure increased slightly by 1% (refer to Table 1). Figure 1 shows total visitor expenditure on the Gold Coast, revealing that the main source of income from tourism is derived from the domestic overnight market and the only growth in expenditure has been from the international market has been from the international market2.
Page 4 of 33
Figure 1 Total visitor expenditure on the Gold Coast (Source: Tourism Research Australia).
Figure 1
Domestic OvernightDomestic DaytripInternational5,0004,5004,0003,5003,0002,5002,0001,5001,000
5000
Tota
l Exp
end
iture
($ m
illio
n)
Jun-
11
Jun-
12
Jun-
13
Jun-
14
Jun1
5
year ending
Page 6 of 33
2.3. Domestic Visitors
In the year ending June 2015, domestic overnight visitors3 to the Gold Coast decreased by 6% (or 209,000 visitors) to 3,329,000 visitors4. As a result of the decline in visitation, nights spent on the Gold Coast also fell 8% (or by 1,072,000 nights to 13,184,000 nights), with average length of stay falling by 2% to 4 nights (although the 5-year average was steady). This weakening in visitation, combined with reduced per visitor expenditure (down 7% or by $61 per visitor), saw total domestic overnight expenditure on the Gold Coast decrease by 12% (or by $393 million) (refer to Table 2). In contrast, the five year average annual growth rate in domestic overnight expenditure showed a 1% increase for the Gold Coast region (Figure 2).
Domestic holiday visitors were the driver of the declines in overnight domestic visitation to the Gold Coast during the period with a decline of 19% to 1,764,000 visitors (or by 424,000 visitors). Self-drive holidays accounted for much of the declines, falling by 252,000 visitors to 1,153,000 visitors (down 18%). In contrast, the Gold Coast’s visiting friends and relatives (VFR) market increased 11% to 1,068,000 visitors (or by 106,000 visitors) suggesting some substitution may be occurring. Indeed, domestic overnight leisure5 visitors’ use of commercial accommodation declined 21% to 1,578,000 visitors (or by 411,000 visitors), while use of private accommodation increased 9% to 1,277,000 visitors (or by 109,000 visitors). Domestic overnight business visitation to the Gold Coast increased 27% to 408,000 visitors (or by 87,000 visitors).
The key source markets of domestic overnight visitation to the Gold Coast for the year ending June 2015 were Brisbane (1,140,000 visitors), Sydney (503,000 visitors), Melbourne (288,000 visitors), North Coast New South Wales (177,000 visitors), the Darling Downs (135,000 visitors) and the Sunshine Coast (119,000 visitors). The Brisbane overnight market had good growth during the year ending June 2015 (up by 6% or 61,000 visitors), as did the Sydney market (up 9% or by 41,000 visitors). However, the other key domestic overnight markets experienced large declines. The Brisbane overnight market’s average length of stay on the Gold Coast was 2.3 nights (down 0.4 nights).
While there was solid growth in day trip visitation to the Gold Coast (up 11%, or 717,000 visitors), the 5-year average annual growth in daytrips to the Gold Coast was flat. Eighty-six percent of day trips occur for leisure. The Brisbane market is the key source market for day trips to the Gold Coast accounting for 5,093,000 day trips. Total day trip expenditure declined by 14% in the year ending June 2015, driven by a 22% decline in per visitor expenditure. The 5-year average day trip expenditure only fell by 3% (refer to Table 3).
3 Note: The introduction of mobile phone interviewing on the National Visitor Survey in January 2014 has resulted in a break in series (please see ‘Disclaimer’ on page ii). However, further investigation of the trends comparing the periods following the break in series (i.e. the six months ending June 2014 with the six months ending June 2015) reveal that the declining trend is also occurring during this period (with overnight trips to the Gold Coast down 6% and nights down 9%).
4 Note: The total sample size for overnight visitors to the Gold Coast is around 1,400. Once this sample is split by source market and purpose of visit, the accuracy of the estimates is reduced. As there is considerable fluctuation in the time-series data where the sample size is small, only limited information is presented to avoid misrepresentation.
5 Those visitors travelling for the purpose of a holiday or to visit friends and relatives
Figure 2
Page 5 of 33
Figure 2 Gold Coast per visitor expenditure ($) by domestic overnight and daytrip visitors (TRA – Regional Expenditure Model).
1000900800700600500400300200100
0
($) p
er v
isito
r
Jun-
11
Jun-
12
Jun-
13
Jun-
14
Jun1
5
792
98
901
106
847
97
903
107
841
83
Expenditure per overnight visitor ($) Expenditure per daytrip visitor ($)
Year ending
2.4 International Visitors
In the year ending June 2015, the Gold Coast had strong growth in international visitation, with an increase of 6% (or 50,000 visitors) compared with the previous year. International visitors’ average length of stay on the Gold Coast decreased 5% to 10.1 nights, compared with the previous financial year. This has been a result of declines in more traditional longer-stay European markets (where average length of stay fell 4.3 nights to 12.9 nights), being offset by growth in shorter-stay Chinese market (who stay 4.8 nights on average). Despite this, total international visitor nights in the region increased slightly by 1% (or 82,000 nights) to 8,681,000 nights.
International visitors to the Gold Coast increased their expenditure per night by 12% (or $14 per night), which – when combined with increases in visitation – generated an overall 13% increase in expenditure in the region. The result was an additional $131 million being spent in the Gold Coast region in the year ending June 2015. In total, the international market contributed $1,102 million directly to the Gold Coast economy for the year ending June 2015 (refer to Table 4).
During the reporting period, the key international source market to the Gold Coast was China, followed closely by New Zealand. China showed solid growth with an increase of 13% (or 25,000 visitors) to a total 212,000 visitors. Despite the growth in visitor numbers, China’s average length of stay in the region continues to remain the lowest of all international source markets at just 4.8 nights (refer to Table 5)6. This is primarily a result of an underrepresentation of Chinese education visitors (less than 2% of all Chinese visitors on the Gold Coast) when compared to 14% of Chinese visitors to Australia being education visitors. Education visitors typically stay far longer and spend much more while in Australia than leisure or business visitors.
New Zealand remains the key source market in terms of total visitor nights spent on the Gold Coast, amounting to a total of 1,581,000 nights in the region for the year ending June 2015. However, the average length of stay by New Zealand visitors declined 0.8 nights to 9.1 nights on average, which resulted in a decline of 6% in total nights spent on the Gold Coast (or
by 104,000 nights). On a positive note, the UK market has continued to rebound, demonstrating strong growth of 10% to reach 66,700 visitors (up 6,200 visitors).
Most international visitors to the Gold Coast visited for leisure, with 679,000 coming for a holiday and 129,000 visiting friends and relatives. The leisure market represents 95% of all international visitors to the Gold Coast. Recent growth has been mainly from the holiday market, which increased by 36,000 visitors (refer to Table 6). However, the education market has also experienced significant growth of 20% (or 3,500 visitors) to reach a total of 21,000. International visitors coming to the Gold Coast for other purposes (such as for employment, medical, for the possibility of immigration, for a funeral or for other reasons not identified) also increased, up 4,400 visitors to a total of 14,000 visitors in the year ending June 2015.
6 Note: Due to the volatility in the visitor night estimates for a number of key source markets over time, only average length of stay is reported.
Page 6 of 33
Top 5 Domestic Overnight Source Markets (by visitors): 1. Brisbane (1.14 million)
2. Sydney (503,000)
3. Melbourne (288,000)
4. North Coast NSW (177,000)
5. Darling Downs (135,000)
3. Gold Coast Competitiveness Analysis
The competitiveness analysis compares the Gold Coast against a key comparative set of Brisbane, Sunshine Coast, Tropical North Queensland, Sydney, Melbourne and Perth. It is important to understand that some of the competitor destinations (in particular Brisbane, Sydney and Melbourne) have a broader market base, including substantial business tourism segments.
In the year ending June 2015, the Gold Coast lost market share of the domestic overnight visitor market, receiving 4% of all domestic overnight visitors (down 0.5% points) and 4.2% of domestic visitor nights in Australia (down 0.6% points). Similarly, the Gold Coast lost market share of overnight visitors total trip expenditure, receiving 5.1% in the year ending June 2015 (down 0.9% points). This share of expenditure is less than the share received by Brisbane (6.2%), but greater than that of the Sunshine Coast (3.2%) and Tropical North Queensland (3.3%) (refer to Table 7).
In contrast to the Gold Coast, Melbourne improved its market share of visitor nights (up 0.3%). The other comparative regions had a slight decrease in market share of domestic visitor nights (between 1-2%). As a result of Melbourne capturing a larger share of nights, the region also increased its share of visitor expenditure more than any other comparative region (up 0.4% to 12.1%). All key comparative regions experience a steady or slight increase in market share of expenditure (<0.2% each).
Despite the declines in domestic market share, the Gold Coast maintains relatively high average trip expenditure at $841 per visitor, particularly when compared to other key regions. Only Tropical North Queensland and Perth have higher average trip expenditures within the comparative set. The Gold Coast holds a mid-range position for average expenditure per visitor per night (refer to Table 8).
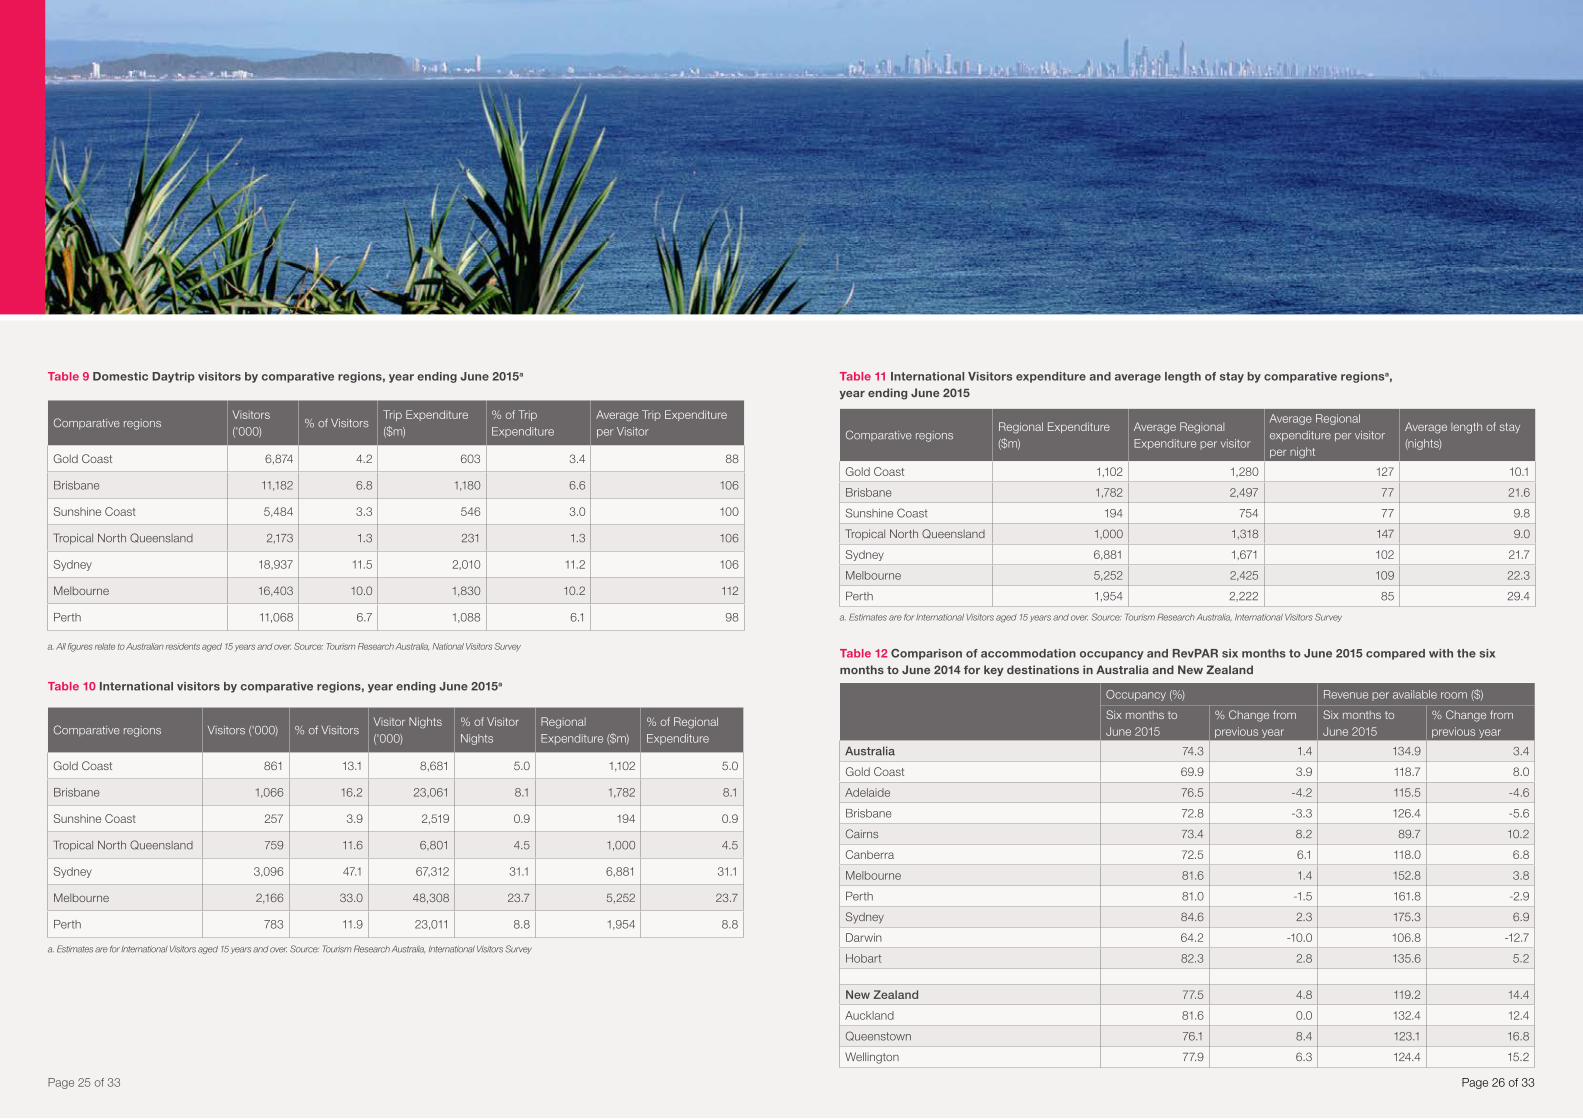
The Gold Coast has a 4.4% share of the domestic daytrip market in terms of visitor numbers and a 3.4% share in terms of trip expenditure. The Gold Coast’s average daytrip expenditure per visitor is $83, well below the $108 average of all daytrips in Australia (refer to Table 9).
Comparatively, the Gold Coast has a strong and growing presence in the international market, with 13.1% of international visitors stopping over in the Gold Coast. However, only 3.7% of all international visitor nights and 5.0% of all international visitors’ expenditure is spent on the Gold Coast. This is low when compared to Capital Cities such as Sydney, Melbourne, Perth and Brisbane, but it is above the share achieved by the Sunshine Coast and Tropical North Queensland (refer to Table 10).
In the year ending June 2015, the Gold Coast’s market share of the international visitor nights decreased slightly by 0.3% to 3.7%. Comparatively, other destinations which also experienced a decline in market share included Sydney (down 0.3 percentage points to 28.6%) and the Sunshine Coast (down 0.2 percentage points to 1.1%). Tropical North Queensland and Perth maintained their previous market shares of 2.9% and 9.8%, respectively. Alternatively, Brisbane (up 0.5 percentage points to 9.8%) and Melbourne (up 1.3 percentage points to 20.5%) increased their respective market shares. Overall, however, market shares are relatively stable.
The Gold Coast’s average international visitors’ regional expenditure is $1,280, which is the second lowest per visitor expenditure in the comparative set, only ahead of the Sunshine Coast. This result is primarily due to the comparatively lower average length of stay of international visitors on the Gold Coast, particularly by the Chinese market. On a per night basis, the Gold Coast has high average expenditure when compared to other key regions at $127 per night, including Sydney ($102 per night) and Melbourne ($109 per night). Only Tropical North Queensland has higher average per night expenditure within the comparative set at $147 per night (refer to Table 11).
Page 8 of 33Page 7 of 33
4. Gold Coast Industry Indicators
Page 10 of 33Page 9 of 33
4.1. Accommodation
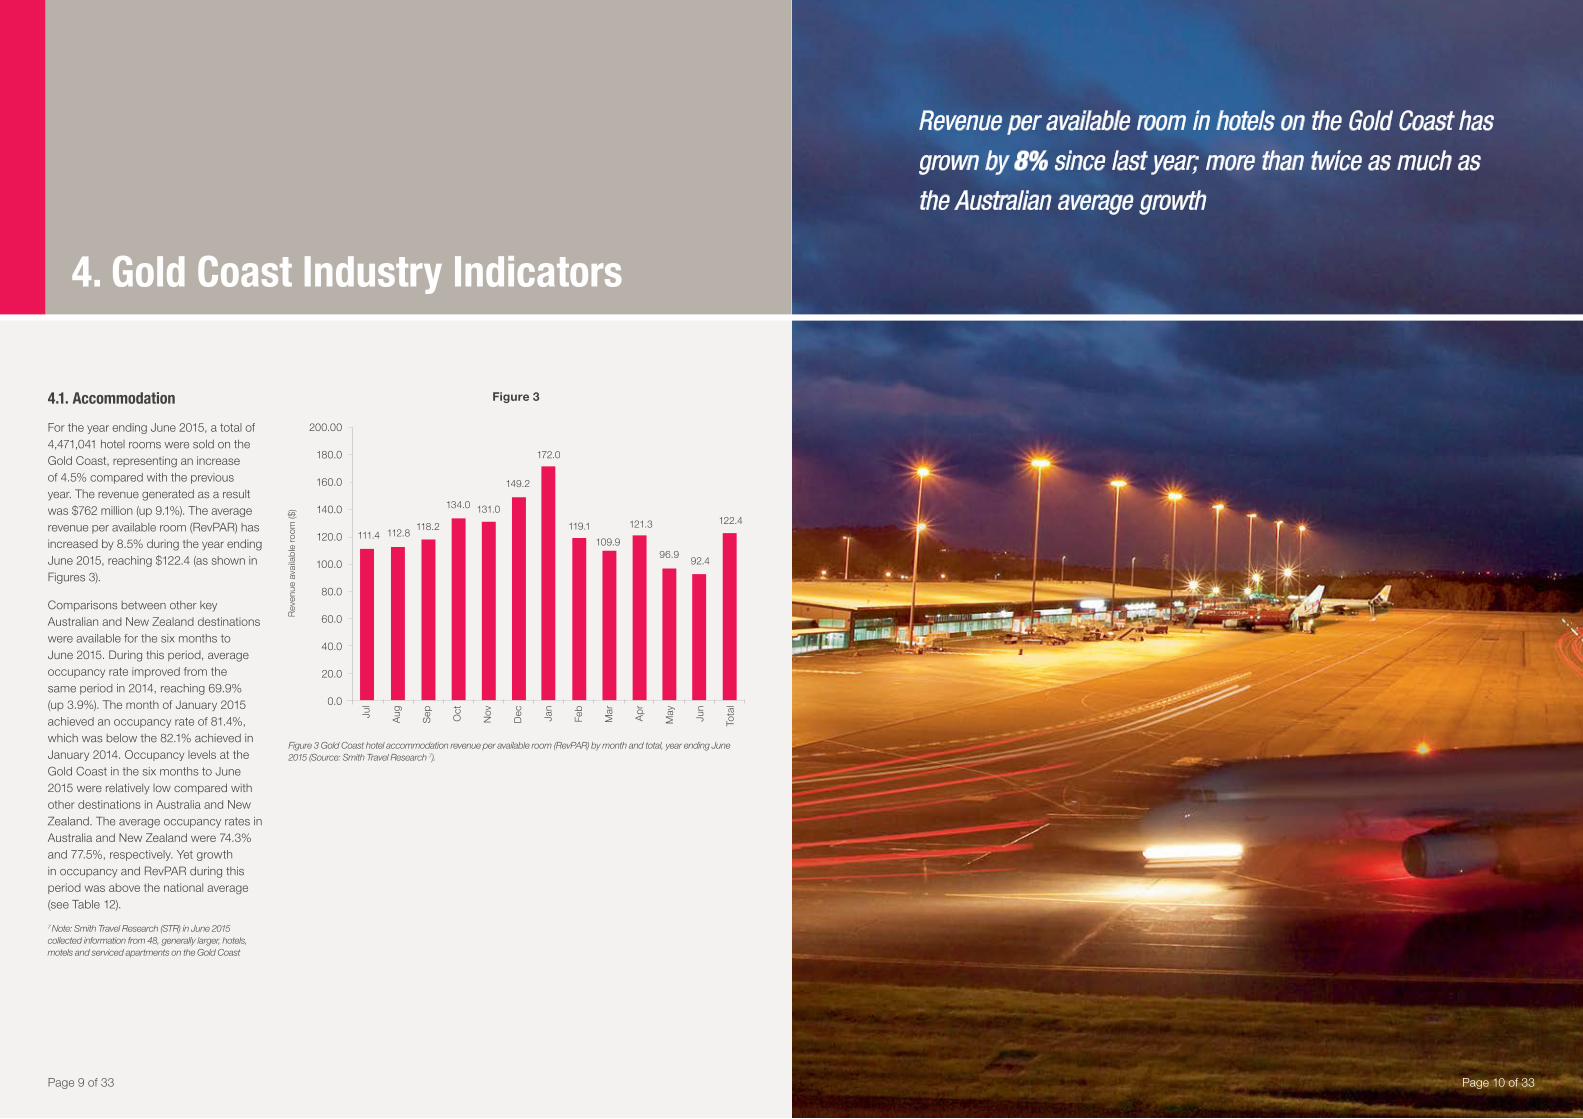
For the year ending June 2015, a total of 4,471,041 hotel rooms were sold on the Gold Coast, representing an increase of 4.5% compared with the previous year. The revenue generated as a result was $762 million (up 9.1%). The average revenue per available room (RevPAR) has increased by 8.5% during the year ending June 2015, reaching $122.4 (as shown in Figures 3).
Comparisons between other key Australian and New Zealand destinations were available for the six months to June 2015. During this period, average occupancy rate improved from the same period in 2014, reaching 69.9% (up 3.9%). The month of January 2015 achieved an occupancy rate of 81.4%, which was below the 82.1% achieved in January 2014. Occupancy levels at the Gold Coast in the six months to June 2015 were relatively low compared with other destinations in Australia and New Zealand. The average occupancy rates in Australia and New Zealand were 74.3% and 77.5%, respectively. Yet growth in occupancy and RevPAR during this period was above the national average (see Table 12).
7 Note: Smith Travel Research (STR) in June 2015 collected information from 48, generally larger, hotels, motels and serviced apartments on the Gold Coast
Revenue per available room in hotels on the Gold Coast has grown by 8% since last year; more than twice as much as the Australian average growth
111.4 112.8118.2
134.0 131.0
149.2
172.0
119.1
109.9
121.3
96.992.4
122.4
Jul
Aug
Sep Oct
Nov
Dec Jan
Feb
Mar
Ap
r
May
Jun
Tota
l
200.00
180.0
160.0
140.0
120.0
100.0
80.0
60.0
40.0
20.0
0.0
Rev
enue
ava
ilab
le r
oom
($)
Figure 3 Gold Coast hotel accommodation revenue per available room (RevPAR) by month and total, year ending June 2015 (Source: Smith Travel Research 7).
Figure 3
4.2. Gold Coast Airport
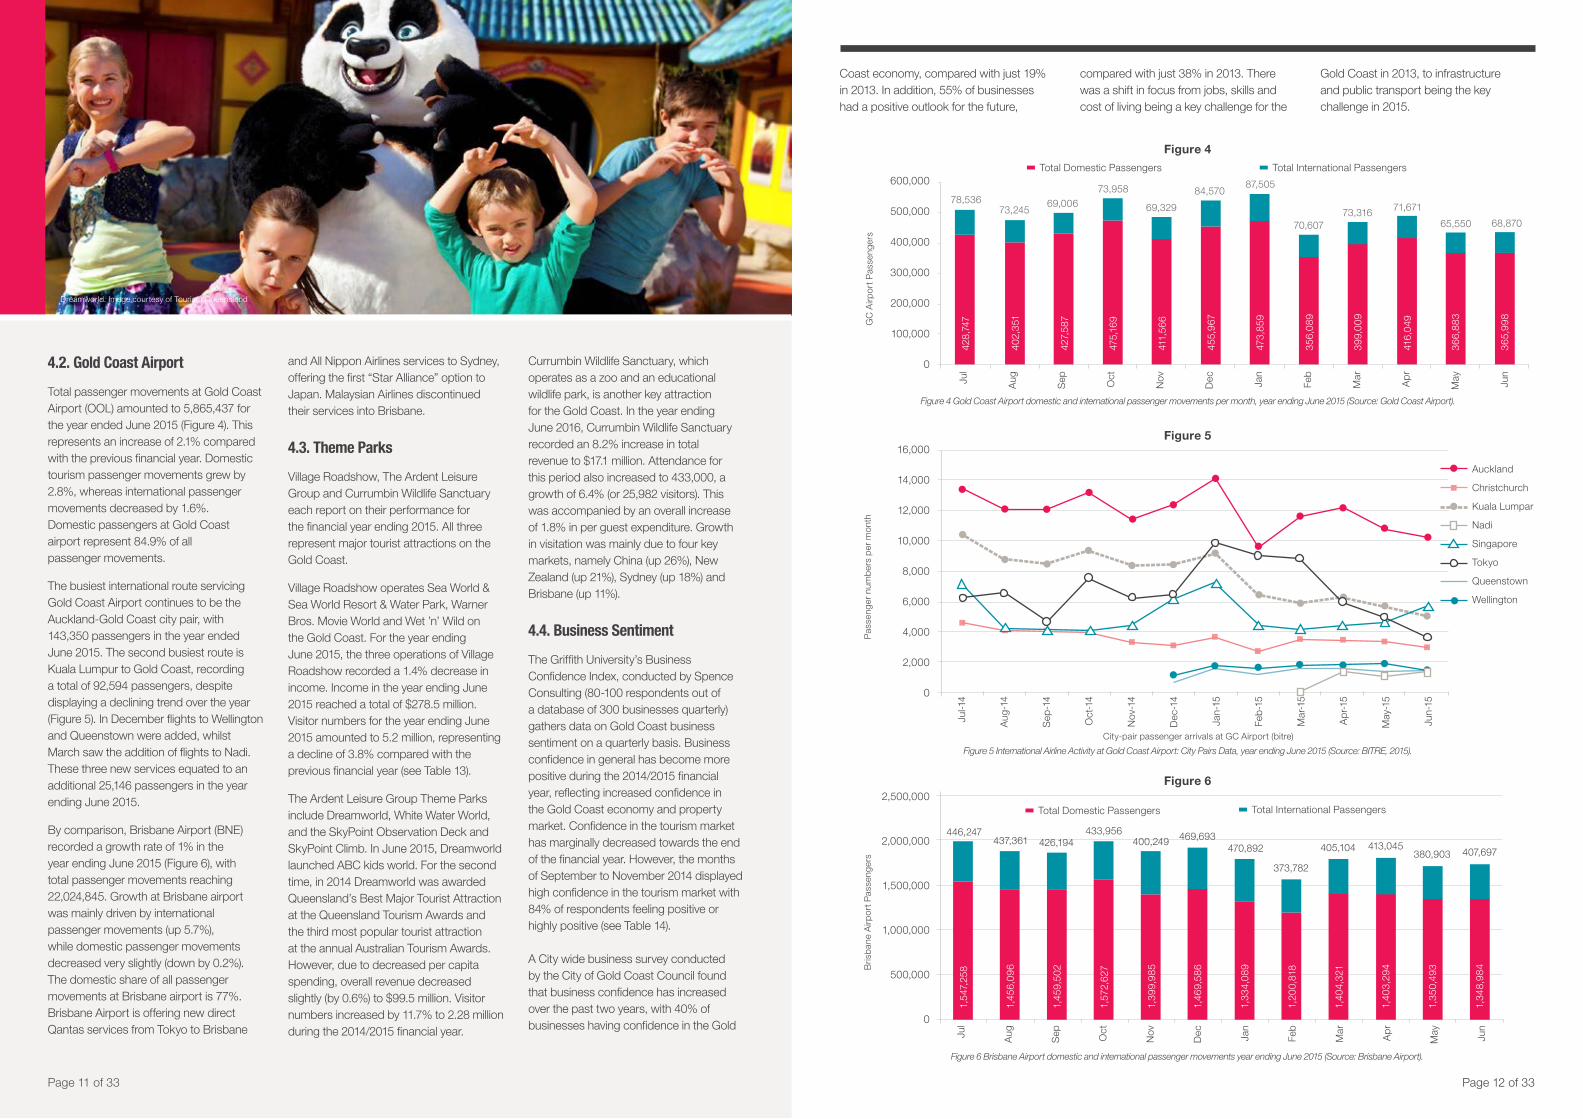
Total passenger movements at Gold Coast Airport (OOL) amounted to 5,865,437 for the year ended June 2015 (Figure 4). This represents an increase of 2.1% compared with the previous financial year. Domestic tourism passenger movements grew by 2.8%, whereas international passenger movements decreased by 1.6%. Domestic passengers at Gold Coast airport represent 84.9% of all passenger movements.
The busiest international route servicing Gold Coast Airport continues to be the Auckland-Gold Coast city pair, with 143,350 passengers in the year ended June 2015. The second busiest route is Kuala Lumpur to Gold Coast, recording a total of 92,594 passengers, despite displaying a declining trend over the year (Figure 5). In December flights to Wellington and Queenstown were added, whilst March saw the addition of flights to Nadi. These three new services equated to an additional 25,146 passengers in the year ending June 2015.
By comparison, Brisbane Airport (BNE) recorded a growth rate of 1% in the year ending June 2015 (Figure 6), with total passenger movements reaching 22,024,845. Growth at Brisbane airport was mainly driven by international passenger movements (up 5.7%), while domestic passenger movements decreased very slightly (down by 0.2%). The domestic share of all passenger movements at Brisbane airport is 77%. Brisbane Airport is offering new direct Qantas services from Tokyo to Brisbane
and All Nippon Airlines services to Sydney, offering the first “Star Alliance” option to Japan. Malaysian Airlines discontinued their services into Brisbane.
4.3. Theme Parks
Village Roadshow, The Ardent Leisure Group and Currumbin Wildlife Sanctuary each report on their performance for the financial year ending 2015. All three represent major tourist attractions on the Gold Coast.
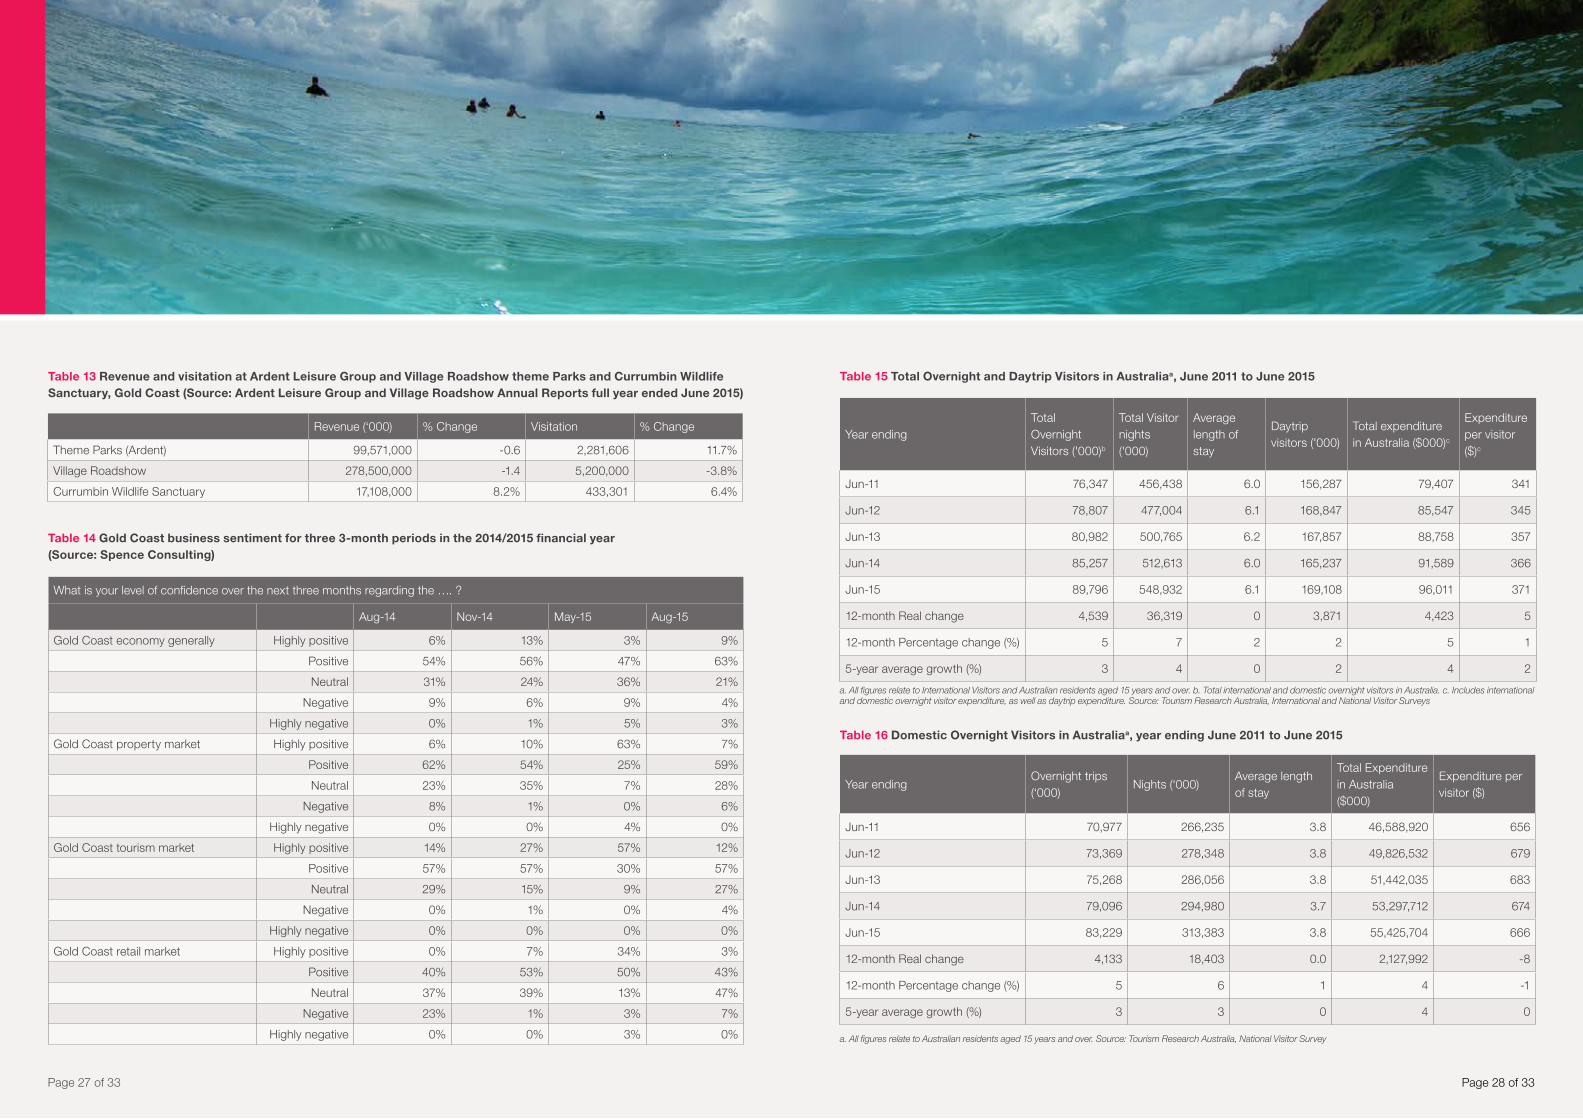
Village Roadshow operates Sea World & Sea World Resort & Water Park, Warner Bros. Movie World and Wet ’n’ Wild on the Gold Coast. For the year ending June 2015, the three operations of Village Roadshow recorded a 1.4% decrease in income. Income in the year ending June 2015 reached a total of $278.5 million. Visitor numbers for the year ending June 2015 amounted to 5.2 million, representing a decline of 3.8% compared with the previous financial year (see Table 13).
The Ardent Leisure Group Theme Parks include Dreamworld, White Water World, and the SkyPoint Observation Deck and SkyPoint Climb. In June 2015, Dreamworld launched ABC kids world. For the second time, in 2014 Dreamworld was awarded Queensland’s Best Major Tourist Attraction at the Queensland Tourism Awards and the third most popular tourist attraction at the annual Australian Tourism Awards. However, due to decreased per capita spending, overall revenue decreased slightly (by 0.6%) to $99.5 million. Visitor numbers increased by 11.7% to 2.28 million during the 2014/2015 financial year.
Currumbin Wildlife Sanctuary, which operates as a zoo and an educational wildlife park, is another key attraction for the Gold Coast. In the year ending June 2016, Currumbin Wildlife Sanctuary recorded an 8.2% increase in total revenue to $17.1 million. Attendance for this period also increased to 433,000, a growth of 6.4% (or 25,982 visitors). This was accompanied by an overall increase of 1.8% in per guest expenditure. Growth in visitation was mainly due to four key markets, namely China (up 26%), New Zealand (up 21%), Sydney (up 18%) and Brisbane (up 11%).
4.4. Business Sentiment
The Griffith University’s Business Confidence Index, conducted by Spence Consulting (80-100 respondents out of a database of 300 businesses quarterly) gathers data on Gold Coast business sentiment on a quarterly basis. Business confidence in general has become more positive during the 2014/2015 financial year, reflecting increased confidence in the Gold Coast economy and property market. Confidence in the tourism market has marginally decreased towards the end of the financial year. However, the months of September to November 2014 displayed high confidence in the tourism market with 84% of respondents feeling positive or highly positive (see Table 14).
A City wide business survey conducted by the City of Gold Coast Council found that business confidence has increased over the past two years, with 40% of businesses having confidence in the Gold
Page 12 of 33Page 11 of 33
Dreamworld. Image courtesy of Tourism Queensland
Figure 4
Figure 4 Gold Coast Airport domestic and international passenger movements per month, year ending June 2015 (Source: Gold Coast Airport).
600,000
500,000
400,000
300,000
200,000
100,000
0
GC
Airp
ort P
asse
nger
s
Total Domestic Passengers Total International Passengers
Jul
Aug
Sep Oct
Nov
Dec Jan
Feb
Mar
Ap
r
May
Jun
78,536
428,
747
73,245
402,
351
427,
587
69,006
475,
169
73,958
411,
566
69,329
455,
967
84,57087,505
473,
859
356,
089
70,60773,316
399,
009
71,671
416,
049
366,
883
65,550
365,
998
68,870
Figure 5 International Airline Activity at Gold Coast Airport: City Pairs Data, year ending June 2015 (Source: BITRE, 2015).
Figure 516,000
14,000
12,000
10,000
8,000
6,000
4,000
2,000
0
Jul-1
4
Aug
-14
Sep
-14
Oct
-14
Nov
-14
Dec
-14
Jan-
15
Feb
-15
Mar
-15
Ap
r-15
May
-15
Jun-
15
Pas
seng
er n
umb
ers
per
mon
th
City-pair passenger arrivals at GC Airport (bitre)
Auckland
Christchurch
Kuala Lumpar
Nadi
Singapore
Tokyo
Queenstown
Wellington
Figure 6
Figure 6 Brisbane Airport domestic and international passenger movements year ending June 2015 (Source: Brisbane Airport).
Jul
Aug
Sep Oct
Nov
Dec Jan
Feb
Mar
Ap
r
May
Jun
446,247437,361 426,194
433,956400,249 469,693
470,892
373,782
405,104 413,045380,903 407,697
1,54
7,25
8
1,45
6,09
6
1,45
9,50
2
1,57
2,62
7
1,39
9,98
5
1,46
9,58
6
1,33
4,08
9
1,20
0,81
8
1,40
4,32
1
1,40
3,29
4
1,35
0,49
3
1,34
8,98
4
Total Domestic Passengers Total International Passengers2,500,000
2,000,000
1,500,000
1,000,000
500,000
0
Bris
bane
Airp
ort P
asse
nger
s
Coast economy, compared with just 19% in 2013. In addition, 55% of businesses had a positive outlook for the future,
compared with just 38% in 2013. There was a shift in focus from jobs, skills and cost of living being a key challenge for the
Gold Coast in 2013, to infrastructure and public transport being the key challenge in 2015.

5. Australian Travel Trends
5.1. Context
According to the ANZ-Roy Morgan Australian Consumer Confidence Ratings, confidence amongst Australian consumers fell 2.2% in the year ending June 2015. Similarly, the Roy Morgan Business Confidence Index showed a decline of 7.6% during the same period.
The weakening Australian Dollar fuelled confidence in tourism in Australia, with expectations that both the international and domestic markets would grow as Australia becomes relatively cheaper to other international destinations. During the 2014/2015 financial year, the AUD fell significantly against the USD and CNY (Figure 7). At the end of June 2015, the AUD was worth only US$0.77. Comparatively, the AUD was relatively more stable against the Euro and the British Pound, with the AUD increasing in strength against the NZD. Several Asian currencies (including Korea and Indonesia) weakened, possibly resulting in weaker demand for international outbound travel by these source markets.
In addition, tourism to Australia is likely to have benefited from lower fuel costs in the fourth quarter of 2014. The drop in fuel prices fell from US$98 per barrel of
Page 14 of 33
Key facts about Australia in the global tourism context (UNWTO - Tourism Barometer):
International arrivals to Australia have increased by 7.6 per cent in 2014.
Australia continues to rank 11th worldwide in terms of international receipts.
International receipts have increased by 9.0 per cent in Australia, in the year to August 2015, compared with the same period in the previous year (based on preliminary data).
Australians spent US$26.3 billion overseas; they are the 9th largest spenders on tourism globally.
Page 13 of 33
crude oil (Brent) in July 2014 to just US$59 at the end of June 2015 will have been a positive factor, especially for domestic drive tourism. Only a proportion of this decrease has been reflected in the cost of tourism transportation, with airlines being slow in adjusting their fuel surcharges.
The TTF Mastercard survey for the first quarter of 2015 shows that the tourism sector remains concerned about the exchange rate, however this concern is lower than previous surveys (Figure 8). Similar to the previous survey, another perceived impediment related to taxes charged on tourists and the quality of retail offering. Compared with previous surveys, there was also increased concern about Australia’s reputation as a desirable tourist destination, including its reputation as a business and events destination. Labour shortages (skilled and unskilled) are also of concern.
5.2. Total Visitation in Australia
In the year ending June 2015, total international and domestic overnight visitors aged 15 years and over in Australia increased by 5% to 89.8 million visitors, of which 6% are international visitors. Average length of stay of total overnight visitors remained steady at 6.1 nights, maintaining the 5-year average. Daytrip visitation by domestic Australian residents was increased slightly by 2% (or 3.9 million trips) to 169.1 million trips.
Total expenditure in Australia by international, domestic overnight and daytrip visitors increased by 5% to $96 billion in the year ending June 2015 (refer to Table 15). During the same period the all-groups consumer price index increased by 1.5% (Reserve Bank of Australia, 2014), indicating that real total visitor expenditure in Australia had good growth.
5.3. Domestic Visitors
In the year ending June 2015, domestic overnight visitation increased 5%. The 5-year growth rate increased 3% per annum on average. Domestic visitors’ nights away from home also increased 6% on the previous year, driven by the increase in number of trips. Total domestic overnight expenditure in Australia increased 4% to $54.4 billion in the year ending June 2015, also a result of the increase in visitation with expenditure per visitor declining slightly (refer to Table 16). Domestic daytrip visitors
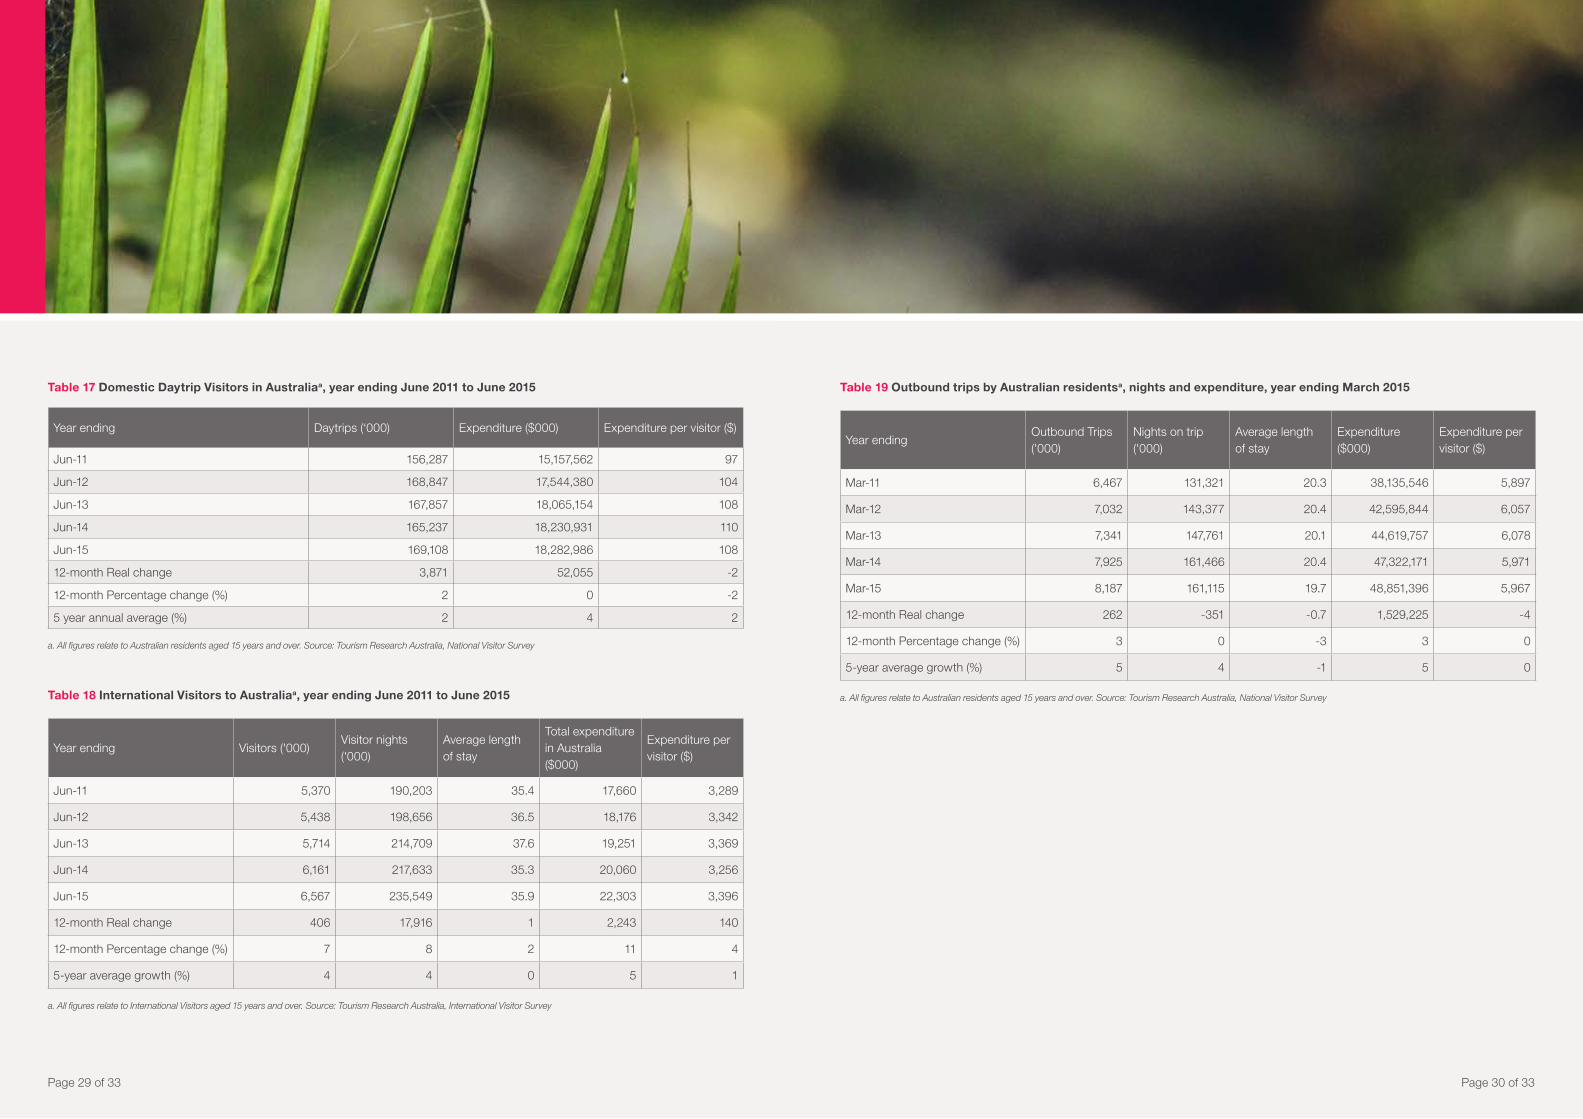
in Australia increased by 2% during the period to 169.1 million trips. However, day trip visitors’ expenditure declined 2% to $108 per visitor (refer to Table 17).
5.4. International Visitors
In the year ending June 2015, international visitors to Australia increased by 7% (or 406,000 visitors) to 6,567,000 visitors. Visitor nights increased by 8% (up 17.9 million nights to 235.5 million nights), with the 5-year trend revealing a 4% average annual growth rate.
Total international visitor expenditure in Australia increased by 11% to $ 2,243 million in the year ending June 2015, driven by an increase in visitation, average length of stay and per visitor expenditure. The average length of stay increased by 2%, while expenditure on a per visitor basis increased 4% (or by $140 per visitor) (refer to Table 18).
As for the Gold Coast, the growth in international visitation to Australia was driven by growth in leisure visitors, which increased by 233,000 visitors to 4,728,000 visitors in the year ending June 2015 (up 5%). This increase in visitors delivered growth in total leisure nights (up 3%) and expenditure by leisure visitors in Australia (up 8%). However, the average length of stay for leisure visitors decreased by 2% to 26.5 nights.
The key international market for Australia in terms of visitor numbers continues to be New Zealand (1,154,000 visitors), followed by China (864,000 visitors), the United Kingdom (629,000 visitors) and the United States (544,000 visitors). China leads the market in terms of visitor nights with an average length of stay of 42.6 nights8, followed by the United Kingdom (who stay
41.4 nights on average). Consequently, Chinese visitors had the highest total expenditure, spending $5.2 billion in Australia and contributing 23% to total international expenditure (compared with their share of arrivals of 13%).
The Chinese leisure market has been growing strongly (up 21% or 107,300 visitors) and maintaining their average length of stay of 22.3 nights. The Chinese education market also displayed strong growth, increasing by 20% (19,000 visitors) and staying 161.3 nights on average. Education visitors represent 13% of the Chinese market in terms of visitors, but 50% of all Chinese visitor nights.
Besides China, other key growth markets in terms of visitor numbers for Australia in the year ending June 2015 include the United States (up 43,300 visitors), New Zealand (up 38,600 visitors) and India (up 34,400 visitors).
In the year ending June 2015, Queensland received 2,229,000 visitors (an increase of 8%). Collectively these visitors spent a total of $4.6 billion (an increase of 15%) in Queensland. Growth rates in terms of expenditure for Queensland were lower than Tasmania (up 27%), similar to Victoria (up 15%), New South Wales (up 10%) and Northern Territory (up 18%), but noticeable higher than South Australia (up 5%) and Western Australia (up 1%).
8 Note: that the average length of stay of Chinese visitors on the Gold Coast is relatively less compared with other international markets.
5.5. Outbound travel by Australians
In the year ending March 20159, outbound travel remained attractive for Australians. The number of all outbound trips increased 3% to 8,187,000 trips, below the five year average annual rate of 5%. Total nights during the period were flat, well below the five year average annual rate of 4%. This was a result of average length of stay overseas declining 0.7 nights to 19.7 nights. Total expenditure increased 3%, driven mainly by visitor numbers, as expenditure per visitor was flat at $5,967 per trip (refer to Table 19).
9 Note: Reporting period is year ending March as Tourism Research Australia collects information on outbound travel by Australians, but the collection lags behind that of the overnight and daytrip results due to the duration of the domestic residents’ overseas trip.
Visitors from China continue to be an important market for Australia. The increasing need and opportunity for differentiation this large market is increasingly recognised by governments and private sector trade organisations, tourism bureaus, and those providing market intelligence (e.g. Hurun Reports at http://up.hurun.net).
50
45
40
35
30
25
20
15
10
5
0
2013 Q3 2014 Q3
% r
esp
ond
ents
rep
ortin
g is
sue
amon
gst t
op th
ree
Exc
hang
e ra
te
Taxe
s on
cha
rges
on
tour
ists
Rep
utat
ion
as a
d
esira
ble
tour
ist
des
tinat
ion
Sho
rtag
e of
ski
lled
lab
our
Ab
norm
al w
eath
er
and
/or
natu
ral
dis
aste
rs
Sho
rtag
e of
un
skill
ed la
bou
r
Qua
lity/
freq
uenc
y of
maj
or e
vent
s
Inad
equa
te r
oom
su
pp
ly
Lack
of a
ttra
ctio
ns
in th
e vi
cini
ty
Lack
of c
onve
ntio
n an
d ex
hib
ition
sp
ace/
faci
litie
s
Rep
utat
ion
as
a b
usin
ess
and
even
ts d
estin
atio
n
Figure 8 TTF Mastercard survey: perceptions of business impediments for tourism (Quarter 1 of 2015).
Figure 8
7
6
5
4
3
2
1
0
1.2
1.1
1
0.9
0.8
0.7
0.6
0.5
0.4
6/7/
2014
20/7
/201
4
2/8/
2014
17/0
8/20
14
31/8
/201
4
14/9
/201
4
28/9
/201
4
12/1
0/20
14
26/1
0/20
15
9/11
/201
4
23/1
1/20
15
7/12
/201
4
21/1
2/20
14
4/1/
2015
18/1
/201
5
1/2/
2015
15/3
/201
5
1/3/
2015
15/3
/201
5
29/3
/201
5
12/4
/201
5
26/4
/201
5
10/5
/201
5
24/5
/201
5
7/6/
2015
21/6
/201
5
Exc
hang
e ra
te fo
r U
SD
, EU
R a
nd N
ZD
Exchange rate for C
NY
(China)
Figure 7 Foreign exchange trends for the Australian dollar (Source: www.oanda.com).
AUD/NZD AUD/CNYAUD/EURAUD/USD
Figure 7
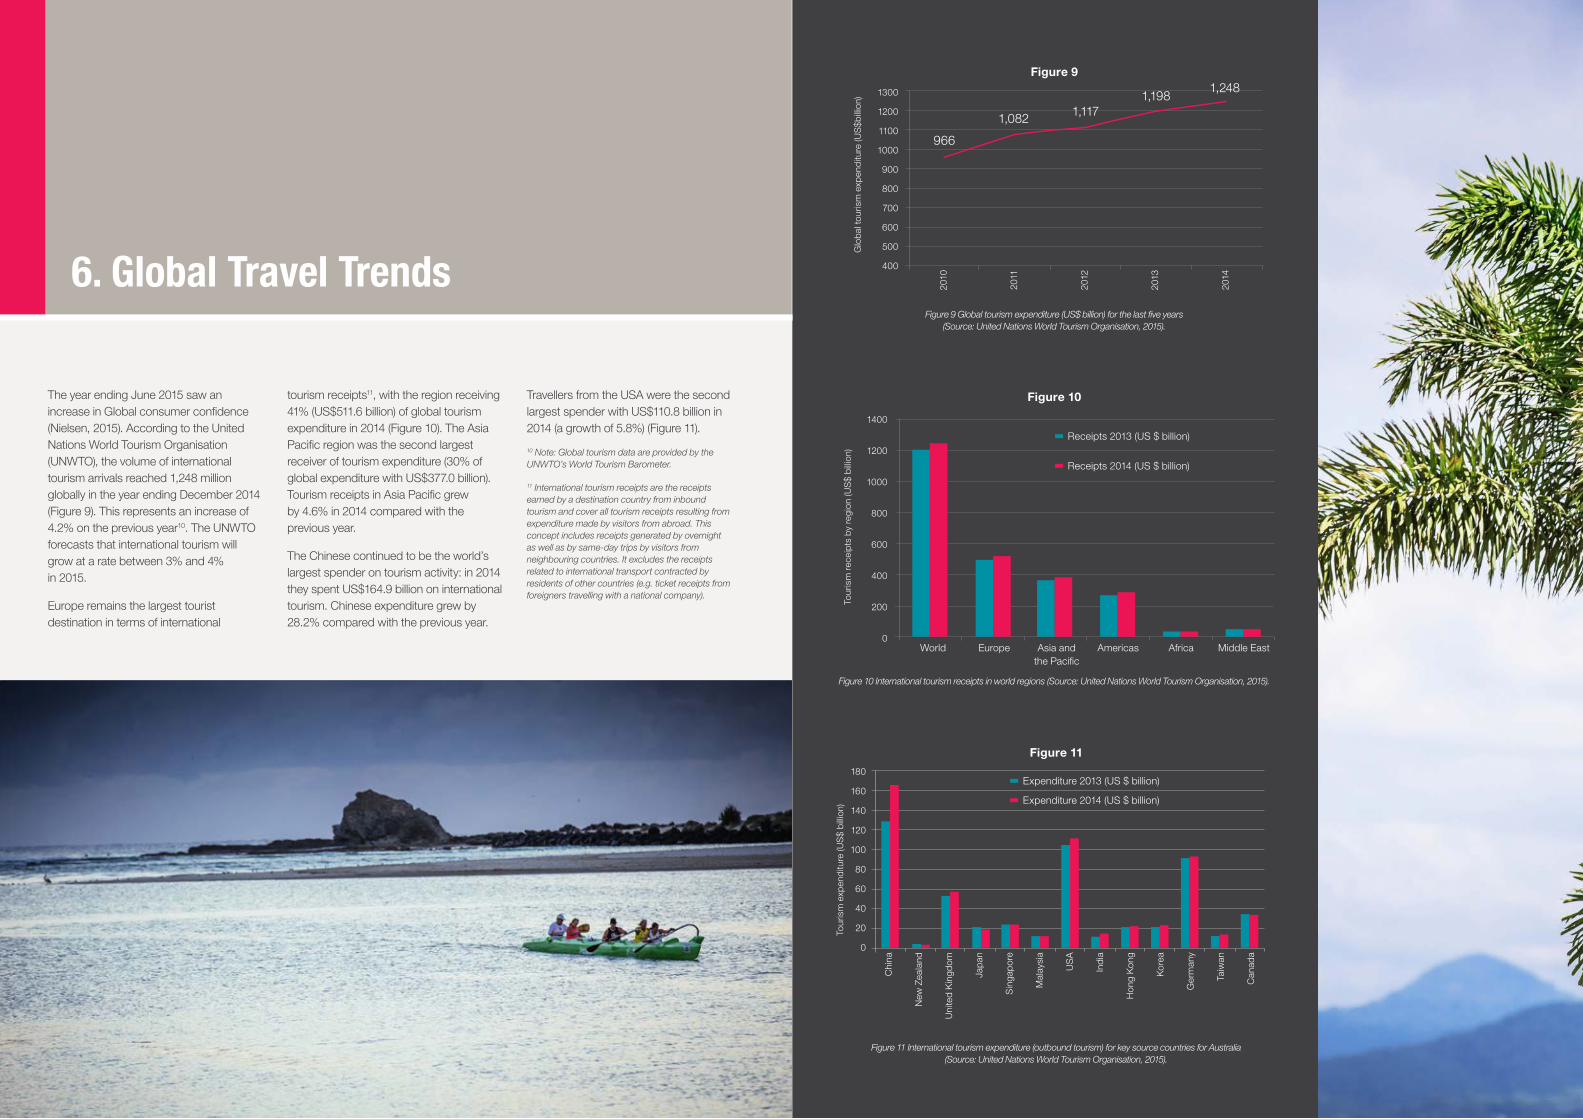
6. Global Travel Trends
The year ending June 2015 saw an increase in Global consumer confidence (Nielsen, 2015). According to the United Nations World Tourism Organisation (UNWTO), the volume of international tourism arrivals reached 1,248 million globally in the year ending December 2014 (Figure 9). This represents an increase of 4.2% on the previous year10. The UNWTO forecasts that international tourism will grow at a rate between 3% and 4% in 2015.
Europe remains the largest tourist destination in terms of international
tourism receipts11, with the region receiving 41% (US$511.6 billion) of global tourism expenditure in 2014 (Figure 10). The Asia Pacific region was the second largest receiver of tourism expenditure (30% of global expenditure with US$377.0 billion). Tourism receipts in Asia Pacific grew by 4.6% in 2014 compared with the previous year.
The Chinese continued to be the world’s largest spender on tourism activity: in 2014 they spent US$164.9 billion on international tourism. Chinese expenditure grew by 28.2% compared with the previous year.
Travellers from the USA were the second largest spender with US$110.8 billion in 2014 (a growth of 5.8%) (Figure 11).
10 Note: Global tourism data are provided by the UNWTO’s World Tourism Barometer.
11 International tourism receipts are the receipts earned by a destination country from inbound tourism and cover all tourism receipts resulting from expenditure made by visitors from abroad. This concept includes receipts generated by overnight as well as by same-day trips by visitors from neighbouring countries. It excludes the receipts related to international transport contracted by residents of other countries (e.g. ticket receipts from foreigners travelling with a national company).
Page 16 of 33Page 15 of 33
Figure 11 International tourism expenditure (outbound tourism) for key source countries for Australia (Source: United Nations World Tourism Organisation, 2015).
Figure 11
Tour
ism
exp
end
iture
(US
$ b
illio
n)
180
160
140
120
100
80
60
40
20
0
Chi
na
New
Zea
land
Uni
ted
Kin
gdom
Japa
n
Sin
gap
ore
Mal
aysi
a
US
A
Ind
ia
Hon
g K
ong
Kor
ea
Ger
man
y
Taiw
an
Can
ada
Expenditure 2013 (US $ billion)
Expenditure 2014 (US $ billion)
1300
1200
1100
1000
900
800
700
600
500
400
Glo
bal t
ouris
m e
xpen
ditu
re (U
S$b
illio
n)
2010
2011
2012
2013
2014
966
1,082 1,1171,198
1,248Figure 9
Figure 9 Global tourism expenditure (US$ billion) for the last five years (Source: United Nations World Tourism Organisation, 2015).
Figure 10
1400
1200
1000
800
600
400
200
0World Europe Asia and
the PacificAmericas Africa Middle East
Receipts 2014 (US $ billion)
Receipts 2013 (US $ billion)
Tour
ism
rec
eipt
s by
reg
ion
(US
$ b
illio
n)
Figure 10 International tourism receipts in world regions (Source: United Nations World Tourism Organisation, 2015).

7. Tourism insights: new experiences for young Chinese travellers
To remain a leading Australian leisure tourism destination, the Gold Coast needs to develop new experiential products. Here we offer new insights into young Chinese travellers from a mixed method study that used focus groups and surveys to assist Gold Coast businesses with improving existing and developing new tourism experiences. Eight focus groups (7 with Chinese and 1 with mixed nationalities) were conducted with four to eight participants studying English language and undergraduate degree programs at Griffith University and The University of Queensland in Queensland, Australia. In addition, a survey was completed by 366 international students living and studying in Australia, with 80% being from China.
Marketing to young Chinese travellers requires a different approach to more traditional markets. This is a mobile-savvy market with the majority having smartphones. As a result, they want to use Chinese mobile phone based applications, such as WeChat. They particularly use their smartphones to take photos to show friends and family what they are doing while in Australia and that they are safe and healthy. They also use their smartphones to get around and find locations. Indeed, they wanted to be able to navigate around attractions using their smartphone and desired technology-based interpretation and translation. Importantly, they want
websites to use simple English words with lots of pictures.
Young Chinese travellers are quite conservative, with only 10-20% being “adventure seekers”. The market generally likes to stay within their comfort zone. Most students were interested in visiting or had visited the major cities or iconic tourist attractions (such as the Great Barrier Reef or Uluru) while in Australia. They chose these destinations because they are familiar ‘must see’ iconic attractions. Most did not want to visit regional destinations and the notion of getting out and dispersing in regional areas was not particularly attractive. To attract them to visit regional areas there needs to be an iconic or one-of-a-kind attraction.
Most young Chinese travellers we talked to had visited the Gold Coast theme parks, but they did not know about other Gold Coast tourism products (e.g. surfing, jet boating, kayaking). They felt these products were outside their ‘comfort zone’. To feel comfortable about a new product, this market needs to be able to relate an activity to something they were already familiar with. For example, young Chinese travellers loved Australian koalas as they can relate these animals to their own panda bears. By drawing links with something they are familiar with, such as highlighting similarities between Chinese mythology and Australian Aboriginal dreamtime
stories, a new product can be introduced in a more appealing way.
Young Chinese travellers are often in Australia to study. Their leisure time is often spent shopping or “hanging out” with friends. They enjoy looking at the beach, but do not swim. There are significant cultural differences between young Australian and young Chinese travellers in their attitudes to the beach and water based activities. Fear of the open surf and avoidance of the sun are key concerns of young Chinese travellers and most cannot swim. So, they generally prefer more passive, rather than active, activities at the beach – such as observing the beauty and atmosphere. Regardless, the beach is very attractive to this market and is a key motivation for visiting the Gold Coast over other destinations.
For more information, contact: Dr Sarah Gardiner ([email protected]) or Professor Noel Scott ([email protected]), or visit the Griffith Institute for Tourism website: https://www.griffith.edu.au/business-government/griffith-institute-tourism
Page 18 of 33Page 17 of 33
Page 19 of 33 Page 20 of 33
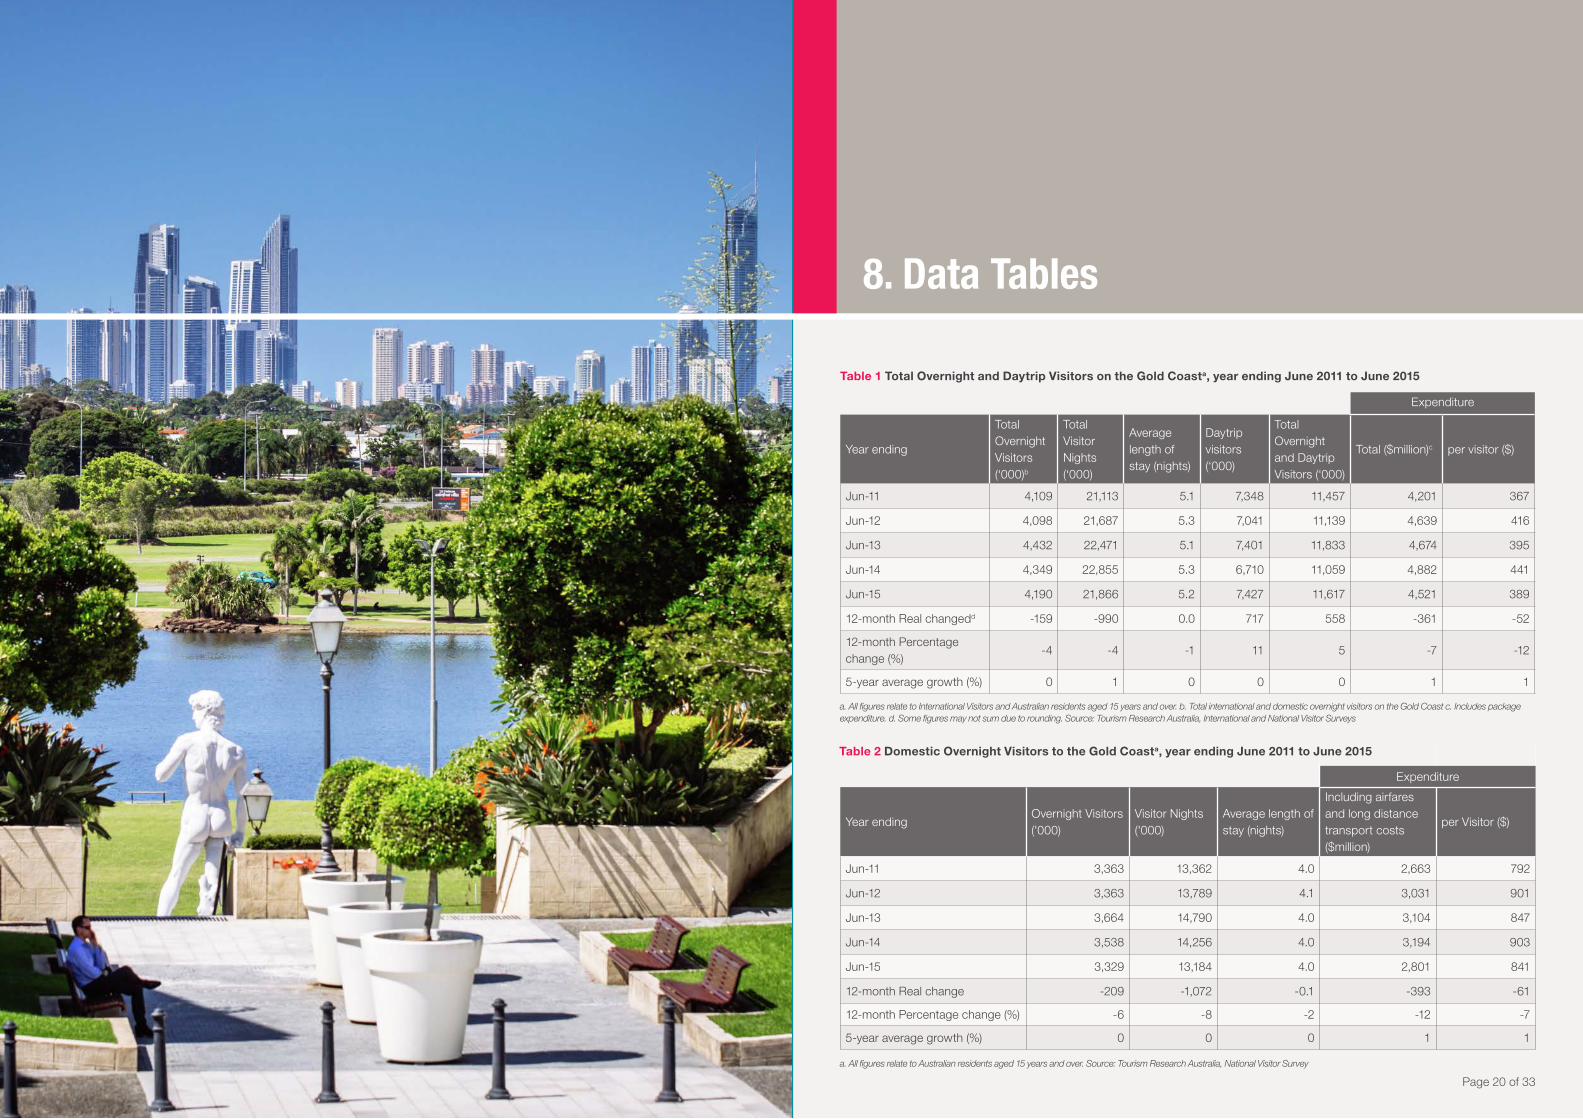
8. Data Tables
Expenditure
Year ending
Total Overnight Visitors (‘000)b
Total Visitor Nights (‘000)
Average length of stay (nights)
Daytrip visitors (‘000)
Total Overnight and Daytrip Visitors (‘000)
Total ($million)c per visitor ($)
Jun-11 4,109 21,113 5.1 7,348 11,457 4,201 367
Jun-12 4,098 21,687 5.3 7,041 11,139 4,639 416
Jun-13 4,432 22,471 5.1 7,401 11,833 4,674 395
Jun-14 4,349 22,855 5.3 6,710 11,059 4,882 441
Jun-15 4,190 21,866 5.2 7,427 11,617 4,521 389
12-month Real changedd -159 -990 0.0 717 558 -361 -52
12-month Percentage change (%)
-4 -4 -1 11 5 -7 -12
5-year average growth (%) 0 1 0 0 0 1 1
Table 1 Total Overnight and Daytrip Visitors on the Gold Coasta, year ending June 2011 to June 2015
a. All figures relate to International Visitors and Australian residents aged 15 years and over. b. Total international and domestic overnight visitors on the Gold Coast c. Includes package expenditure. d. Some figures may not sum due to rounding. Source: Tourism Research Australia, International and National Visitor Surveys
Expenditure
Year endingOvernight Visitors ('000)
Visitor Nights ('000)
Average length of stay (nights)
Including airfares and long distance transport costs ($million)
per Visitor ($)
Jun-11 3,363 13,362 4.0 2,663 792
Jun-12 3,363 13,789 4.1 3,031 901
Jun-13 3,664 14,790 4.0 3,104 847
Jun-14 3,538 14,256 4.0 3,194 903
Jun-15 3,329 13,184 4.0 2,801 841
12-month Real change -209 -1,072 -0.1 -393 -61
12-month Percentage change (%) -6 -8 -2 -12 -7
5-year average growth (%) 0 0 0 1 1
a. All figures relate to Australian residents aged 15 years and over. Source: Tourism Research Australia, National Visitor Survey
Table 2 Domestic Overnight Visitors to the Gold Coasta, year ending June 2011 to June 2015
Page 20 of 33
Page 21 of 33 Page 22 of 33
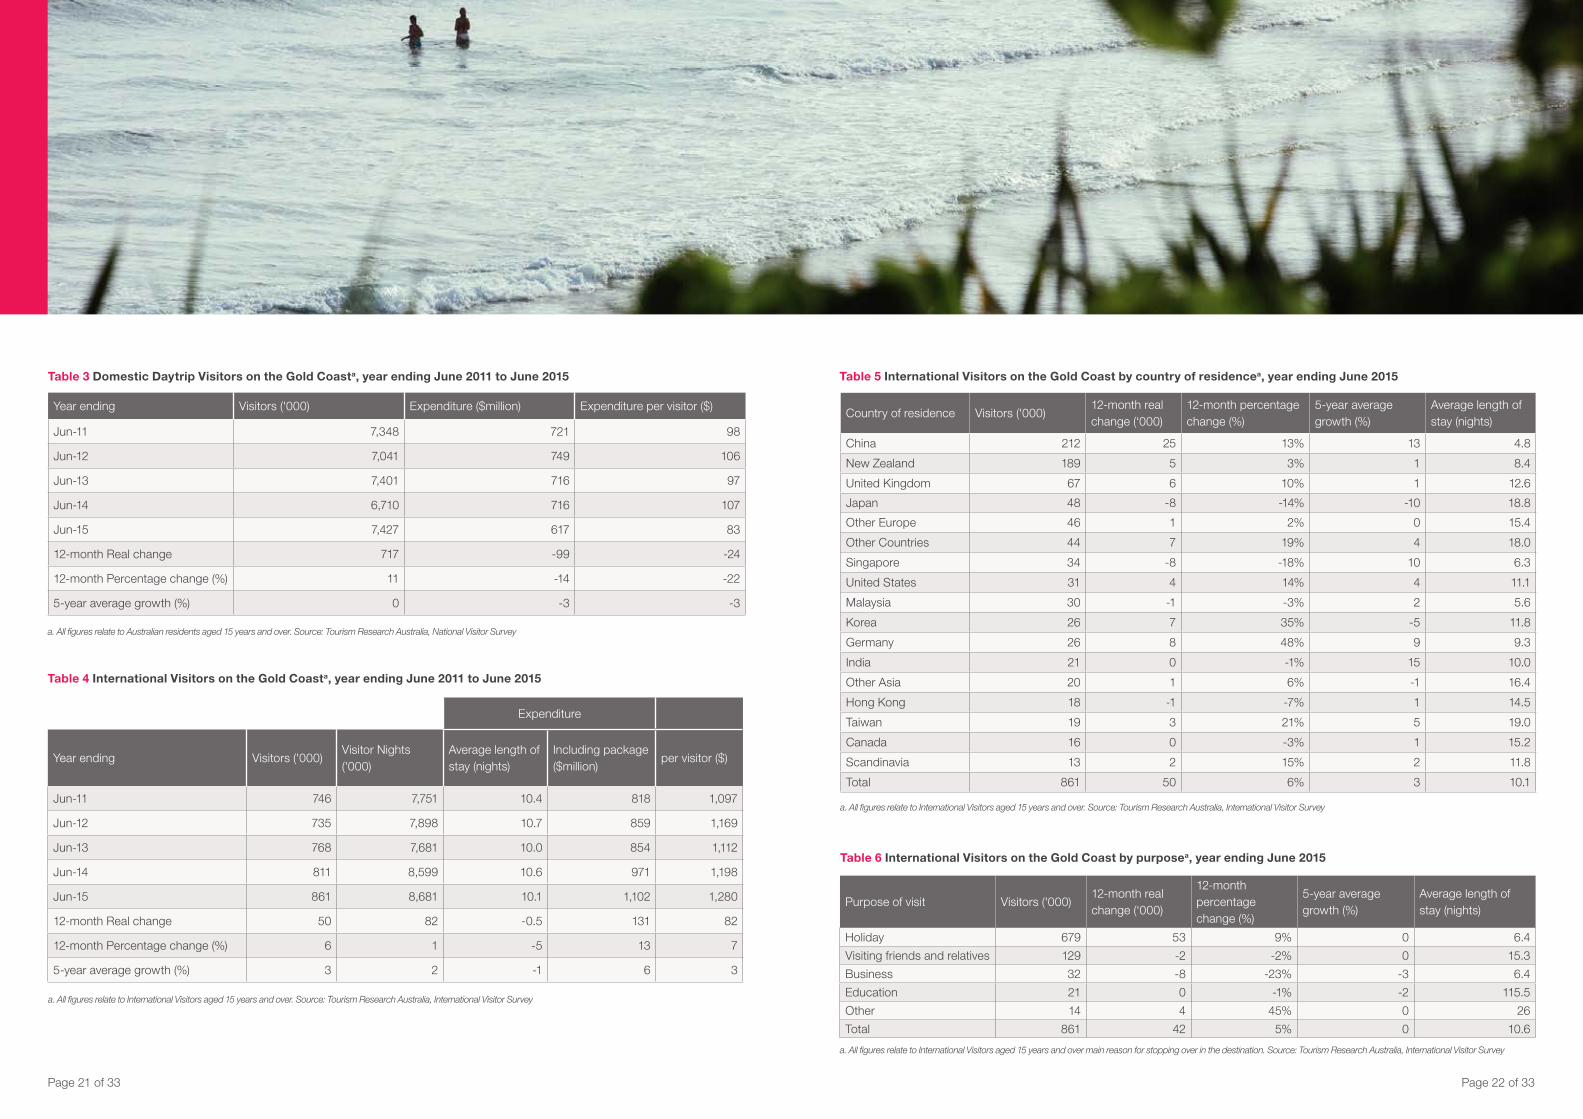
Table 3 Domestic Daytrip Visitors on the Gold Coasta, year ending June 2011 to June 2015
a. All figures relate to Australian residents aged 15 years and over. Source: Tourism Research Australia, National Visitor Survey
Year ending Visitors ('000) Expenditure ($million) Expenditure per visitor ($)
Jun-11 7,348 721 98
Jun-12 7,041 749 106
Jun-13 7,401 716 97
Jun-14 6,710 716 107
Jun-15 7,427 617 83
12-month Real change 717 -99 -24
12-month Percentage change (%) 11 -14 -22
5-year average growth (%) 0 -3 -3
Expenditure
Year ending Visitors ('000)Visitor Nights ('000)
Average length of stay (nights)
Including package ($million)
per visitor ($)
Jun-11 746 7,751 10.4 818 1,097
Jun-12 735 7,898 10.7 859 1,169
Jun-13 768 7,681 10.0 854 1,112
Jun-14 811 8,599 10.6 971 1,198
Jun-15 861 8,681 10.1 1,102 1,280
12-month Real change 50 82 -0.5 131 82
12-month Percentage change (%) 6 1 -5 13 7
5-year average growth (%) 3 2 -1 6 3
a. All figures relate to International Visitors aged 15 years and over. Source: Tourism Research Australia, International Visitor Survey
Country of residence Visitors ('000)12-month real change (‘000)
12-month percentage change (%)
5-year average growth (%)
Average length of stay (nights)
China 212 25 13% 13 4.8
New Zealand 189 5 3% 1 8.4
United Kingdom 67 6 10% 1 12.6
Japan 48 -8 -14% -10 18.8
Other Europe 46 1 2% 0 15.4
Other Countries 44 7 19% 4 18.0
Singapore 34 -8 -18% 10 6.3
United States 31 4 14% 4 11.1
Malaysia 30 -1 -3% 2 5.6
Korea 26 7 35% -5 11.8
Germany 26 8 48% 9 9.3
India 21 0 -1% 15 10.0
Other Asia 20 1 6% -1 16.4
Hong Kong 18 -1 -7% 1 14.5
Taiwan 19 3 21% 5 19.0
Canada 16 0 -3% 1 15.2
Scandinavia 13 2 15% 2 11.8
Total 861 50 6% 3 10.1
Table 5 International Visitors on the Gold Coast by country of residencea, year ending June 2015
a. All figures relate to International Visitors aged 15 years and over. Source: Tourism Research Australia, International Visitor Survey
Purpose of visit Visitors ('000)12-month real change (‘000)
12-month percentage change (%)
5-year average growth (%)
Average length of stay (nights)
Holiday 679 53 9% 0 6.4
Visiting friends and relatives 129 -2 -2% 0 15.3
Business 32 -8 -23% -3 6.4
Education 21 0 -1% -2 115.5
Other 14 4 45% 0 26
Total 861 42 5% 0 10.6
Table 6 International Visitors on the Gold Coast by purposea, year ending June 2015
Table 4 International Visitors on the Gold Coasta, year ending June 2011 to June 2015
a. All figures relate to International Visitors aged 15 years and over main reason for stopping over in the destination. Source: Tourism Research Australia, International Visitor Survey
Page 24 of 33Page 23 of 33
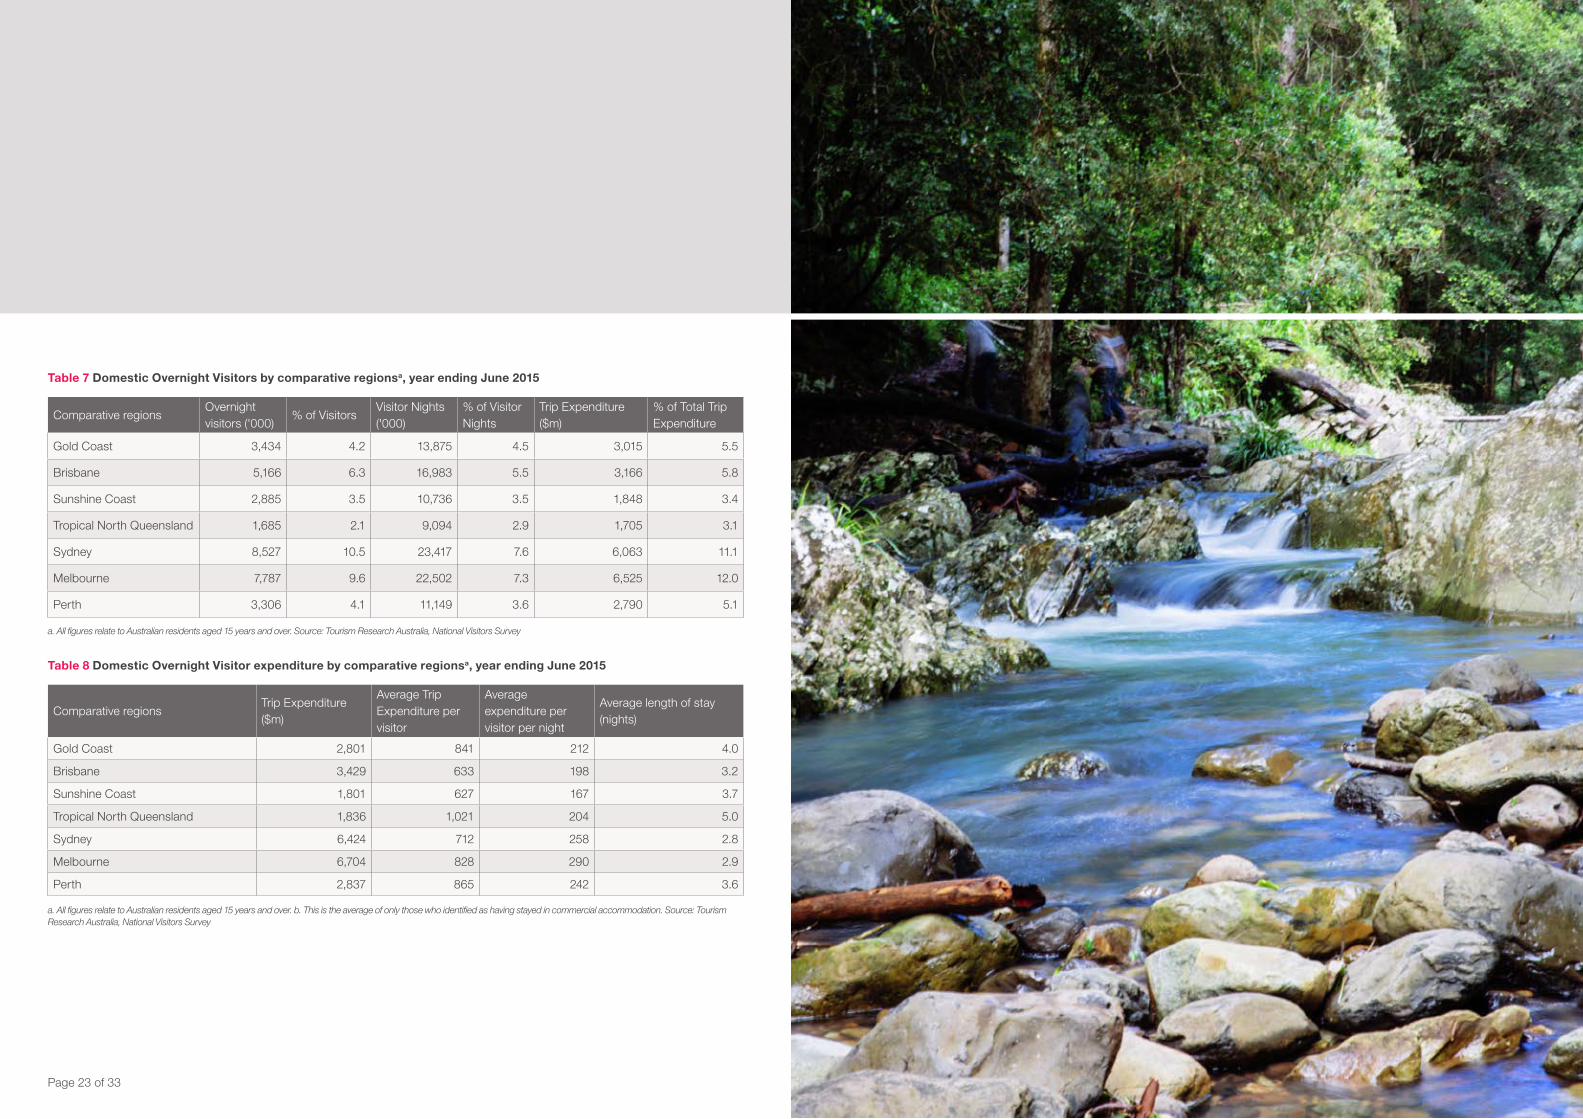
Table 7 Domestic Overnight Visitors by comparative regionsa, year ending June 2015
Comparative regionsOvernight visitors ('000)
% of VisitorsVisitor Nights ('000)
% of Visitor Nights
Trip Expenditure ($m)
% of Total Trip Expenditure
Gold Coast 3,434 4.2 13,875 4.5 3,015 5.5
Brisbane 5,166 6.3 16,983 5.5 3,166 5.8
Sunshine Coast 2,885 3.5 10,736 3.5 1,848 3.4
Tropical North Queensland 1,685 2.1 9,094 2.9 1,705 3.1
Sydney 8,527 10.5 23,417 7.6 6,063 11.1
Melbourne 7,787 9.6 22,502 7.3 6,525 12.0
Perth 3,306 4.1 11,149 3.6 2,790 5.1
Comparative regionsTrip Expenditure ($m)
Average Trip Expenditure per visitor
Average expenditure per visitor per night
Average length of stay (nights)
Gold Coast 2,801 841 212 4.0
Brisbane 3,429 633 198 3.2
Sunshine Coast 1,801 627 167 3.7
Tropical North Queensland 1,836 1,021 204 5.0
Sydney 6,424 712 258 2.8
Melbourne 6,704 828 290 2.9
Perth 2,837 865 242 3.6
Table 8 Domestic Overnight Visitor expenditure by comparative regionsa, year ending June 2015
a. All figures relate to Australian residents aged 15 years and over. Source: Tourism Research Australia, National Visitors Survey
a. All figures relate to Australian residents aged 15 years and over. b. This is the average of only those who identified as having stayed in commercial accommodation. Source: Tourism Research Australia, National Visitors Survey
Page 26 of 33
Comparative regionsVisitors ('000)
% of VisitorsTrip Expenditure ($m)
% of Trip Expenditure
Average Trip Expenditure per Visitor
Gold Coast 6,874 4.2 603 3.4 88
Brisbane 11,182 6.8 1,180 6.6 106
Sunshine Coast 5,484 3.3 546 3.0 100
Tropical North Queensland 2,173 1.3 231 1.3 106
Sydney 18,937 11.5 2,010 11.2 106
Melbourne 16,403 10.0 1,830 10.2 112
Perth 11,068 6.7 1,088 6.1 98
Table 9 Domestic Daytrip visitors by comparative regions, year ending June 2015a
a. All figures relate to Australian residents aged 15 years and over. Source: Tourism Research Australia, National Visitors Survey
Comparative regions Visitors ('000) % of VisitorsVisitor Nights ('000)
% of Visitor Nights
Regional Expenditure ($m)
% of Regional Expenditure
Gold Coast 861 13.1 8,681 5.0 1,102 5.0
Brisbane 1,066 16.2 23,061 8.1 1,782 8.1
Sunshine Coast 257 3.9 2,519 0.9 194 0.9
Tropical North Queensland 759 11.6 6,801 4.5 1,000 4.5
Sydney 3,096 47.1 67,312 31.1 6,881 31.1
Melbourne 2,166 33.0 48,308 23.7 5,252 23.7
Perth 783 11.9 23,011 8.8 1,954 8.8
Table 10 International visitors by comparative regions, year ending June 2015a
a. Estimates are for International Visitors aged 15 years and over. Source: Tourism Research Australia, International Visitors Survey
Comparative regionsRegional Expenditure ($m)
Average Regional Expenditure per visitor
Average Regional expenditure per visitor per night
Average length of stay (nights)
Gold Coast 1,102 1,280 127 10.1
Brisbane 1,782 2,497 77 21.6
Sunshine Coast 194 754 77 9.8
Tropical North Queensland 1,000 1,318 147 9.0
Sydney 6,881 1,671 102 21.7
Melbourne 5,252 2,425 109 22.3
Perth 1,954 2,222 85 29.4
Table 11 International Visitors expenditure and average length of stay by comparative regionsa, year ending June 2015
a. Estimates are for International Visitors aged 15 years and over. Source: Tourism Research Australia, International Visitors Survey
Page 25 of 33
Occupancy (%) Revenue per available room ($)
Six months to June 2015
% Change from previous year
Six months to June 2015
% Change from previous year
Australia 74.3 1.4 134.9 3.4
Gold Coast 69.9 3.9 118.7 8.0
Adelaide 76.5 -4.2 115.5 -4.6
Brisbane 72.8 -3.3 126.4 -5.6
Cairns 73.4 8.2 89.7 10.2
Canberra 72.5 6.1 118.0 6.8
Melbourne 81.6 1.4 152.8 3.8
Perth 81.0 -1.5 161.8 -2.9
Sydney 84.6 2.3 175.3 6.9
Darwin 64.2 -10.0 106.8 -12.7
Hobart 82.3 2.8 135.6 5.2
New Zealand 77.5 4.8 119.2 14.4
Auckland 81.6 0.0 132.4 12.4
Queenstown 76.1 8.4 123.1 16.8
Wellington 77.9 6.3 124.4 15.2
Table 12 Comparison of accommodation occupancy and RevPAR six months to June 2015 compared with the six months to June 2014 for key destinations in Australia and New Zealand
Page 28 of 33
Table 14 Gold Coast business sentiment for three 3-month periods in the 2014/2015 financial year (Source: Spence Consulting)
Page 27 of 33
Revenue (‘000) % Change Visitation % Change
Theme Parks (Ardent) 99,571,000 -0.6 2,281,606 11.7%
Village Roadshow 278,500,000 -1.4 5,200,000 -3.8%
Currumbin Wildlife Sanctuary 17,108,000 8.2% 433,301 6.4%
Table 13 Revenue and visitation at Ardent Leisure Group and Village Roadshow theme Parks and Currumbin Wildlife Sanctuary, Gold Coast (Source: Ardent Leisure Group and Village Roadshow Annual Reports full year ended June 2015)
What is your level of confidence over the next three months regarding the …. ?
Aug-14 Nov-14 May-15 Aug-15
Gold Coast economy generally Highly positive 6% 13% 3% 9%
Positive 54% 56% 47% 63%
Neutral 31% 24% 36% 21%
Negative 9% 6% 9% 4%
Highly negative 0% 1% 5% 3%
Gold Coast property market Highly positive 6% 10% 63% 7%
Positive 62% 54% 25% 59%
Neutral 23% 35% 7% 28%
Negative 8% 1% 0% 6%
Highly negative 0% 0% 4% 0%
Gold Coast tourism market Highly positive 14% 27% 57% 12%
Positive 57% 57% 30% 57%
Neutral 29% 15% 9% 27%
Negative 0% 1% 0% 4%
Highly negative 0% 0% 0% 0%
Gold Coast retail market Highly positive 0% 7% 34% 3%
Positive 40% 53% 50% 43%
Neutral 37% 39% 13% 47%
Negative 23% 1% 3% 7%
Highly negative 0% 0% 3% 0%
Table 15 Total Overnight and Daytrip Visitors in Australiaa, June 2011 to June 2015
Year endingTotal Overnight Visitors ('000)b
Total Visitor nights ('000)
Average length of stay
Daytrip visitors ('000)
Total expenditure in Australia ($000)c
Expenditure per visitor ($)c
Jun-11 76,347 456,438 6.0 156,287 79,407 341
Jun-12 78,807 477,004 6.1 168,847 85,547 345
Jun-13 80,982 500,765 6.2 167,857 88,758 357
Jun-14 85,257 512,613 6.0 165,237 91,589 366
Jun-15 89,796 548,932 6.1 169,108 96,011 371
12-month Real change 4,539 36,319 0 3,871 4,423 5
12-month Percentage change (%) 5 7 2 2 5 1
5-year average growth (%) 3 4 0 2 4 2
a. All figures relate to International Visitors and Australian residents aged 15 years and over. b. Total international and domestic overnight visitors in Australia. c. Includes international and domestic overnight visitor expenditure, as well as daytrip expenditure. Source: Tourism Research Australia, International and National Visitor Surveys
Table 16 Domestic Overnight Visitors in Australiaa, year ending June 2011 to June 2015
Year endingOvernight trips (‘000)
Nights (‘000)Average length of stay
Total Expenditure in Australia ($000)
Expenditure per visitor ($)
Jun-11 70,977 266,235 3.8 46,588,920 656
Jun-12 73,369 278,348 3.8 49,826,532 679
Jun-13 75,268 286,056 3.8 51,442,035 683
Jun-14 79,096 294,980 3.7 53,297,712 674
Jun-15 83,229 313,383 3.8 55,425,704 666
12-month Real change 4,133 18,403 0.0 2,127,992 -8
12-month Percentage change (%) 5 6 1 4 -1
5-year average growth (%) 3 3 0 4 0
a. All figures relate to Australian residents aged 15 years and over. Source: Tourism Research Australia, National Visitor Survey
Page 29 of 33
Year ending Daytrips (‘000) Expenditure ($000) Expenditure per visitor ($)
Jun-11 156,287 15,157,562 97
Jun-12 168,847 17,544,380 104
Jun-13 167,857 18,065,154 108
Jun-14 165,237 18,230,931 110
Jun-15 169,108 18,282,986 108
12-month Real change 3,871 52,055 -2
12-month Percentage change (%) 2 0 -2
5 year annual average (%) 2 4 2
Table 17 Domestic Daytrip Visitors in Australiaa, year ending June 2011 to June 2015
a. All figures relate to Australian residents aged 15 years and over. Source: Tourism Research Australia, National Visitor Survey
Table 18 International Visitors to Australiaa, year ending June 2011 to June 2015
Year ending Visitors ('000)Visitor nights ('000)
Average length of stay
Total expenditure in Australia ($000)
Expenditure per visitor ($)
Jun-11 5,370 190,203 35.4 17,660 3,289
Jun-12 5,438 198,656 36.5 18,176 3,342
Jun-13 5,714 214,709 37.6 19,251 3,369
Jun-14 6,161 217,633 35.3 20,060 3,256
Jun-15 6,567 235,549 35.9 22,303 3,396
12-month Real change 406 17,916 1 2,243 140
12-month Percentage change (%) 7 8 2 11 4
5-year average growth (%) 4 4 0 5 1
a. All figures relate to International Visitors aged 15 years and over. Source: Tourism Research Australia, International Visitor Survey
Page 30 of 33
Table 19 Outbound trips by Australian residentsa, nights and expenditure, year ending March 2015
Year endingOutbound Trips ('000)
Nights on trip ('000)
Average length of stay
Expenditure ($000)
Expenditure per visitor ($)
Mar-11 6,467 131,321 20.3 38,135,546 5,897
Mar-12 7,032 143,377 20.4 42,595,844 6,057
Mar-13 7,341 147,761 20.1 44,619,757 6,078
Mar-14 7,925 161,466 20.4 47,322,171 5,971
Mar-15 8,187 161,115 19.7 48,851,396 5,967
12-month Real change 262 -351 -0.7 1,529,225 -4
12-month Percentage change (%) 3 0 -3 3 0
5-year average growth (%) 5 4 -1 5 0
a. All figures relate to Australian residents aged 15 years and over. Source: Tourism Research Australia, National Visitor Survey
Page 31 of 33 Page 31 of 33
Table 19 Outbound trips by Australian residentsa, nights and expenditure, year ending March 2015
Year endingOutbound Trips ('000)
Nights on trip ('000)
Average length of stay
Expenditure ($000)
Expenditure per visitor ($)
Mar-11 6,467 131,321 20.3 38,135,546 5,897
Mar-12 7,032 143,377 20.4 42,595,844 6,057
Mar-13 7,341 147,761 20.1 44,619,757 6,078
Mar-14 7,925 161,466 20.4 47,322,171 5,971
Mar-15 8,187 161,115 19.7 48,851,396 5,967
12-month Real change 262 -351 -0.7 1,529,225 -4
12-month Percentage change (%) 3 0 -3 3 0
5-year average growth (%) 5 4 -1 5 0
a. All figures relate to Australian residents aged 15 years and over. Source: Tourism Research Australia, National Visitor Survey
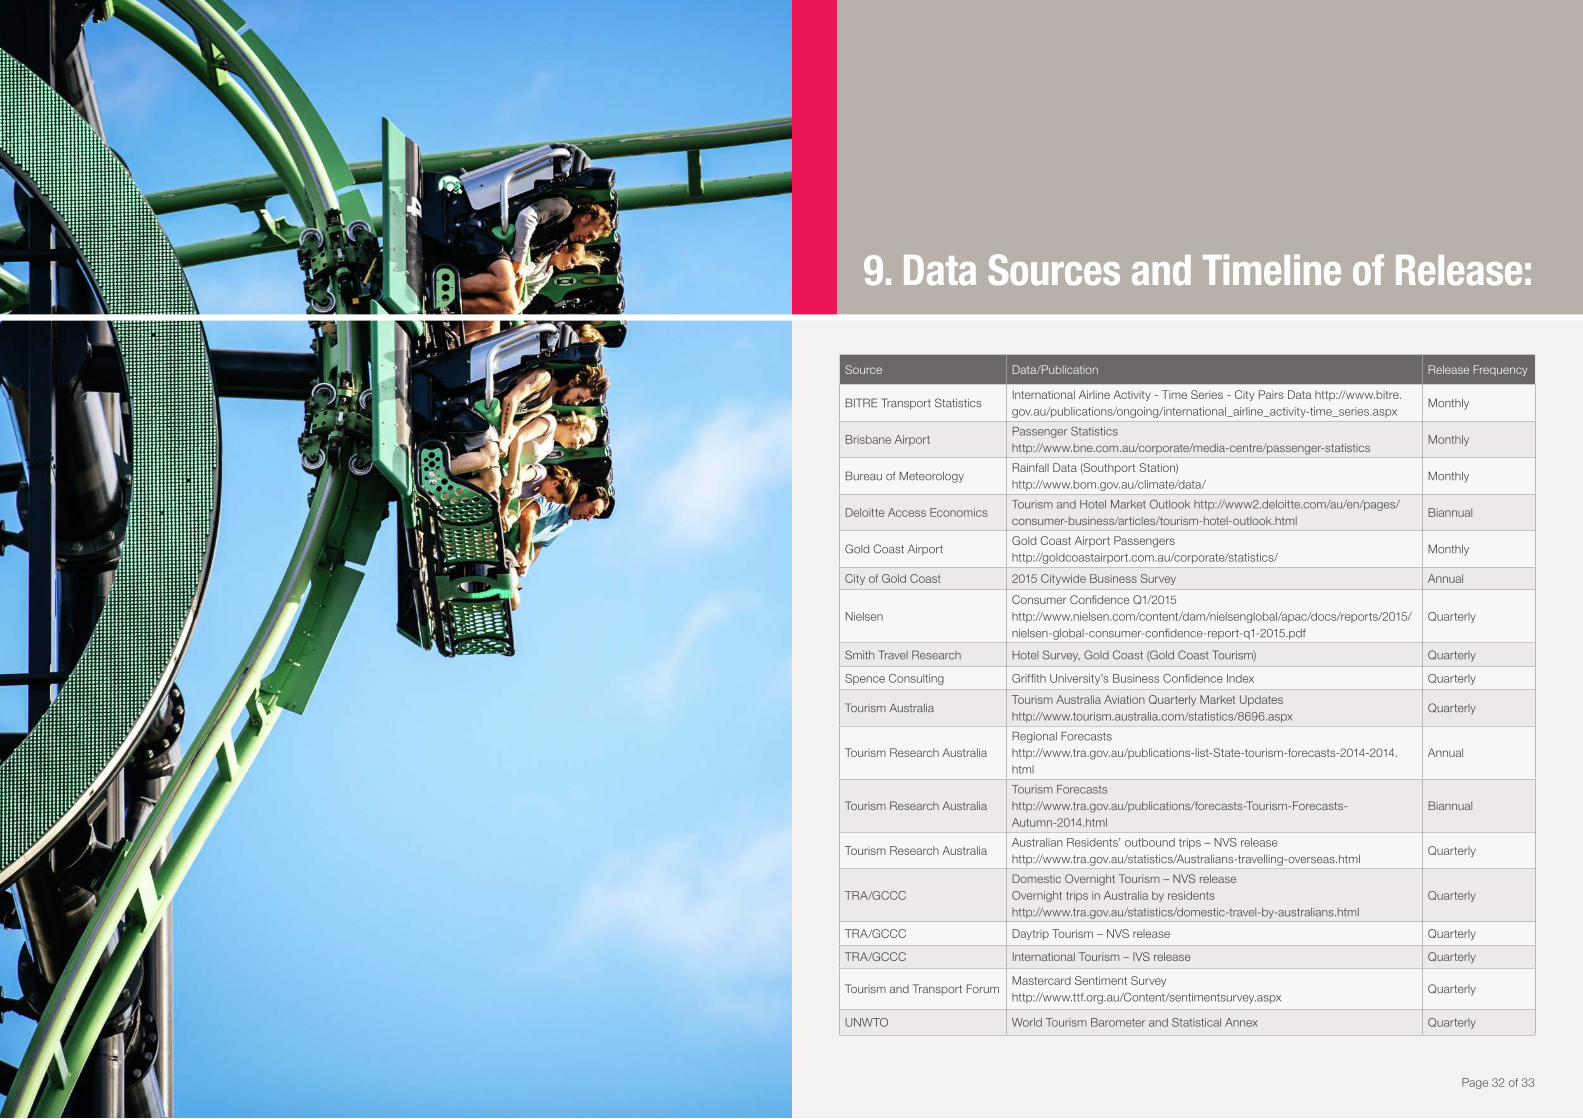
9. Data Sources and Timeline of Release:
Source Data/Publication Release Frequency
BITRE Transport StatisticsInternational Airline Activity - Time Series - City Pairs Data http://www.bitre.gov.au/publications/ongoing/international_airline_activity-time_series.aspx
Monthly
Brisbane AirportPassenger Statisticshttp://www.bne.com.au/corporate/media-centre/passenger-statistics
Monthly
Bureau of MeteorologyRainfall Data (Southport Station)http://www.bom.gov.au/climate/data/
Monthly
Deloitte Access EconomicsTourism and Hotel Market Outlook http://www2.deloitte.com/au/en/pages/consumer-business/articles/tourism-hotel-outlook.html
Biannual
Gold Coast AirportGold Coast Airport Passengershttp://goldcoastairport.com.au/corporate/statistics/
Monthly
City of Gold Coast 2015 Citywide Business Survey Annual
NielsenConsumer Confidence Q1/2015http://www.nielsen.com/content/dam/nielsenglobal/apac/docs/reports/2015/nielsen-global-consumer-confidence-report-q1-2015.pdf
Quarterly
Smith Travel Research Hotel Survey, Gold Coast (Gold Coast Tourism) Quarterly
Spence Consulting Griffith University’s Business Confidence Index Quarterly
Tourism AustraliaTourism Australia Aviation Quarterly Market Updateshttp://www.tourism.australia.com/statistics/8696.aspx
Quarterly
Tourism Research AustraliaRegional Forecastshttp://www.tra.gov.au/publications-list-State-tourism-forecasts-2014-2014.html
Annual
Tourism Research AustraliaTourism Forecastshttp://www.tra.gov.au/publications/forecasts-Tourism-Forecasts-Autumn-2014.html
Biannual
Tourism Research AustraliaAustralian Residents’ outbound trips – NVS releasehttp://www.tra.gov.au/statistics/Australians-travelling-overseas.html
Quarterly
TRA/GCCCDomestic Overnight Tourism – NVS release Overnight trips in Australia by residentshttp://www.tra.gov.au/statistics/domestic-travel-by-australians.html
Quarterly
TRA/GCCC Daytrip Tourism – NVS release Quarterly
TRA/GCCC International Tourism – IVS release Quarterly
Tourism and Transport ForumMastercard Sentiment Survey http://www.ttf.org.au/Content/sentimentsurvey.aspx
Quarterly
UNWTO World Tourism Barometer and Statistical Annex Quarterly
Page 32 of 33
Page 33 of 33