gold coast, australia keynote jan 2010
TRANSCRIPT
Climate Change and Real Estate
From
Global Research to
Local Practice
January 18, 2011Keynote Address
by
Govindan (“Govind”) NairLead Economist, The World Bank, Washington DC, USA
(retired)President, Hemispheres Solutions LLC, Virginia USAAdjunct Professor, The George Washington University, USA
[email protected]@gwu.edu
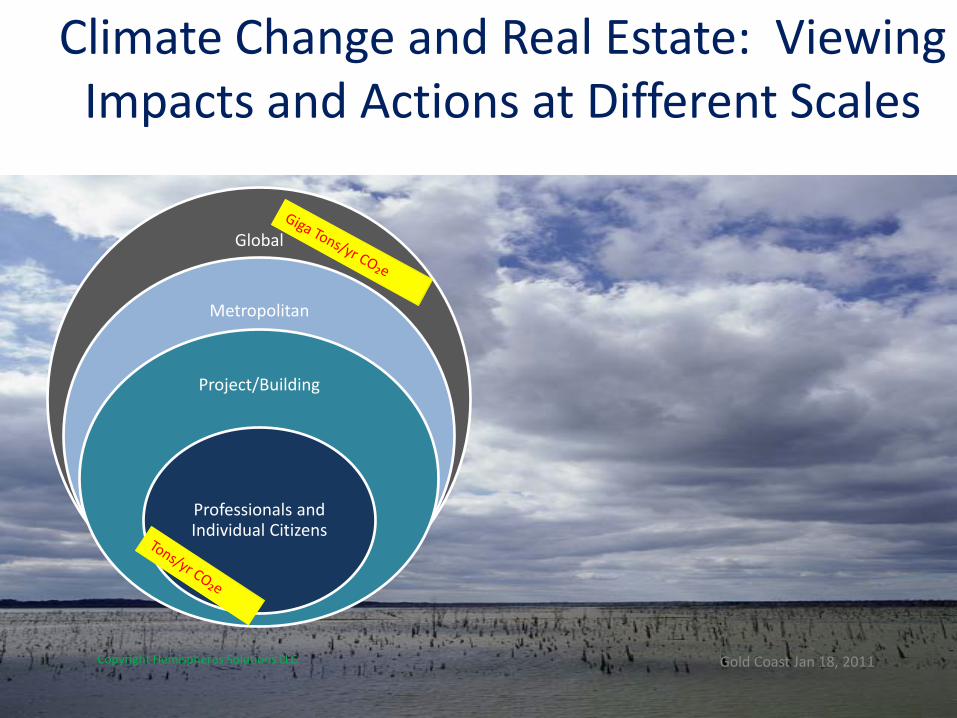
Climate Change and Real Estate: Viewing Impacts and Actions at Different Scales
Global
Metropolitan
Project/Building
Professionals and Individual Citizens
Gold Coast Jan 18, 2011Copyright Hemispheres Solutions LLC
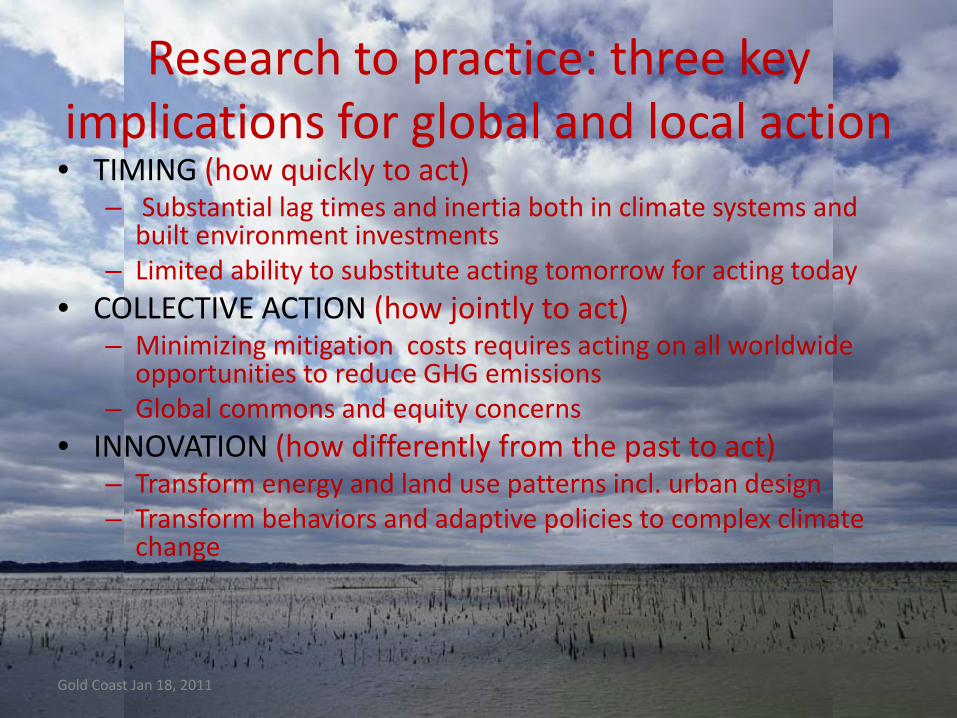
Research to practice: three key implications for global and local action
Gold Coast Jan 18, 2011
• TIMING (how quickly to act)– Substantial lag times and inertia both in climate systems and
built environment investments– Limited ability to substitute acting tomorrow for acting today
• COLLECTIVE ACTION (how jointly to act)– Minimizing mitigation costs requires acting on all worldwide
opportunities to reduce GHG emissions– Global commons and equity concerns
• INNOVATION (how differently from the past to act)– Transform energy and land use patterns incl. urban design– Transform behaviors and adaptive policies to complex climate
change

Research to practice: normative framework
Gold Coast Jan 18, 2011
• TIMING (how quickly to act)– Substantial lag times and inertia both in climate systems and
built environment investments– Limited ability to substitute acting tomorrow for acting today
• COLLECTIVE ACTION (how jointly to act)– Minimizing mitigation costs requires acting on all worldwide
opportunities to reduce GHG emissions– Global commons and equity concerns
• INNOVATION (how differently from the past to act)– Transform energy and land use patterns incl. urban design– Transform behaviors and adaptive policies to complex climate
change
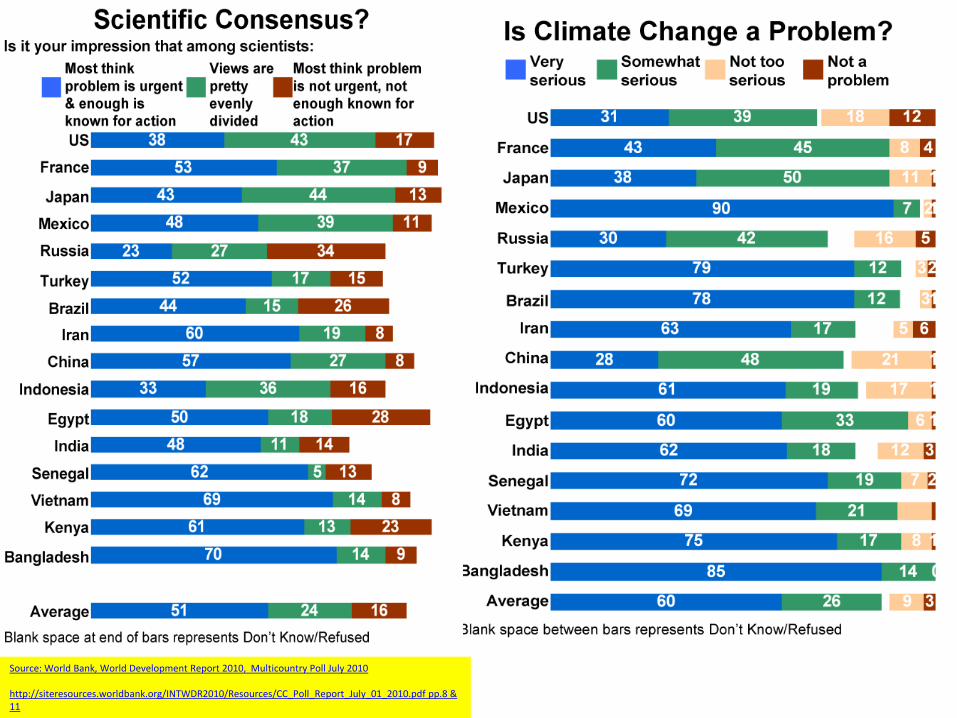
Gold Coast Jan 18, 2011Source: World Bank, World Development Report 2010, Multicountry Poll July 2010
http://siteresources.worldbank.org/INTWDR2010/Resources/CC_Poll_Report_July_01_2010.pdf pp.8 & 11

How U.S. public attitudes to climate change have evolved
Gold Coast Jan 18, 2011
Source: http://environment.yale.edu/climate/files/SixAmericasJune2010.pdf
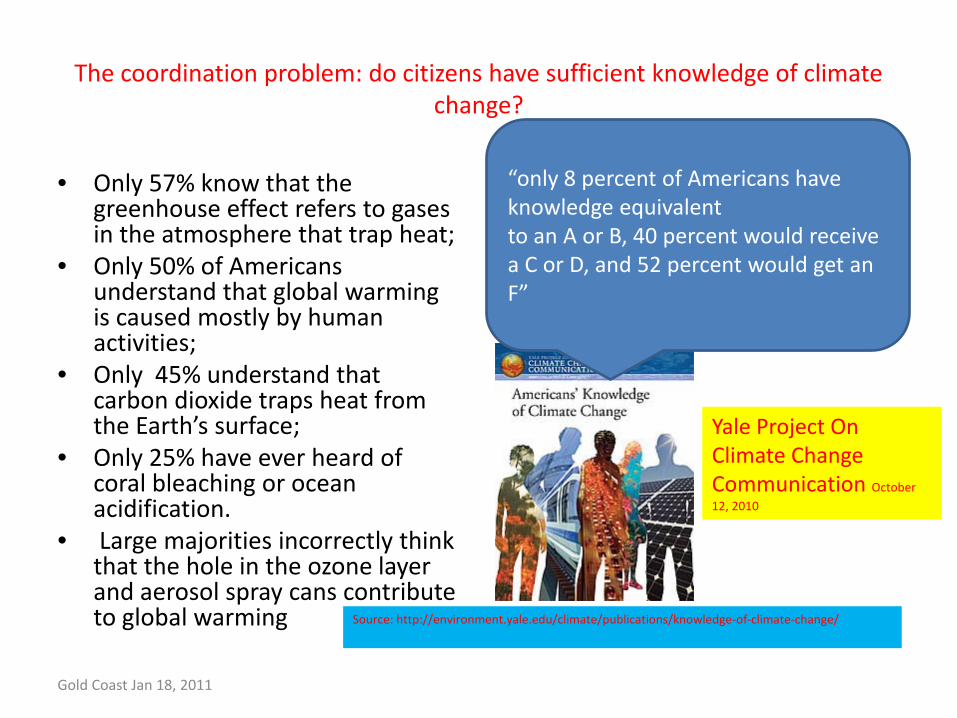
The coordination problem: do citizens have sufficient knowledge of climate change?
• Only 57% know that the greenhouse effect refers to gases in the atmosphere that trap heat;
• Only 50% of Americans understand that global warming is caused mostly by human activities;
• Only 45% understand that carbon dioxide traps heat from the Earth’s surface;
• Only 25% have ever heard of coral bleaching or ocean acidification.
• Large majorities incorrectly think that the hole in the ozone layer and aerosol spray cans contribute to global warming
Gold Coast Jan 18, 2011
“only 8 percent of Americans have knowledge equivalentto an A or B, 40 percent would receive a C or D, and 52 percent would get an F”
Source: http://environment.yale.edu/climate/publications/knowledge-of-climate-change/
Yale Project On Climate Change Communication October 12, 2010
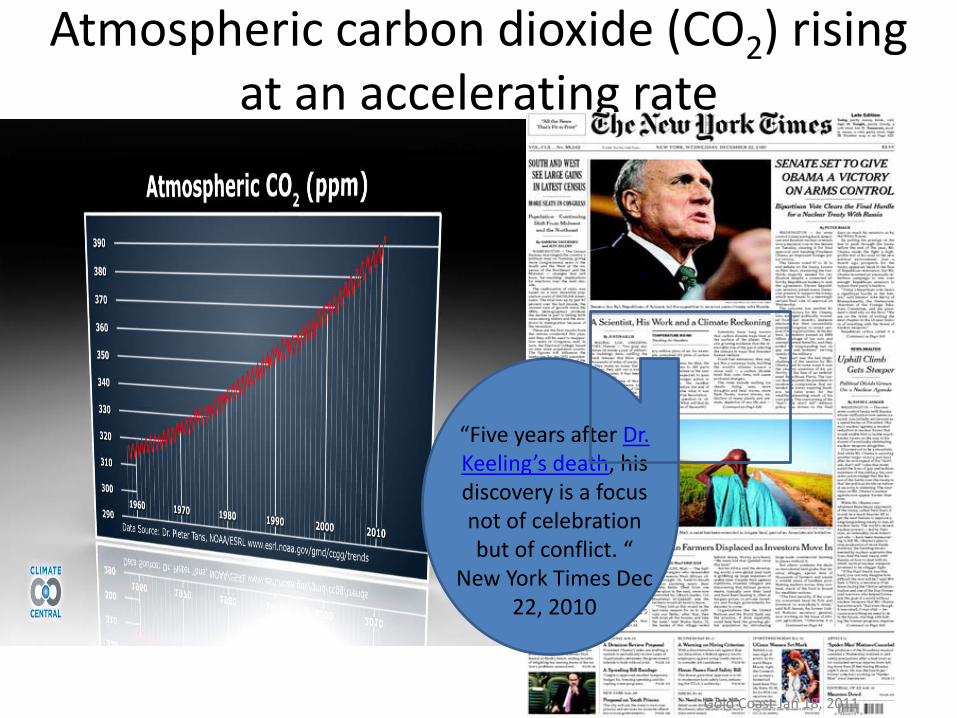
Atmospheric carbon dioxide (CO2) rising at an accelerating rate
Gold Coast Jan 18, 2011
“Five years after Dr. Keeling’s death, his discovery is a focus not of celebration but of conflict. “
New York Times Dec 22, 2010

Global temperature anomalies in the 2000s: record years in a record decade
Gold Coast Jan 18, 2011Source: World Meteorological Organization www.wmo.int

Global annual average temperature and CO2 concentration continue to climb, 1880–2007
Gold Coast Jan 18, 2011
Source: World Development Report 2010The World Bank
Source: Adapted from Karl, Melillo, and Peterson 2009.
Note: Orange bars indicate temperature above the 1901–2000 average, blue bars are below average temperatures. The green line shows the rising CO2concentration. While there is a clear long-term global warming trend, each individual year does not show a temperature increase relative to the previous year, and some years show greater changes than others. These year-to-year fluctuations in temperature are attributable to natural processes, such as the effects of El Niños, La Niñas, and volcanic eruptions.

Gold Coast Jan 18, 2011
1
4
8
9
13
15
16
20
21
17
23
22527
28
29
30
31
14
18
22
24
10
32
33
34
19
7
6
11
5
26 12
3
29
Heat waves / Extreme high temperatures
Severe or prolonged droughts
Intense storms / Flooding / Heavy rainfall
Tropical cyclones, hurricanes and typhoons
Cold waves / Extreme low temperatures / Snow storms
A SNAPSHOT OF SOME EXTREME EVENTS (*) OVER THE PAST DECADE *In the absence of a standard definition of an extreme event,
this map includes single and/or a succession of weather phenomena leading to abnormal meteorological
and/or climate conditions with high impacts such as heat waves, severe storms, flooding, droughts, etc.
Source: World Meteorological Organization
Gold Coast Jan 18, 2011

The emissions gap between where the world is headed and where it needs to go is huge, but a portfolio of clean energy technologies can help the world stay at 450 ppm CO2e (2°C)
)
Gold Coast Jan 18, 2011
Source: The World Bank World Development Report 2010
Sources: WDR team, based on data from Riahi, Grübler, and Nakićenović 2007; IIASA 2009; IEA 2008b.
Note: Fuel switching is changing from coal to gas. Non-biomass renewables include solar, wind, hydropower, and geothermal. Fossil CCS is fossil fuels with carbon capture and storage. While the exact mitigation potential of each wedge may vary under different models depending on the baseline, the overall conclusions remain the same.

TWO DIFFERENT SETS OF ASSUMPTIONS USED IN THE SAME ECONOMIC MODELLooking at tradeoffs: The loss in consumption relative to a world without warming for different
peak CO2e concentrations
Source: Adapted from Hof, den Elzen, and van Vuuren 2008, figure 10.
Note: The curves show the percentage loss in the present value of consumption, relative to what it would be with a constant climate, as a function of the target for peak CO2e concentrations. The “Stern assumptions” and “Nordhaus assumptions” refer to choices about the value of key parameters of the model as explained in the text. The dot shows the optimum for each set of assumptions, where the optimum is defined as the greenhouse gas concentration that would minimize the global consumption loss resulting from the sum of mitigation costs and impact damages.
Source: The World Bank, World Development Report 2010
Gold Coast Jan 18, 2011
Gold Coast Jan 18, 2011
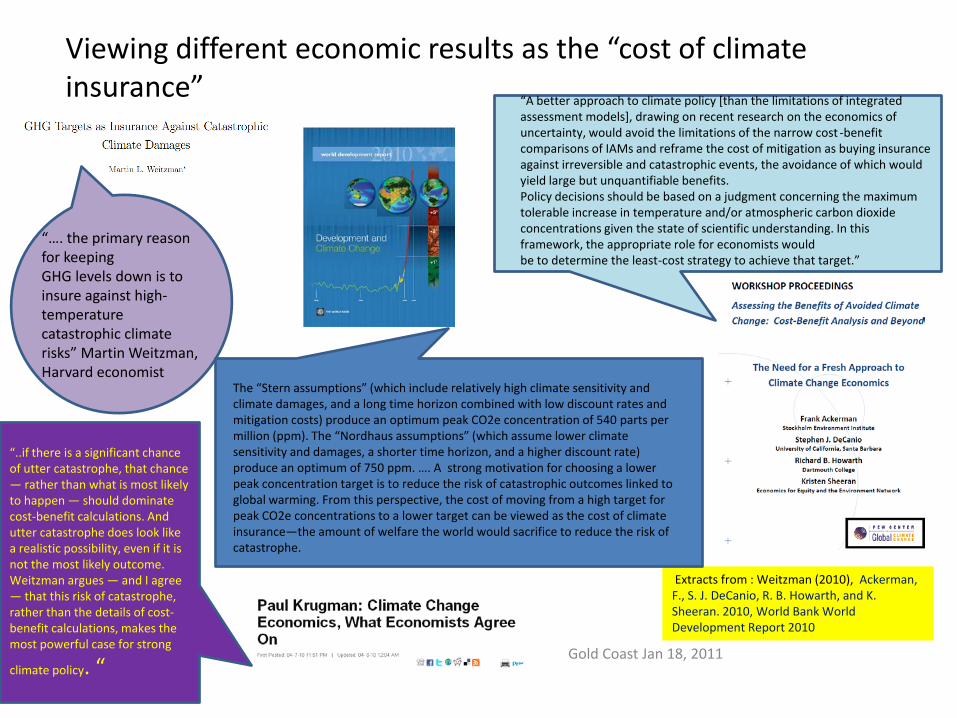
“…. the primary reason for keepingGHG levels down is to insure against high-temperature catastrophic climate risks” Martin Weitzman, Harvard economist
Extracts from : Weitzman (2010), Ackerman, F., S. J. DeCanio, R. B. Howarth, and K. Sheeran. 2010, World Bank World Development Report 2010
“A better approach to climate policy [than the limitations of integrated assessment models], drawing on recent research on the economics of uncertainty, would avoid the limitations of the narrow cost -benefit comparisons of IAMs and reframe the cost of mitigation as buying insurance against irreversible and catastrophic events, the avoidance of which would yield large but unquantifiable benefits.Policy decisions should be based on a judgment concerning the maximum tolerable increase in temperature and/or atmospheric carbon dioxide concentrations given the state of scientific understanding. In this framework, the appropriate role for economists wouldbe to determine the least-cost strategy to achieve that target.”
Viewing different economic results as the “cost of climate insurance”
The “Stern assumptions” (which include relatively high climate sensitivity and climate damages, and a long time horizon combined with low discount rates and mitigation costs) produce an optimum peak CO2e concentration of 540 parts per million (ppm). The “Nordhaus assumptions” (which assume lower climate sensitivity and damages, a shorter time horizon, and a higher discount rate) produce an optimum of 750 ppm. …. A strong motivation for choosing a lower peak concentration target is to reduce the risk of catastrophic outcomes linked to global warming. From this perspective, the cost of moving from a high target for peak CO2e concentrations to a lower target can be viewed as the cost of climate insurance—the amount of welfare the world would sacrifice to reduce the risk of catastrophe.
“..if there is a significant chance of utter catastrophe, that chance — rather than what is most likely to happen — should dominate cost-benefit calculations. And utter catastrophe does look like a realistic possibility, even if it is not the most likely outcome. Weitzman argues — and I agree — that this risk of catastrophe, rather than the details of cost-benefit calculations, makes the most powerful case for strong
climate policy. “

What does the way forward look like? Two options among many:Business as usual or aggressive mitigation
World Development Report 2010
Source: Clarke and others, forthcoming.
Note: The top band shows the range of estimates across models (GTEM, IMAGE, MESSAGE, MiniCAM) for emissions under a business-as-usual scenario. The lower band shows a trajectory that could yield a concentration of 450 ppm of CO2e (with a 50 percent chance of limiting warming to less than 2°C). Greenhouse gas emissions include CO2, CH4, and N2O. Negative emissions (eventually required by the 2°C path) imply that the annual rate of emissions is lower than the rate of uptake and storage of carbon through natural processes (for example, plant growth) and engineered processes (for example, growing biofuels and when burning them, sequestering the CO2 underground). GTEM, IMAGE, MESSAGE, and MiniCAM are the integrated assessment models of the Australian Bureau of Agricultural and Resource Economics, the Netherlands Environmental Assessment Agency, International Institute of Applied Systems Analysis, and Pacific Northwest National Laboratory.Gold Coast Jan 18, 2011
Gold Coast Jan 18, 2011
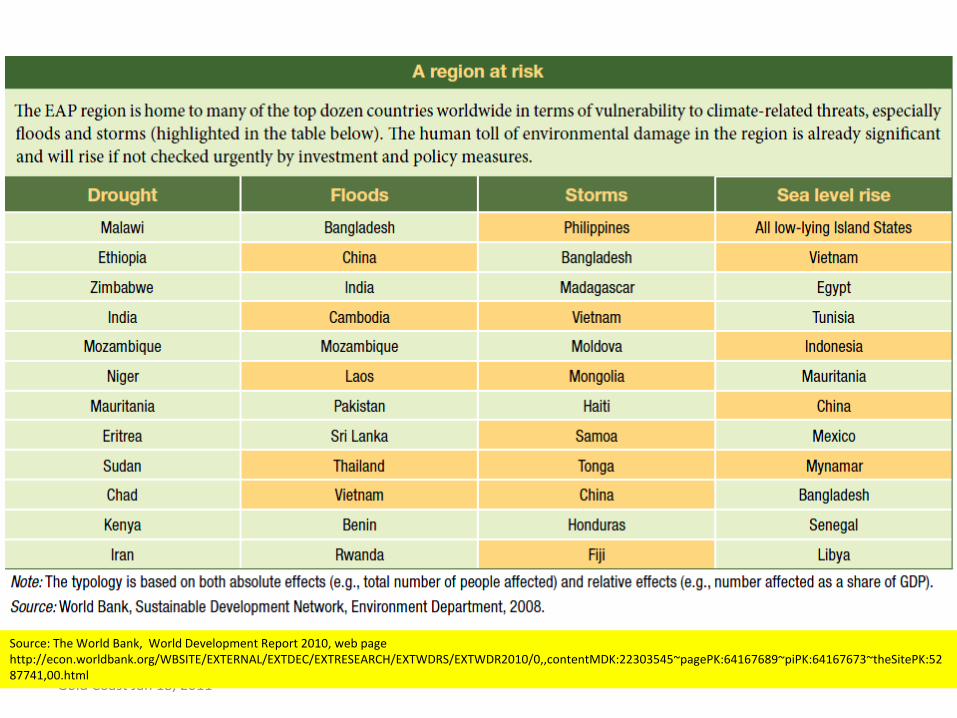
Source: The World Bank, World Development Report 2010, web page http://econ.worldbank.org/WBSITE/EXTERNAL/EXTDEC/EXTRESEARCH/EXTWDRS/EXTWDR2010/0,,contentMDK:22303545~pagePK:64167689~piPK:64167673~theSitePK:5287741,00.html
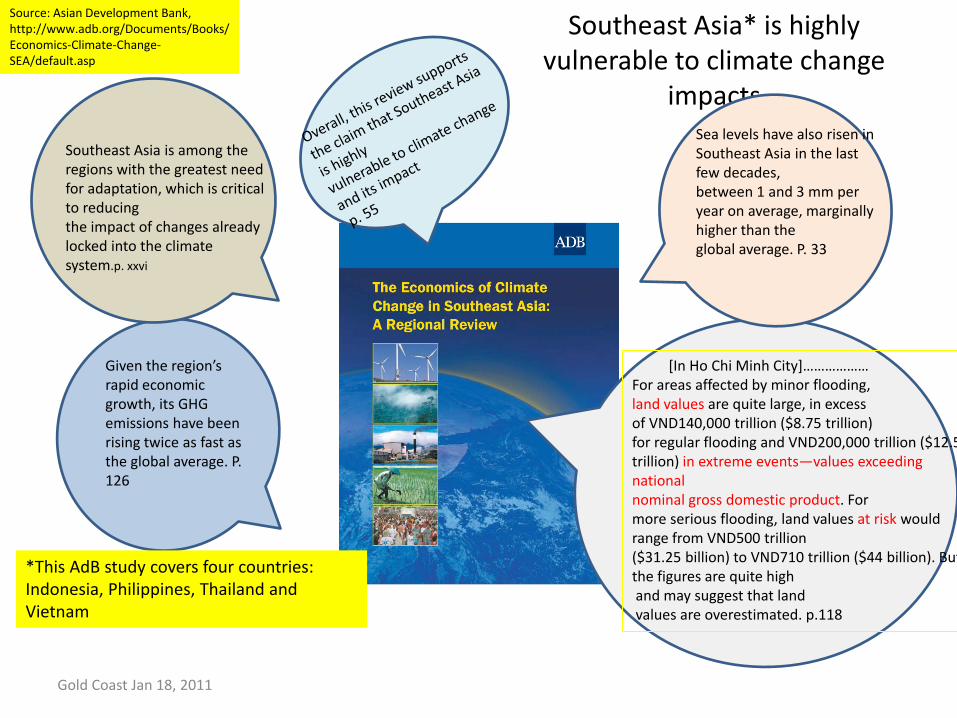
Southeast Asia* is highly vulnerable to climate change
impacts
Gold Coast Jan 18, 2011
Source: Asian Development Bank, http://www.adb.org/Documents/Books/Economics-Climate-Change-SEA/default.asp
Southeast Asia is among the regions with the greatest need for adaptation, which is critical to reducingthe impact of changes already locked into the climate system.p. xxvi
Sea levels have also risen in Southeast Asia in the last few decades,between 1 and 3 mm per year on average, marginally higher than theglobal average. P. 33
Given the region’s rapid economic growth, its GHG emissions have beenrising twice as fast as the global average. P. 126
*This AdB study covers four countries: Indonesia, Philippines, Thailand and Vietnam
[In Ho Chi Minh City]………………For areas affected by minor flooding, land values are quite large, in excess of VND140,000 trillion ($8.75 trillion)for regular flooding and VND200,000 trillion ($12.5 trillion) in extreme events—values exceeding nationalnominal gross domestic product. For more serious flooding, land values at risk would range from VND500 trillion($31.25 billion) to VND710 trillion ($44 billion). But the figures are quite highand may suggest that landvalues are overestimated. p.118
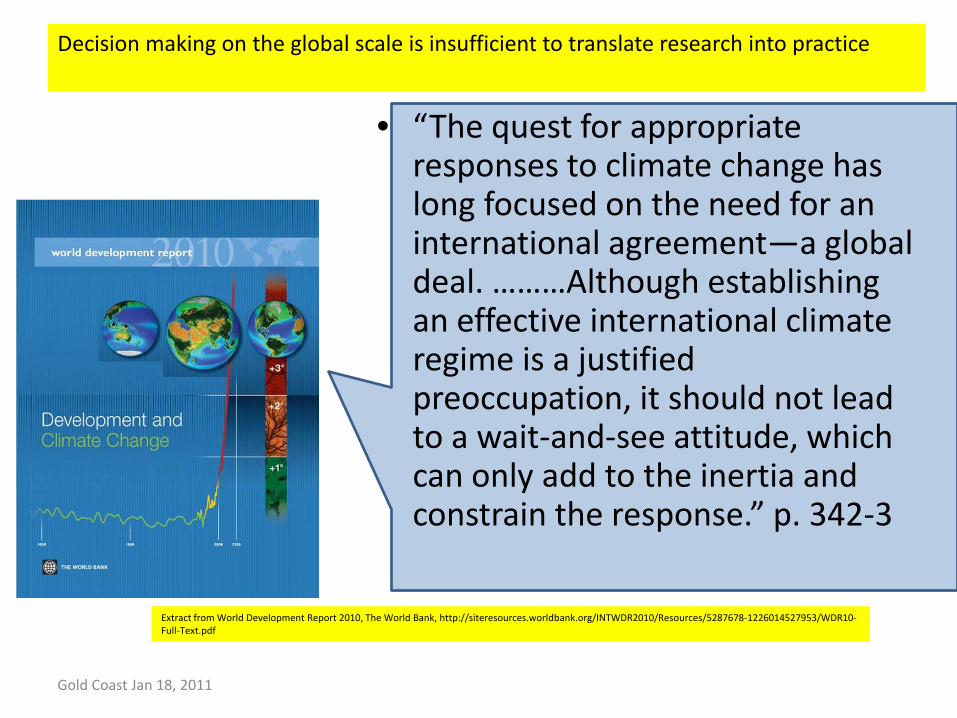
• “The quest for appropriate responses to climate change has long focused on the need for an international agreement—a global deal. ………Although establishing an effective international climate regime is a justified preoccupation, it should not lead to a wait-and-see attitude, which can only add to the inertia and constrain the response.” p. 342-3
Gold Coast Jan 18, 2011
Decision making on the global scale is insufficient to translate research into practice
Extract from World Development Report 2010, The World Bank, http://siteresources.worldbank.org/INTWDR2010/Resources/5287678-1226014527953/WDR10-Full-Text.pdf
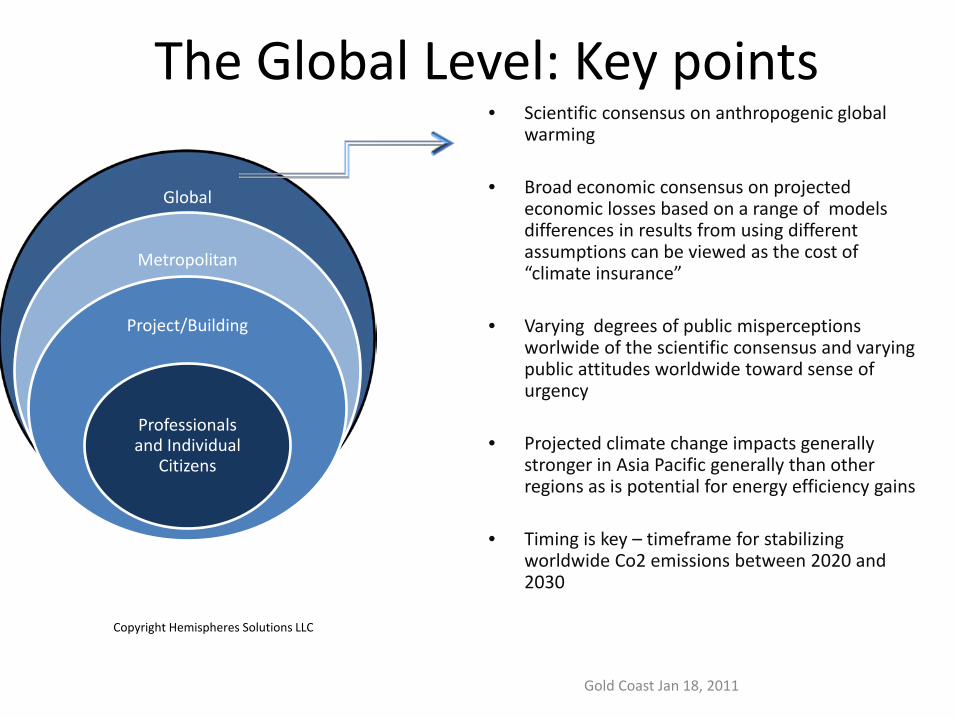
The Global Level: Key points
Global
Metropolitan
Project/Building
Professionals and Individual
Citizens
• Scientific consensus on anthropogenic global warming
• Broad economic consensus on projected economic losses based on a range of models differences in results from using different assumptions can be viewed as the cost of “climate insurance”
• Varying degrees of public misperceptions worlwide of the scientific consensus and varying public attitudes worldwide toward sense of urgency
• Projected climate change impacts generally stronger in Asia Pacific generally than other regions as is potential for energy efficiency gains
• Timing is key – timeframe for stabilizing worldwide Co2 emissions between 2020 and 2030
Gold Coast Jan 18, 2011
Copyright Hemispheres Solutions LLC
Gold Coast Jan 18, 2011
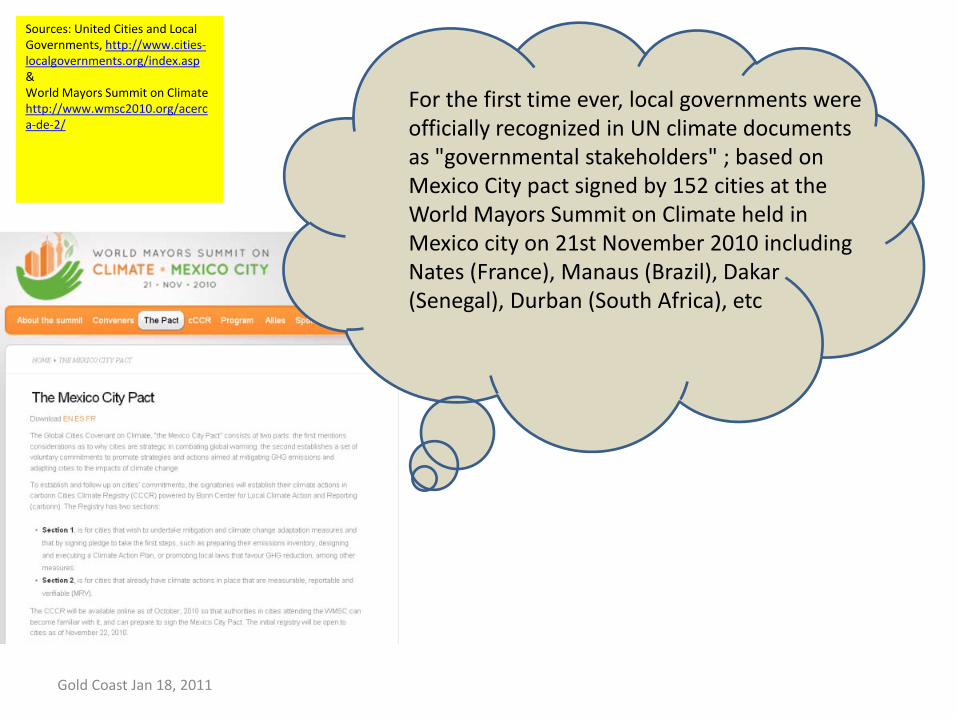
For the first time ever, local governments were officially recognized in UN climate documents as "governmental stakeholders" ; based on Mexico City pact signed by 152 cities at the World Mayors Summit on Climate held in Mexico city on 21st November 2010 including Nates (France), Manaus (Brazil), Dakar (Senegal), Durban (South Africa), etc
Sources: United Cities and Local Governments, http://www.cities-localgovernments.org/index.asp&World Mayors Summit on Climatehttp://www.wmsc2010.org/acerca-de-2/

“Buildings alone represent an average of 60% of total global emissions, and there are more than 20 million vehicles in just 19 key C40 cities. “
Gold Coast Jan 18, 2011
Source: http://www.c40cities.org/
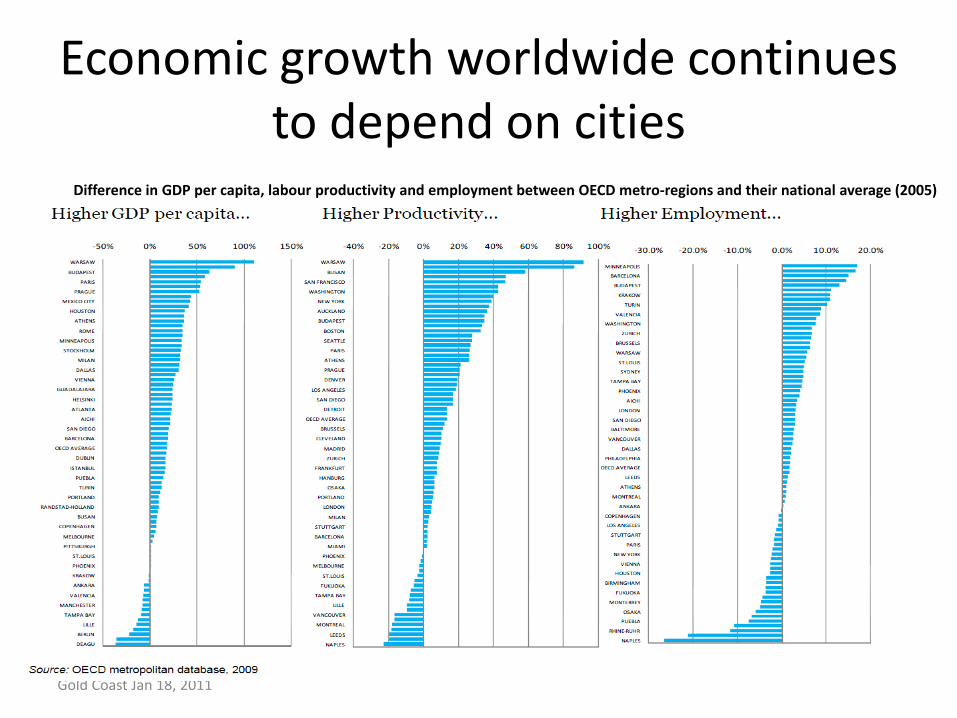
Economic growth worldwide continues to depend on cities
Gold Coast Jan 18, 2011
Difference in GDP per capita, labour productivity and employment between OECD metro-regions and their national average (2005)
Gold Coast Jan 18, 2011
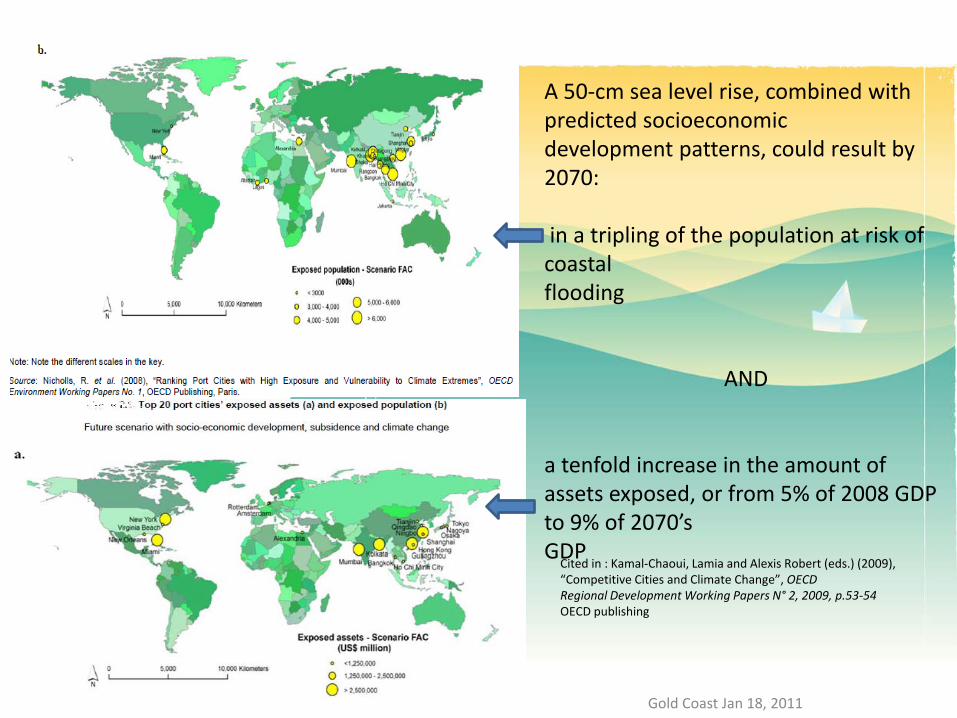
A 50-cm sea level rise, combined with predicted socioeconomicdevelopment patterns, could result by 2070:
in a tripling of the population at risk of coastalflooding
AND
a tenfold increase in the amount of assets exposed, or from 5% of 2008 GDP to 9% of 2070’sGDP
Cited in : Kamal-Chaoui, Lamia and Alexis Robert (eds.) (2009),“Competitive Cities and Climate Change”, OECDRegional Development Working Papers N° 2, 2009, p.53-54OECD publishing

Asian cities are especially vulnerable
Data Sources: UNHABITAT, 2008, Bangkok Metropolitan Administration 2009Gold Coast Jan 18, 2011
Of the total urban population in Asia, 17 percent lives in the low
elevation coastal zones64% of these cities in developing countries
In South-East Asia, more than one third of the urban population
lives in such a setting
Half of above in Asia (excl Australia, NZ)
18 of Asia’s 20 largest are coastal, or located on a riverbank or in a
delta
Worldwide: 3,351 cities in low-elevation coastal zones
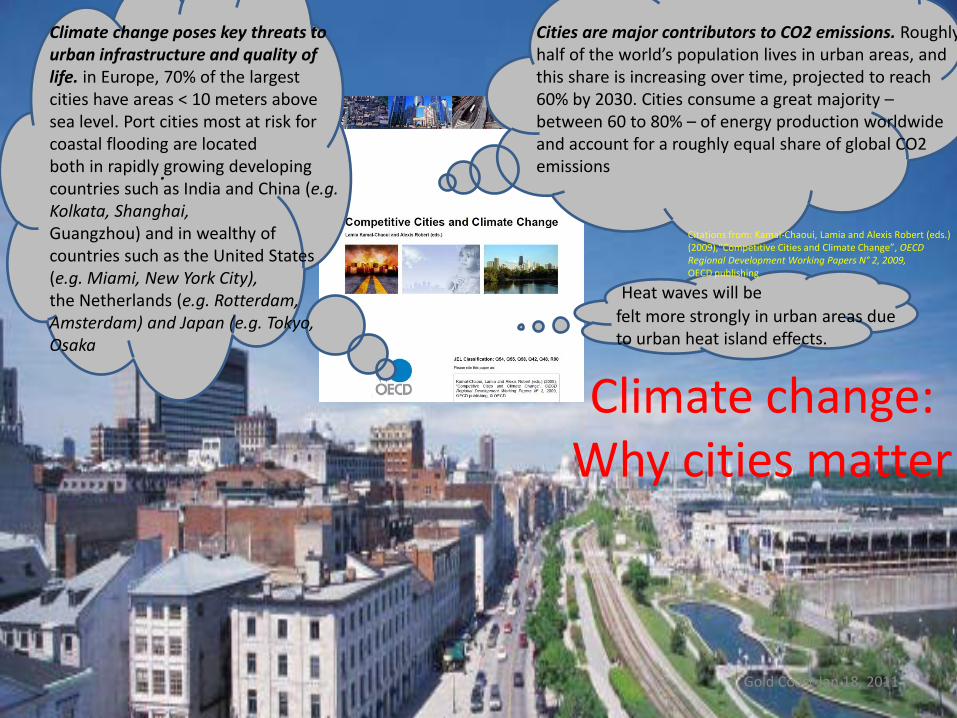
Climate change: Why cities matter
Gold Coast Jan 18, 2011
Cities are major contributors to CO2 emissions. Roughly half of the world’s population lives in urban areas, and this share is increasing over time, projected to reach 60% by 2030. Cities consume a great majority –between 60 to 80% – of energy production worldwide and account for a roughly equal share of global CO2 emissions.
Climate change poses key threats to urban infrastructure and quality of life. in Europe, 70% of the largest cities have areas < 10 meters above sea level. Port cities most at risk for coastal flooding are locatedboth in rapidly growing developing countries such as India and China (e.g. Kolkata, Shanghai,Guangzhou) and in wealthy of countries such as the United States (e.g. Miami, New York City),the Netherlands (e.g. Rotterdam, Amsterdam) and Japan (e.g. Tokyo, Osaka
Heat waves will befelt more strongly in urban areas due to urban heat island effects.
Citations from: Kamal-Chaoui, Lamia and Alexis Robert (eds.) (2009),“Competitive Cities and Climate Change”, OECDRegional Development Working Papers N° 2, 2009,OECD publishing

…but GHG emissions per capita may be lower in cities than elsewhere
• detailed analyses of urban greenhouse gas emissions for individual cities suggest that, per capita, urban residents tend to generate a substantially smaller volume of carbon emissions than residents elsewhere in the same country (Dodman, 2009) e.g
– per capita emissions in New York City are only 29.7 per cent of those in the United States as a whole (PlaNYC, 2007)
– those in London are just over half of the British average (Mayor of London, 2007)
– those in Rio de Janeiro are only 28.0 per cent of those of Brazil as a whole (Dubeux and La Rovere,2007)
– those in Barcelona are only 33.9 per cent of those of Spain as a whole (Baldasano et al., 1999)
• relatively low levels of emissions are influenced by urban density patterns:– the density of buildings
– the average dwelling unit size; and
– the extent of public
Gold Coast Jan 18, 2011
extracted from: Dodman, David Urban Form, Greenhouse Gas Emissions and Climate Vulnerability
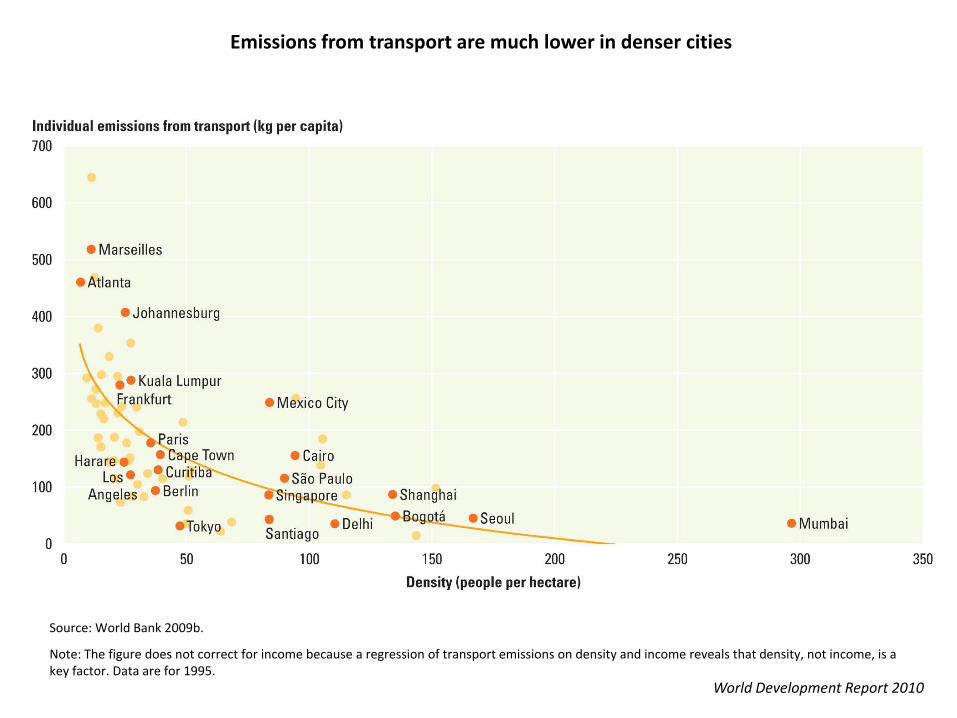
Emissions from transport are much lower in denser cities
World Development Report 2010
Source: World Bank 2009b.
Note: The figure does not correct for income because a regression of transport emissions on density and income reveals that density, not income, is a key factor. Data are for 1995.
Gold Coast Jan 18, 2011
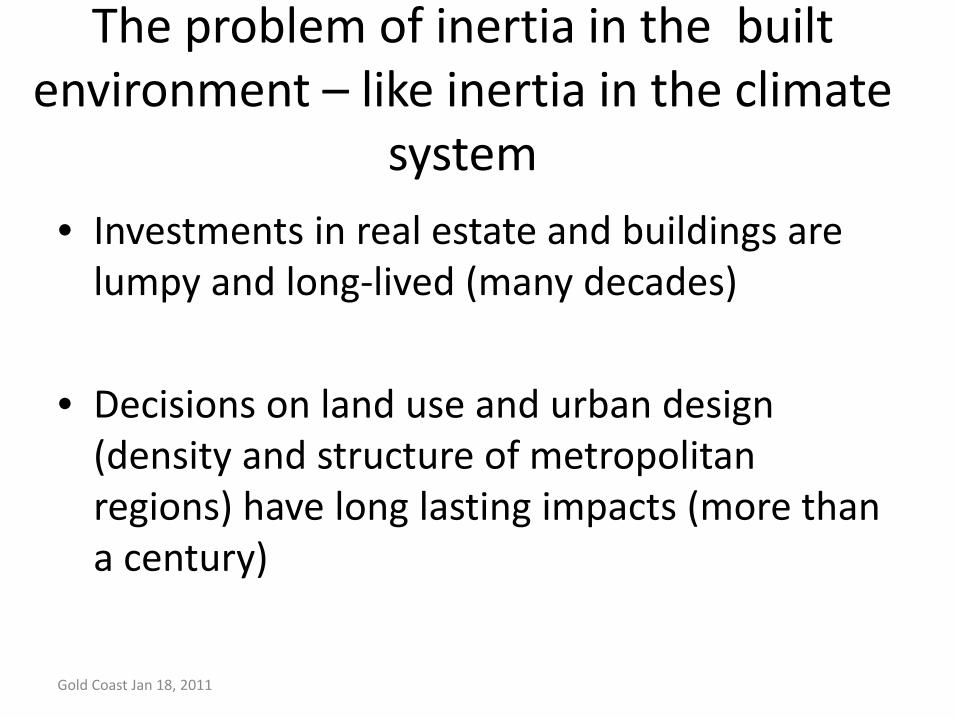
The problem of inertia in the built environment – like inertia in the climate
system• Investments in real estate and buildings are
lumpy and long-lived (many decades)
• Decisions on land use and urban design (density and structure of metropolitan regions) have long lasting impacts (more than a century)
Gold Coast Jan 18, 2011

Framing the policy choices in the Kayaequation
• CO2 = (CO2 / E) * (E / GDP)* (GDP / POP) * POP
Gold Coast Jan 18, 2011
energy-related carbon dioxide emissions (CO2)
CO2 = energy-related carbon dioxide emissions (CO2)
GDP = gross domestic productE= energyPOP=population
carbon dioxide intensity of energy use Energy
intensity of economic output
Key policy levers

Until now, improvements in two policy levers -- energy and carbon intensity -- have not been enough to offset rising energy demand boosted
by rising incomes
Source: World Bank, World Development Report 2010
Source: IPCC 2007.
Note: GDP is valued using purchasing power parity (PPP) dollars.

Energy projections with Kaya equation• CO2 = (CO2 / E) * (E / GDP)* (GDP / POP) * POP
Gold Coast Jan 18, 2011

Energy projections with Kaya equation• CO2 = (CO2 / E) * (E / GDP)* (GDP / POP) * POP
Gold Coast Jan 18, 2011
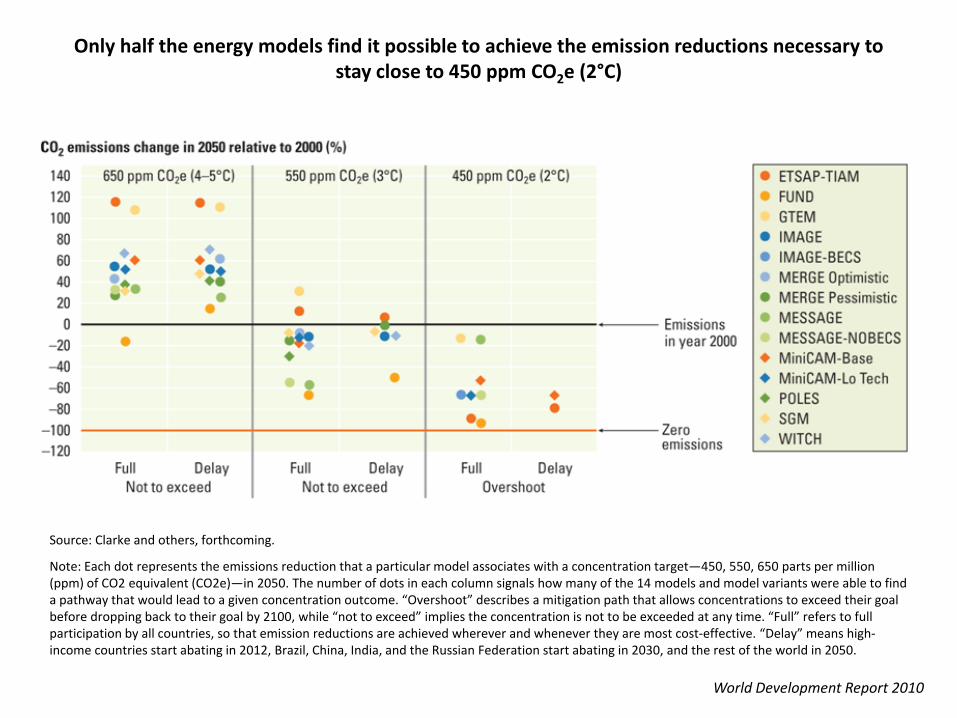
Only half the energy models find it possible to achieve the emission reductions necessary to stay close to 450 ppm CO2e (2°C)
World Development Report 2010
Source: Clarke and others, forthcoming.
Note: Each dot represents the emissions reduction that a particular model associates with a concentration target—450, 550, 650 parts per million (ppm) of CO2 equivalent (CO2e)—in 2050. The number of dots in each column signals how many of the 14 models and model variants were able to find a pathway that would lead to a given concentration outcome. “Overshoot” describes a mitigation path that allows concentrations to exceed their goal before dropping back to their goal by 2100, while “not to exceed” implies the concentration is not to be exceeded at any time. “Full” refers to full participation by all countries, so that emission reductions are achieved wherever and whenever they are most cost-effective. “Delay” means high-income countries start abating in 2012, Brazil, China, India, and the Russian Federation start abating in 2030, and the rest of the world in 2050.
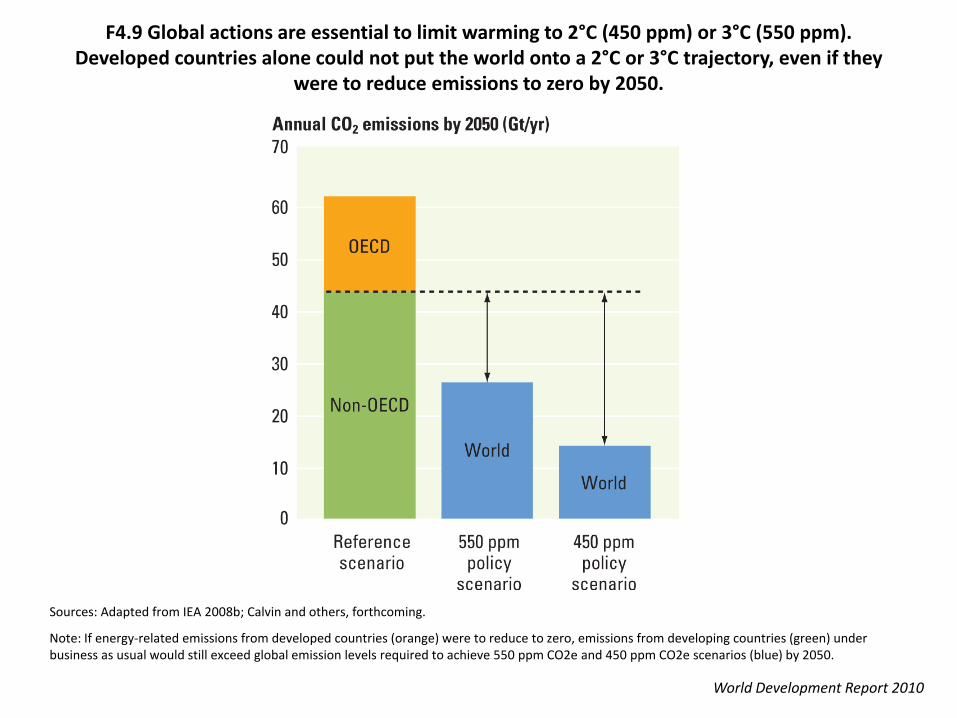
F4.9 Global actions are essential to limit warming to 2°C (450 ppm) or 3°C (550 ppm). Developed countries alone could not put the world onto a 2°C or 3°C trajectory, even if they
were to reduce emissions to zero by 2050.
World Development Report 2010
Sources: Adapted from IEA 2008b; Calvin and others, forthcoming.
Note: If energy-related emissions from developed countries (orange) were to reduce to zero, emissions from developing countries (green) under business as usual would still exceed global emission levels required to achieve 550 ppm CO2e and 450 ppm CO2e scenarios (blue) by 2050.
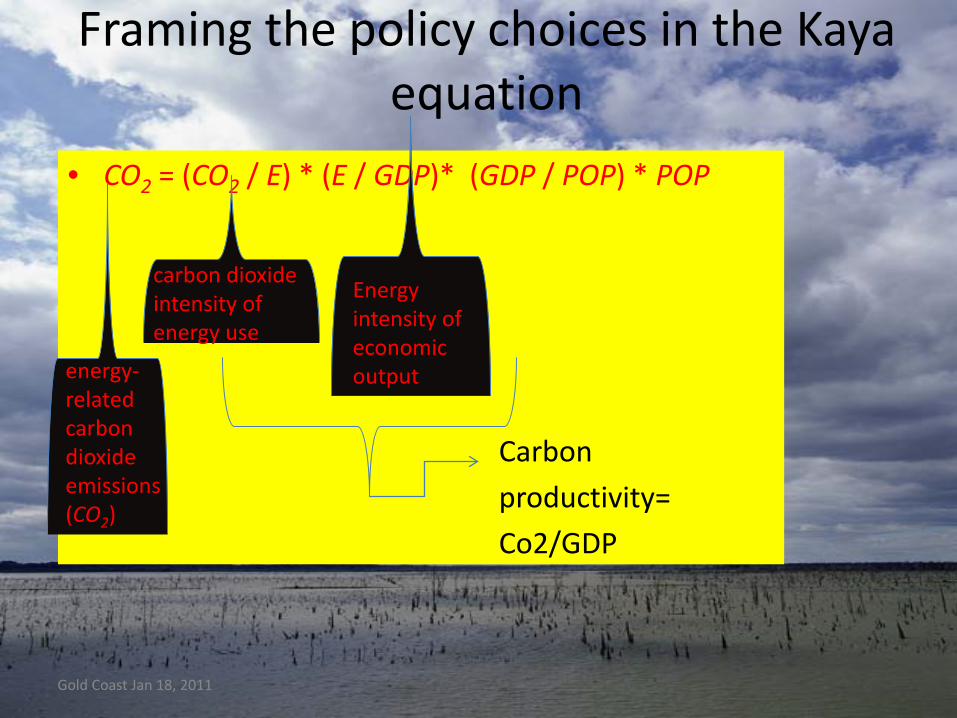
Framing the policy choices in the Kayaequation
• CO2 = (CO2 / E) * (E / GDP)* (GDP / POP) * POP
Carbon
productivity=
Co2/GDP
Gold Coast Jan 18, 2011
energy-related carbon dioxide emissions (CO2)
carbon dioxide intensity of energy use
Energy intensity of economic output

Gold Coast Jan 18, 2011

Gold Coast Jan 18, 2011
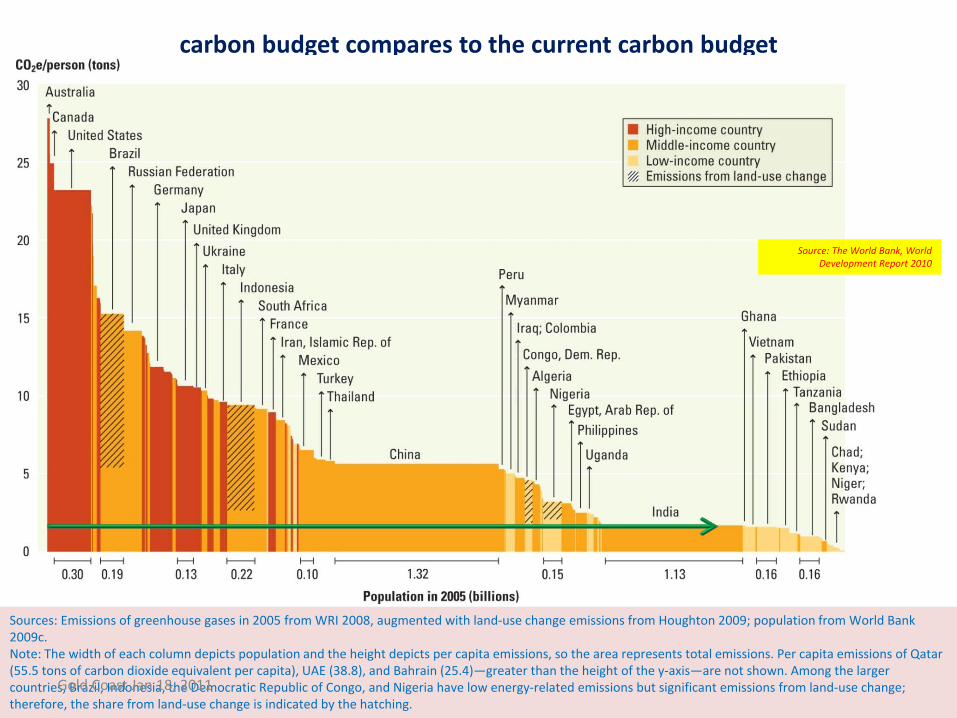
carbon budget compares to the current carbon budget
Sources: Emissions of greenhouse gases in 2005 from WRI 2008, augmented with land-use change emissions from Houghton 2009; population from World Bank 2009c.Note: The width of each column depicts population and the height depicts per capita emissions, so the area represents total emissions. Per capita emissions of Qatar (55.5 tons of carbon dioxide equivalent per capita), UAE (38.8), and Bahrain (25.4)—greater than the height of the y-axis—are not shown. Among the larger countries, Brazil, Indonesia, the Democratic Republic of Congo, and Nigeria have low energy-related emissions but significant emissions from land-use change; therefore, the share from land-use change is indicated by the hatching.
Source: The World Bank, World Development Report 2010
Gold Coast Jan 18, 2011

One ton of CO₂ emission
equivalent each
Average US passenger family car every 2 ½ months
A household’s use of electricity every six weeks.
The typical use of a microwave oven every seven years or of a refrigerator every 15 months.
A household’s use of heating and cooking fuel every four months (if energy use were
spread equally throughout the year)>> every four years in
Hawaii or every six weeks in Maine
Gold Coast Jan 18, 2011
Data source: based on multiple US government data sources, cited in Frank Ackerman and Elizabeth A. Stanton “The social cost of carbon”, real-world economics review, issue no. 53, 26 June 2010, pp. 129-143, http://www.paecon.net/PAEReview/issue53/AckermanStanton53.pdf

Gold Coast Jan 18, 2011

Gold Coast Jan 18, 2011

Gold Coast Jan 18, 2011
Gold Coast Jan 18, 2011

The importance of carbon pricing
Gold Coast Jan 18, 2011
“Providing a strong, stable carbon price is the single policy action that is likely to have the biggest effect in improving economic efficiency and tackling the climate crisis. Clarity on policy and prices is all the more important now, with companies facing such uncertainty because of the financial crisis: the two risks compound each other, damping investment. We may not be able fully to resolve the risks of the financial crisis quickly; but we can take actions now that will markedly reduce uncertainties about future carbon policies and prices.”
Extract (underline and bold added) from Joseph Stiglitz and Nicholas Stern, Financial Times, March 2, 2009 Obama’s chance to lead the green recovery

It’s not just about energy: Carbon pricing changes the mitigation potential of various sectors of the economy including buildings
Source: The World Bank, World Development Report 2010Source: Barker and others 2007b, figure TS.27.
Note: EIT = economies in transition. The ranges for global economic potentials as assessed in each sector are shown by black vertical lines.
Gold Coast Jan 18, 2011

F4.8 Estimates of global mitigation costs and carbon prices for 450 and 550 ppm CO2e (2°C and 3°C) in 2030 from five models
Sources: WDR team, based on data from Knopf and others, forthcoming; Rao and others 2008; Calvin and others, forthcoming.
Note: This graphic compares mitigation costs and carbon prices from five global energy-climate models—MiniCAM, IMAGE, MESSAGE, POLES, and REMIND (see note 28 for model assumptions and methodology). MiniCAM, POLES, IMAGE, and MESSAGE report abatement costs for the transformation of energy systems relative to the baseline as a percent of GDP in 2030, where GDP is exogenous. a. The mitigation costs from REMIND are given as macroeconomic costs expressed in GDP losses in 2030 relative to baseline, where GDP is endogenous.
World Development Report 2010
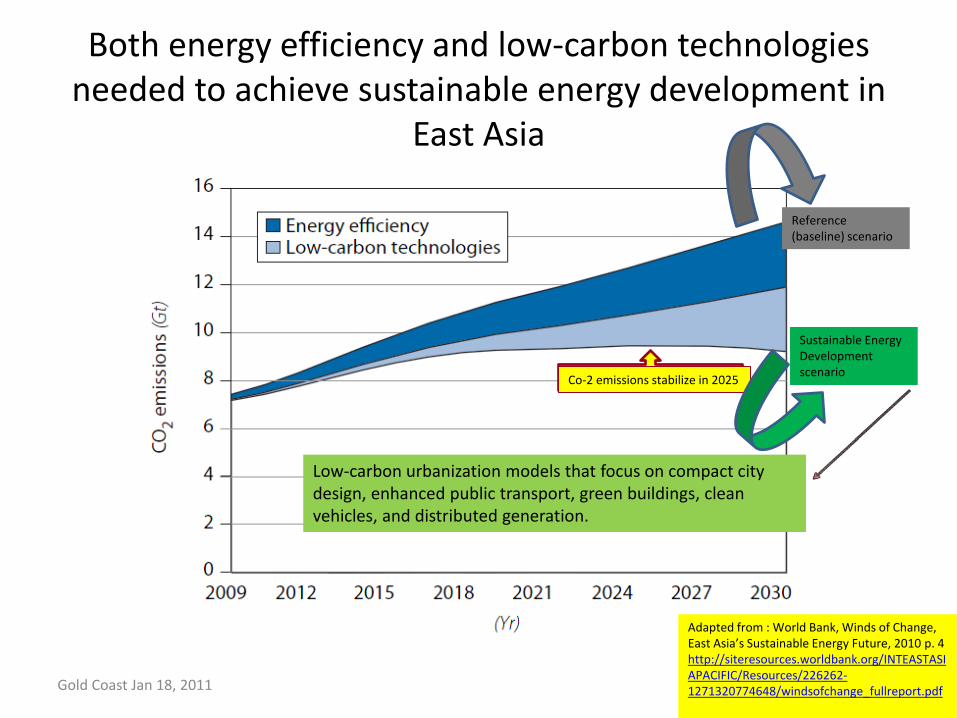
Both energy efficiency and low-carbon technologies needed to achieve sustainable energy development in
East Asia
Gold Coast Jan 18, 2011
Adapted from : World Bank, Winds of Change, East Asia’s Sustainable Energy Future, 2010 p. 4 http://siteresources.worldbank.org/INTEASTASIAPACIFIC/Resources/226262-1271320774648/windsofchange_fullreport.pdf
Co-2 emissions stabilize in 2025
Sustainable Energy Development scenario
Reference (baseline) scenario
Low-carbon urbanization models that focus on compact city design, enhanced public transport, green buildings, clean vehicles, and distributed generation.
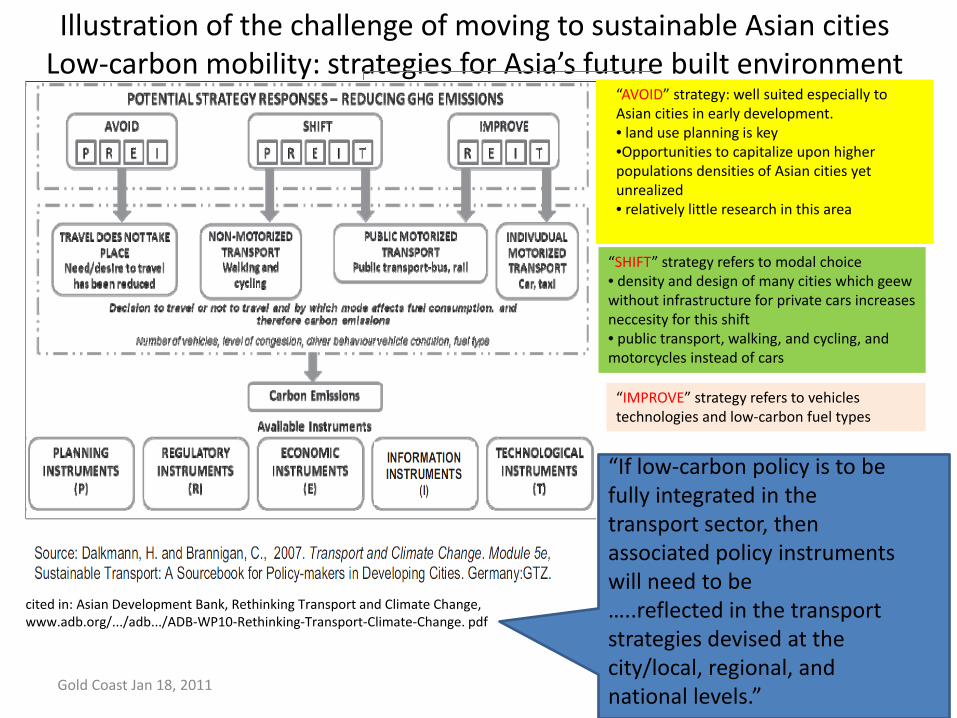
Illustration of the challenge of moving to sustainable Asian citiesLow-carbon mobility: strategies for Asia’s future built environment
Gold Coast Jan 18, 2011
cited in: Asian Development Bank, Rethinking Transport and Climate Change,www.adb.org/.../adb.../ADB-WP10-Rethinking-Transport-Climate-Change. pdf
“AVOID” strategy: well suited especially to Asian cities in early development. • land use planning is key•Opportunities to capitalize upon higher populations densities of Asian cities yet unrealized• relatively little research in this area
“SHIFT” strategy refers to modal choice• density and design of many cities which geewwithout infrastructure for private cars increases neccesity for this shift• public transport, walking, and cycling, and motorcycles instead of cars
“IMPROVE” strategy refers to vehicles technologies and low-carbon fuel types
“If low-carbon policy is to be fully integrated in the transport sector, then associated policy instruments will need to be…..reflected in the transport strategies devised at the city/local, regional, and national levels.”
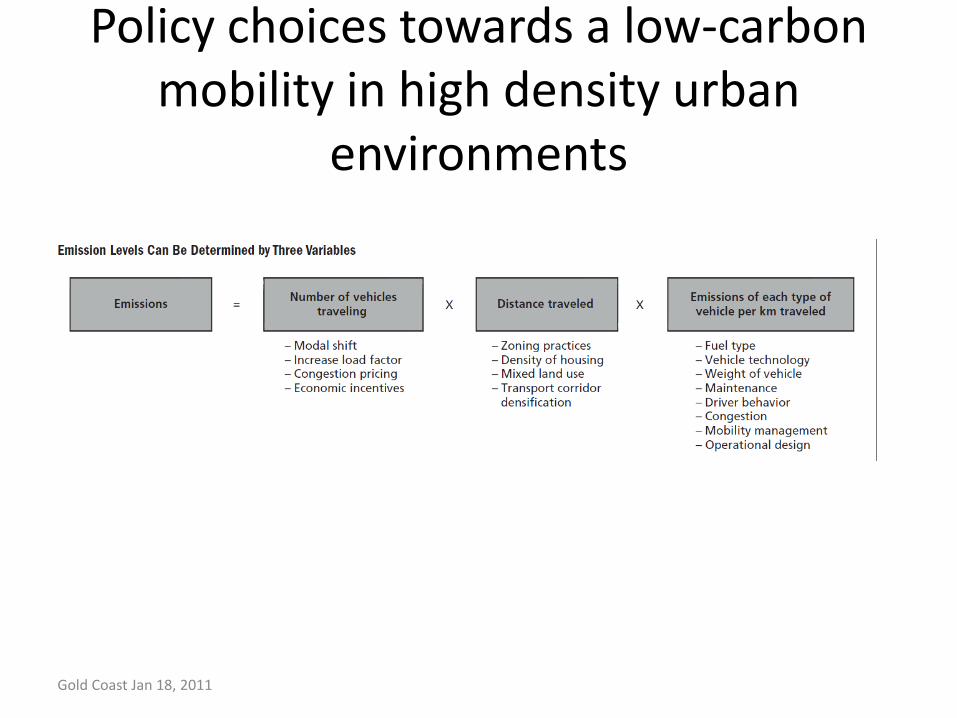
Policy choices towards a low-carbon mobility in high density urban
environments
Gold Coast Jan 18, 2011
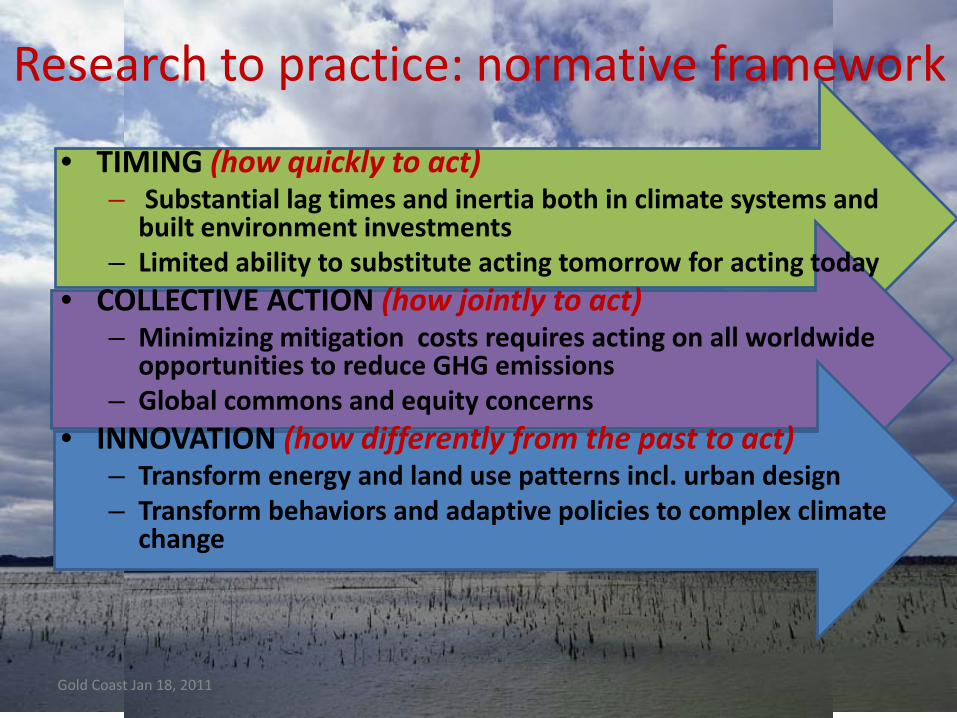
Research to practice: normative framework
Gold Coast Jan 18, 2011
• TIMING (how quickly to act)– Substantial lag times and inertia both in climate systems and
built environment investments– Limited ability to substitute acting tomorrow for acting today
• COLLECTIVE ACTION (how jointly to act)– Minimizing mitigation costs requires acting on all worldwide
opportunities to reduce GHG emissions– Global commons and equity concerns
• INNOVATION (how differently from the past to act)– Transform energy and land use patterns incl. urban design– Transform behaviors and adaptive policies to complex climate
change

References• Ackerman, F., S. J. DeCanio, R. B. Howarth, and K. Sheeran. 2010. “The Need for a Fresh Approach to Climate Change Economics.” In Assessing the
Benefits of Avoided Climate
• Change: CostBenefit Analysis and Beyond. Gulledge, J., L. J. Richardson, L. Adkins, and S. Seidel (eds.), Proceedings of Workshop on Assessing the Benefits of Avoided Climate Change, March 16–17, 2009. Pew Center on Global Climate Change: Arlington, VA. p. 159–181. : http://www.pewclimate.org/events/2009/benefitsworkshop
• Asian Development Bank, The Economics of Climate Change in Southeast Asia:A Regional Review, 2009, http://www.adb.org/Documents/Books/Economics-Climate-Change-SEA/default.asp
• Asian Development Bank, Rethinking Transport and Climate Change, www.adb.org/.../adb.../ADB-WP10-Rethinking-Transport-Climate-Change. pdf
• Barrett, Scott, Johns Hopkins University, Economics The Open Access Open Assessment E-Journal Vol. 3, 2009-5 | March 3, 2009 | http://www.economics-ejournal.org/economics/journalarticles/2009-5
• Kamal-Chaoui, Lamia and Alexis Robert (eds.) (2009),“Competitive Cities and Climate Change”, OECD Regional Development Working Papers N° 2, 2009, OECD publishing, Organisatiion for Ecnomiic Cooperation and Development
• Krugman, Paul, Building A Green Economy, The New York Times Magazine, April 7, 2010 http://www.nytimes.com/2010/04/11/magazine/11Economy-t.html?pagewanted=all
• Liliana Andonova, Colby College,Michele M. Betsill, Colorado State University, Harriet Bulkeley, Durham University, Transnational Climate Change Governance, Paper prepared for the Amsterdam Conference on the Human Dimensions of Global,Environmental Change, 24-26 May 2007
• London School of Economics and Political Science, The Hartwell Paper, May 2010, http://www2.lse.ac.uk/researchAndExpertise/units/mackinder/theHartwellPaper/Home.aspx
• Frank Ackerman and Elizabeth A. Stanton “The social cost of carbon”, real-world economics review, issue no. 53, 26 June 2010, pp. 129-143, http://www.paecon.net/PAEReview/issue53/AckermanStanton53.pdf
• Bangkok Metropolitan Administration 2009, Bangkok Assessment Report on Climate Change 2009 http://www.unep.org/dewa/pdf/BKK_assessment_report2009.pdf
• Dodman, David Urban Form, Greenhouse Gas Emissions and Climate Vulnerability in UNFPA & International Institute for Environment and Development, Population Dynamics and Climate Change, 2009
•
Gold Coast Jan 18, 2011

References• Neff, Todd, Connecting Science and Policy to Combat Climate Change, Scientific American, March 17, 2009.
http://www.scientificamerican.com/article.cfm?id=connecting-science-and-po
• Pacific Institute, THE 2010 CLIMATE B.S.* OF THE YEAR AWARD , http://www.pacinst.org/press_center/press_releases/climate_bs_award.html
• Rachlinski, J. Psychology of Global Climate Change, 2000 Univesity of Ill.inois Law Review299 (2000)
• Smith, V. Kerry HOW CAN POLICY ENCOURAGE ECONOMICALLY SENSIBLE CLIMATE ADAPTATION?, NATIONAL BUREAU OF ECONOMIC RESEARCH, Working Paper 16100, June 2010
• http://www.nber.org/papers/w16100
• Stiglitz, Joseph, and Stern, Nicholas, Obama’s chance to lead the green recovery, Financial Times March 2, 2009• http://www.ft.com/cms/s/0/7c51644a-075b-11de-9294-000077b07658.html#ixzz1A4kssZbj
• UK DirectGov, Stern Review on Economics of Climate Change, http://www.direct.gov.uk/en/Nl1/Newsroom/DG_064854
• UK Energy Research Centre, The Rebound Effect: an assessment of the evidence for economy-wide energy savings from improved energy efficiency• October 2007, www.ukerc.ac.uk/Downloads/PDF/07/0710ReboundEffect/0710ReboundEffectReport.pdf
• United Cities and Local Governments, http://www.cities-localgovernments.org/index.asp
• U.S. Energy Information Administration, International Energy Outlook 2010, http://www.eia.doe.gov/oiaf/ieo/emissions.html
• Weitzman, Martin L (2010) GHG Targets as Insurance Against Catastrophic Climate Damages Department of Economics, Harvard University ([email protected]). June 3, 2010 version http://www.economics.harvard.edu/faculty/weitzman/files/1A1A.InsuranceCatastrophicRisks.pdf
Gold Coast Jan 18, 2011
References• UNFPA & International Institute for Environment and Development, Population Dynamics and Climate Change, 2009
• World Bank, World Development Report 2010: Development and Climate Change, http://econ.worldbank.org/WBSITE/EXTERNAL/EXTDEC/EXTRESEARCH/EXTWDRS/EXTWDR2010/0,,menuPK:5287748~pagePK:64167702~piPK:64167676~theSitePK:5287741,00.html
• World Bank, World Development Report2010, Public attitudes toward climate change: findings from Multicountry Poll July 2010, http://siteresources.worldbank.org/INTWDR2010/Resources/CC_Poll_Report_July_01_2010.pdf
• World Bank, World Development report 2010, Regional Vulnerability To Climate Change, http://econ.worldbank.org/WBSITE/EXTERNAL/EXTDEC/EXTRESEARCH/EXTWDRS/EXTWDR2010/0,,contentMDK:22303545~pagePK:64167689~piPK:64167673~theSitePK:5287741,00.html
• World Bank, Winds of Change: East Asia’s Sustainable Energy Future, 2010 http://siteresources.worldbank.org/INTEASTASIAPACIFIC/Resources/226262-1271320774648/windsofchange_fullreport.pdf
• World Mayors Summit on Climate http://www.wmsc2010.org/acerca-de-2/
• World Meteorological Organization, http://www.wmo.int/pages/index_en.html
• Yale University, Yale Project on Climate Change Communication, http://environment.yale.edu/climate/ & http://environment.yale.edu/climate/files/SixAmericasJune2010.pdf
•
Gold Coast Jan 18, 2011

Thank You!
Gold Coast Jan 18, 2011

Gold Coast Jan 18, 2011