gold and silver technicals and trendz june 2011
TRANSCRIPT

8/6/2019 Gold and Silver Technicals and Trendz June 2011
http://slidepdf.com/reader/full/gold-and-silver-technicals-and-trendz-june-2011 1/14
TREND FOR THIS WEEK 30 MAY 2011
Gold - I would like to see 1542 defeated early this week, to ward off pressure under a base
channel line at that level. Gold still ShortTerm bullish while above 1522. Key MediumTerm
support still at 1504. To keep on track for a 1660 to 1760 target in June, I want to see 1590+
touched this week.
Silver - I want to see it move above 39.50 this week, heading toward the initial target zone of
40.61 to 41.64.
36.75 is key support and critical MT support at 35.72
USD - posted a bearish outside engulfing line candle on the weekly. The 3/10/20 is aiming
toward a MT [MEDIUMTERM] bearish posture

8/6/2019 Gold and Silver Technicals and Trendz June 2011
http://slidepdf.com/reader/full/gold-and-silver-technicals-and-trendz-june-2011 2/14
The daily gold chart shows the short term uptrend that has been in place since May 17th.
The red circles on the chart is when the weaker cycles for the month are most apt to kick inand the blue circles when the stronger cycles are due to kick in. As in any cycle, not all of
them work -- but as you can see -- they do a good job of giving an edge as to expectations. As
long as price remains above the lower purple channel line -- the short term trend is up. First
resistance listed Thursday night was the 1538-1545 area -- and the high on Friday was
1538.10 --- we listed 1509-1516 as the low range for Thursday/Friday and the low was 1514.
AS LONG AS PRICE IS IN THE PURPLE CHANNEL --- odds favor the short term trend is up.
However --- the next SHORT TERM TREND CHANGE IS APPROACHING -- and is coming due
during the first week of June.
Not only that --- but there are long term cycles and seasonal cycles to watch for as we
approach June

8/6/2019 Gold and Silver Technicals and Trendz June 2011
http://slidepdf.com/reader/full/gold-and-silver-technicals-and-trendz-june-2011 3/14

8/6/2019 Gold and Silver Technicals and Trendz June 2011
http://slidepdf.com/reader/full/gold-and-silver-technicals-and-trendz-june-2011 4/14
Gold on a weekly chart shows the long term bull market is intact. The thing that has happened in May-- is that price
reached the green resistance line and produced a pullback. This line has produced all the pullbacks since the crash low.
Every touch of that line has producted a correction to the 34 week average -- and the lower green line. ALMOST EVERY
YEAR HAS HAD A PULLBACK FROM JUNE TO JULY/AUGUST. If this is the case --- then that is the most likely scenario. THE
NEXT COMING FEW WEEKS ARE VERY IMPORTANT to the trend. Not only are the short term weaker cycles on the top
chart coming due - and the yearly summer seasonal -- But the Martin Armstrong 4.3 year Economic Confidence model isdue in JUNE of 2011, meaning that a major line up of CYCLES are REACHING A PINNICLE TURN

8/6/2019 Gold and Silver Technicals and Trendz June 2011
http://slidepdf.com/reader/full/gold-and-silver-technicals-and-trendz-june-2011 5/14
The Martin Armstrong Economic Confidence Cycle is Due
--- I have noted the EVENTS that have taken place during this most important of all CYCLES. That is because it signals MAJOR MONEY FLOW
CHANGES from the Global Community. There is a MAJOR MONEY flow change about to develop. Note the events that have developed at these
trend changes. It isn't always the same market. Sometimes its the all time peak in interest rates, the peak of the NIKKI Japan market, the
NASDAQ 5000 peak --- and yes --- some key gold and silver turns. THE NEXT CYCLE TURN IS IN JUNE -- and if history repeats (because we never
learn from past mistakes) then the MONEY FLOW WILL SHIFT --- to the "NEXT" big thing. Can it be Gold ? SURE. Can it be something else ?
SURE. How will we know ? BY THE WAY THE PRICE CHARTS REACT at such a a big cycle turn.
Did SILVER peak a month early from this major cycle and is waiting for Gold to either finish its run into this cycle so it can Pullback into a
seasonal low in July/August -- OR IS THE CYCLE CALLING for a major turn ? ONE OF THE GLOBAL MARKETS is about to see a money shift --IN ---
- and the other OUT. (Note - The chart work I produce I learned from Mr. Armstrong being a loyal subscriber to him during the 80's for over 10
years).

8/6/2019 Gold and Silver Technicals and Trendz June 2011
http://slidepdf.com/reader/full/gold-and-silver-technicals-and-trendz-june-2011 6/14
The Edge of the Wedge chart
On a long term weekly basis (below) the 21st Century Gold Bull market remains intact at
the moment. A test of the dotted trend lines might be in the making near the 1400-1425
dollar area for the summer lows ???? . The long term trend remains up --- but that upper
trend line should be considered resistance at the 1575 area. THIS IS THE MOST
IMPORTANT UPSIDE AT THE MOMENT -- AND THE PRICE TO BEAT.

8/6/2019 Gold and Silver Technicals and Trendz June 2011
http://slidepdf.com/reader/full/gold-and-silver-technicals-and-trendz-june-2011 7/14
SILVERWe've discussed the importance of the long term blue line and look how the market "recognizes" this most important line.
For the entire bull market it was a major resistance line. Since the peak, price has now returned to this long term blue line
to TEST if it now becomes support. Major support is this 32-34 dollar area and where the RED moving average and other
support line at the 27.50 dollar area. A BOUNCE BACK TOWARDS the upper momentum line and the moving averages is in
play. Note how price and the blue 34 week average --- both arrived at the long term blue line at the same time.

8/6/2019 Gold and Silver Technicals and Trendz June 2011
http://slidepdf.com/reader/full/gold-and-silver-technicals-and-trendz-june-2011 8/14
The HUI gold stocks bounced right at the support line below the channel and the bounce today was right at the up trend
line at to the moving averages. Did price make a bottom or was this just a bounc? - PRICE HAS HELD A KEY AREA of support -
-- and as long as price remains above 500-520 -the same number we have been using for the past year, -- the trend is still
intact. Price is now testing the moving averages. THUS the MOVING AVERAGE BLUE LINE is the PIVOT to keeping the
"TREND" in up mode. A break below the 490 AREA and the CHANNEL LINES will warn of a JULY/AUGUST low in the GOLD
STOCKS
8/6/2019 Gold and Silver Technicals and Trendz June 2011
http://slidepdf.com/reader/full/gold-and-silver-technicals-and-trendz-june-2011 9/14
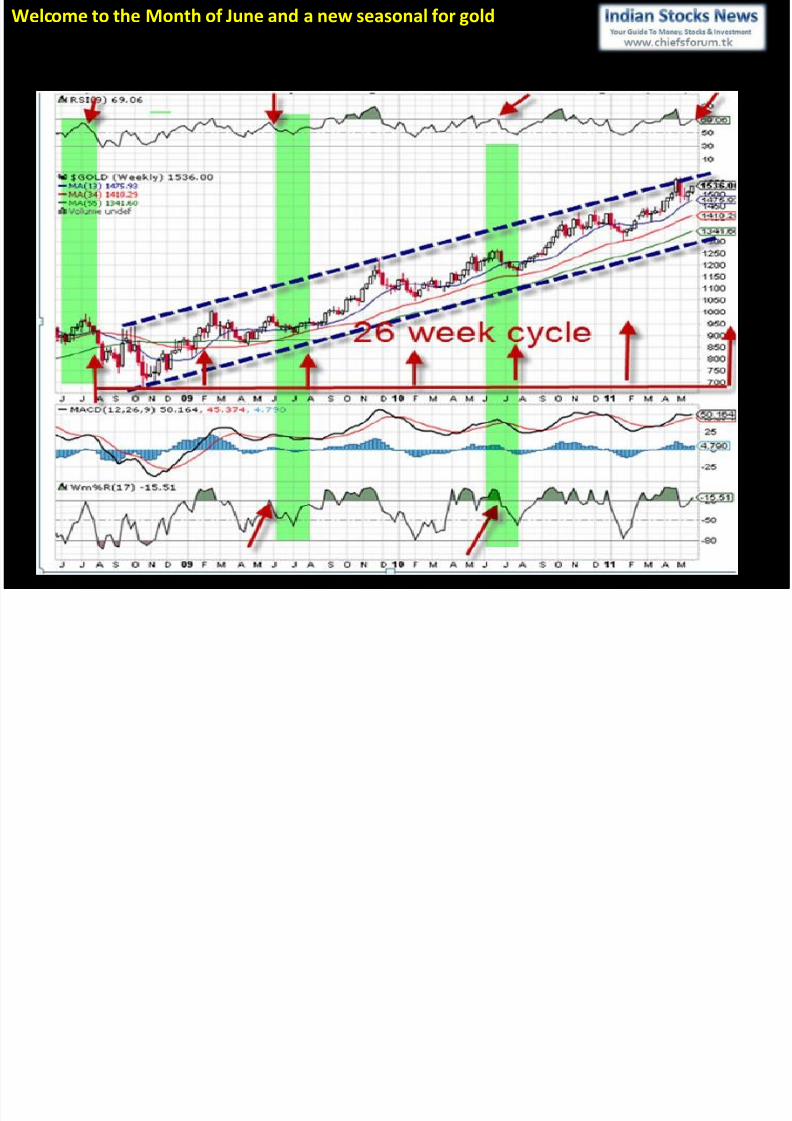
Welcome to the Month of June and a new seasonal for gold
In the past three years --- this is when gold has a vulnerable weak point. If the technicals (RSI and WILLIAMS) break here and
we move below the 13 week moving average ----- the seasonal pullback should be in Play.

8/6/2019 Gold and Silver Technicals and Trendz June 2011
http://slidepdf.com/reader/full/gold-and-silver-technicals-and-trendz-june-2011 10/14
GLOBAL GOLD --- The first clue of a SEASONAL CORRECTION on a global scale for GOLD
comes with the Swiss Franc chart. THIS WEEK GOLD closed below all THREE WEEKLY
MOVING AVERAGES.
May 28th 2011 UpdateNow we come to the Month of June -- Memorial Day Weekend -- and the Summer kick-off for USA. On the
calendar its not until June 21st but the point is the Summer season is the time when gold is most likely to
be at its weakest of the year.
Prices usually peak in May/June and drift lower into July/August. The level of the drop is based on the
strength of the underlying commodity. Last year -- Gold re-rallied into the week of June 21st --- and then
dropped to the 1154 low on July 28th --- and bottomed for the year. We'll look for a week 1 June high ----
pullback to mid month ---near the 17th and then one final quick push before the weakest part of the cyclekicks in.
8/6/2019 Gold and Silver Technicals and Trendz June 2011
http://slidepdf.com/reader/full/gold-and-silver-technicals-and-trendz-june-2011 11/14
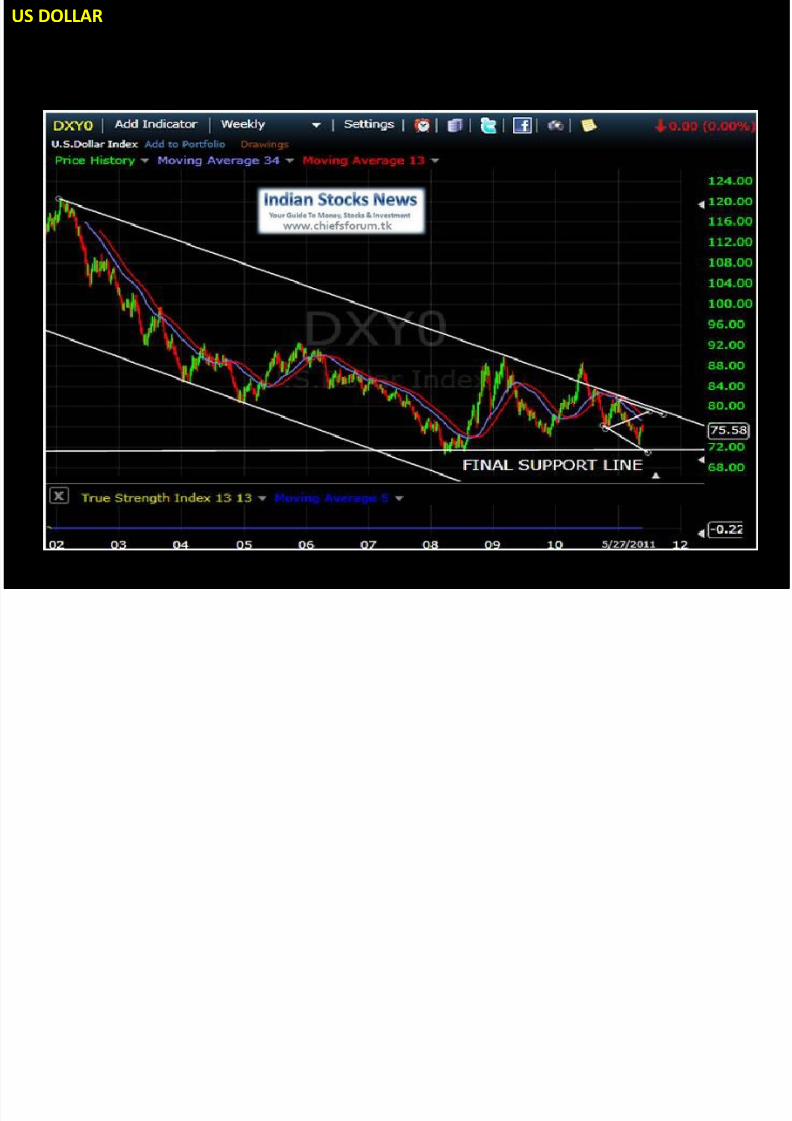
US DOLLAR
The US DOLLAR pulled back last week and held the moving averages. As long as price is above
the moving averages on a closing basis --- the short term trend is up. A lot of the rise is coming
from the Euro -- which has taken a good hit on debt concerns.
8/6/2019 Gold and Silver Technicals and Trendz June 2011
http://slidepdf.com/reader/full/gold-and-silver-technicals-and-trendz-june-2011 12/14
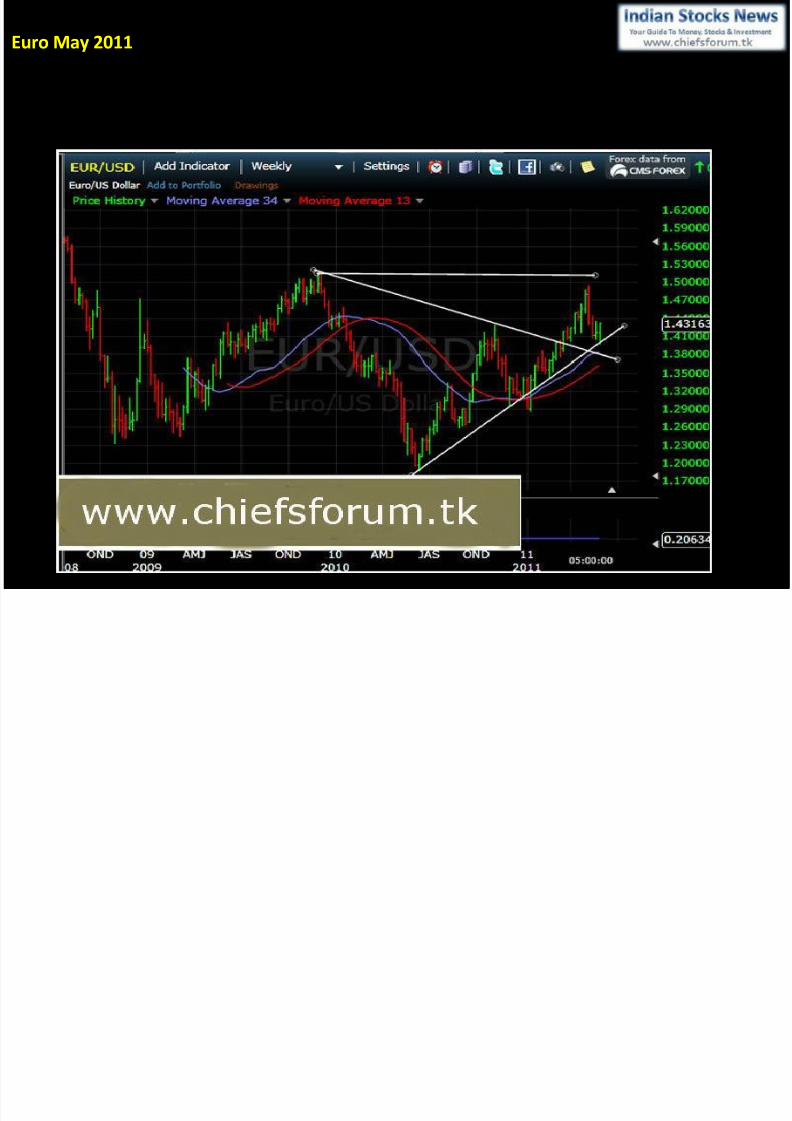
Euro May 2011
The medium term Euro trend remains in trouble but price found support at the downtrend line
in the 139-140 area. On a weekly medium term basis --- the 34 week average and the
downtrend line is current support for Euro price. THE MONTH OF JULY IS USUALLY AN
IMPORTANT TURN POINT FOR THE CURRENCIES.

8/6/2019 Gold and Silver Technicals and Trendz June 2011
http://slidepdf.com/reader/full/gold-and-silver-technicals-and-trendz-june-2011 13/14

8/6/2019 Gold and Silver Technicals and Trendz June 2011
http://slidepdf.com/reader/full/gold-and-silver-technicals-and-trendz-june-2011 14/14