gocl corporation limited · this document may include predictions, estimates or other information...
TRANSCRIPT
GOCL Corporation Limited
56th Annual General Meeting
29th August 2017
GOCL Corporation Limited
56th Annual General Meeting
29th August 2017
Welcome to Shareholders
1516
2584
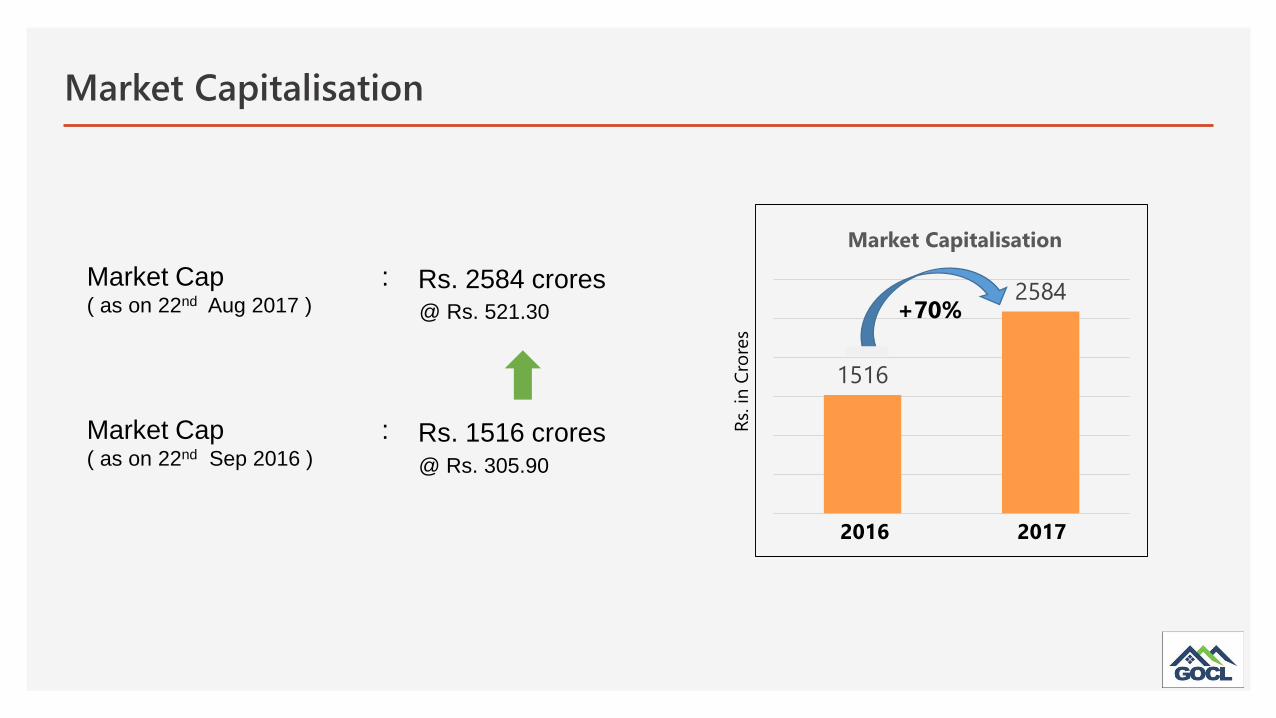
Market Capitalisation
Rs.
in
Cro
res
Market Cap :( as on 22nd Aug 2017 )
Market Cap :( as on 22nd Sep 2016 )
@ Rs. 521.30
@ Rs. 305.90
Market Capitalisation
2016 2017
Rs. 1516 crores
Rs. 2584 crores+70%
ICRA Rating
ICRA has reaffirmed the ratings of your Company as :
Long term Rating
[ICRA] BBB
Short term Rating
[ICRA] A3 +

Overview of the Performance
Year 2016-17
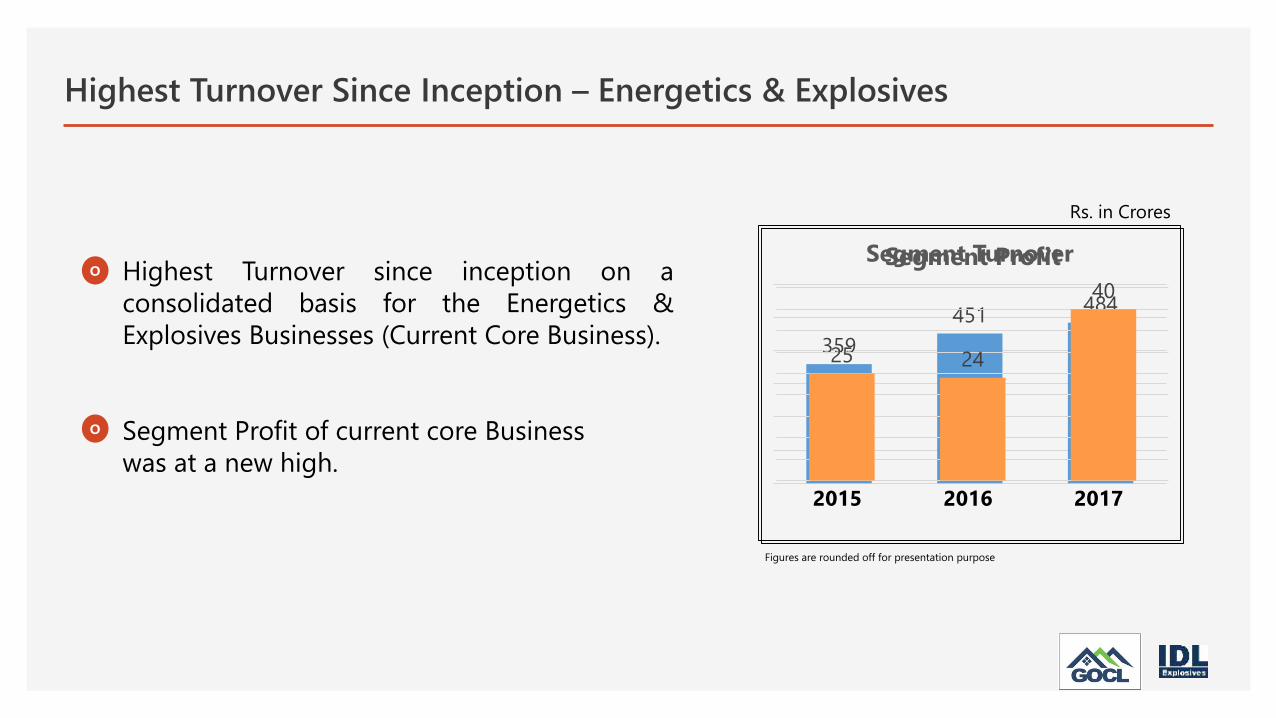
359
451484
Segment Turnover
Highest Turnover Since Inception – Energetics & Explosives
Figures are rounded off for presentation purpose
Rs. in Crores
Highest Turnover since inception on a
consolidated basis for the Energetics &
Explosives Businesses (Current Core Business).
Segment Profit of current core Business
was at a new high.
o
o
25 24
40
Segment Profit
2015 2016 2017
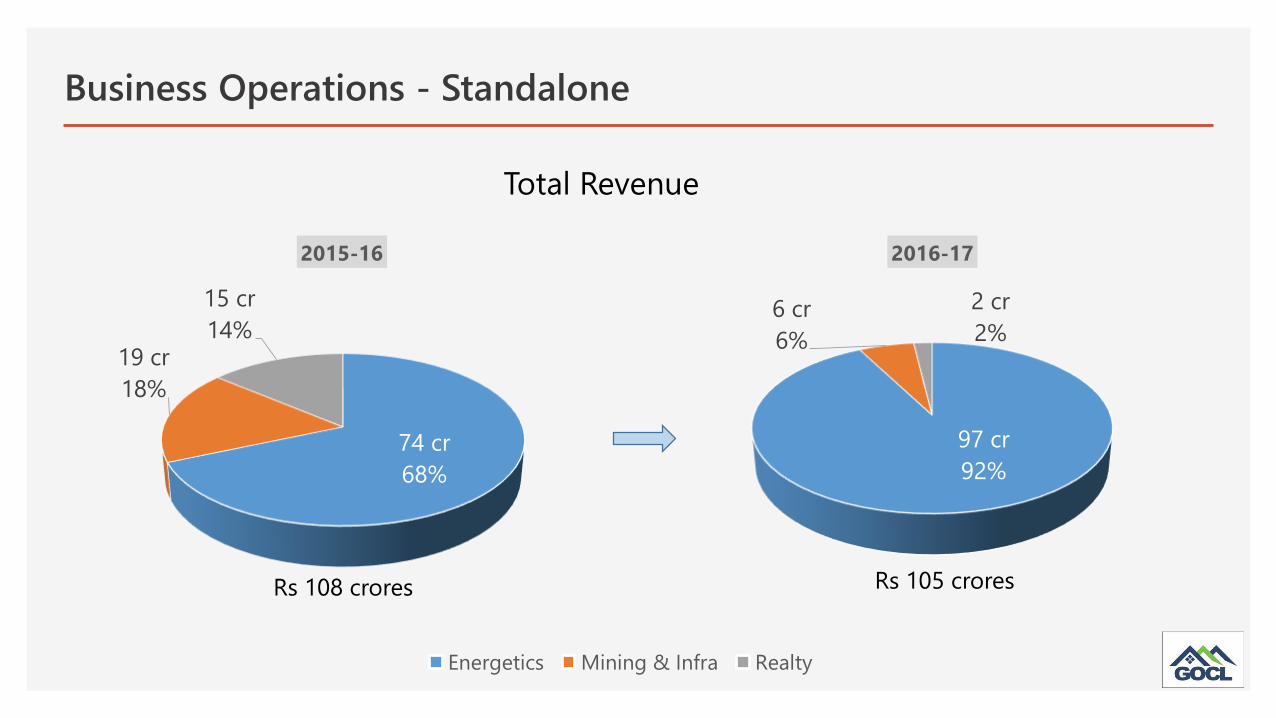
97 cr
92%
6 cr
6%
2 cr
2%
2016-17
Business Operations - Standalone
74 cr
68%
19 cr
18%
15 cr
14%
2015-16
Rs 108 crores Rs 105 crores
Total Revenue
Energetics Mining & Infra Realty
o
o
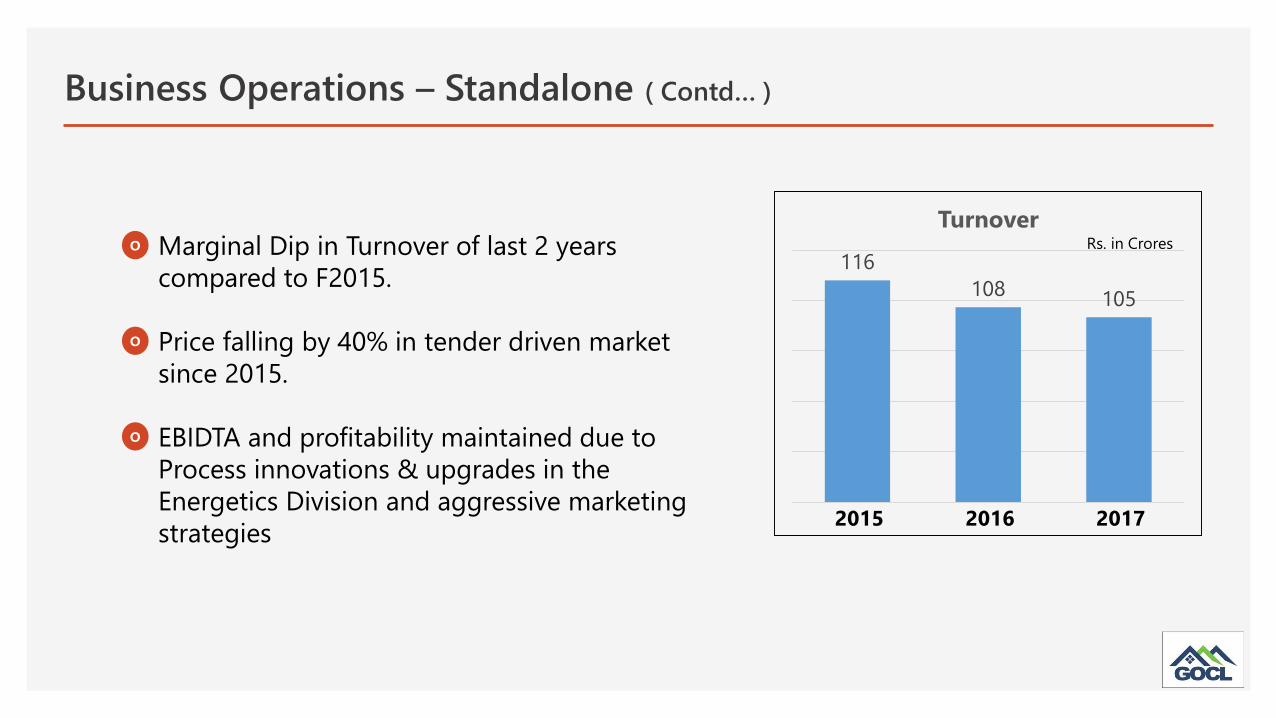
Marginal Dip in Turnover of last 2 years
compared to F2015.
Price falling by 40% in tender driven market
since 2015.
EBIDTA and profitability maintained due to
Process innovations & upgrades in the
Energetics Division and aggressive marketing
strategies
o
116
108105
Turnover
Business Operations – Standalone ( Contd… )
2015 2016 2017
Rs. in Crores
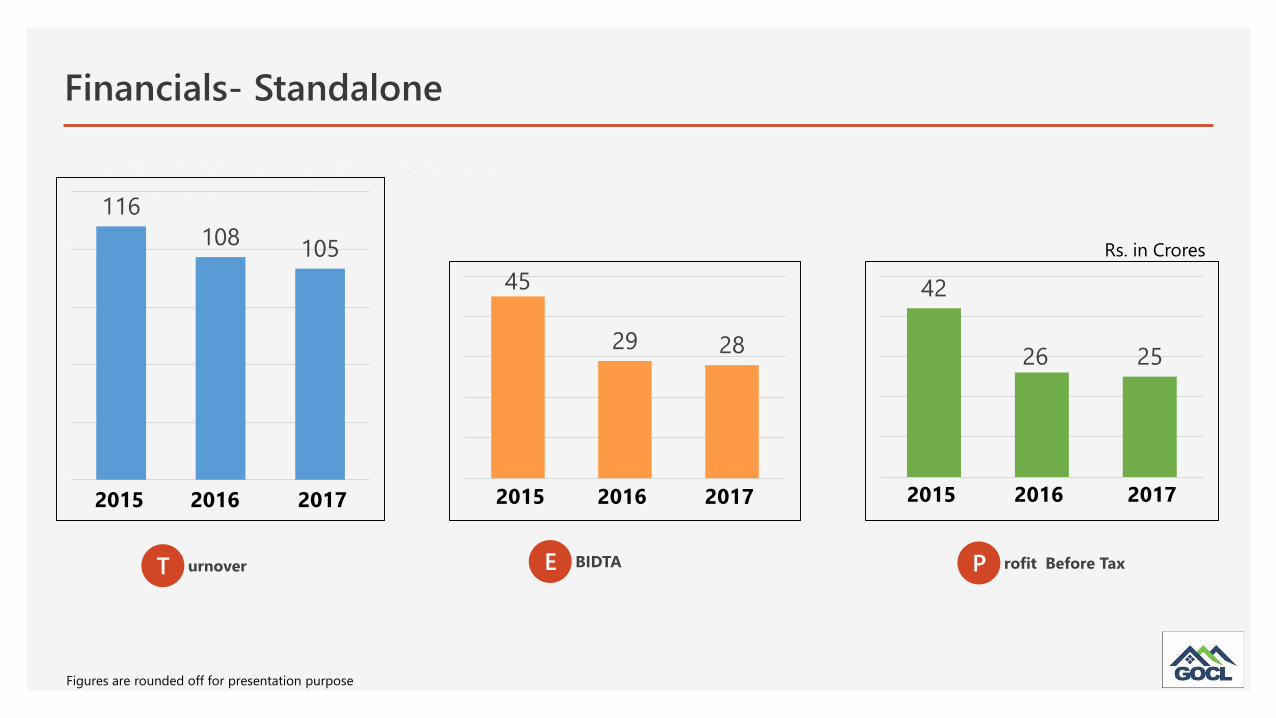
Financials- Standalone
When you share your presentation with others, you’ll see them
working with you at the same time.
How it works:
T urnover
116
108105
E BIDTA
45
29 28
P rofit Before Tax
42
26 25
Figures are rounded off for presentation purpose
Rs. in Crores
2015 2016 2017 2015 2016 2017 2015 2016 2017

When you share your presentation with others, you’ll see them
working with you at the same time.
How it works:
P rofit After Tax as % to Sales
16.27
18.32
PAT % to Sales
E PS
3.55
3.90
EPS
Figures are rounded off for presentation purpose
Rs. in Crores
Financials - Standalone ( Contd… )
18
19
PAT
P rofit After Tax
2016 2017 2016 2017 2016 2017
(Rs.)

Borrowings
46
19
Long Term
319
0
Short Term
L ong Term S hort Term
Rs. in Lakhs
2016 2017 2016 2017
Figures are rounded off for presentation purpose
When you share your presentation with others, you’ll see them
working with you at the same time.
How it works:
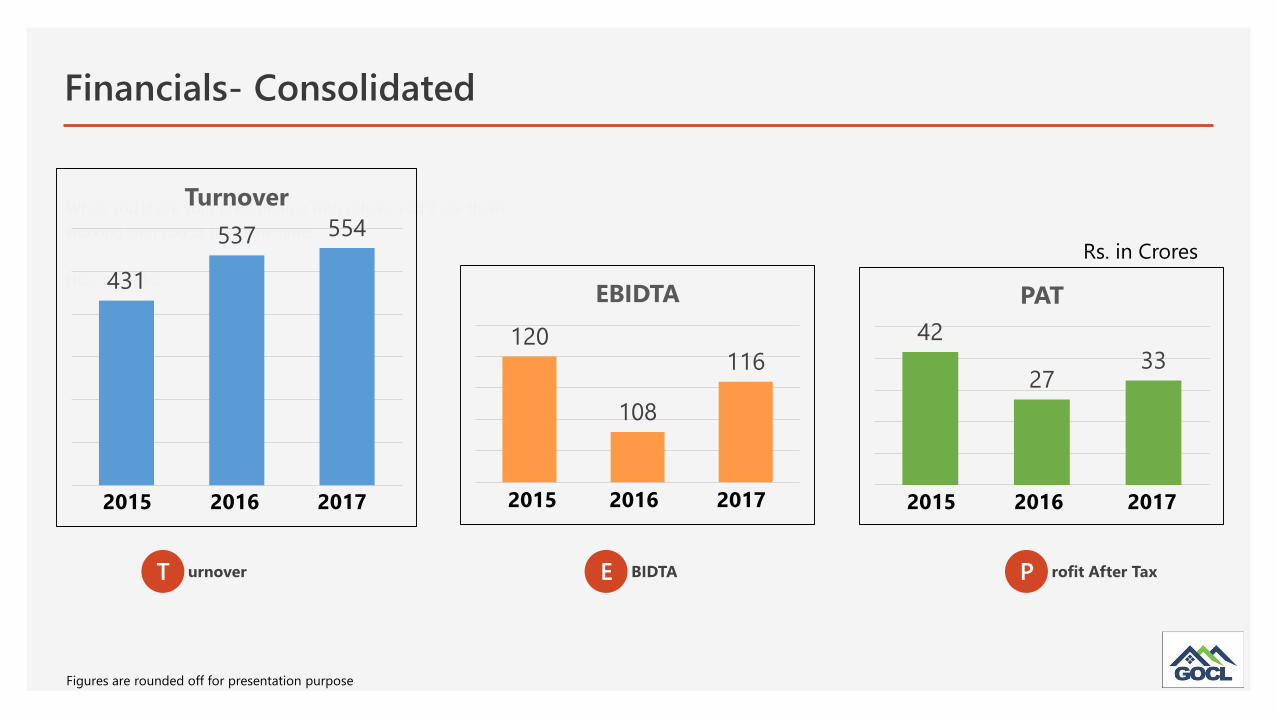
T urnover
431
537 554
Turnover
E BIDTA
120
108
116
EBIDTA
P rofit After Tax
42
2733
PAT
Financials- Consolidated
Figures are rounded off for presentation purpose
Rs. in Crores
2015 2016 2017 2015 2016 2017 2015 2016 2017

Production Output
When you share your presentation with others, you’ll see them
working with you at the same time.
How it works:
D etonators
62
71
Detonators
D Cords
12
16
Dcords
E xplosives
1.2
1.32Explosives
Figures are rounded off for presentation purpose
2016 2017 2016 2017 2016 2017
Million Nos Million Mtrs Lakh Metric Tonnes
Divisionwise Performances
Energetics Division

Energetics
o
o
Gross Turnover : Rs. 97 crores
Increase of 30%
Volume Increase :
Domestic Exports
Detonators 14% 37%
Det. Fuse 49% 46%
14%
49%
Detonators Det. Fuse
Volume Increase
( Domestic )
74
97
TurnoverRs. in Crores
2016 2017
37%
46%
Detonators Det. Fuse
Volume Increase
( Exports )
( Compare to F 2016 )
14%
33%
Detonators Det. Fuse
Production

Energetics ( Contd… )
o
o
Several Projects for upgradation and modification of
processes and equipment for enhancing production &
safety were completed.
Actions were taken to reduce production costs and
improve efficiencies.
Pilot Plant for manufacture of HMX for captive
consumption was also completed.
o
HMX Plant
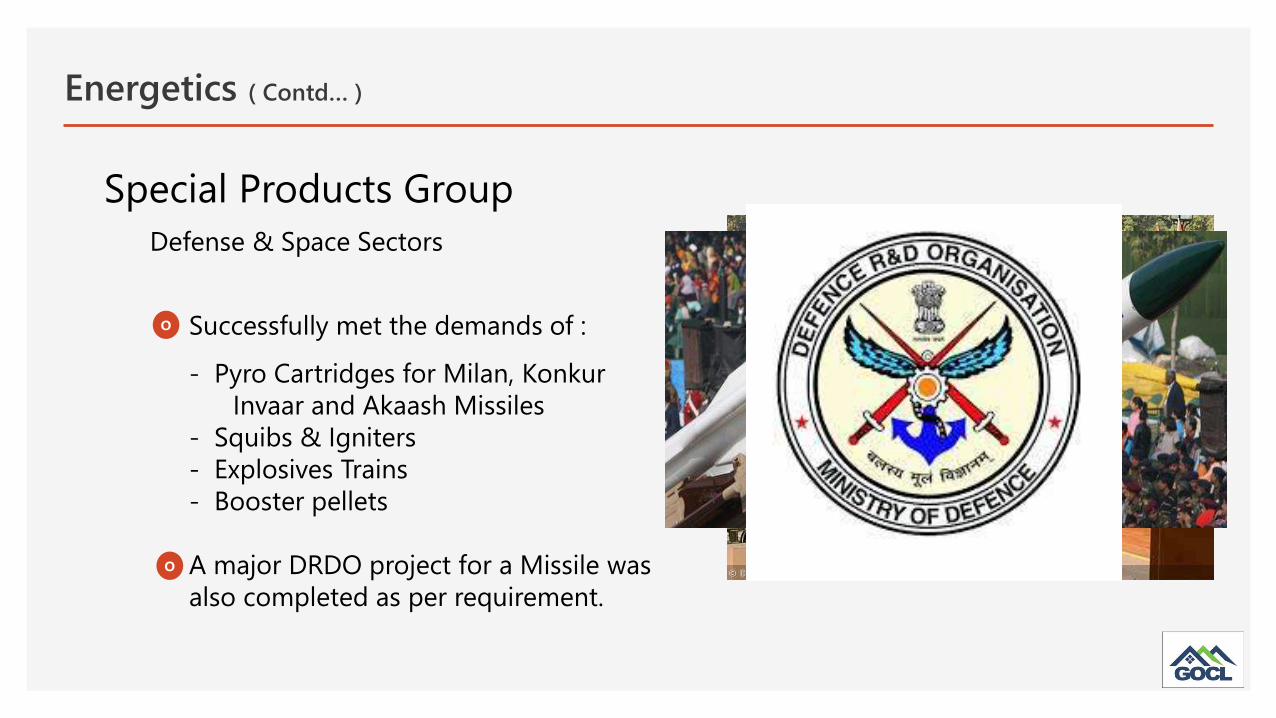
Energetics ( Contd… )
o Successfully met the demands of :
- Pyro Cartridges for Milan, Konkur
Invaar and Akaash Missiles
- Squibs & Igniters
- Explosives Trains
- Booster pellets
A major DRDO project for a Missile was
also completed as per requirement.
o
Special Products Group
Defense & Space Sectors
Exports
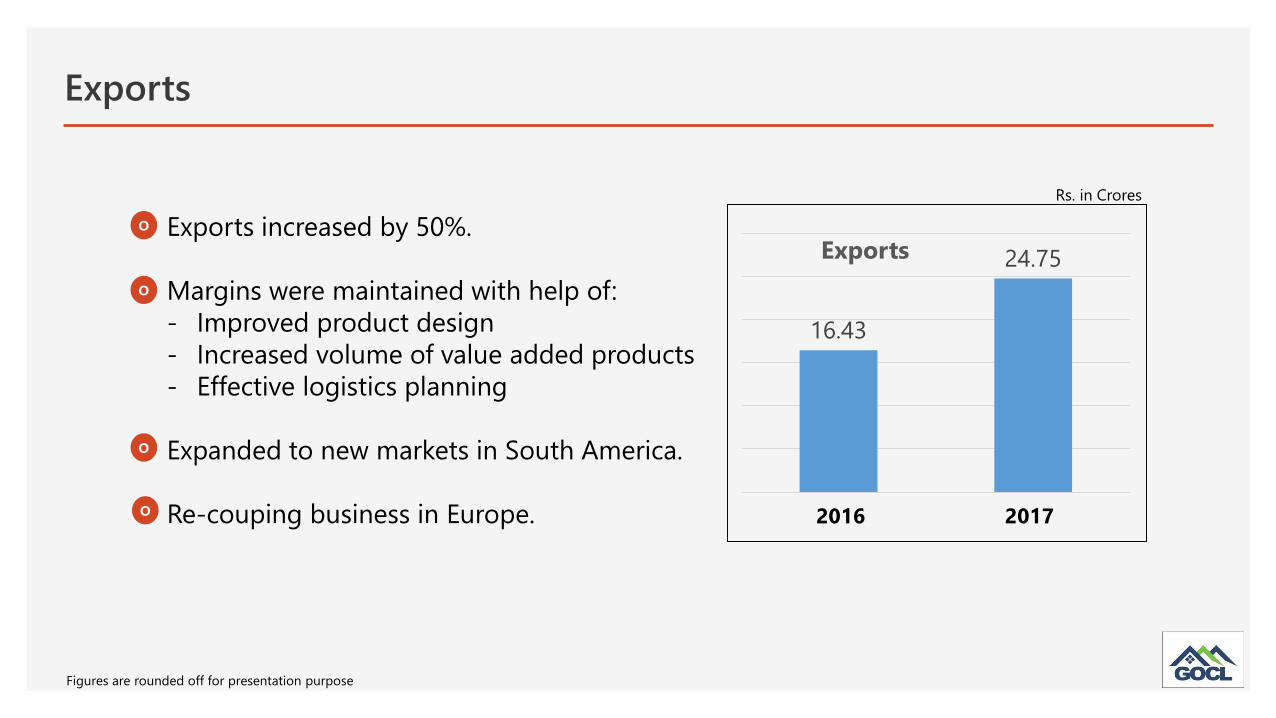
o
o
Exports increased by 50%.
Margins were maintained with help of:
- Improved product design
- Increased volume of value added products
- Effective logistics planning
Expanded to new markets in South America.
Re-couping business in Europe.
o
o
16.43
24.75Exports
Figures are rounded off for presentation purpose
Rs. in Crores
2016 2017
Mining & Infrastructure Division
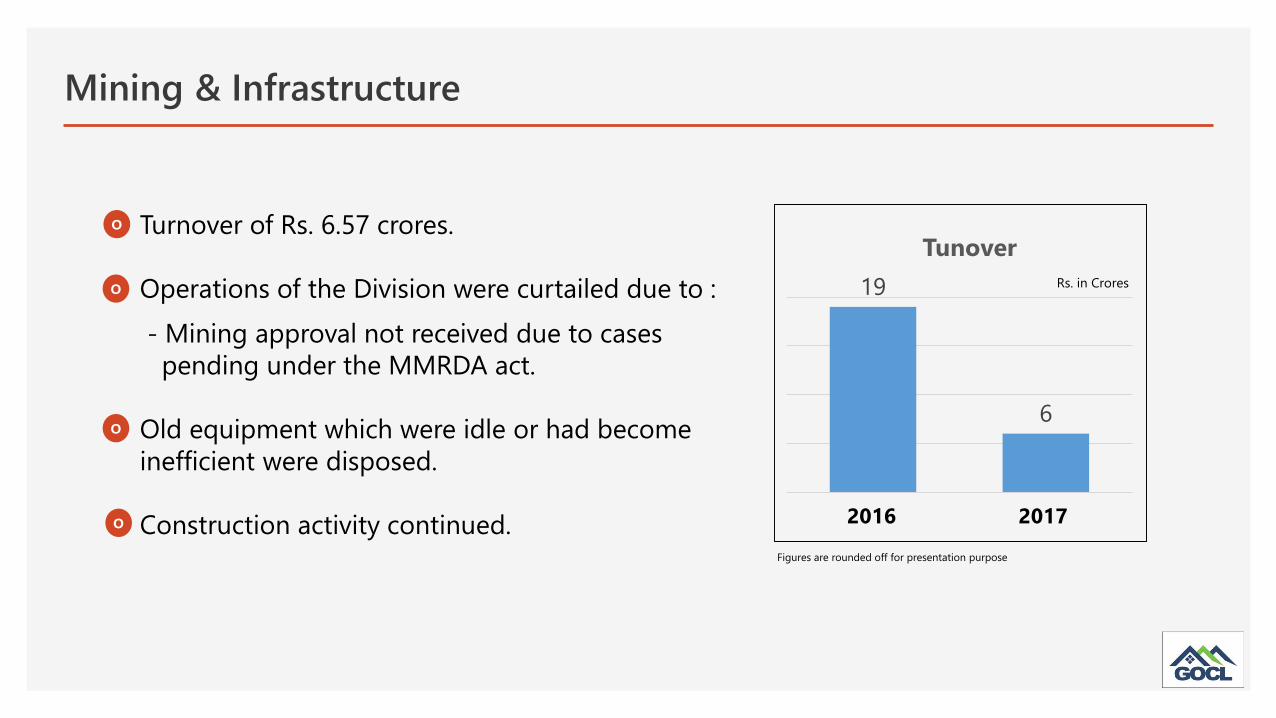
Mining & Infrastructure
o Turnover of Rs. 6.57 crores.
Operations of the Division were curtailed due to :
- Mining approval not received due to cases
pending under the MMRDA act.
Old equipment which were idle or had become
inefficient were disposed.
Construction activity continued.
o
o
o
19
6
Tunover
2016 2017
Figures are rounded off for presentation purpose
Rs. in Crores
IDL Explosives LimitedWholly Owned Subsidiary

Wholly Owned Subsidiary – IDL Explosives Limited
When you share your presentation with others, you’ll see them
working with you at the same time.
How it works:
T urnover
337
450 469
Turnover
E BIDTA
1922
37EBIDTA
P rofit After Tax
7 7
16
PAT
Figures are rounded off for presentation purpose
Rs. in Crores
2015 2016 2017 2015 2016 2017 2015 2016 2017
C artridge & Bulk
Explosives
1.2
1.32
ProductionLakh Metric Tonnes
2016 2017

Wholly Owned Subsidiary – IDL Explosives Limited ( Contd… )
This improved performance was due to
innovation and expansion of the plants.
A new continuous slurry plant was installed at
Rourkela Factory.
New Bulk emulsion support plants were
commissioned at Damogoria, West Bengal and
Raigarh, Chhattisgarh to meet the growing
demand.
The Improved capacity utilization helped in
better margins.
o
o
o
o
Outlook for the Year 2017-18
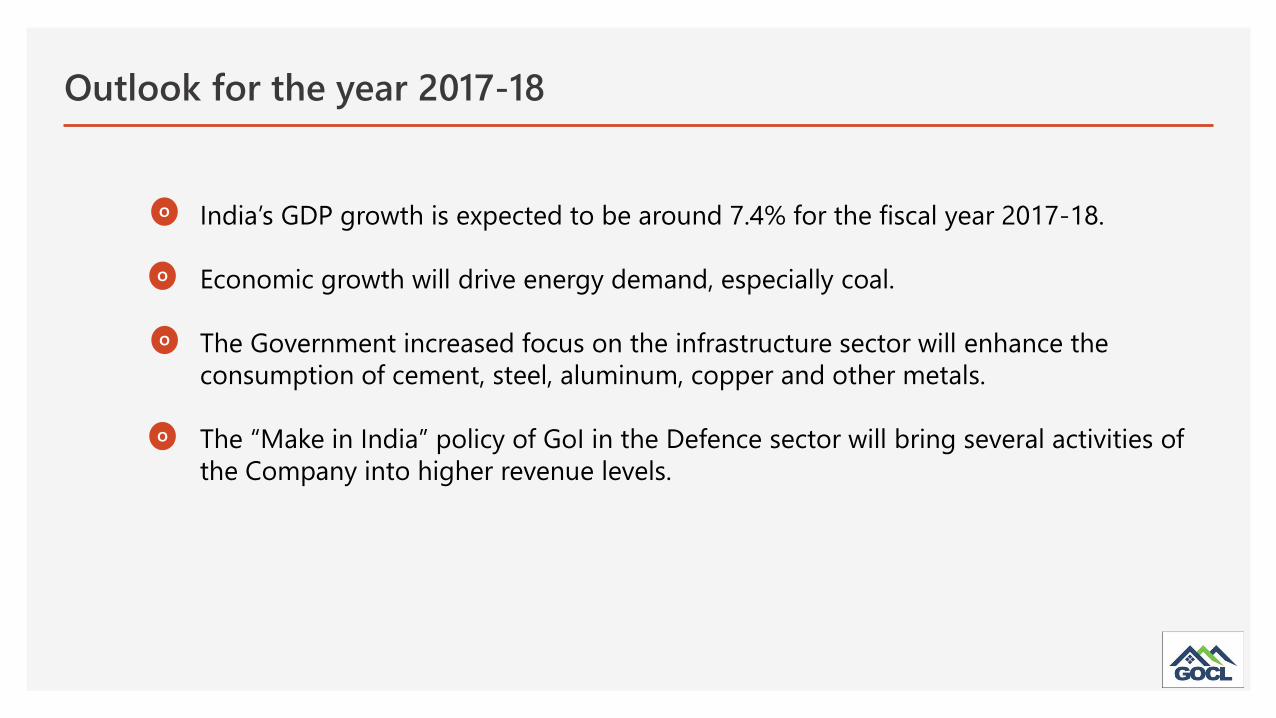
Outlook for the year 2017-18
India’s GDP growth is expected to be around 7.4% for the fiscal year 2017-18.
Economic growth will drive energy demand, especially coal.
The Government increased focus on the infrastructure sector will enhance the
consumption of cement, steel, aluminum, copper and other metals.
The “Make in India” policy of GoI in the Defence sector will bring several activities of
the Company into higher revenue levels.
o
o
o
o

The growth of GDP will drive the demand for Power, Steel, Cement and major Minerals
which in turn sustains the demand for Explosives & Accessories.
Also significant increase in demand is expected from infrastructure, transport, housing and
irrigation segments.
The growth in demand in these areas over the medium and long term augurs well for the
Company to deliver enhanced value to stakeholders.
Outlook for the year 2017-18 ( Contd… )
Energetics & Explosives
o
o
o
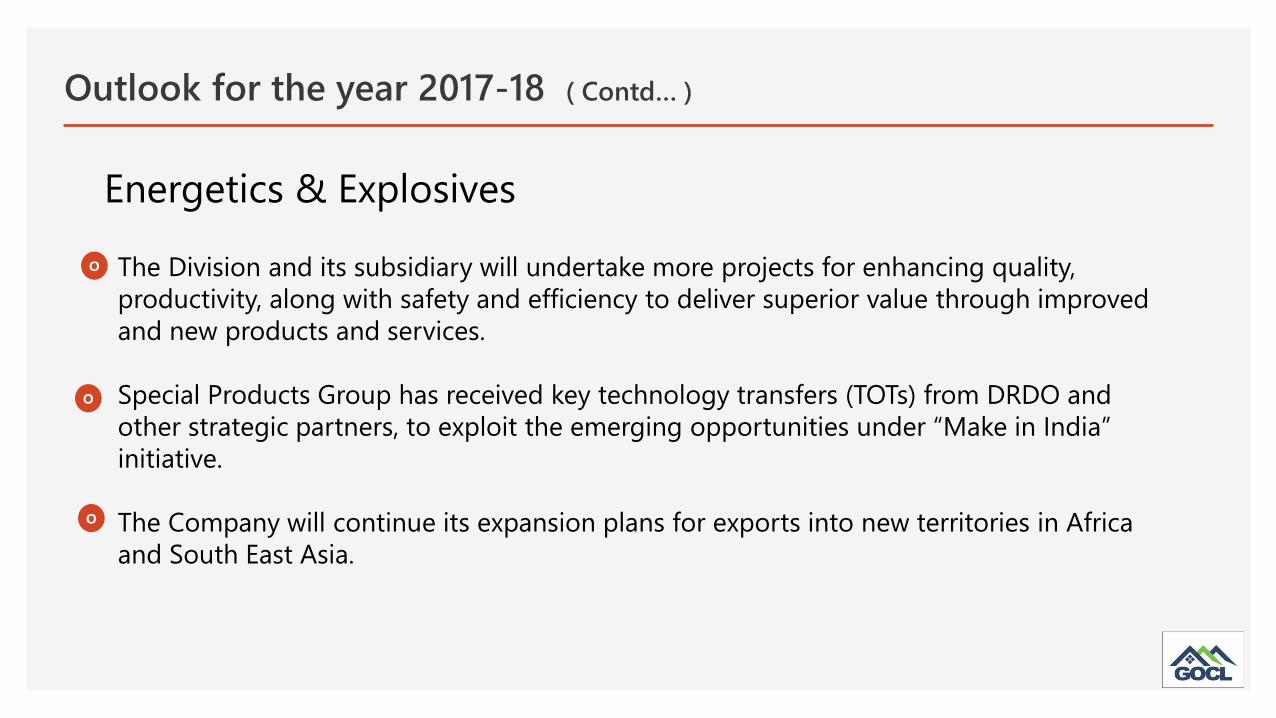
The Division and its subsidiary will undertake more projects for enhancing quality,
productivity, along with safety and efficiency to deliver superior value through improved
and new products and services.
Special Products Group has received key technology transfers (TOTs) from DRDO and
other strategic partners, to exploit the emerging opportunities under “Make in India”
initiative.
The Company will continue its expansion plans for exports into new territories in Africa
and South East Asia.
Energetics & Explosives
o
o
o
Outlook for the year 2017-18 ( Contd… )

Mining business in the metal sector, is awaiting Supreme Court orders under the
MMRDA Act.
Very limited activity is currently being continued in mines meant for captive
consumption.
The commercial mining activities will be taking more time as several clarifications are
still awaited.
Infrastructure work is being continued on a limited scale.
Mining & Infrastructure
o
o
o
o
Outlook for the year 2017-18 ( Contd… )
Realty Division
Realty
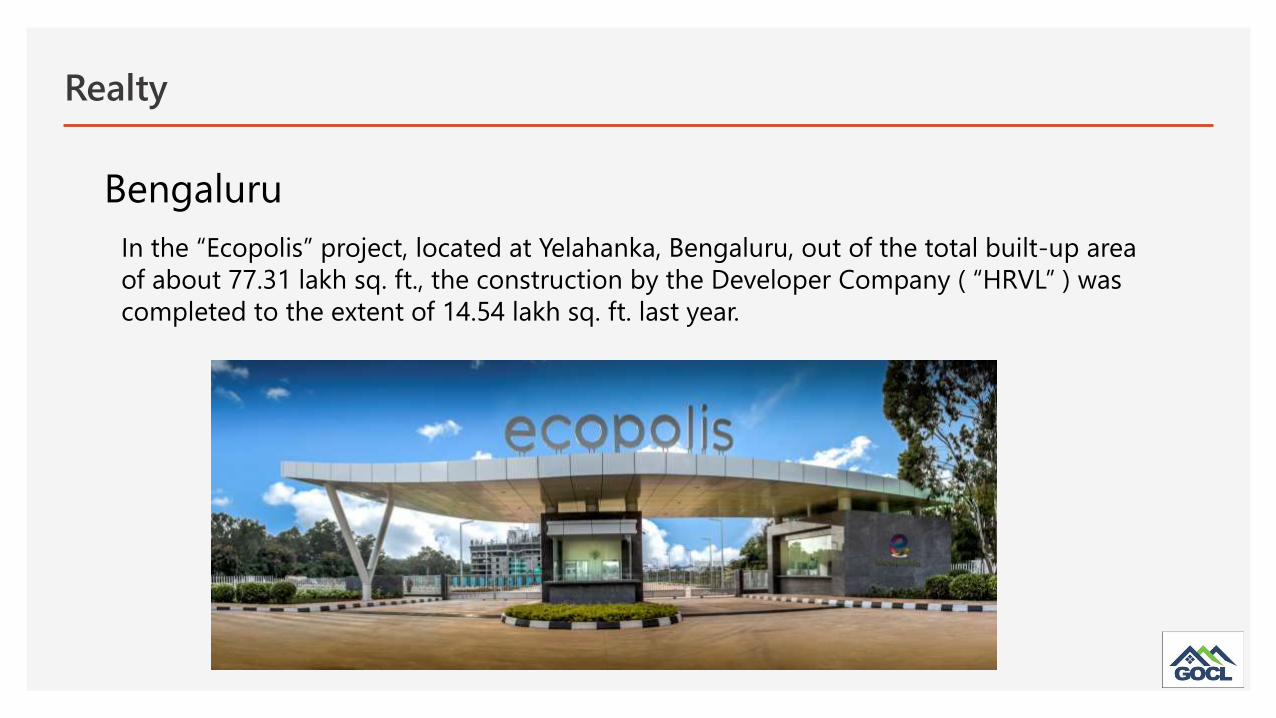
In the “Ecopolis” project, located at Yelahanka, Bengaluru, out of the total built-up area
of about 77.31 lakh sq. ft., the construction by the Developer Company ( “HRVL” ) was
completed to the extent of 14.54 lakh sq. ft. last year.
Bengaluru

Realty
This year another 10.06 lakh sq. ft. is added as Block 2 of the SEZ area is nearing completion.
Bengaluru
Realty
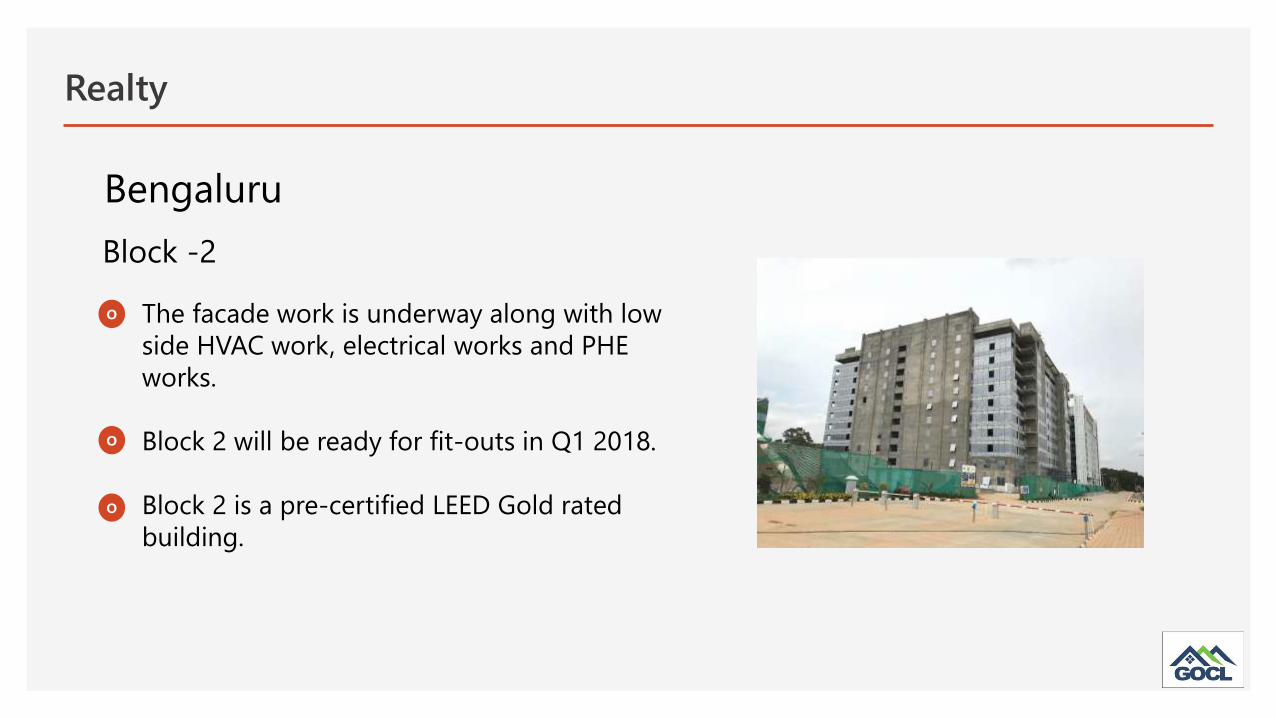
The facade work is underway along with low
side HVAC work, electrical works and PHE
works.
Block 2 will be ready for fit-outs in Q1 2018.
Block 2 is a pre-certified LEED Gold rated
building.
Bengaluru
Block -2
o
o
o
Realty
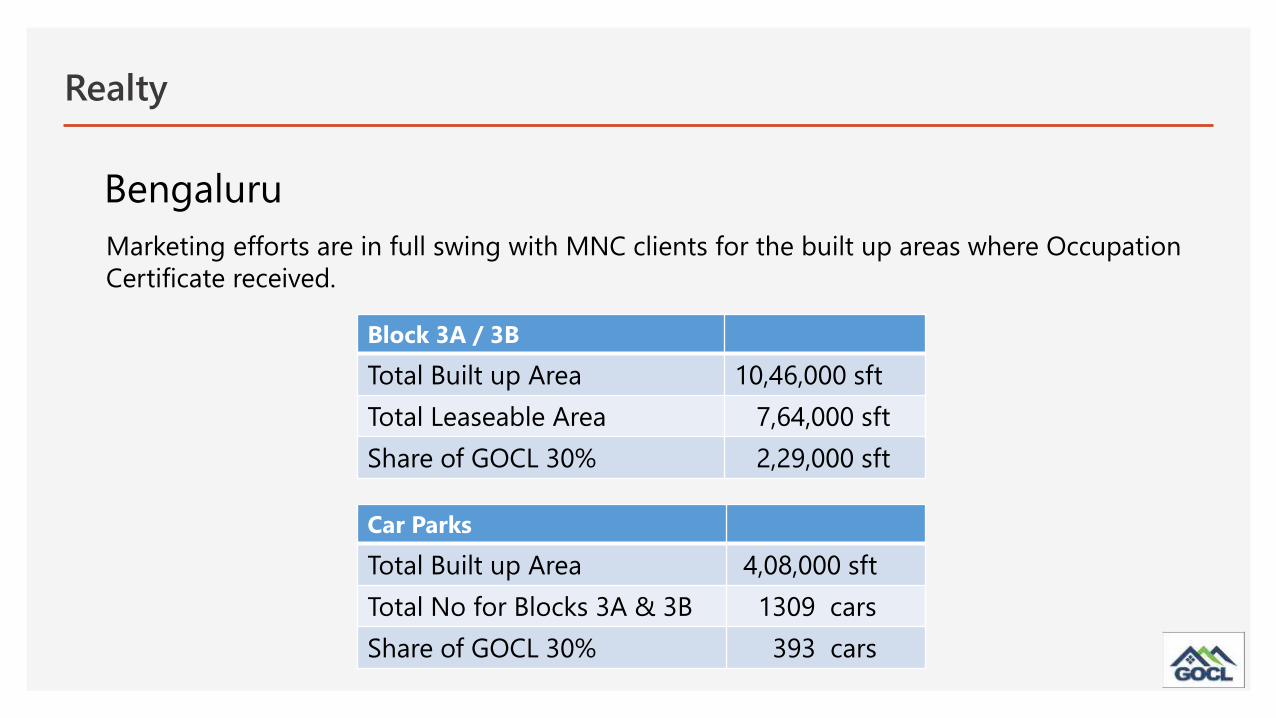
Marketing efforts are in full swing with MNC clients for the built up areas where Occupation
Certificate received.
Bengaluru
Block 3A / 3B
Total Built up Area 10,46,000 sft
Total Leaseable Area 7,64,000 sft
Share of GOCL 30% 2,29,000 sft
Car Parks
Total Built up Area 4,08,000 sft
Total No for Blocks 3A & 3B 1309 cars
Share of GOCL 30% 393 cars

Realty
The Area details of Block 2 :
Bengaluru
Block 2
Total Built up Area 10,06,000 sft
Total Leaseable Area 7,06,000 sft
Share of GOCL 30% 2,11,800 sft
Car Parks
Total Car Parks 885 cars
Share of GOCL 30% 266 cars
Realty
The Developer Company is closely working with consultants and local
brokers for built up areas in Block 3A / 3B as well as for future
developments as per the approved Master Plan.
The Developers have received clients’ sale / lease and ‘Build to Suit’
requirements from reputed organizations and are working towards a
positive conclusion.
Bengaluru
o
o
The Real Estate (Regulation and Development) Act 2016, which has recently come into
force, is expected to create a uniform regulatory environment and bring transparency
to the sector, thereby giving a boost to investments into the sector which had turned
sluggish.
The first quarter of calendar year 2017 saw India’s gross office take-up of space
amounting to 9.3 million sft. Bengaluru maintained its top position in comparison to
9 cities with 37% share of total absorption area.
Our development being located in the North Bengaluru block towards the new
airport should receive good demand in 2017–18, since the realty blocks at Bengaluru
such as Outer Ring Road, Suburban Business District, Central Business District,
Whitefield and Bannerghatta Road are expected to reach saturation.
Bengaluru
Realty
o
o
o

Hyderabad commercial market clocked 0.51 million sq. ft. of total office leasing
volume in Q1 2017.
IT / ITeS segment contributed to 61% of the total share followed by healthcare (20%),
business centers (15%) and others (4%).
With the MNCs signing large office spaces in the last few months The city saw the
second-largest office space absorption after Bengaluru.
Hyderabad
Realty
o
o
o
Owing to its proximity to the IT hub in Hyderabad, the Company’s Project at
Kukatpally will be an Integrated Mixed-use Township comprising of residential
apartments, IT / ITeS office space, retail, healthcare, educational facilities, leisure and
hospitality facilities.
An Integrated new Master Plan for full 100-acre development has been reworked to
suit the present market conditions. A more detailed revised plan has been submitted
for approval.
Realty
Hyderabad
o
o

Hyderabad
Master Plan

Strategic Investments
As reported earlier the Company through its UK based subsidiary HGHL Holdings
Limited, UK (HGHL) holds 10% stake in Houghton International Inc., USA a subsidiary of
the Hinduja Group’s Gulf Oil International.
Houghton International, has in the month of April 2017 entered into a definitive
agreement to combine with Quaker Chemical Corporation ( listed on the NYSE : KWR )
to create a global leader in the space of process fluids, chemical specialties, and
technical expertise to the global primary metals and metal working industries.
The Hinduja conglomerate will be the largest shareholder in the combined public
company. Your Company will be entitled to approx. 2% in the combined entity.
o
o
o

In Conclusion…
The economy is accelerating with the reforms and attention of the
Government to laggard sectors. Mining and Real Estate activities are
expected to pick up momentum.

Safe Harbour Statement
This document may include predictions, estimates or other information that might be considered forward-looking.
While these forward-looking statements represent current judgment on what the future holds, they are subject to risks
and uncertainties that could cause actual results to differ materially. GOCL disclaims any obligation to update / revise
or publicly release any revision to these forward-looking statements in light of new information or future events.
This material was used by GOCL Corporation Limited during an oral presentation; it is not a complete record of the
discussion. No part of this presentation is to be circulated, quoted, or reproduced for any distribution without prior
written approval from GOCL Corporation Limited.
Thank you