glycemic index of ten common horse feeds
TRANSCRIPT

REFEREED
Glycemic Index of Ten Common Horse FeedsAnne V. Rodiek MS, PhD,a and Carolyn L. Stull, MS, PhDb
ORIGINAL RESEARCH
ABSTRACT
Two 6 � 6 Latin-square designed experiments exam-ined the glycemic responses to 10 common equine feedsin six Quarter Horse mares. At 8:00 AM of the samplingdays, horses were offered a meal of 1 of 10 commonfeeds. The amount of feed offered was calculated onan isocaloric basis at 4 Mcal digestible energy permeal. Jugular blood samples were collected for 300 min-utes after feeding, and plasma was analyzed for glucoseconcentration. The results showed that plasma glucosevalues peaked approximately 90 to 120 minutes aftereating, whereas glycemic index (GI) values rangedfrom 7 to 129 based on a standard of oats set at a GIof 100. The four feeds with the highest GI values (sweetfeed, corn, jockey oats, and oats) were greater (P < .05)than the four feeds with the lowest GI values (beet pulp,alfalfa, rice bran, and soy hulls). Barley and wheat branhad intermediate GI (55–69) values, but were not sig-nificantly different from either the high or low group.Whereas large variations in the data were found, conser-vative utilization of the ranking or categories of GIvalues of the 10 common horse feeds examined maybe useful for formulating rations with different glycemicobjectives.
Keywords: Horses; Glucose; Glycemic response; Energy;Oats; Alfalfa
INTRODUCTIONPopulation studies in humans have shown a relationshipbetween high glycemic diets and obesity, insulin resistance,coronary heart disease, and possibly cancer, particularly inolder people who are overweight and maintain a sedentarylifestyle.1 The glycemic index (GI) for human foods wasdeveloped in the 1980s to provide information on theblood glucose concentrations produced by different foodsafter ingestion, because this could not be predicted bychemical composition of foods.2 A glycemic value for
From the Department of Animal Science and Agricultural Education, California
State University, Fresno, Fresno, CAa; and University of California, Davis, School
of Veterinary Medicine, Davis, CA.b
Reprint requests: Dr. Anne Rodiek, Department of Animal Science and Agricultural
Education, 2415 E. San Ramon MS–AS 75, California State University,
Fresno, Fresno, CA 93740.
0737-0806/$ - see front matter
� 2007 Elsevier Inc. All rights reserved.
doi:10.1016/j.jevs.2007.04.002
Volume 27, Number 5
a food is determined by comparing the area under theplasma glucose response curve of the test food with thatof a standard food (originally glucose, but later whitebread). The glycemic index of any given food is calculatedand expressed as a percentage of the glucose response tothe standard food.3 Large variations can occur in the glyce-mic index of a food because of the starch and sugar content,food form, cooking or processing,4 rate of eating,5 andother factors. Variations of 10–15% are considered to bewithin the error associated with the measurement of GI.6
Some human nutritionists recommend that foods be di-vided into three categories based on GI: a high GI group(GI > 70), medium GI group (GI 55–69), and low GIgroup (GI< 55), and small differences in GI between foodswithin a category not be considered when formulating dietswith different glycemic objectives (www.glycemicindex.com).
A GI of horse feeds is of interest because starch and sugardigestion and glucose metabolism in the horse is similar tothat of humans, creating comparable fluctuations in bloodglucose and insulin concentrations; and also because horseshave been shown to suffer at least some of the same healthmaladies associated with high glucose concentrations orfluctuations in glucose concentration as humans. Less re-search has been done to show similar relationships betweenhigh glycemic diets and comparable equine conditions as inhumans, but limited research and anecdotal evidence indi-cate that horses do experience obesity, insulin resistance,and other maladies associated with high starch intake.
Formulating equine diets that produce attenuated glyce-mic and insulinemic responses may have health benefits tothe horse in avoiding or ameliorating insulin resistance andits undesirable effects related to laminitis and other meta-bolic conditions.7 Conversely, formulating diets thatproduce elevations in glucose concentration may providea powerful energy source for some types of athletic per-formance, particularly for work in which carbohydrateoxidation supplies a large percentage of the energy require-ment.8 Creating a GI of common horse feeds, under con-trolled conditions, is the first step toward understandingcarbohydrate digestion and glucose metabolism in horses,and to having the knowledge to formulate diets with lowor high GIs or loads.
The objectives of this study were to quantify the plasmaglucose responses of 10 common horse feeds fed on an iso-caloric (digestible energy) basis, calculate a glycemic indexfor these feeds, rank the feeds by GI, and categorize feedsinto groups based on their glycemic index for utilizationin appropriate dietary recommendations.
205

MATERIALS AND METHODS
DesignSix mature, healthy mares, ranging in initial body weightbetween 506 and 631 kg (1,114 and 1,388 lb), wereused in two 6 � 6 Latin-square designed experiments toexamine the glycemic response to 10 common equinefeeds. The mares were of Quarter Horse breeding, andthe mean age was 17.8 � 4.3 years. Feeds in one square(high glycemic square) were chosen, anticipating that thesewould produce a high glycemic response, and feeds fora second square (low glycemic square) were selected basedon an assumption that these would produce a lower glyce-mic response. Steamed, crimped oats and long-stem(baled) alfalfa hay were common to both squares. The feedsin a high glycemic square included, besides oats and alfalfa,steamed, rolled barley; steamed, rolled corn; sweet feed(a commercial feed composed of steamed, rolled corn;steamed, crimped oats; steamed, rolled barley; and molas-ses), and steamed, crimped ‘‘jockey’’ (heavy) oats. Theadditional feeds in a low glycemic square were rice bran,shredded beet pulp, pelleted soy hulls, and wheat bran.Nutrient composition of the feeds was determined bya commercial laboratory (Equi-analytical, Ithaca, NY).
Horses were individually housed in outdoor pens withno bedding provided on sampling days. On non-samplingdays, horses were fed medium-quality alfalfa hay twicedaily. Horses had ad libitum access to water at all times.After an overnight fast on each blood sampling day (twiceweekly), horses were offered an amount of feed calculatedfrom 1989 NRC9 values to contain 4 Mcal digestible en-ergy (DE) (Table 1). No other feed was offered duringthis time. Time to complete eating of the experimentalfeeds was recorded, and any feed not eaten by the end ofthe 300-minute sampling period was weighed.
Table 1. Weight of feeds offered in high and lowglycemic Latin squares calculated to containapproximately 4 Mcal DE
High Glycemic Square
Feed Weight (kg)
Oats 1.38Alfalfa hay 2.04Barley 1.23Corn 1.18Sweet feed 1.26Jockey oats 1.38
Low Glycemic Square
Oats 1.38Alfalfa hay 2.04Wheat bran 1.37Rice bran 1.53Beet pulp 1.71Soy hulls 2.36
206
Blood Collection and AnalysisJugular blood (30 ml) was sampled via venipuncture 15minutes before, and 30, 60, 90, 120, 180, 240, and 300minutes after feeding at approximately 8:00 AM. Bloodwas collected into evacuated tubes containing anti-glyco-lytic agents, potassium oxalate and sodium fluoride, andmaintained on ice until centrifuged. Plasma was obtainedand frozen at –568C. Glucose concentration was deter-mined in duplicate by use of an auto-analyzer (YSI 2300STAT Plus, Yellow Springs, OH).
Statistical AnalysisGlycemic indices were calculated as a summary of the tem-poral glucose pattern, defined in terms of the area underthe plasma glucose curve (above the pre-feeding glucoseconcentration) for each feed for each horse. Areas underthe plasma glucose response curves were calculated bythe trapezoidal method of numerical integration.3 Theoat treatment was assigned a GI of 100, and the GIs forthe other dietary treatments were calculated as the area un-der the curve for that treatment, expressed as a percentageof the mean area under the curve for oats. The response tooats for each horse (and within each square) was used tocalculate the GIs for other feeds fed to that horse.
Glycemic index values were analyzed using a general lin-ear model in SPSS (SPSS for Windows, Rel. 14.0.0. 2005.Chicago: SPSS, Inc.) with day and horse and square as ran-dom factors and feed treatment as a fixed factor. Becauseno significant differences were found between squares(P ¼ .956), both Latin squares were combined by drop-ping square from the model. Multiple comparisons weremade using Tukey’s HSD (a ¼ 0.05). The relationship ofglycemic index to feed composition as well as feed intakewas examined using a linear regression.
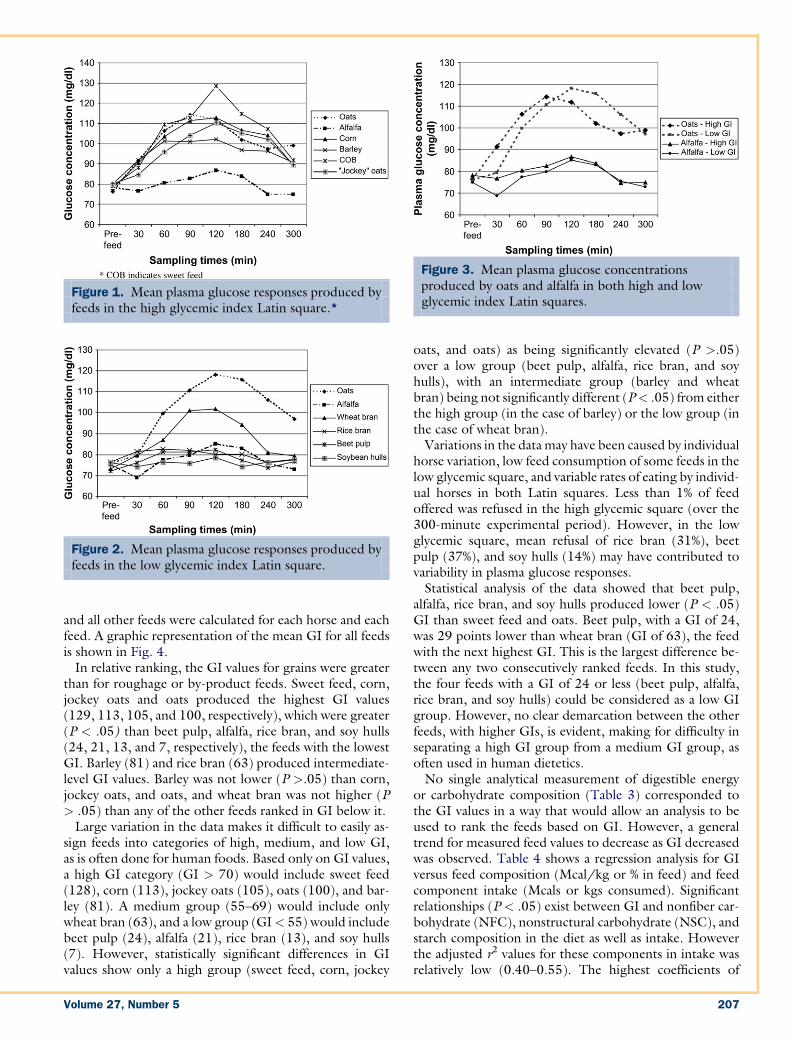
RESULTSChanges in plasma glucose concentrations over the 300-minute sampling periods in the low and high glycemicsquares are shown in Figs. 1 and 2. Plasma glucose concen-trations peaked at approximately 90 to 120 minutes afterthe start of eating for feeds in both the high and low glyce-mic squares. The glucose concentration in all feeds, withthe exception of oats, returned to prefeeding concentra-tion (P > .05) by the end of the 300-minute samplingperiod (Fig. 3). The plasma glucose responses of the feedswithin a square, other than oats and alfalfa, were relativelygreater in the high glycemic square compared with the lowglycemic square. Horse significantly affected GI (P¼ .042)across all data, indicating variation in response from oneanimal to the next. However, no attempt was made toremove horse-induced variation from the area under thecurve (AUC) or GI values.
Mean values for areas under the plasma glucose responsecurves for all feeds and GI values are shown in Table 2.Glycemic indices for all 10 feeds were determined basedon areas under the plasma glucose response curves foreach feed and for each horse. With the AUC for oats setat 100, percentage differences from the AUC for oats
Journal of Equine Veterinary Science May 2007
and all other feeds were calculated for each horse and eachfeed. A graphic representation of the mean GI for all feedsis shown in Fig. 4.
In relative ranking, the GI values for grains were greaterthan for roughage or by-product feeds. Sweet feed, corn,jockey oats and oats produced the highest GI values(129, 113, 105, and 100, respectively), which were greater(P < .05) than beet pulp, alfalfa, rice bran, and soy hulls(24, 21, 13, and 7, respectively), the feeds with the lowestGI. Barley (81) and rice bran (63) produced intermediate-level GI values. Barley was not lower (P >.05) than corn,jockey oats, and oats, and wheat bran was not higher (P> .05) than any of the other feeds ranked in GI below it.
Large variation in the data makes it difficult to easily as-sign feeds into categories of high, medium, and low GI,as is often done for human foods. Based only on GI values,a high GI category (GI > 70) would include sweet feed(128), corn (113), jockey oats (105), oats (100), and bar-ley (81). A medium group (55–69) would include onlywheat bran (63), and a low group (GI< 55) would includebeet pulp (24), alfalfa (21), rice bran (13), and soy hulls(7). However, statistically significant differences in GIvalues show only a high group (sweet feed, corn, jockey
Figure 1. Mean plasma glucose responses produced byfeeds in the high glycemic index Latin square.*
Figure 2. Mean plasma glucose responses produced byfeeds in the low glycemic index Latin square.
Volume 27, Number 5
oats, and oats) as being significantly elevated (P >.05)over a low group (beet pulp, alfalfa, rice bran, and soyhulls), with an intermediate group (barley and wheatbran) being not significantly different (P< .05) from eitherthe high group (in the case of barley) or the low group (inthe case of wheat bran).
Variations in the data may have been caused by individualhorse variation, low feed consumption of some feeds in thelow glycemic square, and variable rates of eating by individ-ual horses in both Latin squares. Less than 1% of feedoffered was refused in the high glycemic square (over the300-minute experimental period). However, in the lowglycemic square, mean refusal of rice bran (31%), beetpulp (37%), and soy hulls (14%) may have contributed tovariability in plasma glucose responses.
Statistical analysis of the data showed that beet pulp,alfalfa, rice bran, and soy hulls produced lower (P < .05)GI than sweet feed and oats. Beet pulp, with a GI of 24,was 29 points lower than wheat bran (GI of 63), the feedwith the next highest GI. This is the largest difference be-tween any two consecutively ranked feeds. In this study,the four feeds with a GI of 24 or less (beet pulp, alfalfa,rice bran, and soy hulls) could be considered as a low GIgroup. However, no clear demarcation between the otherfeeds, with higher GIs, is evident, making for difficulty inseparating a high GI group from a medium GI group, asoften used in human dietetics.
No single analytical measurement of digestible energyor carbohydrate composition (Table 3) corresponded tothe GI values in a way that would allow an analysis to beused to rank the feeds based on GI. However, a generaltrend for measured feed values to decrease as GI decreasedwas observed. Table 4 shows a regression analysis for GIversus feed composition (Mcal/kg or % in feed) and feedcomponent intake (Mcals or kgs consumed). Significantrelationships (P < .05) exist between GI and nonfiber car-bohydrate (NFC), nonstructural carbohydrate (NSC), andstarch composition in the diet as well as intake. Howeverthe adjusted r2 values for these components in intake wasrelatively low (0.40–0.55). The highest coefficients of
Figure 3. Mean plasma glucose concentrationsproduced by oats and alfalfa in both high and lowglycemic index Latin squares.
207
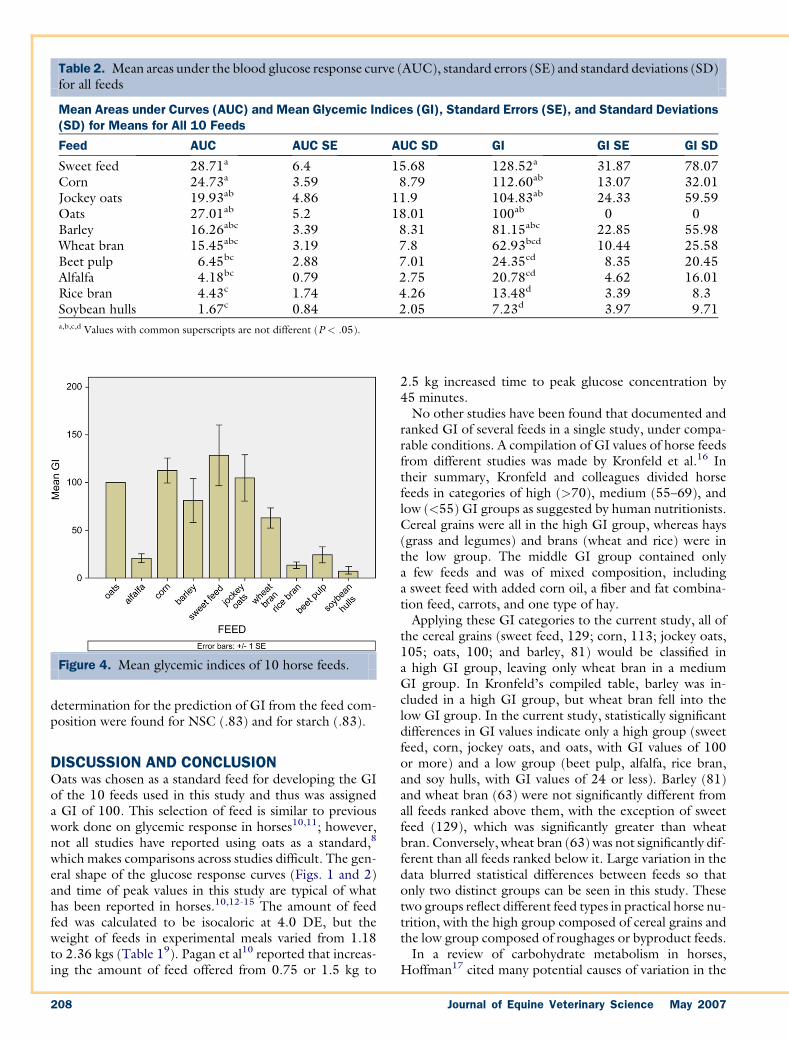
Table 2. Mean areas under the blood glucose response curve (AUC), standard errors (SE) and standard deviations (SD)for all feeds
Mean Areas under Curves (AUC) and Mean Glycemic Indices (GI), Standard Errors (SE), and Standard Deviations(SD) for Means for All 10 Feeds
Feed AUC AUC SE AUC SD GI GI SE GI SD
Sweet feed 28.71a 6.4 15.68 128.52a 31.87 78.07Corn 24.73a 3.59 8.79 112.60ab 13.07 32.01Jockey oats 19.93ab 4.86 11.9 104.83ab 24.33 59.59Oats 27.01ab 5.2 18.01 100ab 0 0Barley 16.26abc 3.39 8.31 81.15abc 22.85 55.98Wheat bran 15.45abc 3.19 7.8 62.93bcd 10.44 25.58Beet pulp 6.45bc 2.88 7.01 24.35cd 8.35 20.45Alfalfa 4.18bc 0.79 2.75 20.78cd 4.62 16.01Rice bran 4.43c 1.74 4.26 13.48d 3.39 8.3Soybean hulls 1.67c 0.84 2.05 7.23d 3.97 9.71a,b,c,d Values with common superscripts are not different (P < .05).
determination for the prediction of GI from the feed com-position were found for NSC (.83) and for starch (.83).
DISCUSSION AND CONCLUSIONOats was chosen as a standard feed for developing the GIof the 10 feeds used in this study and thus was assigneda GI of 100. This selection of feed is similar to previouswork done on glycemic response in horses10,11; however,not all studies have reported using oats as a standard,8
which makes comparisons across studies difficult. The gen-eral shape of the glucose response curves (Figs. 1 and 2)and time of peak values in this study are typical of whathas been reported in horses.10,12-15 The amount of feedfed was calculated to be isocaloric at 4.0 DE, but theweight of feeds in experimental meals varied from 1.18to 2.36 kgs (Table 19). Pagan et al10 reported that increas-ing the amount of feed offered from 0.75 or 1.5 kg to
Figure 4. Mean glycemic indices of 10 horse feeds.
208
2.5 kg increased time to peak glucose concentration by45 minutes.
No other studies have been found that documented andranked GI of several feeds in a single study, under compa-rable conditions. A compilation of GI values of horse feedsfrom different studies was made by Kronfeld et al.16 Intheir summary, Kronfeld and colleagues divided horsefeeds in categories of high (>70), medium (55–69), andlow (<55) GI groups as suggested by human nutritionists.Cereal grains were all in the high GI group, whereas hays(grass and legumes) and brans (wheat and rice) were inthe low group. The middle GI group contained onlya few feeds and was of mixed composition, includinga sweet feed with added corn oil, a fiber and fat combina-tion feed, carrots, and one type of hay.
Applying these GI categories to the current study, all ofthe cereal grains (sweet feed, 129; corn, 113; jockey oats,105; oats, 100; and barley, 81) would be classified ina high GI group, leaving only wheat bran in a mediumGI group. In Kronfeld’s compiled table, barley was in-cluded in a high GI group, but wheat bran fell into thelow GI group. In the current study, statistically significantdifferences in GI values indicate only a high group (sweetfeed, corn, jockey oats, and oats, with GI values of 100or more) and a low group (beet pulp, alfalfa, rice bran,and soy hulls, with GI values of 24 or less). Barley (81)and wheat bran (63) were not significantly different fromall feeds ranked above them, with the exception of sweetfeed (129), which was significantly greater than wheatbran. Conversely, wheat bran (63) was not significantly dif-ferent than all feeds ranked below it. Large variation in thedata blurred statistical differences between feeds so thatonly two distinct groups can be seen in this study. Thesetwo groups reflect different feed types in practical horse nu-trition, with the high group composed of cereal grains andthe low group composed of roughages or byproduct feeds.
In a review of carbohydrate metabolism in horses,Hoffman17 cited many potential causes of variation in the
Journal of Equine Veterinary Science May 2007
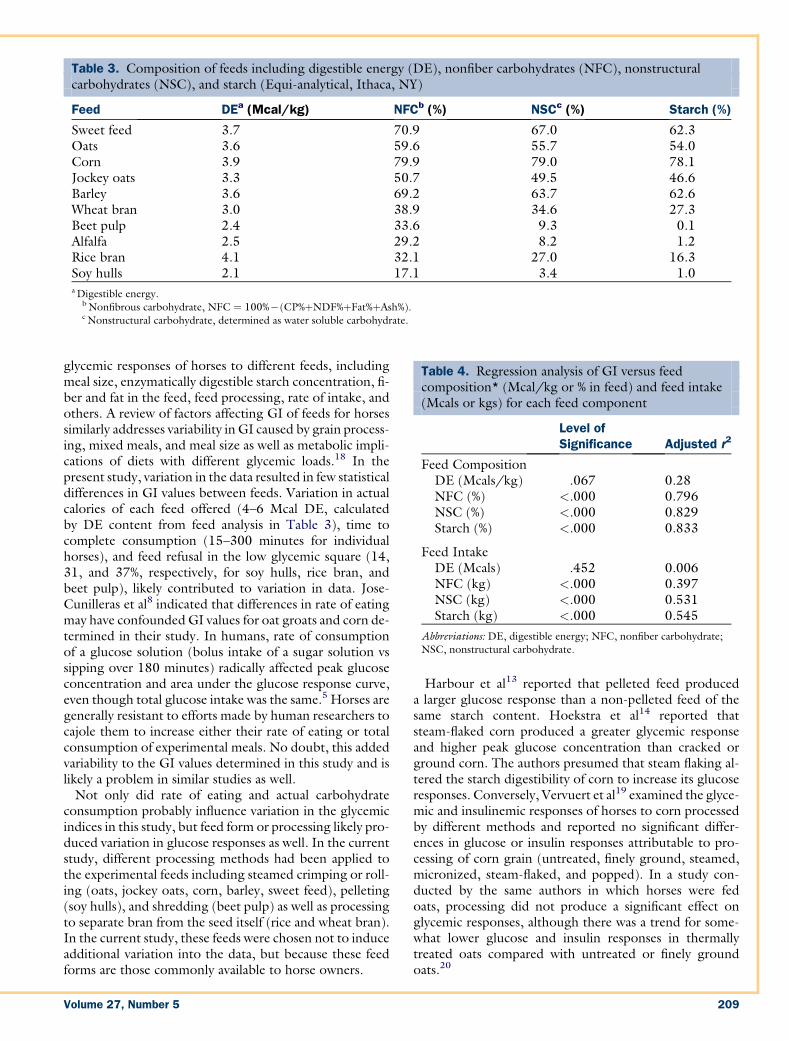
Table 3. Composition of feeds including digestible energy (DE), nonfiber carbohydrates (NFC), nonstructuralcarbohydrates (NSC), and starch (Equi-analytical, Ithaca, NY)
Feed DEa (Mcal/kg) NFCb (%) NSCc (%) Starch (%)
Sweet feed 3.7 70.9 67.0 62.3Oats 3.6 59.6 55.7 54.0Corn 3.9 79.9 79.0 78.1Jockey oats 3.3 50.7 49.5 46.6Barley 3.6 69.2 63.7 62.6Wheat bran 3.0 38.9 34.6 27.3Beet pulp 2.4 33.6 9.3 0.1Alfalfa 2.5 29.2 8.2 1.2Rice bran 4.1 32.1 27.0 16.3Soy hulls 2.1 17.1 3.4 1.0a Digestible energy.
b Nonfibrous carbohydrate, NFC ¼ 100%� (CP%þNDF%þFat%þAsh%).c Nonstructural carbohydrate, determined as water soluble carbohydrate.
glycemic responses of horses to different feeds, includingmeal size, enzymatically digestible starch concentration, fi-ber and fat in the feed, feed processing, rate of intake, andothers. A review of factors affecting GI of feeds for horsessimilarly addresses variability in GI caused by grain process-ing, mixed meals, and meal size as well as metabolic impli-cations of diets with different glycemic loads.18 In thepresent study, variation in the data resulted in few statisticaldifferences in GI values between feeds. Variation in actualcalories of each feed offered (4–6 Mcal DE, calculatedby DE content from feed analysis in Table 3), time tocomplete consumption (15–300 minutes for individualhorses), and feed refusal in the low glycemic square (14,31, and 37%, respectively, for soy hulls, rice bran, andbeet pulp), likely contributed to variation in data. Jose-Cunilleras et al8 indicated that differences in rate of eatingmay have confounded GI values for oat groats and corn de-termined in their study. In humans, rate of consumptionof a glucose solution (bolus intake of a sugar solution vssipping over 180 minutes) radically affected peak glucoseconcentration and area under the glucose response curve,even though total glucose intake was the same.5 Horses aregenerally resistant to efforts made by human researchers tocajole them to increase either their rate of eating or totalconsumption of experimental meals. No doubt, this addedvariability to the GI values determined in this study and islikely a problem in similar studies as well.
Not only did rate of eating and actual carbohydrateconsumption probably influence variation in the glycemicindices in this study, but feed form or processing likely pro-duced variation in glucose responses as well. In the currentstudy, different processing methods had been applied tothe experimental feeds including steamed crimping or roll-ing (oats, jockey oats, corn, barley, sweet feed), pelleting(soy hulls), and shredding (beet pulp) as well as processingto separate bran from the seed itself (rice and wheat bran).In the current study, these feeds were chosen not to induceadditional variation into the data, but because these feedforms are those commonly available to horse owners.
Volume 27, Number 5
Harbour et al13 reported that pelleted feed produceda larger glucose response than a non-pelleted feed of thesame starch content. Hoekstra et al14 reported thatsteam-flaked corn produced a greater glycemic responseand higher peak glucose concentration than cracked orground corn. The authors presumed that steam flaking al-tered the starch digestibility of corn to increase its glucoseresponses. Conversely, Vervuert et al19 examined the glyce-mic and insulinemic responses of horses to corn processedby different methods and reported no significant differ-ences in glucose or insulin responses attributable to pro-cessing of corn grain (untreated, finely ground, steamed,micronized, steam-flaked, and popped). In a study con-ducted by the same authors in which horses were fedoats, processing did not produce a significant effect onglycemic responses, although there was a trend for some-what lower glucose and insulin responses in thermallytreated oats compared with untreated or finely groundoats.20
Table 4. Regression analysis of GI versus feedcomposition* (Mcal/kg or % in feed) and feed intake(Mcals or kgs) for each feed component
Level ofSignificance Adjusted r2
Feed CompositionDE (Mcals/kg) .067 0.28NFC (%) <.000 0.796NSC (%) <.000 0.829Starch (%) <.000 0.833
Feed IntakeDE (Mcals) .452 0.006NFC (kg) <.000 0.397NSC (kg) <.000 0.531Starch (kg) <.000 0.545
Abbreviations: DE, digestible energy; NFC, nonfiber carbohydrate;NSC, nonstructural carbohydrate.
209

Other components of feeds or combinations of feeds alsoinfluence glucose response. Stull and Rodiek15 reportedthat isocaloric meals of 100% corn or a 50:50 combinationof corn and alfalfa produced significantly elevated plasmaglucose responses (compared with pre-feeding), whereasa 90:10 combination of corn and corn oil or 100% alfalfadid not produce significant elevations. Chemical analysesof the feeds showed that the corn and oil meal was highestin DE and lowest in crude fiber, although not lower instarch than the 50:50 corn–alfalfa combination. Nonethe-less, its glucose response was lower than the corn and alfalfacombination. Crandell et al21 reported that horses feda diet in which 15% of the DE requirement was met withfat instead of with a traditional mixed grain and molassesfeed showed significantly lower glucose responses during3 hours post-feeding, even though the two diets providedequal caloric intake. Pagan et al22 reported that the addi-tion of 200 ml soybean oil to an oats-corn-molasses grainmeal caused lower glucose concentrations for 3 hours aftereating than the same amount of grain mix without the ad-dition of soybean oil. The authors concluded that the addi-tion of fat (soybean oil) to the grain meal lowered glucoseconcentrations post-feeding even when starch content ofthe two meals was the same, possibly because of the effectof fat on gastric emptying. A plausible explanation of thelow GI found for rice bran in the current study may havebeen partially caused by its fat content (22.5% measured,but not reported here), even though its content of non-structural carbohydrate and starch were greater than thefeeds with higher GI values, beet pulp and alfalfa.
In the current study, none of the measured feed compo-nent values (Table 3) associated with carbohydrate contentranked the GI of the feeds correctly. A trend was seen for allcarbohydrate measures and digestible energy to be lower infeeds with low GIs. This is not a new revelation, as the GIconcept was conceived as a way to measure physiologicallyavailable glucose that could not be measured by traditionalanalyses. Table 4 shows the coefficients of determination(adjusted r2) of GI and feed composition (Mcal/kg or %)or feed component intake (Mcal or kg). The highest corre-lation to GI was found with NSC and starch content of thefeed (0.83 and 0.83, respectively). In this study, NSC wasdetermined as water-soluble carbohydrate, a method thatextracts both simple sugars and fructan, which is not enzy-matically digested in the horse. Notwithstanding thisnondigestible carbohydrate included in NSC, NSC ap-peared to be nearly as good a predictor of GI as starchcomposition.
In 1999, Englyst et al23 described an in vitro methodfor measuring rapidly available glucose (RAG) and slowlyavailable glucose (SAG) in an effort to quantify theamounts of glucose likely to be available for rapid andslow absorption, respectively, in the human small intestine.In a study in which humans consumed foods with differentRAG values and glycemic responses to those foods weredetermined, the authors reported that the correlation be-tween the glycemic response and RAG was highly signifi-cant. As RAG in food increased, the same percentage
210
increase was seen in glycemic response. After individualvariation was removed from the data, 70% of the differenceseen in glycemic response was shown to be caused by levelof RAG. In another study, the same researchers24 reportedthat GI and insulin index (II) values determined for 23 dif-ferent human cereal product foods were not significantlycorrelated to starch or sugar content, but were significantlycorrelated to RAG (positive correlation) and SAG (nega-tive correlation) content of the foods. SAG and fat contenttogether accounted for 73% of the variation in GI.
Whether RAG and SAG are equally well correlated to GIin horse feeds remains to be determined. Enzymatic carbo-hydrate digestion in horses and humans is similar, howeverthe main dietary ingredients of the two species are not.Most horses eat, as the main component of their diet,highly fibrous feeds that are primarily fermented in thelarge intestine. These feeds (hay, pasture, silage) aremuch higher in insoluble carbohydrate than even themost fibrous of (human) vegetarian diets and thereforeare likely lower in total soluble carbohydrate, fat, or proteincontent. Differences in composition of horse feeds com-pared with human foods may suggest re-evaluating GIgroupings of feeds based on GI value. Perhaps in the horse,high- and low-GI feeds predominate, with only a few feedsin a middle group. In horses, cereal grains and molassesmixes likely will have quite high GI values, whereas forages(hays, primarily) will have quite low GI values.
Variation due to individual characteristics, physiologicstate, and acclimation to diet may alter digestion, absorp-tion, and metabolism of glucose and may be sources of var-iation in GI. Hoffman et al25 reported that mares in lategestation, compared with early or late lactation, showeda greater glucose response (measured as area under a glu-cose response curve) after an oral glucose tolerance test.Hoffman also reported that mares acclimated to a diethigh in digestible carbohydrate showed a smaller glucoseresponse and faster glucose clearance than horses accli-mated to a diet higher in fiber and lower in digestiblecarbohydrate. In another study conducted by Hoffmanet al,26 obesity in horses was reported to increase insulin re-sponse and to reduce insulin sensitivity, that is, more insu-lin was required to reduce plasma glucose concentrationsafter intravenous injection of glucose. Benders et al27 re-ported that horses afflicted with equine motor neuron dis-ease displayed lower mean plasma glucose concentrationsduring an oral glucose tolerance test compared with nor-mal horses. Ralston et al28 reported that older horses(>20 years) often showed elevated glucose and insulin re-sponses to an oral glucose tolerance test, frequently associ-ated with hypophyseal or thyroid adenomas discovered atnecropsy.
From a practical standpoint, utilization of the ranking orcategories of GI values of the 10 common horse feeds ex-amined in the current study may be useful for formulatingrations with different glycemic objectives. As expected,cereal grains produced significantly higher GI values thanroughage or by-product feeds. However, variation inducedby individual differences attributable to age, physiologic
Journal of Equine Veterinary Science May 2007

state, and rate of eating, as well as chemical composition offeed and feed processing all influence GI values. Further re-search investigation may narrow the variation found in spe-cific GI values for individual feeds, thus developing a moreuseful tool for ration formulation to meet specific glucoseavailability goals.
In conclusion, this study was conducted to determineand rank GI values for 10 common horse feeds. These feedswere found to have GI values that ranged from 7 to 129,based on a standard of oats, set at a GI of 100. The fourfeeds with the highest GI values (sweet feed, corn, jockeyoats, and oats) were significantly greater in GI than thefour feeds with the lowest GI values (beet pulp, alfalfa,rice bran, and soy hulls). Unlike human foods, it appearsthat horse feeds fall into only two GI groups, high andlow, but further distinction may have been obscured bylarge variations in the data. Feed composition appears tobe related to GI but cannot be used with confidence torank feeds with regard to GI.
ACKNOWLEDGMENTS
The authors thank A.L. Gilbert Feed Company, Oakdale,CA, for donation of feeds for this study.
REFERENCES
1. Jenkins DJA, Kendall CWC, Augustin LSA, Franceschi S, Hamidi M,
Marchie A, et al. Glycemic index: overview of implications in health
and disease. Am J Clin Nutr 2002;76(Suppl):266S–273S.
2. Jenkins DJA, Wolever TMS, Taylor RH. Glycemic index of foods:
a physiological basis for carbohydrate exchange. Am J Clin Nutr
1981;34:362–366.
3. Wolever TMS, Jenkins DJA, Jenkins AL, Josse RG. The glycemic
index: methodology and clinical implications. Am J Clin Nutr 1991;
54:846–854.
4. Brand JC, Nicholson PL, Thorburn AW, Trussell AS. Food process-
ing and the glycemic index. Am J Clin Nutr 1985;42:1192–1196.
5. Jenkins DJ, Wolever TM, Ocana AM, Vuksan V, Cunnane SC,
Jenkins M, et al. Metabolic effects of reducing rate of glucose ingestion
by single bolus versus continuous sipping. Diabetes 1990;39:775–781.
6. Foster-Powell K, Miller JB. International tables of glycemic index.
Am J Clin Nutr 1995;62:871S–893S.
7. Kronfeld DS, Treiber KH, Hess TM, Boston RC. Insulin resistance
in the horse: definition, detection and dietetics. J Anim Sci 2005;
83E(Suppl):E22–E31.
8. Jose-Cunilleras E, Taylor LE, Hinchchliff KW. Glycemic index of
cracked corn, oat groats and rolled barley in horses. J Anim Sci
2004;82:2623–2629.
9. National Research Council. Nutrient requirements of horses. 5th rev
ed. Washington, DC: National Academy Press; 1989:50–67.
10. Pagan JD, Harris PA, Kennedy MAP, Davidson N, Hoekstra KE.
Feed type and intake affects glycemic response in Thoroughbred
horses. In: Proceedings 16th Equine Nutrition Physiology Society
Symposium; 1999:149–150.
11. Groff L, Pagan J, Hoekstra K, Gardner S, Rice O, Roose K, et al.
Effect of preparation method on the glycemic response to ingestion
of beet pulp in Thoroughbred horses. In: Proceedings 17th Equine
Nutrition Physiology Society Symposium; 2001:125.
Volume 27, Number 5
12. Williams CA, Kronfeld DS, Staniar WB, Harris PA. Plasma
glucose and insulin responses of Thoroughbred mares fed a meal
high in starch and sugar or fat and fiber. J Anim Sci 2001;79:
2196–2201.
13. Harbour LE, Lawrence LM, Hayes SH, Stine CJ, Powell DM.
Concentrate composition, form and glycemic response in horses.
In: Proceedings 18th Equine Nutrition Physiology Society Sympo-
sium; 2003:329–330.
14. Hoekstra KE, Newman K, Kennedy MAP, Pagan JD. Effect of
corn processing on glycemic response in horses. In: Proceedings
16th Equine Nutrition Physiology Society Symposium; 1999:
144–148.
15. Stull CL, Rodiek AV. Responses of blood glucose, insulin and
cortisol concentrations to common equine diets. J Nutr 1998;118:
206–213.
16. Kronfeld D, Rodiek A, Stull C. Glycemic indices, glycemic loads and
glycemic dietetics. J Equine Vet Sci 2004;24:399–404.
17. Hoffman RM. Carbohydrate metabolism in horses. In: Ralston SL,
Hintz HF, eds. Recent advances in equine nutrition. Ithaca, NY:
International Veterinary Information Service (www.ivis.org); 2003:
A1506.0803.
18. Vervuert I, Coenen M. Factors affecting glycaemic index of feeds for
horses. In: Proceedings 3rd European Equine Health Congress;
2006.
19. Vervuert I, Coenen M, Bothe C. Effects of corn processing on the
glycaemic and insulinaemic responses in horses. J Anim Physiol
Anim Nutr 2004;88:348.
20. Vervuert I, Coenen M, Bothe C. Effects of oat processing on the gly-
caemic and insulin responses in horses. J Anim Physiol Anim Nutr
2003;87:96–104.
21. Crandell K, Pagan JD, Harris P, Duren SE. A comparison of grain,
vegetable oil and beet pulp as energy sources for the exercised horse.
In: Pagan JK, Geor RJ, eds. Advances in equine nutrition II. Notting-
ham, UK: Nottingham University Press; 2001:487.
22. Pagan JD, Rotmensen T, Jackson SG. Responses of blood glucose,
lactate and insulin in horses fed equal amounts of grain with or
without added soybean oil. In: Pagan JK, Geor RJ, eds. Advances
in equine nutrition II. Nottingham, UK: Nottingham University
Press; 2000:93–95.
23. Englyst KN, Englyst HN, Hudson GJ, Cole TJ, Cummings JH.
Rapidly available glucose in foods: an in vitro measurement that
reflects the glycemic response. Am J Clin Nutr 1999;69:448–454.
24. Englyst KN, Vinoy S, Englyst HN, Lang V. Glycaemic index of cereal
products explained by their content of rapidly and slowly available
glucose. Br J Nutr 2003;89:329–340.
25. Hoffman RM, Kronfeld DS, Cooper WL, Harris PA. Glucose clear-
ance in grazing mares is affected by diet, pregnancy and lactation.
J Anim Sci 2003;81:1764–1771.
26. Hoffman RM, Boston RC, Stefanovski D, Kronfeld DS, Harris PA.
Obesity and diet affect glucose dynamics and insulin sensitivity in
Thoroughbred geldings. J Anim Sci 2003;81:2333–2342.
27. Benders NA, Dyer J, Wijnbert ID, Shirazi-Beechey SP, van der
Kolk JH. Evaluation of glucose tolerance and intestinal luminal
membrane glucose transporter function in horses with equine motor
neuron disease. Am J Vet Res 2005;66:93–99.
28. Ralston SL, Nockel CF, Squires EL. Differences in diagnostic test
results and hematologic data between aged and young horses. Am
J Vet Res 1988;49:1397–1392.
211