glycated albumin and hba1c as predictors of … · a prospective, monocentric cohort study....
TRANSCRIPT

Journal of Diabetes Research & ClinicalMetabolismISSN 2050-0866 | Volume 3 | Article 9
Special Section | Diabetic Complications | Original Open Access
Glycated albumin and HbA1c as predictors of mortality and vascular complications in type 2 diabetes patients with normal and moderately impaired renal function: 5-year results from a 380 patient cohortChristoph Hasslacher1*, Felix Kulozik1, Isabel Platten1 and Justo Lorenzo Bermejo2
AbstractBackground: Glycated albumin (GA) represents a better marker of glycemic control than HbA1c in patients with renal failure. Studies on the clinical impact of GA in patients with normal or moderately impaired renal function (CKD stages 1-3) are sparse. The present study investigates the relationship between GA and HbA1c in this patient group and the ability of both biomarkers to predict vascular complications.Methods: A total of 380 type 2 diabetic patients were followed–up during a median time of 4.7 years in a prospective, monocentric cohort study. Following parameters were measured at 6-12 month intervals : GA, HbA1c, NT-pro-BNP and further routine laboratory parameters; clinical status regarding treatment modality and onset of cardiovascular, cerebrovascular, peripheral vascular, renal, and ophthalmological events as well as death by any cause.Results: GA showed a strong positive correlation with HbA1c (r=0.71, 95% CI 0.61 to 0.75), with little dependence on patient gender, age, renal function and anemia. No association was found between the two biomarkers and risk of cardiovascular and cerebrovascular events. The risk of peripheral vascular events significantly increased with increasing HbA1c (Pval=0.002, HR=1.45) and showed a borderline association with increasing GA (Pval=0.06, HR=1.09). A strong association was found between GA and onset of renal events (Pval=0.01, HR=1.15).Conclusions: GA and HbA1c measurements are correlated in diabetic patients with CKD stages 1-3. The association with macroangiopathic complications is stronger for HbA1c than for GA values. GA levels predict particularly well renal events.Keywords: Diabetes, glycated albumin, glycated hemoglobin, cardiovascular complications, diabetic nephropathy, diabetic retinopathy
© 2014 Hasslacher et al; licensee Herbert Publications Ltd. This is an Open Access article distributed under the terms of Creative Commons Attribution License (http://creativecommons.org/licenses/by/3.0). This permits unrestricted use, distribution, and reproduction in any medium, provided the original work is properly cited.
BackgroundMarkers of long - term glycemic control are essential tools in the care of diabetic patients. Currently, measurement of HbA1c is the most commonly used and best evaluated marker for both glycemic control and prediction of vascular complications [1-3]. Due to the long lifespan of erythrocytes, HbA1c reflects plasma glucose levels for the past 2-3 months. However, HbA1c measurements are affected by variant hemoglobin (Hb) and some diseases that shorten the lifespan of erythrocytes such
as hemolytic anemia and renal anemia [3]. Especially in dialysis patients, low Hb concentrations may result in falsely low HbA1c values and thus underestimate glycemic control in patients who actually have an increased risk for subsequent cardiovascular or infectious complications [4,5].
Recent studies have shown that glycated albumin (GA may represent a better marker of glycemic control than HbA1c in diabetic patients with renal insufficiency [4,5]. GA is not infl-uenced by the above mentioned factors which affect HbA1c
*Correspondence: [email protected]
1Diabetes Institute Heidelberg and Department of Clinical Studies, St. Joseph’s Hospital, Heidelberg, Germany.2Institute of Medical Biometry and Informatics, Heidelberg University Hospital, Germany.
CrossMark← Click for updates
Hasslacher et al. Journal of Diabetes Research & Clinical Metabolism 2014, http://www.hoajonline.com/journals/pdf/2050-0866-3-9.pdf
2
doi: 10.7243/2050-0866-3-9
concentrations but instead reflects glycemic control over a shorter period of time (2-3 weeks) due to the much shorter half-life of albumin [6,7]. Elevated GA values seem to be pred-ictive for the development of cardiovascular complications, hospitalization and death in diabetic patients with renal insu- fficiency [8,9].
In contrast to patients with renal insufficiency, there are only few longitudinal studies dealing with GA as a marker of glycemic control and predictor of vascular complications in type 2 diabetic patients with normal or moderately impaired renal function. In order to provide objective evidence about GA in the routine clinical context that may translate into a better management of this group of patients, we conducted a 5-year cohort study of type 2 diabetes patients with a focus on (a) the relationship between GA and HbA1c in patients with normal and reduced renal function and (b) the GA value as predictor of macro- and microvascular complications.
MethodsWe conducted a prospective, monocentric cohort study that included 380 type 2 diabetes patients who were followed-up from 2005 to 2011. All patients admitted to the outp-atient clinic of St. Josefshospital Heidelberg GmbH were invited to participate in the study if they fulfilled the following enroll-ment criteria: diagnosis of type 2 diabetes (according to guidelines of German Diabetes Association [10]), age <75 years and body mass index (BMI) <40 kg/m2. Patients aff-ected by severe illnesses such as malignoma, liver cirrhosis, congestive heart failure, renal insufficiency (estimated glomerular filtration rate (eGFR) <30 ml/min), acute infection (diagnosed by clinical symptoms and elevated hsCRP or elevated number of leucocytes), bronchial asthma (steroid dependent), rheumatoid arthritis requiring any type of the-rapy, any organ transplantation, congenital cardiac or renal anomalies, and pregnant patients were excluded. All included participants were on treatment with insulin and/or oral hypo-glycemic agents.
Patients received diabetological education and treatment at the outpatient clinic, further diabetes care was under the discretion of patient´s GP or diabetologist. Participants were invited to follow-up visits in 6 to 12 month intervals at the outpatient clinic for up to 5 years. At each visit, patient’s infor-mation on medical history, clinical status, current medi-cation, body weight, electrocardiogram, doppler-examination for ankle-brachial-index (ABI), and blood pressure in a sitting position after 10 minutes rest was updated. Aliquots of serum, plasma and urine samples were obtained and stored at–80oC.
Laboratory measurements per visit included: HbA1c, glycated albumin (GA), full blood count, creatinine, lipids, high-sensitive C-reactive protein (hs CRP), N-terminal pro-brain natriuretic peptide (NT-pro-BNP), urine status and the albumin/creatinine ratio. eGFR was calculated according to the Cockroft-Gault formula. All measurements were performed by MZV Labor Dr. Limbach u. Kollegen, Heidelberg, Germany. HbA1c was
measured by high pressure liquid chromatography, urine albumin by a turbidimetric immunoassay in a sample of first morning urine after exclusion of any urinary tract infection and menstruation. The other laboratory measurements were assessed with routine methods by an autoanalyser (Dimenson, Siemens, Germany) using serum or lithium - heparinized plasma. GA was measured enzymatically using the LUCICA GA-L kit (Asahi Kasei Pharma Corporation; Tokyo, Japan) in serum samples. GA% was calculated according to manufacturer’s instructions. As shown by other investigations, the general performance of this method, i.e., sensitivity, specificity, repro-ducibility and linearity, is good, samples stored for as long as 23 years are suitable for this GA assay [11,12].
The primary investigated endpoints were: cardiovascular (first of myocardial infarction, percutaneous transluminal coronary angioplasty (PTCA) and coronary artery bypass graft (CABG), cerebrovascular (first of ischemic stroke, transient ischemic attack (TIA) and carotis-thrombendarterectomy (TEA), peripheral vascular (first of amputation, percutaneous transluminal angioplasty (PTA) and bypass-operation), renal (terminal renal failure and start of dialysis), opthalmological (blindness) and death by any cause. Secondary endpoints included cardiovascular (first of primary cardiovascular, death and positive coronary angiography without intervention or NT-pro-BNP measurement >400 pg/ml), cerebrovascular (first of primary cerebrovascular, death and arteria carotis stenosis of any degree), peripheral vascular (first of primary peripheral vascular, death and ankle-brachial-index under 0.9), renal (first of primary renal, death, reduction of eGFR to less than 60 ml/min and onset of macroalbuminuria, i.e., an albumin/creatinine ratio over 300 mg/g in female patients and over 200 mg/g in male patients according to guidelines of German Diabetes Association (10), and ophthalmological (first of primary ophthalmological, death, diagnosis of persistent retinopathy and retinopathy progression) events. The study was approved by the local ethics committee and written informed consent was obtained from all patients.
Patient characteristics were described by median values with the 5th and 95th percentiles and relative frequencies, as appropriate. The relationship between GA and Hb1Ac meas-urements was examined by Spearman correlation and linear regression slope coefficients, together with estimates of fixed and proportional biases. In order to take into account the within patient dependence of repeated measurements, 95% CIs for coefficients and bias estimates were obtained by bootstrapping (10000 bootstrap samples). Box plots were used to depict GA and Hb1Ac changes during patient follow-up. Survival was calculated from the first GA and Hb1Ac measurement to the endpoints described in the previous paragraph. Survival time was censored for patients who did not experience the investigated events. The association between event-free survival and GA as well as Hb1Ac concentrations was first assessed based on glycemic marker measurements at first visit by log-rank tests and represented using Kaplan–

Hasslacher et al. Journal of Diabetes Research & Clinical Metabolism 2014, http://www.hoajonline.com/journals/pdf/2050-0866-3-9.pdf
3
doi: 10.7243/2050-0866-3-9
Meier plots. In addition, hazard ratios (HRs) with 95% CIs were calculated treating GA and Hb1Ac measurements as time-dependent variables in a Cox proportional hazard regression model by considering time periods between two patient measurements as separate observations. Statistical analyses were implemented using SAS version 9.3, figures were drawn using R (http://www.rproject.org). The present study has no statistical power for a confirmatory assessment of the possible effects of two biomarkers (GA and Hb1Ac) on six endpoints (cardiovascular, cerebrovascular, peripheral vascular, renal, ophthalmological, death). Probability values should be exploratory interpreted.
Results The baseline demographic and laboratory characteristics of the investigated patients at first visit, with their treatment modalities and concomitant diseases are summarized in Table 1. The median age was approximately 65 years, with a median diabetes duration of 9 years. Almost one half of patients (46%) was treated with insulin with or without addition of oral antidiabetic drugs. A similar percentage of patients (47%) received statins indicating presence of dyslipidemia. Most patients showed arterial hypertension treated in first line with ACE-inhibitors or AT1-blockers in combination with diuretics
Hb1Ac showed a clear correlation with GA measurements (Spearman correlation 0.71, 95% confidence interval (CI), 0.61 to 0.75). A one-percent increase in HbA1c corresponded to a GA-increase of 2.35%, 95% CI (2.16%, 2.56%). Stratified analyses revealed that the strength of the relationship between Hb1Ac and GA was practically identical in male and female patients, and slightly decreased with increasing age, decreasing kidney function and anemia onset. However, differences did not reach statistical significance (data not shown).
The median number of GA/Hb1Ac measurements per patient was eight, 50% of the patients presented between five and eleven measurements. The median time of follow up after the first GA and Hb1Ac measurement was 4.7 years. The first, second (median) and third quartiles at the first patient obser-vation amounted 6.6, 7.2, and 7.9, respectively for HbA1c, and 14.1, 15.8 and 18.3, respectively for GA. These thresholds were used to define ordinal scaled categories.
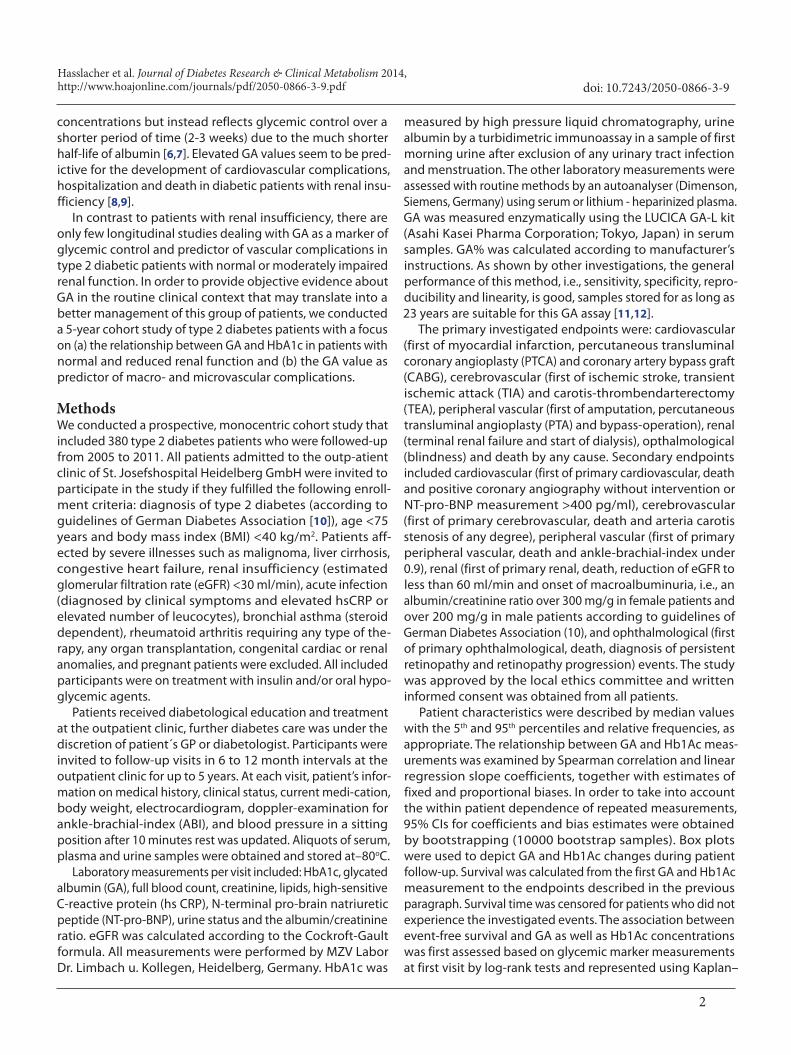
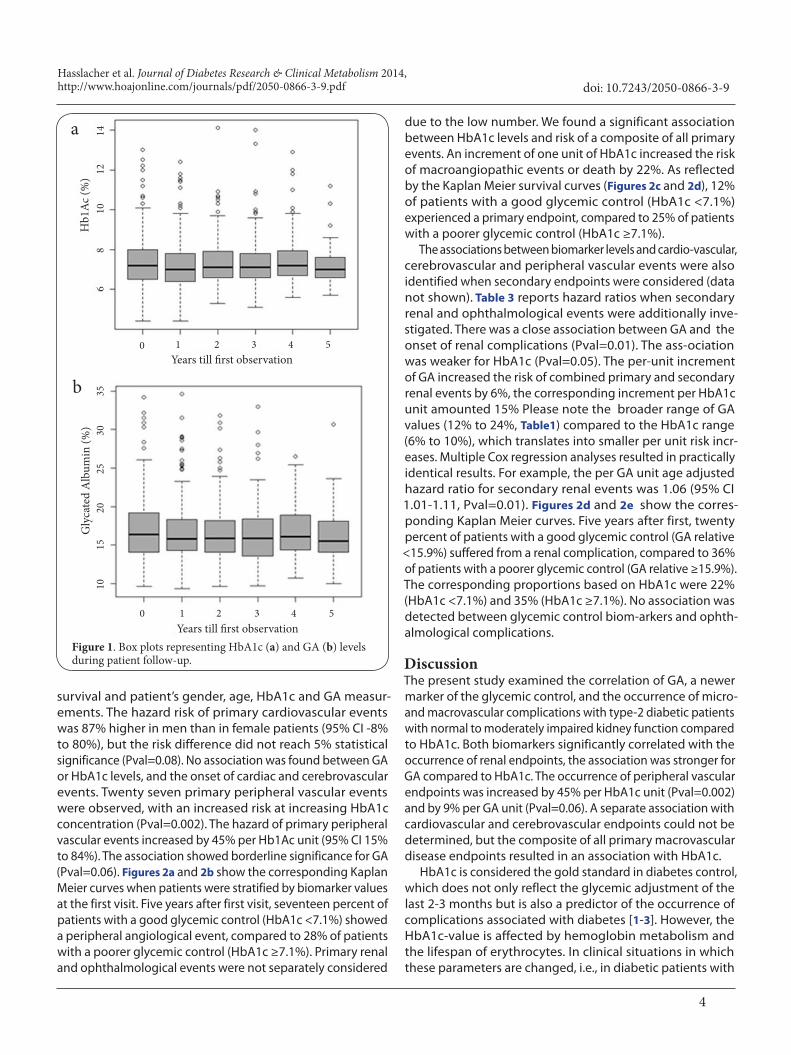
Figure 1 shows the course of HbA1c and GA during the follow-up period. No significant changes in HbA1c and GA were noticed in patients with a normal, nor in patients with an impaired renal function (eGFR under 90 ml/min; data not shown).
Regarding primary (secondary) endpoints, cardiovascular events were observed in 9.3% (25.2%) of patients, peripheral vascular in 6.9% (11.3%), and cerebrovascular events in 5.1% (2.1%). Three patients developed terminal renal failure and two patients went blind due to diabetic retinopathy. 39.8% of the patients experienced secondary renal events and 11.3% secondary retinopathy events. Twenty-two (5.7%) patients died.Table 2 shows the relationship between primary event-free
Characteristic Unit/Level Median (5th and 95th percentile)/ Proportion
Gender Male 56% --
Age Years 64.6 (46.6-74.8)
Diabetes duration Years 9.0 (1.0-28.0)
BMI kg/m² 30.6 (23.9-39.8)
HbA1c % 7.2 (5.8-9.9)
HbA1c IFCC mmol/mol 55.2 (39.9-84.7)
Glycated albumin % 16.6 (12.3-24.2)
Cholesterol mg/dl 189.0 (125.0-270.0)
LDL–Cholesterol mg/dl 114.0 (61.0-174.0)
HDL–Cholesterol mg/dl 47.0 (29.0-77.0)
Triglycerides mg/dl 140.0 (63.0-407.0)
Hemoglobin (males) g/dl 14.7 (12.5-16.9)
Hemoglobin (females) g/dl 13.5 (11.9-15.1)
hsCRP mg/l 2.5 (0.3-13.0)
NT-proBNP pg/ml 85.5 (14.0-790.0)
eGFR ml/min 91.4 (50.0-46.9)
Urine albumin/ creatinine ratio mg/g 15.1 (2.5-225.9)
Blood pressure systolic mmHg 143.0 (120.0-178.0)
Blood pressure diastolic mmHg 80.0 (60.0-100.0)
Treatment Prevalence (%)
Oral antidiabetic drugs (OAD) 54 %
Insulin with/without combination of OAD 46 %
Statins 47 %
ACE-Inhibitors/AT1 blockers 72 %
Diuretics 54 %
Beta blockers 49 %
Calcium antagonists 31 %
Concomitant diseases Prevalence (%)
Hypertension 88 %
Coronary heart disease 19 %
Cerebrovascular disease 11 %
Peripheral arterial disease 20 %
Neuropathy 45 %
eGFR <60 ml/min 12 %
Microalbuminuria 27 %
Retinopathy (any degree) 19 %
*Results apply to the first visit.
Table 1. Characteristics of the investigated patient cohort (N=380)*.
Hasslacher et al. Journal of Diabetes Research & Clinical Metabolism 2014, http://www.hoajonline.com/journals/pdf/2050-0866-3-9.pdf
4
doi: 10.7243/2050-0866-3-9
Figure 1. Box plots representing HbA1c (a) and GA (b) levels during patient follow-up.
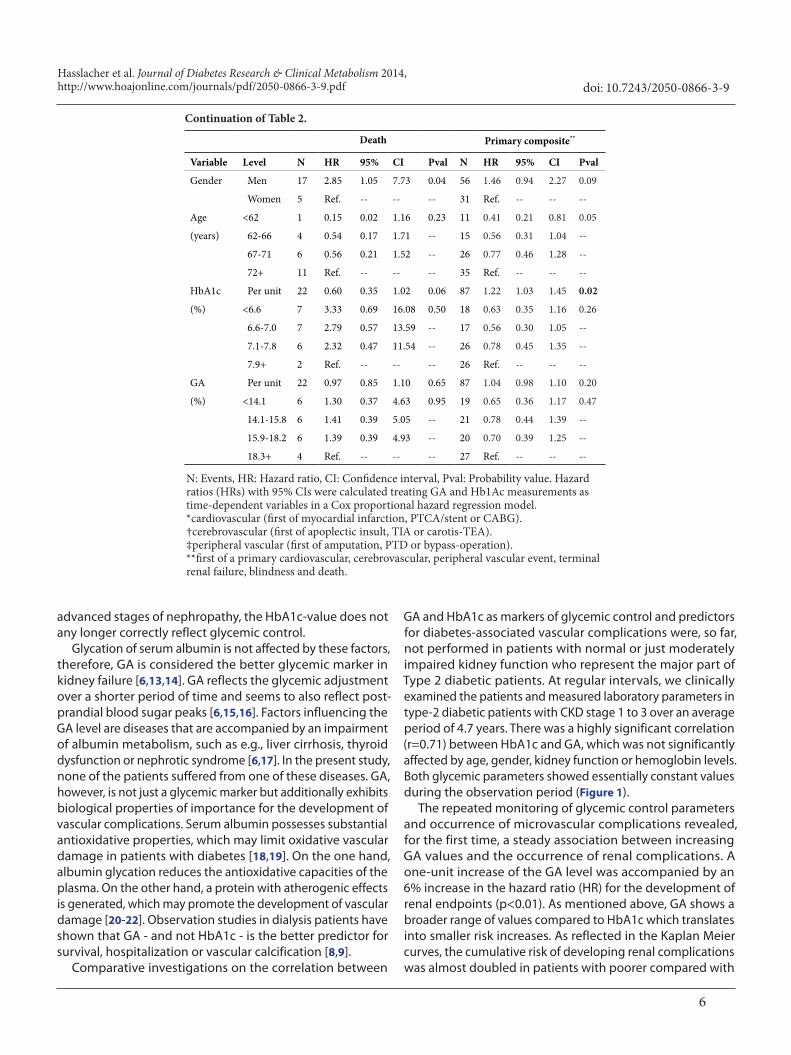
survival and patient’s gender, age, HbA1c and GA measur-ements. The hazard risk of primary cardiovascular events was 87% higher in men than in female patients (95% CI -8% to 80%), but the risk difference did not reach 5% statistical significance (Pval=0.08). No association was found between GA or HbA1c levels, and the onset of cardiac and cerebrovascular events. Twenty seven primary peripheral vascular events were observed, with an increased risk at increasing HbA1c concentration (Pval=0.002). The hazard of primary peripheral vascular events increased by 45% per Hb1Ac unit (95% CI 15% to 84%). The association showed borderline significance for GA (Pval=0.06). Figures 2a and 2b show the corresponding Kaplan Meier curves when patients were stratified by biomarker values at the first visit. Five years after first visit, seventeen percent of patients with a good glycemic control (HbA1c <7.1%) showed a peripheral angiological event, compared to 28% of patients with a poorer glycemic control (HbA1c ≥7.1%). Primary renal and ophthalmological events were not separately considered
due to the low number. We found a significant association between HbA1c levels and risk of a composite of all primary events. An increment of one unit of HbA1c increased the risk of macroangiopathic events or death by 22%. As reflected by the Kaplan Meier survival curves (Figures 2c and 2d), 12% of patients with a good glycemic control (HbA1c <7.1%) experienced a primary endpoint, compared to 25% of patients with a poorer glycemic control (HbA1c ≥7.1%).
The associations between biomarker levels and cardio-vascular, cerebrovascular and peripheral vascular events were also identified when secondary endpoints were considered (data not shown). Table 3 reports hazard ratios when secondary renal and ophthalmological events were additionally inve-stigated. There was a close association between GA and the onset of renal complications (Pval=0.01). The ass-ociation was weaker for HbA1c (Pval=0.05). The per-unit increment of GA increased the risk of combined primary and secondary renal events by 6%, the corresponding increment per HbA1c unit amounted 15% Please note the broader range of GA values (12% to 24%, Table1) compared to the HbA1c range (6% to 10%), which translates into smaller per unit risk incr-eases. Multiple Cox regression analyses resulted in practically identical results. For example, the per GA unit age adjusted hazard ratio for secondary renal events was 1.06 (95% CI 1.01-1.11, Pval=0.01). Figures 2d and 2e show the corres-ponding Kaplan Meier curves. Five years after first, twenty percent of patients with a good glycemic control (GA relative <15.9%) suffered from a renal complication, compared to 36% of patients with a poorer glycemic control (GA relative ≥15.9%). The corresponding proportions based on HbA1c were 22% (HbA1c <7.1%) and 35% (HbA1c ≥7.1%). No association was detected between glycemic control biom-arkers and ophth-almological complications.
DiscussionThe present study examined the correlation of GA, a newer marker of the glycemic control, and the occurrence of micro- and macrovascular complications with type-2 diabetic patients with normal to moderately impaired kidney function compared to HbA1c. Both biomarkers significantly correlated with the occurrence of renal endpoints, the association was stronger for GA compared to HbA1c. The occurrence of peripheral vascular endpoints was increased by 45% per HbA1c unit (Pval=0.002) and by 9% per GA unit (Pval=0.06). A separate association with cardiovascular and cerebrovascular endpoints could not be determined, but the composite of all primary macrovascular disease endpoints resulted in an association with HbA1c.
HbA1c is considered the gold standard in diabetes control, which does not only reflect the glycemic adjustment of the last 2-3 months but is also a predictor of the occurrence of complications associated with diabetes [1-3]. However, the HbA1c-value is affected by hemoglobin metabolism and the lifespan of erythrocytes. In clinical situations in which these parameters are changed, i.e., in diabetic patients with
Years till first observation
Years till first observation
Gly
cate
d A
lbum
in (%
)H
b1A
c (%
)
0 1 2 3 4 5
68
1012
14a
b
0
1015
2025
3035
1 2 3 4 5

Hasslacher et al. Journal of Diabetes Research & Clinical Metabolism 2014, http://www.hoajonline.com/journals/pdf/2050-0866-3-9.pdf
5
doi: 10.7243/2050-0866-3-9
Figure 2. Kaplan-Meier survival curves on the relationship between HbA1c (GA) and peripheral vascular events (a (b)), combined primary events (c (d)), and renal events (e (f)). The number of patients at risk is indicated in the lower part of the plots.
Cardiovascular* Cerebrovascular† Peripheral vascular‡
Variable Level N HR 95% CI Pval N HR 95% CI Pval N HR 95% CI Pval
Gender Men 25 1.87 0.92 3.80 0.08 12 1.21 0.50 2.97 0.67 17 1.38 0.63 3.02 0.42
Women 11 Ref. -- -- -- 8 Ref. -- -- -- 10 Ref. -- -- --
Age <62 3 0.22 0.06 0.79 0.13 1 0.19 0.02 1.53 0.27 8 1.88 0.60 5.86 0.75
(years) 62-66 8 0.67 0.28 1.60 -- 7 1.40 0.48 4.03 -- 6 1.47 0.44 4.86 --
67-71 11 0.78 0.35 1.73 -- 5 0.79 0.25 2.48 -- 8 1.61 0.52 4.94 --
72+ 14 Ref. -- -- -- 7 Ref. -- -- -- 5 Ref. -- -- --
HbA1c per unit 36 1.07 0.81 1.41 0.64 20 0.98 0.64 1.49 0.92 27 1.45 1.15 1.84 0.002
(%) <6.6 7 0.63 0.24 1.62 0.80 5 1.30 0.35 4.87 0.66 5 0.47 0.16 1.39 0.22
6.6-7.0 9 0.84 0.34 2.03 -- 3 0.74 0.16 3.31 -- 3 0.28 0.08 1.05 --
7.1-7.8 9 0.76 0.31 1.83 -- 8 1.63 0.49 5.44 -- 9 0.76 0.31 1.89 --
7.9+ 11 Ref. -- -- -- 4 Ref. -- -- -- 10 Ref. -- -- --
GA per unit 36 1.01 0.93 1.10 0.74 20 0.98 0.86 1.11 0.72 27 1.09 1.00 1.18 0.06
(%) <14.1 9 0.65 0.28 1.53 0.32 5 1.17 0.31 4.38 0.83 4 0.42 0.13 1.38 0.26
14.1-15.8 9 0.80 0.34 1.87 -- 4 1.08 0.27 4.33 -- 4 0.45 0.14 1.48 --
15.9-18.2 5 0.38 0.14 1.07 -- 7 1.67 0.49 5.72 -- 10 1.04 0.42 2.57 --
18.3+ 13 Ref. -- -- -- 4 Ref. -- -- -- 9 Ref. -- -- --
Table 2. Relationship between death or primary endpoint-free survival and patient’s gender, age, HbA1c and GA measurements. Global probability values for variable effects are shown in addition to confidence intervals for comparisons with the reference category.
YearsYears
Years
Even
t-fr
ee su
rviv
alEv
ent-
free
surv
ival
Even
t-fr
ee su
rviv
al
Even
t-fr
ee su
rviv
alEv
ent-
free
surv
ival
Even
t-fr
ee su
rviv
al
HbA1c < 7.1 HbA1c < 7.1HbA1c < 7.1
GA rel <15.9 GA rel <15.9 GA rel <15.9
Pvallog-rank 0.07
Pvallog-rank 0.33 Pvallog-rank 0.30 Pvallog-rank 0.01
Pvallog-rank 0.12Pvallog-rank 0.05
0 1 2 3 4 5Years
0 1 2 3 4 5 0 1 2 3 4 5Years
0 1 2 3 4 5Years
0 1 2 3 4 5 0 1 2 3 4 5
170 165 151 131 114 89 HbA1c < 7.1210 198 177 132 94 72 HbA1c 7.1+
165 163 147 122 101 82 GA rel < 15.9215 198 181 141 107 79 GA rel 15.9+
165 161 144 122 103 89 GA rel < 15.9215 201 187 148 112 83 GA rel 15.9+
165 163 149 128 107 92 GA rel < 15.9215 196 179 143 113 86 GA rel 15.9+
170 164 151 133 114 96 HbA1c < 7.1210 195 177 138 106 82 HbA1c < 7.1+
170 167 154 134 116 96 HbA1c < 7.1210 195 177 136 99 76 HbA1c 7.1+
0.0
0.2
0.4
0.6
0.8
1.0
0.0
0.2
0.4
0.6
0.8
1.0
0.0
0.2
0.4
0.6
0.8
1.0
0.0
0.2
0.4
0.6
0.8
1.0
0.0
0.2
0.4
0.6
0.8
1.0
0.0
0.2
0.4
0.6
0.8
HbA1c 7.1+ HbA1c 7.1+ HbA1c 7.1+
GA rel 15.9+GA rel 15.9+GA rel 15.9+
a c
d f
e
b 1.0
Hasslacher et al. Journal of Diabetes Research & Clinical Metabolism 2014, http://www.hoajonline.com/journals/pdf/2050-0866-3-9.pdf
6
doi: 10.7243/2050-0866-3-9
Death Primary composite**
Variable Level N HR 95% CI Pval N HR 95% CI Pval
Gender Men 17 2.85 1.05 7.73 0.04 56 1.46 0.94 2.27 0.09
Women 5 Ref. -- -- -- 31 Ref. -- -- --
Age <62 1 0.15 0.02 1.16 0.23 11 0.41 0.21 0.81 0.05
(years) 62-66 4 0.54 0.17 1.71 -- 15 0.56 0.31 1.04 --
67-71 6 0.56 0.21 1.52 -- 26 0.77 0.46 1.28 --
72+ 11 Ref. -- -- -- 35 Ref. -- -- --
HbA1c Per unit 22 0.60 0.35 1.02 0.06 87 1.22 1.03 1.45 0.02
(%) <6.6 7 3.33 0.69 16.08 0.50 18 0.63 0.35 1.16 0.26
6.6-7.0 7 2.79 0.57 13.59 -- 17 0.56 0.30 1.05 --
7.1-7.8 6 2.32 0.47 11.54 -- 26 0.78 0.45 1.35 --
7.9+ 2 Ref. -- -- -- 26 Ref. -- -- --
GA Per unit 22 0.97 0.85 1.10 0.65 87 1.04 0.98 1.10 0.20
(%) <14.1 6 1.30 0.37 4.63 0.95 19 0.65 0.36 1.17 0.47
14.1-15.8 6 1.41 0.39 5.05 -- 21 0.78 0.44 1.39 --
15.9-18.2 6 1.39 0.39 4.93 -- 20 0.70 0.39 1.25 --
18.3+ 4 Ref. -- -- -- 27 Ref. -- -- --
Continuation of Table 2.
N: Events, HR: Hazard ratio, CI: Confidence interval, Pval: Probability value. Hazard ratios (HRs) with 95% CIs were calculated treating GA and Hb1Ac measurements as time-dependent variables in a Cox proportional hazard regression model.*cardiovascular (first of myocardial infarction, PTCA/stent or CABG).†cerebrovascular (first of apoplectic insult, TIA or carotis-TEA).‡peripheral vascular (first of amputation, PTD or bypass-operation).**first of a primary cardiovascular, cerebrovascular, peripheral vascular event, terminal renal failure, blindness and death.
advanced stages of nephropathy, the HbA1c-value does not any longer correctly reflect glycemic control.
Glycation of serum albumin is not affected by these factors, therefore, GA is considered the better glycemic marker in kidney failure [6,13,14]. GA reflects the glycemic adjustment over a shorter period of time and seems to also reflect post-prandial blood sugar peaks [6,15,16]. Factors influencing the GA level are diseases that are accompanied by an impairment of albumin metabolism, such as e.g., liver cirrhosis, thyroid dysfunction or nephrotic syndrome [6,17]. In the present study, none of the patients suffered from one of these diseases. GA, however, is not just a glycemic marker but additionally exhibits biological properties of importance for the development of vascular complications. Serum albumin possesses substantial antioxidative properties, which may limit oxidative vascular damage in patients with diabetes [18,19]. On the one hand, albumin glycation reduces the antioxidative capacities of the plasma. On the other hand, a protein with atherogenic effects is generated, which may promote the development of vascular damage [20-22]. Observation studies in dialysis patients have shown that GA - and not HbA1c - is the better predictor for survival, hospitalization or vascular calcification [8,9].
Comparative investigations on the correlation between
GA and HbA1c as markers of glycemic control and predictors for diabetes-associated vascular complications were, so far, not performed in patients with normal or just moderately impaired kidney function who represent the major part of Type 2 diabetic patients. At regular intervals, we clinically examined the patients and measured laboratory parameters in type-2 diabetic patients with CKD stage 1 to 3 over an average period of 4.7 years. There was a highly significant correlation (r=0.71) between HbA1c and GA, which was not significantly affected by age, gender, kidney function or hemoglobin levels.Both glycemic parameters showed essentially constant values during the observation period (Figure 1).
The repeated monitoring of glycemic control parameters and occurrence of microvascular complications revealed, for the first time, a steady association between increasing GA values and the occurrence of renal complications. A one-unit increase of the GA level was accompanied by an 6% increase in the hazard ratio (HR) for the development of renal endpoints (p<0.01). As mentioned above, GA shows a broader range of values compared to HbA1c which translates into smaller risk increases. As reflected in the Kaplan Meier curves, the cumulative risk of developing renal complications was almost doubled in patients with poorer compared with

Hasslacher et al. Journal of Diabetes Research & Clinical Metabolism 2014, http://www.hoajonline.com/journals/pdf/2050-0866-3-9.pdf
7
doi: 10.7243/2050-0866-3-9
Renal* Ophthalmological†
Variable Level N HR 95% CI Pval N HR 95% CI Pval
Gender Men 84 1.11 0.79 1.54 0.55 45 2.23 1.29 3.86 0.004
Women 61 Ref. -- -- -- 18 Ref. -- -- --
Age <62 15 0.26 0.15 0.46 <0.0001 6 0.34 0.14 0.86 0.12
(years) 62-66 20 0.32 0.20 0.53 -- 17 0.99 0.52 1.87 --
67-71 31 0.37 0.25 0.57 -- 17 0.80 0.43 1.50 --
72+ 79 Ref. -- -- -- 23 Ref. -- -- --
HbA1c Per unit 145 1.15 1.00 1.34 0.05 63 1.19 0.98 1.46 0.09
(%) <6.6 23 0.61 0.36 1.02 0.17 14 0.66 0.33 1.31 0.40
6.6-7.0 36 0.81 0.51 1.29 -- 13 0.57 0.28 1.16 --
7.1-7.8 50 1.02 0.66 1.57 -- 16 0.67 0.35 1.30 --
7.9+ 36 Ref. -- -- -- 20 Ref. -- -- --
GA Per unit 145 1.06 1.02 1.10 0.01 63 1.03 0.97 1.10 0.34
(%) <14.1 27 0.51 0.32 0.83 0.06 14 0.69 0.34 1.38 0.70
14.1-15.8 36 0.71 0.46 1.11 -- 13 0.75 0.37 1.54 --
15.9-18.2 37 0.76 0.49 1.18 -- 18 0.92 0.48 1.77 --
18.3+ 45 Ref. -- -- -- 18 Ref. -- -- --
Table 3. Relationship between death and renal or ophthalmological event-free survival and patient’s gender, age, HbA1c and GA measurements. Global probability values for variable effects are shown in addition to confidence intervals for comparisons with the reference category
N: Events, HR: Hazard ratio, CI: Confidence interval, Pval: Probability value. Hazard ratios (HRs) with 95% CIs were calculated treating GA and Hb1Ac measurements as time-dependent variables in a Cox proportional hazard regression model.*renal (first of death by any cause, terminal renal failure, reduction of eGFR to less than 60 ml/min or onset of macroalbuminuria, i.e. an albumin/creatinine ratio over 300 mg/g in female patients and over 200 mg/g in male patients).†ophthalmological (first of death by any cause, blindness, diagnosis of persistent retinopathy or retinopathy progression).
better glycemic control ( 36% vs 20%; Figures 2e and 2f). There was also a positive although weaker association between HbA1c and the occurrence of renal events (Pval=0.05). For both glycemic markers, the collectives with better and poorer glycemic control already split up in the first year of observation. In the DCCT/EDIC study a similar association was described between GA and onset of nephropathy [23]. An association of glycemic control and the occurrence of retinopathy could not be detected in our analysis.
The time-dependent analysis of glycemic control parameters and the occurrence of macrovascular endpoints showed a significant correlation between HbA1c and peripheral vascular events. The occurrence of peripheral vascular endpoints was increased by 45% per HbA1c unit (Pval=0.002) and by 9% per GA unit (Pval=0.06) (Table 2). Corresponding findings were obtained by the Kaplan-Meier curve (Figures 2a and 2b). The correlation between GA and the angiological events was positive too but only marginally significant. In contrast, an association between glycemic control parameter and the occurrence of cardiovascular and cerebrovascular events was not detected. The composite of all primary endpoints, however,
pointed towards a positive correlation with HbA1c but not with GA. Five years after the start of the study, only 12% of the patients with better diabetes control had developed a primary endpoint, compared to 25% of patients with poorer diabetes control.
The effect of glycemic control, measured by the HbA1c level, on the development and progression of diabetic neph-ropathy is well documented in numerous studies. A novelty of the present study was the identified association with the biomarker GA [1,2]. It cannot be decided in this investigation whether 1) the closer correlation between renal endpoints and GA compared to the ones with HbA1c indicate that post-prandial blood sugar levels, which are better reflected by GA than by HbA1c, are of importance for the development of nephropathy or 2) GA as a pathogenetic agent damages especially glomerular structures. Several studies showed that the function of mesangial cells is altered by GA [24-26]. The reasons for the absence of a corresponding association with retinopathy in our study are unclear. It is, however, well-kn-own that the occurrence of retinopathy and nephropathy in type 2 diabetes are not closely linked. The prevalence of

Hasslacher et al. Journal of Diabetes Research & Clinical Metabolism 2014, http://www.hoajonline.com/journals/pdf/2050-0866-3-9.pdf
8
doi: 10.7243/2050-0866-3-9
ophthalmological endpoints (11.3%) was clearly smaller than the one of renal endpoints (39.8%) in this study as well.
According to the results of intervention studies, the effect of glycemic control on the development or progression of macrovascular complications seems to depend substantially on the time point and the duration of the glycemic intervention. With intensified treatment starting at the time the diabetes is diagnosed, long-term observation over many years was able to detect an effect of better glycemic control on the prevention of macrovascular complications [27,28]. An inten-sification of diabetes therapy after the diabetes has been existing for a prolonged period of time and at higher age of the patients did not show a positive effect [29,30]. At the time of enrolment, the duration of diabetes and the age of the patients examined in this study amounted to 9.0 and 64.6 years, respectively. This may, with a relatively short observation time of 4.5 years, explain the lack of a correlation between glycemic control and the occurrence of cardiovascular and cerebrovascular complications. However, for the peripheral vascular endpoint and the composite of all macrovascular complications including death, a significant association was observed for HbA1c but not for GA.
Present findings are limited by the number of investigated patients and the time of follow-up. For example, the number of blind patients or patients on dialysis therapy were too low for a statistical evaluation. However, the gathered results as a composite of primary and secondary endpoints appear to be valid in order to answer the question whether GA is superior to HbA1c as a predictor of vascular complications also in patients without higher-stage kidney impairment.Since this study is a monocentric observational study, the gathered findings cannot necessarily be generalized. On the other hand, the strength of the study was the homogeneous patient cohort that was treated according to usual standards of diabetes therapy over a prolonged period of time in one region, and monitored according to a standardized procedure. The statistical analyses accounted for parameter changes over the course of time (time-dependent variables) so that changes during the observation period were considered.
ConclusionIn summary, it can be stated that GA has clinical potential in the prediction of renal events in type 2 diabetic patients with normal or mildly impaired kidney function. Further investigations will have to show whether this indicates a pathogenetic role of postprandial blood sugar peaks, which are better reflected by GA than by HbA1c, or whether GA is a damaging agent of glomerular structures. HbA1c measurements appear to be a better predictor with regard to macrovascular complications in this patient collective.
List of abbreviationsBMI: Body mass indexCABG: Coronary artery bypass graft
1. Jakus V and Rietbrock N. Advanced glycation end-products and the progress of diabetic vascular complications. Physiol Res. 2004; 53:131-42. | Pdf | PubMed
2. American Diabetes Association. Standards of medical care in diabetes--2012. Diabetes Care. 2012; 35 Suppl 1:S11-63. | Article | PubMed Abstract | PubMed Full Text
3. Goldstein DE, Little RR, Lorenz RA, Malone JI, Nathan D, Peterson CM and Sacks DB. Tests of glycemia in diabetes. Diabetes Care. 2004; 27:1761-73. | Article | PubMed
4. Inaba M, Okuno S, Kumeda Y, Yamada S, Imanishi Y, Tabata T, Okamura M, Okada S, Yamakawa T, Ishimura E and Nishizawa Y. Glycated albumin is a better glycemic indicator than glycated hemoglobin values in hemodialysis patients with diabetes: effect of anemia and erythropoietin injection. J Am Soc Nephrol. 2007; 18:896-903. | Article | PubMed
5. Peacock TP, Shihabi ZK, Bleyer AJ, Dolbare EL, Byers JR, Knovich MA, Calles-Escandon J, Russell GB and Freedman BI. Comparison of glycated albumin and hemoglobin A(1c) levels in diabetic subjects on hemodialysis. Kidney Int. 2008; 73:1062-8. | Article | PubMed
6. Koga M and Kasayama S. Clinical impact of glycated albumin as another glycemic control marker. Endocr J. 2010; 57:751-62. | Article | PubMed
7. Takahashi S, Uchino H, Shimizu T, Kanazawa A, Tamura Y, Sakai K, Watada H, Hirose T, Kawamori R and Tanaka Y. Comparison of glycated albumin (GA) and glycated hemoglobin (HbA1c) in type 2 diabetic patients: usefulness of GA for evaluation of short-term changes in glycemic control. Endocr J. 2007; 54:139-44. | Article | PubMed
8. Fukuoka K, Nakao K, Morimoto H, Nakao A, Takatori Y, Arimoto K, Taki M, Wada J and Makino H. Glycated albumin levels predict long-term
Authors’ contributions CH FK IP JLBResearch concept and design ✓ -- -- --Collection and/or assembly of data ✓ ✓ ✓ --Data analysis and interpretation ✓ -- -- ✓Writing the article ✓ -- -- ✓Critical revision of the article ✓ ✓ ✓ ✓Final approval of article ✓ ✓ ✓ ✓Statistical analysis -- -- -- ✓
CI: Confidence intervalsCKD: Chronic kidney diseaseeGFR: estimated glomerular filtration rateGA: Glycated albuminHbA1c: glycated hemoglobinHR: Hazard ratiohs CRP: high-sensitive C-reactive proteinNT-pro-BNP: N-terminal pro-brain natriuretic peptideOAD: Oral antidiabetic drugPTA: Percutaneous transluminal angioplastyPTCA: Percutaneous transluminal coronary angioplastyTEA: Carotis-thrombendarterectomyTIA: Transient ischemic attack
Competing interestsThe authors declare that they have no competing interests.
Authors’ contributions
AcknowledgementThe study was kindly supported by an unrestricted grant of Manfred Lautenschläger Stiftung Diabetes, Wiesloch, Germany.
Publication historyEIC: Geoffrey Burnstock, University College London, UK.Received: 08-Aug-2014 Final Revised: 29-Sep-2014 Accepted: 23-Oct-2014 Published: 30-Oct-2014
References

Hasslacher et al. Journal of Diabetes Research & Clinical Metabolism 2014, http://www.hoajonline.com/journals/pdf/2050-0866-3-9.pdf
9
doi: 10.7243/2050-0866-3-9
survival in diabetic patients undergoing haemodialysis. Nephrology (Carlton). 2008; 13:278-83. | Article | PubMed
9. Freedman BI, Andries L, Shihabi ZK, Rocco MV, Byers JR, Cardona CY, Pickard MA, Henderson DL, Sadler MV, Courchene LM, Jordan JR, Balderston SS, Graham AD, Mauck VL, Russell GB and Bleyer AJ. Glycated albumin and risk of death and hospitalizations in diabetic dialysis patients. Clin J Am Soc Nephrol. 2011; 6:1635-43. | Article | PubMed
10. Clinical Practice Guidelines of the German Diabetes Association. Exp Clin Endocrinol Diabetes. 2014; 122:383-436.
11. Kouzuma T, Uemastu Y, Usami T and Imamura S. Study of glycated amino acid elimination reaction for an improved enzymatic glycated albumin measurement method. Clin Chim Acta. 2004; 346:135-43. | Article | PubMed
12. Nathan DM, Steffes MW, Sun W, Rynders GP and Lachin JM. Determining stability of stored samples retrospectively: the validation of glycated albumin. Clin Chem. 2011; 57:286-90. | Article | PubMed
13. Kim KJ and Lee BW. The roles of glycated albumin as intermediate glycation index and pathogenic protein. Diabetes Metab J. 2012; 36:98-107. | Article | PubMed Abstract | PubMed Full Text
14. Freedman BI. A critical evaluation of glycated protein parameters in advanced nephropathy: a matter of life or death: time to dispense with the hemoglobin A1C in end-stage kidney disease. Diabetes Care. 2012; 35:1621-4. | Article | PubMed Abstract | PubMed Full Text
15. Vos FE, Schollum JB, Coulter CV, Manning PJ, Duffull SB and Walker RJ. Assessment of markers of glycaemic control in diabetic patients with chronic kidney disease using continuous glucose monitoring. Nephrology (Carlton). 2012; 17:182-8. | Article | PubMed
16. Saisho Y, Tanaka K, Abe T, Shimada A, Kawai T and Itoh H. Glycated albumin to glycated hemoglobin ratio reflects postprandial glucose excursion and relates to beta cell function in both type 1 and type 2 diabetes. Diabetol Int. 2011; 2:146-153. | Article
17. Okada T, Nakao T, Matsumoto H, Nagaoka Y, Tomaru R, Iwasawa H and Wada T. Influence of proteinuria on glycated albumin values in diabetic patients with chronic kidney disease. Intern Med. 2011; 50:23-9. | Article | PubMed
18. Roche M, Rondeau P, Singh NR, Tarnus E and Bourdon E. The antioxidant properties of serum albumin. FEBS Lett. 2008; 582:1783-7. | Article | PubMed
19. Bourdon E and Blache D. The importance of proteins in defense against oxidation. Antioxid Redox Signal. 2001; 3:293-311. | Article | PubMed
20. Rondeau P and Bourdon E. The glycation of albumin: structural and functional impacts. Biochimie. 2011; 93:645-58. | Article | PubMed
21. Rodino-Janeiro BK, Gonzalez-Peteiro M, Ucieda-Somoza R, Gonzalez-Juanatey JR and Alvarez E. Glycated albumin, a precursor of advanced glycation end-products, up-regulates NADPH oxidase and enhances oxidative stress in human endothelial cells: molecular correlate of diabetic vasculopathy. Diabetes Metab Res Rev. 2010; 26:550-8. | Article | PubMed
22. Cohen MP. Clinical, pathophysiological and structure/function consequences of modification of albumin by Amadori-glucose adducts. Biochim Biophys Acta. 2013; 1830:5480-5. | Article | PubMed
23. Nathan DM, McGee P, Steffes MW and Lachin JM. Relationship of glycated albumin to blood glucose and HbA1c values and to retinopathy, nephropathy, and cardiovascular outcomes in the DCCT/EDIC study. Diabetes. 2014; 63:282-90. | Article | PubMed
24. Cohen MP, Hud E, Wu VY and Ziyadeh FN. Albumin modified by Amadori glucose adducts activates mesangial cell type IV collagen gene transcription. Mol Cell Biochem. 1995; 151:61-7. | Article | PubMed
25. Cohen MP, Lautenslager GT, Hud E, Shea E, Wang A, Chen S and Shearman CW. Inhibiting albumin glycation attenuates dysregulation of VEGFR-1 and collagen IV subchain production and the development of renal insufficiency. Am J Physiol Renal Physiol. 2007; 292:F789-95. | Article | PubMed
26. Li Y and Wang S. Glycated albumin activates NADPH oxidase in rat mesangial cells through up-regulation of p47phox. Biochem Biophys Res Commun. 2010; 397:5-11. | Article | PubMed Abstract | PubMed Full Text
27. Holman RR, Paul SK, Bethel MA, Matthews DR and Neil HA. 10-year follow-up of intensive glucose control in type 2 diabetes. N Engl J Med. 2008; 359:1577-89. | Article | PubMed
28. Patel A, MacMahon S, Chalmers J, Neal B, Billot L, Woodward M, Marre M, Cooper M, Glasziou P, Grobbee D, Hamet P, Harrap S, Heller S, Liu L, Mancia G, Mogensen CE, Pan C, Poulter N, Rodgers A, Williams B, Bompoint S, de Galan BE, Joshi R and Travert F. Intensive blood glucose control and vascular outcomes in patients with type 2 diabetes. N Engl J Med. 2008; 358:2560-72. | Article | PubMed
29. Gerstein HC, Miller ME, Genuth S, Ismail-Beigi F, Buse JB, Goff DC, Jr., Probstfield JL, Cushman WC, Ginsberg HN, Bigger JT, Grimm RH, Jr., Byington RP, Rosenberg YD and Friedewald WT. Long-term effects of intensive glucose lowering on cardiovascular outcomes. N Engl J Med. 2011; 364:818-28. | Article | PubMed Abstract | PubMed Full Text
30. Duckworth W, Abraira C, Moritz T, Reda D, Emanuele N, Reaven PD, Zieve FJ, Marks J, Davis SN, Hayward R, Warren SR, Goldman S, McCarren M, Vitek ME, Henderson WG and Huang GD. Glucose control and vascular complications in veterans with type 2 diabetes. N Engl J Med. 2009; 360:129-39. | Article | PubMed
Citation:Hasslacher C, Kulozik F, Platten I and Lorenzo Bermejo J. Glycated albumin and HbA1c as predictors of mortality and vascular complications in type 2 diabetes patients with normal and moderately impaired renal function: 5-year results from a 380 patient cohort. J Diab Res Clin Met. 2014; 3:9. http://dx.doi.org/10.7243/2050-0866-3-9