glycaemic index and body weight - british nutrition …. prof gary frost... · the effect of...
TRANSCRIPT
Glycaemic index and body weight
Gary Frost
Imperial College
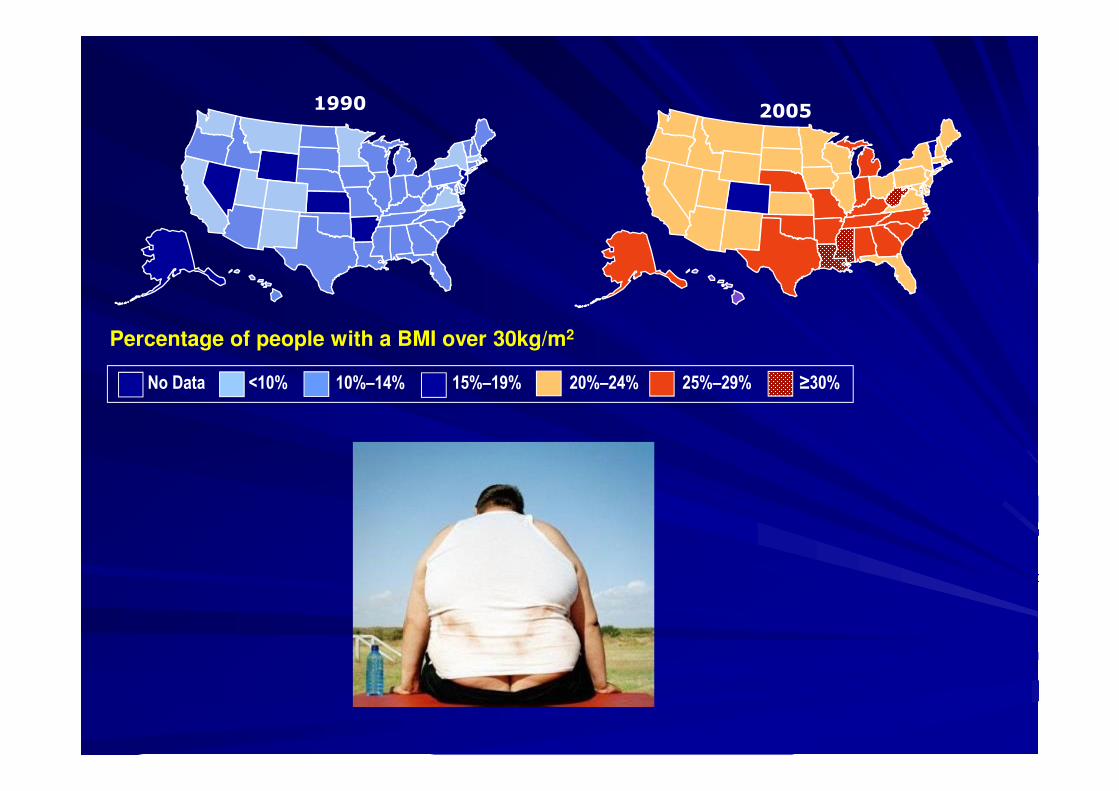
19902005
No Data <10% 10%–14% 15%–19% 20%–24% 25%–29% ≥30%
Percentage of people with a BMI over 30kg/m2
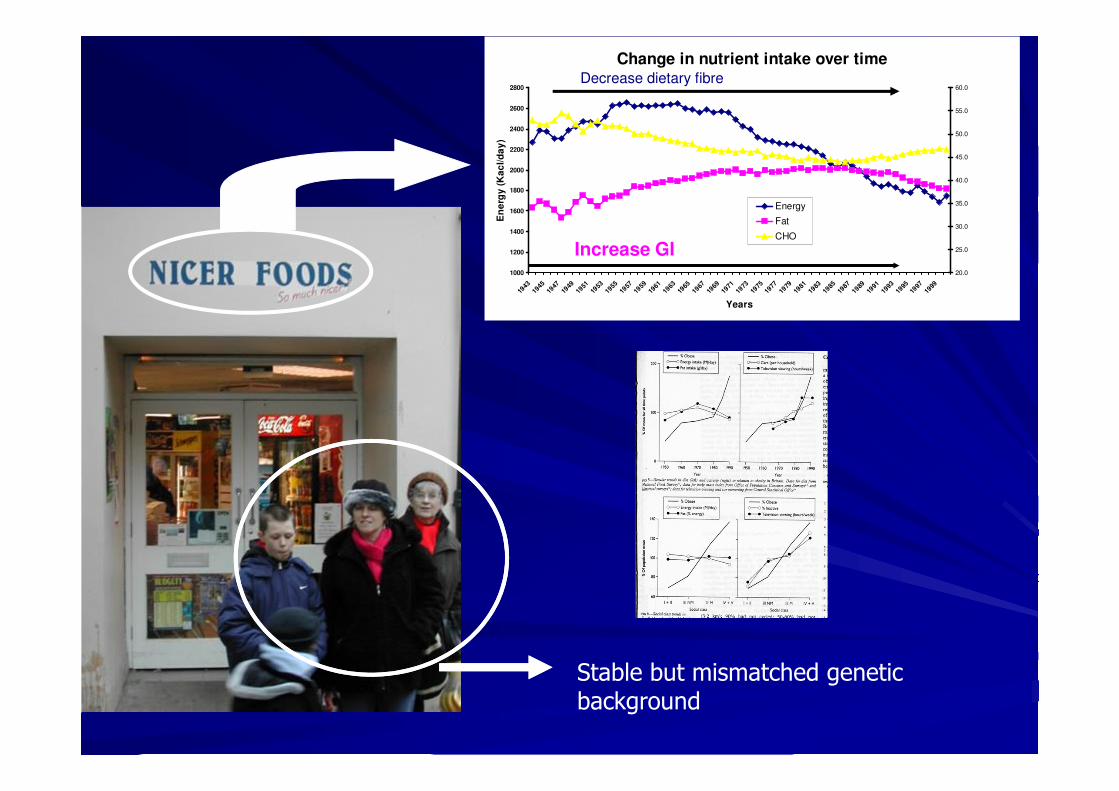
Change in nutrient intake over time
1000
1200
1400
1600
1800
2000
2200
2400
2600
2800
1943
1945
1947
1949
1951
1953
1955
1957
1959
1961
1963
1965
1967
1969
1971
1973
1975
1977
1979
1981
1983
1985
1987
1989
1991
1993
1995
1997
1999
Years
En
erg
y (
Ka
cl/d
ay
)
20.0
25.0
30.0
35.0
40.0
45.0
50.0
55.0
60.0
Energy
Fat
CHO
Stable but mismatched genetic background
Increase GI
Decrease dietary fibre
What is glycaemic index
History
Known from the beginning of the century that different CHO have different effects on blood glucose and insulin
Early 1980’s Jenkins, Wolever and Leeds termed the phrase GI. Aimed at improving glycaemic control in people living with diabetes
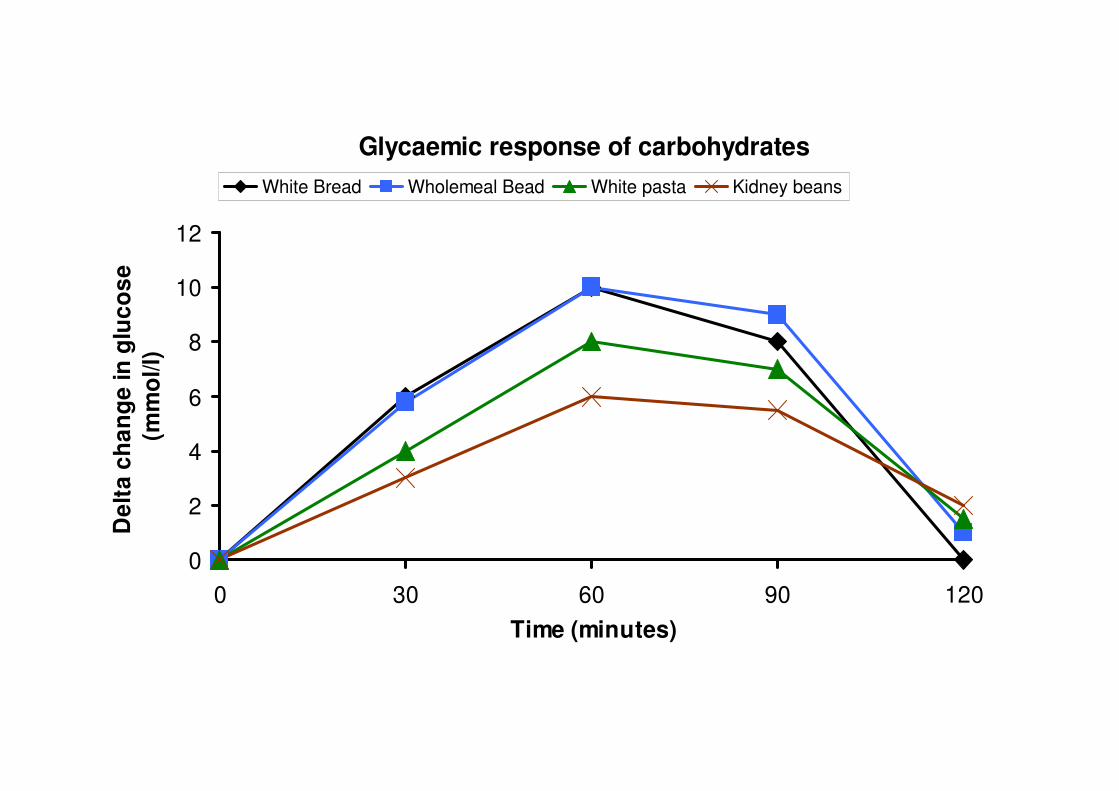
Glycaemic response of carbohydrates
0
2
4
6
8
10
12
0 30 60 90 120
Time (minutes)
De
lta
ch
an
ge
in
glu
co
se
(mm
ol/l)
White Bread Wholemeal Bead White pasta Kidney beans
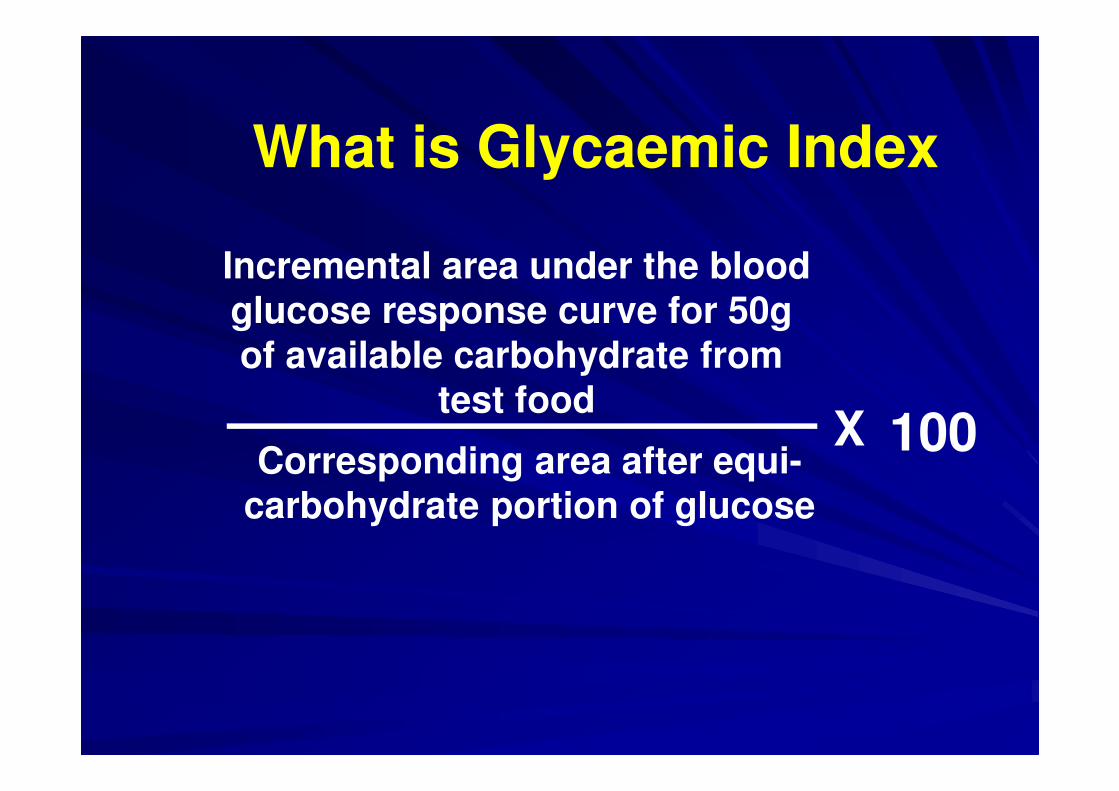
What is Glycaemic Index
Incremental area under the bloodglucose response curve for 50g of available carbohydrate from
test food
Corresponding area after equi-carbohydrate portion of glucose
X 100
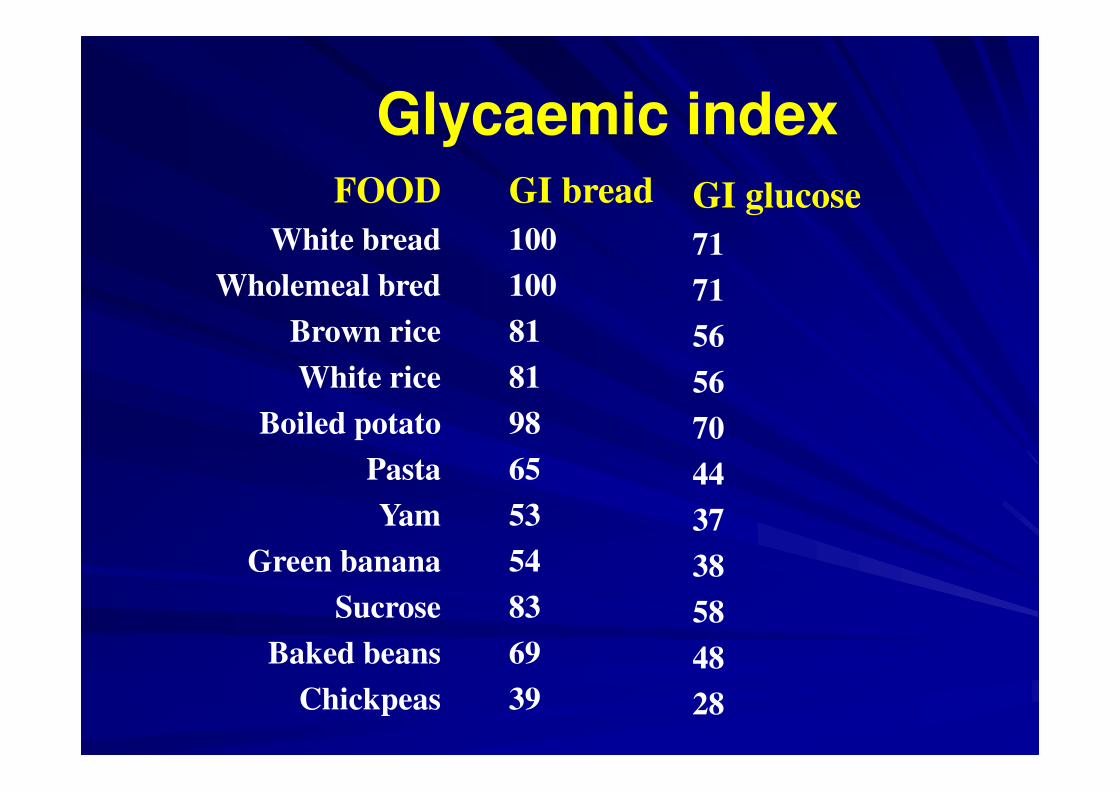
Glycaemic indexFOOD
White bread
Wholemeal bred
Brown rice
White rice
Boiled potato
Pasta
Yam
Green banana
Sucrose
Baked beans
Chickpeas
GI bread
100
100
81
81
98
65
53
54
83
69
39
GI glucose
71
71
56
56
70
44
37
38
58
48
28
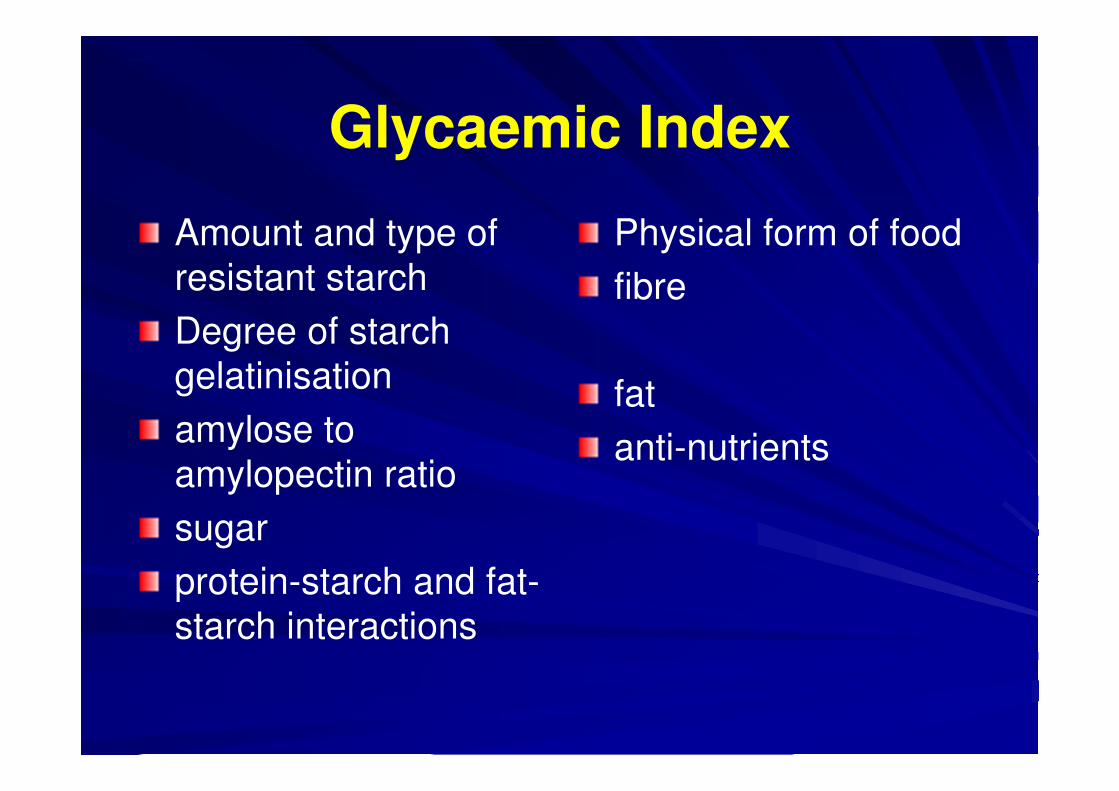
Glycaemic Index
Amount and type of
resistant starch
Degree of starch
gelatinisation
amylose to
amylopectin ratio
sugar
protein-starch and fat-
starch interactions
Physical form of food
fibre
fat
anti-nutrients
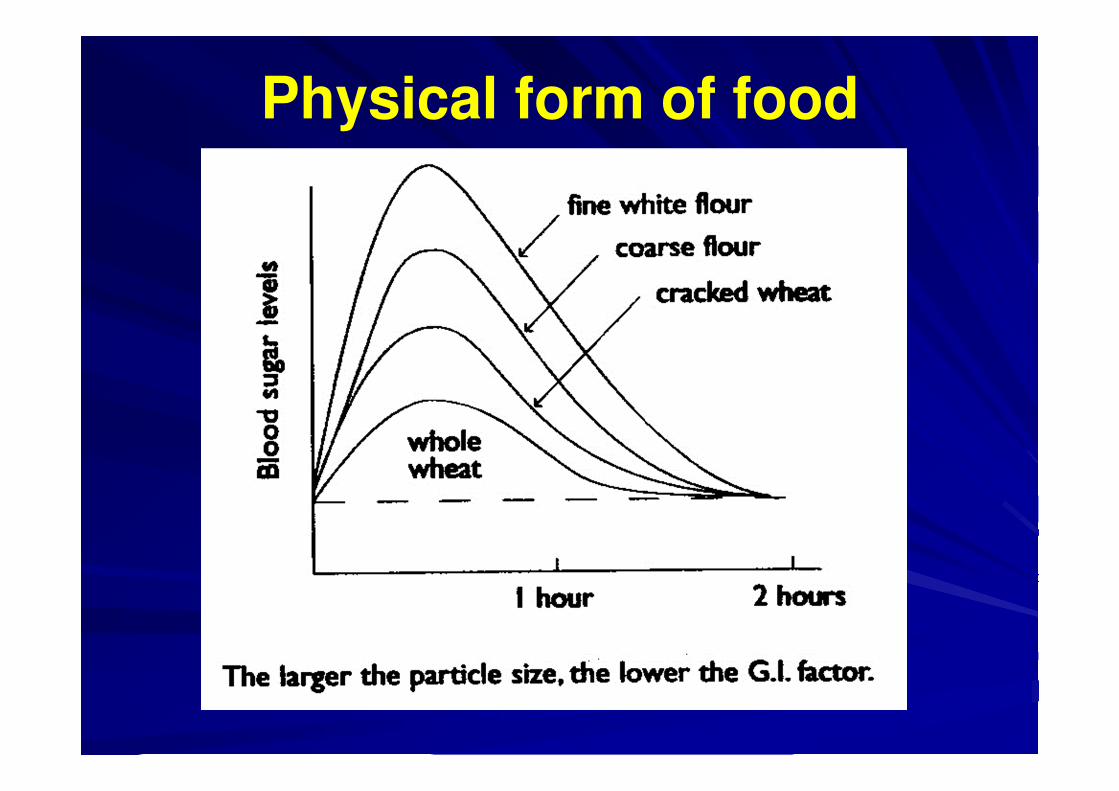
Physical form of food
Evidence in diabetes
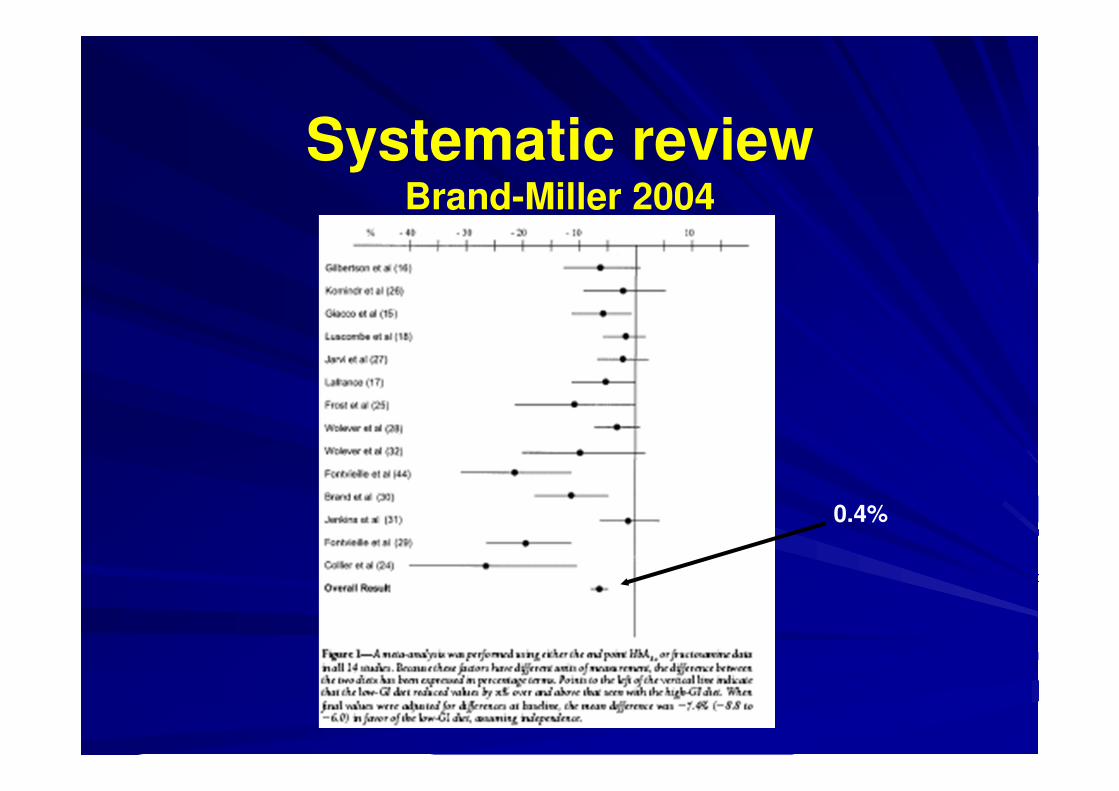
Systematic reviewBrand-Miller 2004
0.4%
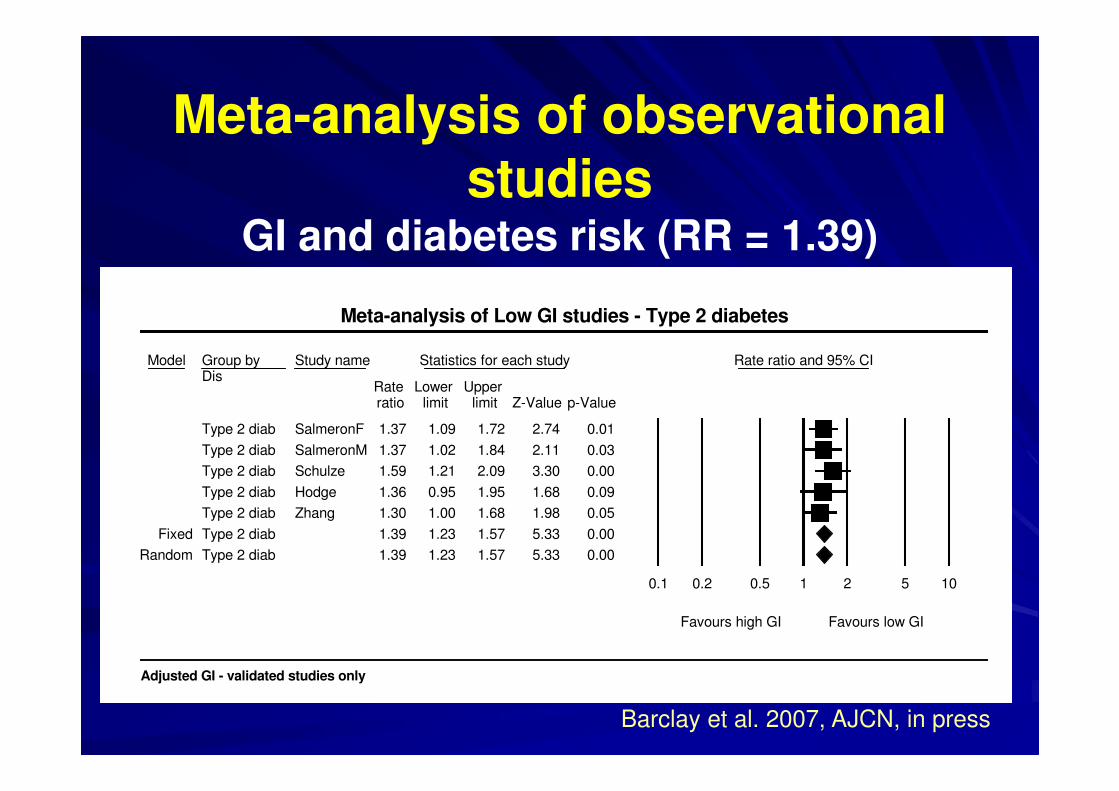
Model Group byDis
Study name Statistics for each study Rate ratio and 95% CI
Rate Lower Upper ratio limit limit Z-Value p-Value
Type 2 diab SalmeronF 1.37 1.09 1.72 2.74 0.01
Type 2 diab SalmeronM 1.37 1.02 1.84 2.11 0.03
Type 2 diab Schulze 1.59 1.21 2.09 3.30 0.00
Type 2 diab Hodge 1.36 0.95 1.95 1.68 0.09
Type 2 diab Zhang 1.30 1.00 1.68 1.98 0.05
Fixed Type 2 diab 1.39 1.23 1.57 5.33 0.00
Random Type 2 diab 1.39 1.23 1.57 5.33 0.00
0.1 0.2 0.5 1 2 5 10
Favours high GI Favours low GI
Meta-analysis of Low GI studies - Type 2 diabetes
Adjusted GI - validated studies only
Meta-analysis of observational studies
GI and diabetes risk (RR = 1.39)
Barclay et al. 2007, AJCN, in press
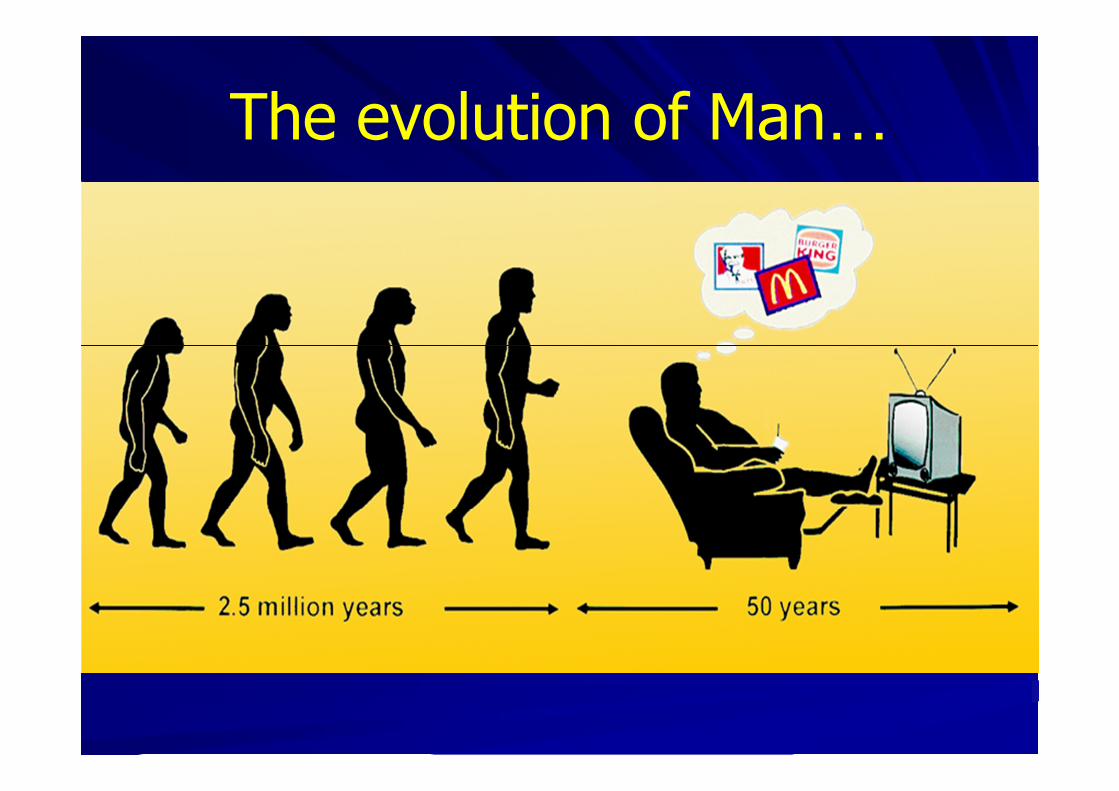
The evolution of Man…

Acute studies
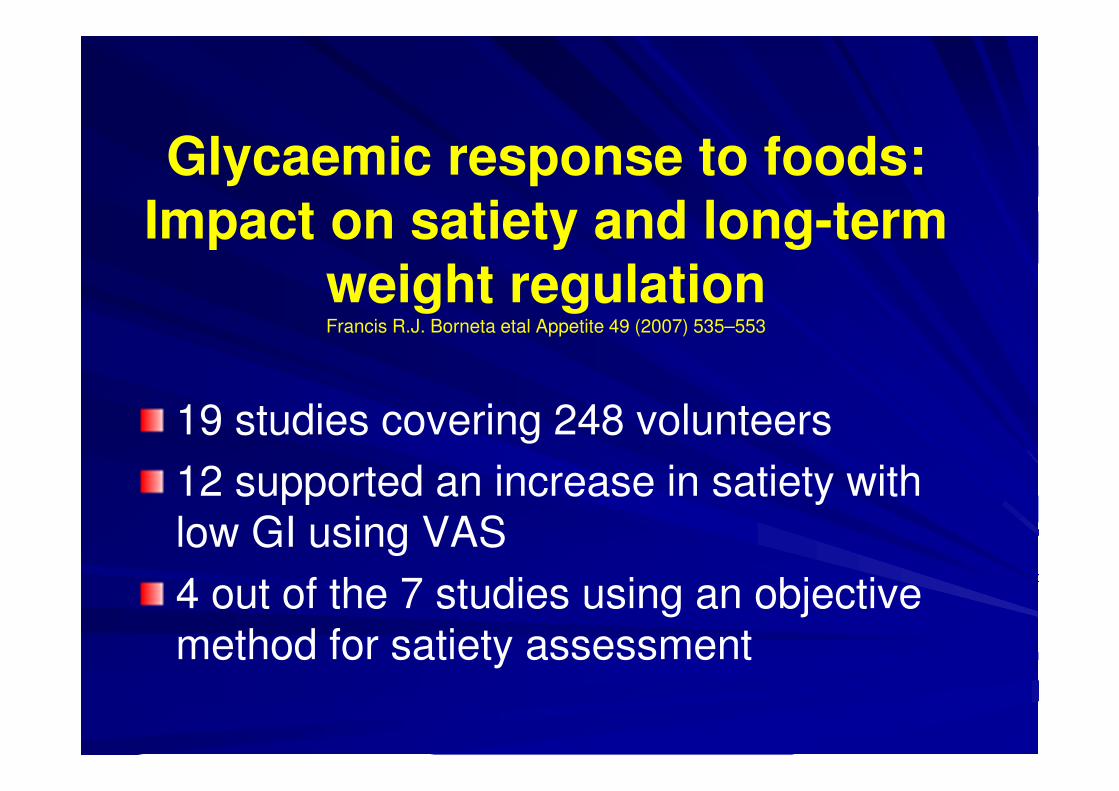
Glycaemic response to foods: Impact on satiety and long-term
weight regulationFrancis R.J. Borneta etal Appetite 49 (2007) 535–553
19 studies covering 248 volunteers
12 supported an increase in satiety with low GI using VAS
4 out of the 7 studies using an objective method for satiety assessment
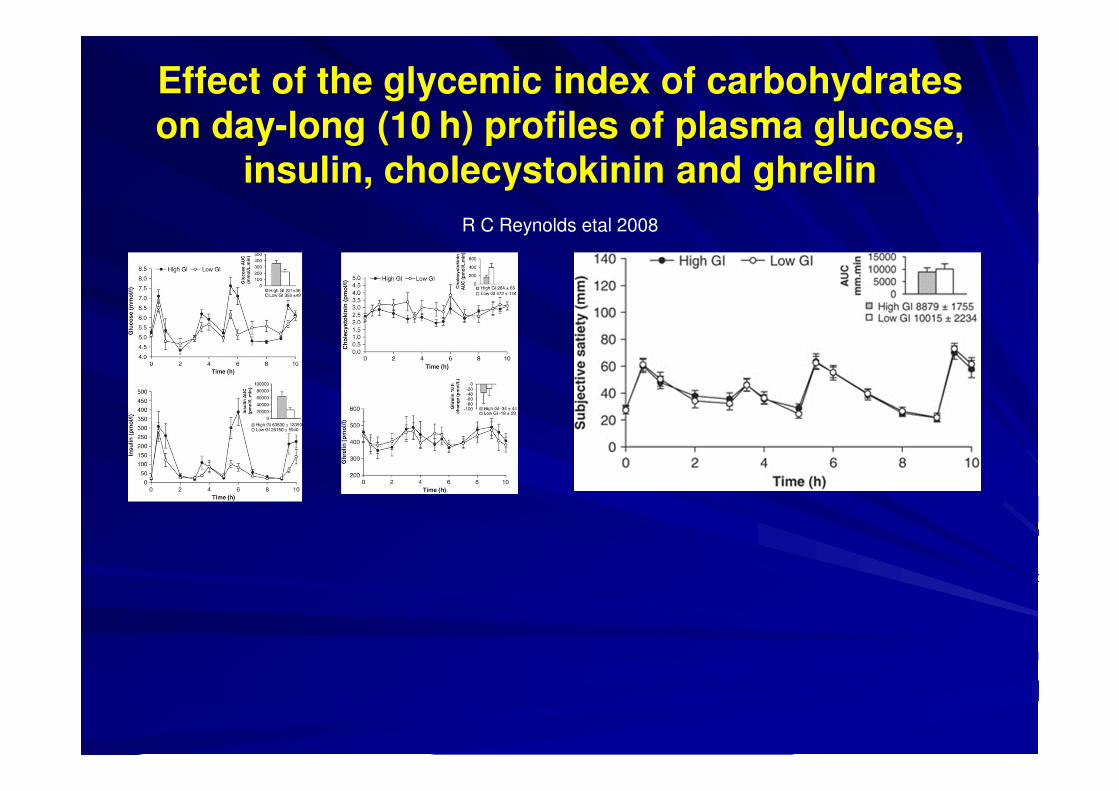
Effect of the glycemic index of carbohydrates on day-long (10 h) profiles of plasma glucose,
insulin, cholecystokinin and ghrelin
R C Reynolds etal 2008
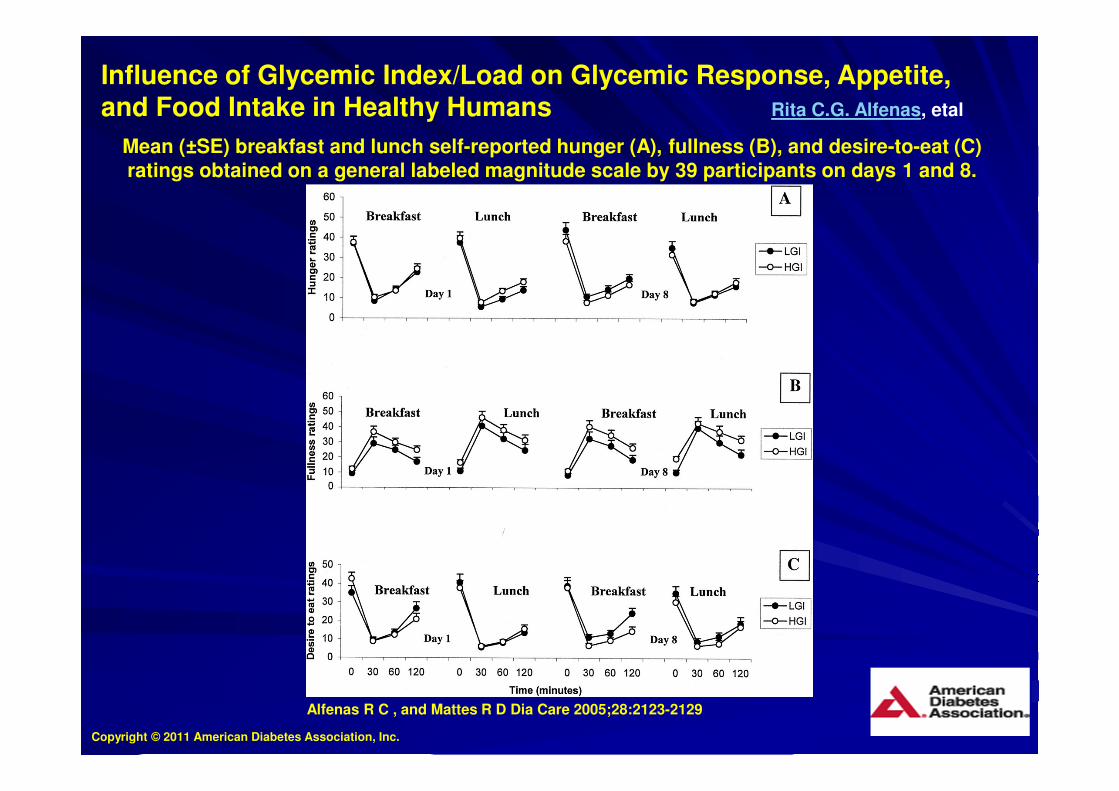
Mean (±SE) breakfast and lunch self-reported hunger (A), fullness (B), and desire-to-eat (C) ratings obtained on a general labeled magnitude scale by 39 participants on days 1 and 8.
Alfenas R C , and Mattes R D Dia Care 2005;28:2123-2129
Copyright © 2011 American Diabetes Association, Inc.
Influence of Glycemic Index/Load on Glycemic Response, Appetite, and Food Intake in Healthy Humans Rita C.G. Alfenas, etal
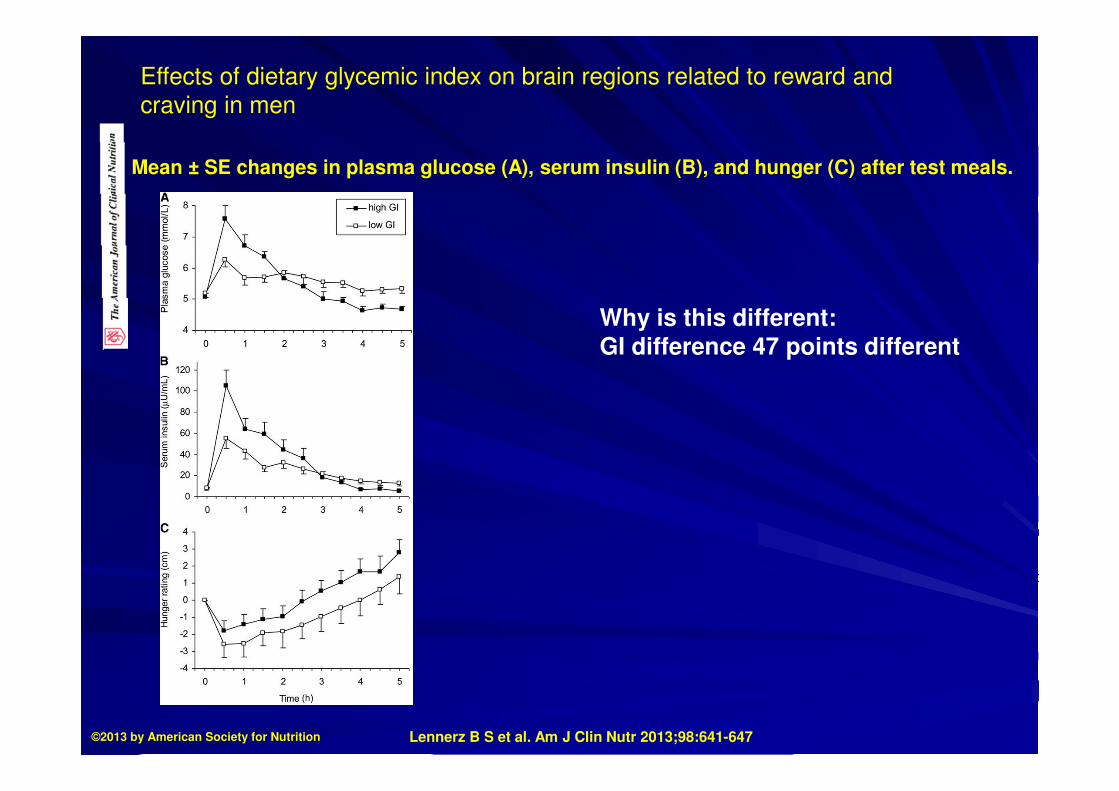
Mean ± SE changes in plasma glucose (A), serum insulin (B), and hunger (C) after test meals.
Lennerz B S et al. Am J Clin Nutr 2013;98:641-647©2013 by American Society for Nutrition
Effects of dietary glycemic index on brain regions related to reward and
craving in men
Why is this different:GI difference 47 points different
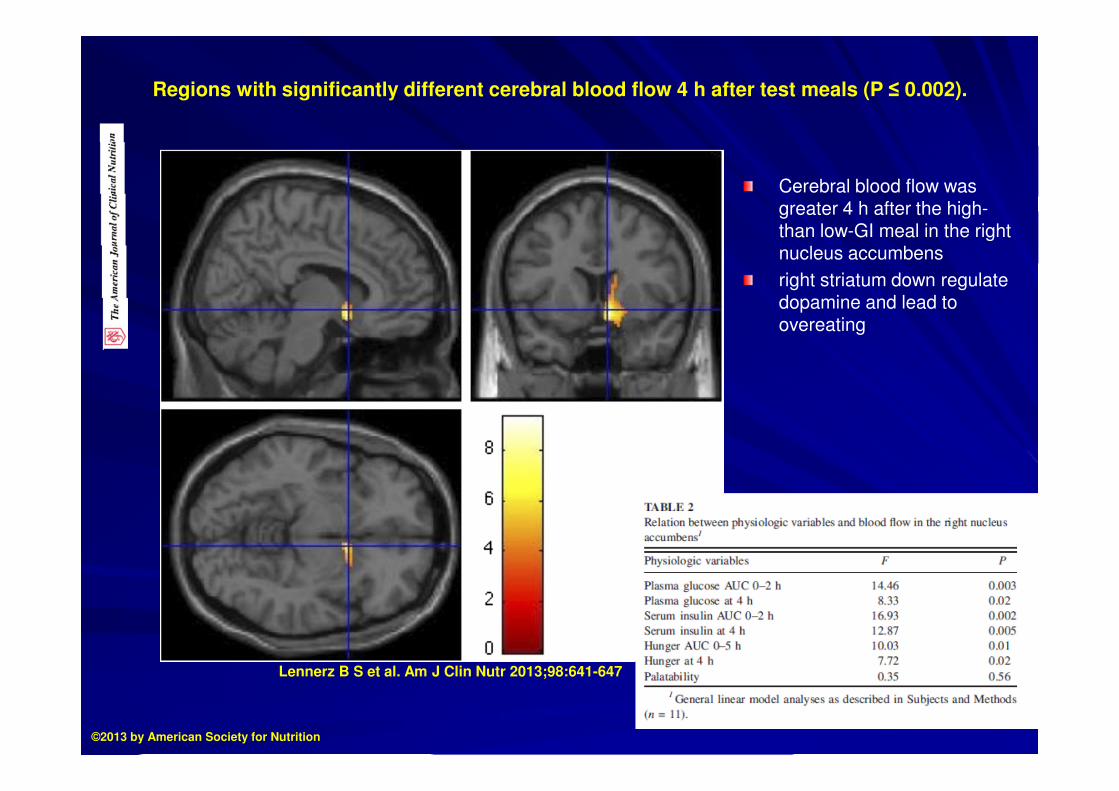
Regions with significantly different cerebral blood flow 4 h after test meals (P ≤ 0.002).
Lennerz B S et al. Am J Clin Nutr 2013;98:641-647
©2013 by American Society for Nutrition
Cerebral blood flow was greater 4 h after the high-than low-GI meal in the right nucleus accumbens
right striatum down regulate dopamine and lead to overeating
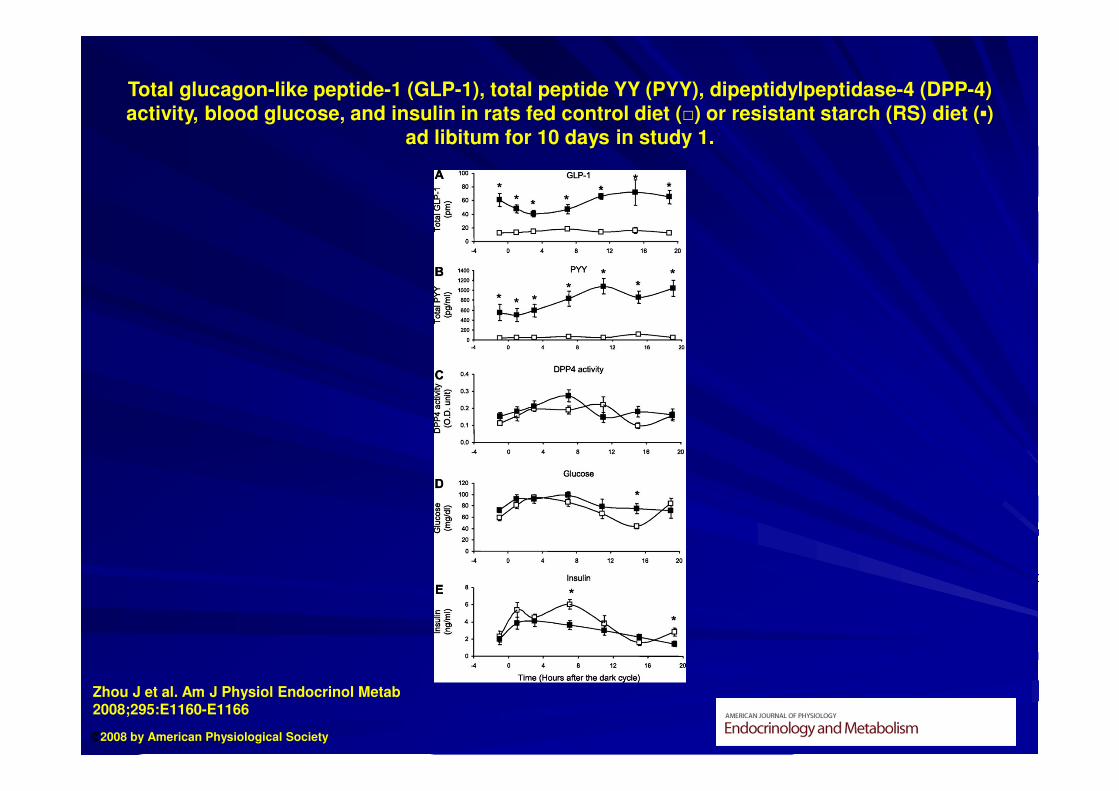
Total glucagon-like peptide-1 (GLP-1), total peptide YY (PYY), dipeptidylpeptidase-4 (DPP-4) activity, blood glucose, and insulin in rats fed control diet (□) or resistant starch (RS) diet (▪)
ad libitum for 10 days in study 1.
Zhou J et al. Am J Physiol Endocrinol Metab 2008;295:E1160-E1166
©2008 by American Physiological Society
Long term
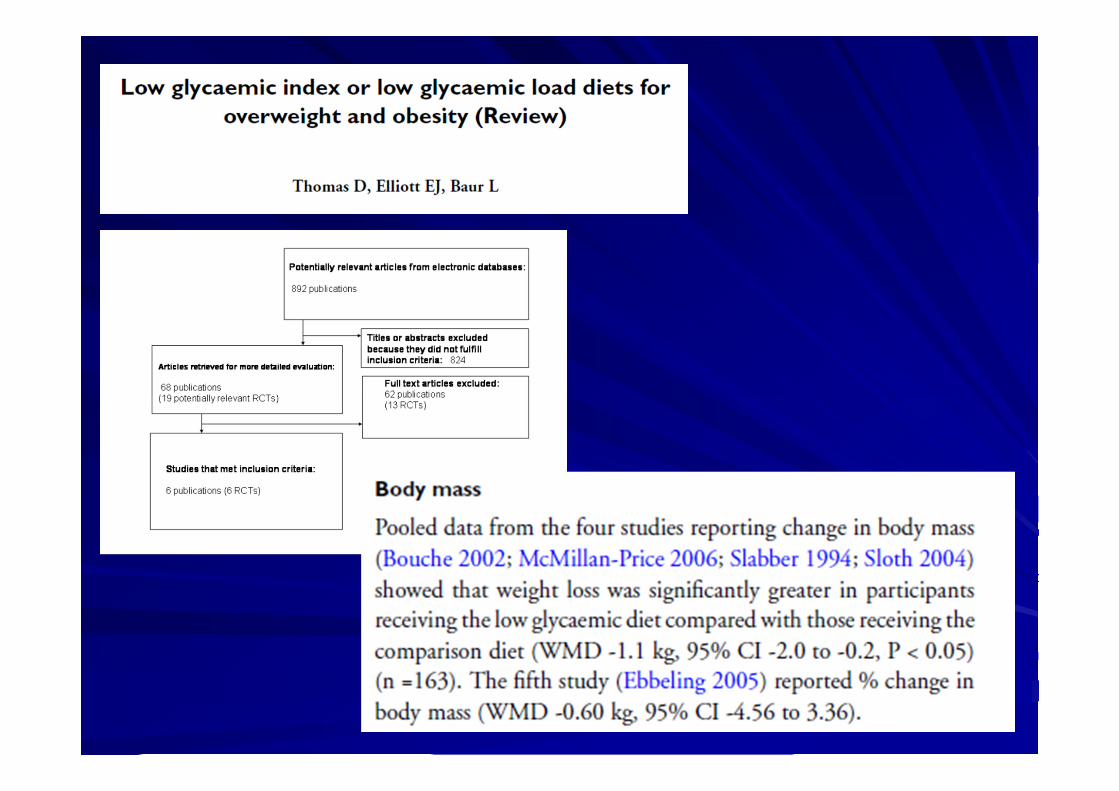
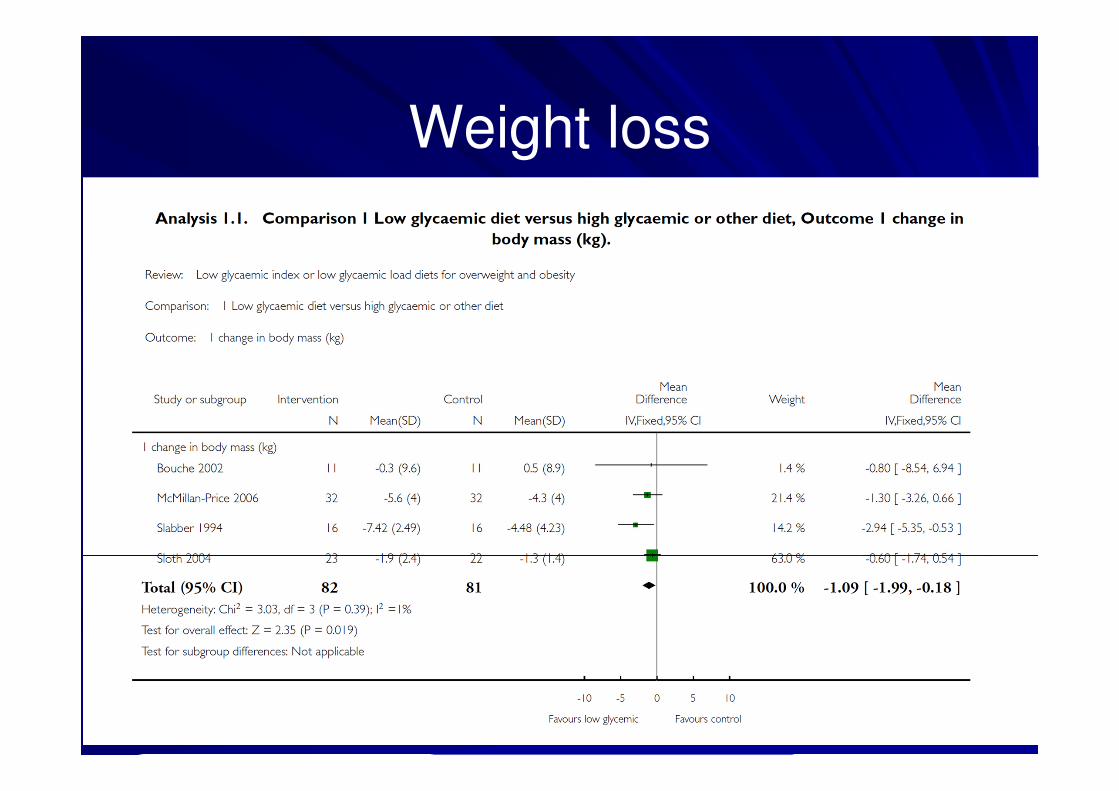
Weight loss
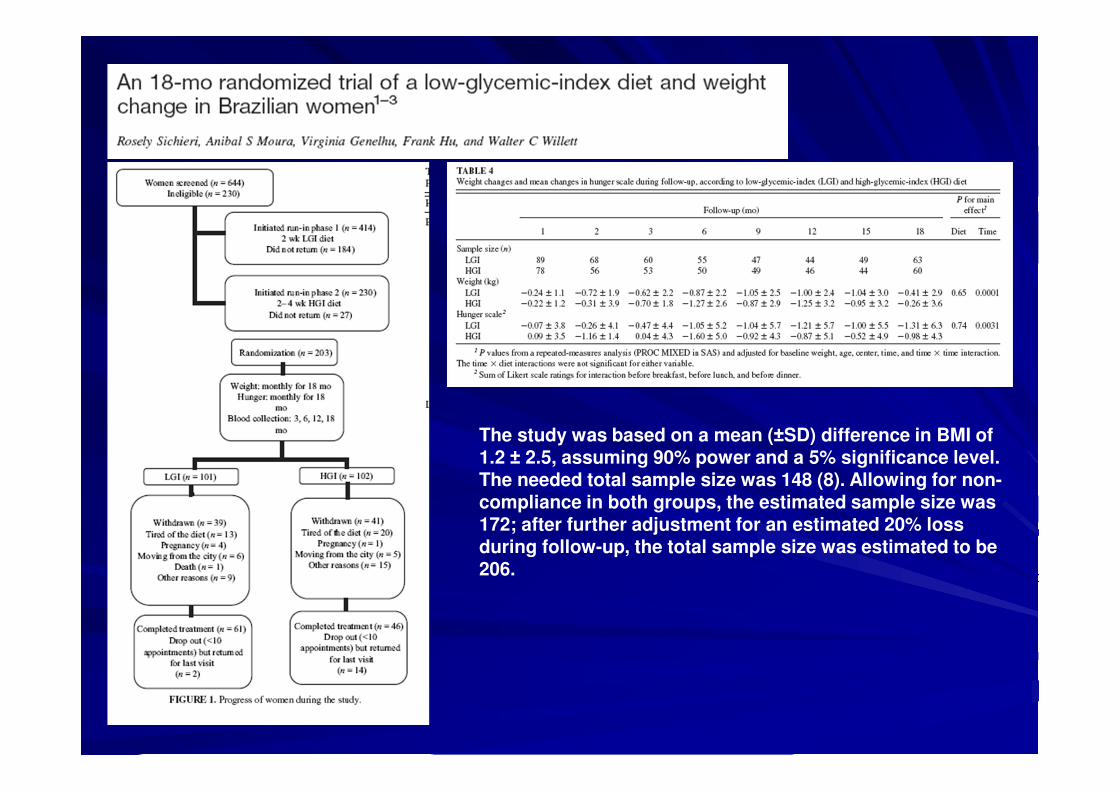
The study was based on a mean (±SD) difference in BMI of 1.2 ± 2.5, assuming 90% power and a 5% significance level. The needed total sample size was 148 (8). Allowing for non-compliance in both groups, the estimated sample size was 172; after further adjustment for an estimated 20% loss during follow-up, the total sample size was estimated to be 206.
Weight maintenance
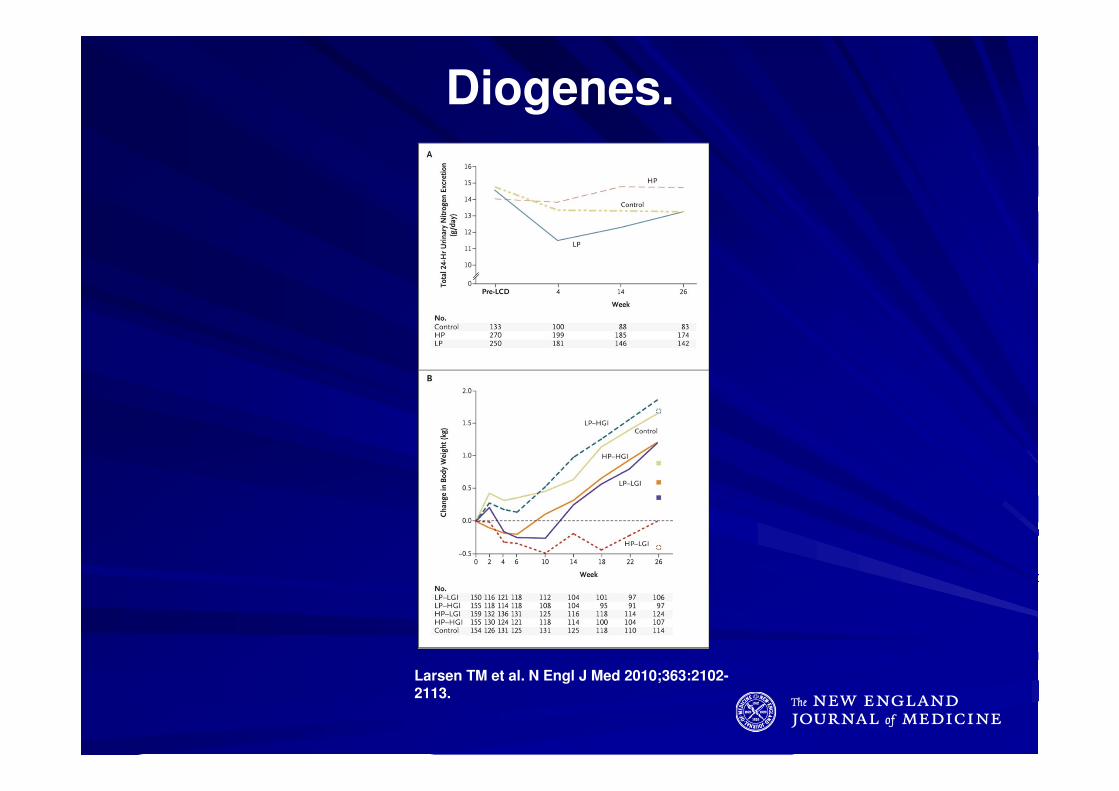
Diogenes.
Larsen TM et al. N Engl J Med 2010;363:2102-2113.
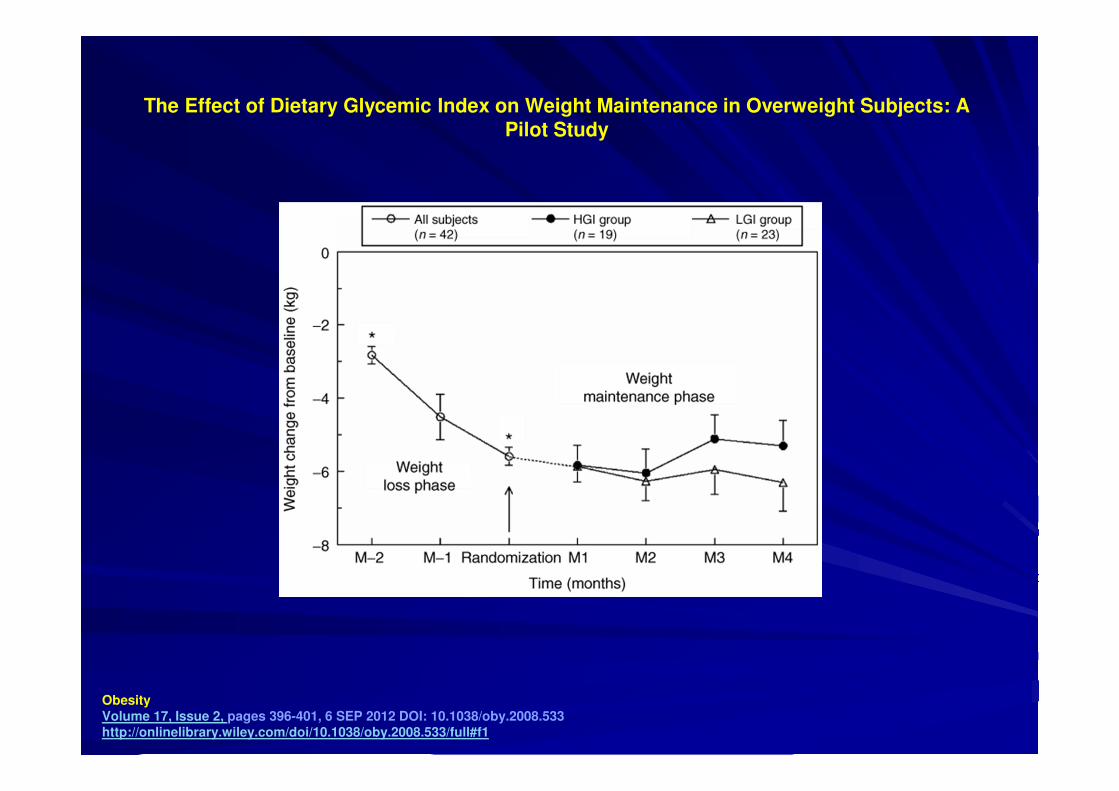
The Effect of Dietary Glycemic Index on Weight Maintenance in Overweight Subjects: A Pilot Study
Obesity
Volume 17, Issue 2, pages 396-401, 6 SEP 2012 DOI: 10.1038/oby.2008.533
http://onlinelibrary.wiley.com/doi/10.1038/oby.2008.533/full#f1

What is going on?
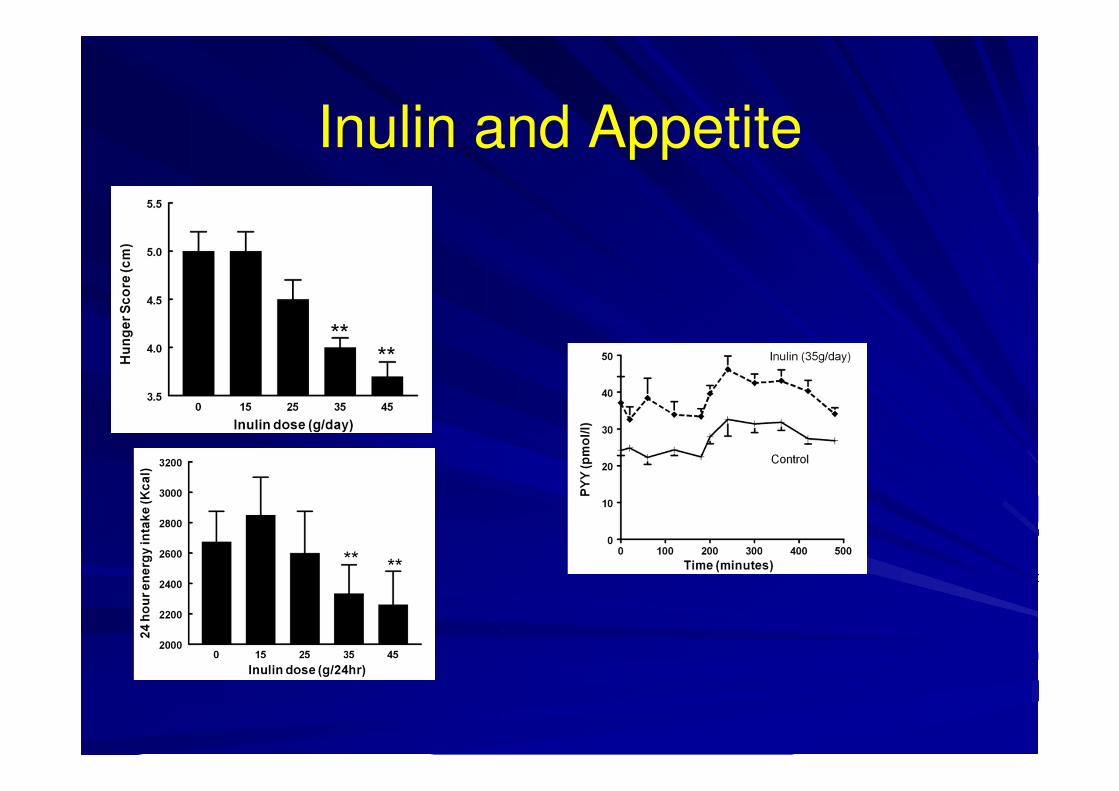
Inulin and Appetite

Dietary NDCs have positive biological effects – mediated by SCFA
Increased concentrations of SCFA
Increased dietary NDCsIncreased fermentation
Increase anorexigenic signalling
Reduced appetite and food
intake
Reduced free fatty acid outputIncreased lipogenesisIncreased leptin secretionReduced inflammation
Increase inPYY & GLP-1
FFAR2/3 ??
FFAR2/3
Improved insulin sensitivity
Reduced cholesterol synthesisReduced glucose outputReduced inflammation
SCFA
FFAR2/3
Reduced inflammation
FFAR2/3
+
Change in gut flora

Conclusion
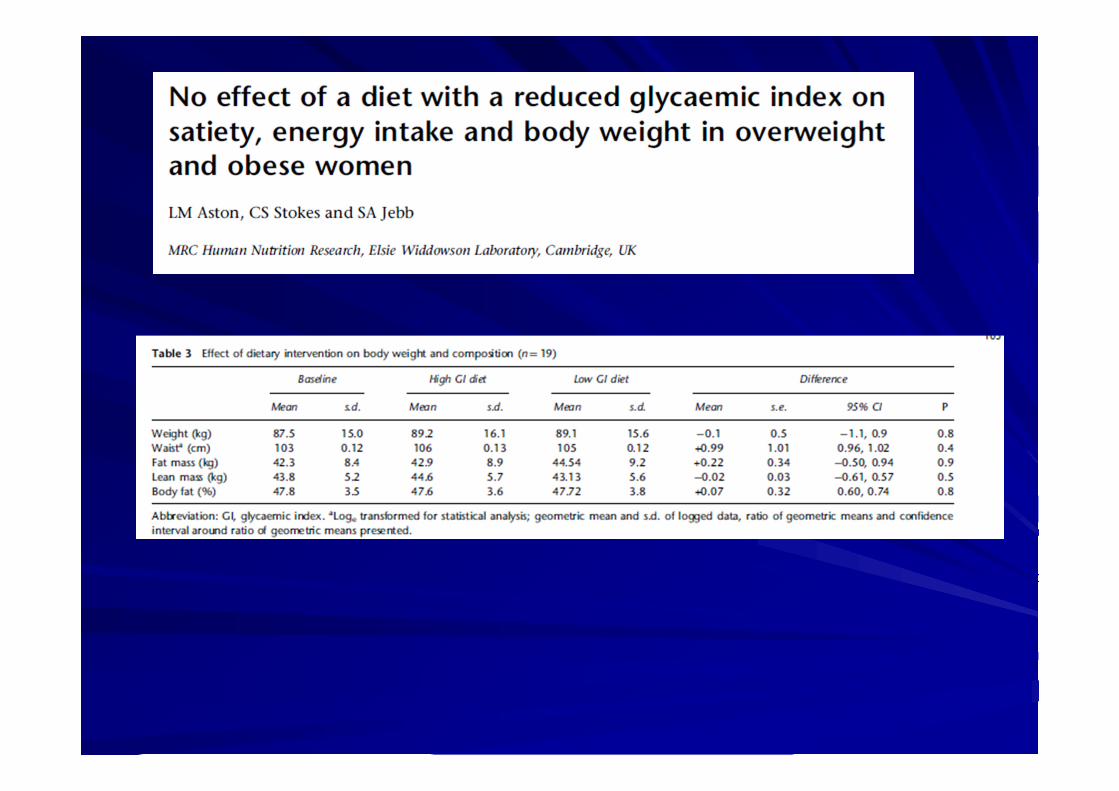
The effect of glycaemic index on appetite and body weight is a bit mixed.
But
Big differences show clear effects
High intakes of fermentable carbohydrate show effect
Need a fresh look with this insight.