glucose-induced o consumption activates hypoxia · pdf fileglucose-induced o 2 consumption...
TRANSCRIPT

Glucose-Induced O2 Consumption Activates HypoxiaInducible Factors 1 and 2 in Rat Insulin-SecretingPancreatic Beta-CellsMohammed Bensellam1, Bertrand Duvillie3, Galyna Rybachuk1, D. Ross Laybutt4, Christophe Magnan5,
Yves Guiot2, Jacques Pouyssegur6, Jean-Christophe Jonas1*
1 Pole d9Endocrinologie, Diabete et Nutrition, Institut de Recherche Experimentale et Clinique, Universite Catholique de Louvain, Brussels, Belgium, 2 Pole de
Morphologie, Institut de Recherche Experimentale et Clinique, Universite Catholique de Louvain, Brussels, Belgium, 3 INSERM U845, Faculte de Medecine, Research Center
Growth and Signalling, Universite Paris Descartes, Hopital Necker, Paris, France, 4 Diabetes and Obesity Research Program, Garvan Institute of Medical Research, St.
Vincent’s Hospital, Sydney, Australia, 5 Unite de Biologie Fonctionnelle et Adaptative, CNRS-Universite Paris Diderot-Paris 7, Paris, France, 6 Institute of Developmental
Biology and Cancer Research, University of Nice, CNRS UMR 6543, Centre A. Lacassagne, Nice, France
Abstract
Background: Glucose increases the expression of glycolytic enzymes and other hypoxia-response genes in pancreatic beta-cells. Here, we tested whether this effect results from the activation of Hypoxia-Inducible-factors (HIF) 1 and 2 in a hypoxia-dependent manner.
Methodology/Principal Findings: Isolated rat islets and insulin-secreting INS-1E cells were stimulated with nutrients atvarious pO2 values or treated with the HIF activator CoCl2. HIF-target gene mRNA levels and HIF subunit protein levels weremeasured by real-time RT-PCR, Western Blot and immunohistochemistry. The formation of pimonidazole-protein adductswas used as an indicator of hypoxia. In INS-1E and islet beta-cells, glucose concentration-dependently stimulated formationof pimonidazole-protein adducts, HIF1 and HIF2 nuclear expression and HIF-target gene mRNA levels to a lesser extent thanCoCl2 or a four-fold reduction in pO2. Islets also showed signs of HIF activation in diabetic Leprdb/db but not non-diabeticLeprdb/+ mice. In vitro, these glucose effects were reproduced by nutrient secretagogues that bypass glycolysis, and wereinhibited by a three-fold increase in pO2 or by inhibitors of Ca2+ influx and insulin secretion. In INS-1E cells, small interferingRNA-mediated knockdown of Hif1a and Hif2a, alone or in combination, indicated that the stimulation of glycolytic enzymemRNA levels depended on both HIF isoforms while the vasodilating peptide adrenomedullin was a HIF2-specific targetgene.
Conclusions/Significance: Glucose-induced O2 consumption creates an intracellular hypoxia that activates HIF1 and HIF2 inrat beta-cells, and this glucose effect contributes, together with the activation of other transcription factors, to the glucosestimulation of expression of some glycolytic enzymes and other hypoxia response genes.
Citation: Bensellam M, Duvillie B, Rybachuk G, Laybutt DR, Magnan C, et al. (2012) Glucose-Induced O2 Consumption Activates Hypoxia Inducible Factors 1 and 2in Rat Insulin-Secreting Pancreatic Beta-Cells. PLoS ONE 7(1): e29807. doi:10.1371/journal.pone.0029807
Editor: Carlo Gaetano, Istituto Dermopatico dell’Immacolata, Italy
Received May 16, 2011; Accepted December 6, 2011; Published January 3, 2012
Copyright: � 2012 Bensellam et al. This is an open-access article distributed under the terms of the Creative Commons Attribution License, which permitsunrestricted use, distribution, and reproduction in any medium, provided the original author and source are credited.
Funding: This work was supported by grant 3.4516.09 from the Fonds de la Recherche Scientifique Medicale (to Dr. Jonas), grant ARC 05/10-328 from theGeneral Direction of Scientific Research of the French Community of Belgium and the Interuniversity Poles of Attraction Program (P6/42)-Belgian Science Policy (toDr. Jonas), METOXIA-EU-FP7 (to Dr. Pouyssegur), a grant from the European Foundation for the Study of Diabetes in partnership with Merck Sharp & Dohme(EFSD/MSD Partnership for European Studies on Beta Cell Function and Survival: Basic Research Programme) (to Dr. Jonas), a grant from the EFSD in partnershipwith the Juvenile Diabetes Research Foundation and Novo Nordisk A/S (EFSD/JDRF/Novo Nordisk European Programme in Type 1 Diabetes Research) (to Dr.Duvillie), and a grant from the Association de Langue Francaise pour l’Etude du Diabete et des Maladies Metaboliques (ALFEDIAM) in partnership with sanofi-aventis Group (to Dr. Duvillie). Dr. Bensellam was Research Fellow and Dr. Jonas is Research Director of the Fonds de la Recherche Scientifique-FNRS (Belgium).These funding agencies and their commercial partners had no role in study design, data collection and analysis, decision to publish, or preparation of themanuscript.
Competing Interests: Dr. Jonas and Dr. Duvillie obtained grants from non-commercial funding agencies that raised funds through partnerships with MerckSharp & Dohme, sanofi-aventis Group and Novo-Nordisk A/S. There are no patents, marketed products, or products in development related to this research. Thisdoes not alter the authors’ adherence to all the PLoS ONE policies on sharing data and materials.
* E-mail: [email protected]
Introduction
Hypoxia-Inducible-Factors (HIFs) are basic helix-loop-helix-
PAS domain transcription factors composed of a regulated asubunit (HIF1a or HIF2a) and a constitutively expressed HIF1bsubunit (Aryl-hydrocarbon-Receptor Nuclear Translocator
(ARNT)) [1,2]. Under normoxic conditions, Prolyl-Hydroxy-
lase-Domain proteins (PHD1-3) hydroxylate HIFa subunits on
proline residues in an O2-, Fe2+- and a-ketoglutarate-dependent
manner. This hydroxylation promotes HIFa binding to von
Hippel-Lindau protein, followed by their polyubiquitylation and
proteasomal degradation. Under hypoxic conditions (O2 partial
pressure (pO2),2.3–38 mmHg) or after inhibition of PHDs with
CoCl2, HIFa subunits are no longer degraded and translocate
with ARNT to the nucleus where they activate the transcription
of HIF-target genes including glucose transporter 1 (Glut1),
PLoS ONE | www.plosone.org 1 January 2012 | Volume 7 | Issue 1 | e29807
glycolytic enzymes, monocarboxylate transporter 4 (Mct4), the
vasodilating peptide adrenomedullin (Adm), vascular endothelial
growth factors (Vegfs), and erythropoietin (Epo). This response
favours cell survival by triggering a switch from aerobic
mitochondrial to anaerobic glycolytic ATP production at the
cellular level, an increase in blood flow and capillary growth at
the organ level, and an increase in O2 transport capacity at the
organism level [1–3].
The glucose stimulation of insulin secretion (GSIS) by
pancreatic beta-cells critically depends on the acceleration of
glycolysis and mitochondrial Krebs cycle, with consequent
increases in NAD(P)H and ATP production as well as export of
Krebs cycle intermediates, including a-ketoglutarate, to the
cytosol [4]. Subsequent plasma membrane depolarization and
Ca2+ influx through voltage-dependent-Ca2+-channels trigger
insulin granule exocytosis [5]. In addition, glucose stimulates
various ATP-consuming processes such as gene transcription,
protein synthesis, and Ca2+ pumping [6]. In beta-cells, glucose-
induced acceleration of ATP production is coupled to an
increase in mitochondrial O2 consumption [7–9]. In vivo, the
concomitant increase in islet blood flow prevents the fall in
intra-islet pO2 [10,11]. In isolated islets maintained in vitro or
transplanted in vivo, however, the glucose stimulation of beta-
cell O2 consumption leads to a reduction in intra-islet pO2 [12–
14], of which approximately one third depends on the
stimulation of Ca2+ influx [15]. However, as a drop in pO2
and an increase in a-ketoglutarate exert opposite effects on
PHD-mediated HIFa hydroxylation [2], it remains unclear
whether glucose eventually activates HIFs in beta-cells and, if
so, to what extent such activation contributes to the glucose
regulation of islet gene expression. In this context, it has
recently been shown that glucose activates HIF1 in MIN6 cells
and mouse islets only if cultured under slightly hypoxic
conditions [16].
Others and we have previously shown that islet expression of
hexokinase (Hk) 1, lactate dehydrogenase A (Ldha), Mct1 and 4
and Hypoxia up-regulated 1 (Hyou1) is increased in hyperglyce-
mic rats [17–20]. We more recently reported that the glucose
stimulation of cultured rat islets increases their mRNA levels of
most glycolytic enzymes (except glucokinase (GK)), of other HIF-
target genes like Adm, and of genes that are induced by hypoxia
independently from HIF activation, like Hyou1 [21]. We now
demonstrate that glucose activates HIF1 and HIF2 in rat beta
cells and that both HIF isoforms play distinct roles in the glucose
stimulation of expression of glycolytic enzymes and Adm. We also
provide some evidence that HIFs are activated in islets from
diabetic mice, suggesting that hyperglycaemia could induce beta-
cell hypoxia in vivo.
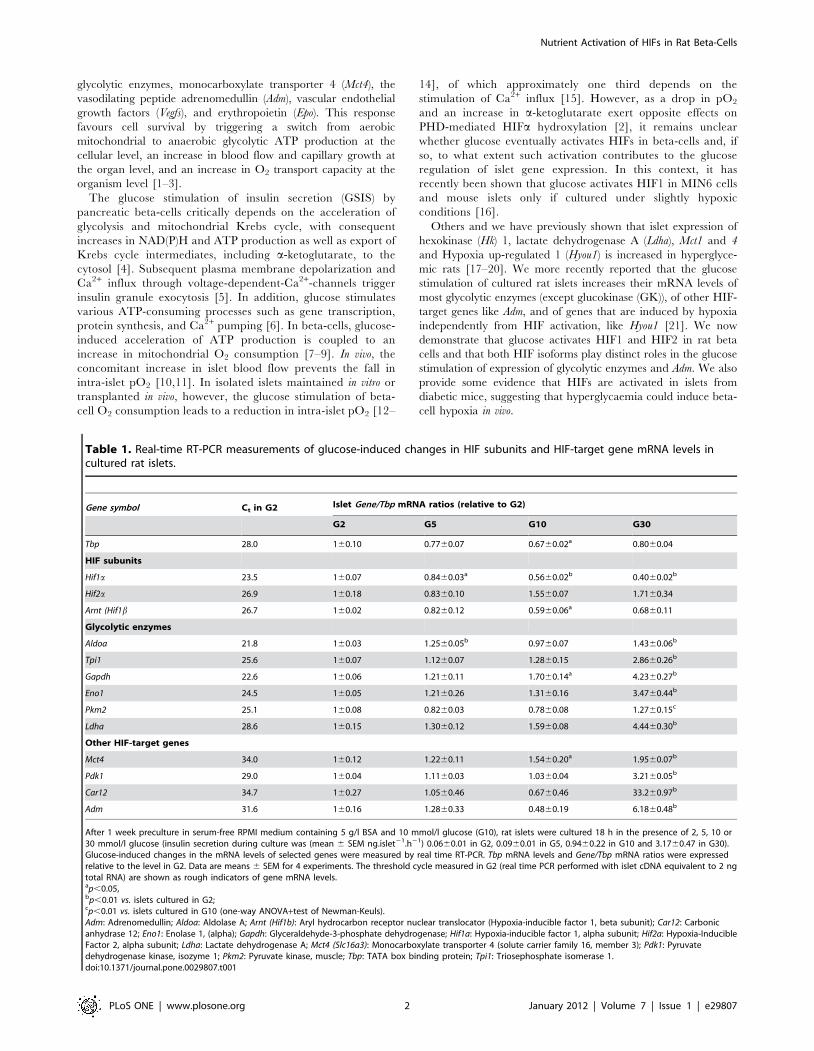
Table 1. Real-time RT-PCR measurements of glucose-induced changes in HIF subunits and HIF-target gene mRNA levels incultured rat islets.
Gene symbol Ct in G2 Islet Gene/Tbp mRNA ratios (relative to G2)
G2 G5 G10 G30
Tbp 28.0 160.10 0.7760.07 0.6760.02a 0.8060.04
HIF subunits
Hif1a 23.5 160.07 0.8460.03a 0.5660.02b 0.4060.02b
Hif2a 26.9 160.18 0.8360.10 1.5560.07 1.7160.34
Arnt (Hif1b 26.7 160.02 0.8260.12 0.5960.06a 0.6860.11
Glycolytic enzymes
Aldoa 21.8 160.03 1.2560.05b 0.9760.07 1.4360.06b
Tpi1 25.6 160.07 1.1260.07 1.2860.15 2.8660.26b
Gapdh 22.6 160.06 1.2160.11 1.7060.14a 4.2360.27b
Eno1 24.5 160.05 1.2160.26 1.3160.16 3.4760.44b
Pkm2 25.1 160.08 0.8260.03 0.7860.08 1.2760.15c
Ldha 28.6 160.15 1.3060.12 1.5960.08 4.4460.30b
Other HIF-target genes
Mct4 34.0 160.12 1.2260.11 1.5460.20a 1.9560.07b
Pdk1 29.0 160.04 1.1160.03 1.0360.04 3.2160.05b
Car12 34.7 160.27 1.0560.46 0.6760.46 33.260.97b
Adm 31.6 160.16 1.2860.33 0.4860.19 6.1860.48b
After 1 week preculture in serum-free RPMI medium containing 5 g/l BSA and 10 mmol/l glucose (G10), rat islets were cultured 18 h in the presence of 2, 5, 10 or30 mmol/l glucose (insulin secretion during culture was (mean 6 SEM ng.islet21.h21) 0.0660.01 in G2, 0.0960.01 in G5, 0.9460.22 in G10 and 3.1760.47 in G30).Glucose-induced changes in the mRNA levels of selected genes were measured by real time RT-PCR. Tbp mRNA levels and Gene/Tbp mRNA ratios were expressedrelative to the level in G2. Data are means 6 SEM for 4 experiments. The threshold cycle measured in G2 (real time PCR performed with islet cDNA equivalent to 2 ngtotal RNA) are shown as rough indicators of gene mRNA levels.ap,0.05,bp,0.01 vs. islets cultured in G2;cp,0.01 vs. islets cultured in G10 (one-way ANOVA+test of Newman-Keuls).Adm: Adrenomedullin; Aldoa: Aldolase A; Arnt (Hif1b): Aryl hydrocarbon receptor nuclear translocator (Hypoxia-inducible factor 1, beta subunit); Car12: Carbonicanhydrase 12; Eno1: Enolase 1, (alpha); Gapdh: Glyceraldehyde-3-phosphate dehydrogenase; Hif1a: Hypoxia-inducible factor 1, alpha subunit; Hif2a: Hypoxia-InducibleFactor 2, alpha subunit; Ldha: Lactate dehydrogenase A; Mct4 (Slc16a3): Monocarboxylate transporter 4 (solute carrier family 16, member 3); Pdk1: Pyruvatedehydrogenase kinase, isozyme 1; Pkm2: Pyruvate kinase, muscle; Tbp: TATA box binding protein; Tpi1: Triosephosphate isomerase 1.doi:10.1371/journal.pone.0029807.t001
Nutrient Activation of HIFs in Rat Beta-Cells
PLoS ONE | www.plosone.org 2 January 2012 | Volume 7 | Issue 1 | e29807
Results
Effects of glucose on HIF-target gene mRNA levels incultured rat islets and INS-1E cells
To characterize the role of HIF in the glucose stimulation of
islet gene expression, we first tested the effect of a 18 h culture in
the presence of 2, 5, 10 or 30 mmol/l glucose (G2, G5, G10, or
G30) on the mRNA levels of known HIF-target genes and
compared it with the effect of HIF activation by CoCl2, hypoxia or
knockout of vhlh, the gene coding the von Hippel-Lindau protein
[22].
Due to limited O2 diffusion, large islets frequently suffer from
central necrosis under normoxic culture conditions [14,23].
Therefore, islets with central necrosis (usually with a diameter
.150 mm) were systematically discarded during preculture, and
the islet density per cm2 and the medium depth were kept constant
between groups. Under these conditions, glucose significantly
increased the mRNA levels of many (but not all) HIF-target genes
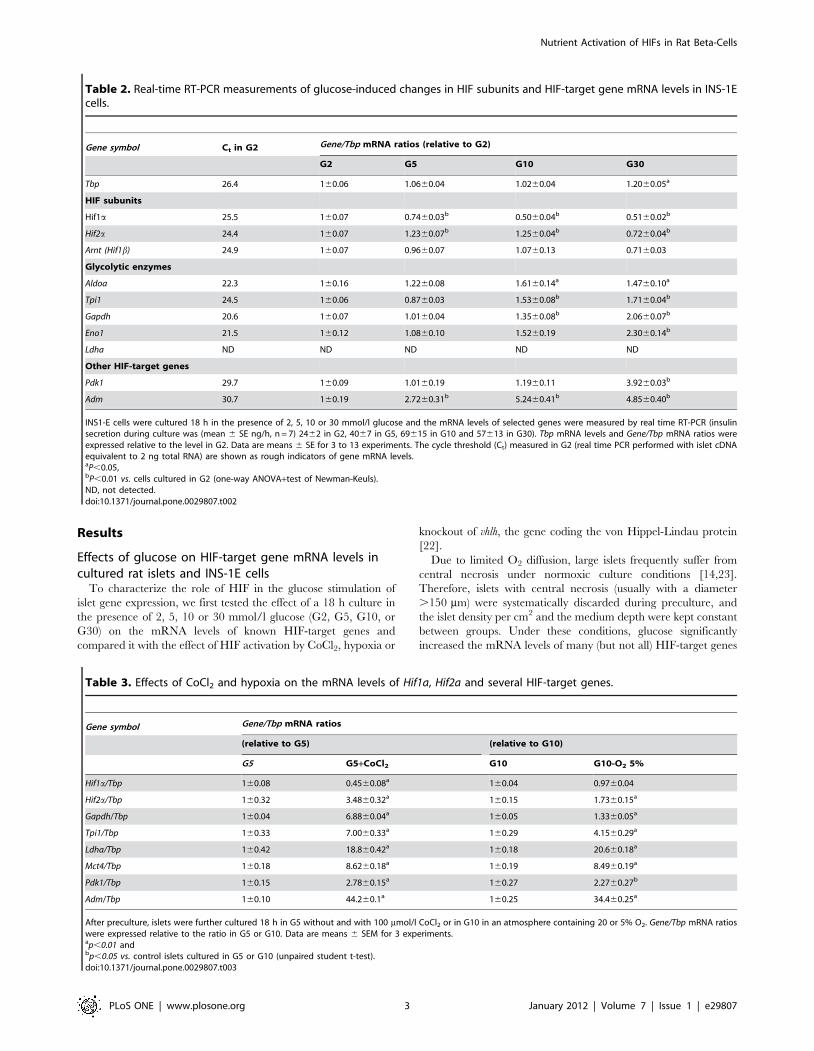
Table 2. Real-time RT-PCR measurements of glucose-induced changes in HIF subunits and HIF-target gene mRNA levels in INS-1Ecells.
Gene symbol Ct in G2 Gene/Tbp mRNA ratios (relative to G2)
G2 G5 G10 G30
Tbp 26.4 160.06 1.0660.04 1.0260.04 1.2060.05a
HIF subunits
Hif1a 25.5 160.07 0.7460.03b 0.5060.04b 0.5160.02b
Hif2a 24.4 160.07 1.2360.07b 1.2560.04b 0.7260.04b
Arnt (Hif1b) 24.9 160.07 0.9660.07 1.0760.13 0.7160.03
Glycolytic enzymes
Aldoa 22.3 160.16 1.2260.08 1.6160.14a 1.4760.10a
Tpi1 24.5 160.06 0.8760.03 1.5360.08b 1.7160.04b
Gapdh 20.6 160.07 1.0160.04 1.3560.08b 2.0660.07b
Eno1 21.5 160.12 1.0860.10 1.5260.19 2.3060.14b
Ldha ND ND ND ND ND
Other HIF-target genes
Pdk1 29.7 160.09 1.0160.19 1.1960.11 3.9260.03b
Adm 30.7 160.19 2.7260.31b 5.2460.41b 4.8560.40b
INS1-E cells were cultured 18 h in the presence of 2, 5, 10 or 30 mmol/l glucose and the mRNA levels of selected genes were measured by real time RT-PCR (insulinsecretion during culture was (mean 6 SE ng/h, n = 7) 2462 in G2, 4067 in G5, 69615 in G10 and 57613 in G30). Tbp mRNA levels and Gene/Tbp mRNA ratios wereexpressed relative to the level in G2. Data are means 6 SE for 3 to 13 experiments. The cycle threshold (Ct) measured in G2 (real time PCR performed with islet cDNAequivalent to 2 ng total RNA) are shown as rough indicators of gene mRNA levels.aP,0.05,bP,0.01 vs. cells cultured in G2 (one-way ANOVA+test of Newman-Keuls).ND, not detected.doi:10.1371/journal.pone.0029807.t002
Table 3. Effects of CoCl2 and hypoxia on the mRNA levels of Hif1a, Hif2a and several HIF-target genes.
Gene symbol Gene/Tbp mRNA ratios
(relative to G5) (relative to G10)
G5 G5+CoCl2 G10 G10-O2 5%
Hif1a/Tbp 160.08 0.4560.08a 160.04 0.9760.04
Hif2a/Tbp 160.32 3.4860.32a 160.15 1.7360.15a
Gapdh/Tbp 160.04 6.8860.04a 160.05 1.3360.05a
Tpi1/Tbp 160.33 7.0060.33a 160.29 4.1560.29a
Ldha/Tbp 160.42 18.860.42a 160.18 20.660.18a
Mct4/Tbp 160.18 8.6260.18a 160.19 8.4960.19a
Pdk1/Tbp 160.15 2.7860.15a 160.27 2.2760.27b
Adm/Tbp 160.10 44.260.1a 160.25 34.460.25a
After preculture, islets were further cultured 18 h in G5 without and with 100 mmol/l CoCl2 or in G10 in an atmosphere containing 20 or 5% O2. Gene/Tbp mRNA ratioswere expressed relative to the ratio in G5 or G10. Data are means 6 SEM for 3 experiments.ap,0.01 andbp,0.05 vs. control islets cultured in G5 or G10 (unpaired student t-test).doi:10.1371/journal.pone.0029807.t003
Nutrient Activation of HIFs in Rat Beta-Cells
PLoS ONE | www.plosone.org 3 January 2012 | Volume 7 | Issue 1 | e29807

that were up-regulated by more than 2-fold in vhlh-knockout islets
[22], including Glut1, most glycolytic enzymes, Mct4, pyruvate
dehydrogenase kinase 1 (Pdk1), Adm and carbonic anhydrase 12
(Car12) (Table 1 and Table S1). This effect was larger for genes
expressed at low levels under control conditions (Ldha, Adm and
Car12) than for the highly expressed genes Gapdh and aldolase A
(Aldoa). Glucose also increased the mRNA levels of Gapdh, triose
phosphate isomerase 1 (Tpi1) and Adm (but not Ldha that remained
below detection limit) in INS-1E cells cultured for 18 h at 70%
confluence, indicating that the glucose stimulation of HIF-target
gene expression was not restricted to devascularized islets (Table 2).
In contrast, glucose failed to affect the islet expression of HIF-
target genes that were not or only slightly increased in vhlh-KO
islets, like hexokinase 1 and 2 (Hk1 and Hk2), and vascular
endothelial growth factors (Vegf). (Table S1).
As expected, the mRNA levels of Gapdh, Tpi, Ldha, Mct4, Pdk1
and Adm were significantly increased in CoCl2-treated rat islets or
in islets exposed overnight to hypoxia (pO2 ,38 mmHg) (Table 3),
a condition under which all islets developed central necrosis. In
contrast, CoCl2 and hypoxia did not affect the mRNA levels of
genes that are markedly induced by glucose in rat islets but are not
HIF-target genes, like thioredoxin interacting protein (Txnip) and
aldolase B (Aldob) (data not shown).
Effects of glucose on the expression of HIF subunits incultured rat islets and INS-1E cells
To characterize the role of HIF in the glucose stimulation of
islet gene expression, we next compared the effects of glucose,
CoCl2 and hypoxia on the expression of components of the HIF
signalling pathway. As shown in Table 1 and Table S1, the mRNA
coding the main HIF subunits, HIF-regulating and HIF-
interacting proteins were detected in rat islets, some of them
being significantly affected by glucose. Most noticeably, glucose
(between G2 and G30) decreased Hif1a mRNA levels by 60% and
Arnt mRNA levels by 40% while increasing Hif2a mRNA levels 2-
fold. Glucose similarly affected Hif subunits mRNA levels in INS-
1E cells, except that Hif2a mRNA levels increased at lower glucose
concentrations than in rat islets and tended to decrease between
G10 and G30 (Table 2). Interestingly, CoCl2 but not hypoxia also
decreased Hif1a mRNA levels, while both treatments increased
Hif2a mRNA levels in rat islets (Table 3).
Because HIF activation mainly results from the stabilization of
its alpha subunits and their nuclear translocation with ARNT, we
next tested the effect of glucose, hypoxia and CoCl2 on HIF1a and
ARNT protein levels in cultured rat islets by immunohistochem-
istry. After culture in G5, HIF1a was only detected in the nuclei of
a few insulin-negative cells while ARNT was detected in the
cytosol and nuclei of most islet cells (Figure 1 and Figure S1). After
culture in G30, HIF1a staining increased in insulin-positive but
not insulin-negative islet cells, while ARNT staining was
unaffected. The increase in HIF1a staining was heterogeneous
between beta-cells (Figure 1). In comparison, hypoxia and CoCl2markedly increased HIF1a staining in most islet cells outside the
central necrotic area. Exposure to CoCl2 also tended to increase
the intensity of ARNT staining in islet cell nuclei (Figure S1).
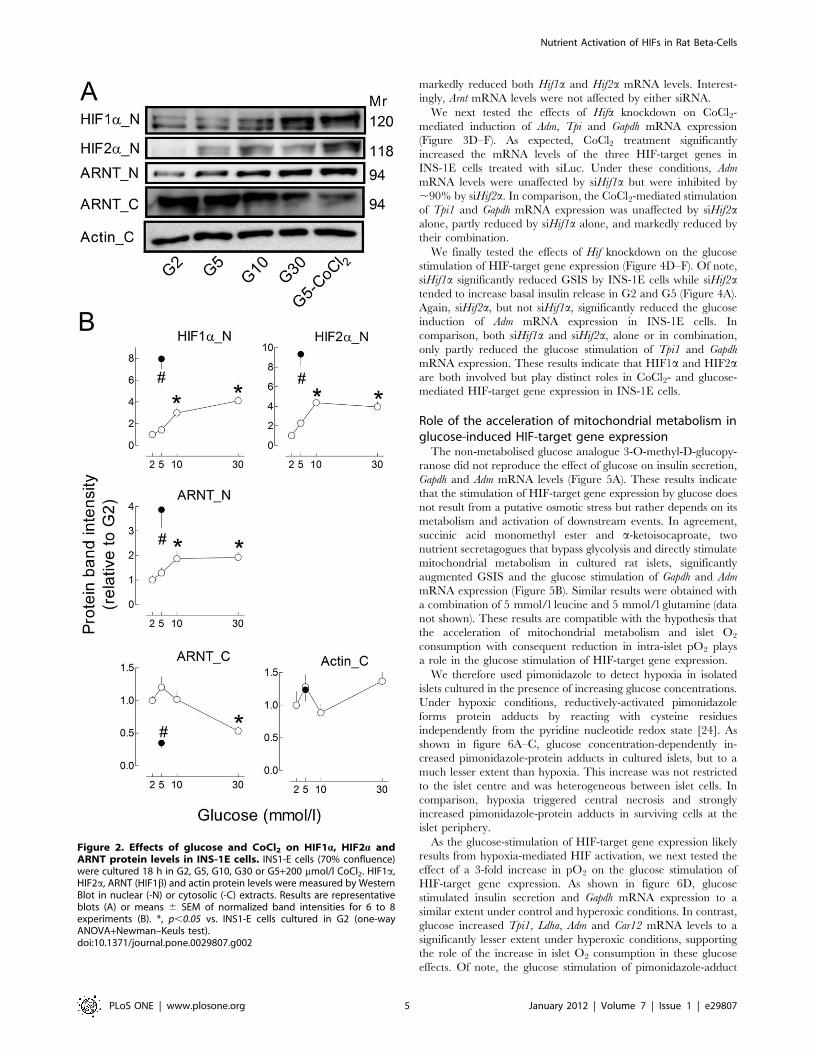
Glucose also increased HIF nuclear levels in INS-1E cells
(Figure 2). Thus, compared with G2, culture in G30 induced a 4-
fold increase in HIF1a and HIF2a nuclear levels and a 2-fold
increase in ARNT. Glucose also decreased cytosolic ARNT levels
by ,50%. These glucose effects were, however, of smaller
amplitude than those of CoCl2 (Figure 2B). These results indicate
that, upon glucose stimulation, HIF1a and HIF2a translocate with
their dimerization partner ARNT to beta-cell nuclei.
Effects of Hif1a and Hif2a knockdown on the expressionof glycolytic enzymes and Adm in INS-1E cells
The relationship between HIF1/HIF2 expression and the up-
regulation of their target genes was tested in INS-1E cells using
small interfering RNAs (siRNAs) against Hif1a and Hif2a. We first
checked the effects of selected siRNAs on the mRNA levels of Hif
subunits during culture in the presence of G2 and CoCl2(Figure 3A–C) or in the presence of increasing glucose concen-
trations (Figure 4B–C). As in rat islets, CoCl2 significantly
decreased Hif1a and increased Hif2a mRNA levels in INS-1E
cells treated with a siRNA against luciferase (siLuc) (Figure 3 B and
C). As expected, Hif1a and Hif2a siRNAs selectively reduced by
,75% the mRNA levels of the targeted Hifa subunit without
affecting the other alpha subunit, while their combination
Figure 1. Effects of glucose, hypoxia and CoCl2 on HIF1a protein levels in cultured rat islets. After 1 week preculture in G10, rat isletswere cultured 18 h in medium containing 5 or 30 mmol/l glucose (G5, G30), G5+200 mmol/l CoCl2 or G5 in the presence of 5% O2 (pO2,38 mmHg)instead of 20% O2 (pO2,151 mmHg) in the incubator (G5 hypoxia). HIF1a and insulin were detected by immunohistochemistry in 5 mm-thick isletsections. Results are representative for 2 to 3 experiments.doi:10.1371/journal.pone.0029807.g001
Nutrient Activation of HIFs in Rat Beta-Cells
PLoS ONE | www.plosone.org 4 January 2012 | Volume 7 | Issue 1 | e29807
markedly reduced both Hif1a and Hif2a mRNA levels. Interest-
ingly, Arnt mRNA levels were not affected by either siRNA.
We next tested the effects of Hifa knockdown on CoCl2-
mediated induction of Adm, Tpi and Gapdh mRNA expression
(Figure 3D–F). As expected, CoCl2 treatment significantly
increased the mRNA levels of the three HIF-target genes in
INS-1E cells treated with siLuc. Under these conditions, Adm
mRNA levels were unaffected by siHif1a but were inhibited by
,90% by siHif2a. In comparison, the CoCl2-mediated stimulation
of Tpi1 and Gapdh mRNA expression was unaffected by siHif2aalone, partly reduced by siHif1a alone, and markedly reduced by
their combination.
We finally tested the effects of Hif knockdown on the glucose
stimulation of HIF-target gene expression (Figure 4D–F). Of note,
siHif1a significantly reduced GSIS by INS-1E cells while siHif2atended to increase basal insulin release in G2 and G5 (Figure 4A).
Again, siHif2a, but not siHif1a, significantly reduced the glucose
induction of Adm mRNA expression in INS-1E cells. In
comparison, both siHif1a and siHif2a, alone or in combination,
only partly reduced the glucose stimulation of Tpi1 and Gapdh
mRNA expression. These results indicate that HIF1a and HIF2aare both involved but play distinct roles in CoCl2- and glucose-
mediated HIF-target gene expression in INS-1E cells.
Role of the acceleration of mitochondrial metabolism inglucose-induced HIF-target gene expression
The non-metabolised glucose analogue 3-O-methyl-D-glucopy-
ranose did not reproduce the effect of glucose on insulin secretion,
Gapdh and Adm mRNA levels (Figure 5A). These results indicate
that the stimulation of HIF-target gene expression by glucose does
not result from a putative osmotic stress but rather depends on its
metabolism and activation of downstream events. In agreement,
succinic acid monomethyl ester and a-ketoisocaproate, two
nutrient secretagogues that bypass glycolysis and directly stimulate
mitochondrial metabolism in cultured rat islets, significantly
augmented GSIS and the glucose stimulation of Gapdh and Adm
mRNA expression (Figure 5B). Similar results were obtained with
a combination of 5 mmol/l leucine and 5 mmol/l glutamine (data
not shown). These results are compatible with the hypothesis that
the acceleration of mitochondrial metabolism and islet O2
consumption with consequent reduction in intra-islet pO2 plays
a role in the glucose stimulation of HIF-target gene expression.
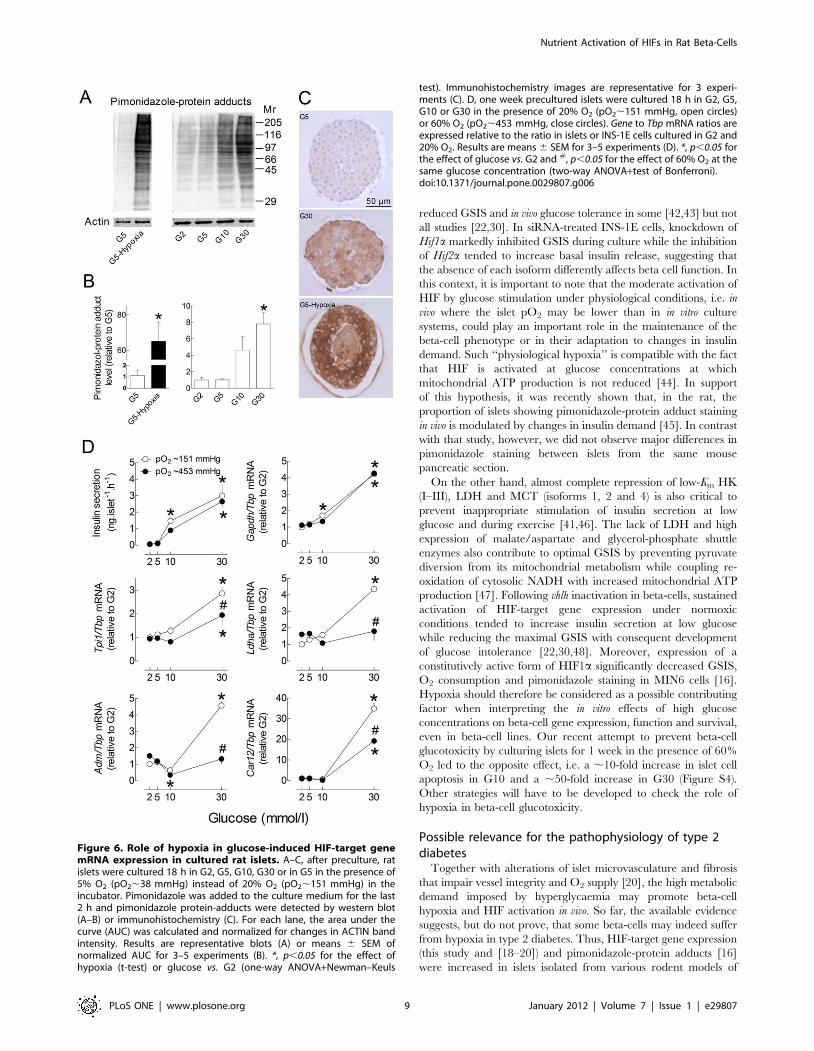
We therefore used pimonidazole to detect hypoxia in isolated
islets cultured in the presence of increasing glucose concentrations.
Under hypoxic conditions, reductively-activated pimonidazole
forms protein adducts by reacting with cysteine residues
independently from the pyridine nucleotide redox state [24]. As
shown in figure 6A–C, glucose concentration-dependently in-
creased pimonidazole-protein adducts in cultured islets, but to a
much lesser extent than hypoxia. This increase was not restricted
to the islet centre and was heterogeneous between islet cells. In
comparison, hypoxia triggered central necrosis and strongly
increased pimonidazole-protein adducts in surviving cells at the
islet periphery.
As the glucose-stimulation of HIF-target gene expression likely
results from hypoxia-mediated HIF activation, we next tested the
effect of a 3-fold increase in pO2 on the glucose stimulation of
HIF-target gene expression. As shown in figure 6D, glucose
stimulated insulin secretion and Gapdh mRNA expression to a
similar extent under control and hyperoxic conditions. In contrast,
glucose increased Tpi1, Ldha, Adm and Car12 mRNA levels to a
significantly lesser extent under hyperoxic conditions, supporting
the role of the increase in islet O2 consumption in these glucose
effects. Of note, the glucose stimulation of pimonidazole-adduct
Figure 2. Effects of glucose and CoCl2 on HIF1a, HIF2a andARNT protein levels in INS-1E cells. INS1-E cells (70% confluence)were cultured 18 h in G2, G5, G10, G30 or G5+200 mmol/l CoCl2. HIF1a,HIF2a, ARNT (HIF1b) and actin protein levels were measured by WesternBlot in nuclear (-N) or cytosolic (-C) extracts. Results are representativeblots (A) or means 6 SEM of normalized band intensities for 6 to 8experiments (B). *, p,0.05 vs. INS1-E cells cultured in G2 (one-wayANOVA+Newman–Keuls test).doi:10.1371/journal.pone.0029807.g002
Nutrient Activation of HIFs in Rat Beta-Cells
PLoS ONE | www.plosone.org 5 January 2012 | Volume 7 | Issue 1 | e29807

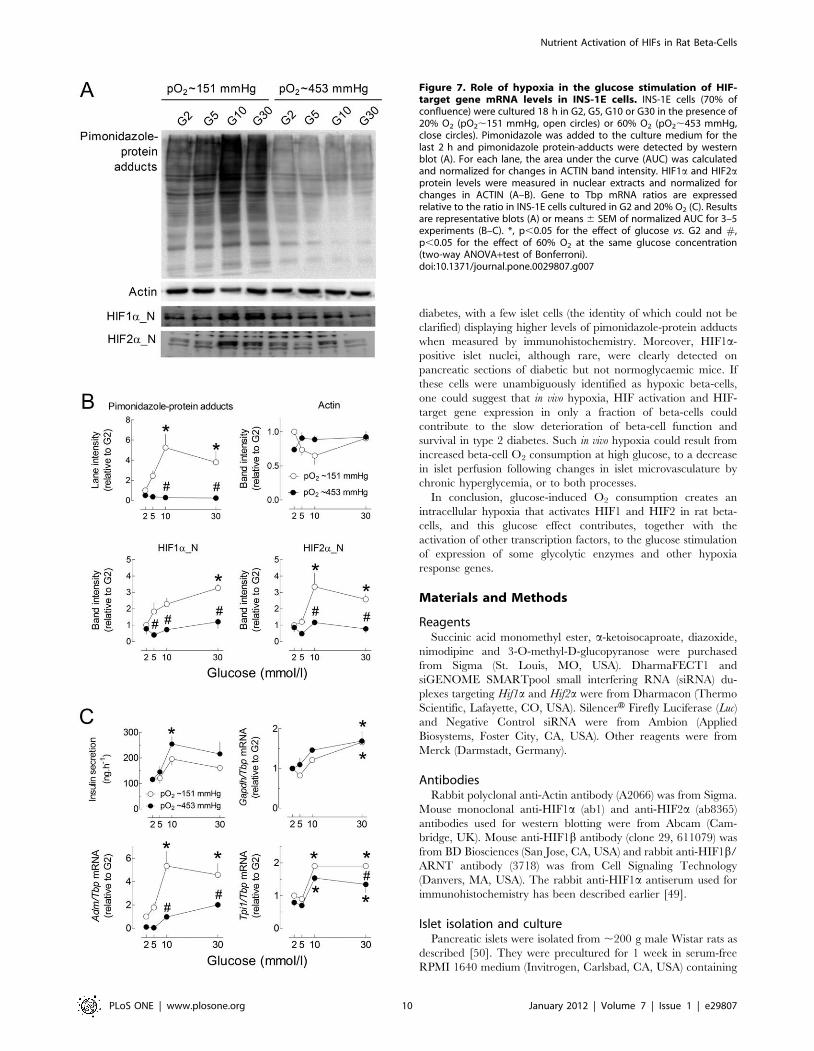
formation was also suppressed by culture in the presence of 90%
O2 (Figure S2). Also in INS-1E cells, culture under hyperoxic
conditions markedly reduced the glucose stimulation of pimoni-
dazole-protein adduct formation, HIF1a and HIF2a nuclear
accumulation, and Adm and Tpi1 mRNA expression (Figure 7). It
did not, however, significantly affect GSIS and the stimulation of
Gapdh mRNA expression. These results indicate that, depending
on the HIF-target gene studied, the glucose stimulation of mRNA
expression is independent (Gapdh) or partly results from hypoxia
(Tpi, Adm), not only in isolated islets, but also in INS-1E cells.
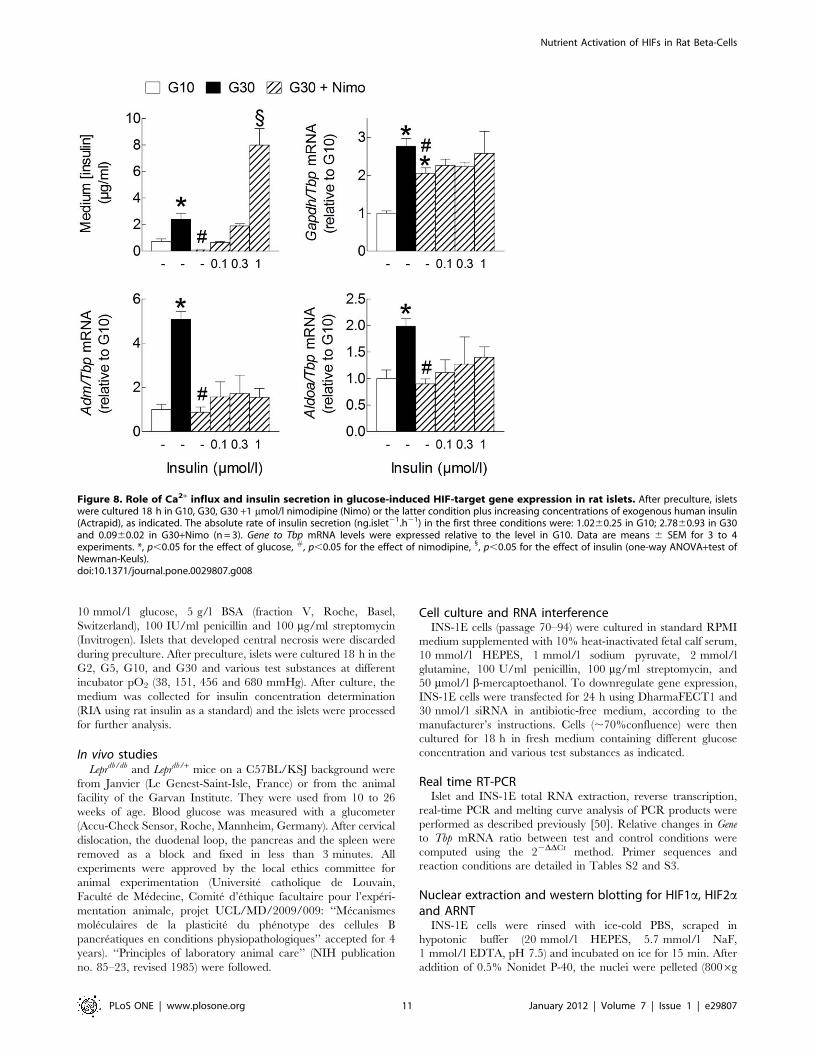
Role of Ca2+ influx in the glucose stimulation of HIF-target gene mRNA expression
It has previously been shown that approximately one third of
the glucose stimulation of islet O2 consumption is Ca2+-dependent
[15]. The L-type Ca2+ channel blocker nimodipine, which almost
fully inhibited insulin secretion during culture in G30, only slightly
reduced the mRNA levels of Gapdh but markedly reduced Aldoa
and Adm mRNA levels in G30 (Figure 8). Interestingly, the latter
inhibition was not prevented by addition of exogenous insulin to
the medium, indicating that Ca2+ influx contributes to the
stimulation of HIF-target gene expression independently from
changes in insulin concentration. In contrast, nimodipine exerted
opposite effects on Txnip and Aldob mRNA levels (data not shown).
Similar results were obtained with diazoxide, a KATP channel
opener that inhibits glucose-induced Ca2+ influx and insulin
secretion [25] (data not shown). Also in INS-1E cells, nimodipine
significantly reduced the glucose stimulation of Adm and Aldoa
mRNA expression without affecting that of Gapdh (Figure S3).
Hypoxia-mediated HIF activation in islets from diabeticmice?
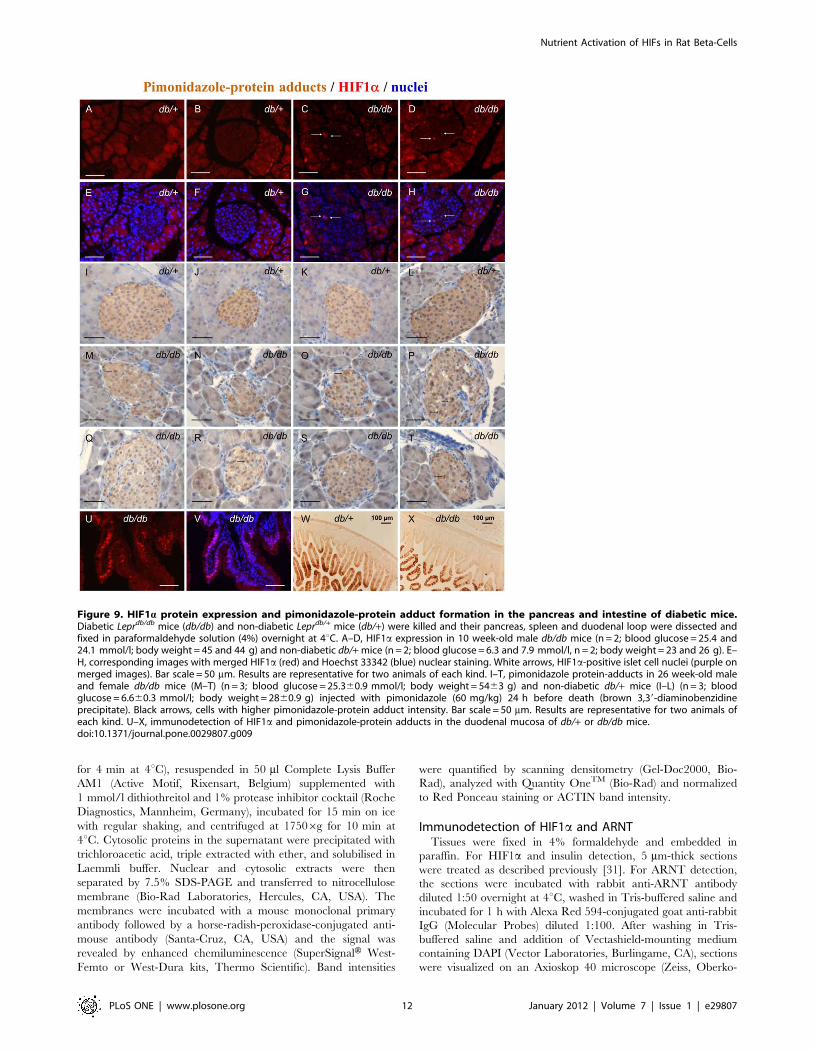
To test whether in vivo hyperglycaemia also induces hypoxia and
activates HIF in pancreatic islets, we first measured HIF1a protein
levels in islets from diabetic Leprdb/db and non-diabetic Leprdb/+
mice. Interestingly, a few HIF1a-positive nuclei were detected in
some islets from diabetic mice, whereas none were observed in
sections from non-diabetic mice (Figure 9A–H). That the lack of
HIF1a staining did not result from a problem in tissue fixation/
processing was confirmed by the observation, on the same section,
of a large number of HIF1a-positive epithelial nuclei in the villi of
the intestinal mucosa (Figure 9U–V). For technical reasons, we
could not determine whether the few HIF1a-positive islet cells
detected in Leprdb/db mice are beta-cells or not.
We next measured pimonidazole-protein adducts in the same
model of diabetes. Interestingly, islets from both diabetic and non-
diabetic mice were more heavily stained than the surrounding
exocrine acini (Figure 9I–T), suggesting that they experience low
intensity hypoxia irrespective of the glucose tolerance status. This
staining seemed, however, less intense than that observed in the
villi of the duodenal mucosa (Figure 9W–X). Although the
intensity of pimonidazole staining looked similar or even slightly
lower in islets from diabetic vs. non-diabetic mice, there were clear
differences regarding its heterogeneity between cells. Thus,
Figure 3. Effects of HIF1a and HIF2a knockdown on the stimulation of HIF-target gene expression by CoCl2. INS-1E cells (70%confluence) were transfected for 24 h with siRNA duplexes directed against Luciferase, Hif1a and Hif2a mRNA (siLuc, siHif1a and siHif2a). Then, thetransfection medium was replaced with RPMI medium containing 10% foetal calf serum and G2 alone or with 200 mmol/l CoCl2. After 18 h culture,the medium was collected for insulin concentration determination and cells were processed for measurement of gene mRNA levels. Gene to TbpmRNA ratios were expressed relative to the ratio in INS1-E cells treated with siLuc and cultured in G2. Data are means 6 SEM for 3 experiments.*, p,0.05 for the effect of CoCl2 and #, p,0.05 for the effect of siRNA treatment (two-way ANOVA+test of Bonferroni).doi:10.1371/journal.pone.0029807.g003
Nutrient Activation of HIFs in Rat Beta-Cells
PLoS ONE | www.plosone.org 6 January 2012 | Volume 7 | Issue 1 | e29807

pimonidazole staining was almost uniform throughout the islets of
non-diabetic mice (Figure 9I–L), whereas it was heterogeneous in
islets from diabetic mice, with a few cells displaying a higher
intensity (Figure 9M–T). Unfortunately, we could not determine
whether these islet cells with higher pimonidazole staining are
beta-cells or not.
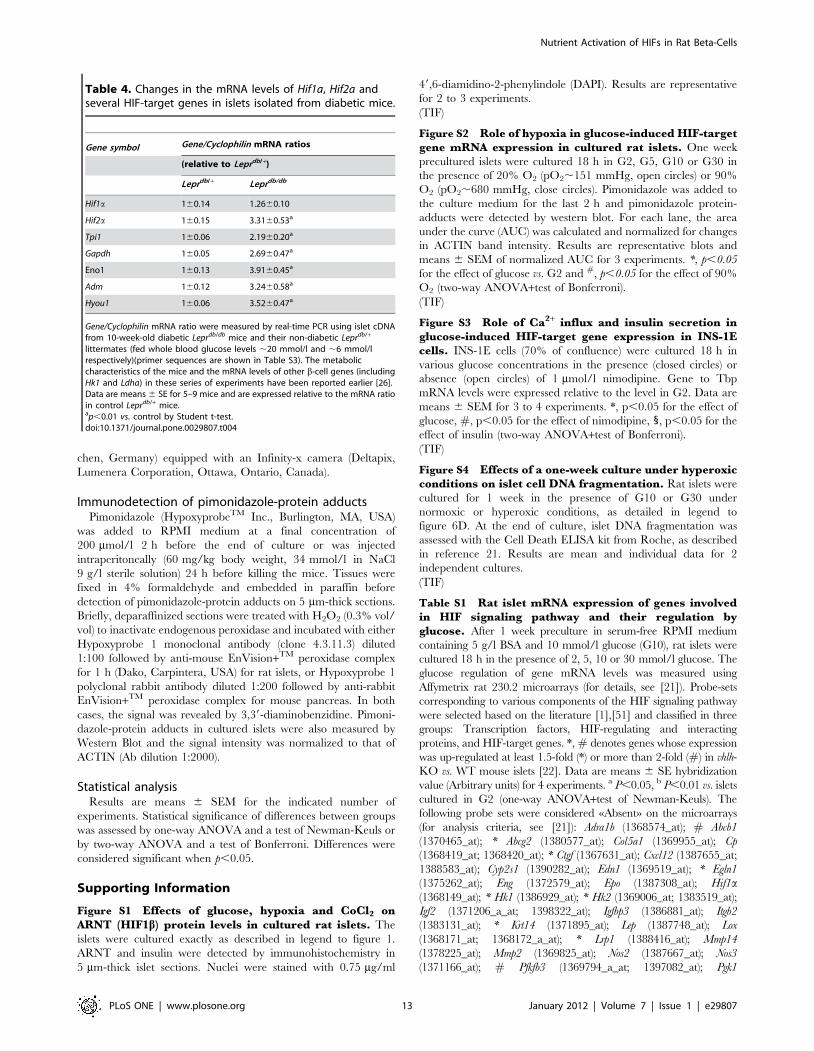
We finally measured the islet mRNA levels of Hifa subunits and
of several HIF-target genes in Leprdb/db and Leprdb/+ mice. As shown
in Table 4, the mRNA levels of Hif1a were not different in islets
from Leprdb/db and Leprdb/+ mice, but those of Hif2a and of all HIF-
target genes tested (except for Ldha tested in a previous study [26]),
were significantly up-regulated in the islets of Leprdb/db mice,
further supporting the hypothesis that HIF1 and HIF2 are
activated in islets from diabetic mice.
Discussion
This study demonstrates that, even in small islets and cell
monolayer, glucose and other nutrient secretagogues that bypass
glycolysis activate HIF1 and HIF2 in rat beta-cells following the
induction of a state of moderate hypoxia. This effect, which was
not simply due to limited O2 diffusion in culture but also depended
on the glucose stimulation of O2 consumption in beta-cells,
contributed to the stimulation of expression of glycolytic enzymes
and other hypoxia-response genes. In a recent study very similar to
ours but carried out in MIN6 cells and mouse islets, glucose
stimulation rapidly (within one hour) triggered beta-cell hypoxia
only if the pO2 was reduced from 20 to 10% [16]. Despite this
difference, both studies converge in showing that in vitro glucose
stimulation of beta-cell O2 consumption can induce intracellular
hypoxia and activate HIF. Depending on its intensity, this
response could either play an important role in beta-cell
adaptation to increased insulin demand under physiological
conditions (physiological hypoxia) or be involved in the detrimen-
tal effect of chronic hyperglycemia.
Earlier studies have convincingly shown that glucose rapidly
increases O2 consumption in islets from rats [8,15,27], mice [12],
non-human primates and humans [9]. Although we did not repeat
these measurements of islet O2 consumption or intra-islet pO2, we
have shown that glucose increases the formation of pimonidazole-
protein adducts in islets and INS-1E cells in parallel with changes
in HIF-target gene expression and HIF nuclear accumulation.
Moreover, these effects were inhibited under hyperoxic conditions.
Pimonidazole-protein adducts were not more abundant in the
center than at the islet periphery, indicating that our results do not
simply result from central necrosis. In addition, this staining was
heterogeneous between individual cells, as would be expected from
the metabolic heterogeneity of beta-cells [28].
The increase by glucose of HIF1a nuclear levels in rat beta-cells
is in good agreement with the fact that glucose induces moderate
hypoxia and with current and previous observations that hypoxia
activates HIF1 in INS-1E cells and cultured islets [14,23,29]. It is
also compatible with the recent report that Hif1a gene inactivation
corrected the stimulation of HIF-target gene expression following
vhlh inactivation in mouse beta-cells [30]. In contrast, the increase
of HIF2a nuclear levels in INS-1E cells by glucose, CoCl2 and
hypoxia is surprising because HIF2a was detected neither in
hypoxic embryonic pancreatic explants [31] nor in vhlh-knockout
mouse islets [30]. However, the role of HIF2a in INS-1E cells is
strongly supported by the observation that Hif2a expression is
Figure 4. Effects of Hif1a and HIF2a knockdown on the glucose stimulation of HIF-target gene expression. INS-1E cells (70%confluence) were transfected for 24 h with siRNA duplexes directed against Luciferase, Hif1a and Hif2a mRNA (siLuc, siHif1a and siHif2a). Then, thetransfection medium was replaced with RPMI medium containing 10% foetal calf serum and increasing glucose concentrations. After 18 h culture,the medium was collected for insulin concentration determination (A) and cells were processed for measurement of gene mRNA levels (B–F). Gene toTbp mRNA ratios were expressed relative to the ratio in INS1-E cells treated with siLuc and cultured in G2. Data are means 6 SEM for 3 experiments.*, p,0.05 for the effect of glucose vs. G2 and #, p,0.05 for the effect of siRNA treatment at the same glucose concentration (two-way ANOVA+test ofBonferroni). For Adm/Tbp mRNA ratio, the reduction by siHif2a in G30 was significant only after removal of siHif1a data that were highly variable.doi:10.1371/journal.pone.0029807.g004
Nutrient Activation of HIFs in Rat Beta-Cells
PLoS ONE | www.plosone.org 7 January 2012 | Volume 7 | Issue 1 | e29807

absolutely required for the stimulation of Adm mRNA expression.
Of note, glucose, CoCl2 and hypoxia also affected Hifa mRNA
levels in rat beta-cells through unknown mechanisms, but the
relative contribution of these changes to the global increase in HIF
activity and HIF-target gene expression has not been investigated.
In any case, these changes in Hifa mRNA levels should only
modulate the increase in HIFa protein levels that mainly result
from their stabilization under hypoxic conditions [1].
It is well established that glucose stimulates the expression of
various glycolytic enzymes in cultured insulin-secreting cells and
rodent islets, including GK, GAPDH and liver pyruvate kinase
[32,33]. It has been shown that the stimulation of expression of
liver pyruvate kinase results from a reduction in AMPK activity
[34] and from activation of the transcription factors ChREBP and
c-MYC [35,36]. In contrast, the stimulation of GK expression has
been ascribed to SREBP1c activation [37]. However, the
transcription factors involved in the glucose-induced expression
of other glycolytic enzymes in beta-cells are poorly characterized.
In other tissues, HIF1a is preferentially involved in the regulation
of glycolytic enzymes while HIF2a stimulates the expression of
genes related to angiogenesis [38]. In INS-1E cells, knockdown of
Hif1a and Hif2a had a stronger effect on the glucose stimulation of
Tpi1 and Gapdh than knockdown of either isoform alone. This
suggests that both HIF1 and HIF2 modulate the expression of
glycolytic enzymes, at least in rat beta-cells. However, neither
hyperoxia, nor Hif1a/Hif2a knockdown or inhibition of Ca2+
influx with nimodipine were able to fully inhibit the glucose
induction of glycolytic enzymes (except for the complete inhibition
of Ldha mRNA by hyperoxia in whole rat islets), confirming that
other transcription factors, e.g. Myc [39], are also involved. This
remark is particularly important in the case of Gapdh mRNA, the
glucose induction of which was unaffected by hyperoxia and
nimodipine treatment. On the other hand, hyperoxia, Hif2a but
not Hif1a) knockdown and nimodipine almost fully inhibited the
expression of Adm, thereby demonstrating the specific role of HIF2
in Adm expression by glucose-induced decrease in islet pO2. Thus,
both HIF isoforms are not redundant and play distinct roles in
beta-cell gene expression.
Possible relevance for the physiology andpathophysiology of beta-cells
High expression of GK and downstream glycolytic enzymes is
critical for GSIS [40,41]. In agreement, global down-regulation of
glycolytic enzymes in Hif1a or Arnt knockout beta-cells markedly
Figure 5. Effects of 3-O-methyl-D-glucopyranose, succinate and a-ketoisocaproate on Gapdh and Adm expression in cultured ratislets. After preculture, rat islets were further cultured 18 h; A, in the presence of G10 (open columns), G30 (filled columns), or G10+20 mmol/l 3-O-methyl-D-glucopyranose (3-OMG) (hatched columns); B, in the presence of increasing glucose concentrations without (open circle) or with (closedcircles) 10 mmol/l succinic acid monomethylester (SAM) or 5 mmol/l a-ketoisocaproate (KIC). Gene to Tbp mRNA ratios were expressed relative to theratio in G10 (A) or G2 (B). Data are means 6 SEM for 3 to 6 experiments. The effects of glucose, KIC and SAM on insulin secretion and gene mRNAlevels were significant by one-way ANOVA (A) or two-way ANOVA (B)(P,0.005). #, p,0.05 for the effect of SAM or KIC at that particular glucoseconcentration (two-way ANOVA+test of Bonferroni).doi:10.1371/journal.pone.0029807.g005
Nutrient Activation of HIFs in Rat Beta-Cells
PLoS ONE | www.plosone.org 8 January 2012 | Volume 7 | Issue 1 | e29807
reduced GSIS and in vivo glucose tolerance in some [42,43] but not
all studies [22,30]. In siRNA-treated INS-1E cells, knockdown of
Hif1a markedly inhibited GSIS during culture while the inhibition
of Hif2a tended to increase basal insulin release, suggesting that
the absence of each isoform differently affects beta cell function. In
this context, it is important to note that the moderate activation of
HIF by glucose stimulation under physiological conditions, i.e. in
vivo where the islet pO2 may be lower than in in vitro culture
systems, could play an important role in the maintenance of the
beta-cell phenotype or in their adaptation to changes in insulin
demand. Such ‘‘physiological hypoxia’’ is compatible with the fact
that HIF is activated at glucose concentrations at which
mitochondrial ATP production is not reduced [44]. In support
of this hypothesis, it was recently shown that, in the rat, the
proportion of islets showing pimonidazole-protein adduct staining
in vivo is modulated by changes in insulin demand [45]. In contrast
with that study, however, we did not observe major differences in
pimonidazole staining between islets from the same mouse
pancreatic section.
On the other hand, almost complete repression of low-Km HK
(I–III), LDH and MCT (isoforms 1, 2 and 4) is also critical to
prevent inappropriate stimulation of insulin secretion at low
glucose and during exercise [41,46]. The lack of LDH and high
expression of malate/aspartate and glycerol-phosphate shuttle
enzymes also contribute to optimal GSIS by preventing pyruvate
diversion from its mitochondrial metabolism while coupling re-
oxidation of cytosolic NADH with increased mitochondrial ATP
production [47]. Following vhlh inactivation in beta-cells, sustained
activation of HIF-target gene expression under normoxic
conditions tended to increase insulin secretion at low glucose
while reducing the maximal GSIS with consequent development
of glucose intolerance [22,30,48]. Moreover, expression of a
constitutively active form of HIF1a significantly decreased GSIS,
O2 consumption and pimonidazole staining in MIN6 cells [16].
Hypoxia should therefore be considered as a possible contributing
factor when interpreting the in vitro effects of high glucose
concentrations on beta-cell gene expression, function and survival,
even in beta-cell lines. Our recent attempt to prevent beta-cell
glucotoxicity by culturing islets for 1 week in the presence of 60%
O2 led to the opposite effect, i.e. a ,10-fold increase in islet cell
apoptosis in G10 and a ,50-fold increase in G30 (Figure S4).
Other strategies will have to be developed to check the role of
hypoxia in beta-cell glucotoxicity.
Possible relevance for the pathophysiology of type 2diabetes
Together with alterations of islet microvasculature and fibrosis
that impair vessel integrity and O2 supply [20], the high metabolic
demand imposed by hyperglycaemia may promote beta-cell
hypoxia and HIF activation in vivo. So far, the available evidence
suggests, but do not prove, that some beta-cells may indeed suffer
from hypoxia in type 2 diabetes. Thus, HIF-target gene expression
(this study and [18–20]) and pimonidazole-protein adducts [16]
were increased in islets isolated from various rodent models of
Figure 6. Role of hypoxia in glucose-induced HIF-target genemRNA expression in cultured rat islets. A–C, after preculture, ratislets were cultured 18 h in G2, G5, G10, G30 or in G5 in the presence of5% O2 (pO2,38 mmHg) instead of 20% O2 (pO2,151 mmHg) in theincubator. Pimonidazole was added to the culture medium for the last2 h and pimonidazole protein-adducts were detected by western blot(A–B) or immunohistochemistry (C). For each lane, the area under thecurve (AUC) was calculated and normalized for changes in ACTIN bandintensity. Results are representative blots (A) or means 6 SEM ofnormalized AUC for 3–5 experiments (B). *, p,0.05 for the effect ofhypoxia (t-test) or glucose vs. G2 (one-way ANOVA+Newman–Keuls
test). Immunohistochemistry images are representative for 3 experi-ments (C). D, one week precultured islets were cultured 18 h in G2, G5,G10 or G30 in the presence of 20% O2 (pO2,151 mmHg, open circles)or 60% O2 (pO2,453 mmHg, close circles). Gene to Tbp mRNA ratios areexpressed relative to the ratio in islets or INS-1E cells cultured in G2 and20% O2. Results are means 6 SEM for 3–5 experiments (D). *, p,0.05 forthe effect of glucose vs. G2 and #, p,0.05 for the effect of 60% O2 at thesame glucose concentration (two-way ANOVA+test of Bonferroni).doi:10.1371/journal.pone.0029807.g006
Nutrient Activation of HIFs in Rat Beta-Cells
PLoS ONE | www.plosone.org 9 January 2012 | Volume 7 | Issue 1 | e29807
diabetes, with a few islet cells (the identity of which could not be
clarified) displaying higher levels of pimonidazole-protein adducts
when measured by immunohistochemistry. Moreover, HIF1a-
positive islet nuclei, although rare, were clearly detected on
pancreatic sections of diabetic but not normoglycaemic mice. If
these cells were unambiguously identified as hypoxic beta-cells,
one could suggest that in vivo hypoxia, HIF activation and HIF-
target gene expression in only a fraction of beta-cells could
contribute to the slow deterioration of beta-cell function and
survival in type 2 diabetes. Such in vivo hypoxia could result from
increased beta-cell O2 consumption at high glucose, to a decrease
in islet perfusion following changes in islet microvasculature by
chronic hyperglycemia, or to both processes.
In conclusion, glucose-induced O2 consumption creates an
intracellular hypoxia that activates HIF1 and HIF2 in rat beta-
cells, and this glucose effect contributes, together with the
activation of other transcription factors, to the glucose stimulation
of expression of some glycolytic enzymes and other hypoxia
response genes.
Materials and Methods
ReagentsSuccinic acid monomethyl ester, a-ketoisocaproate, diazoxide,
nimodipine and 3-O-methyl-D-glucopyranose were purchased
from Sigma (St. Louis, MO, USA). DharmaFECT1 and
siGENOME SMARTpool small interfering RNA (siRNA) du-
plexes targeting Hif1a and Hif2a were from Dharmacon (Thermo
Scientific, Lafayette, CO, USA). SilencerH Firefly Luciferase (Luc)
and Negative Control siRNA were from Ambion (Applied
Biosystems, Foster City, CA, USA). Other reagents were from
Merck (Darmstadt, Germany).
AntibodiesRabbit polyclonal anti-Actin antibody (A2066) was from Sigma.
Mouse monoclonal anti-HIF1a (ab1) and anti-HIF2a (ab8365)
antibodies used for western blotting were from Abcam (Cam-
bridge, UK). Mouse anti-HIF1b antibody (clone 29, 611079) was
from BD Biosciences (San Jose, CA, USA) and rabbit anti-HIF1b/
ARNT antibody (3718) was from Cell Signaling Technology
(Danvers, MA, USA). The rabbit anti-HIF1a antiserum used for
immunohistochemistry has been described earlier [49].
Islet isolation and culturePancreatic islets were isolated from ,200 g male Wistar rats as
described [50]. They were precultured for 1 week in serum-free
RPMI 1640 medium (Invitrogen, Carlsbad, CA, USA) containing
Figure 7. Role of hypoxia in the glucose stimulation of HIF-target gene mRNA levels in INS-1E cells. INS-1E cells (70% ofconfluence) were cultured 18 h in G2, G5, G10 or G30 in the presence of20% O2 (pO2,151 mmHg, open circles) or 60% O2 (pO2,453 mmHg,close circles). Pimonidazole was added to the culture medium for thelast 2 h and pimonidazole protein-adducts were detected by westernblot (A). For each lane, the area under the curve (AUC) was calculatedand normalized for changes in ACTIN band intensity. HIF1a and HIF2aprotein levels were measured in nuclear extracts and normalized forchanges in ACTIN (A–B). Gene to Tbp mRNA ratios are expressedrelative to the ratio in INS-1E cells cultured in G2 and 20% O2 (C). Resultsare representative blots (A) or means 6 SEM of normalized AUC for 3–5experiments (B–C). *, p,0.05 for the effect of glucose vs. G2 and #,p,0.05 for the effect of 60% O2 at the same glucose concentration(two-way ANOVA+test of Bonferroni).doi:10.1371/journal.pone.0029807.g007
Nutrient Activation of HIFs in Rat Beta-Cells
PLoS ONE | www.plosone.org 10 January 2012 | Volume 7 | Issue 1 | e29807
10 mmol/l glucose, 5 g/l BSA (fraction V, Roche, Basel,
Switzerland), 100 IU/ml penicillin and 100 mg/ml streptomycin
(Invitrogen). Islets that developed central necrosis were discarded
during preculture. After preculture, islets were cultured 18 h in the
G2, G5, G10, and G30 and various test substances at different
incubator pO2 (38, 151, 456 and 680 mmHg). After culture, the
medium was collected for insulin concentration determination
(RIA using rat insulin as a standard) and the islets were processed
for further analysis.
In vivo studiesLeprdb/db and Leprdb/+ mice on a C57BL/KSJ background were
from Janvier (Le Genest-Saint-Isle, France) or from the animal
facility of the Garvan Institute. They were used from 10 to 26
weeks of age. Blood glucose was measured with a glucometer
(Accu-Check Sensor, Roche, Mannheim, Germany). After cervical
dislocation, the duodenal loop, the pancreas and the spleen were
removed as a block and fixed in less than 3 minutes. All
experiments were approved by the local ethics committee for
animal experimentation (Universite catholique de Louvain,
Faculte de Medecine, Comite d’ethique facultaire pour l’experi-
mentation animale, projet UCL/MD/2009/009: ‘‘Mecanismes
moleculaires de la plasticite du phenotype des cellules B
pancreatiques en conditions physiopathologiques’’ accepted for 4
years). ‘‘Principles of laboratory animal care’’ (NIH publication
no. 85–23, revised 1985) were followed.
Cell culture and RNA interferenceINS-1E cells (passage 70–94) were cultured in standard RPMI
medium supplemented with 10% heat-inactivated fetal calf serum,
10 mmol/l HEPES, 1 mmol/l sodium pyruvate, 2 mmol/l
glutamine, 100 U/ml penicillin, 100 mg/ml streptomycin, and
50 mmol/l b-mercaptoethanol. To downregulate gene expression,
INS-1E cells were transfected for 24 h using DharmaFECT1 and
30 nmol/l siRNA in antibiotic-free medium, according to the
manufacturer’s instructions. Cells (,70%confluence) were then
cultured for 18 h in fresh medium containing different glucose
concentration and various test substances as indicated.
Real time RT-PCRIslet and INS-1E total RNA extraction, reverse transcription,
real-time PCR and melting curve analysis of PCR products were
performed as described previously [50]. Relative changes in Gene
to Tbp mRNA ratio between test and control conditions were
computed using the 22DDCt method. Primer sequences and
reaction conditions are detailed in Tables S2 and S3.
Nuclear extraction and western blotting for HIF1a, HIF2aand ARNT
INS-1E cells were rinsed with ice-cold PBS, scraped in
hypotonic buffer (20 mmol/l HEPES, 5.7 mmol/l NaF,
1 mmol/l EDTA, pH 7.5) and incubated on ice for 15 min. After
addition of 0.5% Nonidet P-40, the nuclei were pelleted (8006g
Figure 8. Role of Ca2+ influx and insulin secretion in glucose-induced HIF-target gene expression in rat islets. After preculture, isletswere cultured 18 h in G10, G30, G30 +1 mmol/l nimodipine (Nimo) or the latter condition plus increasing concentrations of exogenous human insulin(Actrapid), as indicated. The absolute rate of insulin secretion (ng.islet21.h21) in the first three conditions were: 1.0260.25 in G10; 2.7860.93 in G30and 0.0960.02 in G30+Nimo (n = 3). Gene to Tbp mRNA levels were expressed relative to the level in G10. Data are means 6 SEM for 3 to 4experiments. *, p,0.05 for the effect of glucose, #, p,0.05 for the effect of nimodipine, 1, p,0.05 for the effect of insulin (one-way ANOVA+test ofNewman-Keuls).doi:10.1371/journal.pone.0029807.g008
Nutrient Activation of HIFs in Rat Beta-Cells
PLoS ONE | www.plosone.org 11 January 2012 | Volume 7 | Issue 1 | e29807
for 4 min at 4uC), resuspended in 50 ml Complete Lysis Buffer
AM1 (Active Motif, Rixensart, Belgium) supplemented with
1 mmol/l dithiothreitol and 1% protease inhibitor cocktail (Roche
Diagnostics, Mannheim, Germany), incubated for 15 min on ice
with regular shaking, and centrifuged at 17506g for 10 min at
4uC. Cytosolic proteins in the supernatant were precipitated with
trichloroacetic acid, triple extracted with ether, and solubilised in
Laemmli buffer. Nuclear and cytosolic extracts were then
separated by 7.5% SDS-PAGE and transferred to nitrocellulose
membrane (Bio-Rad Laboratories, Hercules, CA, USA). The
membranes were incubated with a mouse monoclonal primary
antibody followed by a horse-radish-peroxidase-conjugated anti-
mouse antibody (Santa-Cruz, CA, USA) and the signal was
revealed by enhanced chemiluminescence (SuperSignalH West-
Femto or West-Dura kits, Thermo Scientific). Band intensities
were quantified by scanning densitometry (Gel-Doc2000, Bio-
Rad), analyzed with Quantity OneTM (Bio-Rad) and normalized
to Red Ponceau staining or ACTIN band intensity.
Immunodetection of HIF1a and ARNTTissues were fixed in 4% formaldehyde and embedded in
paraffin. For HIF1a and insulin detection, 5 mm-thick sections
were treated as described previously [31]. For ARNT detection,
the sections were incubated with rabbit anti-ARNT antibody
diluted 1:50 overnight at 4uC, washed in Tris-buffered saline and
incubated for 1 h with Alexa Red 594-conjugated goat anti-rabbit
IgG (Molecular Probes) diluted 1:100. After washing in Tris-
buffered saline and addition of Vectashield-mounting medium
containing DAPI (Vector Laboratories, Burlingame, CA), sections
were visualized on an Axioskop 40 microscope (Zeiss, Oberko-
Figure 9. HIF1a protein expression and pimonidazole-protein adduct formation in the pancreas and intestine of diabetic mice.Diabetic Leprdb/db mice (db/db) and non-diabetic Leprdb/+ mice (db/+) were killed and their pancreas, spleen and duodenal loop were dissected andfixed in paraformaldehyde solution (4%) overnight at 4uC. A–D, HIF1a expression in 10 week-old male db/db mice (n = 2; blood glucose = 25.4 and24.1 mmol/l; body weight = 45 and 44 g) and non-diabetic db/+ mice (n = 2; blood glucose = 6.3 and 7.9 mmol/l, n = 2; body weight = 23 and 26 g). E–H, corresponding images with merged HIF1a (red) and Hoechst 33342 (blue) nuclear staining. White arrows, HIF1a-positive islet cell nuclei (purple onmerged images). Bar scale = 50 mm. Results are representative for two animals of each kind. I–T, pimonidazole protein-adducts in 26 week-old maleand female db/db mice (M–T) (n = 3; blood glucose = 25.360.9 mmol/l; body weight = 5463 g) and non-diabetic db/+ mice (I–L) (n = 3; bloodglucose = 6.660.3 mmol/l; body weight = 2860.9 g) injected with pimonidazole (60 mg/kg) 24 h before death (brown 3,39-diaminobenzidineprecipitate). Black arrows, cells with higher pimonidazole-protein adduct intensity. Bar scale = 50 mm. Results are representative for two animals ofeach kind. U–X, immunodetection of HIF1a and pimonidazole-protein adducts in the duodenal mucosa of db/+ or db/db mice.doi:10.1371/journal.pone.0029807.g009
Nutrient Activation of HIFs in Rat Beta-Cells
PLoS ONE | www.plosone.org 12 January 2012 | Volume 7 | Issue 1 | e29807
chen, Germany) equipped with an Infinity-x camera (Deltapix,
Lumenera Corporation, Ottawa, Ontario, Canada).
Immunodetection of pimonidazole-protein adductsPimonidazole (HypoxyprobeTM Inc., Burlington, MA, USA)
was added to RPMI medium at a final concentration of
200 mmol/l 2 h before the end of culture or was injected
intraperitoneally (60 mg/kg body weight, 34 mmol/l in NaCl
9 g/l sterile solution) 24 h before killing the mice. Tissues were
fixed in 4% formaldehyde and embedded in paraffin before
detection of pimonidazole-protein adducts on 5 mm-thick sections.
Briefly, deparaffinized sections were treated with H2O2 (0.3% vol/
vol) to inactivate endogenous peroxidase and incubated with either
Hypoxyprobe 1 monoclonal antibody (clone 4.3.11.3) diluted
1:100 followed by anti-mouse EnVision+TM peroxidase complex
for 1 h (Dako, Carpintera, USA) for rat islets, or Hypoxyprobe 1
polyclonal rabbit antibody diluted 1:200 followed by anti-rabbit
EnVision+TM peroxidase complex for mouse pancreas. In both
cases, the signal was revealed by 3,39-diaminobenzidine. Pimoni-
dazole-protein adducts in cultured islets were also measured by
Western Blot and the signal intensity was normalized to that of
ACTIN (Ab dilution 1:2000).
Statistical analysisResults are means 6 SEM for the indicated number of
experiments. Statistical significance of differences between groups
was assessed by one-way ANOVA and a test of Newman-Keuls or
by two-way ANOVA and a test of Bonferroni. Differences were
considered significant when p,0.05.
Supporting Information
Figure S1 Effects of glucose, hypoxia and CoCl2 onARNT (HIF1b) protein levels in cultured rat islets. The
islets were cultured exactly as described in legend to figure 1.
ARNT and insulin were detected by immunohistochemistry in
5 mm-thick islet sections. Nuclei were stained with 0.75 mg/ml
49,6-diamidino-2-phenylindole (DAPI). Results are representative
for 2 to 3 experiments.
(TIF)
Figure S2 Role of hypoxia in glucose-induced HIF-targetgene mRNA expression in cultured rat islets. One week
precultured islets were cultured 18 h in G2, G5, G10 or G30 in
the presence of 20% O2 (pO2,151 mmHg, open circles) or 90%
O2 (pO2,680 mmHg, close circles). Pimonidazole was added to
the culture medium for the last 2 h and pimonidazole protein-
adducts were detected by western blot. For each lane, the area
under the curve (AUC) was calculated and normalized for changes
in ACTIN band intensity. Results are representative blots and
means 6 SEM of normalized AUC for 3 experiments. *, p,0.05
for the effect of glucose vs. G2 and #, p,0.05 for the effect of 90%
O2 (two-way ANOVA+test of Bonferroni).
(TIF)
Figure S3 Role of Ca2+ influx and insulin secretion inglucose-induced HIF-target gene expression in INS-1Ecells. INS-1E cells (70% of confluence) were cultured 18 h in
various glucose concentrations in the presence (closed circles) or
absence (open circles) of 1 mmol/l nimodipine. Gene to Tbp
mRNA levels were expressed relative to the level in G2. Data are
means 6 SEM for 3 to 4 experiments. *, p,0.05 for the effect of
glucose, #, p,0.05 for the effect of nimodipine, 1, p,0.05 for the
effect of insulin (two-way ANOVA+test of Bonferroni).
(TIF)
Figure S4 Effects of a one-week culture under hyperoxicconditions on islet cell DNA fragmentation. Rat islets were
cultured for 1 week in the presence of G10 or G30 under
normoxic or hyperoxic conditions, as detailed in legend to
figure 6D. At the end of culture, islet DNA fragmentation was
assessed with the Cell Death ELISA kit from Roche, as described
in reference 21. Results are mean and individual data for 2
independent cultures.
(TIF)
Table S1 Rat islet mRNA expression of genes involvedin HIF signaling pathway and their regulation byglucose. After 1 week preculture in serum-free RPMI medium
containing 5 g/l BSA and 10 mmol/l glucose (G10), rat islets were
cultured 18 h in the presence of 2, 5, 10 or 30 mmol/l glucose. The
glucose regulation of gene mRNA levels was measured using
Affymetrix rat 230.2 microarrays (for details, see [21]). Probe-sets
corresponding to various components of the HIF signaling pathway
were selected based on the literature [1],[51] and classified in three
groups: Transcription factors, HIF-regulating and interacting
proteins, and HIF-target genes. *, # denotes genes whose expression
was up-regulated at least 1.5-fold (*) or more than 2-fold (#) in vhlh-
KO vs. WT mouse islets [22]. Data are means 6 SE hybridization
value (Arbitrary units) for 4 experiments. a P,0.05, b P,0.01 vs. islets
cultured in G2 (one-way ANOVA+test of Newman-Keuls). The
following probe sets were considered «Absent» on the microarrays
(for analysis criteria, see [21]): Adra1b (1368574_at); # Abcb1
(1370465_at); * Abcg2 (1380577_at); Col5a1 (1369955_at); Cp
(1368419_at; 1368420_at); * Ctgf (1367631_at); Cxcl12 (1387655_at;
1388583_at); Cyp2s1 (1390282_at); Edn1 (1369519_at); * Egln1
(1375262_at); Eng (1372579_at); Epo (1387308_at); Hif1a(1368149_at); * Hk1 (1386929_at); * Hk2 (1369006_at; 1383519_at);
Igf2 (1371206_a_at; 1398322_at); Igfbp3 (1386881_at); Itgb2
(1383131_at); * Krt14 (1371895_at); Lep (1387748_at); Lox
(1368171_at; 1368172_a_at); * Lrp1 (1388416_at); Mmp14
(1378225_at); Mmp2 (1369825_at); Nos2 (1387667_at); Nos3
(1371166_at); # Pfkfb3 (1369794_a_at; 1397082_at); Pgk1
Table 4. Changes in the mRNA levels of Hif1a, Hif2a andseveral HIF-target genes in islets isolated from diabetic mice.
Gene symbol Gene/Cyclophilin mRNA ratios
(relative to Leprdb/+)
Leprdb/+ Leprdb/db
Hif1a 160.14 1.2660.10
Hif2a 160.15 3.3160.53a
Tpi1 160.06 2.1960.20a
Gapdh 160.05 2.6960.47a
Eno1 160.13 3.9160.45a
Adm 160.12 3.2460.58a
Hyou1 160.06 3.5260.47a
Gene/Cyclophilin mRNA ratio were measured by real-time PCR using islet cDNAfrom 10-week-old diabetic Leprdb/db mice and their non-diabetic Leprdb/+
littermates (fed whole blood glucose levels ,20 mmol/l and ,6 mmol/lrespectively)(primer sequences are shown in Table S3). The metaboliccharacteristics of the mice and the mRNA levels of other b-cell genes (includingHk1 and Ldha) in these series of experiments have been reported earlier [26].Data are means 6 SE for 5–9 mice and are expressed relative to the mRNA ratioin control Leprdb/+ mice.ap,0.01 vs. control by Student t-test.doi:10.1371/journal.pone.0029807.t004
Nutrient Activation of HIFs in Rat Beta-Cells
PLoS ONE | www.plosone.org 13 January 2012 | Volume 7 | Issue 1 | e29807

(1368906_at); Plaur (1387269_s_at); Prok1 (1387650_at); # Serpine1
(1368519_at; 1392264_s_at); Slc2a3 (1372326_at; 1387707_at); Tert
(1388222_at); Tf (1370228_at; 1391323_at); Tgfb3 (1367859_at); #Tgm2 (1387776_at).
(DOC)
Table S2 Sequences of oligonucleotide primers andreaction conditions for real-time PCR amplification ofrat cDNA, and characteristics of PCR products. Tm:
Amplicon melting temperature; a: Islet sample cDNA quantity per
tube (ng total RNA equivalent).
(DOC)
Table S3 Sequences of oligonucleotide primers for real-time PCR amplification of mouse cDNA.(DOC)
Acknowledgments
We thank Yassaman Ghojavand for her contribution to the study of
pimonidazole-protein adducts formation, Denis Charlier for expert
technical help and F. Knockaert for insulin RIA. We also thank Decio
Eizirik for help with SiRNA transfection.
Author Contributions
Conceived and designed the experiments: MB J-CJ. Performed the
experiments: MB GR BD DRL CM. Analyzed the data: MB GR BD DRL
J-CJ. Contributed reagents/materials/analysis tools: BD DRL CM YG JP.
Wrote the paper: MB J-CJ. Provided corrections and suggestions to the
paper: GR BD DRL CM YG JP.
References
1. Semenza GL (2007) Oxygen-dependent regulation of mitochondrial respiration
by hypoxia-inducible factor 1. Biochem J 405: 1–9.
2. Taylor CT (2008) Mitochondria and cellular oxygen sensing in the HIF
pathway. Biochem J 409: 19–26.
3. Brahimi-Horn MC, Chiche J, Pouyssegur J (2007) Hypoxia signalling controls
metabolic demand. Curr Opin Cell Biol 19: 223–229.
4. Jitrapakdee S, Wutthisathapornchai A, Wallace JC, MacDonald MJ (2010)
Regulation of insulin secretion: role of mitochondrial signalling. Diabetologia 53:
1019–1032.
5. Henquin JC (2009) Regulation of insulin secretion: a matter of phase control and
amplitude modulation. Diabetologia 52: 739–751.
6. Hinke SA, Hellemans K, Schuit FC (2004) Plasticity of the b cell insulin
secretory competence: preparing the pancreatic b cell for the next meal. J Physiol
558: 369–380.
7. Hutton JC, Malaisse WJ (1980) Dynamics of O2 consumption in rat pancreatic
islets. Diabetologia 18: 395–405.
8. Longo EA, Tornheim K, Deeney JT, Varnum BA, Tillotson D, et al. (1991)
Oscillations in cytosolic free Ca2+, oxygen consumption, and insulin secretion in
glucose-stimulated rat pancreatic islets. J Biol Chem 266: 9314–9319.
9. Wang W, Upshaw L, Strong DM, Robertson RP, Reems J (2005) Increased
oxygen consumption rates in response to high glucose detected by a novel
oxygen biosensor system in non-human primate and human islets. J Endocrinol
185: 445–455.
10. Carlsson PO, Jansson L, Ostenson CG, Kallskog O (1997) Islet capillary blood
pressure increase mediated by hyperglycemia in NIDDM GK rats. Diabetes 46:
947–952.
11. Carlsson PO, Jansson L, Palm F (2002) Unaltered oxygen tension in rat
pancreatic islets despite dissociation of insulin release and islet blood flow. Acta
Physiol Scand 176: 275–281.
12. Jung SK, Kauri LM, Qian WJ, Kennedy RT (2000) Correlated oscillations in
glucose consumption, oxygen consumption, and intracellular free Ca(2+) in
single islets of Langerhans. J Biol Chem 275: 6642–6650.
13. Ortsater H, Liss P, Akerman KE, Bergsten P (2002) Contribution of glycolytic
and mitochondrial pathways in glucose-induced changes in islet respiration and
insulin secretion. Pflugers Arch 444: 506–512.
14. Lau J, Henriksnas J, Svensson J, Carlsson PO (2009) Oxygenation of islets and its
role in transplantation. Curr Opin Organ Transplant 14: 688–693.
15. Sweet IR, Gilbert M (2006) Contribution of calcium influx in mediating glucose-
stimulated oxygen consumption in pancreatic islets. Diabetes 55: 3509–3519.
16. Sato Y, Endo H, Okuyama H, Takeda T, Iwahashi H, et al. (2011) Cellular
hypoxia of pancreatic b-cells due to high levels of oxygen consumption for
insulin secretion in vitro. J Biol Chem 286: 12524–12532.
17. Hosokawa H, Hosokawa YA, Leahy JL (1995) Upregulated hexokinase activity
in isolated islets from diabetic 90% pancreatectomized rats. Diabetes 44:
1328–1333.
18. Jonas JC, Sharma A, Hasenkamp W, Ilkova H, Patane G, et al. (1999) Chronic
hyperglycemia triggers loss of pancreatic b cell differentiation in an animal
model of diabetes. J Biol Chem 274: 14112–14121.
19. Laybutt DR, Sharma A, Sgroi DC, Gaudet J, Bonner-Weir S, et al. (2002)
Genetic regulation of metabolic pathways in b-cells disrupted by hyperglycemia.
J Biol Chem 277: 10912–10921.
20. Li X, Zhang L, Meshinchi S, Dias-Leme C, Raffin D, et al. (2006) Islet
microvasculature in islet hyperplasia and failure in a model of type 2 diabetes.
Diabetes 55: 2965–2973.
21. Bensellam M, Van Lommel L, Overbergh L, Schuit FC, Jonas JC (2009) Cluster
analysis of rat pancreatic islet gene mRNA levels after culture in low-,
intermediate- and high-glucose concentrations. Diabetologia 52: 463–476.
22. Zehetner J, Danzer C, Collins S, Eckhardt K, Gerber PA, et al. (2008) pVHL is
a regulator of glucose metabolism and insulin secretion in pancreatic b cells.
Genes Dev 22: 3135–3146.
23. Buchwald P (2009) FEM-based oxygen consumption and cell viability models for
avascular pancreatic islets. Theor Biol Med Model 6: Article 5. DOI 10.1186/
1742-4682-6-5.
24. Arteel GE, Thurman RG, Raleigh JA (1998) Reductive metabolism of the
hypoxia marker pimonidazole is regulated by oxygen tension independent of the
pyridine nucleotide redox state. Eur J Biochem 253: 743–750.
25. Trube G, Rorsman P, Ohno-Shosaku T (1986) Opposite effects of tolbutamide
and diazoxide on the ATP-dependent K+ channel in mouse pancreatic b-cells.
Pflugers Arch 407: 493–499.
26. Kjorholt C, Akerfeldt MC, Biden TJ, Laybutt DR (2005) Chronic hyperglyce-
mia, independent of plasma lipid levels, is sufficient for the loss of b-cell
differentiation and secretory function in the db/db mouse model of diabetes.
Diabetes 54: 2755–2763.
27. Jung SR, Reed BJ, Sweet IR (2009) A highly energetic process couples calcium
influx through L-type calcium channels to insulin secretion in pancreatic beta-
cells. Am J Physiol Endocrinol Metab 297: E717–E727.
28. Pipeleers D, Kiekens R, Ling Z, Wilikens A, Schuit F (1994) Physiologic
relevance of heterogeneity in the pancreatic beta-cell population. Diabetologia
37 Suppl 2: S57–S64.
29. Moritz W, Meier F, Stroka DM, Giuliani M, Kugelmeier P, et al. (2002)
Apoptosis in hypoxic human pancreatic islets correlates with HIF-1a expression.
FASEB J 16: 745–747.
30. Cantley J, Selman C, Shukla D, Abramov AY, Forstreuter F, et al. (2009)
Deletion of the von Hippel-Lindau gene in pancreatic b cells impairs glucose
homeostasis in mice. J Clin Invest 119: 125–135.
31. Heinis M, Simon MT, Ilc K, Mazure NM, Pouyssegur J, et al. (2010) Oxygen
tension regulates pancreatic b-cell differentiation through hypoxia-inducible
factor 1a. Diabetes 59: 662–669.
32. Roche E, Assimacopoulos-Jeannet F, Witters LA, Perruchoud B, Yaney G, et al.
(1997) Induction by glucose of genes coding for glycolytic enzymes in a
pancreatic b-cell line (INS-1). J Biol Chem 272: 3091–3098.
33. Ma Z, Portwood N, Brodin D, Grill V, Bjorklund A (2007) Effects of diazoxide
on gene expression in rat pancreatic islets are largely linked to elevated glucose
and potentially serve to enhance b-cell sensitivity. Diabetes 56: 1095–1106.
34. da Silva Xavier G, Leclerc I, Salt IP, Doiron B, Hardie DG, et al. (2000) Role of
AMP-activated protein kinase in the regulation by glucose of islet beta cell gene
expression. Proc Natl Acad Sci U S A 97: 4023–4028.
35. Wang H, Wollheim CB (2002) ChREBP rather than USF2 regulates glucose
stimulation of endogenous L-pyruvate kinase expression in insulin-secreting cells.
J Biol Chem 277: 32746–32752.
36. Collier JJ, Zhang PL, Pedersen KB, Burke SJ, Haycock JW, et al. (2007) c-Myc
and ChREBP regulate glucose-mediated expression of the L-type pyruvate
kinase gene in INS-1-derived 832/13 cells. Am J Physiol Endocrinol Metab 293:
E48–E56.
37. Diraison F, Ravier MA, Richards SK, Smith RM, Shimano H, et al. (2008)
SREBP1 is required for the induction by glucose of pancreatic b-cell genes
involved in glucose sensing. J Lipid Res 49: 814–822.
38. Hu CJ, Wang LY, Chodosh LA, Keith B, Simon MC (2003) Differential roles of
hypoxia-inducible factor 1a (HIF-1a) and HIF-2a in hypoxic gene regulation.
Mol Cell Biol 23: 9361–9374.
39. Collier JJ, Doan TT, Daniels MC, Schurr JR, Kolls JK, et al. (2003) c-Myc is
required for the glucose-mediated induction of metabolic enzyme genes. J Biol
Chem 278: 6588–6595.
40. Matschinsky FM (1996) A lesson in metabolic regulation inspired by the
glucokinase glucose sensor paradigm. Diabetes 45: 223–241.
41. Quintens R, Hendrickx N, Lemaire K, Schuit F (2008) Why expression of some
genes is disallowed in beta-cells. Biochem Soc Trans 36: 300–305.
42. Gunton JE, Kulkarni RN, Yim S, Okada T, Hawthorne WJ, et al. (2005) Loss of
ARNT/HIF1b mediates altered gene expression and pancreatic-islet dysfunc-
tion in human type 2 diabetes. Cell 122: 337–349.
Nutrient Activation of HIFs in Rat Beta-Cells
PLoS ONE | www.plosone.org 14 January 2012 | Volume 7 | Issue 1 | e29807
43. Cheng K, Ho K, Stokes R, Scott C, Lau SM, et al. (2010) Hypoxia-inducible
factor-1a regulates b cell function in mouse and human islets. J Clin Invest 120:
2171–2183.
44. Khaldi MZ, Guiot Y, Gilon P, Henquin JC, Jonas JC (2004) Increased glucose
sensitivity of both triggering and amplifying pathways of insulin secretion in rat
islets cultured for one week in high glucose. Am J Physiol Endocrinol Metab 287:
E207–E217.
45. Olsson R, Carlsson PO (2011) A low-oxygenated subpopulation of pancreatic
islets constitutes a functional reserve of endocrine cells. Diabetes 60: 2068–2075.
46. Ishihara H, Wang H, Drewes LR, Wollheim CB (1999) Overexpression of
monocarboxylate transporter and lactate dehydrogenase alters insulin secretory
responses to pyruvate and lactate in b cells. J Clin Invest 104: 1621–1629.
47. Sekine N, Cirulli V, Regazzi R, Brown LJ, Gine E, et al. (1994) Low lactate
dehydrogenase and high mitochondrial glycerol phosphate dehydrogenase in
pancreatic b-cells. Potential role in nutrient sensing. J Biol Chem 269:
4895–4902.48. Puri S, Cano DA, Hebrok M (2009) A role for von Hippel-Lindau protein in
pancreatic b-cell function. Diabetes 58: 433–441.
49. Richard DE, Berra E, Gothie E, Roux D, Pouyssegur J (1999) p42/p44 mitogen-activated protein kinases phosphorylate hypoxia-inducible factor 1a (HIF-1a)
and enhance the transcriptional activity of HIF-1. J Biol Chem 274:32631–32637.
50. Elouil H, Bensellam M, Guiot Y, Vander Mierde D, Pascal SM, et al. (2007)
Acute nutrient regulation of the unfolded protein response and integrated stressresponse in cultured rat pancreatic islets. Diabetologia 50: 1442–1452.
51. Benita Y, Kikuchi H, Smith AD, Zhang MQ, Chung DC, et al. (2009) Anintegrative genomics approach identifies Hypoxia Inducible Factor-1 (HIF-1)-
target genes that form the core response to hypoxia. Nucleic Acids Res 37:4587–4602.
Nutrient Activation of HIFs in Rat Beta-Cells
PLoS ONE | www.plosone.org 15 January 2012 | Volume 7 | Issue 1 | e29807