globefish highlights - issue 4/2013 - fao
TRANSCRIPT

HIGHLIGHTSA quarterly update on world seafood markets
31/10/2013 Issue 4/2013
Tel.: (+39) 06 57054163 - Fax: (+39) 06 57053020 - Email: [email protected] - Website: www.globefish.org

Bibliographic reference:GLOBEFISH Highlights2013FAO/GLOBEFISH Highlights (4/2013): p. 56
A quarterly updatebased onthe GLOBEFISH databank
About GLOBEFISHGLOBEFISH forms part of the Products, Trade and Marketing Branch of the FAO Fisheries and Aquaculture Department and is part of the FISH INFOnetwork (see below). It collects information from the main market areas in developed countries. for the benefit of the world’s producers and exporters. Part of its services is an electronic databank and the distribution of information through the GLOBEFISH European Fish Price Report, the GLOBEFISH Highlights, the GLOBEFISH Research Programme and the GLOBEFISH Commodity Updates.
The GLOBEFISH Highlights are based on information available in the databank, supplemented by market information from industry correspondents and from six regional services which form the FISH INFOnetwork: INFOFISH (Asia and the Pacific), INFOPESCA (Latin America and the Caribbean), INFOPECHE (Africa), INFOSAMAK (Arab countries), EUROFISH (Central and Eastern Europe) and INFOYU (China).
This issue of GLOBEFISH Highlights has been prepared by Audun Lem, Paola Sabatini and Karine Boisset with contributions from Shirlene M. Anthonysamy, Nada Bougouss, Victoria Chomo, Felix Dent, Fatima Ferdouse, Erik Hempel, Jianwei Lei, Rodrigo Misa, Sudari Pawiro, Ferit Rad, Meyling Tang, Stefania Vannuccini and Xiaowei Zhou. Hilary Cochrane provided editing services and Turan Rahimzadeh was responsible for the layout. The Norwegian Seafood Council provided data support for the FAO Fish Price Index.
GLOBEFISH Highlights are distributed to the subscribers of: INFOFISH Trade News, INFOPESCA Noticias Comerciales, INFOPECHE Nouvelles Commerciales, through EUROFISH and INFOYU. GLOBEFISH Highlights are also available in electronic form.
For subscription details please contact:
GLOBEFISH, FIPM/FAO Tel: (39-06) 5705 4163Viale delle Terme di Caracalla Fax: (39-06) 5705 302000153 Rome, ItalyEmail: [email protected]: www.globefish.org
All rights reserved. Reproduction and dissemination of material in this information product for educational or other non-commercial purposes are authorized without any prior written permission from the copyright holders provided the source is fully acknowledged. Reproduction of material in this information product for resale or other commercial purposes is prohibited without written permission of the copyright holders. Applications for such permission should be addressed to the Chief, Electronic Publishing Policy and Support Branch, Communication Division, FAO, Viale delle Terme di Caracalla, 00153 Rome, Italy or by e-mail to copyright@ fao. org
© FAO GLOBEFISH 2013

Global fish economy Aquaculture continues to boost overall supply but mar-kets are hesitant to pay current prices pushing quota-tions down from earlier levels. Fish consumption per capita continues to grow with aquaculture in the process of overtaking capture fisheries as a source of fish supply for direct human consumption p. 2
Lower supply and high prices are the characteristics of international shrimp trade at present
Lower production of farmed shrimp associated with the disease problems in Asia and Latin America during the first half of the year and poor supply forecast for the rest of the year have
pushed shrimp prices higher worldwide. p. 4
Overall 2013 tuna landings lower than last year Japan, the largest sashimi tuna mar-ket, has become less active with lower imports during the first half of the year. The canned tuna market fared better with improved imports by the
European Union and the USA. Canned tuna demand has also increased in many non-conventional markets. p. 11
In spite of good supply cod prices have not dropped globally
Overall the supply situation for the main species of groundfish is mixed. Taking all sources of supply into con-sideration, there is probably an over-
supply of cod; however, cod prices in Europe and Asia have in-creased over the summer months. p. 17
Octopus supplies increasing in main markets Octopus supplies are more abundant, particularly from Morocco, and this is reflected in busier trading in the main markets, such as Japan, Spain and Italy, which have all increased
imports substantially during the first half of the year. Squid supplies are also up slightly but supplies of cuttlefish remain tight. p. 21
Demand remains firm keeping prices steady and strong Production in China is currently reported to be down by 30% while other producers in Asia, Africa and Latin America continue to intensify
tilapia farming. Demand remains firm, which will help keep prices steady and strong. p. 25
Steady global demand but major markets slow down VASEP has forecast lower pro-duction in 2013, which together with other measures should help stabilize pangasius prices. Im-
ports into the EU took a step back while US imports grew marginally. Elsewhere, demand remains strong for pan-gasius fillet and is being met by both imported and local sources. p. 27
Turkey becomes largest producer but prices weaken and costs continue to rise
The increasing volumes of seabass and seabream that are coming to market have led to weaker prices. Although consumers have reason to be happy,
producers are in a different position as margins have taken a serious hit. p. 29
Booming market finally begins to cool as growing con-sumer resistance to mark-ups reverses upward trend
Since the recovery that began in late 2012, the salmon market has witnessed continued driving growth and a positive price trajectory lifting export revenues
to record levels, particularly for Norwegian producers supplying EU markets. This price trend has recently been reversed, how-ever, and there is evidence of weakening demand as high raw material costs filter down the value chain. p. 35
EU ban on mackerel and herring from the Faroe Islands brings Iceland to the negotiation table
The EU has followed through with its threat to impose trade restrictions on the Faroe Islands in August, and Nor-way has followed suit. This means that
mackerel and herring from the Faroes are banned in the EU and Norway, and the impact on the industry may soon be felt. There will be shifts in trade flows, and there may also be some price consequences as a result of this. p. 41
Rising price trend continues as a result of strong de-mand for fishmeal
The rising price trend for fishmeal con-tinued through the second quarter of 2013. With this latest increase, prices have risen approximately 43% between mid-2008 and mid-2013. Soymeal prices remained relatively flat over the same
period, thus this growing price differential may provide incen-tives for terrestrial farmers to substitute fishmeal with less ex-pensive feed alternatives. p. 46
Fish oil prices reach record highs The fish oil price continued its steady rise, reaching new highs in mid-2013. Growing demand for aquaculture prod-ucts will continue to put upward pres-sure on fish oil prices as a primary ingre-dient in fish feeds for carnivorous fish
species. p. 48
Decline in European Imports of Bivalve Molluscs Slows but Asian Demand Growing
Mussel trade within the European Union during the first six months of 2013 was dominated by intra-EU trade, with 72%, or 67 300 tonnes, of imports coming from countries within the European communi-
ty, in particular from Spain, Netherlands, Denmark, Italy and UK. p. 49
Fish and fishery products statistics p. 56
INSIDE THIS ISSUE...

2 Globefish Highlights October 2013
GLOBAL FISH ECONOMYaccess in the fisheries sector therefore has become more a question of the exporter’s ability to adhere to regulatory requirements in the importing country rather than an issue of tariffs. In addition, however, the proliferation of new voluntary market-based standards linked to sustainable production, traceability and certification are adding costs to the product with little immediate benefit to producers.
The outlook for the rest of the year is one of firming demand and somewhat higher prices in the run-up to the end-of-year festivities. A number of species continue to be in short supply and prices will remain at a sustained high level. In early 2014 a somewhat weaker market is likely to be seen again.
Whitefish revitalized
During the last month, whitefish, one of the most important commodities in global production
Aquaculture continues to boost overall sup-ply but markets are hesitant to pay current prices pushing quotations down from earlier levels. Fish consumption per capita continues to grow with aq-uaculture in the process of overtaking capture fish-eries as a source of fish supply for direct human con-sumption.
Production and markets
Overall production is boosted by a buoyant aquaculture sector guiding total supply for the year to a new record of 160 million tonnes. Fish consumption is also up, reaching almost 20 kg per capita. This reflects the increased availability of farmed products, but also that increasing volumes of wild species are now going to direct human consumption and less towards fishmeal production.
World trade is also up with both values and volumes entering international markets showing moderate growth. The market situation overall continues to be difficult, in particular in traditional developed country markets. The slightly higher prices of some farmed species therefore are more a symptom of supply shortages rather than strong demand.
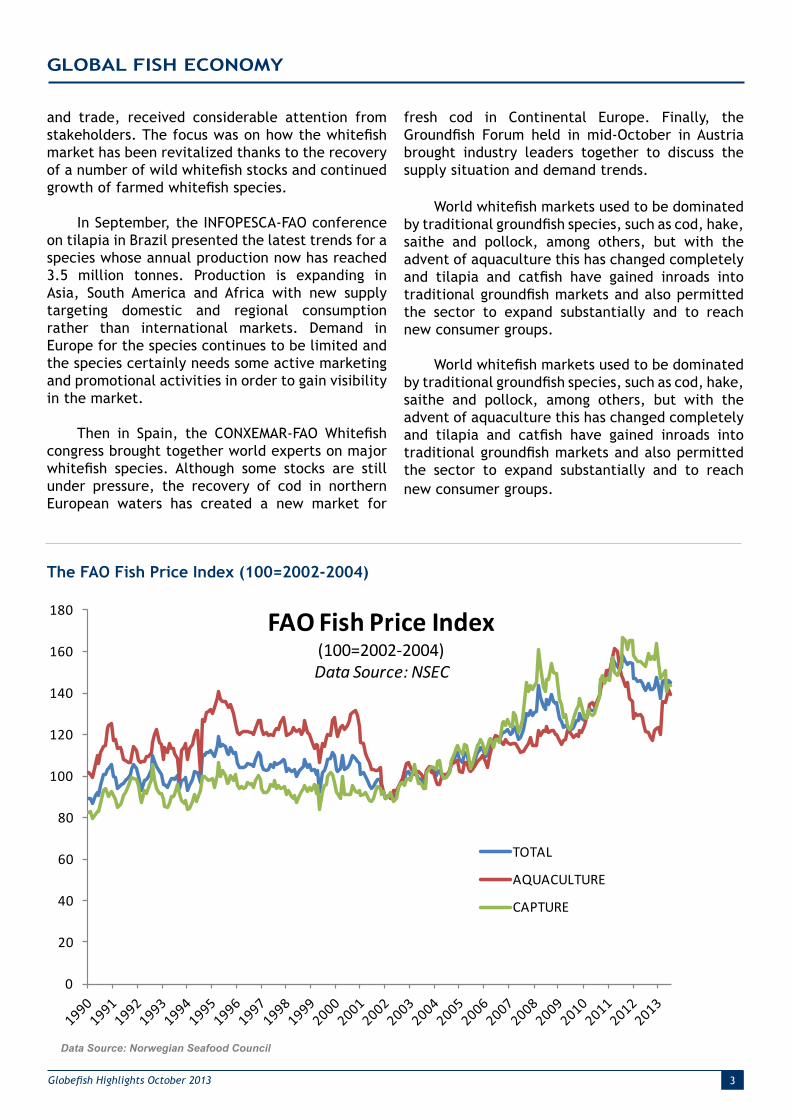
The FAO Fish Price Index shows that overall price levels remain high although they have receded from the top levels of late 2012. Supply problems for farmed salmon and shrimp have boosted aquaculture quotations whereas wild-caught whitefish species, tuna and pelagic species have been weaker. Other farmed species, such as seabass and seabream, were down as supply increases far exceed immediate market requirements.
Economic outlook Markets continue to be influenced by uncertain
economic sentiments in traditional markets. In Japan, a weaker currency has made imports more expensive. In the USA, imports for the first half of the year were flat in both values and volumes. Developing country demand has been more positive with domestic demand boosting both local production, in particular of farmed products, and imports.
It is well-known that import duties on fish and fishery products for exports to developed country markets are generally low or inexistent. Market
World fish markets at a glance 2011 2012 2013 Change:
2013 over 2012 estim. f’cast
million tonnes %
WORLD BALANCE Production 156.2 156.9 160.0 2.0
Capture fisheries 93.5 90.6 90.1 -0.6
Aquaculture 62.7 66.3 69.9 5.4
Trade value (exports USD billion) 128.2 129.3 132.2 2.2
Trade volume (live weight) 57.4 57.6 57.8 0.3
Total utilization 156.2 156.9 160.0 2.0
Food 131.8 135.1 140.4 4.0
Feed 18.3 16.1 15.6 -3.1
Other uses 6.0 5.8 4.0 -30.8
SUPPLY AND DEMAND INDICATORS
Per caput food consumption:
Food fish (kg/year) 18.9 19.2 19.7 2.8
From capture fisheries (kg/year) 9.9 9.8 9.9 1.5
From aquaculture (kg/year) 9.0 9.4 9.8 4.3
Totals may not match due to rounding.
3Globefish Highlights October 2013
GLOBAL FISH ECONOMY
The FAO Fish Price Index (100=2002-2004)
Data Source: Norwegian Seafood Council
and trade, received considerable attention from stakeholders. The focus was on how the whitefish market has been revitalized thanks to the recovery of a number of wild whitefish stocks and continued growth of farmed whitefish species.
In September, the INFOPESCA-FAO conference on tilapia in Brazil presented the latest trends for a species whose annual production now has reached 3.5 million tonnes. Production is expanding in Asia, South America and Africa with new supply targeting domestic and regional consumption rather than international markets. Demand in Europe for the species continues to be limited and the species certainly needs some active marketing and promotional activities in order to gain visibility in the market.
Then in Spain, the CONXEMAR-FAO Whitefish congress brought together world experts on major whitefish species. Although some stocks are still under pressure, the recovery of cod in northern European waters has created a new market for
fresh cod in Continental Europe. Finally, the Groundfish Forum held in mid-October in Austria brought industry leaders together to discuss the supply situation and demand trends.
World whitefish markets used to be dominated by traditional groundfish species, such as cod, hake, saithe and pollock, among others, but with the advent of aquaculture this has changed completely and tilapia and catfish have gained inroads into traditional groundfish markets and also permitted the sector to expand substantially and to reach new consumer groups.
World whitefish markets used to be dominated by traditional groundfish species, such as cod, hake, saithe and pollock, among others, but with the advent of aquaculture this has changed completely and tilapia and catfish have gained inroads into traditional groundfish markets and also permitted the sector to expand substantially and to reach new consumer groups.
0
20
40
60
80
100
120
140
160
180 FAO Fish Price Index(100=2002-2004)Data Source: NSEC
TOTAL
AQUACULTURE
CAPTURE

4 Globefish Highlights October 2013
Lower supply and high prices are the characteristics of international shrimp trade at present
Lower production of farmed shrimp associated with the disease problems in Asia and Latin America during the first half of the year and poor supply forecast for the rest of the year have pushed shrimp prices higher worldwide. US buyers are influencing market prices with strong demand, while Japanese imports are lower because of the weak yen. High shrimp prices have also made import demands lower on European markets.
SHRIMP
Supply
Farmed shrimp supply did not increase much in Asia or in Latin America during the peak production season of May-September. The early mortality syndrome (EMS) problems in Thailand are being addressed but this year’s harvest production almost certainly will be half of last year’s volume. In Viet Nam overall supply during the first half of the year declined because of persistent disease problems in the central provinces and also in the Mekong Delta area. However, vannamei production increased as a result of a shift back to vannamei from black tiger. Production in Indonesia has been relatively stable, but raw material prices have almost doubled compared with last year, as a result of the supply shortage in Southeast Asia and the depreciation of the rupiah against the US dollar. Although good production has been obtained in India, the unrest in Andhra Pradesh state has resulted in serious disruptions in harvesting, transportation and the movements of the labour force, making the supply of raw materials for export processing quite difficult in this, the main shrimp producing state.
In the USA the accumulated domestic landings
up to June totaled 18 366 tonnes, a decrease of 2% in comparison with the same period in 2012.
For the wild caught Argentinean ‘seabob’ shrimp
Shrimp production by main species (2011) (in tonnes)
(Penaeus muelleri), another good year is predicted for 2013. Landings during the January to July 2013 period were above 31 000 tonnes, indicating stable supply this year.
Market trends during the first half of the year
Raw material shortage worldwide kept shrimp prices firm with a temporary weakening during May and June. During the first half of the year, import growth was stagnant in the two large western markets of the EU and USA. In Japan, there was no real recovery in consumer demand as import costs increased, associated with the weak yen. Supply shortage at origins and strong demand from US buyers pushed shrimp prices to record high levels.
Japan
Demand for raw shrimp tempered in Japanese market
The Japanese market is totally dependent on imported supplies of shrimp and the weaker yen, increased landing costs and rising international prices all contribute to a tough situation. Demand for raw shrimp is suffering and preference for processed shrimp imports has increased. Japanese importers must compete with
White Shrimp in Japanese market,origin Indonesia
Source: Infofish ITN
Penaeus vannamei
40%
Giant tiger prawn 12%
Akiami paste shrimp 8%
Northern prawn, 5%
Others, 36%
Source: FAO
5
10
15
20
25
30
Sep-02 Sep-03 Sep-04 Sep-05 Sep-06 Sep-07 Sep-08 Sep-09 Sep-10 Sep-11 Sep-12 Sep-13
USD/kg
31/40
16/20

5Globefish Highlights October 2013
frozen shrimp were also at a record low from Thailand (-33%) from January to July 2013 compared with the same period last year.
Domestic sales prices have increased. By the end of August, wholesale prices of vannamei shrimp were 6% higher than those of July, even though the peak holiday demand was over by mid-August.
In late August, contract prices for Indian headless vannamei increased by nearly 20% to USD 15.70/kg compared with USD 13.10/kg in June. Export prices of black tiger shrimp from India also increased almost at the same rate, reaching USD 15.50/kg, CFR Japan. Competition is also strong from US buyers, while shrimp demand from Europe is improving as well.
No countervailing duties for countries involved
The US International Trade Commission (USITC) ruled four to two in favour of abandoning the imposition of countervailing duties on imported warmwater shrimp from the seven countries that had been accused of subsidizing their shrimp industries. The countries involved were Ecuador, China, India, Viet Nam, Thailand, Indonesia and Malaysia. The USITC did not find that there was a real damage for the US domestic shrimp industry.
The Gulf of Mexico shrimp producers supply only one-tenth of the shrimp consumed in the US. They are yet to decide whether to appeal the case. The producers had argued that fuel costs have hampered competition with shrimp farms in Asia as they “receive government support” and that government subsidies abroad threaten
US buyers but the weak yen makes this difficult. Hence imports slowed down, particularly for raw frozen shrimp. Poor supplies of shell-on shrimp from Thailand and high prices also affected shrimp demand in the supermarket trade. Imports of processed shrimp are a better option in the current situation.
Consumer demand slowed down after the summer holiday but prices increased further in Japanese wholesale trade, as a result of falling domestic inventories and poor supply forecast in producing countries. Export prices have also increased in south and Southeast Asian producing countries as many of these currencies have weakened against the US dollar and raw material prices continue to rise.
Imports
Imports during the period January to June 2013 fell below last year’s as result of lower supplies of raw frozen products. However, processed shrimp imports increased, which is a reflection of the market as domestic reprocessing costs escalate in Japan.
Imports of raw frozen shrimp in the January-June period were 1.38% lower, although supplies increased from Indonesia, Viet Nam and India. Processed shrimp imports went up by 2.18% compared with the same period last year. Supplies of cooked frozen shrimp and sushi shrimp were 6.13% and 32% higher respectively.
Global market trends
According to a recent survey, the import price of vannamei shrimp from Thailand increased by almost 50% (in yen terms) in July compared with the same month last year, which was a result of the weakening yen and rising export prices from the origin. Cumulative imports of raw
SHRIMP
ImportsShrimp (by product): Japan
Jan-Jun2008 2009 2010 2011 2012 2013
(1 000 tonnes)
Live 0.0 0.1 0.1 0.0 0.3 0.5
Fresh/chilled 0.0 0.0 0.0 1.0 - -
Frozen, raw 84.1 85.2 86.4 83.6 85.7 84.5
Dried/salted/in brine 1.1 1.8 1.5 1.6 1.4 1.0
Cooked, frozen 9.1 8.7 9.7 9.8 11.3 11.9
Cooked & smoked 0.1 0.1 0.1 0.2 0.2 0.1
Frozen ebi ** ** ** ** ** 0.2
Prepared/preserved* 20.6 20.9 21.3 23.6 23.2 23.1
Sushi (with rice) 0.0 0.1 0.7 1.5 1.0 1.2
Total 115.0 116.9 119.8 120.4 123.1 122.2*(incl. tempura shrimp ) Source: Japan Customs
ImportsShrimp (frozen): Japan
Jan-Jun2008 2009 2010 2011 2012 2013
(1 000 tonnes)Indonesia 17.9 17.3 15.7 15.1 15.1 16.6
Viet Nam 15.6 14.0 16.3 13.0 14.1 14.8
Thailand 10.4 14.1 17.6 15.8 16.2 12.0
India 9.3 9.2 9.1 8.1 10.1 11.9
China 7.4 5.4 5.5 7.1 6.5 5.3
Argentina 0.4 0.7 0.9 2.3 3.7 4.8
Russia 5.2 4.5 4.4 4.4 3.8 3.7
Malaysia 2.0 2.4 3.1 4.5 3.5 2.5
Myanmar 2.7 3.1 2.1 2.6 2.4 2.2
Greenland 2.6 3.9 2.2 1.9 1.5 2.0
Canada 3.8 3.9 3.4 2.9 2.9 2.0
Bangladesh 1.5 1.5 1.4 1.2 1.2 1.9
Others 5.0 5.3 4.7 4.9 4.9 4.8
Total 84.1 85.2 86.4 83.7 85.7 84.6Source: Japan Customs

6 Globefish Highlights October 2013
to destroy the domestic shrimp business.
USA - Imports
In general, shrimp supplies to the US market are lower both because of EMS in Asia and the high occurrence of white spot disease in Latin American countries, mainly Mexico.
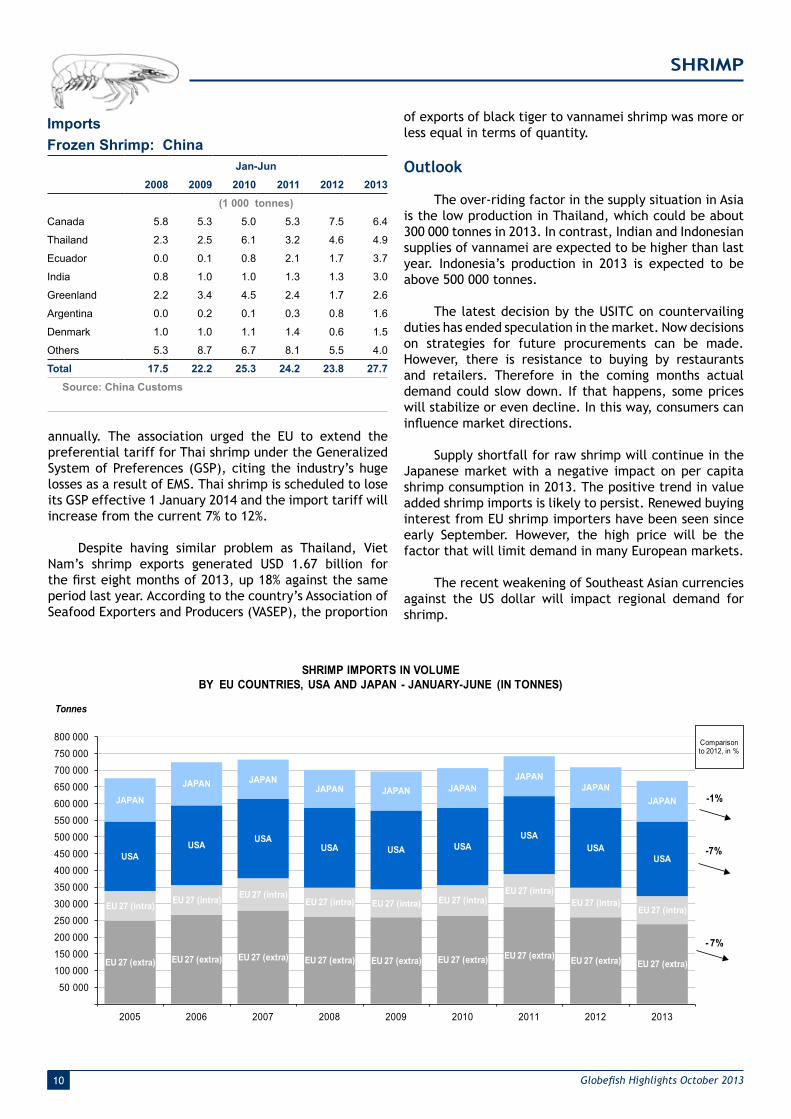
The supply shortfall from Thailand was 32% in the January to June period against the same period last year. Ecuador is still in second place but the difference has narrowed considerably this year. Indian supplies during this period increased by 82%, moving from 9th place in 2009 to 3rd this year in half-yearly imports. Despite the import surge from India, overall import during the first half of the year was nearly 16 000 tonnes or 7% down on last year. However, in terms of price and volume of imports, the US continues to dominate international shrimp trade.
Europe - Quiet market for the first half of the year
European shrimp markets were quiet during the first six months of the year. Sluggish domestic demand and high shrimp prices because of short supplies prompted many European buyers to withdraw from the international market as they were unable to compete with buyers from other countries. Buying activities were mainly focused
SHRIMP
on immediate needs. Only in the last two months have concerted efforts been made to buy consistently and pay competitive prices to refill depleted inventories.
The slow demand is reflected in lower shrimp imports into the EU. For the first six months of the year total shrimp imports into the EU-27 declined by 7% while shipments from the third countries (extra-trade) declined by 7.7% on a year on year basis. There were sharp drops in supplies from Thailand (-33.3%), China (-12.4%), Ecuador (-5.7%) and also Viet Nam (-4.5%). Increased supplies from India (+12.5%), Greenland (+7.4%) and Denmark (+11.2%) were unable to offset the declines.
Shrimp imports into major European markets also posted negative growths except to Italy, which grew marginally by almost 4% as more shipments were recorded from Spain (+13.9%) and Argentina (+36.8%). Imports from
Shrimp prices (16-20 count) in main wholesale markets, USA and Japan
Source: Infofish ITN
3
4
5
6
7
8
Aug-03 Aug-04 Aug-05 Aug-06 Aug-07 Aug-08 Aug-09 Aug-10 Aug-11 Aug-12 Aug-13
USD/lbGulf brown, New York
Indian white, Tokyo
ImportsShrimp: USA
Jan-Jun2008 2009 2010 2011 2012 2013
(1 000 tonnes)Thailand 71.1 73.4 81.4 77.0 60.1 41.0
Ecuador 31.8 33.3 35.8 35.0 44.1 39.1
India 5.5 8.6 7.3 14.9 20.4 37.1
Indonesia 43.2 40.1 29.4 35.3 37.4 35.8
Viet Nam 15.1 14.6 14.1 16.9 16.8 18.9
China 23.7 17.5 18.8 16.2 16.2 16.1
Malaysia 10.4 7.4 9.1 9.2 10.9 8.4
Mexico 7.8 12.4 10.5 6.7 10.8 7.3
Peru 4.1 5.2 4.2 4.9 4.6 5.5
Guyana 5.2 5.8 4.3 4.0 6.1 4.8
Others 19.4 18.1 14.1 12.3 12.5 9.8
Total 237.311 236.3 229.0 232.4 239.8 223.8Source: NMFS
ImportsShrimp: USA
Jan-Jun
Product
2011 2012 2013
1 000 tonnes
million USD
1 000 tonnes
million USD
1 000 tonnes
million USD
Peeled frozen 84.5 808.3 90.5 821.2 93.2 844.1
Other frozen 36.7 343.6 33.8 330.8 27.0 272.5
Breaded 20.5 134.1 18.4 125.1 16.4 109.2
Other preparations 2.0 11.2 1.3 7.3 1.1 6.4
Headless shell-on frozen
All sizes 86.9 754.6 94.7 777.1 84.6 773.4
< 15 6.4 98.8 8.4 123.1 7.3 112.2
15/20 6.6 79.6 8.7 87.3 6.5 69.7
21/25 12.4 127.5 11.9 104.2 12.8 129.7
26/30 12.9 112.5 14.8 123.6 14.5 134.8
31/40 17.4 133.2 17.7 128.8 16.4 136.6
41/50 10.8 73.3 11.8 79.7 11.7 89.4
51/60 11.0 74.1 10.2 65.0 8.1 56.2
61/70 5.4 33.3 6.3 39.0 4.1 26.7
> 70 3.9 22.3 4.7 26.6 3.1 18.3
Other products 1.8 17.6 1.2 7.8 1.5 19.1
Total 232.4 2 069.0 239.8 2 069.3 223.8 2 024.8Source: NMFS

7Globefish Highlights October 2013
SHRIMP
Ecuador, the largest supplier, went down slightly by 2.1%.
Germany is highly dependent on shrimp supplies from Asia and the most affected country as German imports dropped sharply by more than 16% with lower shipments from Thailand (-27.8%), Viet Nam (-23.4%) and Bangladesh (-21.6%). Only India shipped more to this market (+9%).
India and Bangladesh are two major Asian producing countries that have not been affected by the EMS problem and they generally did well in all major markets. Imports from India and Bangladesh to the UK market increased sharply by 13.5% and 27.6% respectively, but shipments from Thailand, the number one supplier, dropped by 24.5%. Shrimp imports into France also declined marginally by 1.6% this year largely as a result of lower supply from Thailand (-47.1%), which could not be compensated for by increased supplies from Ecuador (+21.9%), Bangladesh (+44.4%), India (+3.2%) and also Viet Nam (+4.8%).
The largest shrimp market in the EU, Spain, continued
Imports/ExportsShrimp: EU-27 (by country of origin)
Jan-Jun2008 2009 2010 2011 2012 2013
(1 000 tonnes)IMPORTSEcuador 37.5 32.7 37.0 48.6 44.0 41.5
Greenland 33.9 32.9 31.8 34.7 28.4 30.5
India 26.1 29.7 27.1 28.9 26.4 29.7
Denmark 24.9 22.9 24.7 22.4 19.7 21.9
Thailand 13.7 18.9 28.7 28.6 24.9 16.6
Netherlands 17.3 16.9 18.0 22.1 19.9 16.1
Bangladesh 14.4 16.1 16.8 17.5 15.7 15.7
China 18.7 16.1 17.6 20.0 17.8 15.6
Argentina 8.5 13.9 11.5 17.9 13.8 14.9
Viet Nam 11.9 10.3 15.3 20.3 15.4 14.7
Canada 16.2 15.7 14.3 14.1 16.5 11.4
Spain 7.5 8.8 10.2 10.0 12.5 10.6
Belgium 11.1 10.4 10.9 13.8 11.1 10.5
Others 106.8 97.8 92.4 89.0 80.0 72.4
Grand Total 348.4 343.1 356.4 387.9 346.4 322.1Total Intra Imports 87.2 85.4 92.2 98.4 87.7 83.2Total Extra Imports 261.3 257.7 264.2 289.5 258.7 238.9EXPORTSGrand Total 171.3 167.9 168.2 180.6 156.9 147.9Total Intra Exports 119.2 119.7 121.9 136.8 120.3 114.1Total Extra Exports 52.1 48.2 46.3 43.9 36.6 33.9
Source: EUROSTAT
ImportsShrimp: Italy
Jan-Jun2008 2009 2010 2011 2012 2013
(1 000 tonnes)Ecuador 8.6 9.2 10.6 11.0 9.5 9.3
Spain 1.9 2.7 2.4 3.0 3.6 4.1
Argentina 1.9 2.0 2.8 3.0 1.9 2.6
India 3.0 2.3 2.9 3.3 2.5 2.6
Denmark 3.1 2.1 2.3 2.1 1.3 1.7
Belgium 0.7 0.8 0.6 0.6 0.4 1.1
Netherlands 1.5 1.6 2.0 2.6 2.1 1.1
Viet Nam 0.9 0.6 1.0 1.2 0.5 0.9
Others 7.5 6.7 6.5 6.4 4.1 3.6
Total 28.9 28.1 31.0 33.3 25.9 26.9Source: ISTAT
ImportsShrimp: Germany
Jan-Jun2008 2009 2010 2011 2012 2013
(1 000 tonnes)Thailand 4.4 5.3 6.3 5.3 5.4 3.9
Viet Nam 3.8 3.3 3.8 6.7 4.7 3.6
Netherlands 3.0 2.9 3.1 3.7 3.2 3.0
Bangladesh 1.3 3.3 2.6 2.8 3.7 2.9
India 3.2 3.3 2.7 2.2 2.2 2.4
Belgium 2.7 1.8 2.5 2.2 1.8 1.8
UK 1.2 0.9 1.6 1.3 1.3 1.3
Others 6.7 6.7 6.3 6.8 6.5 5.1
Total 26.1 27.4 28.8 30.8 28.7 24.0Source: Germany Customs
ImportsShrimp: UK
Jan-Jun2008 2009 2010 2011 2012 2013
(1 000 tonnes)Thailand 3.3 4.7 6.5 8.1 9.4 7.1
India 3.9 3.5 3.4 3.5 3.7 4.2
Denmark 4.5 4.7 4.6 4.0 3.3 3.9
Bangladesh 2.2 2.8 2.8 3.0 2.9 3.7
Canada 1.6 2.3 3.1 3.4 3.8 2.8
Viet Nam 1.4 1.3 2.2 2.9 2.4 2.4
Indonesia 4.3 3.7 3.5 3.7 1.6 2.0
Iceland 4.4 3.7 3.5 2.7 2.7 1.9
China 0.6 0.4 1.2 1.5 1.9 1.7
Others 7.7 6.4 5.6 5.9 6.0 5.2
Total 33.9 33.5 36.3 38.7 37.8 34.9Source: Her Majesty’s Revenue & Customs

8 Globefish Highlights October 2013
SHRIMP
ImportsShrimp: France
Jan-Jun2008 2009 2010 2011 2012 2013
(1 000 tonnes)Ecuador 10.2 7.9 12.3 12.9 13.7 16.7
India 4.4 5.5 5.9 5.9 6.3 6.5
Netherlands 2.9 3.0 2.8 3.0 3.3 3.4
Venezuela 1.7 1.7 1.8 1.7 2.8 2.8
Madagascar 4.2 3.2 3.1 2.8 2.9 2.6
Bangladesh 1.7 1.5 2.3 2.5 1.8 2.6
Viet Nam 1.7 1.5 2.6 2.3 2.1 2.2
Spain 0.8 1.3 2.7 2.2 2.8 2.0
Thailand 1.5 2.6 4.4 4.6 3.4 1.8
Belgium 2.3 2.1 2.1 3.0 2.2 1.3
Others 15.2 14.2 12.8 8.1 9.0 7.4
Total 46.6 44.4 52.8 48.9 50.3 49.5Source: Direction Nationale des Statistiques du CommerceExtérieur – DNSCE
ImportsShrimp: Spain
Jan-Jun2008 2009 2010 2011 2012 2013
(1 000 tonnes)IMPORTSArgentina 6.2 11.6 8.3 14.4 11.4 11.1
Ecuador 11.2 7.7 8.3 15.4 13.5 10.7
China 13.1 10.6 10.1 11.6 9.4 7.9
Senegal 1.4 0.8 0.7 1.7 2.4 2.4
Morocco 3.8 2.9 2.2 2.3 2.2 1.9
Belgium 1.8 1.8 1.7 2.0 1.3 1.6
Netherlands 1.6 1.7 1.4 1.8 1.4 1.4
Tunisia 0.6 0.5 1.0 1.2 1.2 1.4
Nicaragua 0.8 1.5 0.9 1.0 1.5 1.3
Peru 1.0 0.8 0.8 1.3 1.3 1.3
Others 17.8 17.2 19.3 20.3 12.3 10.3
Total 59.4 57.3 54.6 72.9 58.0 51.3EXPORTSItaly 3.7 4.9 4.9 8.9 6.7 7.5
France 1.9 3.9 3.2 3.0 4.5 3.3
Portugal 3.2 3.5 3.5 3.5 3.7 3.0
Greece 0.6 0.5 0.6 0.9 1.0 0.9
Others 1.4 1.6 0.9 1.7 1.9 1.7
Total 10.7 14.6 13.1 17.9 17.7 16.3Source: Agencia Tributaria
ImportsShrimp: Denmark
Jan-Jun2008 2009 2010 2011 2012 2013
(1 000 tonnes)IMPORTSGreenland 32.4 31.6 30.8 33.8 27.5 29.7
Canada 11.5 10.2 7.0 6.3 9.7 7.1
USA 0.2 0.1 0.3 0.4 1.1 1.1
Iceland 2.2 0.6 0.9 1.0 0.7 0.9
Viet Nam 0.5 0.6 0.7 0.9 1.0 0.8
China 0.7 0.2 0.3 0.4 0.6 0.7
Others 7.0 7.0 5.8 4.2 4.0 4.7
Total 54.5 50.3 45.9 47.0 44.6 45.0EXPORTSSweden 9.4 9.8 9.2 10.8 10.6 11.2
Russia 17.3 10.6 7.3 4.6 3.7 2.9
UK 6.3 6.2 5.9 5.1 4.4 4.0
Norway 3.3 3.8 3.9 4.0 3.5 3.8
Germany 4.2 3.6 3.2 3.4 3.3 3.2
China 3.5 3.8 2.8 3.7 2.4 3.4
Italy 4.1 2.6 2.7 2.5 2.3 3.6
Netherlands 3.4 2.7 2.5 2.2 1.4 1.4
Morocco 0.6 2.1 2.4 1.8 1.1 2.7
France 1.8 1.6 1.5 1.3 0.9 1.0
Japan 1.9 1.5 1.4 1.4 0.9 0.8
Others 9.5 7.6 7.8 9.5 7.5 7.9
Total 65.4 56.0 50.6 50.3 42.1 45.9Source: EUROSTAT
on a downward trend. Imports declined by 11.6% while exports fell almost 8% in the January-June period this year. Supplies from all sources declined with shipments from Argentina, Ecuador and China, the three largest suppliers, falling by 2.6%, 20.7% and 16% respectively.
Supply shortages in Asia have benefited Denmark, the main shrimp producing/exporting country in the EU, to some extent. Exports from Denmark went up by 9.0% while imports, mainly of raw material for re-processing, were slightly up by 1% with more supplies coming from Greenland (+8%).
Imports by both the Netherlands and Belgium fell by 21.7% and 15.3% respectively. Re-export activities from these two countries were also affected. During the reporting period shrimp exports from the Netherlands declined by 15.5% while from Belgium the drop was 11.1%.
Asia - Demand from China continues to grow
Buyers from China have been actively buying shrimp from major producing countries in Asia, particularly from India. Purchases were made at competitive prices, matching those paid by US buyers. As a result, shrimp imports into China for January-June this year were

9Globefish Highlights October 2013
SHRIMP
Graphs source: European Price Report
Imports/ExportsShrimp: Netherlands
Jan-Jun2008 2009 2010 2011 2012 2013
(1 000 tonnes)IMPORTSMorocco 2.6 3.5 4.0 4.1 4.5 3.1
Belgium 1.4 1.7 2.3 4.3 3.7 3.1
Germany 2.6 3.8 3.9 4.9 3.8 2.8
India 3.6 5.2 4.7 3.3 2.9 2.8
Bangladesh 1.1 2.6 2.9 2.5 2.5 1.9
Viet Nam 1.1 0.8 0.9 1.9 2.0 1.5
Indonesia 2.7 2.8 2.8 2.1 1.6 1.4
Denmark 2.3 1.8 2.2 1.8 1.3 1.0
China 0.9 1.6 1.0 0.8 0.9 1.0
Thailand 1.2 1.9 1.6 1.4 1.4 1.0
Others 4.9 6.1 4.5 6.8 6.4 4.7
Total 24.5 31.9 30.8 33.9 30.9 24.2EXPORTSMorocco 9.2 12.1 13.3 13.7 11.8 10.2
Germany 4.5 5.0 5.5 6.8 5.8 5.3
Belgium 6.0 6.4 6.9 7.5 6.0 5.1
France 4.6 6.8 7.6 6.8 5.9 4.5
Spain 1.3 2.4 1.0 0.8 1.2 1.0
Italy 1.1 0.9 1.4 1.8 1.4 0.8
Others 2.7 3.3 2.4 1.4 1.6 1.5
Total 29.3 36.8 38.0 39.0 33.6 28.4Source: EUROSTAT
Imports/ExportsShrimp: Belgium
Jan-Jun2008 2009 2010 2011 2012 2013
(1 000 tonnes)IMPORTSIndia 5.2 6.0 4.1 7.4 5.8 8.0
Netherlands 5.8 5.6 6.1 9.0 8.4 5.4
Bangladesh 7.1 5.0 4.9 5.7 3.6 3.1
Viet Nam 1.4 1.3 2.2 2.0 1.3 1.9
Ecuador 4.4 4.1 2.5 5.6 3.7 1.3
Others 10.8 8.8 9.4 8.6 5.9 4.7
Total 34.7 30.7 29.2 38.2 28.7 24.3EXPORTSFrance 10.4 9.5 8.4 13.0 8.6 5.9
Netherlands 3.8 2.8 3.1 4.8 4.6 3.7
Spain 2.9 2.6 2.6 2.7 2.5 2.7
Germany 2.5 2.6 3.1 2.7 2.6 2.5
Italy 0.8 1.0 0.6 0.7 0.4 1.1
UK 4.1 2.3 1.7 1.1 0.5 1.1
Others 3.3 2.9 2.8 3.3 3.3 3.1
Total 27.8 23.7 22.3 28.3 22.6 20.1Source: EUROSTAT
10.10
3.505.006.508.009.50
11.00
Sep-
08
Jan -
09
May
-09
Sep-
09
Jan -
10
May
-10
Sep-
10
Jan-
11
May
-11
Sep-
11
Jan-
12
May
-12
Sep-
12
Jan-
13
May
-13
Sep-
13
40-50 pc/kg
USD/kg
Whiteleg shrimp - Penaeus vannameiHead-on, shell-on, origin: Ecuador (fob)
11.40
7.20
5.20
3.05.07.09.0
11.013.0
Sep-
09
Dec
-09
Mar
-10
Jun-
10
Sep-
10
Dec
-10
Mar
-11
Jun-
11
Sep-
11
Dec
-11
Mar
-12
Jun-
12
Sep-
12
Dec
-12
Mar
-13
Jun-
13
Sep-
13
Black Tiger - In Europe, origin: Bangladesh8-12 16-2031-40USD/kg
significantly up by 16.4% with more supplies coming from both Asian and also Latin American sources. Supplies from Ecuador and India increased by 117.6% and 130.8% respectively, while from Greenland imports were up by around 53%. Canada remained the largest supplier to China but shipments dropped by 14.7% this year.
Though overseas demand has been very strong and prices have been rising rapidly, Indian shrimp packers have had to face environmental problems as well as political challenges. Raw materials shortage because of diminished crops, heavy rains, white spot disease and the on-going political problems in Andhra Pradesh have badly affected the delivery of shrimp from farms to processing plants, as the transportation systems were also paralyzed. As a result, ex-farm prices of vannamei shrimp in Andhra Pradesh reportedly jumped to INR 400-500/kg (USD 6.5-8.2) in August from INR 200-300/kg (USD 3.3-4.9/Kg) last year for the count 30/kg.
The Thai Shrimp Association said that there have been encouraging signs that EMS is abating and that shrimp supply in the second half of this year is expected to improve. Thai shrimp companies have been importing raw materials from other countries, such as Ecuador and India, to keep their processing plants running. The association predicted that shrimp exports from Thailand may drop by 50% this year because of the lower harvest. In the past Thailand shipped an average of 350 000 tonnes
10 Globefish Highlights October 2013
SHRIMP
annually. The association urged the EU to extend the preferential tariff for Thai shrimp under the Generalized System of Preferences (GSP), citing the industry’s huge losses as a result of EMS. Thai shrimp is scheduled to lose its GSP effective 1 January 2014 and the import tariff will increase from the current 7% to 12%.
Despite having similar problem as Thailand, Viet Nam’s shrimp exports generated USD 1.67 billion for the first eight months of 2013, up 18% against the same period last year. According to the country’s Association of Seafood Exporters and Producers (VASEP), the proportion
ImportsFrozen Shrimp: China
Jan-Jun2008 2009 2010 2011 2012 2013
(1 000 tonnes)Canada 5.8 5.3 5.0 5.3 7.5 6.4
Thailand 2.3 2.5 6.1 3.2 4.6 4.9
Ecuador 0.0 0.1 0.8 2.1 1.7 3.7
India 0.8 1.0 1.0 1.3 1.3 3.0
Greenland 2.2 3.4 4.5 2.4 1.7 2.6
Argentina 0.0 0.2 0.1 0.3 0.8 1.6
Denmark 1.0 1.0 1.1 1.4 0.6 1.5
Others 5.3 8.7 6.7 8.1 5.5 4.0
Total 17.5 22.2 25.3 24.2 23.8 27.7Source: China Customs
of exports of black tiger to vannamei shrimp was more or less equal in terms of quantity.
Outlook
The over-riding factor in the supply situation in Asia is the low production in Thailand, which could be about 300 000 tonnes in 2013. In contrast, Indian and Indonesian supplies of vannamei are expected to be higher than last year. Indonesia’s production in 2013 is expected to be above 500 000 tonnes.
The latest decision by the USITC on countervailing duties has ended speculation in the market. Now decisions on strategies for future procurements can be made. However, there is resistance to buying by restaurants and retailers. Therefore in the coming months actual demand could slow down. If that happens, some prices will stabilize or even decline. In this way, consumers can influence market directions.
Supply shortfall for raw shrimp will continue in the Japanese market with a negative impact on per capita shrimp consumption in 2013. The positive trend in value added shrimp imports is likely to persist. Renewed buying interest from EU shrimp importers have been seen since early September. However, the high price will be the factor that will limit demand in many European markets.
The recent weakening of Southeast Asian currencies against the US dollar will impact regional demand for shrimp.
EU 27 (extra) EU 27 (extra) EU 27 (extra) EU 27 (extra) EU 27 (extra) EU 27 (extra) EU 27 (extra) EU 27 (extra) EU 27 (extra)
EU 27 (intra) EU 27 (intra) EU 27 (intra)EU 27 (intra) EU 27 (intra) EU 27 (intra)
EU 27 (intra)EU 27 (intra)
EU 27 (intra)
USAUSA USA
USA USA USAUSA
USAUSA
JAPAN
JAPAN JAPANJAPAN JAPAN JAPAN
JAPANJAPAN
JAPAN
50 000100 000150 000200 000250 000300 000350 000400 000450 000500 000550 000600 000650 000700 000750 000800 000
2005 2006 2007 2008 2009 2010 2011 2012 2013
SHRIMP IMPORTS IN VOLUME BY EU COUNTRIES, USA AND JAPAN - JANUARY-JUNE (IN TONNES)
Tonnes
Comparison to 2012, in %
-7%
- 7%
-1%

11Globefish Highlights October 2013
TUNA
Overall 2013 tuna landings lower than last year
Japan, the largest sashimi tuna market, has become less active with lower imports during the first half of the year. The canned tuna market fared better with improved imports by the European Union and the USA. Canned tuna demand has also increased in many non-conventional markets.
In the Western Pacific, the 4-month FAD fishing ban remains in force until 31 October and since the start on 1 July catches have been reduced but the price of frozen skipjack for delivery to Thailand dropped to USD 1 900/tonne in July, which was the lowest since January 2012; it weakened further to USD 1 800/tonne in August and moved up to USD 1 920/tonne (CFR Bangkok) in mid-September.
In the Eastern Pacific tuna supplies to canners in Ecuador have dropped significantly from the coastal and deep-sea fisheries since late July because of adverse weather conditions, coupled with strong currents and colder ocean water temperatures. The IATTC fishing closed period was also in place from 29 July to 28 September and 35% of the fishing fleet was not fishing in that area. The remaining vessels will observe the second closure from 18 November 2013 to 18 January 2014. Skipjack stock volumes are good and Manta prices have levelled off at USD 2 050/tonne ex vessel.
In the Indian Ocean skipjack catches have improved and this has allowed the transhipment price from the Atlantic to drop to EUR 1 500/tonne FOB Seychelles compared with EUR 1 620/tonne recorded in August. Yellowfin volumes have not changed much, resulting in a slightly lower price of EUR 2 260/tonne, FOB Seychelles.
In the Atlantic Ocean, fishing off the African coast also remains favourable; the ex vessel price of skipjack in Abidjan dropped to EUR 1 490/tonne and to EUR 2 400/tonne for yellowfin.
Skipjack tuna 38%
Yellowfin tuna 18%Bigeye tuna
6%
Albacore 3%
Atlantic bluefin tuna 0.1%
Pacific bluefin tuna 0.1%
Others 33%
Tuna production by species (2011) (in tonnes)
Source: FAO
A similar price weakening was seen in Europe. In Spain, skipjack is being traded for EUR 1 630/tonne CFR, quite a substantial drop compared with EUR 1 700/tonne in August. As for yellowfin, prices in Italy are stable at EUR 2 600-2 650/tonne CFR, but Spanish prices have contracted sharply to EUR 2 450 CFR/tonne.
Japan
During the first half of the year, tuna landings in Japan posted a slight rise of 1.4% as a result of a significant increase in coastal landings of fresh bluefin and skipjack.
In August, there were unusually large landings of small sized bluefin (20-30 kg/per piece) on the Pacific Ocean side of Hokkaido, which were a result of an unexpected warmwater current in that region.
LandingsTuna: Japan
Jan-Jun2008 2009 2010 2011 2012 2013
(1 000 tonnes)Bluefin Fresh 1.9 0.6 0.6 1.1 0.6 1.0
Frozen 0.3 0.0 0.5 0.3 0.3 0.2
Albacore Fresh 23.9 26.6 20.8 23.4 30.3 28.0
Frozen 1.8 6.5 3.4 4.4 10.2 11.4
Bigeye Fresh 3.3 3.0 1.6 1.4 1.6 1.3
Frozen 11.0 9.1 8.1 8.7 10.9 12.3
Yellowfin Fresh 4.8 4.7 4.6 3.6 3.1 3.3
Frozen 4.7 3.2 2.5 3.2 17.3 8.5
Skipjack Fresh 20.4 20.7 19.6 20.8 16.3 28.6
Frozen 114.8 106.8 101.7 101.2 102.9 101.8
Total Fresh 64.4 58.6 47.3 50.3 51.9 62.3
Frozen 132.5 124.7 116.2 117.8 141.7 134.1
Grand Total 196.9 183.3 163.5 168.0 193.7 196.4Source: INFOFISH

12 Globefish Highlights October 2013
Demand for fresh chilled sashimi tuna has weakened on the Japanese market. Generally demand for sashimi tuna improves from beginning of autumn but this year sales were still down as a result of the warm weather, which is not favourable for raw fish consumption. Tuna prices, however, remain firm while supplies of air-flown tuna were low because of bad weather conditions in local and foreign fishing grounds during August and September. Recently one of the large department stores in Japan started to promote the sale of MEL Japan (Marine Eco-label Japan) certified local skipjack through its outlets.
In the second half of 2013, the seasonal catches for sanma or pike mackerel began to appear on the market; this is a competitor for fresh tuna in autumn.
In contrast to sashimi tuna, retail demand for red meat quality bigeye tuna remains high for Western Pacific origin fish because the quality is good. Lower quality tuna of Indian Ocean origin (caught off Somalia last year) is less popular in spite of lower prices and the market is showing a preference for better quality products. This year, supplies of frozen bigeye tuna are expected to be lower than last year and prices are already on the rise.
Kaiten sushi restaurant operators, however, remain loyal to Mexican and Australian bluefin tuna.
During the first half of the year, overall tuna imports (excluding canned tuna) remained below last year’s level in Japan. Imports of fresh and frozen tuna, including loins, totalled 113 162 tonnes compared with 129 410 tonnes imported in the same period in 2012.
Notably, imports of all types of frozen tuna, except albacore, remained below last year’s levels during the January to June period in 2013. Supply shortfall for frozen skipjack was particularly high at - 47%.
Despite the weakening yen, imports of red meat quality frozen tuna loins were stable during the first half of the year. Supplies during this period increased from the Republic of Korea and China but dropped significantly
Coldstorage holdingsTuna: Japan
Source: INFOFISH Trade News
TUNA
ImportsFresh/chilled tuna: Japan
Jan-Jun2008 2009 2010 2011 2012 2013
(1 000 tonnes)Yellowfin 8.0 8.3 7.9 7.6 6.5 5.1
Bigeye 7.5 7.8 5.8 5.6 6.6 5.6
Bluefin 1.9 2.8 2.2 1.2 1.6 2.3
S. bluefin 0.5 1.4 0.8 0.6 0.7 0.9
Albacore 0.1 0.1 0.0 0.0 0.0 0.0
Skipjack 0.0 0 0.0 0.0 0.0 0.0
Total 18.0 20.4 16.7 15.0 15.4 13.9Source: INFOFISH
Yellowfin
Bigeye
Albacore
Skipjack
Others
0
20
40
60
80
100
120
2002 2003 2004 2005 2006 2007 2008 2009 2010 2011 2012 2013
1000 tonnes
ImportsFrozen tuna: Japan
Jan-Jun2008 2009 2010 2011 2012 2013
(1 000 tonnes)Yellowfin 27.0 22.9 24.8 22.7 28.3 20.2
Bigeye 45.0 39.6 41.6 32.1 42.2 41.2
Skipjack 16.9 32 32.5 20.4 15.8 8.5
S. bluefin 0.0 1.0 1.2 0.5 0.6 0.7
Albacore 1.9 3.1 7.5 9.4 5.9 7.9
N. Bluefin 3.9 3.7 0.9 1.6 3.2 1.4
Total 94.7 102.3 108.5 86.7 96.2 79.9Source: INFOFISH
from Fiji and also from Indonesia. Viet Nam was the only source that increased supply from Southeast Asia. From south Asia, India appeared as a new source of supplies (although the quantity is still small), whereas frozen loin supply from Sri Lanka was down. Imports of frozen bluefin loins increased during the first half of the year, as more whole fish are being processed into frozen loin for longer shelf life.
USA
There was a marginal decline in air-flown fresh tuna imports during the first half of the year although the import value increased from USD 107 million to USD 110 million, which could be linked with increased imports of high value Pacific bluefin tuna. Total imports of non-canned tuna during this time were 122 810 tonnes valued at USD 250 million compared with 143 075 tonnes and USD 232 million during the same period last year. Nearly 80% of these were frozen loins and steaks.

13Globefish Highlights October 2013
TUNA
are engaging in promoting canned tuna products as well as introducing new premium and convenience products.
As an indication of recovering domestic demand, canned tuna imports into the USA continued to show strong growth this year. During the first six months of 2013 imports of canned (and pouch) tuna grew by 12.2% in volume and 17.8% in value against the same period of last year. Significant growth was recorded for imports of popular light meat tuna in brine (+21.1%) and also more expensive pouched tuna (+7.8%). Thailand remained the largest supplier and has shipped almost 54 000 tonnes so far this year, up 26.7%. Almost 83% of the total canned tuna imported into the USA came from ASEAN countries and shipments from this group increased by around 12% this year.
Suppliers are also generally more optimistic about the USA market this year. Chicken of the Sea International (COS), expects revenue growth of 8% and volume growth of 2% this year. Its competitor, StarKist recently launched a newly branded “Made in America” canned Chunk Light Tuna in Water, and Chunk Light Tuna in Oil, prepared and packaged in American Samoa. Bumble Bee has released the autumn edition of its BeeWell for Life ebook – these are aimed at providing seasonally appropriate fitness tips and encouraging healthy living, as well as containing
ImportsTuna pouches: USA
Jan-Jun2008 2009 2010 2011 2012 2013
(1 000 tonnes)Thailand 10.8 11.5 11.7 9.6 9.6 10.3
Ecuador 6.6 5.2 6.5 5.8 5.5 7.0
Others 2.6 2.8 4.0 3.3 2.4 1.7
Total 20.0 19.5 22.2 18.7 17.5 19.0Source: NFMS
ImportsCanned tuna (excl. pouches): USA
Jan-Jun2008 2009 2010 2011 2012 2013
(1 000 tonnes)Thailand 32.8 36.7 56.0 51.5 32.9 43.7
Viet Nam 8.5 7.1 11.5 12.0 10.5 10.4
Philippines 16.2 14.8 11.1 14.1 11.8 9.1
China 2.1 3.4 2.8 4.1 4.3 5.6
Indonesia 9.0 7.7 8.3 6.3 4.9 5.0
Others 6.0 3.4 3.5 5.7 4.4 3.8
Total 74.6 73.1 93.2 93.6 68.8 77.6Source: NFMS
Demand for fresh chilled sashimi tuna remained stable in the USA, which is now the second largest market for non-canned tuna products.
Canned tuna: positive trends continue in major markets
The lower price of USD 2 000/tonne CFR Bangkok, at which skipjack has been traded since early July, has softened canned tuna prices by 2-5% in recent weeks. Demand for canned tuna in European and USA markets continues to improve. Packers in Asia reported better sales in the second quarter of 2013 as customers used up low-priced inventories.
USA
The confidence of US consumers has improved slightly as a result of positive economic indications and there are signs of willingness to spend more on products that meet changing tastes and provide value for money. To revive demand for canned tuna major tuna packers
ImportsFresh Tuna: USA
Jan-Jun2008 2009 2010 2011 2012 2013
(1 000 tonnes)Yellowfin 8.7 7.6 8.1 8.3 8.3 8.0
Bigeye 3.0 2.7 2.5 1.5 2.0 2.0
Albacore 0.3 0.4 0.2 0.3 0.4 0.4
Bluefin 0.2 0.2 0.3 0.2 0.2 0.3
Skipjack 0.0 0.0 0.0 0.0 0.0 0.0
Others 0.2 0.1 0.2 0.2 0.2 0.3
Total 12.4 11.0 11.3 10.5 11.1 11.0Source: NMFS
ImportsTuna loins: USA
Jan-Jun2008 2009 2010 2011 2012 2013
(1 000 tonnes)Thailand 8.0 4.7 13.2 14.2 8.6 13.3
Fiji 5.2 5.8 6.3 4.2 4.0 5.7
China 0.2 0.0 0.0 2.0 5.8 5.2
Mauritius 3.5 3.4 2.3 3.4 2.9 4.7
Ecuador 0.3 0.0 0.1 0.0 1.3 0.7
Trin & Tob 5.1 5.1 4.2 3.2 0.0 0.0
Others 1.1 2.3 7.3 4.9 8.2 6.0
Total 23.4 21.3 33.5 31.9 30.8 35.6Source: NFMS

14 Globefish Highlights October 2013
recipes using Bumble Bee’s canned products, including tuna.
Meanwhile the National Oceanic and Atmospheric Administration (NOAA) approved the new Dolphin Protection Consumer Act that came into effect on 13 July this year. The ruling includes a period of education and outreach to provide the fishing industry with additional guidance on enforcement up to 1 January 2014. NOAA said the new act is compliant with a WTO ruling and it requires that any canned tuna sold in the US with a Dolphin-Safe label must have a certification that no dolphins were killed or seriously injured in the process, no matter what gear type was used or where the tuna was caught.
Europe
On the whole consumer sentiment has improved and retailers have reported better sales of canned tuna in recent months. Innovative products and promotions were undertaken by major packers, and these, coupled with the growing popularity of private (supermarket) brands, have contributed to increasing imports. For the first 6 months of the year, canned tuna imports into the EU-27 (external) posted positive growth of 13.6% in volume and 31.8% in value on a year on year basis, amounting to 197 162 tonnes worth USD 1.14 billion.
Canned tuna shipments to selected European major markets also increased significantly except to Italy, which posted negative growth of almost 8% for the January to June 2013 period compared with the same period last year. Italy imported less from Spain (-19.1%), its largest supplier, but shipments from Seychelles increased sharply (+48.4%) indicating that buyers opted for cheaper alternatives.
Germany imported more canned tuna this year (+14.6%) with more supplies reported from Ecuador (+82%) and Thailand (+73.3%). Ecuador overtook the Philippines as the number one supplier as supplies from
TUNA
CFR PricesCanned tuna*: USA, EUROPE
* 48x6.5 oz Europe, 48x6 oz USA, chunk, origin Thailand Source: GLOBEFISH
the latter dropped by 15.6% during the reporting period.
Thailand and Ecuador also did well in the French market supplying 31% and 51.7% more respectively in 2013, while Cote d’Ivoire managed to increase its shipments by 19.4% overtaking Seychelles as the largest supplier.
British consumers bought 8.4% less canned fish in the last 12 months up to June this year, according to Nielsen’s report. The canned tuna market, however, seemed to be better this year as reflected in higher imports. Up to June 2013 imports increased by 7.3% with more supplies coming from Asian countries such as Thailand (+59.3%) and Indonesia (+50%). Shipments from Mauritius, the largest supplier to UK, dropped by more than 19%.
0.00
10.00
20.00
30.00
40.00
50.00
60.00
Jan-
09
Mar
-09
May
-09
Jul-0
9
Sep-
09
Nov-
09
Jan-
10
Mar
-10
May
-10
Jul-1
0
Sep-
10
Nov-
10
Jan-
11
Mar
-11
May
-11
Jul-1
1
Sep-
11
Nov-
11
Jan-
12
Mar
-12
May
-12
Jul-1
2
Sep-
12
Nov-
12
Jan-
13
Mar
-13
May
-13
Jul-1
3
Sep-
13
USD/carton
USA
Europe
ImportsCanned tuna: France
Jan-Jun2008 2009 2010 2011 2012 2013
(1 000 tonnes)Côte d’Ivoire 16.0 11.7 10.0 6.1 10.8 12.9
Seychelles 7.9 6.6 6.5 9.5 12.0 12.5
Spain 10.6 10.0 11.1 16.7 8.9 10.5
Ecuador 4.3 7.2 6.6 7.4 5.8 7.6
Thailand 3.0 4.8 4.6 5.2 2.9 4.4
Madagascar 4.4 5.1 1.7 5.0 3.7 3.3
Mauritius 0.6 0.4 0.8 1.1 2.2 2.7
Ghana 2.2 3.2 3.8 4.3 3.0 2.2
Others 6.6 7.5 4.7 3.6 2.5 3.2
Total 55.5 56.5 49.8 58.9 51.9 59.3Source: Direction Nationale des Statistiques du CommerceExtérieur – DNSCE
ImportsCanned tuna: Germany
Jan-Jun2008 2009 2010 2011 2012 2013
(1 000 tonnes)Ecuador 15.2 8.2 5.0 5.1 3.9 7.1
Philippines 7.4 10.1 7.7 8.6 7.7 6.5
Papua NG 0.7 2.0 5.6 4.7 5.9 4.7
Netherlands 0.2 1.9 2.4 3.6 2.9 2.7
Thailand 3.6 2.1 2.4 1.9 1.5 2.6
Indonesia 3.1 3.6 3.1 4.2 3.1 2.0
Seychelles 3.9 0.6 1.9 1.0 0.1 0.3
Others 4.2 4.7 3.7 7.0 7.3 11.1
Total 38.3 33.1 31.8 36.1 32.3 37.0Source: Germany Customs

15Globefish Highlights October 2013
TUNA
Graphs Source: GLOBEFISH European Price Report
ImportsCanned tuna: Italy
Jan-Jun2008 2009 2010 2011 2012 2013
(1 000 tonnes)Spain 22.6 21.0 21.6 25.1 23.2 18.8
Seychelles 2.6 3.0 3.1 2.7 3.1 4.6
Côte d’Ivoire 4.0 5.4 2.9 2.2 4.6 3.7
Colombia 5.1 4.2 5.3 5.6 4.7 3.5
Ecuador 1.0 1.6 3.0 2.3 1.8 3.1
Portugal 1.0 0.8 0.5 0.8 1.0 1.1
Mauritius 1.5 1.2 1.6 1.5 1.2 1.0
Thailand 1.5 1.2 1.6 1.5 1.2 1.0
France 3.4 3.6 0.3 1.0 0.5 0.1
Others 2.1 2.3 1.6 2.1 3.1 4.0
Total 44.8 44.3 41.4 44.8 44.4 40.9Source: ISTAT
ImportsTuna loins: Italy
Jan-Jun2008 2009 2010 2011 2012 2013
(1 000 tonnes)Ecuador 5.0 7.3 5.1 5.5 5.0 6.0
Thailand 2.2 8.4 4.4 3.2 4.8 2.7
China 0.4 2.2 2.2 2.3 1.5 1.6
Kenya 3.4 0.7 1.0 1.9 1.3 1.6
Mauritius 3.4 1.5 2.2 0.7 1.5 1.0
Others 5.2 2.0 4.7 5.3 4.1 6.2
Total 19.6 22.1 19.6 18.9 18.1 19.1Source: ISTAT
ImportsTuna loins: Spain
Jan-Jun2008 2009 2010 2011 2012 2013
(1 000 tonnes)Ecuador 12.2 16.6 15.0 12.9 11.1 10.9
China 1.2 1.6 2.2 3.1 1.6 5.0
Thailand 3.5 6.6 4.9 10.6 2.1 4.5
Guatemala 0.0 2.7 4.5 4.0 4.2 3.7
El Salvador 6.9 9.1 4.5 2.9 2.7 3.2
Mauritius 0.9 2.2 2.4 6.6 4.1 2.1
Indonesia 0.0 0.0 0.0 0.8 2.0 1.6
Others 1.9 4.6 2.9 3.8 4.7 5.1
Total 26.6 43.4 36.3 44.6 32.6 35.9Source: Agencia Tributaria
2.051.90
0.501.001.502.002.503.00
Jan-
10M
ar-1
0M
ay-1
0Ju
l-10
Sep-
10N
ov-1
0Ja
n-11
Mar
-11
May
-11
Jul-1
1Se
p-11
Nov
-11
Jan-
12M
ar-1
2M
ay-1
2Ju
l-12
Sep-
12N
ov-1
2Ja
n-13
Mar
-13
May
-13
Jul-1
3Se
p-13
Skipjack Bangkok CFR
Skipjack Ecuador, ex-vessel
USD/kg
Tuna - Pacific Ocean
2.45
1.63
0.501.001.502.002.503.00
Jan-
10M
ar-1
0M
ay-1
0Ju
l-10
Sep-
10N
ov-1
0Ja
n-11
Mar
-11
May
-11
Jul-1
1Se
p-11
Nov
-11
Jan-
12M
ar-1
2M
ay-1
2Ju
l-12
Sep-
12N
ov-1
2Ja
n-13
Mar
-13
May
-13
Jul-1
3Se
p-13
Yellowfin > 10 kg, Spain CFR
Skipjack main sizes, Spain CFREUR/kg
Tuna - Spanish canneries
1.49
2.26
1.63
2.40
0.501.001.502.002.503.00
Jan-
10M
ar-1
0M
ay-1
0Ju
l-10
Sep-
10N
ov-1
0Ja
n-11
Mar
-11
May
-11
Jul-1
1Se
p-11
Nov
-11
Jan-
12M
ar-1
2M
ay-1
2Ju
l-12
Sep-
12N
ov-1
2Ja
n-13
Mar
-13
May
-13
Jul-1
3Se
p-13
Skipjack, Seychelles, FOB
Yellowfin, Seychelles, FOB
Skipjack, Abidjan ex-vessel
Yellowfin, Abidjan, > 10 kg, ex-vessel
EUR/kg
Tuna - Indian/Atlantic Oceans
7.308.65
2.003.004.005.006.007.008.009.00
10.00
Jan-
10M
ar-1
0M
ay-1
0Ju
l-10
Sep-
10N
ov-1
0Ja
n-11
Mar
-11
May
-11
Jul-1
1Se
p-11
Nov
-11
Jan-
12M
ar-1
2M
ay-1
2Ju
l-12
Sep-
12N
ov-1
2Ja
n-13
Mar
-13
May
-13
Jul-1
3Se
p-13
Skipjack - frozen cooked loins, single cleaned, Spain/Italy DDP
Yellowfin - frozen cooked loins, double cleaned, Italy DDPUSD/kg
Tuna - Loins

16 Globefish Highlights October 2013
the UK (+159.4%), Germany (+83.9%), France (+62.3%), Argentina (+19.5%) and Chile (+68.5%). Surprisingly exports to Syria were also significantly up by 193.4%.
In the domestic market TUF reported that canned fish demand in Thailand was flat in the second half of last year compared with an average annual growth of 3-5% in recent years. In 2012, the overall market value of Thai canned fish was THB 6.2 billion (USD 207 million).
In China, the tuna canning industry is growing, particularly in Zhoushan and Ningbo cities. In Zhousan there are 15 companies processing tuna with an installed capacity of around 25 000 tonnes raw material a year, Atuna.com reports.
Canned tuna prices in Japan for locally produced products increased by 9.3% as a result of increased production costs and the weaker yen. The value of imported products also increased (+18%) on a year on year basis in the January to June period, despite a 1.7% shortfall in the imported volume. Thailand had a 70% share in this supply.
Outlook
This year supplies of sashimi quality frozen bigeye tuna are expected to be lower than last year’s and firmer price levels are forecast.
Canned tuna sales in Europe and the USA are expected to continue on a positive trend in the third quarter because of improved consumer’s confidence and better sales during summer. Canned tuna prices, however, will remain high as the skipjack price is predicted to rebound to above USD 2 000 towards the end of the year.
Source: ITN
CFR PricesFrozen Skipjack: Thailand and Africa
Taking advantage of the EU duty free import quota for pre-cooked tuna loins, Spain imported more from Asia this year, particularly from China (+212.5%) and Thailand (+114.3%). Nevertheless Ecuador remained the largest supplier of pre-cooked tuna loins to Spain, though shipment from this source dropped slightly (-1.8%) this year. Ecuador, however, managed to supply more (+20%) pre-cooked tuna loins to Italy.
Asia
Asian canned tuna producing countries are hopeful that they will get better market access to the EU markets next year. The Philippines is expecting to receive preferential treatment for its canned tuna exports to the EU under the enhanced Generalized Scheme of Preferences or GSP Plus program to be implemented from 1 January 2014 while Thailand has resumed its free trade agreement negotiation with the EU. To support the negotiation, 130 Thai companies including Thai Union Frozen Products (TUF) recently signed a memorandum of understanding to adopt the International Labour Organization’s Good Labour Practices (GLP) program. Many accusations have been targeted at the Thai tuna industry, especially from Spain, which has continually accused Thailand of labour violations and poor working conditions.
With better demand from some major markets Thai canned tuna exports maintained a positive trend and grew marginally by 1.4% in quantity during the first semester of this year against the same period of 2012. In value terms, however, the exports were more or less stagnant. Shipments to Egypt, the number one destination in the Middle East, dropped by almost half. Similar trends were recorded in exports to Libya (-12.9%), Papua New Guinea (-27.3%), Italy (-83.9%), South Africa (-15.5%), UAE (-27.3%) and to the largest market USA (-3.4%). Higher shipments to other markets, however, managed to offset the declines as exports to some European and Latin American markets increased significantly, for example to
TUNA
0
500
1000
1500
2000
2500
Sep-03 Sep-04 Sep-05 Sep-06 Sep-07 Sep-08 Sep-09 Sep-10 Sep-11 Sep-12 Sep-13
USD/tonne
Thailand
Africa
ExportsCanned tuna: Thailand
Jan-Jun2008 2009 2010 2011 2012 2013
(1 000 tonnes)USA 43.7 48.1 59.8 53.3 37.2 36.0
Australia 18.7 15.3 20.6 23.6 16.0 15.9
Japan 12.8 12.9 11.6 14.8 13.5 14.5
Libya 18.1 15.5 11.1 4.2 15.8 13.8
Canada 14.8 16.3 14.4 16.9 12.8 13.2
Egypt 21.7 14.1 25.2 21.9 20.1 10.3
Saudi Arabia 10.5 7.1 12.0 10.2 10.9 9.1
UK 8.2 9.7 6.2 16.0 2.3 6.1
Tunisia * * * * 5.8 5.4
South Africa 5.0 5.6 4.9 4.6 5.4 4.6
Others 95.4 87.5 108.9 104.6 63.4 77.1
Total 248.9 232.1 274.7 270.1 203.2 206.0
* inlcuded under “others” Source: Thai Customs

17Globefish Highlights October 2013
GROUNDFISH
In spite of good supply cod prices have not dropped globally
Overall the supply situation for the main species of groundfish is mixed. Taking all sources of supply into consideration, there is probably an over-supply of cod; however, cod prices in Europe and Asia have increased over the summer months. China, in particular, is facing a serious shortage of supplies both for its fillet and surimi production, and this may have opened the Chinese market for exports of both raw material and surimi. For saithe and haddock, there is also a shortage of supplies and prices have pushed upward.
Supplies
The much publicized cod quota for the Barents Sea for this season (2013 – 2014) is very high at almost one million tonnes. This is shared mainly by Norway, Russia, and the EU. However Iceland has also increased its quotas for cod and haddock. The total allowable catch (TAC) of cod in Iceland was set at 214 000 tonnes, up from 195 400 tonnes last year (+9.5%). The Icelandic haddock quota was increased from 36 000 tonnes last year to 38 000 tonnes this year.
Cod
There has been much media speculation about low cod prices, but in fact this is not necessarily true in all cases. To some extent it depends of the product type and also on the geographic position of market. During the late spring and summer, a general increase in cod prices has actually been registered.
Fresh cod prices have increased in 2013 because of a growing demand for fresh fish. From Iceland it is reported that prices of fresh whitefish such as cod, haddock, saithe and redfish are up. It seems that there is a widely diversified market for whitefish products that is behaving quite differently these days from the norms of the past.
Norwegian average export prices for fresh, round
cod increased from NOK 15.30 per kg in April to NOK 22.23 per kg in August (+45.3%), while average export prices for round frozen cod increased from NOK 14.91 per kg in April to NOK 15.40 in August (+3.3%). For both of these products, prices peaked in July, at NOK 23.14 per kg for fresh cod and NOK 15.57 for frozen cod.
In September, Norway raised the minimum first-
Alaska43%
Hake15%Haddock
6%
Saithe5%
Cod18%
Whiting 3%
Others6%
Groundfish production by species (2011)
Source: FAO
ImportsFrozen cod: UK
Jan-Jun2008 2009 2010 2011 2012 2013
(1 000 tonnes)China 11.2 6.7 6.3 7.7 8.4 10.0
Iceland 6.7 7.7 7.8 8.3 8.4 9.3
Russian Fed. 4.0 4.6 5.0 4.1 6.4 7.6
Norway 3.2 4.4 4.7 5.6 4.3 5.1
Denmark 4.6 3.6 3.5 3.7 3.8 4.7
Faroe Is. 3.2 3.1 3.0 3.5 3.6 4.4
Germany 1.5 0.9 3.3 4.3 4.1 4.0
Greenland 0.5 0.8 1.9 1.8 2.4 2.2
Poland 2.0 2.2 1.3 1.1 1.4 1.4
Others 3.0 1.7 1.9 2.0 1.1 1.5
Total 39.9 35.7 38.7 42.1 43.9 50.2Source: Her Majesty’s Revenue & Customs
ImportsFrozen cod fillets: Germany
Jan-Jun2008 2009 2010 2011 2012 2013
(1 000 tonnes)China 6.7 4.4 4.0 7.4 5.5 5.7
Poland 1.5 0.9 4.1 2.1 2.6 3.6
Viet Nam 0.0 0.0 0.7 0.7 0.7 1.1
Denmark 1.1 0.8 1.1 1.3 0.8 0.5
Russian Fed 0.7 0.4 0.3 0.3 0.3 0.4
Norway 0.1 0.1 0.2 0.2 0.2 0.3
Iceland 0.2 0.5 0.4 0.3 0.0 0.1
Others 1.0 1.0 0.6 0.2 1.1 1.7
Total 11.3 8.1 11.4 12.5 11.2 13.4Source: Germany Customs

18 Globefish Highlights October 2013
hand cod price by between NOK 0.25 and 0.50 per kg. For the larger sizes, prices were increased by NOK 0.25, while for the smallest size (under 1 kg) prices were raised by NOK 0.50. Last year, Norwegian minimum cod prices were reduced in anticipation of the 33% increase in the cod quota for the Barents Sea.
Demand in China is also high because of shortage of domestic supplies for the processing industry. This has helped to drive up the price of cod in recent months.
Hake, haddock, pollock and hoki
There is a shortage of haddock supplies on the European market, and this has pushed prices up. Haddock prices in Norway went up by 27%, while cod and saithe prices dropped by 15% and 22%, respectively. Consequently, haddock prices are now on a par with cod prices, but then there is the danger that consumers will eventually protest against these high prices and move to other products.
It is expected that the haddock quotas for 2014, which will be set by the joint Russian-Norwegian fisheries commission in early October, will be lower than the 2013 quota. Thus, ICES has recommended that the quota be cut by 25% to just 150 000 tonnes, down from 200 000 tonnes in 2013 and 318 000 tonnes in 2012.
Russian catches of pollock increased slightly during
GROUNDFISH
the first half of 2013, to 1 045 610 tonnes, up by 0.4% from the same period last year. This year there has been a noticeable change in processing at sea. While production of H&G products during the first half of the year fell by 4.3% to 454 120 tonnes and frozen whole fish dropped by 6.6% to 67 120 tonnes, frozen-at-sea fillets went up by 59% to 28 690 tonnes.
New Zealand is expected to increase its hoki quota for the coming season. Hoki stocks have had a six-year growth period and last year 130 000 tonnes were landed. It is expected that the quota for the coming season will be raised to 150 000 tonnes. While this is considered a rather modest increase, it is welcomed as a responsible move that will continue to build up the stocks.
Demand for hoki is good locally, but also in European markets such as Poland, the Netherlands, Italy, France and the UK. There has also been an increasing demand for hoki blocks imported for further processing. Demand for hoki is expected to continue to grow and prices have also been increasing.
The Chinese processing industry is dependent on imports of raw material and when prices for Russian pollock increased recently Chinese processors were put under pressure, with falling profit margins. At the same time operating costs increased. Prices for double frozen
ImportsCod-like groundfish: USA
Jan-Jun2008 2009 2010 2011 2012 2013
(1 000 tonnes)FilletsChina 35.1 38.2 34.4 42.2 41.0 40.0
Iceland 4.3 5.1 5.0 3.5 4.6 5.9
Russian Fed. NA 0.8 6.5 2.4 1.9 3.6
Canada 1.9 2.3 2.6 2.1 2.6 1.8
Norway 0.4 0.6 0.4 0.3 0.4 1.3
Others 3.4 2.4 1.3 1.6 4.1 6.5
Total 45.1 49.4 50.2 52.1 54.6 59.1Blocks/SlabsChina 17.8 21.4 18.1 17.3 17.1 15.4
Iceland 0.2 0.7 0.3 0.3 0.5 0.8
Argentina 1.5 0.5 0.3 0.2 0.5 0.6
Norway 0.0 0.1 0.4 0.5 0.2 0.4
Russian Fed. 0.3 1.8 0.8 0.6 0.3 0.2
Canada 0.3 0.3 0.1 0.1 0.2 0.1
Others 0.8 0.9 1.0 1.0 1.4 2.4
Total 20.9 25.7 21.0 20.0 20.2 19.9Gr. Total 66.0 75.1 71.2 72.1 74.8 79.0
Source: NMFS
ImportsFrozen hake fillets: Germany
Jan-Jun2008 2009 2010 2011 2012 2013
(1 000 tonnes)Namibia 1.1 0.9 1.1 1.4 1.7 1.6
Peru 2.2 1.6 2.3 2.1 0.5 1.4
Argentina 1.7 1.9 1.5 0.3 0.6 0.9
USA 2.5 2.4 2.8 2.4 2.6 0.4
Others 2.1 2.0 0.7 0.9 0.7 0.6
Total 9.6 8.8 8.4 7.1 6.1 4.9Source: Germany Customs
ImportsFrozen Alaska pollock fillets: Germany
Jan-Jun2008 2009 2010 2011 2012 2013
(1 000 tonnes)China 43.9 46.0 44.1 45.7 38.1 46.0
USA 29.4 13.5 18.4 22.7 27.6 15.3
Russian Fed 16.7 13.2 9.1 8.5 4.5 6.3
Others 2.1 3.0 2.4 2.4 2.8 2.0
Total 92.1 75.8 74.0 79.3 73.0 69.6Source: Germany Customs

19Globefish Highlights October 2013
GROUNDFISH
Russian pollock increased from USD 1 300 to USD 1 400 – 1 500 per tonne. Chinese producers are now looking for an excuse to increase their own prices, so pollock products may be in line for a general price increase.
Surimi
The export value of surimi from the USA during the first half of the year declined by some 5% to USD 167.8 million. Export volume, on the contrary, increased by 4.9% to 73 486 tonnes. In other words, prices for US surimi fell during this period.
The largest decline was registered for exports to Japan, which fell by 18.5% by volume to 25 996 tonnes, and the value of US surimi exports to Japan fell by almost 25% to USD 52.4 million.
US exports to the Republic of Korea, in contrast, increased by almost 29% by volume to 19 248 tonnes. Export value to the Republic of Korea rose by 11.7% to USD 67 million.
The French surimi producer Fleury Michon reported a 15% drop in sales in France during the second quarter of 2013. The reasons given for this decline were bad weather, limited raw material supplies, a weak promotional effort, and the poor European economy.
In Japan, surimi production has been declining through the first half of the year. It is reported that the six onshore plants in Hokkaido saw a drop in production of as much as 18% during the first six months of the year. As a result, surimi inventory has been reduced by 19%.
Demand for surimi in China is growing, and at present, demand is outstripping supplies. Surimi products, such as fish balls, are very popular in China. Although China constructed several surimi plants in the first decade of
ImportsFrozen hake: Italy
Jan-Jun2008 2009 2010 2011 2012 2013
(1 000 tonnes)Argentina 5.4 5.5 4.8 4.4 3.2 3.9
Namibia 1.2 1.8 2.1 2.1 2.3 3.1
S. Africa 2.7 2.8 2.6 2.6 2.9 3.0
Spain 2.3 2.3 3.6 3.3 2.6 2.4
Uruguay 1.3 1.6 3.4 3.5 1.2 1.9
Peru 0.1 0.0 0.0 0.1 0.3 0.8
Chile 0.1 0.5 0.8 0.4 0.3 0.3
Others 1.2 1.5 2.8 2.8 2.9 3.8
Total 14.3 16.0 20.1 19.2 15.7 19.2Source: ISTAT
ImportsFrozen Alaska pollock fillets: France
Jan-Jun2008 2009 2010 2011 2012 2013
(1 000 tonnes)China 11.5 12.9 9.8 14.7 12.5 11.2
Russian Fed. 4.2 3.4 2.4 2.9 2.5 5.8
USA 4.5 3.1 2.5 5.2 4.9 4.0
Germany 2.3 1.2 1.8 3.0 2.8 2.9
Others 0.2 0.6 0.8 0.2 0.3 0.3
Total 22.7 21.1 17.3 26.0 23.0 24.2Source: Direction Nationale des Statistiques du CommerceExtérieur – DNSCE
2.40
1.31.61.92.22.52.8
Sep-
08
Jan-
09
May
-09
Sep-
09
Jan-
10
May
-10
Sep-
10
Jan-
11
May
-11
Sep-
11
Jan-
12
May
-12
Sep-
12
Jan-
13
May
-13
Sep-
13
Surimi - In France, origin: Spain
Stick 250 gr/pc
EUR/kg
Source: European Price Report
the century and has increased fishing efforts in the South China Sea, the plants have now been forced to turn to imported raw material to meet demand. It is estimated that Chinese surimi production in 2012 amounted to about 240 000 tonnes.
However, during the first months of 2013, surimi production fell by up to 30% as a result of the shortage of raw material. Surimi consumption is estimated to be growing rapidly, at over 10% per year. With the raw material shortage and with reduced production, China is now forced to import both fish for raw material and surimi products from other producing countries.
International trade
Norwegian exports of fresh cod grew dramatically during the first half of 2013. The volume in fact doubled compared with the same period in 2012. Shipments to all major markets were up.
Norwegian cod exports to the UK continued to grow during the second quarter of 2013. Norwegian cod exports were up by 89% to 4 613 tonnes during the second quarter, totalling 12 690 tonnes at an FOB value of NOK 291.8 million. That represents an increase in volume of 43.5%, but prices were much lower so the increase in

20 Globefish Highlights October 2013
value was just 0.2%.
In spite of this, cod lost market share on the UK market in 2012. According to data from market research company Nielsen, the volume of cod sold through supermarkets in the UK declined by 3.2%, to 39 485 tonnes in 2012 compared with 2011, with the value falling by 1.1% to GBP 317.7 million.
However there was considerable variation from product to product. Sales of fresh cod increased by as much as 8% to 11 607 tonnes, but prices fell so that the value of fresh cod sold declined by GBP 0.19 per kg. The volume of frozen cod sales fell by 7.2% to 27 878 tonnes, while prices for frozen cod held better and in fact registered a slight increase compared with 2011.
Imports of cod-like groundfish into the USA increased during the first six months of the year. Fillet imports increased by 8.2% to 59 100 tonnes, while imports of blocks and slabs declined slightly by 1.5% to 19 900 tonnes. At the same time major shifts between the relative positions of the main suppliers took place.
US imports of double frozen pollock blocks went down by as much as 28% during the first half of 2013. Imports fell from 70 000 tonnes to 50 000 tonnes. This is the lowest level for several years and well below peak years of 2005 (83 000 tonnes) and 2009 (77 000 tonnes). The main supplier as usual is China, which has had supply problems. These were reflected in the decline in shipments to the USA. Compensating for the lower imports from China, imports from Russia have increased four-fold, but from a very low base.
German imports of Alaska pollock fillets declined by 4.7% to 69 600 tonnes. China, as the main supplier, strengthened its position on this market and increased shipments by over 20%. The USA lost market share and experienced a 45% decline in shipments to Germany.
German imports of frozen cod fillets increased by almost 20% during the first half of the year. The main supplier, China, maintained its position, while Poland increased shipments by over 38%. German imports of frozen hake fillets declined, on the contrary, by almost 20%.
French imports of frozen Alaska pollock fillets were quite stable during the first half of the year at 24 200 tonnes. China shipped slightly less product to France, while Russia increased exports to France by 132% to 5 800 tonnes.
There was a 14% increase in UK imports of frozen cod in the first half of 2013. The main suppliers, China, Iceland and Russia, all supplied more, as did most other suppliers. Since 2009, the UK has had a steady increase in imports of frozen cod.
GROUNDFISH
CFR pricesGroundfish blocks: USA
Source: ITN
Frozen hake imports into Italy were also up during the first half of 2013. Total imports increased by 22% to 19 200 tonnes. Argentina, Namibia and South Africa are the main suppliers to this market.
Black cod
In the Pacific, black cod prices have remained stable in spite of the fact that fishermen are now targeting this species after the summer season. In general, prices for black cod are low compared with a year ago. There was good demand both in Europe and Asia (especially China) for this fish, but with the high price levels last year it took some time to bring down inventories.
At present supplies are improving, and therefore a certain downward price adjustment is expected. The changing market for luxury seafood in China is one of the driving factors.
Outlook
The outlook for the coming winter season is one of considerably higher cod quotas, and consequently most observers are expecting falling prices, at least for the more traditional products such as frozen fillets and blocks, and clipfish and stockfish. There are signs that demand for high quality fresh products is growing. A complicating factor is the demand for processing raw material in China. This could contribute to keeping prices higher than would otherwise be expected.
For 2015 it expected that the cod quotas will be somewhat reduced, perhaps to about 900 000 tonnes for the Barents Sea. For haddock and saithe it is more difficult to predict. Much will depend on the relationship between the small pelagics in the north and the cod population. As herring is currently under pressure, the cod stocks in a few years’ time may have difficulty finding enough food, and the stocks could decline again.
0.5
1.0
1.5
2.0
2.5
3.0
3.5
Sep-02 Sep-03 Sep-04 Sep-05 Sep-06 Sep-07 Sep-08 Sep-09 Sep-10 Sep-11 Sep-12 Sep-13
USD/lb
Cod
Hake
Alaska pollack

21Globefish Highlights October 2013
CEPHALOPODS
Octopus supplies increasing in main markets
Octopus supplies are more abundant, particularly from Morocco, and this is reflected in busier trading in the main markets, such as Japan, Spain and Italy, which have all increased imports substantially during the first half of the year. Squid supplies are also up slightly but supplies of cuttlefish remain tight.
Octopus
Supplies of octopus that entered international trade during the first half of 2013 have increased markedly. So far this does not seem to have affected prices much, which is unexpected in light of the difficult economic situation, particularly on the European market.
The quota for the Moroccan summer octopus fishery was increased by 37% this year. It is reported that catches have included more large sizes than previously. The Mauritanian fishery started on 15 June and slightly higher prices were reported. Mauritanian catches were slightly poorer than expected, but here also the catches have consisted of a larger share of large sizes. Prices for processing material were down a bit from last year. This led to a somewhat higher domestic consumption. Domestic prices are expected to firm up later in the year.
In Mexico, the octopus fishery in Yucatan started in August, and it is expected that some 12 000 tonnes will be landed during this season. At the same time, about 6 000 tonnes are in cold storage, and, as supplies are quite good at the moment, traders are having a problem placing this on the market. As the octopus fishery is of great importance to the local communities, authorities are concerned about the market.
Japan imported almost 36% more octopus in the first half of 2013 than during the same period in 2012. Most of this growth was caused by dramatically higher imports
from Morocco. Other suppliers were more or less at the same level as last year. Mauritania increased shipments by 16.5%, but shipments from China declined by 21%. Viet Nam, Spain and Thailand also lost market share in Japan during this period.
Italian octopus imports were fairly stable during the first half of 2013, in spite of economic problems. In fact, there was a slight (+2.5%) increase in imports,
Squid 79%
Cephalopods nei8%
Octopus 9%
Cuttlefish9%
Source: FAO
Cephalopods production by species (2011)ImportsOctopus: Japan
Jan-Jun2008 2009 2010 2011 2012 2013
(1 000 tonnes)
Morocco 7.8 7.5 6.7 2.7 3.8 12.4
Mauritania 8.1 11.0 5.7 6.3 8.5 9.9
China 4.0 2.1 4.1 3.7 3.7 2.9
Viet Nam 2.0 2.1 1.3 1.4 1.9 1.6
Spain 1.6 0.9 0.6 0.9 1.5 0.6
Thailand 0.6 0.8 0.5 0.6 0.7 0.5
Others 3.6 0.8 0.4 1.0 1.4 1.3
Total 27.6 25.2 19.3 16.6 21.5 29.2Source: Japan Customs
ImportsOctopus: Italy
Jan-Jun2008 2009 2010 2011 2012 2013
(1 000 tonnes)Morocco 8.6 9.3 6.0 2.9 2.8 8.2
Spain 4.3 4.1 4.6 4.5 3.0 4.0
Indonesia 2.1 1.7 2.1 2.4 2.5 1.2
Senegal 1.6 1.7 1.1 1.8 2.5 1.2
Viet Nam 2.2 1.8 2.1 1.6 1.6 0.9
Mauritania 0.6 2.8 1.2 1.1 0.5 0.8
Mexico 1.6 0.1 1.0 2.5 0.6 0.5
Thailand 1.6 1.3 0.7 0.4 0.8 0.3
Tunisia 0.6 0.6 0.6 2.2 2.4 0.0
Others 4.6 2.4 2.7 3.6 3.1 3.2
Total 27.7 26.0 22.0 22.8 19.8 20.3Source: ISTAT

22 Globefish Highlights October 2013
The interest in jumbo flying squid (Dosidicus gigas) in South America is increasing, and in Chile there are initiatives to collect more information on this fishery and on the resources. A status evaluation is needed to enable the authorities to estimate biologically acceptable catch levels for the species.
Both the industry and the artisanal sector are showing interest in this fishery and, therefore, the authorities see the need to regulate the fishery to ensure that it is not overfished quickly, but turned into an important and sustainable activity. However, little is known about the resource as most information comes from Peru and the northern hemisphere.
During the first six months of 2013, Peru exported jumbo flying squid worth USD 198.4 million. This represented a 9.6% increase compared with the same period in 2012. Peruvian jumbo flying squid has found diverse markets in over 50 countries and is even exported to Thailand. The main demand is for raw, frozen squid. It is exported also as salted and dried, or prepared and in some cases canned. The main markets for Peruvian flying jumbo squid are China and Spain.
During the first six months of 2013, China’s imports of Peruvian jumbo flying squid were worth USD 61 million, an 11.9% increase over last year. Spain’s imports were valued at USD 35 million in the first half of the year, a drop of 6 %. Other important markets include Thailand, the Republic of Korea, Japan, Italy and the USA.
The development of the Peruvian jumbo flying squid industry has been remarkable, and this has led to interest in the species south of the border.
Source: European Price Report
which amounted to 20 300 tonnes. Morocco was once again the major supplier, and shipments from Morocco to Italy increased dramatically (+193%) after having been very modest during 2011 and 2012. Spain also increased exports to Italy by some 33%, but Indonesia and Senegal both lost market share. Shipments from these countries went down by 52%, to just 1 200 tonnes each.
The improved supply situation was clearly evident in Spain’s import statistics for the first half of the year. Total Spanish octopus imports rose by 38.9% to 20 700 tonnes. The main suppliers were Morocco and Portugal, which increased shipments by 85.1% and 289%. Morocco has thus recaptured its place as the most dominant supplier to the Spanish market. Mauritania shipped slightly less (-22%), while China increased shipments from 200 tonnes to 600 tonnes.
Squid
Squid supplies have also improved somewhat in the first half of the year. Supplies from the Falkland Islands (Malvinas) seemed to be a little weaker, though.
CEPHALOPODS
ImportsOctopus: Spain
Jan-Jun2008 2009 2010 2011 2012 2013
(1 000 tonnes)Morocco 14.6 12.9 11.8 8.0 6.7 12.4
Portugal 1.8 0.6 0.7 1.0 0.9 3.5
Mauritania 2.5 4.4 2.2 3.1 2.7 2.1
China 1.1 1.9 1.5 0.2 0.2 0.6
Algeria 0.7 0.3 0.3 0.4 0.4 0.4
Viet Nam 0.8 0.7 0.9 0.5 0.6 0.3
Senegal 0.3 0.3 0.4 0.7 0.8 0.2
India 0.4 0.4 0.3 0.5 0.3 0.2
Others 3.8 1.5 2.8 3.3 2.3 1.1
Total 26.0 23.1 21.0 17.6 14.9 20.7Source: Agencia Tributaria
9.00
7.00
3.50
5.50
7.50
9.50
Sep-
08
Jan-
09
May
-09
Sep-
09
Jan-
10
May
-10
Sep-
10
Jan-
11
May
-11
Sep-
11
Jan-
12
May
-12
Sep-
12
Jan-
13
May
-13
Sep-
13
T2
T6EUR/kg
Octopus - Whole - frozen, in Spain, origin: Morocco
ImportsSquid: Japan
Jan-Jun2008 2009 2010 2011 2012 2013
(1 000 tonnes)China 11.9 11.1 12.3 14.4 16.8 18.8
Peru 5.2 6.8 1.2 4.8 2.9 4.7
Thailand 3.2 3.1 4.2 3.7 3.4 3.3
Chile 0.0 0.0 0.1 0.9 3.5 2.5
Viet Nam 2.4 2.7 2.7 2.3 2.7 2.1
USA 3.8 1.6 2.0 1.8 0.5 0.9
India 0.5 0.5 0.8 1.0 0.7 0.8
Philippines 0.3 0.4 0.6 0.4 0.6 0.7
Argentina 2.0 2.2 0.3 0.4 0.3 0.4
New Zealand 0.5 1.3 0.4 0.2 0.3 0.1
Others 1.3 1.6 2.0 2.5 6.1 5.1
Total 30.7 30.8 25.9 31.1 33.7 36.1Source: Japan Customs

23Globefish Highlights October 2013
CEPHALOPODS
Squid imports into Japan were up by 7% during the first half of 2013, to 36 100 tonnes. The main supplier, China, increased shipments by 12%, and Peru also increased shipments to Japan (+62%). Of the other main suppliers, Chile and Viet Nam experienced slight declines.
There was a marked increase in Italian squid imports during the first six months of this year. Imports increased from 31 300 tonnes in 2012 to 38 100 tonnes in 2013 (+21.7%). Spain was still the major supplier and its market share increased. Imports from Spain went up by 23.7% to 12 000 tonnes during the period. The second largest supplier, Thailand, experienced a slight decline, but kept its number two position. Shipments from India and Peru increased by 125% and 266%, respectively.
Squid imports into Spain surprisingly declined during the first half of the year, from 55 200 tonnes to 47 200
tonnes (-14.5%). Most of this decline was due to a decline in shipments from the Falklands Islands (Malvinas) (-25%) and India (-21.5%). The Falkland Islands (Malvinas) still remain the largest supplier of squid to Spain, accounting for 36% of total Spanish squid imports. Peru and Morocco registered increases in squid exports to Spain during the period.
The USA, which has become a major importer (and exporter) of squid over the past decade, imported somewhat less during the first half of this year. Imports fell from 37 000 tonnes during the first six months of 2012 to 34 300 tonnes during the same period in 2013 (-7.3%). The major supplier by far, China, shipped slightly less, and there were no major changes among the other suppliers, just a general reduction.
ImportsSquid: Italy
Jan-Jun2008 2009 2010 2011 2012 2013
(1 000 tonnes)Spain 8.5 9.9 10.8 11.8 9.7 12.0
Thailand 12.3 10.8 11.5 11.9 9.2 8.9
India 1.5 2.0 4.3 4.2 1.6 3.6
Peru 0.2 1.6 1.0 0.0 0.6 2.2
Viet Nam 4.2 2.5 3.6 3.6 2.7 2.1
Indonesia 0.6 0.5 1.1 1.6 1.1 1.2
South Africa 1.4 2.3 2.9 3.0 1.5 1.0
Others 6.7 4.4 4.8 6.7 5.0 7.2
Total 35.3 34.1 40.0 42.7 31.3 38.1Source: ISTAT
ImportsSquid: Spain
Jan-Jun2008 2009 2010 2011 2012 2013
(1 000 tonnes)Falkland/Malv. 17.6 14.6 20.9 17.1 22.8 17.0
India 6.6 6.2 10.9 8.0 9.3 7.3
Peru 2.8 2.7 6.7 6.3 4.3 6.4
China 3.5 3.5 5.3 5.8 5.0 5.0
Morocco 2.4 2.8 3.1 4.1 2.7 4.8
South Africa 2.4 2.0 2.9 2.4 1.4 0.5
UK 1.7 0.9 1.7 0.6 0.1 0.3
New Zealand 1.5 1.2 0.1 0.5 0.1 0.1
Others 10.6 4.5 5.3 7.9 9.5 5.8
Total 49.1 38.3 56.8 52.7 55.2 47.2Source: Agencia Tributaria
ImportsSquid: USA
Jan-Jun2008 2009 2010 2011 2012 2013
(1 000 tonnes)China 12.4 11.9 15.4 16.9 19.4 18.8
Thailand 4.7 2.7 2.3 1.9 2.3 2.1
Peru 0.9 1.6 1.6 1.4 1.9 2.0
India 2.8 1.9 2.5 1.8 2.2 1.8
Republic of Korea 2.1 3.9 3.5 2.4 1.7 1.7
Taiwan PC 2.8 3.4 2.7 1.3 1.8 1.3
New Zealand 0.6 0.6 0.8 0.7 0.5 1.1
Others 2.9 2.6 2.2 2.8 7.2 5.5
Total 29.2 28.6 31.0 29.3 37.0 34.3Source: NMFS
Cuttlefish
Cuttlefish supplies have been a little tighter, especially from India, and this is reflected in international trade statistics.
Cuttlefish imports into Japan declined quite considerably by 21% during the first six months this year. All the three major suppliers (Thailand, Morocco and Viet Nam) shipped less than during the same period in 2012.
Cuttlefish imports into Italy also declined because of reduced availability. Total imports during the first six months fell from 12 200 tonnes in 2012 to 10 700 tonnes in 2013 (-12.2%). There were no dramatic shifts between the major suppliers, however. Shipments from France and Tunisia fell, while Spain and Morocco exported more cuttlefish to Italy.

24 Globefish Highlights October 2013
Source: European Price Report
Cuttlefish imports into Spain also fell during the first half of the year. Total imports declined from 20 100 to 18 600 (-7.5%), in spite of increased exports from the main suppliers, Morocco and Mauritania. There was a significant reduction in imports from India (-60%), while other suppliers saw only minor changes.
ImportsCuttlefish: Japan
Jan-Jun2008 2009 2010 2011 2012 2013
(1 000 tonnes)Thailand 3.8 3.5 3.3 2.7 2.8 2.3
Morocco 0.9 1.4 1.8 0.9 1.9 1.7
Viet Nam 2.0 2.0 1.7 1.4 1.8 1.1
Malaysia 0.7 0.9 0.8 0.6 0.6 0.6
Republic of Korea 0.4 0.3 0.3 0.3 0.2 0.2
Others 0.9 1.1 0.9 1.0 1.2 0.8
Total 8.6 9.1 8.9 6.9 8.6 6.8Source: Japan Customs
ImportsCuttlefish: Italy
Jan-Jun2008 2009 2010 2011 2012 2013
(1 000 tonnes)France 3.2 2.2 3.3 3.7 3.6 3.0
Spain 1.9 2.2 2.1 1.6 1.5 2.0
Tunisia 2.0 1.8 2.9 3.4 2.7 1.9
Morocco 0.3 1.4 1.1 1.5 0.6 1.1
UK 0.8 0.5 0.6 0.4 0.7 0.9
Senegal 1.0 1.0 1.0 1.1 0.7 0.9
Mauritania 0.1 1.0 0.6 0.2 0.1 0.2
Netherlands 0.5 0.2 0.4 0.3 0.5 0.1
Others 2.0 1.4 1.3 1.8 1.5 0.7
Total 11.9 11.8 13.3 13.9 12.2 10.7Source: ISTAT
Prices
Octopus prices in general have been stable over the past year. Increased supplies in 2013 may change this, and falling prices can be expected, both because of improved supplies, and as a result of the continuing economic crisis in Europe, especially in the Mediterranean countries.
Squid prices in Europe fell towards the end of 2012, but have started a recovery, albeit an uncertain one. At present squid prices are high compared with a few years ago, and they are increasing slightly in 2013.
Outlook
In general, the supply outlook for octopus is good. It is expected that more product will enter the market, and this is bound to put some pressure on prices. However, demand in the main markets appears to be good, in spite of economic weakness.
Squid is also in good supply and prices are relatively high. This is expected to continue. For cuttlefish, on the other contrary, supplies might be tighter and prices will probably be relatively stable.
ImportsCuttlefish: Spain
Jan-Jun2008 2009 2010 2011 2012 2013
(1 000 tonnes)Morocco 7.3 7.7 8.4 9.5 7.7 9.8
Mauritania 1.4 2.0 1.5 1.1 1.7 2.2
India 5.7 6.1 6.5 5.9 4.5 1.8
France 1.8 1.3 1.5 1.8 1.9 1.7
China 2.4 2.3 1.8 0.6 0.9 1.3
Ghana 0.9 0.9 1.0 1.1 0.7 0.2
Others 4.2 2.3 3.6 4.0 2.8 1.7
Total 23.8 22.6 24.3 23.8 20.1 18.6Source: Agencia Tributaria
6.70
3.004.005.006.007.008.00
Sep-
08
Jan-
09
May
-09
Sep-
09
Jan-
10
May
- 10
Sep-
10
Jan-
11
May
-11
Sep-
11
Jan-
12
May
-12
Sep-
12
Jan-
13
May
-13
Sep-
13
Squid - In Italy, origin: South Africa
Squid - Whole, FAS, size M EUR/kg
Coldstorage holdingsSquid and Cuttlefish: Japan
Source: Japan Fisheries Agency
0
20
40
60
80
100
120
140
160
Jun-01 Jun-02 Jun-03 Jun-04 Jun-05 Jun-06 Jun-07 Jun-08 Jun-09 Jun-10 Jun-11 Jun-12 Jun-13
1 000 MT
Cuttlefish
NEI
Squid
CEPHALOPODS

25Globefish Highlights October 2013
Demand remains firm keeping prices steady and strong
Production in China is currently reported to be down by 30% while other producers in Asia, Africa and Latin America continue to intensify tilapia farming. Demand remains firm, which will help keep prices steady and strong.
TILAPIA
China
Official figures for tilapia production have not been released yet but tilapia production was estimated to be 1.5 million tonnes in 2012, up from 1.4 million tonnes in 2011 in response to increased domestic and foreign market demand. However, industry sources report at least a 30% decline in production to date and attribute this to farm-ers’ financial constraints to restock ponds, affected by the harsh weather conditions in 2012.
In the first six months of 2013 total tilapia exports from China reached 161 200 tonnes, 7% more than a year ago. In value Chinese tilapia exports were higher by 11% with a value close to USD 543 million.
The frozen fillet category took the largest share of tilapia exports (45%) but posted negative growth both in volume (-7%) and value (+3.6%). Exports of frozen fillet to the USA, the main market, were down by about 18% while Mexico imported 34% more. Exports of frozen fillet also increased to the EU markets of Spain (+32%), Poland (+62%) and Germany (+19%). In Latin American Costa Rica, Peru and Colombia also imported more while exports to Iran and Southeast Asia (Malaysia, Viet Nam and Thailand) increased by 138% each.
Whole frozen tilapia exports in contrast experienced a 24% rise in volume while in value, they increased by 44% to USD 124 million. This category also took a larger share of the total export volume at 36% compared with 32% in the previous reporting period. The growth was largely fa-cilitated by higher demand from Africa and the Middle East markets.
EU
Frozen tilapia fillet imports increased by 13% during the first six months of this year, continuing the positive trend from the first quarter. Asian exporters dominated the market, supplying 99% of imports with China in the lead followed by Indonesia, Viet Nam and Thailand. Im-ports increased from all Asian sources except from Malay-sia. The EU-27 imported 8 353 tonnes of frozen tilapia fil-let during this period.
Taiwan Province of China
Taiwan PC exported 32% more frozen tilapia during the January-June 2013 period at 18 400 tonnes compared with a year ago, with frozen whole tilapia taking a 90% share. Exports of this category (16 564 tonnes) increased
to almost all markets except for Saudi Arabia, Japan and Qatar.
As a part of a Belize-Taiwan Aquaculture Project, the latter has donated USD 651 725 to the Ministry of Agriculture of Belize making it the second donation toward the five-year tilapia project that will cost approximately BZD 5 million. The project aims to provide male tilapia fingerlings to small-scale farmers around the country.
USA
This year’s lower production in China (down by 30%) has pushed prices up amidst renewed interest in the US market. Buyers are reportedly securing products for the year-end to avoid shortages. Industry sources say that current buying activity is strong and there is a shortage of 7-9 oz/pc size; buyers are going for 3-5 oz/pc size instead. Despite current interest, average import prices declined from USD 3.78/kg during January-June 2012 to USD 3.65/kg in the same period in 2013, but are expected to end higher during the rest of 2013.
Demand for high value fresh/chilled (air-flown) tila-pia fillet continues to rise despite increasing prices. During the first six months of 2013 imports of fresh/chilled tilapia fillet shot up to 14 092 tonnes valued at USD 102.1 mil-lion (up 65% in volume and 71% in value) against the same period last year. Lower supplies of frozen fillet from China and also from Indonesia were quoted as the main reason for the trend. Honduras overtook Ecuador as the largest supplier of fresh tilapia fillet to the market followed by Costa Rica. Both countries managed to increase their ship-ments by 53% and 180% respectively this year, while sup-ply from Ecuador declined by 3.2%. These three countries contributed almost 75% of the total imports fresh/chilled tilapia fillet to the US market.
Supplies of frozen tilapia during the first half of 2013 declined 16% from the same period last year, while the value of imports declined by 18%. Supplies of frozen fillet from China were significantly lower (-21%) as more whole frozen fish is diverted to African markets. Domestic mar-kets in most supplying countries are also absorbing more products to cater for local demand.
Uganda
Tilapia from Uganda will soon be available on the market in Germany, bringing in more income for commer-cial fish farmers and local fishermen. Demand for tilapia is on the rise although Nile perch is still widely available

26 Globefish Highlights October 2013
in the domestic market. During the January to May period in 2013 Germany imported 1 170 tonnes of frozen tilapia fillet, with 80% coming from China and Indonesia. In the meantime, plans are underway to link the fisheries sec-tors of Uganda and Germany to enable the exchange of technical knowledge and strategic investment. Over 15 500 tonnes of fish were exported mostly to Europe in 2011, with Nile perch species contributing a larger percentage. However, demand for tilapia has pushed prices up in the recent months.
Trinidad/Tobago
The government of Trinidad and Tobago recently an-nounced incentives to encourage the freshwater fish pro-duction sector to increase local fish farming initiatives, ac-cording to the Trinidad and Tobago Guardian. Consumption of tilapia is about 135 tonnes per annum but only 22 tonnes
TILAPIA
is from local production and the remainder is mostly im-ported from China. One of the incentives announced by the government is the offer of tilapia feed at cost price to fish farmers.
Africa
The African Development Bank (AFDB) is providing finance for an agro-industrial project to increase tilapia farming in Zimbabwe on Lake Kariba reported the Zim-babwe Standard. The ambitious project hopes to increase tilapia production by seven times the current level by 2015 and to produce 20 000 tonnes of fish. Demand for tilapia is growing in the countries adjacent to Zimbabwe. The Dem-ocratic Republic of Congo, Zambia, South Africa, Malawi and Angola together require 100 000 tonnes of imported fish annually, with a combined fish consumption of 1.3 mil-lion tonnes. The project will create around 900 new jobs by 2015 and it is hoped that it will contribute an estimated USD 33 million to the country in the next 10 years.
Colombia
Local production of freshwater species has increased substantially reaching a total of 61 500 tonnes in 2011 of which tilapia comprised 78%. The regions of Huila, Valle del Cauca, Tolima and Meta are the main producing centers of this kind. In terms of exports, the main item is frozen fish, which last year exceeded 41 000 tonnes. Tilapia ex-ports from Colombia almost entirely enter the US market.
Outlook
Tilapia farming is gaining more attention worldwide, particularly to supply local demand in regions where local production is possible. Although production from the larg-est producer, China, is reported to have declined since the start of this year, increased supplies from other producers worldwide are keeping the market firm.
ImportsWhole Frozen Tilapia: USA
Jan-Jun2008 2009 2010 2011 2012 2013
(1 000 tonnes)China 14.7 11.9 11.3 10.1 12.4 10.8
Taiwan PC 8.3 7.3 7.5 5.9 5.1 7.5
Thailand 1.8 0.6 1.0 0.3 0.2 0.3
Others 0.8 0.3 0.2 0.6 0.3 0.4
Total 25.6 20.1 20.0 16.9 18.0 19.0Source: NMFS
ImportsFrozen Tilapia Fillets: USA
Jan-Jun2008 2009 2010 2011 2012 2013
(1 000 tonnes)China 36.6 44.9 57.5 51.9 71.3 56.5
Indonesia 4.8 4.0 4.6 4.0 6.4 5.4
Taiwan PC 1.2 1.1 1.0 0.8 0.8 0.7
Ecuador 0.2 0.5 0.3 0.2 0.4 0.4
Total 43.2 51.4 64.5 57.9 80.8 63.9Source: NMFS
ImportsTilapia (by product form): USA
Jan-Jun2008 2009 2010 2011 2012 2013
(1 000 tonnes)Whole frozen 25.6 20.1 20.0 16.9 18.0 19.0
Frozen fillets 43.2 51.4 64.5 57.9 80.8 63.9
Fresh fillets 15.4 12.4 12.5 11.7 8.5 14.1
Total 84.2 83.9 97.0 86.5 107.3 97.0Source: NMFS
Tilapia certification has been available worldwide since 2009. Cur-rently there are 40 000 tonnes of GLOBALG.A.P. certified Nile tila-pia (Oreochromis niloticus) in China, Honduras, Malaysia, Poland and Viet Nam. The certification includes not only farming activi-ties but the feed and the seedlings used. GLOBALG.A.P. Chain of Custody certifications for tilapia are currently issued in Belguim, Honduras and the Netherlands. Source: GLOBALG.A.P.
ImportsFresh Tilapia Fillets: USA
Jan-Jun2008 2009 2010 2011 2012 2013
(1 000 tonnes)Honduras 4.5 3.2 3.5 4.2 2.5 3.8
Ecuador 4.7 4.8 4.1 4.1 3.3 3.2
Costa Rica 2.9 2.9 3.2 1.7 1.2 3.5
Colombia 0.9 0.7 1.2 1.1 1.2 1.9
Others 2.4 0.8 0.5 0.6 0.3 1.7
Total 15.4 12.4 12.5 11.7 8.5 14.1Source: NMFS

27Globefish Highlights October 2013
Steady global demand but major markets slow down
VASEP has forecast lower production in 2013, which together with other measures should help stabilize pangasius prices. Imports into the EU took a step back with the on-going Euro-crisis while US imports grew marginally. Elsewhere, demand remains strong for pangasius fillet and is being met by both local and imported sources.
PANGASIUS
Viet Nam
The Viet Nam Association of Seafood Exporters and Producers (VASEP) has forecast lower production of pangasius in 2013 at about 800 000 tonnes compared with 1.2-1.5 million tonnes previously targeted. Production in the first seven months of 2013 was lower than a year ago with output from the main producing regions down by an average of 10%. VASEP reports that market and price volatility discouraged farmers while many processors barely made profits.
During the period January-June 2013, VASEP reported USD 850 million worth of pangasius exports from Viet Nam, down marginally (-0.5%) from the same period last year. The US remains the single largest market with nearly 13% more import value from last year with about 52 000 tonnes. The European Union, however, took a smaller share. Latin America, Southeast Asia and the Middle East showed higher import values. Central American markets, namely Brazil, Mexico and Colombia, also imported more from Viet Nam.
Meanwhile, VASEP has proposed setting up one company to represent all local pangasius exporters in selling products to the EU in a move to cut costs and prevent excessive competition and price reductions among local exporters. The proposed company will sell Vietnamese pangasius directly to EU supermarkets and distributors at an electronic auction in Belgium’s Zeebrugge port. Belgium will send experts to Viet Nam to assist in selling pangasius directly to EU distributors from Zeebrugge port.
Philippines
The Department of Trade and Industry is offering its service facilities to the pangasius industry as part of a plan to help develop the sector. The department has offered to lend its facilities to be shared by priority industry clusters and has done an initial identification of areas that want to avail themselves of these facilities. The facilities will provide an area where equipment for pangasius processing can be shared by several cooperatives. The facilities are similar to the fish processing plants that have already been set up in other areas.
The shared service programme aims to help develop micro, small and medium scale enterprises to be more
competitive in local and foreign markets. It has a budget allocation of around PHP 700 million (USD 16 million).
The trade department said it aims to set up 800 such facilities nationwide. The agency has several pilot projects for the pangasius industry in Regions 3 to 5 and 8 to 12. Pangasius was introduced to the country in 1981. Between January and May 2013 the Philippines imported 42% more pangasius fillet from Viet Nam at 5 955 tonnes compared with a year ago.
India
Pangasius imports have come to a standstill in the last two months because of the weakening Indian rupee. However, during the January-May 2013 period, India imported 2 291 tonnes of frozen pangasius fillet from Viet Nam compared with only 981 tonnes a year before, the Ministry of Commerce reports. Pangasius fillet is widely used in the catering sector. Meanwhile, locally produced pangasius fillet is making steady inroads in the market although the fillet size is smaller compared with imported pangasius.
USA
Pangasius
During the first half of 2013, frozen catfish imports increased only marginally (+4.2%) to reach 52 397 tonnes compared with a year ago, constrained by tight supply from the major producer, Viet Nam. In a move to help strengthen prices, nine Vietnamese exporters will be reducing their export volume to 5 000 tonnes a month from the earlier 12 244 tonnes.
Domestic catfish
August has been designated as National Catfish Month to honour US catfish farmers, recognizing contributions that the United States catfish industry have made to the economy since the 1980s. The southern states of Louisiana, Mississippi, Alabama and Arkansas produce most of the nation’s catfish. Mississippi is the leading producer of farm-raised catfish but Texans consume more catfish that any other state. Belzoni, Mississippi is also known as the catfish capital of the world and hosts the Annual World Catfish Festival.

28 Globefish Highlights October 2013
Source: European Price Report
PANGASIUS
EU
In the first six months of 2013, imports of frozen pangasius fillet into the EU-27 declined by 12% from the same period last year reaching 69 841 tonnes, in contrast to the positive trend seen during the first quarter of 2013. Spain remains the largest importer within the EU and absorbed 14% more with nearly 16 000 tonnes compared with the same period last year. Denmark, Greece, Lithuania, Romania and Sweden imported more. Average import prices declined by 14% to USD 2.38/kg compared with the same time last year.
Asia
Pangasius imports into Asian markets were generally positive from January to June 2013 with most countries buying more. Imports into Singapore, Thailand, China, Republic of Korea, India and Japan all increased by an average of 50%. Approximately 30 000 tonnes of frozen pangasius fillet was imported into Asian countries during this period compared with about 20 000 tonnes a year ago. Demand for pangasius remains strong in Asia within households as well as in the catering sector. However, imports into Indonesia were negligible because of the stringent government regulations to ensure the quality of imported fish as well as to encourage consumption of local fish. The government is also targeting local production of pangasius and hopes to reach 1.1 million tonnes this year.
Outlook
Global supply of pangasius is likely to be lower this year with the major producer Viet Nam forecasting a nearly 40% decline in production. More products will be diverted to other markets besides the depressed EU market where imports have waned. Supplies to fulfill the steady demand from across the globe will also come from other producers worldwide but particularly in Asia.
ImportsFrozen Catfish fillets: USA
Jan-Jun2008 2009 2010 2011 2012 2013
(1 000 tonnes)Viet Nam 12.5 16.4 19.6 34.9 47.4 48.5
China 9.2 4.3 5.6 2.0 0.2 0.0
Thailand 3.5 3.5 1.4 0.7 0.0 0.0
Malaysia 0.5 0.1 0.3 0.0 0.0 0.0
Indonesia 0.4 0.2 0.1 0.0 0.0 0.0
Others 0.7 0.9 1.0 0.3 0.0 0.0
Total 26.8 25.4 28.0 37.9 47.6 48.5Source: NMFS
2.052.00
1.50
2.00
2.50
3.00
3.50
Sep-
08
Jan-
09
May
-09
Sep-
09
Jan-
10
May
-10
Sep-
10
Jan-
11
May
-11
Sep-
11
Jan-
12
May
-12
Sep-
12
Jan-
13
May
-13
Sep-
13
Fillets - interleaved, 20% glaze, skinless, boneless, belly-off
Fillets - IQF, white, 20%, 1kg poly bagUSD/kg
Pangasius - in Spain, origin: Viet Nam
PANGASIUS NEWS Viet Nam sees jump in pangasius exports to Ukraine
Vietnamese pangasius exports to Ukraine were up 6.6% on the previous year from January to August 2013, reports Pan-gasius Viet Nam, citing Vietnamese customs.Exports in the first eight months of the year were valued at USD 21 million, compared with USD 19.7 million in the same period of 2012. Some exporters said sales to this market jumped in three recent months.Ukrainian demand for imported pangasius is expected to strongly increase in the coming months as pangasius prod-ucts are welcomed more and more by consumers, said the news website.Earlier this year, an inspection delegation of Ukraine State Agency for Fisheries visited Viet Nam to assess the manage-ment of hygiene and food safety in Vietnamese seafood processing facilities, and the monitoring system of farming, processing and transportation activities in order to ensure the quality of seafood products imported into Ukraine.Overall Vietnamese exports fared less well, however. Through August 2013, Viet Nam pangasius exports totaled USD 1.135 billion, a 1.6% drop against the corresponding pe-riod in 2012. Source: Undercurrent News
Pangasius exports to China up 72% in June 2013
A significant year-on-year increase in Vietnamese pangasius exports to China and Hong Kong SAR mean exports to China and Hong Kong SAR are up 21.5% for the first half of 2013.Exports have climbed by 72.7% in June alone, equating to USD 8.014 million of pangasius, according to statistics from the Viet Nam Association of Seafood Exporters and Produc-ers. China and Hong Kong SAR accounted for 4.7% of Viet Nam’s pangasius exports in January to June 2013, but 5.7% of them in June alone. In July statistics revealed China had become the third largest market for Vietnamese seafood generally, overtaking the Republic of Korea.With imports of USD 231 million in first six months of 2013, China made up nearly 28% of total seafood exports from Viet Nam.In the first quarter of 2013, Viet Nam seafood exports to Chi-na were valued at USD 98 million, up 8% over the same pe-riod of 2012, and the positive growth continued in Q2 2013.Source: Undercurrent News

29Globefish Highlights October 2013
Turkey becomes largest producer but prices weaken and costs continue to rise
The increasing volumes of seabass and seabream that are coming to market have led to weaker prices. Although consumers have reason to be happy, producers are in a different position as margins have taken a serious hit. This is particularly the case for bass where volumes are up between 7 and 10% this year whereas bream volumes have actually fallen somewhat and prices remain at the level of 2012. Companies have also been suffering from tight credit and rising costs on feed, putting many firms in the red. The largest of all the companies in Greece, and in fact the largest producer of bass and bream in the world, the merged Dias-Selonda company, applied for bankruptcy protection in September.In general, the build-up of supply in a weak market was bound to cause lower prices in the short term. Over time, markets will certainly be able to absorb the larger volumes but for a more stable long-term balance in the market, more product innovation and the development of additional markets is clearly needed.
EUROPEAN SEABASS AND GILTHEAD SEABREAM
Source: European Price Report
Seabass (Dicentrarchus
labrax), 49%
Seabream (Sparus aurata),
51%
Seabass and seabream production (2011)(in 1 000 tonnes)
Source: FAO
Prices
Generally, in the bass and bream market, prices remain strong and firming during winter and spring as most suppliers have no fish available for sale during this period. With rising water temperatures and new growth, the fish reaches market size in early summer and the additional volumes coming to market start exerting pressure on prices. This pattern is fairly cyclical and repeats itself year after year. Compared with 2012, however, seabass prices were significantly lower in the first half of this year whereas seabream prices were quite similar to 2012 levels during the same period.
Lower prices have stimulated demand but most markets remain weak with only limited signs of recovery in sight. In some markets such as France, the abundant catches of wild cod from northern Europe at attractive prices may have created some additional competition for bass and bream, although normally the species are not seen as direct competitors.
5.00
3.93
3.03.54.04.55.05.56.06.5
Sep-
08
Jan-
09
May
-09
Sep-
09
Jan-
10
May
-10
Sep-
10
Jan-
11
May
-11
Sep-
11
Jan-
12
May
-12
Sep-
12
Jan-
13
May
-13
Sep-
13
Seabass and Seabream - In Italy, origin: Greece
Seabass fresh whole 300-450 gr/pc
Seabream fresh whole 300-450 gr/pcEUR/kg
Supply
Strong increases in shipments from Turkey of bream (+66%) and bass (+81%) during the first six months of the year caused Turkey’s export to reach 16 300 tonnes (+73%) for the period. Undoubtedly, this has led to weaker prices and margins as the market was not able to absorb such increasing quantities in a context of uncertain demand. It could be argued that Turkey’s exports also go to new and emerging markets such as the Middle East, Russia and the US and not exclusively to the EU, but Italy remains Turkey’s largest single market at 3 100 tonnes (+48%) followed by the Netherlands at 2 900 tonnes

30 Globefish Highlights October 2013
EUROPEAN SEABASS AND GILTHEAD SEABREAM
ProductionSeabass (Dicentrarchus labrax): World
Jan-Jun2008 2009 2010 2011 2012* 2013*
(1 000 tonnes)Turkey 49.3 46.6 50.8 47.0 65.0 78.0
Greece 35.5 33.9 40.2 44.4 35.0 32.0
Egypt 5.5 6.7 17.6 18.7 20.0 20.0
Spain 10.3 13.3 12.2 18.4 8.0 7.0
Italy 7.0 6.9 7.0 7.0 7.0 6.0
France 7.4 9.6 8.0 6.0 6.0 6.0
Others 8.2 5.3 9.7 12.2 15.0 19.0
Total 123.2 122.2 145.6 153.7 156.0 168.0Source: FAO (until 2011) (*) Estimate
Production Seabream (Sparus aurata): World
Jan-Jun2008 2009 2010 2011 2012* 2013*
(1 000 tonnes)Greece 52.2 60.7 57.4 71.1 66.0 62.0
Turkey 33.2 29.5 29.3 33.0 31.0 30.0
Spain 23.5 24.4 21.4 16.4 16.0 14.0
Egypt 7.2 8.1 17.1 15.9 9.0 10.0
Italy 5.8 5.7 6.6 6.7 5.0 5.0
Tunisia 1.8 2.0 2.8 4.6 5.0 4.0
Cyprus 1.9 2.6 2.8 3.1 4.0 3.0
France 1.7 1.5 2.6 2.4 2.0 2.0
Others 12.3 11.7 12.0 11.0 11.0 14.0
Total 137.8 144.1 150.9 162.2 149.0 144.0Source: FAO (until 2011) (*) Estimate
ImportsFresh Seabream and Seabass: Italy(quantity)
Jan-Jun2008 2009 2010 2011 2012 2013
(1 000 tonnes)Seabream(dentex/pagellus)
Spain 0.2 0.3 0.3 0.3 0.3 0.3
Greece 0.9 0.6 0.6 0.4 0.5 0.2
Total 1.3 1.1 1.1 0.8 0.9 0.5Seabream(gilthead)
Greece 7.0 7.5 8.3 8.3 9.3 8.8
Turkey 0.7 0.9 1.0 1.0 0.9 1.5
Malta 0.5 0.5 0.7 0.8 1.0 0.7
Total 8.8 9.6 10.8 11.0 12.3 12.1SeabassGreece 5.3 5.1 8.0 8.4 7.3 6.9
Turkey 1.4 2.3 1.2 0.9 1.2 1.5
Croatia 0.4 0.4 0.5 0.9 0.6 0.6
France 1.0 0.8 0.6 0.6 0.5 0.5
Total 8.4 8.8 10.5 11.1 10.1 9.9Gr.Total 18.4 19.5 22.3 22.9 23.3 22.5
Source: ISTAT
(+190% including re-exports). Turkish exports to Spain with 2 000 tonnes are also substantial (+43%). Overall, therefore, the rapid increase in shipped volumes has led to increased demand as consumers benefit from lower prices but at the expense of prices and margins. Turkish producers have also developed new value added products, especially frozen fillets for a number of catering markets.
At the same time Greece, traditionally the leading producer but now behind Turkey, saw export volumes drop 6.5% to 37 100 tonnes for the period with Italy (-12%), Spain (+12%) and France (-6.4%) as the principal destinations. Early harvesting at smaller sizes by some Greek producers will decrease overall volumes for the year.
Markets
Italy: declining sales in Europe’s largest market for bass and bream
The Italian market continues to suffer from falling purchasing power among consumers. The decision to increase the VAT in October will not improve matters and the economy remains in recession with hope of a modest rebound postponed to late 2014.
Both values and volumes for the first two quarters were down. Despite low prices buying interest was hesitant and imported volumes dropped by 3.4%.
The drop in sales in Italy is not limited to bass and bream but the whole seafood segment is affected. This time retailers cannot be accused of overcharging for products; to the contrary, supermarkets have done much to promote the product and for most of the year portion sized fish from Greece has been on sale at around EUR 5-6 per kilo.
During the period, shipments from Greece dropped whereas Turkey increased sales to Italy.
France: the rebound continues after weak 2012
As observed during the first quarter, France represents a positive element in an otherwise difficult market. Import volumes were up a significant 30% from

31Globefish Highlights October 2013
EUROPEAN SEABASS AND GILTHEAD SEABREAM
2012, which, however, was the worst year since 2008 for bass and bream imports. Import values were up only 10% during the semester given that prices were lower than in 2012.
Of note is the fact that both Greece and Spain increased their shipments to France during the semester. Spanish producers have for some time intensified their export activities as a result of a difficult domestic market and this is evidently having some success. For Greek exporters, France has become an important market although some of the volumes may include re-exports from Turkey.
Spain: higher imports but growing exports as well
Together with France, Spain represents a positive sign in the bass and bream market. The domestic economy continued to suffer but at least the bass and bream market has shown signs of new vigour, with volumes in fact bouncing back an impressive 38% during the semester.
ImportsFresh Seabream and Seabass: France(value)
Jan-Jun2008 2009 2010 2011 2012 2013
(million Euro)Seabream(dentex/pagellus)
Spain 0.7 0.6 0.7 1.2 1.1 0.6
Greece 1.3 1.3 1.4 2.6 1.4 0.2
Total 2.6 2.4 2.9 5.0 2.8 1.1Seabream(gilthead)
Greece 7.5 10.4 11.2 11.6 9.4 11.2
Spain 2.5 2.8 3.0 1.4 4.8 6.3
Total 10.5 13.6 15.6 14.6 15.6 19.9SeabassGreece 7.2 6.4 8.4 9.9 8.1 6.8
Spain 0.5 0.6 1.3 1.8 2.2 3.9
Netherlands 1.3 0.9 0.9 0.9 1.1 1.1
Total 11.0 10.7 12.4 14.5 14.1 14.6Gr. Total 24.2 26.7 30.9 34.1 32.4 35.6
Source: Direction Nationale des Statistiques du CommerceExtérieur – DNSCE
ImportsFresh Seabream and Seabass: France(quantity)
Jan-Jun2008 2009 2010 2011 2012 2013
(1 000 tonnes)Seabream(dentex/pagellus)
Spain 0.2 0.2 0.2 0.3 0.3 0.1
Greece 0.4 0.3 0.3 0.5 0.3 0.0
Total 0.7 0.7 0.8 1.0 0.7 0.3Seabream(gilthead)
Greece 1.9 3.0 2.5 2.3 1.8 3.0
Spain 0.7 0.9 0.7 0.3 0.9 1.3
Total 2.7 3.9 3.5 2.8 3.0 4.7SeabassGreece 1.4 1.5 1.7 2.0 1.3 1.4
Spain 0.1 0.1 0.2 0.3 0.4 0.6
Total 2.1 2.3 2.4 2.7 2.3 2.7Gr. Total 5.6 7.0 6.7 6.6 5.9 7.7
Source: Direction Nationale des Statistiques du CommerceExtérieur – DNSCE
ImportsFresh Seabream and Seabass: Italy(value)
Jan-Jun2008 2009 2010 2011 2012 2013
(million Euro)Seabream(dentex/pagellus)
Spain 2.5 2.8 2.9 2.8 3.0 2.7
Greece 3.6 2.8 3.0 2.3 2.9 0.9
Portugal 0.9 1.0 1.0 1.3 0.8 0.8
Total 7.7 7.5 7.8 6.7 7.2 4.8
Seabream(gilthead)
Greece 24.6 27.2 35.9 42.2 40.7 38.2
Turkey 2.2 2.9 3.9 4.7 3.6 6.0
Malta 1.8 1.8 3.1 4.2 4.0 2.9
Spain 1.9 2.2 2.2 2.3 3.2 2.4
Total 32.8 36.7 48.4 57.7 55.7 54.5
SeabassGreece 25.0 23.3 35.1 40.7 41.0 35.6
Turkey 6.2 8.2 4.1 3.8 6.0 6.0
France 7.5 6.4 5.2 5.3 4.1 4.3
Croatia 2.0 1.7 2.1 4.0 2.8 3.1
Spain 0.8 0.6 1.0 0.8 1.5 2.2
Total 43.2 41.5 49.1 57.3 57.5 52.5Gr.Total 83.7 85.8 105.3 121.7 120.3 111.8
Source: ISTAT

32 Globefish Highlights October 2013
EUROPEAN SEABASS AND GILTHEAD SEABREAM
ImportsFresh Seabream and Seabass: Spain (value)
Jan-Jun2008 2009 2010 2011 2012 2013
(million Euro)Seabream(all species)
Greece 14.8 16.4 16.5 20.2 14.1 18.9
Turkey 2.1 1.1 0.4 5.1 4.6 3.5
Morocco 0.8 0.8 0.6 1.8 1.9 1.5
Portugal 1.5 0.7 0.5 0.5 1.2 1.4
France 1.3 1.7 1.7 0.8 0.6 0.7
Total 21.2 21.0 20.3 28.9 22.5 26.2SeabassGreece 12.2 8.5 10.4 10.9 7.6 11.7
Turkey 6.2 5.8 4.8 4.8 1.8 5.2
France 3.1 2.5 2.0 1.6 1.6 1.6
Total 23.0 17.9 18.2 17.9 11.3 19.2Gr. Total 44.2 38.9 38.5 46.8 33.7 45.4
Source: Agencia Tributaria
ImportsFresh Seabass: UK
Jan-Jun2008 2009 2010 2011 2012 2013
(1 000 tonnes)Greece 1.5 0.9 1.7 2.3 2.3 2.7
Netherlands 0.3 0.7 1.0 0.8 0.6 1.2
Italy 0.4 0.4 0.1 0.1 0.0 0.0
France 0.5 0.3 0.2 0.4 0.3 0.2
Others 0.0 0.3 0.2 0.1 0.6 0.9
Total 2.7 2.7 3.1 3.7 3.9 5.0Source : Her Majesty’s Revenue & Customs
ImportsFresh Seabream: UK
Jan-Jun2008 2009 2010 2011 2012 2013
(1 000 tonnes)Greece 0.5 0.5 0.5 0.6 1.2 1.6
Netherlands 0.1 0.3 0.3 0.3 0.2 0.4
France 0.1 0.2 0.1 0.2 0.1 0.1
Others 0.3 0.2 0.2 0.3 0.4 0.2
Total 1.0 1.1 1.1 1.3 1.9 2.3Source : Her Majesty’s Revenue & Customs
Of note is the fact that total bass imports doubled from 2 000 to 4 000 tonnes, whereas bream imports were up a more modest 11%.
UK: market expands thanks to product innovation
The encouraging development in the UK market was sustained with imports reaching 7 300 tonnes, up a remarkable 26% for the period. Greece continued to be the
principal supplier for the UK followed by the Netherlands, which mostly represents re-exports from Turkey. The UK market is different from Continental Europe as frozen fillets are very popular in the supermarket chains thanks to inviting packaging and constant product innovation. As frozen fillets are not included in the above numbers the real size of imports, and thus the extent of the UK market, is even larger.
Germany
The German market continued to increase its imports with volumes up 69% during the first semester to reach almost 3 000 tonnes. Although some volumes may be for re-exports, there is no doubt that the German market has developed significantly over the last few years.
USA: Strong growth
US import volumes of bass and bream rose by a remarkable 40% during the first 6 months of 2013 to reach almost 2 200 tonnes. Fresh bass made up 86% of the volume whereas fresh bream constituted around 10%. Greece, with 60% of the market, is the leading supplier although Turkey has been gaining ground lately to reach 10%.
ImportsFresh Seabream and Seabass: Spain(quantity)
Jan-Jun2008 2009 2010 2011 2012 2013
(1 000 tonnes)Seabream(all species)
Greece 4.2 4.7 3.9 3.9 3.2 3.9
Turkey 0.6 0.3 0.1 1.0 1.1 0.9
Morocco 0.2 0.2 0.1 0.2 0.2 0.2
France 0.2 0.2 0.2 0.1 0.0 0.0
Total 5.7 5.7 4.6 5.5 4.6 5.1SeabassGreece 2.5 1.9 2.5 2.2 1.5 2.5
Turkey 1.4 1.5 1.3 1.1 0.4 1.2
France 0.3 0.3 0.2 0.2 0.1 0.1
Total 4.4 3.9 4.1 3.5 2.0 4.0Gr. Total 10.1 9.6 8.7 9.0 6.6 9.1
Source: Agencia Tributaria

33Globefish Highlights October 2013
The growth in the US market is indeed a positive phenomenon. Although the quantities are not huge, the US market provides additional possibilities for Mediterranean producers in a difficult overall market. Suppliers should be aware however that the US fresh market is extremely price sensitive and exposed to the health of the dining-out market.
Middle East: Sharp rise in Lebanese imports
Turkish and Greek producers have for years sought to introduce their products in new markets. That this is bearing fruit is shown by the strong demand represented by Lebanon, which during the first six months of 2013 reached 2 100 tonnes of bass and bream imported from Turkey alone, up 110 % from the previous year.
Outlook
The UK, US, German, Middle Eastern and Russian markets are all developing nicely, and traditional markets such as Spain and France have also rebounded in 2013. However Italy, the largest market, remains difficult and is not expected to turn this year. Likewise, volume growth for the most part has been caused by lower prices, especially for bass.
ExportsFresh Seabass : Greece
Jan-Jun2008 2009 2010 2011 2012 2013
(1 000 tonnes)Italy 7.8 7.1 8.9 9.0 7.9 6.9
Spain 2.6 2.0 2.8 2.1 1.2 1.8
France 1.6 1.5 1.8 2.0 1.7 1.4
Portugal 1.0 1.1 1.3 1.3 1.1 1.2
UK 1.5 0.9 1.7 2.0 1.1 1.2
Others 1.5 1.3 1.8 2.3 2.0 1.4
Total 16.0 13.9 18.3 18.7 15.0 13.9Source : EUROSTAT
ExportsFresh Seabream: Greece
Jan-Jun2008 2009 2010 2011 2012 2013
(1 000 tonnes)Italy 13.3 13.8 13.8 10.2 10.7 9.4
Spain 5.2 5.3 4.1 4.2 4.6 4.7
France 3.1 3.5 3.3 3.1 3.0 3.0
Portugal 1.3 2.3 1.2 2.1 2.3 2.4
Germany 1.0 1.2 1.1 1.0 1.2 1.1
Others 2.4 2.6 2.6 2.6 2.9 2.6
Total 26.3 28.7 26.1 23.2 24.7 23.2Source : EUROSTAT
ExportsFresh Seabass : Turkey
Jan-Jun2008 2009 2010 2011 2012 2013
(1 000 tonnes)Ita;y 1.4 2.3 1.2 0.9 1.2 1.5
Netherlands 1.0 1.2 0.9 0.8 0.5 1.5
Spain 1.1 1.5 1.3 1.1 0.4 1.2
Russian Fed 0.1 0.0 0.3 0.7 0.5 1.1
Lebanon 0.2 0.5 0.7 0.6 0.3 0.5
Greece 2.1 1.5 1.0 0.4 0.4 0.0
Others 0.1 0.4 0.4 0.5 1.0 2.0
Total 6.0 7.4 5.8 5.0 4.3 7.8Source : State Institute of Statistics
ExportsFresh Seabream : Turkey
Jan-Jun2008 2009 2010 2011 2012 2013
(1 000 tonnes)Lebanon 0.5 1.0 1.0 1.0 0.7 1.6
Italy 0.7 0.9 1.0 1.0 0.9 1.6
Netherlands 0.6 0.5 0.4 0.5 0.5 1.4
Russian Fed 0.1 0.0 0.3 0.7 0.8 1.1
Spain 0.6 0.3 0.1 1.1 1.0 0.8
Others 0.4 0.7 0.6 0.8 1.2 2.0
Total 2.9 3.4 3.4 5.1 5.1 8.5Source : State Institute of Statistics
ImportsFresh Seabream and Seabass: Germany
Jan-Jun2008 2009 2010 2011 2012 2013
(1 000 tonnes)Seabream(dentex/pagellus)
Greece 0.2 0.2 0.3 0.2 0.2 0.2
Total 0.3 0.3 0.3 0.2 0.2 0.2Seabream 0.0 0.0 0.0 0.0 0.0 0.0
(gilthead) 0.0 0.0 0.0 0.0 0.0 0.0
Greece 0.3 0.4 0.5 0.4 0.5 0.6
Italy 0.1 0.1 0.1 0.1 0.0 0.1
France 0.0 0.1 0.0 0.0 0.0 0.0
Turkey 0.0 0.0 0.0 0.1 0.2 0.7
Total 0.6 0.7 0.7 0.7 0.7 1.7Seabass 0.0 0.0 0.0 0.0 0.0 0.0
Greece 0.1 0.2 0.3 0.3 0.3 0.3
France 0.1 0.1 0.1 0.1 0.1 0.1
Italy 0.0 0.0 0.1 0.2 0.0 0.1
Total 0.4 0.4 0.5 0.7 0.8 1.1Gr.Total 1.3 1.4 1.6 1.6 1.8 3.0
Source: Germany Customs
EUROPEAN SEABASS AND GILTHEAD SEABREAM

34 Globefish Highlights October 2013
This situation is not expected to change in the near future. Plentiful supplies from Turkey will keep markets well replenished and prices can be expected to weaken even further over the coming months with recovery in prices only to be expected during early 2014. Bass prices are particularly under strain as production increases for this species have been the most pronounced.
Seabass and Seabream Market Report - Turkey
Based on output of marine hatcheries it is estimated that the volume of production of seabass and seabream in Turkey for 2013 will exceed 100 000 tonnes; some suggest that even 120 000 tonnes could be reached. 65% of the production comes from farms in Muğla province, 30% from İzmir and the remaining supply comes from the Black Sea region. This year, 70-75% of production is expected to go for export and the remaining 25-30% to domestic markets.
Water temperatures off the Turkish Aegean and Mediterranean coasts during July to September provide an ideal temperature range for growing seabass and seabream and production and harvesting peak in this period. It also coincides with the high tourism season in Turkey, boosting domestic demand for both species.
At the same time demand for feed increases and farmers tend to increase fish sales during this period, which leads to higher supply volumes and thus lower prices in the market. The opening of the capture fisheries season on 1 September also has a negative impact on prices of farmed fish.
Domestic Market
In the high season during July to September domestic consumption of seabass and seabream is estimated at 2 000 tonnes per month, with the most popular sizes for seabass ranging from 300-400g (TRY 10/kg) to 600-800g (TRY 15/kg) and for seabream from 200g (TRY 7.5/kg) to 400g (TRY 9.5/kg).
In summer 2013 both domestic and export prices for both species were similar, with domestic prices lower this year compared with last year. Normally export prices are higher.
Small to medium-sized cage farms sell mainly to domestic markets, as do land-based farms using earthen ponds (nearly 4 000 tonnes in total). Pond reared seabass and seabream usually fetch a premium (+TRY 2/kg) compared with the
price of cage fish.
Export Markets
Exports of seabass and seabream during the July-September 2013 period are estimated at about 6 000 tonnes per month, of which 60% was seabass. Fillets and fresh/chilled fish are the main export products. A weaker Lira against major foreign currencies favoured exports in August and September.
Average export prices of seabass and seabream for summer 2013 were as following:
Seabass Seabream200-300g EUR 3.6/kg 200-300g EUR 3.5/kg
300-400g EUR 4.5/kg 300-400g EUR 4.25/kg
400-600g EUR 5.5/kg 400-600g EUR 5.0/kg
600-800g EUR 6.5/kg 600-800g EUR 6.5/kg
800-1000g EUR 9.0/kg - -
Opportunities
With the active involvement of the “Seafood Promotion Committee” (STG) in market promotion, Turkey is expanding and diversifying its international seafood markets. The Russian Federation, USA and Middle East are emerging markets for Turkish farmed seafood.
Companies are promoting the production of more value added products for export. New packaging/processing facilities are adding to the seafood processing capacity of Turkish aquaculture companies. Major Turkish aquaculture companies are considering investing in aquaculture in Middle East and North African countries.
Constraints
On the domestic market retailers have a significant influence on price formation, also because neither farmers nor farmers’ organizations are active in regulating supply, nor do they undertake any concerted marketing or take measures aiming at more price stability.
Up till April 2012, the government paid a production premium to producers. The end to this scheme has added to the cash-flow problems of some farmers although the major cause is in low prices.
EUROPEAN SEABASS AND GILTHEAD SEABREAM

35Globefish Highlights October 2013
Booming market finally begins to cool as growing consumer resistance to mark-ups reverses upward trend
Since the recovery that began in late 2012, the salmon market has witnessed continued driving growth and a positive price trajectory lifting export revenues to record levels, particularly for Norwegian producers supplying EU markets. This price trend has recently been reversed, however, and there is evidence of weakening demand as high raw material costs filter down the value chain. For Chilean producers still struggling to achieve profitability while dealing with disease concerns and stricter farming regulations, the focus has switched to the USA and to newer markets such as Brazil to compensate for a weakening Japanese market.
SALMON
Prices
Prices leveled off over the summer and have now begun to drop as demand cools in the face of delayed but inevitable mark-ups on salmon products by retailers. The price decline is not uniform amongst the different sizes, with a relative surplus of smaller fish on the market that is pushing prices down faster than those of other sizes. However, it is thought that demand in major markets is still strong enough, and supply still sufficiently tight, to
Source: European Price Report
Salmon fillet prices (FOB Miami, chilled, C-trim, Alt. fresh, 3-4 bs)
Source: EPR
Atlantic salmon 44.2%
Pink(=Humpback)salmon15%
Sockeye(=Red)salmon4.1%
Coho(=Silver)salmon 4.6%
Chum(=Keta=Dog)
salmon7.1%
Salmon (farmed and wild) production by species (2011)
Source: FAO
4.80
2.02.53.03.54.04.55.05.56.06.5
Sep-
08
Jan-
09
May
-09
Sep-
09
Jan-
10
May
-10
Sep-
10
Jan-
11
May
-11
Sep-
11
Jan-
12
May
-12
Sep-
12
Jan-
13
May
-13
Sep-
13
Salmon - In Europe, origin: Norway
Fresh, gutted, head-on, 3-6 kg/pcEUR/kg
2.00
2.50
3.00
3.50
4.00
4.50
5.00
5.50
6.00
Sep-07 Sep-08 Sep-09 Sep-10 Sep-11 Sep-12 Sep-13
ProductionFarmed salmon: World
Jan-Dec2008 2009 2010 2011 2012* 2013*
(1 000 tonnes)ATLANTIC SALMONNorway 737.7 862.9 927.9 1060.0 1075.0 1050.0
Chile 388.8 233.3 123.2 264.3 310.0 330.0
UK 128.7 133.4 154.6 158.0 160.0 155.0
Canada 104.1 100.2 101.4 102.1 120.0 115.0
Faeroe Is. 38.5 51.4 45.4 60.5 60.0 60.0
Australia 25.7 29.9 31.8 35.2 31.0 31.0
Ireland 10.0 12.0 15.0 15.0 15.0 15.0
USA 16.7 14.1 19.5 18.6 16.0 15.0
Others 1.0 5.0 2.0 2.0 3.0 3.0
Total 1451.3 1440.0 1426.0 1721.0 1790.0 1774.0PACIFIC SALMONJapan 12.8 15.8 14.8 0.1 8.0 8.0
Chile 92.4 157.6 123.4 160.7 195.0 210.0
New Zealand 9.1 12.4 12.9 14.0 12.0 12.0
Total 114.3 185.7 151.1 174.8 215.0 230.0Gr. Total 1565.6 1625.7 1577.1 1895.8 2005.0 2004.0
Source: FAO (until 2011) (*) Estimate

36 Globefish Highlights October 2013
ensure average Norwegian export prices remain above NOK 30/kg, before picking up again as seasonal demand kicks in later in the year.
Meanwhile, export prices on US markets for Chilean products have levelled out slightly above the 3-year average whereas in Japan prices for Chilean coho were rising but from very low levels, which dragged down Chile’s export revenues in the first two quarters of 2013.
Norway
With high prices supported by firm demand, particularly on the most important EU markets, Norwegian suppliers continued breaking records throughout the first half of the year. According to the Norwegian Seafood Council, the value of Norwegian salmon exports in the first half of 2013 totalled NOK 17.4 billion, a new record. This represents an increase of NOK 3.4 billion, or 25% more than in the first half of 2012.
Part of the reason for the lucrative price levels was lower harvest volumes in the first half of the year resulting from biomass restrictions and colder water temperatures this year. These conditions meant lower export volumes in the first two quarters of 431 000 tonnes, a 7% decrease compared with last year. Famers have tried to hold off on harvesting until later than usual in order to take full advantage of the high profit margins, but are now being forced to put more volume on the market.
84% of the export volume in the first half of the
year was fresh whole Atlantics, 7% fresh fillets, 4% frozen whole Atlantics and 4% frozen fillets.
Despite a decline in the total volume of exports, the export volume to Norway’s top market, the EU, remained largely unchanged, with an increase in value of some 35% to NOK 11.9 billion. Almost 69% of the volume of Norwegian salmon exports in the first half of 2013 went to countries in the EU, up from 65% in the same period last year.
France was the biggest market for Norwegian salmon, with an export volume of 60 000 tonnes (NOK 2.5 billion), down by 6% (up 29%) from the same period last year. Poland was the biggest growth market in the EU, up by 12% (up 61%) to 55 000 tonnes (NOK 2.2 billion). Exports to Russia, however, fell by some 22% (up 9%) to around 49 000 tonnes (NOK 1.8 billion) as the price-sensitive Russian market replaced Norwegian fresh whole Atlantics with increased quantities of cheaper frozen Chilean product.
In the first two quarters of 2013, exports to Asia were down by 18% or 12 000 tonnes. The biggest reductions were in exports to Taiwan Province of China (down 3 000 tonnes) and Japan (down by almost 3 000 tonnes). Exports to the USA also dropped, by 24%, as Chile re-established its position as prime supplier to the US market.
Latest figures for the month of August show a year-on-year 9% decline in export volume of Norwegian salmon, while considerably higher prices than last year meant a 28% increase in value.
Norwegian trout exports up in value
In the first half of 2013, the value of exports of Norwegian fjord trout increased by NOK 197 million to a total of NOK 1 billion. The volume of exports totalled 26 100 tonnes, on a par with the same period last year. While exports to eastern Europe declined, growth was seen in exports to the EU and Asia. In the EU, exports increased to Poland and Denmark in particular, while in Asia the biggest growth markets were Thailand and China.
Chile
The Chilean salmon industry is undergoing an important transformation process that seeks to overcome the current financial crisis and to address high production costs. The high production costs incurred by local companies make them less competitive compared with Norway-based salmon farms and this is a source of loss and negative returns. The industry is involved in acquisitions and mergers driven by financial institutions and needs to focus on reducing the number of companies in order to improve the management of production volumes and to increase the price of salmon. Health problems caused by
Exports (value)Salmon and Trout: Norway
Jan-Jun2008 2009 2010 2011 2012 2013
(bill. NOK)Salmon 7.9 10.4 13.4 14.7 14.0 17.5
Fresh 6.4 8.1 10.1 11.4 11.1 14.4
Frozen 0.4 0.4 0.5 0.7 0.5 0.4
Fresh fillet 0.7 1.2 1.8 1.6 1.4 1.7
Froz. Fillet 0.4 0.7 1.0 1.0 1.0 1.0
Trout 0.8 1.0 0.7 0.6 0.8 1.0
Source: Norwegian Seafood Council
Exports (quantity)Salmon and Trout: Norway
Jan-Jun2008 2009 2010 2011 2012 2013
(1 000 tonnes)Salmon 275.2 301.9 343.2 347.2 450.1 429.0
Fresh 245.0 255.0 278.2 290.7 385.0 370.5
Frozen 15.1 11.6 14.6 15.9 16.4 10.5
Fresh fillet 6.7 24.3 34.7 26.9 31.4 32.5
Froz. Fillet 8.4 11.0 15.7 13.7 17.3 15.5
Trout 35.0 31.0 18.5 13.9 26.0 26.1
Source: Norwegian Seafood Council
SALMON

37Globefish Highlights October 2013
SALMON
the ISA virus and measures imposed by health authorities have forced producers to decrease the size at which salmon is harvested. Previously 5 kilos was regarded as the optimum size but now, to minimize risks, the size is around 4 kilos, which implies a loss of profit margin and product image.
Exports
During the period January-June 2013, total exports of salmonids were 297 600 tonnes, which means an 18% increase compared with the same time in 2012. On average, FOB prices (unit value) for salmonid exports went down by 12%, to USD 5.67/kg, in relation to the same period of 2012.
Atlantic salmon was the most exported species throughout the first semester with 150 400 tonnes for a total of USD 1.02 billion, with an average FOB price of USD 6.76/kg. In terms of quantity, a significant rise of 51% was registered along with a 49% increase in value. Coho salmon was the second most important species
Exports (quantity)Salmon and Trout: Chile
Jan-Jun2008 2009 2010 2011 2012 2013
(1 000 tonnes)Japan 110.0 94.0 71.8 87.8 120.2 98.1
USA 59.0 42.0 23.1 29.2 49.7 64.8
EU (25) 23.0 15.0 4.2 4.2 7.1 18.4
Lat.America 25.0 29.0 26.5 22.9 38.9 48.5
Others 80.0 36.0 26.0 39.9 36.6 67.9
Total 297.0 216.0 151.6 184.0 252.6 297.6Source: IFOP
Exports (value)Salmon and Trout: Chile
Jan-Jun2008 2009 2010 2011 2012 2013
(million USD)Japan 384.0 471.0 429.5 599.2 776.4 437.9
USA 399.0 316.0 218.2 328.1 409.8 541.4
EU (25) 140.0 134.0 32.0 41.3 47.9 110.3
Lat.America 132.0 87.0 166.7 177.8 214.4 286.3
Others 184.0 137.0 140.2 257.9 194.5 312.5
Total 1239.0 1146.0 986.6 1404.2 1643.0 1688.4Source: Boletín de Exportaciones del IFOP
Exports (unit value)Salmon and Trout: Chile
Jan-Jun2008 2009 2010 2011 2012 2013
(in USD/kg) Salmon 4.19 5.22 6.33 7.54 6.26 5.59 Frozen 4.55 4.78 5.52 6.55 5.91 4.70
Fresh 6.17 6.29 7.98 9.56 6.57 7.24
Canned 6.15 6.54 7.31 10.54 13.33 9.48
Salted 6.75 5.22 6.01 6.75 6.67 3.31
Smoked 12.55 12.52 13.23 15.73 15.00 14.76
Trout 4.15 5.56 6.77 7.91 6.90 5.95 Frozen 3.90 5.32 6.50 7.67 6.74 5.52
Fresh 5.32 6.81 7.63 8.72 8.33 7.85
Canned 6.63 6.96 8.66 10.74 0.00 0.00
Salted 4.78 5.52 6.15 6.82 3.72 5.60
Smoked 10.06 11.60 12.40 14.30 15.00 14.13
Average 4.18 5.31 6.51 7.68 6.46 5.67Source: Boletín de Exportaciones del IFOP
Exports (value)Salmon and Trout: Chile
Jan-Jun2008 2009 2010 2011 2012 2013
(million USD)Salmon 945.6 823.0 567.7 859.6 1100.2 1293.9 Frozen 538.7 557.9 339.2 512.5 640.5 714.0
Fresh 323.8 238.4 198.4 316.3 419.9 554.6
Canned 12.7 9.9 5.3 3.3 3.8 1.7
Salted 2.7 1.8 8.2 7.4 12.0 4.4
Smoked 18.8 15.0 16.6 20.1 24.0 19.2
Trout 280.2 323.4 418.9 578.2 542.8 394.5 Frozen 239.8 283.2 338.5 489.1 458.4 323.8
Fresh 20.0 20.1 48.9 51.8 34.9 32.8
Canned 1.1 0.5 0.4 0.1 0.0 0.0
Salted 0.3 2.3 10.7 10.9 16.3 7.6
Smoked 19.0 17.3 20.4 26.2 33.2 30.3
Total 1239.4 1146.4 986.6 1437.8 1643.0 1688.4Source: Boletín de Exportaciones del IFOP
Exports (quantity)Salmon and Trout: Chile
Jan-Jun2008 2009 2010 2011 2012 2013
(1 000 tonnes)Salmon 225.8 157.6 89.7 114.0 175.8 231.4 Frozen 118.4 116.8 61.5 78.2 108.2 152.0
Fresh 52.5 37.9 24.9 33.1 63.9 76.6
Canned 2.1 1.5 0.7 0.3 0.3 0.2
Salted 0.4 0.2 1.4 1.1 1.8 1.3
Smoked 1.5 1.2 1.3 1.3 1.6 1.3
Trout 70.8 58.1 61.9 73.1 78.7 66.3 Frozen 64.9 53.2 52.1 63.7 68.0 58.6
Fresh 3.8 2.9 6.4 5.9 4.2 4.2
Canned 0.2 0.1 0.0 0.0 0.0 0.0
Salted 0.1 0.4 1.7 1.6 4.3 1.4
Smoked 1.9 1.5 1.6 1.8 2.2 2.1
Total 296.6 215.7 151.6 187.1 254.5 297.6Source: Boletín de Exportaciones del IFOP

38 Globefish Highlights October 2013
323 million) in terms of volume and value respectively. The UK imports mainly fresh whole Atlantics with the Faroe Islands as the major origin – Faroese salmon took a 42% share of the total in the first six months of 2013.
Markets
As intermediaries in the value chain are no longer able to bear the high cost of raw material, supermarkets in the EU are finally being forced to increase prices on the consumer side, a move that is predictably having a negative effect on demand and pushing down prices. EU markets, despite strong performance in the first half of year, are also likely to have been weakened somewhat by a lack of promotional activity compared with 2012, and suppliers must be cautious to avoid flooding the market with volumes it can no longer absorb.
Meanwhile Brazil continues to present an appealing alternative to the declining Japanese market for Chile, which at the same time should be looking to consolidate and expand on the inroads that have been made in markets such as Russia and China as well as in traditionally Norwegian EU markets such as France and Germany. In addition to presenting an attractive opportunity to Chilean suppliers, effective penetration of cheaper Chilean product into these markets would potentially serve to reduce price volatility where periods of sustained
in exports, with 80 000 tonnes (5% increase compared with 2012) valued at USD 272 million (a decline of 34%) with an average FOB price of USD 6.76/kg. The total harvest of Atlantic salmon in the first six months of 2013 was 20% higher than in the same period of 2012. In the specific case of rainbow trout, exported volume in the period reviewed reached 66 300 tonnes, a 16% decrease in comparison with 2012. In terms of value a 27% fall was registered, a consequence of the low international prices.
Frozen salmon and trout were the main production lines exported in this period, followed by fresh and chilled products. Cumulative exports for frozen salmon and trout between January and June were 210 600 tonnes (20% up in comparison with 2012) for a total value of USD 1.04 billion (a 6% decline) with an average FOB price of USD 4.9/kg (FOB price for 2012 was USD 6.2/kg). Fresh and chilled salmon and trout, on the contrary, registered exports of 80 700 tonnes for USD 587 million with the average FOB price being USD 7.3/kg. This production line showed a 19% increase in terms of quantity and a 29% improvement in value compared with the same period in 2012.
In terms of quantity, Japan was the main destination in terms of volume during the first semester for Chilean salmon and trout, importing approximately 98 000 tonnes for a total value of USD 438 million. USA followed with 65 000 tonnes worth USD 541 million and was the main destination in terms of value.
Although the last report from SubPesca (August 2013) showed that harvests reached 602 300 tonnes (6.8% less than the same period last year), future prospects are likely to improve. Some experts predict a better second semester for business, thanks to better health monitoring. In addition, Chile is engaged in market diversification aimed at the Brazilian and Chinese markets as well as supplying the traditional USA and Japanese markets.
UK
The UK took advantage of positive price performance on US and EU markets in the first half of the year, with a stable export volume (48 600 tonnes) selling for 14% more than last year (USD 386 million). The US is the major export destination, importing almost entirely fresh whole Atlantics from the UK, posting close to the same volume and a 6% increase in value in the first half of the year compared with 2012. The UK is diversifying its export base, however, with exports to the EU down 13% to about 18 400 tonnes over the same period, and exports to the East Asian markets of China, Taiwan PC and Viet Nam up 70% to a total of 7 200 tonnes..
Despite the higher prices, demand on the UK domestic market was strong in the first two quarters of 2013, and imports were up 14% (to 40 600 tonnes) and 32% (to USD
ExportsSalmon: UK (by product and country)
Jan-Jun2008 2009 2010 2011 2012 2013
(1 000 tonnes)FRESH
USA 6.7 10.1 13.3 19.3 17.0 17.5
France 9.0 8.1 12.0 8.0 8.5 7.5
Ireland 2.5 2.4 1.6 2.3 2.7 2.7
Poland 0.2 0.2 1.0 2.9 3.9 2.1
Germany 1.2 1.0 1.0 1.1 0.7 0.6
Others 3.1 2.8 3.5 5.5 8.6 11.9
Total 22.7 24.6 32.4 39.1 41.4 42.3FROZEN
France 2.4 0.4 0.9 1.5 0.9 0.7
Russian Fed. 0.1 0.3 1.6 0.7 1.8 0.3
Ireland 0.3 0.1 0.1 0.2 0.2 0.2
Others 1.4 2.5 1.0 2.6 2.4 2.8
Total 4.2 3.3 3.6 5.0 5.3 4.0CANNED
Ireland 0.4 0.5 0.5 0.5 0.4 0.3
Others 0.4 0.2 0.2 0.1 0.4 0.5
Total 0.8 0.7 0.7 0.6 0.8 0.8Gr. Total 27.7 28.6 36.7 44.7 47.5 47.1
Source: Her Majesty’s Revenue & Customs
SALMON

39Globefish Highlights October 2013
SALMON
high prices can overly dampen demand to the point where there is a real risk of a price crash when larger volumes hit the market. The delay in price transmission through the supply chain increases this risk, as it can obscure the real strength of consumer side demand.
France
With most of the high costs of raw material being borne further up the supply chain, consumer demand on the French market remained strong throughout the first half of 2013. Volumes were 3% down to 72 900 tonnes compared with last year, but total import value was up by 21% as a result of the higher prices. Imports of whole fresh Atlantics, the most important product sourced mainly from Norway, were down 4%, while imports of frozen and fresh fillets were up 25% and 19% respectively. This reflects the growing importance of Chile as a supplier to the French market, with volumes of Chilean product still low at 4 800 tonnes but 75% higher than the first half of 2012. Salmon suppliers to France must also contend with renewed competition from cod, where stock revival and the consequent low prices allowed sales of fresh cod to overtake those of fresh salmon in the reporting period.
Germany
In Germany, the market situation is still favourable, and the total quantity of salmon imported in the first 6 months of 2013 was 9% higher than last year at 60 200 tonnes. Value was up by 21% to USD 570 million. As in France, imports of fresh whole salmon declined, by 8% to
ImportsSalmon: France
Jan-Jun2008 2009 2010 2011 2012 2013
(1 000 tonnes)Fresh whole 42.3 45.5 50.0 46.4 52.0 46.1
Norway 30.6 31.6 36.4 32.8 36.3 33.3
UK 8.0 7.7 8.5 8.8 9.4 8.3
Frozen Pac 1.4 1.4 1.5 1.1 1.6 1.4
USA 0.8 1.1 1.3 1.1 1.4 1.1
Frozen Atl 1.5 1.0 2.0 1.8 1.0 0.7
Smoked 2.3 2.5 2.9 3.2 3.9 3.9
UK 0.2 0.3 0.3 0.3 0.2 0.3
Poland 1.4 1.6 2.1 2.4 3.1 3.1
Fresh fillets 2.6 4.5 5.4 5.5 8.0 9.5
Norway 2.3 4.0 4.8 5.1 7.2 8.2
Frozen fillets 9.2 10.5 9.9 10.3 8.9 11.1
Chile 4.1 4.9 2.4 2.0 2.7 4.4
China 2.4 2.5 3.7 4.5 3.0 2.4
Grand Total 55.5 64.6 71.7 68.3 75.4 72.8Source: Direction Nationale des Statistiques du CommerceExtérieur – DNSCE
ImportsSalmon: Germany (by origin)
Jan-Jun2008 2009 2010 2011 2012 2013
(1 000 tonnes)Norway 17.8 22.3 25.3 25.5 24.2 22.2
Poland 10.8 13.8 13.4 14.1 14.0 16.6
China 5.6 6.4 8.4 8.5 6.9 5.2
Chile 6.4 5.3 1.1 1.2 0.8 3.9
Lithuania 1.0 1.1 1.6 2.9 2.5 2.1
UK 0.9 1.0 1.2 1.3 1.2 1.5
Others 6.8 7.4 5.8 5.3 7.5 8.4
Total 49.3 57.3 56.8 58.8 57.1 59.9Source: Germany Customs
ImportsSalmon: Germany (by product)
Jan-Jun2008 2009 2010 2011 2012 2013
(1 000 tonnes)Fresh salmon 18.7 24.3 23.2 24.3 21.2 19.4
Frozen salmon 1.4 1.7 2.1 1.2 1.0 1.7
Smoked salmon 12.8 15.5 15.3 17.7 18.3 19.0
Fresh fillets 2.9 3.8 4.1 3.4 3.6 4.4
Frozen fillets 16.4 15.8 16.2 15.7 12.9 15.5
Salted salmon 2.0 0.1 0.0 0.0 2.1 0.5
Total 49.3 57.3 56.8 58.8 57.1 59.9Source: Germany Customs
19 400 tonnes and were replaced by other forms such as smoked and fillets, for which combined volume increased by 12%. Imports increased from Poland, the main supplier of smoked salmon to Germany, and Chile, which supplies mainly frozen fillets. However, demand for smoked is likely to be hit in Q3 as Polish smokers pass on the increased price of Norwegian fresh salmon.
Japan
The Japanese seafood market continues its decline, and demand for salmon and trout imports is following the trend. Imports in the first 2 quarters were down 6% in terms of volume, to 100 900 tonnes, while significantly weaker prices for Chilean salmon than last year meant a 34% drop in value to USD 429 million. Chilean suppliers suffered on the Japanese market and revenues for the first two quarters were down 46% this year. High prices for Norwegian fresh Atlantics also inhibited sales, and Japanese importers appear to be favouring wild-caught Russian sockeye, which saw increases in volume and value of 160% (to 7 200 tonnes) and 162% (to USD 162 million) respectively in the first two quarters.

40 Globefish Highlights October 2013
USA
Much of the USA’s salmon imports during the first semester of the year came from Chile with 58 900 tonnes valued at USD 550 million with Canada in second place with 41 700 tonnes worth USD 284 million. During the first six months of the year, USA imported a total of 149 000 tonnes of salmon products, which represents a 9% rise when compared with the same period in 2012.
Total value of exports between January and June rose by 18%. In terms of exports, a 4% increase in quantity was noted and the value was up by 12% in comparison with the same period in 2012.
Outlook
The drop in salmon prices is likely to be compounded in the short-term by increased harvest volumes particularly from Norwegian farms that must meet maximum biomass requirements, but there is unlikely to be a price crash on the scale of 2012 with current market conditions. The long-term supply outlook is for little or no growth, with reports stating that Chilean farmers will again having to adapt to additional regulations in the near future as maximum pen density restrictions are implemented by Chile’s National Fisheries and Aquaculture department (Sernapesca) in an
ImportsSalmon: Japan
Jan-Jun2008 2009 2010 2011 2012 2013
(1 000 tonnes)FreshAtlantic 10.0 10.0 9.7 9.7 14.1 11.1 Norway 8.0 8.9 8.7 8.5 13.0 9.5
UK 0.2 0.2 0.2 0.3 0.3 0.3
Australia 0.5 0.5 0.6 0.8 0.6 0.4
Pacific 0.3 0.3 0.4 0.4 0.3 0.4Total 10.3 10.3 10.1 10.1 14.4 11.5FrozenAtlantic 1.0 4.0 0.5 0.9 1.1 0.4 Norway 0.6 0.2 0.2 0.6 0.4 0.2
Chile 0.2 3.5 0.1 0.1 0.6 0.1
Pacific 76.8 58.8 59.8 74.9 91.1 89.0 Canada 0.2 0.1 0.3 1.0 0.3 0.6
USA 5.4 3.1 2.9 3.2 2.1 0.9
N. Zealand 0.3 1.3 1.2 0.7 0.3 1.5
Chile 66.9 52.6 53.6 67.5 85.6 78.8
Russian Fed 3.9 1.7 2.2 2.5 2.8 7.2
Total 76.8 58.9 59.8 74.9 91.1 88.9Grand Total 87.1 69.2 69.9 85.0 105.5 100.4
Source: Japan Customs
ImportsSalmon: USA
Jan-Jun2008 2009 2010 2011 2012 2013
(1 000 tonnes)Fresh filletsChile 40.0 26.7 10.5 17.8 29.5 42.4
Canada 3.0 2.1 3.9 3.0 1.8 3.2
Norway 1.3 7.7 13.4 5.3 2.0 2.3
Other 2.0 3.7 4.0 6.3 5.1 4.9
Total fresh fillets 46.3 40.1 31.8 32.4 38.4 52.7Frozen fillets 21.8 26.8 28.6 30.4 28.0 34.1Smoked 1.7 1.8 2.0 1.9 2.6 2.5Salted 0.0 0.0 0.0 0.0 0.0 0.0All salmon 121.8 123.9 116.4 112.6 137.1 149.0
Source: NMFS
SALMON NEWS USA: New records high for salmon harvest
With a record 219 million pink salmon, the 2013 harvest has proven to be the second-best year for commercial salmon fishery.As well as being a record year for this species, this year has also set a record for the total number of salmon harvested, which reached 272 million fish.In an official release, The Alaska Department of Fish and Game (ADF&G) highlighted the fact that this year has yielded USD 691.1 million in revenues so far, a figure only surpassed by a USD 724 million harvest value achieved in 1988.Of all the salmon varieties, sockeye salmon (also called red salmon) remained the most valuable salmon species harvested in Alaska. As much as 50% of all the sockeye salmon harvested came from Bristol Bay.Sockeye price in that area was high despite the fact that the harvest was modest, reaching a statewide value of USD 284 million. For its part, pink salmon, which was produced in several fishing areas, yielded USD 277 million in revenues.The most valuable salmon fishing area in 2013 was Southeast Alaska, where the harvest value reached USD 219 million. Apart from a harvest value of USD 124 million in pink salmon, the area also yielded USD 43.6 million (in harvest-value) for Southeast chum and USD 23.4 million for coho salmon. For its part, chinook salmon returns were USD 17 million in Southeast Alaska.The final value for the salmon fishery for the current year will only be established in 2014, when direct marketers, buyers and seafood processors give their report showing the average price paid to fishermen in 2013. With this in mind, the ADF&G does not discard the possibility that 2013 could turn out to be an historic all-record year for salmon harvest overshadowing that of 1988. Source: FIS.com
attempt to control the spread of disease. This is projected to result in a reduced harvest volume of approximately 530 000 tonnes in 2014, which Sernapesca hopes will boost prices and thus help to improve the profitability of Chilean farms that are currently considerably more concerned by the predicted future increases in feed prices than Norwegian producers will be.
SALMON

41Globefish Highlights October 2013
EU ban on mackerel and herring from the Faroe Islands brings Iceland to the negotiation table
The EU has followed through with its threat to impose trade restrictions on the Faroe Islands in August, and Norway has followed suit. This means that mackerel and herring from the Faroes are banned in the EU and Norway, and the impact on the industry may soon be felt. There will be shifts in trade flows, and there may also be some price consequences as a result of this.
SMALL PELAGICS
The Faroe Islands ignored EU quota negotiations by setting their own parameters and are now facing some unpleasant consequences. In August, the EU decided to ban Faroese exports of mackerel and herring in response to the Faroes’ unilateral quota allocation earlier.
At the same time, the EU is considering taking similar steps against Iceland. However the new Icelandic government has initiated a diplomatic approach to the situation and wants to negotiate a solution to the problem.
This problem has been an issue for several years now and stems from the setting of unilateral quotas for mackerel and herring by Iceland and the Faroes. The background for doing this is that the migration patterns of mackerel have changed in recent years, as the fish has moved into Icelandic and Faroese waters to a greater extent than previously. This has prompted Iceland and the Faroes to demand a greater share of the total quota, but the EU and Norway have objected to this. So Iceland and the Faroes set their own quotas, several times larger than earlier quotas.
Over the past three years, the value of Faroese exports of mackerel and herring have increased dramatically. Mackerel exports went up by a factor of over 2.5 between 2010 and 2012, while herring exports increased by 22% during the same period. For mackerel, the EU has become the most important market for the Faroes, and in 2012 the EU accounted for over 52% of the country’s total mackerel exports and 35% of herring exports. Consequently, an EU ban on Faroese mackerel and herring is very serious.
In this situation, Faroese exporters have to look elsewhere for marketing these products, and the most likely places are Russia, eastern Europe and Africa. Market share in the EU will most likely be taken over by Norwegian and Scottish exporters.
These changes have also had an impact on prices. In Russia, mackerel prices are increasing, and some buyers are now holding back because of the rising prices.
Mackerel
Meanwhile, bad weather off the coast of Norway hindered the mackerel fishery at the beginning of September. The catches that have been landed have consisted of larger sizes, though, especially in northern
ExportsMackerel and herring: Faroe Islands
2010 2011 2012( DKK million)
Mackerel: EU 93 367 434
Non-EU 227 366 393
Of which through EU ports 22 7 82
TOTAL MACKEREL EXPORTS 321 733 827
Herring:EU 97 130 113
Non-EU 169 162 211
Of which through EU ports 26 25 11
TOTAL HERRING EXPORTS 266 291 325Source: Undercurrent News
ImportsFrozen Mackerel: Germany
Jan-Jun2008 2009 2010 2011 2012 2013
(1 000 tonnes)UK 1.7 0.8 1.0 3.6 5.7 4.3
Ireland 2.5 2.9 3.1 2.8 2.2 2.5
Netherlands 1.5 2.0 2.5 3.1 2.9 1.9
Denmark 2.6 2.4 1.7 1.9 0.8 0.6
Poland 1.5 1.7 1.4 1.8 0.2 0.6
Others 1.0 1.0 2.0 2.5 2.1 1.5
Total 10.8 10.8 11.7 15.7 13.9 11.4Source: Germany customs

42 Globefish Highlights October 2013
SMALL PELAGICS
waters, although there is still a serious lack of >600 g fish. According to the fishermen there is plenty of mackerel in the Norwegian EEZ, but it is widely dispersed. This makes fishing somewhat more difficult. Some observers claim that the mackerel is now moving towards the Norwegian zone, and therefore Norwegian landings may be expected to rise soon.
The abundance of mackerel in the North Atlantic is worrying some ocean researchers, who claim that the mackerel is depleting the ocean of food for other small species, such as capelin and herring. According to Norwegian researchers, the present management model does not take into account that some fish stocks can in fact become too big and too dominating, at the expense of others. The mackerel stocks are at an historic high at present.
Norwegian mackerel prices during the second quarter of 2013 were down. Total sales of mackerel were down by 20%, but prices now seem to have stabilized. Norwegian exports of frozen mackerel dropped significantly in August, when only 3 340 tonnes of frozen round mackerel was shipped, compared with 5 478 tonnes during the same month in 2012 (-39%). In addition, the export price dropped by some 6.4%, from NOK 10.40 in August 2012 to NOK 7.73 in August 2013.
ExportsFrozen Mackerel: Norway
Jan-Jun2008 2009 2010 2011 2012 2013
(1 000 tonnes)China 8.5 4.9 6.6 9.4 15.0 9.8
Russian Fed. 4.1 10.9 9.1 10.7 12.7 8.6
Japan 6.0 5.8 3.2 2.6 9.5 6.6
Ukraine 2.0 3.8 3.1 4.3 3.7 5.6
Turkey 4.9 5.7 8.5 7.6 8.7 5.2
Lithuania 0.4 0.7 0.2 1.3 3.6 3.5
Republic of Korea 0.1 4.7 3.0 6.4 1.9 2.4
Poland 1.2 2.8 3.6 3.8 2.7 2.1
Others 5.5 8.6 5.3 12.0 19.5 16.3
Total 32.7 47.9 42.6 58.1 77.3 60.1Source: Statistics Norway
Source: NSC/Central Bureau of Statistics, Norway
Norwegian frozen mackerel export prices
As a result of the very large size of the mackerel stocks, mackerel has started migrating to other regions, and is currently moving northward and eastward.
In order to avoid a major collapse of some species in the region, mackerel stocks should be fished down to a more balanced level as soon as possible according to researchers.
Iceland’s landings of pelagic species were down by as much as 55% in June. Mackerel catches were 40% lower than the same month in 2012, and herring catches were down by a staggering 90%.
On the European market, mackerel prices are low and sliding slightly at the moment. Prices for larger sizes (>600g) are high, however, and increased dramatically in July and August. The main reason was a significant shortage of large sized mackerel during those months.
During the first half of 2013 Norwegian frozen mackerel exports went down by 22% (by volume), and by over 41% by value. The average export price (FOB Norway) for frozen mackerel was down by 26%, from NOK 13.03 per kg in the first half of 2012 to NOK 9.87 per kg in the same period in 2013.
Shipments to the main markets (China, Russia and Japan) all decreased, while exports to the Ukraine increased by over 50%.
Herring
For herring, the situation is similar to that for mackerel. The Faroes have set a unilateral quota that is more than three times higher than its earlier share, and the EU and Norway have objected. In August, it was

43Globefish Highlights October 2013
SMALL PELAGICS
Source: NSC/Central Bureau of Statistics, Norway
Norwegian frozen herring export prices
decided to impose a ban on imports of Faroese herring into the EU as well as mackerel. Again, Iceland has chosen to pursue the diplomatic path, and the country is critical of EU’s aggressive attitude.
Coastal states Norway, EU, the Faroes, Iceland and Russia met in London in early September to negotiate the Norwegian Spring Spawning (NSS) herring quotas, but no agreement was reached during the first round. The quota for NSS herring was cut to 619 000 tonnes, down from 833 000 tonnes in 2012 and 1.17 million tonnes in 2011. Lower supplies of herring during this season are expected to push prices up, or at least maintain these at present levels.
The USA reports that there have been problems with Listeria in Russian herring fillets in oil, according to an FDA alert. The product has been recalled after a routine sampling by New York State Department of Agriculture. Subsequent analysis of the product revealed a positive test result for Listeria monocytogenes. No cases of illness have been reported in connection with this so far. Exports
Frozen Whole Herring: NorwayJan-Jun
2008 2009 2010 2011 2012 2013(1 000 tonnes)
Russian Fed. 73.0 82.7 79.4 44.0 36.7 28.3
Ukraine 46.0 44.2 37.3 30.8 28.3 15.7
Lithuania 7.4 10.5 12.6 10.0 12.1 10.5
Egypt 15.2 8.5 21.8 16.1 14.2 9.4
Netherlands 10.9 12.3 15.0 13.6 7.5 8.0
Nigeria 85.0 81.1 62.3 43.2 4.2 2.9
Poland 1.4 3.1 3.0 1.8 2.1 2.0
Others 31.2 25.4 29.6 24.0 14.5 10.5
Total 270.1 267.8 261.0 183.5 119.6 87.3Source: Statistics Norway
Availability of larger sizes has been very weak, so the price level for these is uncertain at present. Few observers are willing to predict what the autumn prices will be.
Norwegian exports of frozen herring declined by 27% by volume during the first half of the year. The value of frozen herring exports dropped by over 34% as the average export price (FOB Norway) declined by 8.4%, from NOK 8.07 per kg during the first half of 2012 to NOK 7.39 per kg in the first half of 2013. As was the case with mackerel, a lower amount of product was shipped to the main markets in eastern Europe (Russia, Ukraine and Lithuania) as well as to markets in Africa (Egypt, Nigeria).
Prices of North Sea herring are lower this year than in 2012, especially for smaller sizes. Norwegian export prices fell dramatically in August, but that is a seasonal phenomenon, and it is worth noting that export prices for frozen herring in August 2013 were slightly higher than in August 2012.
Dutch exports, on the contrary, increased by a healthy 65%, to almost 50 000 tonnes, during the first half of the year. The most noteworthy aspect of Dutch exports during this period was a dramatic increase in shipments to Nigeria (+137%).
French imports of frozen herring declined markedly during the first half of the year, from almost 4 500 tonnes in 2012 to just 1 600 tonnes in 2013. Shipments from Norway and Iceland were down significantly.
German imports of frozen herring fillets also declined during the period, from 13 900 tonnes in the first half of 2012 to 9 800 tonnes (-29.5%) during the same

44 Globefish Highlights October 2013
period in 2013.
The Japanese market, in contrast, was stable with regard to frozen herring imports during the first half of the year. In fact there was a slight increase in imported volume (+8.6%) compared with 2012. However, the main supplier, Norway, saw a drastic reduction in shipments from 6 200 tonnes during the first half of 2012 to just 3 300 tonnes this year.
Export prices for herring have been on a downward trend since late 2011. Nevertheless there is a great deal more fluctuation in prices for larger sizes, as a result of limited availability. At present, export prices for large mackerel seem to be on an upward trend, while prices for smaller sizes (<600g) seem to have stabilized, although prices went down slightly in August.
SMALL PELAGICS
Anchovies and sardines
The species that has traditionally been used as raw material for the Brazilian canned sardine industry, Sardinella brasiliensis, has been in decline for some years now. In 1970 135 000 tonnes were landed but in 2012 this had fallen to 90 000 tonnes. Brazilian authorities are worried that the stock might collapse, and ordered a five-month fishing ban. At the same time, alternative species to use in the canned sardine industry are being sought, and at present there is some hope that the so-called Matrinxa (Brycon cephalus) may be a possibility.
In Peru, two surveys to determine the quota for the second season of 2013 are under way. During the first season nearly the whole quota was landed: 1 982 239 tonnes were landed of a total quota of 2 050 000 tonnes.
ImportsCanned sardines: France
Jan-Jun2008 2009 2010 2011 2012 2013
(1 000 tonnes)Morocco 6.3 5.9 4.8 3.8 4.6 6.6
Portugal 1.8 2.2 2.2 2.1 2.4 2.5
Spain 0.8 0.3 0.4 0.3 0.2 0.3
Others 0.5 0.2 0.3 0.1 0.4 0.2
Total 9.4 8.6 7.7 6.3 7.6 9.6Source: Direction Nationale des Statistiques du CommerceExtérieur – DNSCE
ImportsFrozen Herring Fillets: Germany
Jan-Jun2008 2009 2010 2011 2012 2013
(1 000 tonnes)Norway 2.6 6.2 9.1 5.8 6.2 3.3
Denmark 2.0 1.2 0.9 0.9 2.8 2.5
UK 0.1 0.0 0.0 0.1 3.3 1.1
Iceland 0.0 0.0 0.3 1.2 0.6 1.0
Netherlands 0.7 0.6 0.6 0.7 0.6 0.6
Others 0.4 0.9 0.5 0.4 0.4 1.3
Total 5.8 8.9 11.4 9.1 13.9 9.8Source: Germany customs
ImportsFresh and Frozen Herring: Japan
Jan-Jun2008 2009 2010 2011 2012 2013
(1 000 tonnes)USA 16.6 13.7 15.2 16.9 11.7 11.3
Russian Fed 5.7 3.4 4.1 3.1 3.5 4.1
Norway 3.5 2.6 2.7 2.6 1.6 1.9
Netherlands 0.6 0.6 0.6 0.2 0.4 0.3
Others 0.1 0.6 0.7 0.2 0.2 1.3
Total 26.5 20.9 23.3 23.0 17.4 18.9Source: Japan Customs
ExportsDutch herring
Jan-Jun2008 2009 2010 2011 2012 2013
(1 000 tonnes)Nigeria 30.1 26.7 3.0 21.1 10.6 25.1
Egypt 0.8 4.2 16.3 5.8 7.0 9.2
China 1.7 5.0 9.6 10.1 7.1 7.0
Germany 1.0 1.9 0.9 1.3 1.0 1.2
Japan 0.3 0.6 0.8 0.9 0.3 0.3
Others 6.3 5.3 5.0 3.0 4.0 6.8
Total 40.2 43.7 35.6 42.2 30.0 49.6Source: Eurostat

45Globefish Highlights October 2013
ImportsCanned sardine: Germany
Jan-Jun2008 2009 2010 2011 2012 2013
(1 000 tonnes)Morocco 4.9 3.1 3.0 1.9 2.0 2.2
Peru 0.1 0.2 0.4 0.3 0.9 0.5
Netherlands 0.4 0.4 0.5 0.4 0.2 0.2
Others 0.7 0.2 0.3 0.4 0.2 0.1
Total 6.1 3.9 4.2 3.0 3.3 3.0Source: Germany customs
In Europe, the EU has approved a 17% cut in the Bay of Biscay anchovy quota, as the total allowable catch was set at 17 000 tonnes. The TAC has been gradually reduced over the past three years in an effort to build up the resource again. Spain and France are the only nations participating in this fishery.
European imports of canned sardines have been relatively stable this year. There has been an increase in French imports, while there was a slight decline in imports into Germany and the UK during the first half of 2013.
French imports increased by 26.3%, to 9 600 tonnes. Most of this increase came from Morocco, which is the main supplier to France.
German imports declined by 11% to just 3 000 tonnes. The main supplier to German is Morocco, and this country increased its shipments to Germany by about 10%, while other suppliers (Peru, Netherlands) lost market share.
Outlook
It is expected that the situation on the mackerel and herring markets will be volatile in the coming months, as the Faroes (and probably Iceland) will have to divert shipments away from the EU market to other parts of the world. This will leave Europe open to other suppliers, and some price fluctuations may be expected as a result.
Supplies of mackerel will be abundant, but this does not mean that prices are expected to decline in all markets. Supplies of herring, in contrast, will be tighter, and stable or higher prices for herring can be expected.
In the UK imports went down by 5.7% to 6 600 tonnes. The main supplier is Portugal, but this country lost market share to Morocco during the first half of 2013.
The US market for canned sardines is fairly stable, but imports during the first half of 2013 declined by 8.3% to 14 400 tonnes. There were some shifts in the relative positions of the main suppliers, as Poland increased shipments to the USA by 45% while Thailand saw a decline of 28.6%. There were only minor changes for most of the other suppliers, but notably Morocco increased canned sardine shipments to the USA by 23.5%.
ImportsCanned sardine: UK
Jan-Jun2008 2009 2010 2011 2012 2013
(1 000 tonnes)Portugal 3.3 2.0 2.7 2.5 2.6 2.2
Morocco 2.7 2.3 2.3 1.2 1.6 2.1
Others 1.8 1.1 2.3 1.3 2.8 2.3
Total 7.8 5.4 7.3 5.0 7.0 6.6Source: Her Majesty’s Revenue & Customs
ImportsCanned sardine: USA
Jan-Jun2008 2009 2010 2011 2012 2013
(1 000 tonnes)Poland 0.7 0.7 0.0 0.0 2.0 2.9
Thailand 2.1 3.1 0.0 0.2 3.5 2.5
Ecuador 1.4 1.7 0.7 0.8 2.2 2.1
Morocco 2.0 1.9 1.6 0.0 1.7 2.1
Canada 3.0 2.9 3.1 3.0 2.0 1.5
China 0.0 0.2 1.2 1.8 1.5 0.8
Philippines 0.7 0.9 0.0 0.0 1.0 0.7
Others 3.9 2.8 13.2 16.7 1.8 1.8
TOTAL 13.8 14.2 19.8 22.5 15.7 14.4Source: NMFS
SMALL PELAGICS

46 Globefish Highlights October 2013
Rising price trend continues as a result of strong demand for fishmeal
The rising price trend for fishmeal continued through the second quarter of 2013. With this latest increase, prices have risen approximately 43% between mid-2008 and mid-2013. Soymeal prices remained relatively flat over the same period, thus this growing price differential may provide incentives for terrestrial farmers to substitute fishmeal with less expensive feed alternatives. In the long term, this situation may stimulate more research into alternative feeds for aquaculture producers of carnivorous species. The threat of countervailing duties on shrimp from seven countries in Asia and Latin America has not materialized, as the USITC voted against the imposition of these duties. However, shrimp imports to the USA continue to command high prices, mostly because of disease problems in producing countries. These higher prices may depress US consumer demand, which in turn could impact derived demand for fishmeal in Asia.
FISHMEAL
Meal 85%4 349
Oil 15%991
Meal and oil processed production (2009) (in 1 000 tonnes)
Source: FAO
Production
Latin American fishmeal production continued to decline, with a 21% drop in production between 2012 and 2013 in the January to June period. Combined fishmeal production from the top five producing countries declined over the same period by 13%, with Denmark and Norway closing some of the production gap. Fishmeal production in Iceland fell between first half of 2012 and first half of 2013 by 28%, primarily because of the high production level in 2012.
ExportsLatin America
Weather continues to hamper fishing in Peru with some ports closed. Peruvian fishermen have filled a little over half their allotted quota through August and there may be an extension of the season into October. China absorbed the majority of Peruvian fishmeal exports in 2013, approximately 69%. This compares with China’s 64% share of Peruvian exports in 2012. China also absorbed 54% of Chilean fishmeal exports in 2013, compared with 43% in 2012.
ProductionFishmeal: 5 major producers
Jan-Jun2008 2009 2010 2011 2012 2013
(1 000 tonnes)Peru/Chile 1 331 1 324 1 102 1 334 851 672
Denmark/Norway 213 182 350 166 74 153
Iceland 77 70 156 81 130 93
Total 1 621 1 576 1 608 1 581 1 054 918Source: IFFO * these figures refer only to IFFO member countries
Europe
Icelandic fishmeal production has been limited because of strong demand for mackerel and herring for human consumption. Norwegian fishermen have reported limited catches this summer.
MarketsGermany
German demand for fishmeal by the end of the second quarter 2013 was still strong compared with the previous year. The volume of fishmeal imports from Iceland, Peru and Morocco was roughly equivalent. These three suppliers accounted for 61% of German fishmeal imports. In contrast, imports of Peruvian fishmeal fell significantly.
USA
Mexico and Chile supplied 74% of USA demand for fishmeal in the first half of 2013. USA imports of fishmeal remain strong, primarily as a result of strong consumer demand for terrestrial meat such as chicken and pork.

47Globefish Highlights October 2013
FISHMEAL
PricesFishmeal and Soymeal
Source: Oil World, GLOBEFISH
* all origins, 64-65% cif Hamburg; 44% cif Rotterdam
ExportsFishmeal: Peru
Jan-Jun2008 2009 2010 2011 2012 2013
(1 000 tonnes)China 429.0 529.1 305.1 453.1 426.1 165.7
Japan 67.0 67.6 51.8 34.3 58.5 20.0
Germany 79.2 73.6 51.9 47.5 90.5 12.5
Viet Nam na na na 25.2 39.9 4.2
Taiwan PC 25.0 34.4 13.7 17.7 31.4 4.2
UK na na na 11.6 11.6 1.3
Others 283.4 207.7 109.1 70.8 7.9 33.1
Total 858.6 878.0 531.6 660.2 665.9 241.0Source: Produce
ExportsFishmeal: Chile
Jan-Jun2008 2009 2010 2011 2012 2013
(1 000 tonnes)China 132.0 235.0 94.3 63.1 70.2 75.8
Japan 20.0 31.0 26.0 15.0 13.1 15.6
Spain 11.0 13.0 14.2 9.3 8.8 6.5
Italy 14.0 10.0 8.6 7.0 7.1 5.5
Republic of Korea 14.0 13.0 9.7 7.0 8.6 5.5
Germany 14.0 22.0 3.7 9.0 10.3 0.5
Others 14.0 41.0 40.1 23.2 42.8 31.4
Total 240.0 378.0 196.6 133.7 161.0 140.8Source: Produce
UK
United Kingdom fishmeal imports continue to decline. In particular, fishmeal supplies from Denmark and Peru have fallen by half since 2008. The main suppliers in the first half of 2013 were Ireland, Denmark, Germany and Iceland. The Danish fleet is expected to begin fishing efforts in September.
0
500
1000
1500
2000
2500
Aug-02 Aug-03 Aug-04 Aug-05 Aug-06 Aug-07 Aug-08 Aug-09 Aug-10 Aug-11 Aug-12 Aug-13
USD/tonne
Fishmeal*
Soymeal**
Outlook
The price of fishmeal rose approximately 43% between mid-2008 and mid-2013 and this price trend is expected to continue. The soymeal price has remained relatively flat over the same period, which may provide incentives for aquaculture operations to seek less expensive feed alternatives to fishmeal. Research continues in this area, namely to reduce the percentage of fishmeal in feeds for carnivorous fish species. Demand for fishmeal in terrestrial animals remains strong, although the widening price differential between soymeal and fishmeal may result in some substitution in terrestrial animal feeds.
ImportsFishmeal: Germany
Jan-Jun2008 2009 2010 2011 2012 2013
(1 000 tonnes)Iceland 6.1 0.0 0.0 1.5 1.3 20.1
Peru 67.6 106.4 86.1 18.5 53.0 20.0
Morocco 0.0 0.0 21.1 19.2 13.6 18.1
Denmark 1.9 4.6 6.3 10.2 2.7 13.9
France 2.0 2.0 1.5 1.6 2.5 8.6
Others 6.6 13.6 9.6 10.5 23.9 14.6
Total 84.2 126.6 124.6 61.5 97.0 95.3Source: Germany Customs
ImportsFishmeal*: USA
Jan-Jun2008 2009 2010 2011 2012 2013
(1 000 tonnes)Mexico 10.8 11.0 4.4 5.2 6.9 8.3
Chile 2.6 3.4 7.8 5.7 7.6 7.0
Canada 2.2 1.5 2.9 2.7 2.2 1.9
Others 2.8 4.0 3.5 1.7 2.9 3.5
Total 18.4 20.0 18.6 15.3 19.6 20.7Source: NMFS * excluding solubles
ImportsFishmeal: UK
Jan-Jun2008 2009 2010 2011 2012 2013
(1 000 tonnes)Ireland 8.2 12.5 9.6 1.2 3.8 6.8
Denmark 15.8 7.0 15.9 9.9 1.1 4.4
Germany 5.8 1.0 6.8 6.1 4.3 3.4
Iceland 4.7 0.0 1.3 1.4 6.0 3.3
Peru 11.0 16.3 18.3 10.9 12.7 1.4
Norway 1.8 1.2 2.4 3.1 0.1 1.1
Others 7.9 6.9 3.8 4.0 5.5 5.1
Total 55.2 44.9 58.1 36.7 33.5 25.5Source: Her Majesty’s Revenue & Customs

48 Globefish Highlights October 2013
FISH OIL
Fish oil prices reach record highs The fish oil price continued its steady rise, reaching new highs in mid-2013. Growing demand for aquaculture products will continue to put upward pressure on fish oil prices as a primary ingredient in fish feeds for carnivorous fish species. Supply shocks and quota restrictions will also contribute to price pressure and volatility. Global consumption of farmed fish, which is expected to surpass the consumption of wild-caught species in 2015, will insure the demand trend remains strong for fish oil used in aquaculture feed and for direct human consumption.
Production
Fish oil production declined 22% between January and June 2012 and the same period in 2013. This decline is attributed to lower production in Latin America, falling around 28% from last year. Icelandic production fell by 39%, however their contribution to total production was only 27 000 tonnes, compared with Latin American production of 147 000 tonnes in the first half of 2013. A poor season in Latin America was partially offset by Denmark and Norway where a 45% rise in fish oil production was seen between 2012 and 2013.
Exports
USA
USA exports were maintained in 2013, with 15 800 tonnes exported between January and June. Menhaden accounted for less than half of USA fish oil.
Latin America
Peruvian exports between January and June 2013 were 20% of total exports in 2012. Fishing has been delayed as a result of the work of research vessels assessing stocks and fishing grounds are not expected to be reopened until October. Primary export markets for Peruvian fish oil were Denmark and Belgium. Chile exported 38 700 tonnes of fish oil in the first half of 2013 compared with total exports of 22 500 tonnes in 2012. Fishing stopped in Chile under an anchovy ban through mid-September and sardine fishing is expected to resume in October. Primary export destinations for Chilean fish
oil were China, Japan and Norway.
Outlook
The price of fish oil continues its steady rise, reaching USD 2 100/tonne in August 2013. This surpassed the previous price peak of USD 1 800/tonne reached in April 2008. There has been a steady rise in fish oil prices since they bottomed out during the global financial crisis, dropping as low as USD 620/tonne in early 2009. Supply shocks in 2012 resulting from El Nino weather conditions and tightening quota restrictions to improve sustainability of catch fisheries contributed to upward pressure on fish oil prices. Global demand for farmed fish, which is expected to surpass consumption of catch species in 2015, will continue to exert upward pressure on fish oil prices.
ProductionFish oil: main exporters
Jan-Jun2008 2009 2010 2011 2012 2013
(1 000 tonnes)Peru/Chile 318 304 179 273 206 147
Denmark/Norway 30 25 72 53 29 42
Iceland 19 20 22 35 44 27
Total 367 349 274 361 278 216Source: IFFO* these figures refer only to IFFO member countries
ExportsFish oil: USA
Jan-Jun2008 2009 2010 2011 2012 2013
(1 000 tonnes)Menhaden 17.0 10.8 27.8 7.8 6.1 7.1
Other 6.8 11.3 6.8 10.5 9.7 8.7
Total 23.3 22.1 34.6 18.3 15.8 15.8Source: NMFS
ExportsFishoil: Peru
Jan-Jun2008 2009 2010 2011 2012 2013
(1 000 tonnes)Denmark 0.0 25.0 7.6 21.2 45.5 10.3
Belgium 27.9 34.0 21.9 14.5 25.4 6.4
Chile 36.6 12.0 19.7 26.2 33.4 3.0
Canada 13.3 5.8 10.4 5.1 16.3 1.9
Australia 5.1 4.2 5.2 1.0 4.2 1.5
China 31.5 17.3 8.7 8.6 * 1.3
Norway 2.9 10.4 7.8 3.0 13.6 1.2
Others 169.9 23.6 11.9 15.7 7.3 4.2
Total 287.2 132.3 93.3 95.4 145.6 29.9Source: Produce * included under “others”

49Globefish Highlights October 2013
BIVALVES
Decline in European Imports of Bivalve Molluscs Slows but Asian Demand Growing
Mussel trade within the European Union during the first six months of 2013 was dominated by intra-EU trade, with 72%, or 67 300 tonnes, of imports coming from countries within the European community, in particular from Spain, Netherlands, Denmark, Italy and UK. Chile supplies by far the largest quantity of mussels from extra-EU countries into the EU, amounting to 24% of the market. In total 26 200 tonnes or 28% are imported from countries outside the EU. With regard to new markets, Canadian and Irish producers are targeting China, considering that mussel consumption there is growing at 20% per year, while Chile is looking towards Thailand following the new Free Trade Agreement signed in October between these two nations. Scallops, oysters and mussels are more in demand this year and a good season is anticipated with higher prices as well.
Mussels
Europe – Imports and Exports
Total imports of mussels into the EU-27 market were 93 900 tonnes during the first six months of 2013, which is a drop of only 1% in volume compared with the same period in 2012. However, the drop is much greater, down by 8%, when compared with 2011 imports, which peaked at 102 000 tonnes, giving a better picture of the impact on demand in just two years.
France had the highest demand in volume with 27 900 tonnes in imports but this was still 9%, or 2 800 tonnes, down on the previous year. Both the next two highest importers, Italy and Spain, increased imports this year, Italy by 17% reaching 19 400 tonnes and Spain reaching 13 600 tonnes. Spain’s imports were concentrated mainly in the two month period when local mussel farms were closed because of red tides.
Bivalves production (2010) (in tonnes)
Clams, cockles, arkshells
5%
Mussels20%
Oysters49%
Scallops, pectens
26%
Source: FAO
Chile is the leading external supplier of mussel imports to Europe with 22 900 tonnes during the first six months of the year, making up 24% of the market.
Spain is next highest supplier of mussels to the EU with 16 600 tonnes, a volume which has not varied particularly much over the last 5 years. Netherlands followed with 14 300 tonnes of mussels supplied to the EU.
Canned mussel exports from Spain fell during July 2013 by almost 32% in comparison with the same period last year, according to Anfaco. The National Association of Manufacturers of Canned Fish and Shellfish said that the fall meant a drop of 6.4% in income but the average price per kilo had increased by 37% to EUR 4.56.
In Spain, Galician producers are concerned that shutting down more than 80% of mussel platforms because of the presence of red tide produced less availability of the products for the Italian and French markets but following that, when the platforms reopened, an oversupply resulted in a drop in prices.
As in the past and co-financed by the European Fisheries Fund, the Galician Xunta will campaign for the promotion of mussel consumption during the last semester of the year, focusing on Christmas season.
In Italy, overall mussel imports increased from 16 600 tonnes to 19 400 tonnes, with increased imports from Chile compared with Spain, which reduced supply from 18 700 tonnes to 16 600 tonnes during the first six months of 2013. Importers indicated that the key factors in this change are related to lower Spanish sales in that period and also to Chile’s direct exports to Italy instead of going through the Spanish market as in the past.

50 Globefish Highlights October 2013
In Portugal, the company Servimar Innova, which is involved in aquaculture development, has provided the means for local Portuguese company Testa & Cunhas to harvest its first production of 1 000 tonnes of farmed mussels from Europe’s largest offshore mussel farm. The company hopes to expand to a production of 10 000 tonnes of mussels a year eventually. During the first semester of 2013, Portugal imported 1 700 tonnes of mussels for local consumption. Currently most of the mussels consumed in Portugal come from Galicia.
Europe – Innovation in supply
As in Chile, Scottish mussel producers also have been affected by the lack of mollusc seeds resulting from factors related to climate change.
A cooperative of mussels and oyster farmers, the Scottish Shellfish Marketing Group (SSMG) is aiming to increase the sale of fresh live mussels and developing
Imports/ExportsMussel: World
Jan-Jun2012 2013
(1 000 tonnes)IMPORTSFrance 30.7 27.9
Italy 16.6 19.4
USA 17.7 16.7
Spain 9.5 13.6
Netherlands 12.5 10.9
Germany 10.3 6.9
Belgium 6.4 6.4
Russia 3.5 3.0
UK 3.3 2.8
Republic of Korea 3.6 2.5
Total 132.4 130.6*EXPORTSChile 35.0 36.8
Spain 19.4 16.6
New Zealand 18.8 16.1
Netherlands 15.9 14.2
Denmark 6.4 9.1
Ireland 9.1 9.0
Canada 8.2 8.0
Italy 6.0 7.1
Greece 5.0 5.6
China 4.0 4.3
Total 146.2 141.5*Source: GTIS* estimates
ImportsMussels: EU-27
Jan-Jun2008 2009 2010 2011 2012 2013
(1 000 tonnes)France* 32.2 29.6 37.1 32.7 30.7 27.9
Italy* 16.7 18.4 17.3 18.5 16.6 19.4
Spain* 10.2 8.0 10.8 13.8 9.5 13.6
Netherlands 14.8 7.6 10.4 10.0 12.5 10.9
Germany* 7.1 6.2 5.7 9.6 10.3 6.9
Belgium 7.9 6.9 6.2 7.0 6.4 6.4
UK* 3.4 2.9 3.3 3.7 3.3 2.8
Portugal 2.1 1.4 1.6 1.9 1.1 1.7
Others 6.0 6.1 4.8 4.7 4.1 3.9
Total 100.4 87.2 97.2 102.0 94.4 93.5Source: EUROSTAT and Customs*
ImportsMussels: EU-27 (by country of origin and destination)
Jan-Jun2008 2009 2010 2011 2012 2013
(1 000 tonnes)IMPORTSChile 24.8 15.5 21.9 28.8 19.0 22.9
Spain* 16.9 17.7 18.2 15.3 18.7 16.6
Netherlands 15.2 15.3 14.2 16.0 15.0 14.3
Denmark 8.7 6.0 6.7 8.7 10.2 8.7
Italy* 3.3 3.1 6.2 5.6 5.2 7.2
UK* 5.0 4.6 5.5 4.3 5.8 6.4
Greece 3.5 6.7 2.5 3.4 4.6 5.2
Others 23.0 18.3 22.0 19.8 15.8 12.2
Grand Total 100.4 87.2 97.2 102.0 94.4 93.5Total Intra 68.3 64.7 69.2 67.1 71.5 67.3Total Extra 32.1 22.5 28.0 34.9 22.9 26.2EXPORTSSpain* 20.0 19.5 28.2 17.8 19.4 16.6
Netherlands 11.7 11.7 14.5 13.8 15.9 14.2
Denmark 7.3 5.8 7.3 6.0 6.4 9.1
Ireland* 8.1 7.2 10.1 9.5 9.1 9.0
Italy* 4.0 3.2 6.2 5.7 6.0 7.1
Others 22.3 20.0 14.2 18.3 16.3 14.6
Grand Total 73.4 67.4 80.5 71.1 73.1 70.7Total Intra 71.6 66.2 79.3 69.8 71.4 69.0Total Extra 1.7 1.1 1.3 1.3 1.7 1.7
Source: EUROSTAT and Customs*
BIVALVES

51Globefish Highlights October 2013
BIVALVES
ready-to-eat products. Traditionally, most of the Scottish mussel production is exported to the Netherlands, where it is processed. However, SSMG has plans to open a processing plant in North Wales, where the main production area is located.
In response to the reduction in European demand, the Irish mussel industry is looking at new ways of supplying traditional markets with its products, in particular by organic production and MSC certification. The Irish Shellfish Association is turning the focus on working more closely with retailers to increase the demand for shellfish products, as well as on increasing communication and cooperation within the sector. This is in response to the EU strategy to boost shellfish farming, thus creating jobs and reducing seafood imports. At the end of July MSC announced that the blue mussel sectors in Northern Ireland and the Republic of Ireland had been MSC certified as sustainable fisheries. These are economically important contributors to the aquaculture sectors of both countries as much of the production is exported to the Netherlands.
Another collaborative initiative has been undertaken by the MusselsAlive project, which has developed best practices for the handling and transportation of fresh mussels over long distances in order to improve shellfish survival. Norway, Scotland and Ireland were the main participants.
South America - Supply
Chile is looking at increasing the supply of mussels to Thailand, particularly now that a Free Trade Agreement has been signed between these countries. Chilean mussels were unknown four years ago on the Southeast Asian market, which, up until then was supplied by green mussels from New Zealand. This year, Chilean mussel shipments reached 15% of the market supply, while in 2012 Chilean mussel exports reached USD 1 million, according to information from Prochile.
In August mussel farming in Chile reached 200 600 tonnes, 6% lower than the amount registered during the
same period in 2012 but with an increase in the exported value of 23%, growing from over USD 103 million to more than USD 127 milllion, according to Subpesca.
North America
In North America, Newfoundland and Labrador´s (NL) mussel industry is also undertaking a promotional campaign in an effort to boost mussel sales in Canada, US and China. The campaign is supported by provincial funding from the fisheries technology and new opportunities programme of CAD 86 000. Since 2006, NL´s government has invested CAD 1 million in the mussel industry, which is now valued at around CAD 100 million annually.
The Global Aquaculture Alliance (GAA) has completed the Best Aquaculture Practices (BAP) standards for mussels recently. These will be a model for other shellfish farms,
ImportsMussels: France
Jan-Jun2008 2009 2010 2011 2012 2013
(1 000 tonnes)Netherlands 7.2 6.8 7.2 7.6 6.9 6.3
Spain 7.1 6.9 7.1 6.4 7.1 4.9
Italy 2.6 2.2 4.8 4.2 3.3 4.9
Chile 5.8 4.6 6.1 6.2 5.7 4.1
UK 1.6 1.9 1.9 1.6 2.0 2.8
Ireland 4.1 3.5 6.8 4.6 3.0 1.6
Greece 0.9 1.8 0.8 0.8 1.2 1.3
Denmark 1.5 0.8 1.2 0.4 0.6 1.2
Others 1.4 1.1 1.2 0.9 0.9 0.8
Total 32.2 29.6 37.1 32.7 30.7 27.9Source: Direction Nationale des Statistiques du CommerceExtérieur – DNSCE
ImportsMussels: Italy
Jan-Jun2008 2009 2010 2011 2012 2013
(1 000 tonnes)Spain 7.2 8.7 8.4 7.0 9.7 9.8
Chile 4.4 2.3 4.4 6.3 2.8 4.4
Greece 2.5 4.5 1.6 2.6 3.3 3.8
Ireland 0.5 0.6 0.8 0.5 0.2 0.6
Turkey 1.1 1.1 1.2 1.0 0.0 0.0
Others 1.0 1.3 0.8 0.9 0.5 0.9
Total 16.7 18.4 17.3 18.5 16.6 19.4Source: ISTAT
ImportsMussels: Spain
Jan-Jun2008 2009 2010 2011 2012 2013
(1 000 tonnes)Chile 2.0 2.0 2.0 2.0 2.0 2.0
New Zealand 0.9 0.6 1.0 0.7 0.5 0.7
France 0.1 0.5 0.9 0.8 1.3 1.9
Others 7.1 4.9 6.9 10.3 5.6 9.0
Total 10.2 8.0 10.8 13.8 9.5 13.6Source: Agencia Tributaria

52 Globefish Highlights October 2013
such as clams, oysters, scallops and abalone. The new standards complement others in promoting responsible aquaculture in meeting world food needs.
China
China´s growing demanding for more seafood makes it an attractive market to target, as domestic production only covers 30% of local seafood demand. Oyster and mussel consumption is growing at 20% per year in the country.
Scallops
Europe - Imports
In the first six months of this year, the volume of scallop imports to the European market reached 22 600 tonnes, a reduction of 5% compared with the same period last year when imports reached 23 700 tonnes and is the lowest in the last six years.
Regarding the countries of origin that traded scallop in the European community market in the first six months of 2013, the UK contributed the highest amount of 24% to the market with 5 500 tonnes, followed by the USA with 3 000 tonnes, while France and Peru contributed 2 800 tonnes each.
In the Spanish market, the demand for scallops between January and June of 2013 grew from 2 500 tonnes to 3 400 tonnes, with France being the main supplier at 50% of shipments. Demand on the French market also fell, from 9 600 tonnes in the first six months of 2012 to 8 600 tonnes in 2013. This is lowest quantity of scallop
Imports/ExportsScallop: World
Jan-Jun2012 2013
(1 000 tonnes)IMPORTSChina 10.2 20.1
USA 8.5 12.7
France 9.7 8.7
Hong Kong 3.3 5.3
Republic of Korea 4.7 4.3
Spain 2.6 3.4
Italy 3.2 3.2
Taiwan 2.5 3.0
Ukraine 1.8 2.9
Canada 2.8 2.8
Total 69.4* 81.4*EXPORTSChina 14.6 15.2
USA 7.0 5.9
UK 6.4 5.7
Peru 2.5 4.5
Argentina 2.4 3.3
Canada 2.2 3.1
Japan 3.0 2.3
Belgium 1.7 2.0
Taiwan 1.1 1.4
Italy 1.4 1.4
Total 56.5 54.4*Source: GTIS
ImportsScallops EU
Jan-Jun2008 2009 2010 2011 2012 2013
(1 000 tonnes)France* 11.8 12.4 12.6 12.4 9.6 8.6
Spain* 5.5 4.8 4.3 4.0 2.5 3.4
Italy* 3.0 2.8 3.2 3.6 3.2 3.1
Belgium 1.8 1.6 2.2 2.6 2.1 1.9
Netherlands 1.2 1.3 2.0 1.2 2.1 1.6
Denmark 0.5 0.4 0.5 1.2 1.4 1.4
Others 3.3 3.7 3.5 3.1 2.7 2.6
Total 27.1 27.0 28.2 28.1 23.7 22.6Source : EUROSTAT and Customs*
ImportsScallop: EU-27 (by country of origin)
Jan-Jun2008 2009 2010 2011 2012 2013
(1 000 tonnes)IMPORTSUK* 4.0 4.8 4.2 4.6 6.0 5.5
USA 3.4 4.5 3.4 3.6 3.0 3.0
France* 2.7 2.0 2.5 2.6 1.8 2.8
Peru 2.6 2.8 4.9 5.0 2.5 2.8
Argentina 2.9 2.7 2.9 2.9 2.3 1.3
Netherlands 0.8 0.7 0.9 0.9 1.2 1.1
Viet Nam 0.7 0.5 1.2 0.8 1.0 1.0
Others 10.0 8.9 8.2 7.7 5.9 5.1
Grand Total 27.1 27.0 28.2 28.1 23.7 22.6Total Intra 12.7 12.8 11.8 12.5 11.9 12.2Total Extra 14.4 14.2 16.4 15.6 11.8 10.4EXPORTSGrand Total 13.6 13.2 16.8 17.8 14.6 13.1Total Intra 13.1 13.0 16.4 17.1 13.6 12.2Total Extra 0.5 0.3 0.4 0.7 1.0 0.9
Source : EUROSTAT and Customs*
BIVALVES

53Globefish Highlights October 2013
BIVALVES
imports in the last six years.
Following negotiations between fishing industry representatives from the UK and France the Marine Management Organisation (MMO) issued fishing vessel licence variations allowing UK scallop fishing vessels to receive 7 extra effort days in exchange for not fishing in certain areas in the latter part of the year. The agreement will come into effect on 1 August and should reduce tensions between French and English scallop fishermen.
South America - Production
In Argentine Patagonia, the local fishermen’s association of Puerto Madryn set up a processing plant for Argentinean scallops. Extraction of no more than 30% of biomass is allowed keeping the resource stock sustainable. In the first half of 2013 total exports of Patagonian scallops from Argentina increased from 2 857 tonnes in 2012 to 3 223 tonnes in 2013. However, European markets were not the recipients of higher quantities of these exports in the first semester of this year, as imports of scallops from
Argentina to the European market fell from 2 300 tonnes in 2012 to 1 300 tonnes in 2013. They are now down by more than half compared with the period from 2008 to 2011.
In August, Chilean scallop production was down by 27.7% compared with the previous year with a volume of 2 600 tonnes, according to information from Subpesca.
Japan
In Japan, the Hokkaido Federation of Fisheries Cooperative Association’s scallop fishery received MSC certification earlier this year, following a process that lasted two and a half years. The fishery has three units: spat collection, hanging cultivation, and seabed ranching and dredge cultivation, all of which have been certified, according to the MSC. Minato-Tsukiji reported that during 2013 the scallop harvest from Hokkaido will be down by 8%. The scallop harvest is also expected to be reduced in the USA and the combined effect is expected to keep prices rising.
Oysters
European production
Oyster production in France has fallen by half, from 120 000 tonnes to a volume between 60 000 and to 70 000 tonnes since 2008, as a result of various diseases, including the herpes virus disease and a disease apparent in adult oysters this year associated with the bacterium Vibrio. Other factors include environmental impacts such as polluted waters, according to the Comite National de la Conchicultura (CNC). Oysters have doubled in price over the past three years as a result of high mortalities and these problems will keep sale prices high during 2013. In September, live oyster sold for EUR 4.5 in France.
ImportsScallops: France
Jan-Jun2008 2009 2010 2011 2012 2013
(1 000 tonnes)UK 1.5 2.4 1.7 1.9 1.8 2.2
Peru 1.6 2.1 3.4 3.7 1.8 2.0
USA 1.8 2.6 1.5 1.7 1.2 1.5
Argentina 2.7 2.7 2.7 2.6 2.3 1.3
Canada 1.0 0.6 0.7 0.6 0.4 0.5
Viet Nam 0.3 0.2 0.6 0.3 0.4 0.3
Chile 1.1 1.2 0.7 0.3 0.3 0.0
Others 1.8 0.6 1.3 1.3 1.4 0.8
Total 11.8 12.4 12.6 12.4 9.6 8.6Source: Direction Nationale des Statistiques du CommerceExtérieur – DNSCE
ImportsScallops: Italy
Jan-Jun2008 2009 2010 2011 2012 2013
(1 000 tonnes)UK 1.3 1.4 1.5 1.8 1.9 1.7
France 0.7 0.5 0.7 0.7 0.6 0.6
Peru 0.2 0.2 0.2 0.4 0.2 0.2
Spain 0.2 0.1 0.2 0.2 0.1 0.1
Others 0.6 0.6 0.6 0.5 0.5 0.5
Total 3.0 2.8 3.2 3.6 3.2 3.1Source: ISTAT
ImportsScallops: Spain
Jan-Jun2008 2009 2010 2011 2012 2013
(1 000 tonnes)France 1.0 0.5 0.9 1.0 0.4 1.7
UK 0.9 0.4 0.7 0.4 0.6 0.6
Italy 2.5 3.2 2.1 1.5 0.9 0.5
Portugal 0.2 0.1 0.2 0.2 0.2 0.1
Others 1.0 0.6 0.4 0.8 0.4 0.4
Total 5.5 4.8 4.3 4.0 2.5 3.4Source: Agencia Tributaria

54 Globefish Highlights October 2013
In Europe the Oysterecover project, initiated in August 2010, has been engaged in the recovery of the European flat oyster (Ostrea edulis), which was decimated by overfishing and disease in the first half of the 20th century. Shellfish associations from four EU Member States worked together to establish scientific and technical methods, procedures and standards to allow for the recovery of O. edulis, in particular trying to produce a strain that is resistant to the disease of bonamisosis, which caused mortalities of up to 90% of affected oysters. FIS.Com reports that, in October, the final workshop will be held in Spain, where results will be presented that indicate the recovery of this species may become a reality. The scientific coordinator of one of the institutions involved said that the European flat oyster could begin to multiply soon and in five years the situation could be much different.
Central and South America countries supporting oyster production
Demand for oysters is generating support for oyster farming projects by governments in several Central and Latin American countries. In Ecuador, the Ministry responsible for fisheries has provided materials for an oyster (Crassostrea gigas) farming project in the open sea with “hanging systems” that will benefit 50 fishermen from the Puerto Real Alto Cooperative. From 2015 ten farming long lines will be in operation.
Currently, only El Salvador in Central America has been involved in oyster farming. In September a workshop was organized to share the experiences of El Salvador in Pacific oyster farming (C. gigas) and to encourage other countries to join this initiative. It was been supported by the Japan International Cooperation Agency (JICA). The Organization of Fisheries and Aquaculture Sector of Central America (OSPESCA) also supports an increase in oyster farming on the Pacific coast of Central America. Venezuela is hoping to develop a Centre for Environmental Monitoring and Production of shellfish seeds.
Source: European Price Report
4.50
1.001.502.002.503.003.504.004.505.00
Sep-
08
Jan-
09
May
-09
Sep-
09
Jan-
10
May
-10
Sep-
10
Jan-
11
May
-11
Sep-
11
Jan-
12
May
-12
Sep-
12
Jan-
13
May
-13
Sep-
13
Live - No. 3EUR/kg
Oyster - Crassostrea gigas, production price, origin: Ireland/France Imports/ExportsOyster: World
Jan-Jun2012 2013
(1 000 tonnes)IMPORTSJapan 4.8 4.9
USA 3.8 4.4
Hong Kong 2.8 3.2
Italy 2.2 2.0
France 1.7 1.7
Canada 1.1 1.3
Belgium 0.7 0.8
Singapore 0.6 0.8
Spain 0.8 0.6
China 0.6 0.6
Total 18.7* 19.2*EXPORTSRepublic of Korea 5.0 6.0
China 3.4 4.3
France 3.1 3.4
Ireland 1.4 2.2
USA 1.8 1.9
Canada 1.6 1.8
Netherlands 1.5 0.9
Japan 0.6 0.7
Malaysia 0.2 0.5
UK 0.8 0.4
Total 17.7* 19.0*Source: GTIS* estimates
In Chile, the Fishery and Aquaculture Centre (CAPIA) began a two-year project for developing small-scale farming of the Chilean oyster (Ostrea chilensis) and for transferring this technology to local fishermen.
North America seeks to overcome climatic and disease problems of oyster production
The Hawaii Tribune-Herald reported in early July that Hawaii is playing an important role in supplying the west coast of the United States with oyster seed. As a result of acidification of the seawater off the west coast at crucial times of the year, oyster hatcheries were seeing large die-offs of larvae. A company in Hawaii was able to produce viable larvae and ship them back to the west coast to complete their life cycle.
BIVALVES

55Globefish Highlights October 2013
CBC News reports that Nova Scotia on the east coast of Canada is looking to New England to learn from their success in managing oyster farms affected by MSX (Multinucleate Sphere X) disease. At the end of July a delegation of researchers, industry representatives and government officials from Canada spent a week on the USA east coast discussing approaches to oyster farming and how to develop methods of raising disease-resistant oysters. The use of triploid genetic varieties as well as systems to grow oysters more quickly are contributing to the success of oyster recovery in these areas of the USA.
Clams
At the end of May this year, the MSC announced the successful certification of the artisanal clam and cockle fisheries of the Ria de Arosa Galician Cooperative Society. The cooperative harvests around 20 tonnes of seafood per year from small boats or from the shore. The production is sold to regional and national markets. This
BIVALVES
Imports/ExportsClam/Cockle/Ark shell
Jan-Jun2012 2013
(1 000 tonnes)IMPORTSJapan 35.4 37.8
Republic of Korea 34.7 30.8
Spain 3.7 10.7
USA 8.7 10.1
China 2.3 4.6
Italy 2.9 4.3
Portugal 0.3 4.1
Thailand 4.8 3.3
Ukraine 1.8 2.9
Singapore 2.7 2.6
Total 108.6* 118.5*EXPORTSChina 75.4 74.6
Republic of Korea 6.3 5.2
USA 3.4 5.1
Italy 3.3 4.9
Thailand 3.6 4.8
Canada 4.2 3.8
Netherlands 1.6 2.5
Portugal 0.3 2.0
Taiwan 1.1 1.4
Indonesia 0.9 1.1
Total 108.2 112.1*Source: GTIS* estimates
gives consumers the assurance that clams and cockles from these fisheries have been caught sustainably and according to world recognised standards. The price of clams has fallen by 28% in the last five years in Galicia, because of slow demand, but having a recognizably certified product may stimulate renewed consumption.
Outlook
Chilean mussel farmers estimate that the high price of seeds will result in an unused capacity of 35% of farming area, which could lead to a reduction of mussel supply from this country. The lower volume could be compensated for by export higher prices, which have already seen an increase of 33% in the average price of mussels. In June 2012, the value was USD 2.54/kg, while the average price in June 2013 was USD 2.84/kg.
Expected production volumes of around 80 000 tonnes of oysters by the end of the year in France might affect prices during the Christmas season. Asia, and in particular China, are attractive options as future markets for French producers as production volumes are expected to increase. Demand is increasing in China and, unlike in Europe, it is not seasonal but year-round. High value products such as oysters and scallops are in demand in an evolving consumption trend, especially in cities like Beijing.
BIVALVES NEWS
As from March 2011 the GLOBALG.A.P. Aquaculture Standard version 4 covers species from the finfish, crustaceans and mollusc groups, including all farming systems. Certification is linked to the scientific name to support transparency in the market. Almost 2 million tonnes of live fish at the point of harvest have been successfully certified in 29 countries involving 15 aquatic species. With 15 GLOBALG.A.P. approved certification bodies working worldwide under the accredited system, any aquatic farming activities seeking GLOBALG.A.P. certification have access to auditing activities. Compound feed manufacturing certification is now present in 16 countries in Europe, Latin America and Southeast Asia to support farms to keep their certified status. The investments made on the GLOBALG.A.P. Integrity Program keeps certification bodies at the highest level of professionalism and credibility. Source: GLOBALG.A.P.
SPAIN: Mussel polygons reopened after red tide remission The Galician government has decided to reopen five mussel platform polygons located in Redondela after checking that the red tide began to recede in the Vigo estuary. However, the Technological Institute for the Control of the Marine Environment of Galicia (Intecmar) warns that the episode is still very virulent. Red tide affects clams, cockles and razor clams, but differently depending on the area. The shellfish industry said the situation is extreme because this is the best time for quality mussel, Atlantico reported. Meanwhile, the director of Intecmar, Covadonga Salgado, was cautious and considered it was “premature” to say that the red tide has reached its peak, the newspaper Faro de Vigo.The mussel sector employs about 15,000 people in Galicia. In this region there are more than 3,300 platforms, and almost 70 per cent is located in the estuary of Arousa while 14 per cent in Vigo.Source: FIS.com

56 Globefish Highlights October 2013
Fish and fishery products statistics
Capture fisheries production
Aquaculture fisheries
productionExports Imports
2010 2011 2010 2011 2011 2012 2013 2011 2012 2013
estim. estim.
Million tonnes (live weight equivalent) USD billion
ASIA 48.7 48.8 52.4 55.5 49.4 52.1 52.8 42.5 44.3 42.7
China2 16.4 16.8 37.0 38.9 19.3 21.0 22.3 12.2 12.3 12.9
of which China, Hong Kong SAR 0.2 0.2 0.0 0.0 0.5 0.8 0.8 3.5 3.7 3.8
& Taiwan Province of China 0.9 0.9 0.3 0.3 1.8 2.0 1.8 1.0 1.0 1.0
India 4.7 4.3 3.8 4.6 3.4 3.4 3.8 0.1 0.1 0.1
Indonesia 5.4 5.7 2.3 2.7 3.2 3.6 3.7 0.4 0.4 0.4
Japan 4.1 3.8 0.7 0.6 1.9 1.8 1.9 17.3 18.0 15.2
Korea, Rep. of 1.7 1.7 0.5 0.5 2.0 2.0 1.7 3.9 3.7 3.6
Philippines 2.6 2.4 0.7 0.8 0.6 0.8 1.0 0.2 0.2 0.2
Thailand 1.8 1.9 1.3 1.0 8.2 8.1 7.2 2.7 3.1 3.2
Viet Nam 2.4 2.5 2.7 2.8 6.2 7.0 7.1 0.7 1.2 1.3
AFRICA 7.7 7.6 1.3 1.4 5.0 5.2 5.2 4.6 5.4 5.6
Ghana 0.4 0.3 0.0 0.0 0.0 0.0 0.0 0.3 0.2 0.3
Morocco 1.1 1.0 0.0 0.0 1.5 1.7 1.8 0.2 0.1 0.2
Namibia 0.4 0.4 0.0 0.0 0.8 0.8 0.8 0.0 0.0 0.1
Nigeria 0.6 0.6 0.2 0.2 0.1 0.1 0.1 1.2 1.5 1.4
Senegal 0.4 0.4 0.0 0.0 0.3 0.3 0.3 0.0 0.0 0.0
South Africa 0.6 0.5 0.0 0.0 0.6 0.6 0.5 0.3 0.4 0.4
CENTRAL AMERICA 2.5 2.4 0.3 0.3 2.1 2.2 2.0 1.4 1.5 1.8
Mexico 1.5 1.6 0.1 0.1 1.1 1.1 1.0 0.6 0.6 0.8
Panama 0.2 0.2 0.0 0.0 0.1 0.1 0.2 0.0 0.1 0.1
SOUTH AMERICA 9.5 14.0 1.6 2.1 12.5 12.7 12.3 2.8 2.8 3.4
Argentina 0.8 0.8 0.0 0.0 1.5 1.3 1.5 0.2 0.2 0.2
Brazil 0.8 0.8 0.5 0.6 0.2 0.2 0.2 1.3 1.2 1.5
Chile 2.7 3.1 0.7 1.0 4.5 4.3 4.6 0.4 0.4 0.4
Ecuador 0.4 0.5 0.3 0.3 2.5 2.9 3.1 0.3 0.2 0.2
Peru 4.3 8.2 0.1 0.1 3.1 3.3 2.4 0.1 0.1 0.2
NORTH AMERICA 5.6 6.2 0.7 0.6 10.4 10.5 10.4 20.1 20.3 20.3
Canada 0.9 0.9 0.2 0.2 4.2 4.3 4.3 2.6 2.7 2.7
United States of America 4.4 5.2 0.5 0.4 5.8 5.8 5.7 17.5 17.6 17.5
EUROPE 13.8 13.3 2.5 2.7 46.1 43.6 46.6 55.8 53.5 56.8
European Union 2 5.4 5.0 1.3 1.3 29.8 28.3 30.4 49.6 47.1 49.7
of which Extra-EU " " " " 5.2 5.5 6.0 26.2 24.9 26.0
Iceland 1.1 1.1 0.0 0.0 2.2 2.2 2.2 0.1 0.1 0.1
Norway 2.7 2.3 1.0 1.1 9.5 8.9 9.7 1.3 1.4 1.3
Russian Federation 4.1 4.3 0.1 0.1 3.3 3.1 3.5 2.7 2.7 3.0
OCEANIA 1.2 1.2 0.2 0.2 2.6 3.0 3.0 1.8 2.0 2.0
Australia 0.2 0.2 0.1 0.1 1.0 1.0 1.1 1.5 1.6 1.6
New Zealand 0.4 0.4 0.1 0.1 0.9 1.2 1.2 0.1 0.2 0.1
WORLD 3 89.0 93.5 59.0 62.7 128.2 129.3 132.2 129.0 129.8 132.6
World excluding Intra-EU " " " " 103.5 106.6 107.8 105.6 107.7 108.8
Developing countries 64.3 69.2 54.9 58.7 67.6 70.9 70.9 33.3 35.3 37.7
Developed countries 24.6 24.3 4.1 4.0 60.6 58.5 61.3 95.7 94.4 94.9
LIFDCs 21.0 20.7 9.7 11.3 10.1 10.7 11.1 4.4 4.9 5.1
LDCs 9.1 9.3 2.5 2.7 2.6 2.4 2.4 0.8 0.9 1.1
NFIDCs 17.0 21.2 3.7 4.0 9.6 10.1 8.9 3.3 3.9 4.41 Production and trade data exclude whales, seals, other aquatic mammals and aquatic plants. Trade data include fish meal and fish oil. 2 Including intra-trade. Cyprus is included
in Asia as well as in the European Union. Starting with 2013 data, EU includes Croatia. 3 For capture fisheries production, the aggregate includes also 19 214 tonnes in 2010 and 19 566 tonnes in 2011 of not identified countries, data not included in any other aggregates. Totals may not match due to rounding.

The GLOBEFISH Research Programme provides detailed analysis of selected markets, species and products of relevance in international fish trade. In addition, studies are published on specific issues of importance to the sector.
❏ I would like to order _____ copy(ies) of volume number _____________________for a total of €_______
❏ By bank cheque in € made out to FAO GLOBEFISH for €_______________________
❏ By bank transfer in Euro to: FAO GLOBEFISH FAO Trust Fund (EUR) Bank Name: HSBC Bank, Plc 8 Canada Square London E14 5HQ, UK Swift/BIC: MIDLGB22 Account Number: 67115083 IBAN: GB04MIDL40051567115083
or By credit card: ❏ Visa ❏ MasterCard
Credit Card Number: ____________________ Expiry Date: _____________________
Signature: ______________________________ For € :__________________________
Please provide the following information:
NAME: ..........................................................................
COMPANY: ..................................................................
POSTAL ADDRESS: ....................................................
CITY: .............................................................................
COUNTRY: ...................................................................
TEL.: ..............................................................................
FAX: ..............................................................................
E-MAIL: .............................. @......................................
Date: ........./ ........./ .........
Glo
befis
h R
esea
rch
Pro
gram
me
Kindly return this form to:GLOBEFISH - FIPMFood and Agriculture Organization of the UNViale delle Terme di Caracalla, 00153 Rome, ItalyTel: (+39) 06 570 544163Fax: (+39) 06 57053020E-mail: [email protected]
Research ProgrammeVol. 114 Eel: Production and Trade according to Washington Convention Legislation Upcoming issueVol. 113 The European market for Mussels Upcoming issueVol. 112 By-products of tuna processing Jul 2013 €30Vol .111 Technical guide to fish canning May 2013 €30Vol. 110 Innovative uses of fisheries by-products Feb 2013 €30Vol. 109 Seafood markets in Southern Africa: potential of regional trade and aquaculture... Jan 2013 €30 Vol. 108 Risks and benefits of seafood consumption Jan 2013 €30 Vol. 107 El eco-etiquetado de productos pesqueros en España Sep 2012 €30Vol. 106 El mercado de productos pesqueros en España Aug 2012 €30Vol. 105 The European market for shrimp Aug 2012 €30 Vol. 104 The Seafood Market in France Aug 2011 €30 Vol. 103 Turbot – Production Technology and Markets Feb 2011 €30 Vol. 102 The Ornamental Fish Trade Nov 2010 €40Vol. 101 Markets for Tilapia Jul 2010 €30Vol. 100 Importance of APEC in world fisheries and aquaculture Mar 2010 €30Vol. 99 Viet Nam - Seafood from Waterland Mar 2010 €30Vol. 98 The seafood market in Greece Mar 2010 €30Vol. 97 Private standards in fisheries and aquaculture Apr 2009 €30Vol. 96 The Seafood Market in Spain Nov 2008 €30Vol. 95 The Seafood Markets in Southern EU - Cyprus, Malta and Slovenia Apr 2008 €30Vol. 94 World Octopus Market Jul 2008 €30Vol. 93 Global Production and Marketing of Canned Tuna Apr 2008 €30

Food and Agriculture Organization of the United NationsFisheries and Aquaculture Policy and Economics DivisionViale delle Terme di Caracalla00153 Rome -ITALYTel: (+39) 06 57054163Fax: (+39) 06 57053020E-mail: [email protected] site: www.globefish.org