globe year 6 evaluation report - sri … year 6 evaluation report ... cedar grove and dutchess...
TRANSCRIPT

October 2002SRI Project 03403
GLOBE YEAR 6 EVALUATION REPORT Explaining Variation in Implementation
Prepared for:
Global Learning and Observations to Benefit the Environment (GLOBE) 1800 G Street, NW, Suite 800 Washington, DC 20006 Prepared by:
Center for Technology in Learning

GLOBE Year 6 Evaluation Project Staff: Barbara Means, Principal Investigator William Penuel, Co-Principal Investigator Valerie M. Crawford Christine Korbak Amy Lewis Robert F. Murphy Linda Shear Cheryl Villavicencio Emily Y. Vinson Louise Yarnall
CONTENTS EXECUTIVE SUMMARY ............................................................................................... i 1. Introduction............................................................................................................ 1-1
Program Description .................................................................................................... 1-1 Evolution of Teacher Training in the United States .................................................... 1-4 International Partners ................................................................................................... 1-5 New Directions ............................................................................................................ 1-6 Evaluation Results ....................................................................................................... 1-7 Report Overview.......................................................................................................... 1-7
2. Methodology ........................................................................................................... 2-1
Investigation of Program Growth ................................................................................ 2-1 Quantitative Analysis of Variation in Program Implementation ................................. 2-1 Examining Classroom Variation in Implementation: Case Studies............................. 2-3 Analysis of International GLOBE Program Partners’ Activities................................. 2-5 Assessment of Student Learning.................................................................................. 2-5 Discussion.................................................................................................................... 2-7
3. Program Growth.................................................................................................... 3-1
Trends in GLOBE Data Reporting .............................................................................. 3-2 Retention of GLOBE Schools from Year to Year ....................................................... 3-3
A New Trend: Earlier Spring Decline in Reporting ................................................ 3-4 Decline in the Number of New GLOBE Teachers Trained......................................... 3-6 Reporting Patterns for Different Data Types ............................................................... 3-9 Reporting Patterns for Protocols Requiring Less-Frequent Data Collection............. 3-12 Discussion.................................................................................................................. 3-15
4. Variation in Implementation Across Schools ...................................................... 4-1
Introduction.................................................................................................................. 4-1 Consistency and Persistence in GLOBE Implementation ........................................... 4-2 Periodic versus Steady Data-Reporting Schools in GLOBE ....................................... 4-4 Persistence in GLOBE Data Reporting........................................................................ 4-4 The Relationship between Data-Reporting Levels and Persistence ............................ 4-5 Impact of Posttraining Supports on GLOBE Data Reporting...................................... 4-7 Barriers to Data Reporting ........................................................................................... 4-9 Discussion.................................................................................................................. 4-15
5. Variation in Implementation in Case Study Schools .......................................... 5-1
Introduction.................................................................................................................. 5-1 An Urban School and a Rural School with Close Ties to Their Communities............ 5-3
GLOBE at Downtown and West Schools................................................................ 5-4 The Challenge: Aligning GLOBE, State Standards, and Testing............................ 5-6
Two Parochial Schools in the Urban U.S. South: Heart of Mary and Cabrini ............ 5-9 GLOBE at Heart of Mary and Cabrini..................................................................... 5-9

Aligning GLOBE with Locally Developed Standards........................................... 5-12 Programs with a Strong Focus on Science: Cedar Grove and Dutchess Academy ... 5-15
GLOBE at Cedar Grove and Dutchess .................................................................. 5-16 Writing Science Standards for Cedar Grove and Dutchess ................................... 5-19
Discussion: Curricular Alignment at the Classroom Level Revisited ....................... 5-21 Dimension 1: School-Level Versus Teacher-Level Focus on GLOBE................. 5-21 Dimension 2: Practicing Doing Science Versus Contributing to Science ............. 5-22 Dimension 3: Adapting to Versus Defining Standards and Tests.......................... 5-23
6. GLOBE International Partners............................................................................ 6-1
Scope of Participation .................................................................................................. 6-1 International Partner Strategies.................................................................................... 6-2
Partnerships for Sustained Funding ......................................................................... 6-2 Institutional and Political Support ........................................................................... 6-3 Teacher Training Models......................................................................................... 6-3 Providing Support for Teachers ............................................................................... 6-4 GLOBE Alignment with Standards ......................................................................... 6-5 Regional Collaborations........................................................................................... 6-7 GLOBE as a Catalyst for Environmental Study ...................................................... 6-8 School-to-School Activities ................................................................................... 6-11
Discussion.................................................................................................................. 6-11 7. Measuring Student Learning................................................................................ 7-1
GLOBE and North Carolina’s Science Standards ....................................................... 7-1 Our Approach to the Assessment................................................................................. 7-3 Initial Focus of the Assessment: Hydrology and Land Cover ..................................... 7-4 The Assessment Pilot Sample...................................................................................... 7-5 Pilot Test Results: Analyses of Student Learning........................................................ 7-5 Discussion.................................................................................................................... 7-6
8. Discussion................................................................................................................ 8-1
Teachers’ Goals Shape GLOBE Implementation ........................................................ 8-1 School-Level Factors Shape GLOBE Implementation................................................ 8-2 Factors External to the School Shape Implementation ................................................ 8-3 Teachers’ Ongoing Opportunities to Learn to Shape Implementation ........................ 8-4 Research Guideposts for the Future of GLOBE .......................................................... 8-6
References...................................................................................................................... R-1
Appendix A................................................................................................................. A-1
Appendix B ................................................................................................................. B-1
Appendix C ................................................................................................................. C-1
Appendix D................................................................................................................. D-1
Tables
Table 1.1 GLOBE Data Collection Protocols*................................................................ 1-3 Table 5.1 Summary of Case Study Schools..................................................................... 5-3 Table 7.1 Competency Goals for North Carolina Middle School Science ...................... 7-2 Table 7.2 Analysis of Differences in Scores across Groups in Assessment
Pilot .......................................................................................................................... 7-6
Figures
Figure 3.1 Number of Schools Reporting Data in GLOBE, Years 1-6, by Month....................................................................................................................... 3-2
Figure 3.2 Trends in GLOBE School Retention.............................................................. 3-4 Figure 3.3 Number of Schools Reporting Data in GLOBE Year 6, Comparing All Reports
and Selected Investigation Areas, by Month ........................................................... 3-5 Figure 3.4 Number of U.S. Teachers Trained, by Year................................................... 3-7 Figure 3.5 Number of International Teachers Trained, by Year...................................... 3-8 Figure 3.6 Number of Schools Reporting Hydrology Data, by Month
and Year ................................................................................................................. 3-11 Figure 3.7 Number of Schools Reporting Data on Selected Hydrology
Protocols, by Year.................................................................................................. 3-12 Figure 3.8 Number of Schools Reporting Selected Soil Protocols, by Year ................. 3-13 Figure 3.9 Number of Schools Reporting Land Cover Qualitative Data,
by Year................................................................................................................... 3-14 Figure 3.10 Number of Schools Reporting GLOBE II Quantitative Land Cover/Biometry
and Phenology Data, by Year ................................................................................ 3-15 Figure 4.1 Number of Steady and Periodic GLOBE Data Reporters
in 2000-01* .............................................................................................................. 4-4 Figure 4.2 Persistence in GLOBE Data Reporting from 1995-96 to 1996-97
and 1999-2000 to 2000-2001 ................................................................................... 4-5 Figure 4.3 Persistence in GLOBE: Steady Reporters vs. Periodic Reporters.................. 4-6 Figure 4.4 Persistence in GLOBE Data Reporting, by School Level.............................. 4-7 Figure 4.5 Type of Support Available, by Number of Months Data Reported,
1999-2000 ................................................................................................................ 4-8 Figure 4.6 Difficulty with Curriculum Integration, by Reporting Type ........................ 4-10 Figure 4.7 Difficulty Finding Time to Report Data, by Reporting Type....................... 4-11 Figure 4.8 Value Is in Taking (Not Reporting) Data, by Reporting Type..................... 4-12 Figure 4.9 Difficulty with Internet Connectivity, by Reporting Type........................... 4-13 Figure 4.10 Difference between Nonreporters and Steady Reporters, by
Barriers to Reporting.............................................................................................. 4-14 Figure 6.1 Spanish School Implements Environment Workshop.................................... 6-7 Figure 6.2 Announcement for VI Global Conference on Environmental
Education ............................................................................................................... 6-10

EXECUTIVE SUMMARY
The Global Learning and Observations to Benefit the Environment (GLOBE)
Program engages students around the world in observing and measuring aspects of their
local environments, including atmosphere, bodies of water, soil, and land cover. Data
gathered by students are provided to scientists for their use through a GLOBE Program
Web site. The GLOBE Program, headquartered in Washington, D.C., has received
support from several United States government agencies: the National Oceanic and
Atmospheric Administration (NOAA); the National Aeronautics and Space
Administration (NASA); the National Science Foundation (NSF); the Environmental
Protection Agency (EPA); and the Departments of Education and State.
As a curriculum resource for teachers, GLOBE offers a set of hands-on, inquiry-based
activities for students. The emphasis in participation is on accurately collecting data,
within a framework of increasing science content and conceptual knowledge, and
reporting data to the GLOBE Web site. The goals of the Program are to:
• help K-12 students improve their achievement in science and mathematics and their skills in the use of computer and network technology while helping students and teachers meet local education standards;
• help expand the pipeline of potential future scientists and researchers for industry, academia, and in support of Government programs, including those of NOAA, NASA, and NSF;
• increase awareness of the environment from a scientific viewpoint, without advocacy relative to issues; and
• improve student understanding of science through involvement in performing real science.
This report was researched and prepared by SRI International (SRI), evaluation
partner for the GLOBE Program. The Year 6 Evaluation Report focuses on variations in
implementation patterns, the factors that shape differences in the ways that schools
implement GLOBE, and the impact of these patterns on student learning. We used data
collected in both 1999-2000 and in 2000-01 to develop an understanding of the sources
and effects of variation in GLOBE implementation across schools. We conducted
i

GLOBE Evaluation Year 6 – Executive Summary
analyses of the GLOBE Data Archive to characterize differences in implementation
patterns at schools across the United States and used teacher survey data from Spring
2000 to help understand those patterns. We conducted case studies at six different
schools across the United States to understand specifically the impact of one important
set of influences on GLOBE implementation—state standards and accountability
systems. Interviews with international partners provided data on specific experiences of
other countries that could be associated with differences in implementation. Finally, we
analyzed the impact of different levels of GLOBE implementation on student learning
both across the United States and in a state where standards have been closely aligned
with GLOBE content and activities.
Signs of overall GLOBE Program growth were mixed in Year 6. There are signs that
the rate at which the Program is adding teachers and data to the GLOBE Data Archive is
slowing compared with previous years’ data on reporting and teacher training. The
pattern of reporting suggests that data reporting overall is stable but, in some cases,
declining slightly. In addition, the spring decline in the number of schools that reported
data to the GLOBE Data Archive was steeper than in previous years. Still, the GLOBE
Program continues to grow in reach and in numbers. As of September 2001, GLOBE has
expanded to include 97 countries. More than 1,800 schools reported data during the most
recent school year (2000-01). The total number of teachers who have been trained in
GLOBE continues to grow.
Importantly, schools are becoming more consistent in reporting GLOBE data. Nearly
half of all schools that reported GLOBE data last year reported data consistently,
submitting data during at least 7 of the 12 months from August 2000 through July 2001.
Consistent student data reporting contributes to the GLOBE Program accomplishing its
educational and scientific mission of involving students in observing the environment in
ways that can contribute to the advancement of science. The analyses performed using
data from the Teacher Survey and GLOBE Data Archive also underscored the
significance of consistency in data reporting for persistence in GLOBE. Schools that
report consistently in one year are twice as likely to report data the next year, based on
analyses of data reporting from 1999-2000 and 2000-01. Interestingly, this pattern is
more pronounced among elementary schools than among secondary schools.
ii

GLOBE Evaluation Year 6 – Executive Summary
Our case studies of GLOBE schools found additional local variation in GLOBE
implementation. We observed that GLOBE implementation varied along three important
dimensions. First, schools differ as to whether there was a school-level focus on GLOBE
or a teacher-level focus on GLOBE. Second, teachers’ goals for teaching GLOBE vary
from school to school, depending on their views of how GLOBE contributes to students’
science learning. Third, the schools differ in the extent to which external pressures of
standards and accountability testing are perceived to compete with GLOBE activities.
Teachers with a greater degree of autonomy in defining the science curriculum for their
students and in articulating how GLOBE fits within their goals for student learning were
more likely to see GLOBE as closely aligned with standards.
Some states have mandated science standards that are aligned with GLOBE content.
These states offer an opportunity to examine how close alignment might impact teachers’
choices about curricular activities. We examined how variation among schools with
respect to alignment of standards and data reporting might be associated with differences
in learning outcomes as measured by our student learning assessment in the Hydrology
Investigation Area. Students from North Carolina classrooms where GLOBE content is
covered because it is incorporated into state standards outperformed students from
classrooms where there is no state-level alignment. In addition, students who reported
GLOBE Hydrology data outperformed students from classrooms where teachers had been
trained in GLOBE but where they had not yet implemented any GLOBE activities.
These results complement previous years’ findings on the significance of data reporting
for student achievement; SRI’s assessments in both Years 4 and 5 found students from
classrooms with above average data reporting were more likely to make scientific
observations of their environment and solve problems with GLOBE-like data than
students in classrooms that reported data less frequently.
Our report concludes with a discussion of implications of this evaluation for the
design of posttraining supports for teachers that may contribute to more student inquiry
with GLOBE data. GLOBE partners have typically emphasized to teachers science
content knowledge more than classroom implementation of GLOBE. Science content
knowledge is indeed important because teachers’ level of comfort with science content is
an important predictor of their use of inquiry methods in science (Dobey & Shafer, 1984).

GLOBE Evaluation Year 6 – Executive Summary
However, classroom implementation of GLOBE is an area in which teachers need
increased support. GLOBE partners have tended to address how to implement GLOBE
in classrooms primarily toward the end of GLOBE training sessions; teachers at GLOBE
trainings have also used the opportunity to talk about classroom implementation
informally during breaks in the training schedule. Teachers would feel more confident
about using GLOBE in the classroom if their training included a sustained focus on
classroom implementation. As the GLOBE Program increases emphasis on student
inquiry with GLOBE data, more attention may need to be paid to the pedagogical content
knowledge and supports needed to prepare teachers to lead student inquiry. Research on
preparing teachers to support student inquiry in science has emphasized the importance of
teachers having opportunities to do science themselves, contribute to a scientific
endeavor, and discuss scientific ideas with others (Flick, 1990; NRC, 2000).
iv

1. Introduction
This report was researched and prepared by SRI International (SRI), evaluation
partner for the Global Learning and Observations to Benefit the Environment (GLOBE)
Program. SRI’s evaluation team has prepared reports for the GLOBE Program since its
inception in 1995, and focused primarily on GLOBE efforts in the United States. Each
year’s report has highlighted different themes as GLOBE has matured. Early evaluation
reports documented the issues related to the expansion of the Program. SRI began
focusing 3 years ago on documenting the efforts of the GLOBE partner approach to
teacher training and support. Recently, evaluation efforts investigated variations in
program implementation from school to school and the factors that contributed to these
variations. The Year 6 Evaluation Report examines more closely variations in
implementation patterns, the factors that shape differences in the ways that schools
implement GLOBE, and the impacts of the Program on student learning.
We used data collected in 1999-2000 and in 2000-01 to develop an understanding of
the sources and effects of variation in GLOBE implementation across schools. We
conducted analyses of the GLOBE Data Archive to characterize differences in
implementation patterns across schools and used teacher survey data from spring 2000 to
help understand those patterns. We conducted case studies at six different schools across
the United States to explore the impact of state standards and accountability systems on
GLOBE implementation. Interviews with international partners provided data on specific
experiences of other countries that could be associated with differences in
implementation. Finally, we administered environmental science assessments and
analyzed the impact of different levels of GLOBE implementation on student learning,
both across the United States and in a state where standards have been closely aligned
with GLOBE content and activities.
Program Description
GLOBE, headquartered in Washington, D.C., has received support from several
United States government agencies: the National Oceanic and Atmospheric
Administration (NOAA), the National Aeronautics and Space Administration (NASA),
1-1

GLOBE Evaluation Year 6 – Chapter 1: Introduction
the National Science Foundation (NSF), the Environmental Protection Agency (EPA),
and the Departments of Education and State. At the GLOBE Annual Conference in July
2001, staff reported that more than 17,000 teachers had completed GLOBE training, and
that there were more than 10,000 GLOBE schools in 97 countries. This reach across so
many nations means that nearly every biome on Earth is represented in GLOBE.
GLOBE engages students around the world in observing and measuring aspects of
their local environments, including atmosphere, bodies of water, soil, and land cover.
Data gathered by students are provided to scientists for their use through a GLOBE Web
site.
GLOBE provides schools with a scientific framework and educational resources, but
it is not a curriculum. Schools and teachers are able to choose which grade levels and
classes will participate and the way in which the Program will be integrated into the local
curriculum. The goals of the Program are to:
• Help K-12 students improve their achievement in science and mathematics and their skill in the use of computer and network technology while helping students and teachers meet local education standards.
• Help expand the pipeline of potential future scientists and researchers for industry, academia, and in support of government programs, including those of NOAA, NASA, and NSF.
• Increase awareness of the environment from a scientific viewpoint, without advocacy relative to issues.
• Improve student understanding of science through involvement in performing real science.
As a curriculum resource for teachers, GLOBE offers a set of hands-on, inquiry-based
activities for students. The emphasis in participation is on accurately collecting data
within a framework of increasing science content and conceptual knowledge, and
reporting data to the GLOBE Web site. Table 1.1 shows the range of protocols in use at
the time of our data collection for this report.
1-2

GLOBE Evaluation Year 6 – Chapter 1: Introduction
Table 1.1 GLOBE Data Collection Protocols*
Atmosphere/Climate Investigation Soil Investigation
Clouds Soil Characterization Field Measurements
Aerosol (Haze) Soil Characterization Lab Analysis
Barometric Pressure Gravimetric Soil Moisture
Relative Humidity Infiltration
Precipitation Soil Temperature
Maximum, Minimum, and Current Temperatures
Optional Gypsum Block Soil Moisture
Ozone
Hydrology Investigation Land Cover/Biology Investigation
Water Temperature Qualitative Land Cover Sample Site
Water pH Quantitative Land Cover Sample Site
Water Transparency Biometry
Dissolved Oxygen Modified UNESCO Classification (MUC) System
Salinity Manual Interpretation Land Cover Mapping
Alkalinity Unsupervised Clustering Land Cover Mapping
Nitrate Accuracy Assessment
Electrical Conductivity
GPS Investigation Phenology
GPS Budburst Phenology
Offset GPS Lilac Phenology
Green-up, Green-down
* From the Teacher’s Guide 2001.
1-3
GLOBE Evaluation Year 6 – Chapter 1: Introduction
GLOBE also includes learning activities. Some of these prepare students to conduct
measurements outlined in the protocols. The learning activities are targeted to a range of
grade levels and are intended to provide an educational context for the scientific activities
of GLOBE data collection and analysis. The protocols and learning activities are
included in the GLOBE Teacher’s Guide, which is given to teachers who attend GLOBE
training sessions. The first edition of the GLOBE Teacher’s Guide was distributed in
March 1995. The third edition was released in 1997, and updates and new protocols have
been released since then. The 2001 edition of the Guide is now available.
GLOBE also offers opportunities for less-structured student participation. In
particular, students can use the GLOBE Web site for many purposes: analysis of data in
the GLOBE Data Archive, e-mail communication with other GLOBE schools using
GLOBE Mail, development of joint research projects with other GLOBE students, and
submission of student reports and findings for inclusion in the on-line Student
Investigations Journal. Activities involving the use of MultiSpec software to manipulate
satellite images are another open-ended aspect of the Program.
Evolution of Teacher Training in the United States
Teachers attend training to prepare them to lead GLOBE activities at their schools.
During the Program’s first year of operation in the United States, GLOBE’s
administrators recruited teachers through an advertisement in the Federal Register,
requiring schools to commit to a full-time data collection schedule (including weekends
and school vacations) and 3 years of participation. Training began in 1995 at 12
university sites across the United States, coordinated and provided through the GLOBE
office. More than 1,500 teachers received GLOBE training that year. Each school was
allowed to send only one teacher for GLOBE training.
As the Program matured and started working on strategies to expand involvement,
GLOBE leadership developed the Program partner model. This option allowed the
Program to expand teacher training more cost-effectively and provide better ongoing
support for GLOBE teachers. Under this model, GLOBE enters into a no-exchange-of-
funds partnership with a university, school district, science center, governmental, or other
nonprofit entity interested in providing GLOBE training in its service area. GLOBE
1-4

GLOBE Evaluation Year 6 – Chapter 1: Introduction
administrators encourage teachers to attend training sessions in groups, so that teachers
have a network of close-by colleagues who are also learning to implement GLOBE. The
proximity of partner organizations to the schools whose teachers they recruit facilitates
this approach. In addition, having local partners means that partners can better provide
follow-up support to trained GLOBE teachers, improving the likelihood that
implementation will occur.
Over the past 3 years of the Program, United States and international partners have
trained nearly all the new GLOBE teachers. The extent and depth of their offerings
therefore affect the reach of the Program in attracting and retaining teachers. The
GLOBE office has taken responsibility for training partners in the GLOBE protocols and
learning activities using a train-the-trainer model. GLOBE office staff are also refining
the supports they provide to GLOBE partners for recruiting, training, and supporting
GLOBE teachers.
International Partners
GLOBE enters into formal agreements with countries other than the United States
because broad international participation is integral to the implementation of the
Program. GLOBE provides the Program infrastructure, while international partners
manage their own implementation, including selecting their own Country Coordinators,
deciding how many and which schools to sponsor, and determining how GLOBE will be
implemented in their schools.
It took time for international partners to identify the sources of funding,
organizational supports, school participants, and sources of equipment necessary for
GLOBE implementation. In GLOBE’s early years, most schools reporting data were
located in the United States (80% in May 1996, for example). Over time, however,
GLOBE has become increasingly international, in practice as well as in intent. Starting
in school year 1996-97 with 173 schools in 19 countries outside the United States,
international participation in GLOBE grew to more than 2,500 schools in 96 non-U.S.
countries in 2000-01. Moreover, 58% of the measurements submitted to the GLOBE
database in 2000-01 came from outside the United States.
1-5
GLOBE Evaluation Year 6 – Chapter 1: Introduction
New Directions
In its sixth year of operation, GLOBE concentrated on three primary areas for
program improvement in the United States: aligning GLOBE with science and other
subject-matter standards developed by individual states, promoting wider use of inquiry
approaches within GLOBE, and extending the reach of GLOBE more systematically to
groups that historically have been underrepresented in the sciences.
Aligning GLOBE with Science Standards. Public demand for improved student
academic achievement in the United States has resulted in accountability systems that
emphasize standards and high-stakes testing. Some states’ science and mathematics
standards align well with the GLOBE Program’s emphasis on hands-on, inquiry-based
learning, and the Program is working closely with GLOBE partners in a number of these
states. Consultants to the Department of Public Instruction in North Carolina have
identified GLOBE as a key resource to its schools for meeting its new state standards in
science. In New York, the State Education Department is developing standards for high
school environmental science that will be closely aligned with GLOBE. Texas signed an
agreement to implement GLOBE in all its schools.
Many states’ standards place a strong emphasis on disciplines other than science.
Unless teachers can show clearly how science activities contribute to the literacy and
mathematics skills emphasized by accountability systems, teachers may feel pressure to
focus less on science. To meet the needs of teachers for interdisciplinary learning
resources, the Primarily GLOBE project (http://www.globe.fsu.edu/index.htm) is
developing informational storybooks and science activities for K-3 students. These items
will address the need for materials that integrate science, mathematics, geography, and
language arts at the primary level. Eight storybooks have already been created and are
currently being field-tested.
Promoting Inquiry Approaches to Implementing GLOBE. GLOBE has always
encouraged student inquiry and research and promotes inquiry approaches in its teacher
training. To support teachers in implementing this approach with their students, GLOBE
Inquiry and Research Learning Activities, targeted at primary and middle levels, are now
available on CD-ROM. These activities provide teachers with real GLOBE datasets and
1-6

GLOBE Evaluation Year 6 – Chapter 1: Introduction
questions to promote student inquiry. Emphasis is on developing questions about data,
identifying patterns in data, and explaining variations and trends in data.
Reaching Out to Groups That Are Underrepresented in Science. GLOBE is also
reaching out to two communities in the United States historically underserved by science
programs, with its training programs for Tribal Colleges and Universities (TCUs) and
Historically Black Colleges and Universities (HBCUs). Both of these groups of
Americans have strong traditions of observing the environment from both scientific and
cultural points of view in ways that can enrich the GLOBE Program.
Evaluation Results
SRI International has tracked the progress of GLOBE’s development, expansion, and
impacts on student learning since 1995. The Year 2 evaluation (Means et al., 1997)
identified key issues for discussion and improvement, from providing classroom and
teacher support to improving assessment. The same report also emphasized the
importance of encouraging collegial support for GLOBE at school sites, developing
grade-appropriate learning activities, and encouraging teachers to use more of the
GLOBE data collection protocols. The Year 3 evaluation focused on developing student
achievement measures, and the Year 4 evaluation focused on the effectiveness of
recruiting, training, and follow-up support practices of GLOBE international and United
States partners. As the GLOBE Program has continued to evolve, it has taken steps to
support and enhance the work of partners. The Year 5 evaluation found that the more
successful GLOBE schools and teachers have adopted many of the principles cited in
SRI’s earlier evaluation reports. The Year 6 evaluation addresses the efforts to continue
growth in the Program despite challenges faced by many schools in implementing the
Program, reduced opportunities to receive training, and the external pressures influencing
curriculum choices across the United States.
Report Overview
Following this introductory chapter, Chapter 2 describes data collection methods, and
Chapter 3 presents a brief update of the status of GLOBE. The remainder of the report
represents Year 6 analyses, focusing throughout on the supports for participation and the
1-7

GLOBE Evaluation Year 6 – Chapter 1: Introduction
impact of external factors on GLOBE. In Chapter 4, a post hoc analysis of teacher survey
data explores variations in GLOBE implementation. The case studies are analyzed in
Chapter 5, and Chapter 6 describes the participation of international partners. The results
of the pilot of a student performance assessment are provided in Chapter 7. The report
concludes with a summary of findings and a related set of recommendations in Chapter 8.
1-8

2. Methodology
This report focuses on SRI’s evaluation activities and findings during 2000-01, the
sixth full school year of GLOBE implementation. In this chapter, we provide an
overview of the data sources and methodology applied in our Year 6 evaluation activities.
The six main sources of information used—the GLOBE database, SRI’s Year 5 teacher
survey data, a telephone teacher survey conducted in Year 6, case study site visits,
interviews with GLOBE Country Coordinators, and assessments of student learning—are
described below in terms of how they are used to support the analyses presented in each
chapter.
Investigation of Program Growth
SRI’s yearly evaluation focuses part of its effort on documenting the ongoing growth
of GLOBE as represented by teacher training and data reporting patterns. This analysis is
based on access to the NOAA-maintained GLOBE Data Archive. The data archive
contains the GLOBE measurements along with the name and location of the school
submitting the data, the type of data, and the date on which the data were collected.
Contact information on schools, teachers, and principals, as well as information about
each teacher’s GLOBE training, was formerly maintained in a separate master database
of “registered” United States GLOBE schools but is now part of the same Oracle
database containing the GLOBE Data Archive.
Statistics from the GLOBE Data Archive were used in the analysis of GLOBE growth
presented in Chapter 3 of this report. In that chapter, we describe the growth of GLOBE
in terms of the number of schools reporting data, number of teachers trained, and
frequencies and types of data reported. Trends in data reporting practices across different
years of GLOBE implementation were examined whenever possible.
Quantitative Analysis of Variation in Program Implementation
This year’s evaluation takes a closer look at variations in program implementation.
Schools vary widely in the extent to which they report data and persist in GLOBE from
year to year. We matched data from the GLOBE Data Archive with survey data collected
2-1
GLOBE Evaluation Year 6 – Chapter 2: Methodology
in Year 5 to investigate implementation variation. The data used and analyses performed
are described below.
Data Reports in 1999-2000. SRI downloaded data in spring 2000 from the GLOBE
Data Archive to create a file of school reports by month. Resulting spreadsheets showed
whether a school reported any data for each month between August 1999 and July 2000.
The data report analyses uses the August-July timeframe because these analyses were
conducted earlier than the Program growth analyses. Schools were then divided into four
groups according to data reporting levels: nonreporters, periodic reporters (reported one
or two months), average reporters (reported three to six months), and steady reporters
(reported seven or more months).
Data Reports in 2000-01. The same procedure was used in July 2001 to download
data reports by school for the 2000-01 school year, also to examine whether a school
reported data at all for each month between August 2000 and July 2001. Schools were
divided into the same four data reporting levels as for 1999-2000. The 2000-01 file was
then merged with the file for data reporting in 1999-2000; information on elementary or
secondary designation of schools was included from the GLOBE school database. We
conducted an analysis of the consistency of GLOBE implementation, using the
proportion of reporters in each group from 2000-01 as an index. Persistence in GLOBE
was determined by selecting those schools that had reported data in 1999-2000 and
comparing their 1999-2000 and 2000-01 reporting levels. Chapter 4 presents these
findings for GLOBE schools overall, as well as for schools at different grade levels
(elementary versus secondary). Because many schools’ grade levels are not indicated in
the GLOBE database, the separate analyses by grade level must be viewed with caution.
Of the 1,795 schools that reported data in 1999-2000, 831 (46 %) were missing
grade-level information.
GLOBE Year 5 Teacher Survey Data. The second part of Chapter 4 focuses on
understanding factors associated with variation in program implementation. We merged
the data file we used to analyze consistency and persistence in GLOBE implementation
with the data file of United States teacher survey responses used in the Year 5 evaluation.
This survey includes information about barriers to program implementation, as well as
information about supports teachers accessed after GLOBE training. Data on barriers
2-2

GLOBE Evaluation Year 6 – Chapter 2: Methodology
and supports were analyzed to determine whether there were significant relationships
between specific barriers and supports and levels of data reporting. A Chi-square test
was used to determine whether the schools’ data reporting levels were significantly
influenced by access to a particular posttraining support or were significantly associated
with a particular barrier to implementing GLOBE. We also merged data on the number
of GLOBE teachers at the school and the date when the newest GLOBE teacher at a
school was trained, both of which may be factors affecting data reporting patterns.
Examining Classroom Variation in Implementation: Case Studies
SRI researchers have visited GLOBE schools in the United States each year of the
evaluation to examine more closely the implementation of the Program. Schools have
been selected each year on the basis of key themes of the evaluation. In early years of the
Program, SRI studied GLOBE schools that were most active in terms of data reporting,
ensuring geographic diversity of sites chosen. More recently, case studies focused on
schools with innovative approaches to implementing GLOBE, again considering
geographic diversity. Case studies during Year 6 of the evaluation focused on how
GLOBE teachers’ implementation practices have been influenced by local school
contexts and the standards and accountability movement. SRI visited three schools
where standards and testing for science learning are set by educators from outside the
school and, for comparison, three schools where accountability is at the school level and
requirements from the district or state are few but where standards are set by GLOBE
teachers or by groups of teachers within particular schools.
The GLOBE database was used to identify schools in states where science standards
were in place. We also decided to select schools in two states where science standards
are either currently aligned or are being aligned closely with GLOBE. Recommendations
from GLOBE staff and information on the GLOBE Web site were also used in selection
of the case study sites. Teachers at potential sites were interviewed by telephone, to
screen the sites and to ensure a diversity of school contexts.
At each site visit, researchers followed a protocol outlining preparation for the visit,
instructions for conducting interviews, and follow-up to sites. As part of their
preparation, the team members participated in an introductory training session that
2-3
GLOBE Evaluation Year 6 – Chapter 2: Methodology
provided an overview of the debriefing form and each of the interview protocols.
Researchers reviewed GLOBE data-reporting patterns of the schools they visited and
made their own arrangements to visit sites. While at each site, each GLOBE researcher
was expected to observe least one group of students as they implemented GLOBE,
conduct four interviews, and conduct an open-ended focus group with a group of GLOBE
students. The interviews were to be conducted with at least one classroom teacher
implementing GLOBE at the school, the school’s principal or headmaster, a district
and/or state administrator, and, if possible, a parent or community member.
Researchers were given specific interview protocols to use for each of the interviews
(Appendix A), as well as a common debriefing form (Appendix B) in which to enter
information on a common set of data elements, to permit cross-case comparison of data.
We used prior research from studies of implementation of educational reform (Cohen &
Hill, 1998), the National Science Education Standards and its supporting documents
(National Research Council, 1996, 2000), and the American Federation of Teachers’
Making Standards Matter (1999) to identify categories of data that would be important to
collect in order to study the influence of standards on GLOBE implementation.
Data collection and analysis procedures were consistent with prior case study work
conducted by SRI for GLOBE (see Means et al., 1997, 1999) and with other approaches
to the study of cases in education (see Means & Olson, 1995). All interviews were tape
recorded, and case study researchers were asked to review all tapes and submit the tape
from the teacher interview from their visit for transcription. Those tapes that were not
selected for transcription were not discarded, however; relevant information from these
interviews was entered on the debriefing form. Two researchers then examined each of
the debriefing forms to characterize schools’ implementations along four dimensions:
teachers’ goals for GLOBE, organization of GLOBE activities within the classroom,
involvement of teachers in the standards-setting process, and perceived alignment of
standards and tests with GLOBE. Pairs of schools with similarities on at least two of
these dimensions were identified, in order to identify sets of contrasting cases, designed
to illustrate ways that schools may differ along the four dimensions analyzed by SRI
researchers. The chapter reports themselves present details from the debriefing forms
selected as relevant to the four dimensions under study.
2-4

GLOBE Evaluation Year 6 – Chapter 2: Methodology
Each school was then given the opportunity to review the draft of the case study
chapter for accuracy of how the school’s GLOBE experience was represented.
Permission to use the school and faculty names was obtained at this time, and errors in
the text identified by case study participants were corrected.
Analysis of International GLOBE Program Partners’ Activities
Our presentation of GLOBE activities from around the world is drawn from several
sources. Chief among these are interviews of 14 Country Coordinators conducted in
summer 2001 at the GLOBE Conference in Blaine, Washington, using protocols focused
on GLOBE partnership and school activities. We also drew from reports provided by
Country Coordinators and a review of resources available through the World Wide Web.
Assessment of Student Learning
A major part of SRI’s evaluation activity during 2000-01 was the development and
piloting of an assessment instrument to be used in our evaluation of student learning
outcomes in North Carolina and across the United States. Our assessment development
process involved identifying existing items from previous student assessments,
developing many new items, and pilot-testing the items with a sample of 8th-graders in
North Carolina and with two national samples of 7th- and 8th-graders. The national
sample included both students who had participated in GLOBE activities and students of
teachers who had received GLOBE training but not implemented GLOBE activities.
Researchers from SRI developed measures of student learning of GLOBE Hydrology
concepts and skills that aligned with the 8th-grade science curriculum in North Carolina.
The goal of the instrument development process was to develop items that were sensitive
to GLOBE-based instruction but not biased to the North Carolina context.
Item Development. The instrument included items focused on both inquiry and
Hydrology content. Item content was determined after reviewing state standards in North
Carolina and the GLOBE learning objectives. Item development focused on identifying
the behaviors that would provide evidence that students grasped core environmental
science concepts and scientific inquiry concepts. An initial set of items was pilot-tested
with a subset of North Carolina students in late fall of 2000. Researchers engaged
2-5

GLOBE Evaluation Year 6 – Chapter 2: Methodology
students in think-aloud interviews while they completed the items. Through this
procedure, we eliminated items that contained construct-irrelevant sources of task
difficulty, such as linguistic barriers, problematic wording, unclear figures or graphics,
and other aspects of task presentation. The cognitive interviews also provided
confirmation that the skills and understandings students used in solving the problems
were those targeted by the items.
In addition to test items, SRI developed a teacher survey and a student survey for
administration to participating classrooms (Appendices C and D). The teacher survey
asked about classroom context, the frequency with which teachers engaged in selected
inquiry practices, and implementation of GLOBE protocols and learning activities. The
student survey included questions about topics studied in class, participation in inquiry
activities in science, attitudes toward science, and perceptions of what scientists actually
do.
Sample Selection. GLOBE classes for the initial pilot test in North Carolina were
identified by using the GLOBE database and screening interviews to determine which
not-yet-implementing classrooms planned to implement GLOBE in spring 2001. A total
of nine North Carolina teachers agreed to participate in the pilot. To ensure that items
were sensitive to GLOBE instruction but not biased to the North Carolina context, we
also included two other samples of students in our study. We included in our sample
middle school classrooms that had reported Hydrology data to the GLOBE Data Archive
at a greater than average frequency from September 2000 to February 2001. We also
included GLOBE-trained teachers at the middle school level who had not yet
implemented GLOBE. A total of eight randomly selected GLOBE classrooms and six
randomly selected non-GLOBE classrooms (all outside North Carolina) agreed to
participate in the assessment pilot.
Administration. We administered a pretest to students enrolled in the North
Carolina classrooms participating in the assessment in February 2001. The test was
administered on-line. Teachers were given a 3-week window for their students to
complete the test, which was expected to take one class period or less. Five of the nine
participating classrooms completed the pretest. A posttest was administered to the North
Carolina sample in May 2001. Only two of the five remaining classrooms completed the
2-6

GLOBE Evaluation Year 6 – Chapter 2: Methodology
posttest during the second 3-week window given to teachers to have their students take
the assessment.
We administered the same online assessment once in May 2001 to the national
samples of GLOBE and non-GLOBE classrooms, during the same 3-week window used
for the North Carolina posttest assessment. Students from five of eight GLOBE
classrooms and students from three of six non-GLOBE classrooms completed the
assessment.
Analysis of Results. We examined the data from two vantage points: (1) as
providing evidence for the validity and reliability of our assessment items and (2) as
providing evidence of student learning. We used our national samples to validate our
assessment, rather than the North Carolina sample, because our survey data from the
classrooms indicated that neither of the North Carolina classrooms that completed the
posttest had spent a significant amount of time on GLOBE. Although students studied
many of the concepts covered by GLOBE in North Carolina because they were part of
the mandated state curriculum, few of them used GLOBE to study these concepts.1 We
identified items where GLOBE students from the national sample significantly
outperformed non-GLOBE students. These items will be used in subsequent years with
GLOBE students in North Carolina and nationally to evaluate the effectiveness of
GLOBE in settings where GLOBE concepts are part of the mandated curriculum.
We also conducted analyses to examine results for evidence of student learning in
GLOBE. We conducted an Analysis of Variance (ANOVA) comparing overall student
scores on the assessment across the three samples: GLOBE classrooms, non-GLOBE
classrooms, and North Carolina classrooms. A post-hoc Scheffe test was conducted to
test the significance of between-group differences. Results of these analyses are
presented in Chapter 7.
Discussion
A key theme that runs through all of our analyses and presentation of results is
variation in program implementation. Through separate analyses and from multiple
1 This pattern was not unexpected, since the state standards and emphasis on GLOBE are relatively new in North Carolina. One would expect a clearer test of GLOBE’s influence to emerge from North Carolina assessment data collected in future years, as is planned for Year 7.
2-7

GLOBE Evaluation Year 6 – Chapter 2: Methodology
sources of data, we aim to describe how GLOBE implementation varies from school to
school, as well as the factors that contribute to that variation. We are concerned not only
with teachers’ goals for GLOBE and how those shape implementation, but also with a
range of supports and contextual variables, such as posttraining mentoring and incentives,
“fit” of GLOBE within the school, and teachers’ responses to pressures placed on them to
meet challenging state standards and accountability testing requirements.
2-8

3. Program Growth
The GLOBE Program continues to grow in reach and in numbers. As of September
2001, GLOBE had expanded to include 97 countries. More than 1,800 schools reported
data during 2000-01. Moreover, the total number of teachers trained in GLOBE
continues to grow, and the percentage of schools that report in one school year and again
in the next year is increasing.
Still there are signs that GLOBE Program growth is slowing, compared with previous
years’ data on reporting and teacher training. Fewer new GLOBE teachers were trained
in 2000-01 than in the preceding year, and data-reporting levels have declined slightly
since 1999-2000. In addition, the spring decline in the number of schools that reported
data to the GLOBE Data Archive was steeper than in previous years.
Atmosphere and Hydrology continue to be the investigation areas for which the most
student data are reported. The number of schools reporting data from protocols in both
these investigation areas has remained fairly constant. Soils data reporting increased for
two measurements—Soil Temperature and Soil Characterization—but declined for Soil
Moisture. The number of schools reporting Land Cover declined from the preceding year
when MUC-a-Thons helped boost the number of schools reporting Land Cover data
dramatically compared with the year before.
A logical explanation for the more rapid decline in the numbers of schools reporting
data in April and May 2001 than in previous years is the decline in new teachers trained.
The number of new GLOBE teachers trained declined by more than half; the number of
months between time trained and first data reports also increased significantly in the past
year.
In a separate study undertaken by the GLOBE office, United States partners
suggested that funding continues to be a major concern for them. Partners are spending
more of their limited resources on follow-up and encouraging schools to increase data
reporting rather than on training new teachers (Conroy, 2001). Other factors that help
explain the spring decline in data reporting are normal program attrition and time taken
away from GLOBE by schools’ participation in mandated accountability testing
3-1

GLOBE Evaluation Year 6 – Chapter 3: Program Growth
programs, now being implemented on a much larger scale in districts and states than in
previous years.
In this chapter, we summarize the patterns in the number of schools reporting data,
number of teachers trained, and number of reports of various types of data submitted.
Comparisons are presented for Years 1 (1995-96) through 6 (2000-01) wherever
comparable data are available. We also discuss possible explanations for the spring
decline in data reporting that are also explored in Chapter 4.
Trends in GLOBE Data Reporting
As of the end of August 2001, 4,827 United States and international GLOBE schools
had reported data since the beginning of the Program in April 1995. The pattern in
Figure 3.1 shows a modest decline in 2000-01 in the overall numbers of schools reporting
data from the preceding year.
Figure 3.1 Number of Schools Reporting Data in GLOBE, Years 1-6, by Month
0
200
400
600
800
1000
1200
2000-01 899 1069 1100 959 939 958 964 898 785 598 259
99-2000 916 1091 1156 1070 1075 1115 1115 1058 985 591 311 367
98-99 692 882 972 896 961 1071 1060 967 974 721 323 604
97-98 960 1014 1032 976 1026 1028 1078 1084 1065 720 301 322
96-97 529 735 793 806 857 936 983 1034 1011 652 304 391
95-96 170 308 415 485 543 660 736 763 792 468 210 283
Sep Oct Nov Dec Jan Feb Mar Apr May Jun Jul Aug
Num
ber o
f Sch
ools
Rep
ortin
g
3-2

GLOBE Evaluation Year 6 – Chapter 3: Program Growth
Looking at the Year 6 reporting period as a whole (September 2000 to August 2001),
25% of international schools and 12% of United States schools with GLOBE-trained
teachers reported data, compared with 33% of international schools and 14% of United
States schools during the same period in Year 5. During Year 6, a total of 1,810 schools
(830 international and 980 United States) reported data, compared with 1,810 schools in
Year 5.
The average number of reports provided by each school declined by 28% in 2000-0l
(average of 600 reports in Year 6, compared with 837 reports in Year 5). Most of this
decline is attributable to schools that report data consistently, that is, at least seven
months in any single school year. These schools submitted 25% fewer data reports in
Year 6 than in Year 5.
Retention of GLOBE Schools from Year to Year
It is difficult to measure teacher retention in GLOBE. Many teachers implement
GLOBE activities, including data collection, but do not report data to the GLOBE Web
site. There is no way to distinguish these teachers and their schools within the GLOBE
database from those that have become inactive but failed to so notify the Program office.
Fully realizing that it is just one measure of school involvement, we have analyzed the
number of schools that report data in one year and report again in the next year. This
index of retentionor program persistence, as we refer to it in Chapter 4is lower than
the actual sustained participation rate, but it is an index that can be easily examined over
time to identify trends in school retention.
We examined the GLOBE Data Archive to identify patterns in the rate of retention of
GLOBE schools. We found that in Year 6, the 1-year retention rate (percentage of
schools that reported data in 1999-2000 and again reported data in 2000-01) increased
slightly, compared with the percentage of schools who reported data in 1998-99 and
again in 1999-2000 (Figure 3.2). The 2-year retention rate, measured by the percentage
of schools reporting in one year that report data 2 years later, also increased from 1999-
2000 to 2000-01. As one would expect, the 2-year retention rate is lower than the 1-year
retention rate, but both rates are increasing.
3-3

GLOBE Evaluation Year 6 – Chapter 3: Program Growth
Figure 3.2 Trends in GLOBE School Retention
59.9% 62.4% 63.8%
44.8%43.0%
0%10%20%30%40%50%60%70%80%90%
100%
1998-99 1999-2000 2000-01
School Year
Perc
enta
ge o
f Sch
ools
Rep
ortin
g
1-YearPersistence
2-YearPersistence
A New Trend: Earlier Spring Decline in Reporting Though the number of schools reporting in the fall has been fairly stable, reporting in
2000-01 dropped off significantly in the spring and much earlier than it did in previous
years. A decrease in the reporting of Atmosphere investigation area data accounts for the
majority of this reduction (see Figure 3.3).
3-4

GLOBE Evaluation Year 6 – Chapter 3: Program Growth
Figure 3.3 Number of Schools Reporting Data in GLOBE Year 6, Comparing All
Reports and Selected Investigation Areas, by Month
0
200
400
600
800
1000
1200
All reports 899 1069 1100 959 939 958 964 898 785 598 259
Atmos 815 953 985 872 855 870 867 794 684 503 215
Hydro 177 238 228 198 194 200 209 197 173 144 58
Soil 36 46 45 43 30 34 36 41 43 25 15
Sep Oct Nov Dec Jan Feb Mar Apr May Jun Jul
Num
ber o
f Sch
ools
Rep
ortin
g
The spring decline in reporting appears to be affecting a broad spectrum of schools.
Three years ago (1998-99), a decline in numbers of schools reporting in April/May,
compared with October/November, was limited to those schools that reported only
occasionally (during one or two months per school year). By 2000-01, the spring decline
was not limited to schools that reported data infrequently; schools that reported data more
consistently to the GLOBE Web site (i.e., during seven months or more) were also less
likely to report data during these months. Thus, even schools committed to GLOBE data
reporting were showing some level of decline in data reporting in springtime.
There may be several reasons for the decline in reporting in April and May. Regular
attrition from the Program is one contributor to the decline in data reporting. Second,
fewer teachers were trained in Year 6 than in any previous year of the Program; fewer
new teachers were therefore initiating data collection in the spring. This fact, combined
3-5

GLOBE Evaluation Year 6 – Chapter 3: Program Growth
with the fact that the average lag time between training and first data reporting increased
this year, is another likely cause of the spring decline in reporting. A third reason for the
spring decline in data reporting may be the increasing competition in schools in the
United States with mandated curricula and testing in spring. Interviews at our case study
sites and on the telephone with GLOBE teachers suggest that district and state testing
programs are increasingly requiring teachers to focus more on subjects tested—usually
reading and mathematics in the early grades—as the tests draw nearer. We discuss the
decline in numbers of new teachers trained in the next section and explore the role of
time taken away from mandated curriculum and testing in greater detail in Chapters 4 and
5.
Decline in the Number of New GLOBE Teachers Trained
As of September 1, 2001, 16,371 GLOBE teachers had been trained overall since the
Program launched in 1995, including 12,655 in the United States and 3,706
internationally. Looking at the number of teachers trained from September 2000 through
August 2001 in the United States, we found that 1,390 United States teachers were
trained in Year 6, compared with nearly 3,000 in Year 5 (see Figure 3.4).
3-6

GLOBE Evaluation Year 6 – Chapter 3: Program Growth
Figure 3.4 Number of U.S. Teachers Trained, by Year
1365
1052
1597
1944
2352
2965
1390
0
500
1000
1500
2000
2500
3000
Spr-Sum1995*
1995-96 1996-97 1997-98 1998-99 1999-2000
2000-01
Num
ber o
f U.S
. Tea
cher
s Tr
aine
d
Notes: 1. Bars depict 12-month (September-August) training totals, except as noted in 1995. 2. Teacher training began in spring 1995. A large number of teachers were trained in the
Program’s first 6 months to provide a critical mass of teachers ready to begin the Program in school year 1995-96.
Figure 3.5 similarly shows that the number of teachers trained in GLOBE partner
countries was dramatically lower in Year 6 (N=293) than in Year 5.
3-7

GLOBE Evaluation Year 6 – Chapter 3: Program Growth
Figure 3.5 Number of International Teachers Trained, by Year
1020
499
997897
293
0
200
400
600
800
1000
1200
Pre-fall 97 1997-98 1998-99 1999-2000 2000-2001
Num
ber o
f Int
erna
tiona
l Tea
cher
s Tr
aine
d
A closer look at the data show that there were fewer opportunities for teachers to
receive GLOBE training in 2000-01 than in previous years. Fewer training workshops
were held in Year 6 (180) than has been typical in recent years (237 in Year 5 and 212 in
Year 4). GLOBE partners in both the United States and internationally placed greater
focus in Year 6 on supporting existing GLOBE teachers and encouraging schools to
report data than on training new teachers.
Since GLOBE partners in the United States have now effectively taken over all
GLOBE training, the decline in teacher training is attributable largely to this shift in their
focus.2 With its operational partner model, the GLOBE Program enters into a no-
exchange-of-funds partnership with a university, school district, science center, or other
nonprofit entity interested in providing GLOBE teacher training in its service area. The
partner sends its trainers to a GLOBE train-the-trainer workshop and receives GLOBE
materials for distribution to the teachers it trains. Many partners have difficulty finding
the necessary funds and staffing to both hold training workshops and provide the level of
3-8

GLOBE Evaluation Year 6 – Chapter 3: Program Growth
follow-up support that GLOBE trainees need. According to a study of United States
GLOBE partners in fall 2001 conducted by the GLOBE office (Conroy, 2001), partners
are increasingly attempting to use their limited funds to provide high-quality follow-up to
teachers they have already trained rather than training large numbers of new teachers.
The decline in the number of new teachers trained in early fall 2000 may have begun
to have an impact on data reports by spring of Year 6. Not enough new teachers were
becoming part of GLOBE to offset attrition. In addition, a change in the lag time
between training and first data reporting was observed this year. Typically, there is an
average lag of 3 to 4 months between time of training and first data reporting; in 2000-01,
the percentage of teachers taking 6 months or more to report data to the GLOBE Web site
from the time of their initial GLOBE training jumped to 58%, compared with 39% in the
preceding year.3
These are some of the factors that have contributed to the spring decline in data
reporting. An additional factor—concern over time taken away from mandated curricula
and testing—is examined in greater detail in the next two chapters.
Reporting Patterns for Different Data Types
The overall reporting pattern for Atmosphere data in the fall of Year 6 has remained
quite similar to those of Years 3-5. However, this pattern shows a definite decrease in the
number of schools reporting Atmosphere data in the spring of 2001, continuing a trend
that was barely discernible in Year 5. All Atmosphere measurement types were reported
by 50 to 100 fewer schools during March, April, and May in Year 6 than during to the
same period in Year 5.
The pattern of reporting for Solid Precipitation differs from the patterns for Cloud
Observations, Air Temperature, and Liquid Precipitation measurements. Specifically, the
number of schools reporting Solid Precipitation never reached the levels of the preceding
year and declined more in spring 2001 than the reporting levels of the other Atmosphere
measurement types. The reduction in the numbers of schools reporting Solid
2 Unfortunately, no comparable data on teachers’ interest in training are available to determine whether fewer people are interested in receiving GLOBE training than in years past. 3 This analysis compared lag times between training and data reporting for schools that had only one GLOBE-trained teacher as of 9/18/01. Sample sizes: Year 6, n = 237; Year 5, n = 307.
3-9

GLOBE Evaluation Year 6 – Chapter 3: Program Growth
Precipitation data in February through May of Year 6 ranged from about 100 to 235
fewer than the numbers reporting for the same period in Year 5. Previously, the Web-
based data entry forms required a school submitting Air Temperature data to also submit
Liquid Precipitation and Solid Precipitation data. Thus, many of the Solid Precipitation
data reports were “0”s, and submitted without need of measurement. This requirement
was recently dropped: e-mail submission and the new option to submit data in
spreadsheet format via e-mail do not require completing fields for Solid Precipitation in
order to report other Atmosphere data. The drop in snow measurements could well be
attributable to the fact that the Web data entry system no longer requires that these fields
be completed, especially as the frequency of snow decreases in spring in the Northern
Hemisphere.
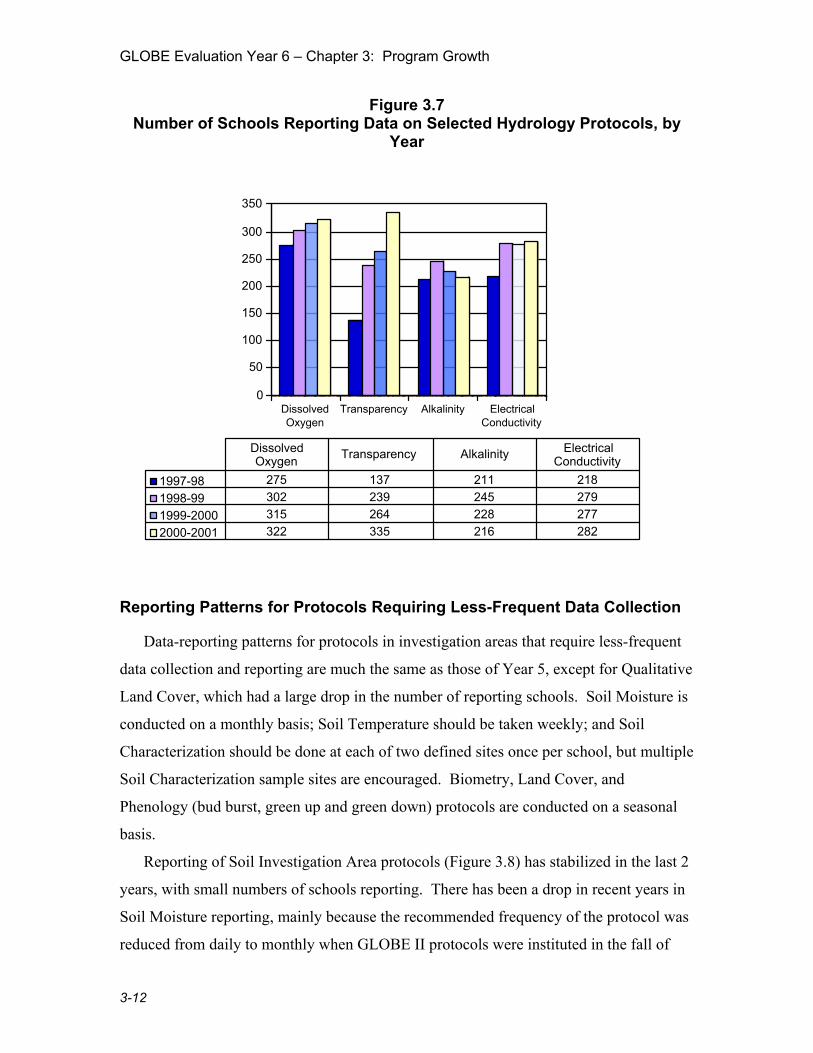
Figure 3.6 shows that the number of schools reporting Hydrology measurements
overall has remained quite consistent with the Year 5 numbers and pattern of reporting.4
As noted in last year’s report, the pattern of reporting has leveled out considerably,
compared with the seasonal peaks and valleys noted in the early years of the Program.
Schools report Hydrology data more consistently throughout the spring, and the data do
not reflect the drop in April and May that is evident in the Year 6 reporting for
Atmosphere protocols. Figure 3.7 shows the numbers of schools reporting selected
Hydrology protocols.
Between 220 and 270 schools reported Hydrology data from October through May
for the last two years, including during the Northern Hemisphere’s winter months when
water sources can be inaccessible because of freezing and inclement weather.
4 Changes in the protocol frequency requirements for Hydrology—from weekly (Years 1 and 2) to monthly (Year 3) to at least monthly but weekly requested if possible (Years 4-6)—have made comparisons across reporting years difficult to interpret.
3-10

GLOBE Evaluation Year 6 – Chapter 3: Program Growth
Figure 3.6 Number of Schools Reporting Hydrology Data, by Month and Year
0
50
100
150
200
250
300
350
Hydrology 2000-01 195 265 254 224 224 230 251 241 231 143 56
Hydrology 99-2000 193 255 264 236 229 245 267 248 235 136 73 75
Hydrology 98-99 154 206 250 190 143 208 206 213 209 169 77 57
Hydrology 97-98 172 247 202 168 176 186 230 229 242 165 86 71
Hydrology 96-97 203 292 293 229 194 203 247 274 286 167 98 106
Hydrology 95-96 59 129 189 189 178 222 234 272 312 193 87 119
Sep Oct Nov Dec Jan Feb Mar Apr May Jun Jul Aug
Since the inception of the Program, 1,538 schools (32%) have reported Hydrology
data out of the 4,827 that have reported any type of GLOBE data. In terms of the larger
population of GLOBE schools with trained teachers (11,106 as of September 1, 2001),
14% have reported Hydrology data. During Year 6, 424 schools (23% of the 1,538
schools who have ever reported Hydrology data) submitted Hydrology data to the
GLOBE Data Archive.
3-11
GLOBE Evaluation Year 6 – Chapter 3: Program Growth
Figure 3.7 Number of Schools Reporting Data on Selected Hydrology Protocols, by
Year
0
50
100
150
200
250
300
350
DissolvedOxygen
Transparency Alkalinity ElectricalConductivity
1997-98 275 137 211 2181998-99 302 239 245 2791999-2000 315 264 228 2772000-2001 322 335 216 282
Dissolved Oxygen Transparency Alkalinity Electrical
Conductivity
Reporting Patterns for Protocols Requiring Less-Frequent Data Collection
Data-reporting patterns for protocols in investigation areas that require less-frequent
data collection and reporting are much the same as those of Year 5, except for Qualitative
Land Cover, which had a large drop in the number of reporting schools. Soil Moisture is
conducted on a monthly basis; Soil Temperature should be taken weekly; and Soil
Characterization should be done at each of two defined sites once per school, but multiple
Soil Characterization sample sites are encouraged. Biometry, Land Cover, and
Phenology (bud burst, green up and green down) protocols are conducted on a seasonal
basis.
Reporting of Soil Investigation Area protocols (Figure 3.8) has stabilized in the last 2
years, with small numbers of schools reporting. There has been a drop in recent years in
Soil Moisture reporting, mainly because the recommended frequency of the protocol was
reduced from daily to monthly when GLOBE II protocols were instituted in the fall of
3-12

GLOBE Evaluation Year 6 – Chapter 3: Program Growth
1997. Some schools have continued to use the Gypsum Block method and send reports
on a daily basis, but as the gypsum blocks wear out, fewer schools are using this method.
The numbers of schools reporting Soil Characterization and Soil Temperature data have
remained very stable.
Figure 3.8 Number of Schools Reporting Selected Soil Protocols, by Year
0
10
20
30
40
50
60
70
80
90
Soil Moisture Soil Temperature SoilCharacterization
1997-98 78 41 36
1998-99 62 81 23
1999-2000 50 83 58
2000-01 41 87 59
Soil Moisture Soil Temperature Soil Characterization
Num
ber o
f Sch
ools
Rep
ortin
g
As shown in Figure 3.9, there was a 60% drop from Year 5 to Year 6 in the number
of schools reporting data for the Land Cover Qualitative protocol, in which students
classify and assign land cover codes according to the Modified UNESCO Classification
(MUC) system. The reduction in data reporting suggests that fewer “MUC-a-Thons”
(during which schools classify as many land cover sites as they can access over a
weekend and conduct ground-truthing satellite data for those sites) were held in Year 6
than in Year 5. These activities have provided useful data to scientists such as Dr.
Russell G. Congalton, Dr. Rosemarie Rowe, and Dr. Mimi Becker. They used GLOBE
3-13

GLOBE Evaluation Year 6 – Chapter 3: Program Growth
data collected during MUC-a-Thons by schools and the community in Dutchess County,
New York, in their recent work assessing the accuracy of a satellite image of the area.
Even though the number of schools reporting qualitative land cover data has dropped,
86% of the schools that report these data continue to classify sites to the more detailed
Levels 3 and 4 of the classification system.
Figure 3.9 Number of Schools Reporting Land Cover Qualitative Data, by Year
64
27
170
312
120
0
50
100
150
200
250
300
350
1996-97 1997-98 1998-99 1999-2000 2000-01
Num
ber o
f Sch
ools
Rep
ortin
g
Reports of quantitative Land Cover/Biometry and Phenology data have been stable
over the last 2 years (Figure 3.10). Compared with some of the other protocols, few
schools report these types of data. Tree Biometry was reported by 100 schools in Year 4
but by fewer than 40 schools in Years 5 and 6. The Year 4 spike may have been
connected with a collaborative project involving a number of schools or a MUC-a-Thon
type of activity. Grass Biomass was reported in Year 6 by about the same number of
schools (fewer than 40) as Tree Biometry, and a few more schools (almost 50) reported
Phenology data.
3-14

GLOBE Evaluation Year 6 – Chapter 3: Program Growth
Figure 3.10 Number of Schools Reporting GLOBE II Quantitative Land Cover/Biometry
and Phenology Data, by Year
0
10
20
30
40
50
60
70
80
90
100
Tree Biometry Grass Biomass Phenology
1997-98 39 67 13
1998-99 100 65 46
1999-2000 38 38 42
2000-01 37 39 49
Tree Biometry Grass Biomass Phenology
Num
ber o
f Sch
ools
Rep
ortin
g
Discussion
Data reporting has been stable for most protocols, but the decline in Atmosphere
reports affects overall totals because this investigation comprises such a large part of
GLOBE data collection activities. The reasons for this decline may be the slower influx
of new schools because fewer teachers were trained in Year 6, the effects of normal
attrition, and less time for teachers to spend on science in the spring—probably because
of the pressures of mandated curriculum content and testing. The Program also faces the
challenge of trying to sustain the interest of current teachers and of recruiting new ones.
Sustaining teachers in the Program was a major focus of many United States and
international partners’ efforts in the past year.
3-15

GLOBE Evaluation Year 6 – Chapter 3: Program Growth
Teacher training has slowed both in the United States and abroad, reflecting a reduced
level of resources available for training, a shift in focus among GLOBE partners, and
perhaps some challenges in the recruitment of teachers. Partner surveys will be fielded in
Year 7 to gain additional insight into the challenges that United States and international
partners are facing in providing training and support.
3-16
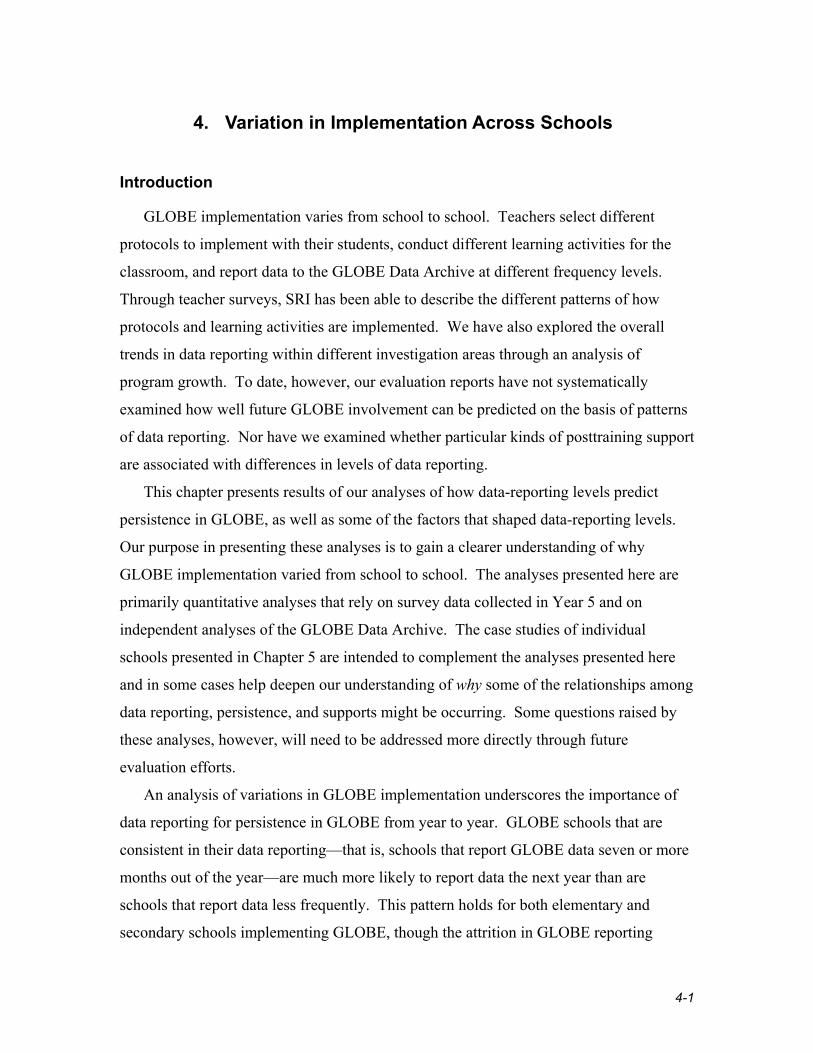
4. Variation in Implementation Across Schools
Introduction
GLOBE implementation varies from school to school. Teachers select different
protocols to implement with their students, conduct different learning activities for the
classroom, and report data to the GLOBE Data Archive at different frequency levels.
Through teacher surveys, SRI has been able to describe the different patterns of how
protocols and learning activities are implemented. We have also explored the overall
trends in data reporting within different investigation areas through an analysis of
program growth. To date, however, our evaluation reports have not systematically
examined how well future GLOBE involvement can be predicted on the basis of patterns
of data reporting. Nor have we examined whether particular kinds of posttraining support
are associated with differences in levels of data reporting.
This chapter presents results of our analyses of how data-reporting levels predict
persistence in GLOBE, as well as some of the factors that shaped data-reporting levels.
Our purpose in presenting these analyses is to gain a clearer understanding of why
GLOBE implementation varied from school to school. The analyses presented here are
primarily quantitative analyses that rely on survey data collected in Year 5 and on
independent analyses of the GLOBE Data Archive. The case studies of individual
schools presented in Chapter 5 are intended to complement the analyses presented here
and in some cases help deepen our understanding of why some of the relationships among
data reporting, persistence, and supports might be occurring. Some questions raised by
these analyses, however, will need to be addressed more directly through future
evaluation efforts.
An analysis of variations in GLOBE implementation underscores the importance of
data reporting for persistence in GLOBE from year to year. GLOBE schools that are
consistent in their data reporting—that is, schools that report GLOBE data seven or more
months out of the year—are much more likely to report data the next year than are
schools that report data less frequently. This pattern holds for both elementary and
secondary schools implementing GLOBE, though the attrition in GLOBE reporting
4-1

GLOBE Evaluation Year 6 – Chapter 4: Variation in Implementation Across Schools
among more “periodic” reporters (schools reporting data during one or two months of the
year) at the secondary level is less dramatic than at the elementary level.
An analysis of posttraining teacher support suggests that the most valuable resources
to teachers are on-site mentoring and provision of materials and other incentives to make
GLOBE data reporting easier. Teachers who accessed these supports from United States
or international partners or elsewhere were much more likely to report data and to report
data at higher levels than those who did not. The provision of supports has effects that
are limited, however: none of the supports teachers said they used in 1999-2000 were
associated with higher data reporting in 2000-01.
There are four factors in addition to posttraining supports that help predict
consistency of data reporting:
• The alignment of GLOBE with teachers’ curricular goals affects reporting; when teachers see GLOBE as aligned with the learning goals they have for their students, they tend to report data more consistently.
• Finding time to submit data is a problem for many GLOBE teachers, and for some, it is the reason most likely to prevent them from submitting data already collected.
• For some teachers, the belief that the value of GLOBE lies in taking data, rather than reporting it, is a factor in inconsistent data reporting.
• Teachers continue to report that difficulties with Internet connectivity contribute to not reporting data consistently, despite the improvements in access to technology at schools across the United States.
Consistency and Persistence in GLOBE Implementation
Many schools collect and report GLOBE data throughout the school year and also
through the summer school closing, as originally intended by GLOBE planners. An
analysis of the GLOBE Data Archive, however, shows that many schools report data
much less consistently than intended and that some schools do not report data at all.
Results from previous years’ teacher surveys and a telephone survey conducted with a
sample of GLOBE teachers in spring 2001 suggest that teachers often collect GLOBE
data that they do not report. This finding would indicate that reporting is just one index
4-2

GLOBE Evaluation Year 6 – Chapter 4: Variation in Implementation Across Schools
of GLOBE implementation. Why, then, investigate GLOBE data reporting as a way to
understand how and why GLOBE implementation varies?
One reason to investigate data-reporting patterns is that data reporting is an essential
part of GLOBE. Learning how to collect and report data forms the largest part of every
GLOBE teacher’s training (Means et al., 1999). Scientists need student data to conduct
their investigations, fulfilling GLOBE’s mission as a science program. Understanding
patterns in reporting, then, is an important indicator of whether teachers and students are
working with GLOBE to meet the science goals.
A second reason to investigate reporting of data as an index of implementation is that
the GLOBE Data Archive provides a window into how GLOBE implementation changes
over time. SRI’s teacher surveys are administered on an annual or biennial basis, but
data are collected throughout the school year and can be compared across years. Using
data reporting as an indicator, we can investigate consistency in GLOBE implementation
in any given year, as well as persistence in GLOBE implementation from year to year.
We have defined two terms that are used throughout this chapter to evaluate
consistency of data reporting. We refer to schools that report one or two months in any
given year as periodic reporters.5 We refer to schools that report seven or more months
out of the year as steady reporters. We also present analyses of schools that fall in the
middle, that is, schools that report data during three to six months out of the year, but
many of the contrasts we draw focus on the implications of schools’ being periodic
versus steady reporters.
To evaluate persistence in data reporting, we analyzed data reporting patterns in
2000-01 from schools that had reported data at least once in 1999-2000. Although we
recognize that many schools may “skip” a year of data reporting, we wanted to have
some reliable index connected to our teacher survey data from Year 5 to better
understand the factors associated with persistence in GLOBE over time.
5 Periodic reporters are distinguished from nonreporting schools, which are registered as GLOBE
schools but do not report data in a particular year.
4-3

GLOBE Evaluation Year 6 – Chapter 4: Variation in Implementation Across Schools
Periodic versus Steady Data-Reporting Schools in GLOBE
Many more of the schools that report GLOBE data are steady reporters than periodic
reporters. In fact, among schools that reported in 2000-01 there were almost twice as
many steady reporters (684) as periodic reporters (377), as shown in Figure 4.1.
Figure 4.1 Number of Steady and Periodic GLOBE Data Reporters in 2000-01*
1592
684
377
0
200
400
600
800
1000
1200
1400
1600
1800
All Reporters Steady Reporters Periodic Reporters
Num
ber o
f Sch
ools
* Includes schools that reported from August to July.
Many more elementary schools than secondary schools are steady reporters, but
reporting does not vary systematically by school level. In other words, it does not appear
that elementary schools are more likely than secondary schools to be steady reporters.
Persistence in GLOBE Data Reporting
In Year 2, SRI examined persistence in data reporting from the first to second year of
GLOBE. During that period, 68% of all GLOBE schools that had reported data in 1995-
96 reported again in 1996-97. The percentage of schools that currently persist in
reporting data from one year to the next is similar. As Figure 4.2 shows, about 64% of
4-4

GLOBE Evaluation Year 6 – Chapter 4: Variation in Implementation Across Schools
schools that reported data in 1999-2000 also reported in 2000-01. Figure 4.2 also shows
that the proportion of nonreporters has not changed substantially since the beginning of
GLOBE.
Figure 4.2 Persistence in GLOBE Data Reporting from 1995-96 to 1996-97 and 1999-
2000 to 2000-2001
68%
32%
64%
36%
0
10
20
30
40
50
60
70
80
90
100
Persistent Reporters Nonreporters
Perc
ent o
f Sch
ools
Data Reporting in 1996-97
Data Reporting in 2000-01
As with steady data reporting, it does not appear that elementary and secondary schools
differ with respect to the likelihood that they will persist from year to year in reporting
data.
The Relationship between Data-Reporting Levels and Persistence
A closer examination of the GLOBE Data Archive shows that data reporting and
persistence are closely related. Schools that are steady reporters in one year are more
than twice as likely as periodic reporters to report data the next year. More than four-
fifths (84%) of the schools that were steady reporters in 1999-2000 reported data in 2000-
01, compared with just two-fifths (40%) of periodic reporters (Figure 4.3).
4-5
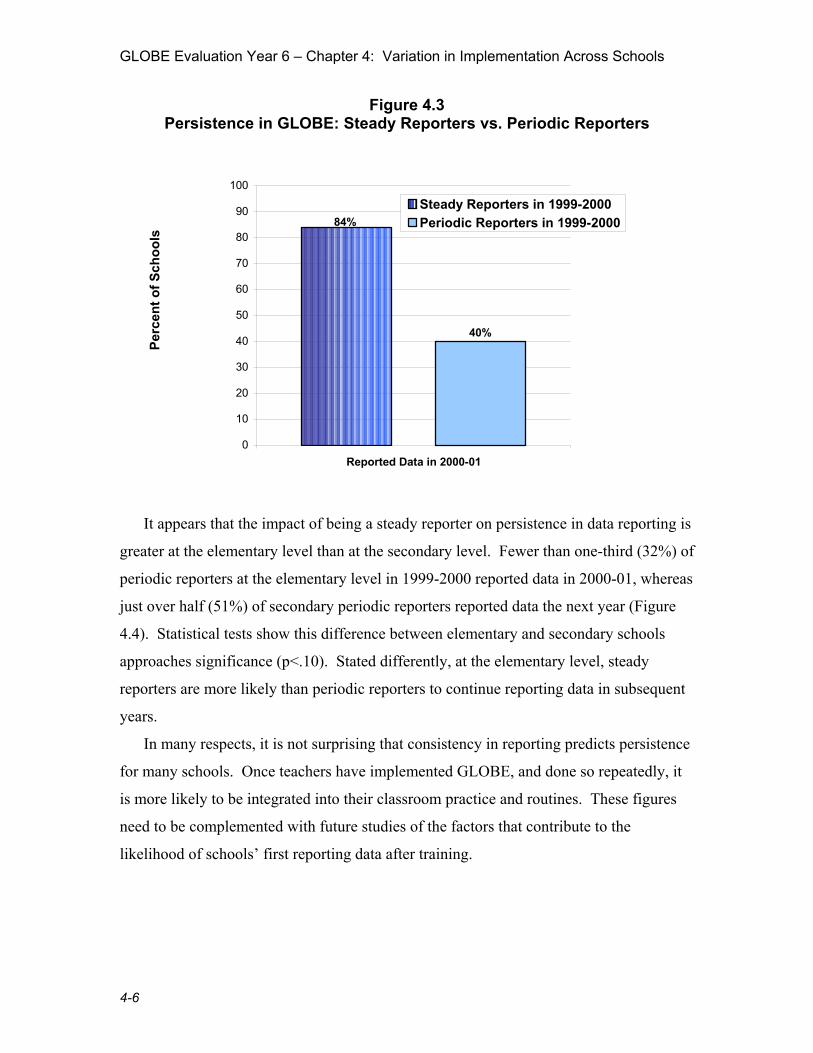
GLOBE Evaluation Year 6 – Chapter 4: Variation in Implementation Across Schools
Figure 4.3 Persistence in GLOBE: Steady Reporters vs. Periodic Reporters
84%
40%
0
10
20
30
40
50
60
70
80
90
100
Reported Data in 2000-01
Steady Reporters in 1999-2000Periodic Reporters in 1999-2000
Perc
ent o
f Sch
ools
It appears that the impact of being a steady reporter on persistence in data reporting is
greater at the elementary level than at the secondary level. Fewer than one-third (32%) of
periodic reporters at the elementary level in 1999-2000 reported data in 2000-01, whereas
just over half (51%) of secondary periodic reporters reported data the next year (Figure
4.4). Statistical tests show this difference between elementary and secondary schools
approaches significance (p<.10). Stated differently, at the elementary level, steady
reporters are more likely than periodic reporters to continue reporting data in subsequent
years.
In many respects, it is not surprising that consistency in reporting predicts persistence
for many schools. Once teachers have implemented GLOBE, and done so repeatedly, it
is more likely to be integrated into their classroom practice and routines. These figures
need to be complemented with future studies of the factors that contribute to the
likelihood of schools’ first reporting data after training.
4-6

GLOBE Evaluation Year 6 – Chapter 4: Variation in Implementation Across Schools
Figure 4.4 Persistence in GLOBE Data Reporting, by School Level
85%
32%
51%
87%
0
10
20
30
40
50
60
70
80
90
100
Steady Reporters in 1999-2000that Reported Data in 2000-01
Periodic Reporters in1999-2000 that Reported
Data in 2000-01
Perc
ent o
f Sch
ools
ElementarySecondary
Impact of Posttraining Supports on GLOBE Data Reporting
Many GLOBE partners offer additional resources to teachers following their initial
training sessions. These resources are intended to support teachers’ efforts to implement
GLOBE protocols and report data. They include the following:
• Communications through such methods as listservs, newsletters, meetings and conferences, and contact with GLOBE partner staff or other GLOBE teachers via telephone or e-mail.
• Mentoring during school visits by GLOBE partner staff or experienced GLOBE teachers.
• Supplementary materials, such as tips for implementation.
• Follow-up or refresher training sessions.
4-7
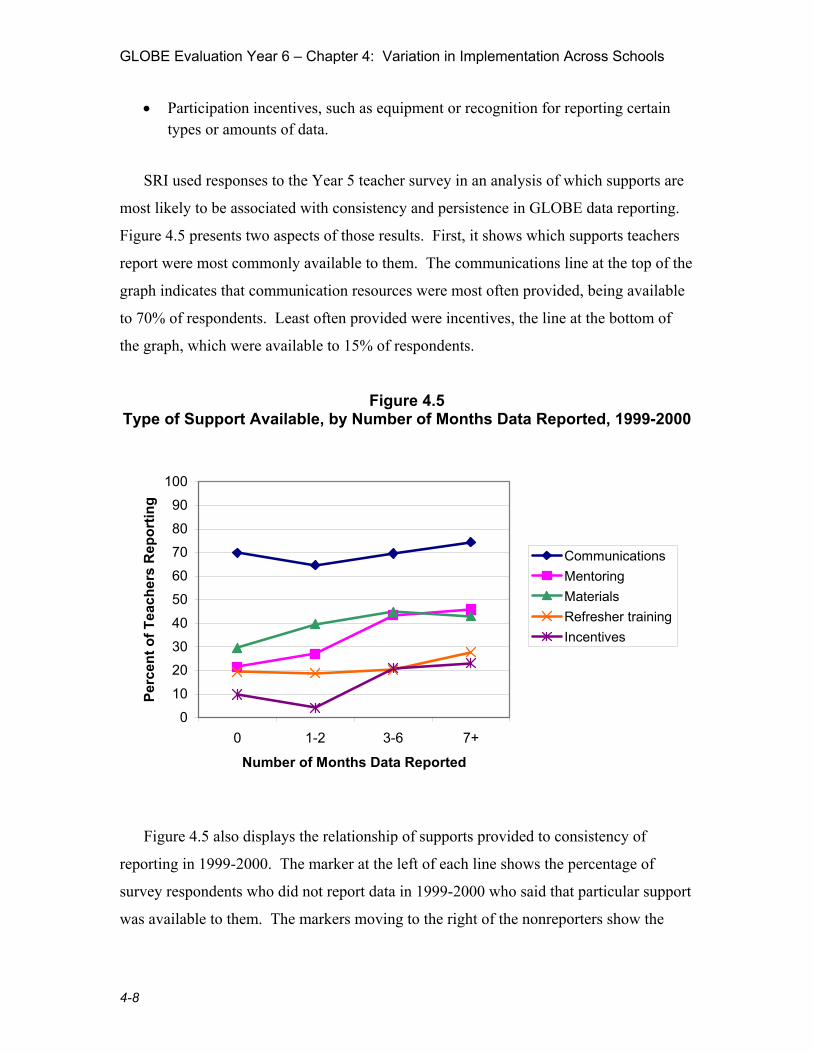
GLOBE Evaluation Year 6 – Chapter 4: Variation in Implementation Across Schools
• Participation incentives, such as equipment or recognition for reporting certain types or amounts of data.
SRI used responses to the Year 5 teacher survey in an analysis of which supports are
most likely to be associated with consistency and persistence in GLOBE data reporting.
Figure 4.5 presents two aspects of those results. First, it shows which supports teachers
report were most commonly available to them. The communications line at the top of the
graph indicates that communication resources were most often provided, being available
to 70% of respondents. Least often provided were incentives, the line at the bottom of
the graph, which were available to 15% of respondents.
Figure 4.5 Type of Support Available, by Number of Months Data Reported, 1999-2000
0102030405060708090
100
0 1-2 3-6 7+
Number of Months Data Reported
Perc
ent o
f Tea
cher
s R
epor
ting
CommunicationsMentoringMaterialsRefresher trainingIncentives
Figure 4.5 also displays the relationship of supports provided to consistency of
reporting in 1999-2000. The marker at the left of each line shows the percentage of
survey respondents who did not report data in 1999-2000 who said that particular support
was available to them. The markers moving to the right of the nonreporters show the
4-8

GLOBE Evaluation Year 6 – Chapter 4: Variation in Implementation Across Schools
availability of the same supports to respondents who reported data for either one or two
months, three to six months, or seven or more months.
From this figure, we can infer which kinds of support were most important in
predicting consistency in data reporting and which ones did not appear to make a
difference. The difference between those who did not report data (nonreporters) and
those who reported data for seven or more months (steady reporters) indicates which
supports are likely to contribute to consistent data reporting. Availability of mentoring,
materials, and incentives (including equipment) were statistically significantly associated
with data-reporting levels. Of the respondents for whom mentoring support was
available, fewer than a quarter (22%) were nonreporters, and almost half (46%) were
steady reporters. Similarly, of those for whom supplementary materials were available,
30% were nonreporters, compared with 43% who were steady reporters. When
incentives were available, 10% of respondents still did not report data, whereas 23% were
steady reporters.6
Barriers to Data Reporting
Forty GLOBE teachers participated in a telephone survey in spring 2001. They were
asked about their reasons for implementing GLOBE and about the impact of standards
and testing on that implementation. Data-reporting patterns identified two sample
groups, one consisting of 20 periodic reporters and a second consisting of 20 steady
reporters. During the telephone interviews, however, most teachers classified as periodic
reporters said that they had, in fact, collected GLOBE data year-round but were unable to
submit all the data collected to the GLOBE Data Archive. We decided to investigate
more deeply the impact of various barriers to data reporting to identify which are most
likely to decrease the number of steady reporters. Teacher survey data from Year 5
contained reasons GLOBE teachers cited for not reporting data.
An analysis of the Year 5 teacher survey data7 indicated that both nonreporters and
steady reporters encounter the same barriers to reporting, but that some barriers have a
much greater impact on nonreporters. One barrier identified by more than three-quarters
6 Each of these differences was statistically significant at p<.05. 7 Data from 1999-2000, the year of the full teacher survey, are presented in this section. Data from 2000-01, the year of the telephone mini-survey, mirror those results.
4-9

GLOBE Evaluation Year 6 – Chapter 4: Variation in Implementation Across Schools
of teachers from non-reporting schools is the difficulty teachers face in integrating
GLOBE into their curricula (Figure 4.6). Fewer than half of steady reporters (48%)
considered this a major barrier, compared with more than three-quarters of nonreporters
(77%).
Figure 4.6 Difficulty with Curriculum Integration, by Reporting Type
23
52
77
48
0.0
25.0
50.0
75.0
100.0
Nonreporters Steady Reporters
Perc
ent o
f Tea
cher
s R
epor
ting
Is not a barrierIs a barrier
Another commonly experienced barrier to reporting data is the difficulty teachers face
in finding time to report data (Figure 4.7). Almost three-quarters of nonreporters (71%)
said they had failed to report data because of competing demands on their time, compared
with about half of the steady reporters (51%).
4-10

GLOBE Evaluation Year 6 – Chapter 4: Variation in Implementation Across Schools
Figure 4.7 Difficulty Finding Time to Report Data, by Reporting Type
29
49
71
51
0.0
25.0
50.0
75.0
100.0
Nonreporters Steady Reporters
Perc
ent o
f Tea
cher
s R
epor
ting
Is not a barrierIs a barrier
One of the reasons teachers implement GLOBE is to teach students to take
measurements accurately. For some teachers, this goal may influence their view of the
value of reporting data. Some teachers believe that the value for their students lies in
taking GLOBE measurements, not in reporting them. This belief again had more impact
on nonreporters than on steady reporters (Figure 4.8). Three-quarters of nonreporters
cited this as a reason for not reporting data, compared with somewhat more than half of
the steady reporters (56%).
4-11
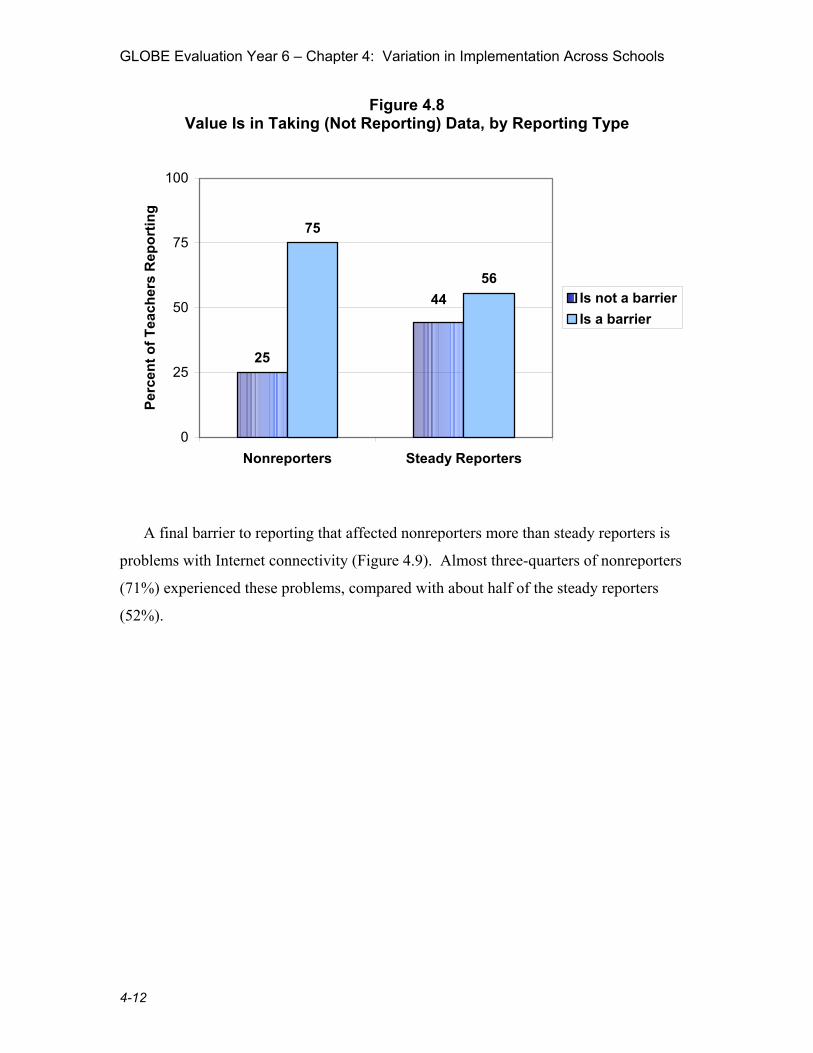
GLOBE Evaluation Year 6 – Chapter 4: Variation in Implementation Across Schools
Figure 4.8 Value Is in Taking (Not Reporting) Data, by Reporting Type
25
75
5644
0
25
50
75
100
Nonreporters Steady Reporters
Perc
ent o
f Tea
cher
s R
epor
ting
Is not a barrierIs a barrier
A final barrier to reporting that affected nonreporters more than steady reporters is
problems with Internet connectivity (Figure 4.9). Almost three-quarters of nonreporters
(71%) experienced these problems, compared with about half of the steady reporters
(52%).
4-12

GLOBE Evaluation Year 6 – Chapter 4: Variation in Implementation Across Schools
Figure 4.9 Difficulty with Internet Connectivity, by Reporting Type
29
48 52
71
0.0
25.0
50.0
75.0
100.0
Nonreporters Steady Reporters
Perc
ent o
f Tea
cher
s R
epor
ting
Is not a barrierIs a barrier
Figure 4.10 illustrates the overall percentage differences between nonreporters and
steady reporters for all barriers. Each bar on the graph displays how much more impact
the barrier had on nonreporters than on steady reporters. The display allows us to see the
relative rankings of particular barriers on consistency of data reporting.
4-13
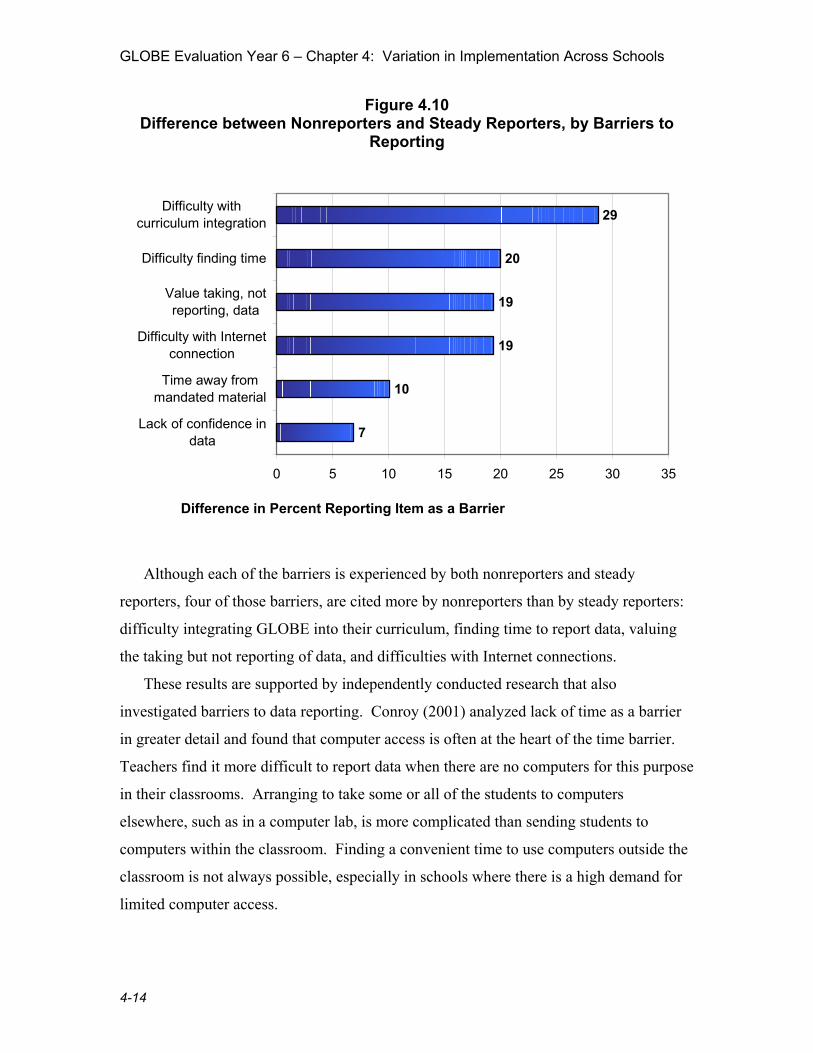
GLOBE Evaluation Year 6 – Chapter 4: Variation in Implementation Across Schools
Figure 4.10 Difference between Nonreporters and Steady Reporters, by Barriers to
Reporting
7
10
19
19
20
29
0 5 10 15 20 25 30 35
Lack of confidence indata
Time away frommandated material
Difficulty with Internetconnection
Value taking, notreporting, data
Difficulty finding time
Difficulty withcurriculum integration
Difference in Percent Reporting Item as a Barrier
Although each of the barriers is experienced by both nonreporters and steady
reporters, four of those barriers, are cited more by nonreporters than by steady reporters:
difficulty integrating GLOBE into their curriculum, finding time to report data, valuing
the taking but not reporting of data, and difficulties with Internet connections.
These results are supported by independently conducted research that also
investigated barriers to data reporting. Conroy (2001) analyzed lack of time as a barrier
in greater detail and found that computer access is often at the heart of the time barrier.
Teachers find it more difficult to report data when there are no computers for this purpose
in their classrooms. Arranging to take some or all of the students to computers
elsewhere, such as in a computer lab, is more complicated than sending students to
computers within the classroom. Finding a convenient time to use computers outside the
classroom is not always possible, especially in schools where there is a high demand for
limited computer access.
4-14

GLOBE Evaluation Year 6 – Chapter 4: Variation in Implementation Across Schools
Conroy also found that submitting data is not always valued as highly as data
collection. Some teachers said that students find submitting data repetitive. Given that
data reporting is also seen as time-consuming, teachers find that they allow the level of
student interest to influence the consistency of data reporting. Others said that collecting
data for scientists is not necessarily a motivating aspect of the Program for teachers.
These results support SRI’s findings and suggest areas to target in efforts to increase data
reporting.
Discussion
One important finding from these data is that many schools do report data
consistently. Nearly half of all schools that reported GLOBE data in Year 6 were steady
reporters, submitting data during at least seven months from August 2000 through July
2001. Consistent student data reporting contributes to GLOBE’s accomplishing its
educational and scientific mission of involving students in observing the environment in
ways that can contribute to the advancement of science.
The analyses performed with data from the teacher survey and the GLOBE Data
Archive also underscore the significance of consistency in data reporting for persistence
in GLOBE. Schools that report consistently in one year are twice as likely to report data
again the next year. Interestingly, this pattern is more pronounced for elementary schools
than for secondary schools, although we have no additional data from our own evaluation
to explain this phenomenon adequately. An analysis of the GLOBE Data Archive does
not tell us why steady reporting seems to be less important to consistency at the
secondary level, but differences between elementary and secondary curricula offer one
possible explanation. Secondary teachers tend to be more tightly bound than elementary
teachers by mandated curricula and by syllabi worked out well in advance. Secondary
teachers may see GLOBE as an opportunity to illustrate a concept or deepen students’
understanding of a particular scientific process more than as an opportunity to teach
responsibility. Therefore, secondary schools’ “inconsistent” reporting of data may mask
a consistency in teachers’ using GLOBE to support particular topics each year in their
curriculum.
4-15

GLOBE Evaluation Year 6 – Chapter 4: Variation in Implementation Across Schools
The analyses examining the relationship between data reporting and posttraining
supports point to the central importance of mentoring and material support to teachers.
Interestingly, some of the more commonly available supports to teachers after training,
such as listservs and newsletters, do not appear to affect whether schools report data or
not. By contrast, direct mentoring during a visit from a GLOBE partner staff person or
experienced GLOBE teacher, as well as incentives and equipment provided to teachers,
have a significant positive effect on data reporting. In most cases, these supports are less
frequently available than are ongoing communications with trainers and other GLOBE
teachers.
Teachers’ own goals for students, along with their local and state school contexts,
also affect data reporting patterns. When teachers perceive GLOBE to be well aligned
with their own curricular goals and when data reporting is one of those goals, schools are
more likely to report data. Technical and time barriers at schools are also important
factors, according to our analyses, as is the teacher’s belief in the importance of reporting
data.
In the next chapter, we examine this latter set of factors associated with teachers’
goals and teaching contexts. Although the data from our teacher survey do not show it
directly, at least part of what contributes to a teacher’s sense of GLOBE’s fit within the
curriculum is GLOBE’s match with state standards and state accountability programs.
Individual teachers and schools vary widely on this dimension, and understanding the
variation is important to unpacking the effect on implementation of “curricular
alignment.”
4-16

5. Variation in Implementation in Case Study Schools
Introduction
Teachers’ decisions to implement science education programs like GLOBE are often
complex. Excitement and enthusiasm for a program’s goals and activities, as well as
teachers’ judgments about how their students will respond, are certainly important
factors. Preparation offered through the type of training GLOBE teachers must undergo
is also important. As the analyses in previous chapters suggest, however, neither
excitement nor readiness predicts program implementation. Follow-up supports like
mentoring, as well as monetary and equipment incentives, are important. So, too, is the
perceived “fit” of the Program within a teacher’s curriculum.
Perceived fit or curricular alignment is itself multifaceted. It refers to how well a
program fits in with goals established by an individual teacher for student learning, but it
also refers to alignment with district and state goals for learning, often expressed in terms
of content or performance standards. From interviews with teachers and students who are
active in GLOBE, we have learned that curricular alignment also involves understanding
how well aligned GLOBE is with pressures that schools face to improve test scores on
mandated assessments.
Not all GLOBE teachers face the same pressures, adopt the same curricula, or share
the same goals for student learning in GLOBE. Understanding the variation in teachers’
own choices of how they implement GLOBE, as well as in the local contexts that shape
their choices, was an important goal of this year’s case study site visits by SRI
researchers. In our data collection, we paid particularly close attention to the impact of
standards and testing on implementation of the GLOBE Program. We sought to illustrate
the ways in which standards and testing influence GLOBE implementation and how
school context variables can modify their impact.
To accomplish our goals for the case studies, we selected schools for geographic
diversity, size of community, and grade level. In addition, we looked for schools in states
where science standards are closely aligned with GLOBE goals and activities. Structured
telephone screening interviews with potential case study sites resulted in selection of six
5-1

GLOBE Evaluation Year 6 – Chapter 5: Variation in Implementation in Schools
schools in six states. A visit to each school included observation of students engaged in
GLOBE activities, but the main source of data collection was interviews. Using
semi-structured interview protocols, we interviewed teachers at the schools visited and, in
some cases, teachers from other schools in their districts, as well as school-, district-, and
state-level administrators, as applicable.
The six sites visited can be organized into pairs of schools with similar overall
characteristics. Two of the schools are public elementary schools implementing a broad
array of GLOBE protocols. Two are parochial schools implementing GLOBE. Two are
public schools that have a specialized focus on environmental studies. These three pairs
of schools, operating in three different contexts, illustrate the diversity of ways that
standards can affect GLOBE Program implementation. The first pair, Downtown
Elementary School (NC) and West Elementary (OH), illustrates how GLOBE is
implemented in the context of meeting challenging state standards for science with high-
stakes accountability testing. The second pair, Most Pure Heart of Mary School (AL) and
Cabrini High School (LA), illustrates GLOBE implementation in school contexts with
high internally developed expectations for learning but comparatively little external
accountability for standards and testing. The third pair, Cedar Grove Middle School
(GA) and Dutchess Academy of Environmental Studies (NY), illustrates how GLOBE is
used as a central component to support the goals of an environmental science program.
Table 5.1 describes the schools visited during the Year 6 evaluation.
5-2

GLOBE Evaluation Year 6 – Chapter 5: Variation in Implementation in Schools
Table 5.1 Summary of Case Study Schools
School Name Grade Levels Location Description GLOBE Protocols
Implemented Downtown Elementary School
K-5 Winston-Salem, NC
Small urban school; no grades are given; parents must contribute volunteer hours
Atmosphere Hydrology Soil
West Elementary School
K-5 East Rochester, OH
Small rural school in farming community
Atmosphere Hydrology Land Cover/Biology
Most Pure Heart of Mary School
K-8 Mobile, AL Small urban Catholic school
Atmosphere Hydrology
Cabrini High School
8-12 New Orleans, LA
Small urban Catholic girls’ prep school; reserves 25% of admission for academically challenged students
Atmosphere Hydrology Soil
Cedar Grove Middle School
6-8 Decatur, GA Environmental science elective; environmentally themed
Atmosphere Hydrology
Dutchess Academy of Environmental Studies
11-12 Poughkeepsie, NY
Occupational education elective program
Atmosphere Hydrology Soil Land Cover/Biology
An Urban School and a Rural School with Close Ties to Their Communities
Downtown Elementary is a small elementary school founded 10 years ago as a
magnet school for students whose parents work in downtown Winston-Salem, North
Carolina. The school was designed as an “open school,” with classrooms separated only
by office dividers; instruction was to be innovative—focused on extended student
projects with strong real-world connections for kids. As a requirement for admission,
parents must work within a 1-mile radius of the downtown area, where the school is
located. Parents are also required to volunteer regularly in the school, so parent
involvement traditionally has been high.
5-3

GLOBE Evaluation Year 6 – Chapter 5: Variation in Implementation in Schools
West Elementary is a rural school in Ohio, 80 miles south of Cleveland. It is in a
region of dairy farms and orchards where concern for the region’s farming economy
overlaps with concern for the environment. There is a sense of shared responsibility
within the school—in programs like GLOBE everyone “pitches in” to make things
happen. For example, the school’s custodian has contributed personal time to maintain
the GLOBE weather station and has collected GLOBE data during school breaks. The
principal at West is proud of the school’s improvement in scores on state tests in recent
years and of the letter of recognition sent by the state to acknowledge the achievement.
GLOBE at Downtown and West Schools Teacher John Cardarelli introduced GLOBE to Downtown Elementary School in
Winston-Salem, North Carolina, in the 2000-01 school year. He learned about the
Program at the North Carolina Center for the Advancement of Teaching, decided to be
trained, and obtained a grant from the North Carolina John Muir Foundation to buy
equipment. He also hoped that other teachers at Downtown would join him, but to date,
no other teachers have been trained.
He teaches a 4th/5th-grade class and involves his 5th-grade students in Atmosphere,
Hydrology, and Soil protocols. A nearby park serves as the Atmosphere site and is
visited daily. Students take Hydrology measurements at Salem Creek about 10 miles
from the school. Cardarelli drives two students there weekly to take measurements for
GLOBE. Cardarelli said that the students really enjoy returning to the same spot to
measure water quality. “It becomes their creek,” he says. Students love to go, and they
have integrated their Hydrology protocol measurements with a local Stream Watch
program, with which Cardarelli’s classes have been involved for more than 5 years.
Cardarelli adapts the implementation of GLOBE protocols to meet the developmental
needs of his particular students. Cardarelli demonstrates the Soil protocols, rather than
having students perform them on their own. He has gone through all the Soil
measurements, and students participate by observation as Cardarelli demonstrates them to
the whole class. He notes,
I think a lot of the concepts of GLOBE are beyond them, but they can get a rudimentary understanding of some of the water and some of the soil measurements. I’ve just tried to simplify the language when I talked about doing
5-4

GLOBE Evaluation Year 6 – Chapter 5: Variation in Implementation in Schools
what we’re doing. And I also let them read the protocols, and we would follow that in class.
Cardarelli would like to engage students in using the data they collect to conduct
analyses, but he says as 5th-graders they have not yet reached the needed level of
intellectual curiosity. Nonetheless, his students said they enjoy the way Cardarelli
teaches science, with lots of hands-on experiments and work outdoors. Cardarelli wants
students to understand that science is active inquiry, and perhaps feels he has influenced a
few of his students to consider science as a profession. His principal has observed that
Cardarelli’s existing interest in science has developed into a passion for it, a development
that she attributes to GLOBE.
West Elementary School in East Rochester, Ohio, has a longer history with GLOBE.
Two teachers from the area attended GLOBE training in 1995, including West’s Karen
Schonauer. District support of the Program progressed to county involvement when the
Stark County Educational Service Center became a GLOBE partner in 1998, sponsoring
the two original teachers and three others in becoming GLOBE trainers. The Center has
continued to support GLOBE teachers in the county with initial training tailored to local
needs, follow-up sessions, on-site support, and a Web site
(http://www.stark.k12.oh.us/globe/).
Like John Cardarelli, Schonauer is currently the only GLOBE teacher at her school.
Her GLOBE activities with students have varied from year to year, depending on the
students’ interests and capabilities. When we visited, GLOBE was implemented as a
voluntary activity with five elementary students participating in daily Atmosphere
protocols, weekly Hydrology protocols, and semiannual Biometry protocols. Schonauer
has also had her students communicate with other schools, communicate with GLOBE
scientists, compare data with similar schools, and train 3rd-grade students to do GLOBE
Atmosphere protocols. Schonauer has participated in the summer Teacher at Sea
program sponsored by NOAA and the United States Department of Commerce, using the
data from that training with her students.
Although both of these schools are active GLOBE schools, the teacher at West is
focused more on the fact that GLOBE data contribute to science. Karen Schonauer’s
students live in a rural community where water and soil monitoring are important to
farming. West’s former principal, Michael Daulbaugh, would like to see GLOBE
5-5

GLOBE Evaluation Year 6 – Chapter 5: Variation in Implementation in Schools
students collect water quality data around a recently built power plant. A county soil
scientist is planning to work with local high school GLOBE teachers to set up a team to
collect soil data for the district at sites from which he needs data. He will then share the
results with the kids, helping them understand how their data contributed to soil mapping,
land use proposals, and the discourse around a local landfill controversy.
The GLOBE Program at Downtown Elementary is focused more on realizing the
benefits of students’ participation in the inquiry process for its own sake. GLOBE
teacher John Cardarelli is also less sure of how GLOBE data are actually used by
scientists:
I’m not sure I understand how many uses scientists are getting from it [GLOBE data]. That’s another thing, and I feel like it’s partly they’re not getting it from me and I’m not getting it from GLOBE in terms of how this data is being used.
Still, Cardarelli’s approach emphasizes “doing science” in ways consistent with the
approach reflected in the protocols.
At Downtown and West, the activities of local school districts illustrate the different
roles that supporting educational entities can play in GLOBE. At Downtown, the district
provides an array of inquiry and hands-on science materials from which schools can
choose. In addition, the district periodically tests students in science to make up for the
fact that the state does not collect data on students’ performance in science in grades K-8.
At West, the school benefits from activities of the Stark County Educational Service
Center, which is a GLOBE United States partner. The county uses a lead teacher model,
in which the Center provides training to lead teachers, who then work with teachers in the
field. For the GLOBE Program, the Center helps lead teachers learn new protocols and
how to integrate them with curriculum before the lead teachers visit teachers in the field.
To support GLOBE activity, the district has a van with a full set of equipment that can be
used for training and loaned to individual schools. The van is operated by two district
staff people available to help teachers learn how to manage GLOBE implementation by
going to the teachers’ schools and assisting with data collection. According to former
principal Mike Daulbaugh at West, the district is an invaluable resource to the school.
The Challenge: Aligning GLOBE, State Standards, and Testing Downtown and West are two public schools where standards and testing are of
primary concern for teachers and administrators. Both are in states that have set
5-6
GLOBE Evaluation Year 6 – Chapter 5: Variation in Implementation in Schools
standards that emphasize student inquiry in science in ways that are consistent with
GLOBE participation. From teachers’ points of view, however, the state accountability
testing is not yet aligned with state standards in science and the lack of alignment reduces
the potential impact of GLOBE and other similar science initiatives on student learning.
They believe that GLOBE can contribute to improved test scores, but they worry that the
current state tests are not well aligned with the state standards in science.
Both North Carolina’s and Ohio’s standards emphasize science as inquiry, as well as
content knowledge and other themes or strands in the study of science. Students in North
Carolina are expected to understand that science is a process of inquiry, and state
standards articulate inquiry skills such as setting up an experiment, collecting and
analyzing data, and developing alternative explanations of phenomena as important for
all students to master. By 4th grade, Ohio students are expected to be able to “select
instruments to make observations and/or organize observations of an event, object, or
organism” and use those data to make predictions about phenomena, two critical
components of the inquiry process. The content standards for science in the middle
grades in North Carolina have been developed with GLOBE investigation areas in mind,
so that the state’s science standards and GLOBE protocols and learning activities have
considerable overlap.
Teachers see the alignment of state standards with GLOBE as an opportunity to teach
students that science is an active process rather than simply facts in a textbook. John
Cardarelli says of his science teaching at Downtown Elementary:
To me, GLOBE is just a way to show real science and how it applies to these different areas. But it’s more than tools; I mean, GLOBE is a lot more than just a bunch of toolsit’s a way of thinking, it’s a way of doing, it’s a way of collecting data and sharing data and joining a community of scientists around the world.
Teachers at West said that GLOBE is ideally suited for state standards to address the
relevance of science to society and to teach more than just isolated facts. The former
principal said that GLOBE can be a “training program” to prepare students to meet the
new state standards in science.
Although teachers see GLOBE as well aligned with standards at both West and
Downtown, they are also ambivalent about the effects they see of accountability testing
on GLOBE implementation. State testing in Ohio includes science at each of the grade
5-7

GLOBE Evaluation Year 6 – Chapter 5: Variation in Implementation in Schools
levels tested. Faculty at West said that testing in science brings legitimacy to focusing
classroom time on science, particularly in a district that promotes hands-on science
inquiry and programs like GLOBE. At the same time, teachers feel that the tests lag
behind the new state standards and therefore are likely not to measure GLOBE skills as
well as they could.
Students in North Carolina aren’t tested in science until high school. As a result,
many teachers, including Cardarelli, give less attention to science than to mandated tests
focusing on students’ mathematics and reading skills, especially toward the end of the
school year:
At the beginning of the year, when there was no testing, it was something I tried to teach every day or at least four times a week, and it would be at least 45 minutes every day for four or five days a week. And as things get closer to the end of the year, things get in the way ofnot just testing, but we had to do a play, a performance, and anything like that takes up an enormous amount of time, and therefore science suffers as far as time.
GLOBE data reports reflect this shift in focus. Although Cardarelli’s students made
regular trips in the early spring to Salem Creek, their Hydrology Study site, they did not
report any data in May. Once testing began after the middle of May, the students also did
not report Atmosphere data. The tests in reading and math take on additional importance
for Cardarelli’s 5th-grade students: they must pass both tests to advance to middle school.
This factor probably contributed to principal Jan Atkinson’s view of GLOBE
implementation in 2000-01 as a “trial period.” Atkinson also noted that it has also
encouraged teachers to think more about links across the curriculum:
[T]here needs to definitely be many, many more opportunities for the integration of the sciences and the social studies with the math and the science...which I think, because of testing, people shy away from.
Despite the mismatch between standards and testing in Ohio and North Carolina,
faculty at both schools believe that GLOBE can make a positive contribution to students’
test performance. At Downtown, both Cardarelli and Atkinson said that GLOBE helps
students by familiarizing them with the metric system, which is part of the math test, and
with reading and following instructions (i.e., for GLOBE protocols), which is a skill
needed in the reading test. Teachers at West noted that the 4th-grade science test requires
students to interpret a weather map, a task for which their GLOBE students are well
prepared. Still, the decline in data reporting at Downtown in the late spring and the sense
5-8

GLOBE Evaluation Year 6 – Chapter 5: Variation in Implementation in Schools
that teachers can spend less time on science because it is not tested at all as part of the
state accountability program suggest that alignment of tests and standards can have a
powerful effect on when and how teachers implement GLOBE.
Two Parochial Schools in the Urban U.S. South: Heart of Mary and Cabrini
Most Pure Heart of Mary School in Mobile, Alabama, is operated by the Sisters of
Saint Francis, a religious order based in Philadelphia. The elementary school is located
just north of downtown Mobile in a predominantly African-American neighborhood.
Heart of Mary sits at the end of a short street that it shares with the local parish church.
The area is a mix of residential and commercial properties. Nearby are a funeral parlor,
public housing units, a community college, open overgrown fields, a public middle
school, a liquor store, some light industry, and a YMCA that the school uses for its
athletic facilities.
Today, Heart of Mary’s students are among the brightest in the Mobile area.
Enrollment at the school is 225 students, up nearly three times from the low of a decade
ago. Most of these students graduate and go on to attend one of the most prestigious high
schools in the area, McGill-Toolen Catholic High School.
Cabrini High School is a small Catholic girls’ college preparatory school, with
students in grades 8 through 12, situated in a residential area of New Orleans, Louisiana.
The student body is racially diverse, and one-quarter of admission spots each year are set
aside for academically challenged students whose performance is expected to improve in
the small, nurturing environment of the school. The school administration and faculty are
directly accountable to the school’s governing board, the Missionary Sisters of the Sacred
Heart of Jesus. Cabrini is a member of a diocese formed from a loose federation of
Catholic schools in the Archdiocese of New Orleans. Although there is collaboration
across the diocese on such issues as school calendaring, the school is not accountable to
the diocese for curriculum, standards, or student testing.
GLOBE at Heart of Mary and Cabrini Sister Shirley Ann Boucher introduced GLOBE at Heart of Mary School during the
2000-01 school year. She learned about the Program at an in-service teacher workshop
offered by the diocese. Her 6th- through 8th-grade students participate in Atmosphere
5-9

GLOBE Evaluation Year 6 – Chapter 5: Variation in Implementation in Schools
and Hydrology protocols; in addition, they were one of three schools to field-test the new
Surface Ozone protocols. The Atmosphere site is across the street from the school,
behind the Sisters of Saint Francis Convent. The students also visit the convent to enter
GLOBE data on-line because the school has no funds to provide an Internet connection in
its computer lab. Students visit the Hydrology site twice a month. Sister Shirley drives
students the 3 miles to the Mobile Bay site. Students participate in GLOBE activities in
rotating teams during the year, with about 10 students involved at a time.
Sister Shirley and her principal, Sister Nancy Crosson, believe that GLOBE benefits
their students by providing them with opportunities to build leadership skills and an
increased sense of responsibility, level of independence, and self-esteem. Sister Nancy
noted that changing “the propensity for students to quit tasks before finishing” is one of
her faculty’s goals. It is also important to Sister Shirley and Sister Nancy that GLOBE
allows for participation of all students, regardless of how students generally perform in
the classroom. The Program provides roles for advanced students as leaders and for less-
advanced students who can successfully contribute to data collection.
In addition, participating as a pilot school for the new ozone protocols has made the
work of scientists more real and visible to students. They developed a strong motivation
for inquiry into data, according to their GLOBE teacher:
And they said, “What was it today?” And I said, “Well, ask the team, what was it.” And so they checked the chart, and they said, “But Dr. Ladd said it had to be higher.” I said, “That’s right.” So then they said, “Should we ask Dr. Ladd, could we ask her, why there’s such a difference?” and I said, “We sure can.” So we e-mailed her and she just answered today saying, “I guess they’ve noticed some discrepancies between that and they’re asking some questions.”
The result of this up-close work with scientists is an appreciation of the process of
scientific inquiry. According to Sister Shirley:
I think the thing with GLOBE is that students learn how to do some inquiries and to ask good questions. They’re beginning to realize that when there’s a problem that needs to be solved, there might be a variety of ways of approaching it, rather than thinking that the teacher just knows.
Ann Smart, who is the GLOBE teacher just an hour away from Mobile at Cabrini
High School in New Orleans, attended GLOBE training at Stennis Space Center in
Mississippi in 1999. Smart says that her GLOBE training was both short and intensive.
By the end, she felt comfortable with the protocols and with one learning activity from
5-10

GLOBE Evaluation Year 6 – Chapter 5: Variation in Implementation in Schools
each investigation area. She uses these activities to introduce protocols in the different
investigation areas, to familiarize her 10th-grade environmental studies students with the
topics, instruments, and procedures required of students. Smart was able to start
implementing GLOBE during the fall after her summer training; she received a grant
from the Lake Pontchartrain Basin Foundation to purchase the Hydrology kits.
Implementation of GLOBE at Cabrini focuses more on data collection and reporting
than on data analysis. Students conduct Atmosphere protocols daily and Hydrology
protocols every seventh school day. Bayou St. John, located next to the school, is the
Hydrology site. All students have the opportunity to participate, regardless of whether
they are “good science students” or not, noted Smart. Four of Smart’s students had the
opportunity to make a presentation on their Hydrology data collection activities through
their participation in Canal Watch, an annual symposium sponsored by the foundation
that provided them with Hydrology kits. The four Cabrini student presenters were
selected on the basis of their good performance in the environmental science class in
which they conduct GLOBE activities. They prepared graphs of water quality data for
the presentation, as well as brief comments describing the basic trend or pattern of the
data to go with each graph.
Students at Cabrini reported that they enjoy the opportunity to go outside to collect
water samples. They also appreciate the opportunity to engage in “practical,” hands-on
activity. When probed by the site visitor about the purpose of this data collection
activity, one student seemed unsure about why they were collecting water quality data
and what was done with the data once they were collected. In contrast, the four students
who presented at the Canal Watch symposium had to examine the GLOBE data they had
collected more carefully and select graphs to identify and present trends to an external
audience. It may be that only a subset of GLOBE students engage in inquiry with
GLOBE data, but Smart’s view of the benefit of GLOBE reflects the kind of experience
these four students had with the Program. According to Smart, “GLOBE prepares
students with a lot of inquiry skills [like] reading graphs, interpreting data, higher-order
thinking skills.”
5-11

GLOBE Evaluation Year 6 – Chapter 5: Variation in Implementation in Schools
Aligning GLOBE with Locally Developed Standards Heart of Mary and Cabrini are private schools that are not obligated to conform to the
state educational policies mandated for public schools, including those for standards and
testing. Heart of Mary is part of the Archdiocese of Mobile, which provides support and
resources to the school. Cabrini, although part of a loose alliance of schools in the
Archdiocese of New Orleans, reports to its own governing board. Consequently, it might
appear that neither Heart of Mary nor Cabrini is affected by the standards and
accountability movement, but staff at both schools said the increased emphasis on
standards and testing at local and state levels is having an impact at their schools.
Teachers like Sister Shirley at Heart of Mary “feel the pressure” to improve scores on
diocese-mandated tests. Cabrini has adopted the ACT as one of its mandatory tests for
students, because college admission and scholarships to state schools are both linked to
scores on that test. Still, individual teachers at both schools have more ownership and
control over the direction of assessment of progress toward meeting the schools’ learning
standards and view test results not simply as indicators of performance but also as guides
to instruction.
Both Heart of Mary and Cabrini are involved in efforts to align standards with
curriculum. Heart of Mary’s diocese provides standards for learning, based on
curriculum and content standards from the Alabama science standards and on guidelines
from the National Science Teachers Association. The diocese promotes hands-on,
authentic, and engaging learning activities in science. According to Sister Shirley, Heart
of Mary’s standards emphasize:
… having the students just getting an answer is not the most important part of the process. Thinking through a problem is the important part; it’s the process. It’s a harder way to teach, and yet I think that’s probably one thing that’s coming back a lot stronger is using the inquiry method.
Heart of Mary’s diocese has developed performance-based science tests to examine
how students are doing in science in grades 4 and 7. The diocese selected grades 4 and 7
because these students are tested in reading and mathematics with the Iowa Test of Basic
Skills. Concerned that student science learning also be assessed, science teachers
developed an assessment of science content and student inquiry skills:
… we were saying, “Well, it’s one thing to talk, we teach, we try to, we’re encouraged to teach hands-on and then we get assessed on facts.” And it’s really
5-12

GLOBE Evaluation Year 6 – Chapter 5: Variation in Implementation in Schools
frustrating because the tests were not hands-onthe Iowaso that’s why we wanted to do our own assessment, to see how our students were doing in terms of the three areas of content, interpreting data, and then the hands-on.
So far, unlike in many public school systems, these tests are used for diagnostic
purposes only, rather than for accountability. Indeed, Sister Shirley reports learning a lot
from watching her students attempt to complete the performance tasks:
I learned more from watching my own students performing the experiments than from necessarily the grading of them. Because it’s seeing them working and processing information, and so I was a little disappointed with some pieces of it, because the kids saidI said, “Now are you sure you remember how to do that?” And they said, “Yes,” and then they hadn’t remembered.... one of the biggest problems that we have as teachers is that we just run out of time. The students basically needed more time to process what they were doing. So in our next year, we will give the students more time on the activities.
Sister Shirley’s view is that accountability tests are largely political and not focused
enough on how to improve instruction in the classroom. GLOBE, by contrast, is
decidedly not political, from Sister Shirley’s point of view, and is therefore perceived by
students as something fun and interesting. She adds, “I would not want GLOBE to be the
main curriculum. I think this would take the ‘specialness’ out of it.”
The development and refinement of standards and curriculum at Cabrini High School
in New Orleans was described by the school’s principal as a work in progress, as the
school continues its effort to better articulate standards and align standards and
curriculum. When asked to describe state or local reform initiatives that have affected
Cabrini High School, teachers and administrators we interviewed mentioned an increased
emphasis on standards and alignment of curriculum with standards. This effort to further
develop standards and align the curriculum was described as a school-based initiative.
According to GLOBE teacher Ann Smart, this is both a bottom-up and a top-down
approach taken by each teacher with individual teachers’ curricula:
The entire faculty mapped their “curriculum guides” to our newly adopted standards. Next, we will do a top-down mapping, and work from the standards down to topics, to curriculum, to make sure we really cover the standards in our curriculum.
This process, as well as other reform initiatives at the school, is characterized by
autonomy of individual teachers within the school and relative autonomy from external
5-13

GLOBE Evaluation Year 6 – Chapter 5: Variation in Implementation in Schools
strictures from the diocese. Other schools and agencies are seen primarily as a source of
new ideas, to be adapted to the school’s own local context. According to Smart:
At the school level [since no state and district connections exist], teachers have a great deal of involvement in shaping policy. For example, all teachers had input and a big role in deciding whether the school would change to a block-schedule format. All teachers did research on block scheduling, and many visited schools that had block schedules to observe.
The school collaborates with other schools in the diocese on the development of
standards and curriculum alignment primarily through working groups and committees,
consulting with outside experts when necessary.
In formulating the school’s science education standards, teachers at Cabrini drew on
both the National Science Education Standards and Louisiana’s Science Content Strands
Standards. The Science Teaching Standards were adopted from the former. All the
content standards were adopted from the latter, with few if any changes. School faculty
felt that it was important for the school to be aligned with state standards because
graduates would be competing with other students in the state for admission to college.
Like Heart of Mary, Cabrini has opted out of participation in the state testing system,
known as LEAP. The school instead relies heavily on ACT and another test of student
achievement selected by the school, called PLAN (which affords accountability with
respect to things that matter to parents, like getting into college). Smart feels that
GLOBE prepares students for these tests because it develops the inquiry skills that are
tested on ACT and PLAN.
Despite their independence from state education agencies, teachers at both Heart of
Mary and Cabrini are focused on aligning standards, curriculum, and testing. These two
schools do not face the accountability measures that public schools face if their students
do not reach achievement goals; nonetheless, their students must compete with students
from the public school system after graduation, lessening the effect that the difference in
accountability might otherwise have. Teachers at these parochial schools see GLOBE as
building skills of responsibility and inquiry, and their approach to assessment emphasizes
both using formal and informal sources of knowledge of students’ skills and
understanding to improve instruction.
5-14

GLOBE Evaluation Year 6 – Chapter 5: Variation in Implementation in Schools
Programs with a Strong Focus on Science: Cedar Grove and Dutchess Academy
Cedar Grove Middle School is located near the southeast corner of Atlanta’s
perimeter freeway in suburban Decatur, Georgia. The school’s mission is to prepare
students to be lifelong learners and critical thinkers, and there is a strong emphasis on
providing students with a safe environment that is conducive to learning. The school has
a particularly strong focus on science, brought about in part by the influence of principal
Deborah Rives, who previously served as district coordinator for middle school science.
While at the district office, Rives endorsed a recommendation that Cedar Grove make
use of the ecological diversity surrounding the school. The school is located at the end of
a dead-end road, with a wild bird refuge and an EPA air quality station nearby. The
campus is shared with the University of Georgia Extension, whose staff suggested
making use of the site’s ecology. Rives, who left the district office when offered the
position of principal at Cedar Grove, described the school as “environmentally themed.”
The hallmark of this theme is the environmental science elective that is a pilot course of
study for the district.
Like Cedar Grove, the Dutchess Academy for Environmental Studies in
Poughkeepsie, New York, is a “themed” program focusing on environmental science.
The Dutchess Academy is a joint effort of the Dutchess County Board of Cooperative
Educational Services (BOCES) and Dutchess Community College (DCC), run as part of
the state’s occupational education program. It is not a regular school that students attend
throughout the day; rather, it is an experimental program within the district designed to
enhance and accelerate science learning for a select group of high-school-aged youth.
Students applying to the program submit academic records, recommendations from a
counselor and a science teacher, and an essay about why they would like to enter the
program. The program includes internships with organizations such as the National Park
Service, the United States Fish and Wildlife Service, and The Nature Conservancy.
Graduates of the program enter college or a variety of environmental jobs. Many of the
graduates complete additional courses at Dutchess Community College and are able to
transfer into botany, zoology, and organic chemistry bachelor’s degree programs at the
State University of New York and at other public, private, and Ivy League schools.
5-15

GLOBE Evaluation Year 6 – Chapter 5: Variation in Implementation in Schools
One thing that makes the program unusual is that students at the Academy come from
high schools across 14 school districts. Many are bused for their half-day at the
Academy, and others drive themselves. With approximately 15 students each in the
junior and senior Academy programs, the students become a cohesive group at their
second school. The program is academically challenging, and a few students have
dropped out of the program when they discovered it was not what they expected. Wayne
Gilchrest, who developed the Academy’s curriculum, tries to work with students
individually to tailor the program to their plans for the future, when possible.
GLOBE at Cedar Grove and Dutchess Eric Mau came to Cedar Grove Middle School after teaching biology for 4 years at a
high school, where he met Deborah Rives. When Rives was appointed principal of the
new Cedar Grove Middle School in spring 1999, Mau wanted to move to Cedar Grove
because he learned that Rives had a vision of a school focused on science with outdoor
classrooms using the GLOBE Program. He began learning about GLOBE by reading the
Teacher’s Guide and then attended a GLOBE training session in Florida.
For Cedar Grove’s first year, Mau taught 8th-grade science and implemented GLOBE
in a 3- to 4-week period of the course. He also led an after-school environmental
education club to extend GLOBE activities. Mau wanted to teach environmental science
all day, however, and Rives concentrated on getting approval to offer an environmental
science elective class in the school’s second year. She won approval for the class as part
of the state-mandated Connections program, designed to give students exposure to fields
in which they might pursue careers. (Other options under Cedar Grove’s Connections
program include art, home economics, computer applications, and chorus.) Students can
accommodate four Connections during four 9-week rotations.
Mau and Rives have obtained grants to support the costs of the environmental science
elective. As a result, the program is well outfitted with GLOBE-related and other
equipment. The GLOBE weather station is set in an open field immediately across the
driveway from the school parking lot. A pathway beside the open field leads farther
down the hill to the Sugar Creek Hydrology site. The students can work at four folding
tables with attached chairs. The students can easily move these tables between the
Atmosphere and Hydrology sites.
5-16

GLOBE Evaluation Year 6 – Chapter 5: Variation in Implementation in Schools
Sixth-grade students at Cedar Grove focus on Soil, while 7th- and 8th-graders focus
on Hydrology. Mau expects teams to carry out the data collection each school day once
students have received protocol training. Mau also uses the data for other environmental
activities with which he is involved. He says he targets a minimum of three days per
week in the outdoor classrooms. Although it is more difficult to take students outside in
winter months, he said that most students come to class with appropriate clothing, ready
to go outdoors. Mau is pleased with this level of student interest and believes that
garnering interest is one of the teacher’s primary responsibilities: “If the student doesn’t
want to do an activity, I must be doing something wrong.”
Many of Mau’s learning goals for students address their social development, which
he has read is in a critical phase for middle school students. For example, Mau begins
each 9-week rotation with team-building exercises, and teamwork skills are part of his
assessment of student achievement. He allows the students to form their own groups and
to determine who will be responsible for each task. He also structures many activities as
open-ended exploration. This approach allows students to try ideas and fail. Because his
course is an elective, he can allow the students time to try again when their initial ideas
prove inaccurate. Learning to fail is important for these students, he said, because most
of them have been taught that failure is the last step, not just one on the way to success.
Farther up the Appalachian Mountain chain, along the foothills that run along the
banks of the Hudson River in New York, Wayne Gilchrest’s GLOBE students at
Dutchess Academy explore the unique features of their local ecology in a program that
allows them to go deeply into the scientific study of the environment. The Academy
program covers basic and aquatic ecology, environmental measurement, wildlife biology,
fish management and aquaculture, Geographic Information Systems (GIS), orienteering
and Global Positioning Systems (GPS), Introduction to College Chemistry, and wetland
ecology and management courses. The Environmental Measurement course that seniors
take covers all GLOBE protocols, and students attain a level of skill equivalent to that of
GLOBE-trained teachers.
Students taking the program attend classes each afternoon at the DCC Norrie Point
Environmental Site, located on the banks of the Hudson River in a state park. The site
has lab and computer facilities, conference space, and access to a small research vessel
5-17
GLOBE Evaluation Year 6 – Chapter 5: Variation in Implementation in Schools
(Gilchrest sought and received grants to finance construction and maintenance of a larger
research vessel with plans to have it ready for use by students beginning in fall 2001).
Students spend much of their Academy time out in the field doing authentic science.
High school seniors involved in the focus group all cited their activities at the Academy
as the highlight of their school experiences, and many looked forward to continuing their
education in the field of environmental science.
Gilchrest’s students also have an opportunity to become involved in a very high-level
Authentic Science Research (ASR) independent study program run by Madeleine Ferren-
Borgaro of Poughkeepsie High School. The projects cover a 3-year period in which
students spend the first year gathering background information on chosen areas of study
and seeking research scientist mentors and the second year working with their mentors on
research projects. The third year culminates with the students presenting papers during a
meeting held at the Massachusetts Institute of Technology. Two of Gilchrest’s students
had ASR projects in 2000-01.
A science teacher with a master’s degree in environmental research and aquatic
ecology, Wayne Gilchrest brings a passion for teaching and for GLOBE to his work at
Dutchess Academy. He developed the Academy’s curriculum using GLOBE as a basis;
practice with GLOBE protocols is an important part of all students’ experiences there.
Students take measurements in a broad range of investigation areas: Atmosphere,
Hydrology, Soil, and Land Cover. Such breadth of coverage is difficult to achieve and is
made possible by the close attention paid by Gilchrest to designing the program with
GLOBE in mind and by the clear focus on environmental science within the program.
Both Dutchess’s and Cedar Grove’s GLOBE Programs benefit from either being a
United States GLOBE partner or having a GLOBE partner nearby. Cedar Grove is part
of a school and United States partner coordinated by Nancy Huebner, a GLOBE-trained
biologist at the Fernbank Science Center in Decatur. The county established the
Fernbank Science Center 30 years ago to enhance science teaching for all schools in the
district. Since then, the Science Center has become a nationally known science museum
and continues to serve schools in DeKalb County through its many programs, including
GLOBE.
5-18
GLOBE Evaluation Year 6 – Chapter 5: Variation in Implementation in Schools
Dutchess Community College has its own United States GLOBE partnership, headed
by Wayne Gilchrest himself. Gilchrest and his colleague Patsy Cicala are the GLOBE
trainers for the Dutchess GLOBE partnership and also developed the concept of the first
“MUC-a-Thon” in 1998. This first MUC-a-Thon and two subsequent ones involved
students and volunteers from six school districts in the county traveling simultaneously to
multiple sites, mapping out study sites with GPS units, and classifying the ground cover
within those sites to the Modified UNESCO Classification (MUC) categories. Their data
have been used by scientists at the University of New Hampshire in an accuracy
assessment study of satellite-generated land cover maps of Dutchess County (Congalton,
Rowe, & Becker, 2001).
Writing Science Standards for Cedar Grove and Dutchess GLOBE Programs at both Cedar Grove and Dutchess Academy differ from those at
the other four schools we visited in that staff at either the district or school level at these
two sites who had been influenced strongly by GLOBE—whether by attending GLOBE
training or being a GLOBE teacher—have been involved in developing science standards
that would apply to their programs. The result has been that teachers at Cedar Grove and
Dutchess are encouraged to adopt GLOBE as a vehicle for achieving learning standards
for students. In New York, moreover, coordination with efforts at the state level have the
potential to influence not only standards but also assessment of environmental science,
enhancing the potential for GLOBE students to perform better on yet-to-be-developed
state science tests because of their experiences in GLOBE.
The DeKalb County School System in Georgia uses the state’s Quality Core
Curriculum (QCC) as its standards for learning. The district has supplemented the QCC
with science curricula that help teachers ensure coverage of the standards in the QCC.
District staff, working in collaboration with science teachers, are revising the science
curriculum to an inquiry-based one. The science curriculum will be piloted in 2001-02
and implemented in 2002-03. The district’s K-12 science coordinator, Marion Reeves,
emphasized the communication effort that this change will demand:
At the meeting this afternoon, we will be working on getting the new curriculum framework out into the schools before next year, so that the dialogue begins that science is moving in a different direction; and it’s going
5-19

GLOBE Evaluation Year 6 – Chapter 5: Variation in Implementation in Schools
to require inquiry, it’s going to require activities, it’s not going to be a little book that you hand out and they do the vocabulary. And that requires a whole shift in the way you approach teaching—completely.
Both Reeves and the district’s K-12 social studies coordinator, Benjamin Ridgeway,
said that GLOBE aligns well with standards in the QCC. In fact, it was Reeves and
Ridgeway who brought GLOBE to the district. They attended training in 1996 and were
attracted to GLOBE for its potential to be used across the curriculum and for the access
the Program provides to scientists and their tools. Ridgeway and Reeves acted as
coordinators for the DeKalb County School System GLOBE partner until their duties
changed for the 2000-01 school year.
As at West Elementary in Ohio, Cedar Grove’s staff feel that the mandated tests are
not well aligned with the science standards. Although the QCC and district curricula are
generally accepted, the district’s testing program is more controversial among teachers.
The district had been using the Iowa Test of Basic Skills (ITBS) at the elementary and
middle school levels and the state’s graduation test at the high school level. Interest in
scores was focused on the reading and math components of the ITBS, not on science. In
the 2000-01 school year, the district moved to the SAT-9 test for grades 3, 5, and 8. This
change may lead to greater attention to student scores in science, but district staff feel it
may have a detrimental effect on teaching hands-on science, since the SAT-9 science test
is not performance based and does not focus on inquiry, per se.
The situation in New York, where Dutchess Academy is located, is somewhat
different. New York has a well-developed set of high school standards at the state level.
The science standards in New York emphasize inquiry as well as extensive content.
There is a great deal of overlap between the standards and GLOBE protocols and
activities. The standards for science are currently being refined, and the state is also
updating its Regents’ examinations, which students must pass for high school graduation.
New York is also developing its first set of standards for environmental science.
Eventually, these standards will be paired with an assessment for environmental science
in the Regents’ examinations. Wayne Gilchrest of Dutchess is directly involved in
developing both the environmental science standards and the assessments to measure
students’ progress in meeting them. Gilchrest would like to see the GLOBE Program
5-20

GLOBE Evaluation Year 6 – Chapter 5: Variation in Implementation in Schools
thoroughly reflected in the environmental science standards that are developed for New
York.
Gilchrest also has worked extensively to revise the state occupational education
standards. Previously, these standards focused heavily on agricultural food production
and forestry management; Gilchrest wants the revised standards to incorporate field
biology, environmental science, land use planning, wetland delineation, and GLOBE
methodologies. The BOCES administration is highly supportive of Gilchrest’s work in
curriculum standards and regularly provides release time and resources to teachers
involved in this type of work.
Gilchrest is convening a network of teachers from across the state in 2001-02 to
further refine the new standards and to develop a framework for assessing progress
toward meeting the standards. SRI will be working in partnership with Gilchrest to
advise the network on assessment development and to help develop items as standards
are refined.
Discussion: Curricular Alignment at the Classroom Level Revisited
Teachers’ perceptions of the degree of alignment between GLOBE and their
curriculum depends on the “fit” between GLOBE and their schools’ values and practices,
the particular goals teachers have for GLOBE, and teachers’ (and their schools’)
orientations toward standards and testing. We visited six schools in 2000-01 that have
different cultures and that housed GLOBE teachers with different views of what GLOBE
could do for students. From our visits, we discerned a set of important dimensions that
can be used to understand ways that GLOBE implementation varies at the classroom
level.
Dimension 1: School-Level Versus Teacher-Level Focus on GLOBE Most of the schools we visited had what might be called a school-level focus on
GLOBE (in contrast to a teacher-level focus). For example, the curriculum at Dutchess
Academy was organized to use several GLOBE activities. School administrators at both
Cedar Grove and West Elementary were actively involved in promoting GLOBE as an
important component of science teaching. At some of the schools, this school-level focus
on GLOBE is augmented by external supports, such as a GLOBE United States partner or
5-21

GLOBE Evaluation Year 6 – Chapter 5: Variation in Implementation in Schools
supportive district personnel. But for at least one school, Downtown Elementary, there
was relatively little schoolwide emphasis on GLOBE. At schools like Downtown
Elementary, GLOBE implementation is conducted by just one teacher. At these schools,
where there is a teacher-level focus on GLOBE, the individual teacher often must
navigate how GLOBE fits into the curriculum and aligns with standards and testing on
his or her own, perhaps with the support of the principal but without active endorsement
from administrators at the district level for participation in GLOBE. There may be many
other “Downtowns” in GLOBE, and many of them may be much less active participants
in GLOBE. Future evaluation efforts will investigate this dimension in greater detail.
Dimension 2: Practicing Doing Science Versus Contributing to Science Teachers adopt and adapt GLOBE to their local classrooms partly on the basis of their
goals for GLOBE. The emphasis some give to GLOBE is for students to practice doing
science. These teachers want students to experience the inquiry process, either by
observation or through participating in it directly. GLOBE data collection is an activity
of scientists; collecting and reporting data are avenues for practicing doing science.
Moreover, in the minds of many teachers, they are ways to teach students about
responsibility. Teachers at five of the six schools we visited believed GLOBE was a
good way to promote students’ social development—improving their sense of
responsibility to community or their understanding of the importance of consistency or
teamwork, for example. GLOBE for these teachers —at least in part—was an activity for
students unto itself, not connected to benefits to others who are outside the classroom.
Other teachers involve GLOBE students with real scientists from outside their
schools. GLOBE scientists visited Heart of Mary and involved students in pilot-testing
new GLOBE protocols. For these students and their teacher, GLOBE is more than just
an opportunity to practice doing science, it is an opportunity to contribute to science.
Although these goals are central to the GLOBE Program design, at least one teacher we
visited had little knowledge of this aspect of the Program and did not know how GLOBE
student data were used. For students who have had the benefit of encountering scientists
and realizing that they are contributing to science, though, or who have had the
opportunity to present their findings to an external audience, contributing to science is an
important goal realized through the efforts of their GLOBE teachers.
5-22
GLOBE Evaluation Year 6 – Chapter 5: Variation in Implementation in Schools
Dimension 3: Adapting to Versus Defining Standards and Tests Perhaps the dimension that distinguishes the schools we visited most sharply from
one another is the degree to which teachers at the schools were given the opportunity to
contribute to the definition of the standards and tests used to hold them accountable for
student achievement in science. Both Downtown Elementary and West Elementary are
schools where teachers must meet challenging state standards for science with high-
stakes accountability testing that others have developed. Implementing GLOBE at these
schools is in part a task of adapting to standards and tests. In other words, teachers find
themselves in a situation where they must interpret and articulate to others connections
between skills their students are likely to learn through GLOBE and skills their district or
state has written into a standards document and tests through accountability programs. In
many cases, moreover, the alignment between GLOBE and standards is much clearer
than the alignment among GLOBE, standards, and testing programs. Teachers who
found themselves in the position of adapting to standards and tests all noted a mismatch
between their state’s standards and its accountability program.
Other schools we visited were in a different position with respect to standards and
tests. Their teachers often found themselves in local or state leadership roles that allowed
them to play a part in defining standards and tests in science. For example, at both the
parochial schools we visited, teachers had strong, internally developed expectations for
learning but comparatively little external accountability for standards and testing. The
archdioceses of which they were part were primarily a peer group with respect to
curriculum, and testing was seen as a tool for providing feedback on student performance
to inform instruction, rather than as a way to administer punishments or rewards for a
school’s performance. In the case of Dutchess Academy, the GLOBE teacher’s
leadership in environmental science education in the state catapulted him into a role in
helping to define standards and testing requirements for the entire state of New York.
GLOBE functions in these settings as a resource to the development of curricula and
assessments. Teachers are much freer to adapt or develop curricula, and they are able to
adjust all of the pieces of the puzzle—GLOBE, their own science curriculum, standards,
and testing—rather than just one or two pieces.
5-23

GLOBE Evaluation Year 6 – Chapter 5: Variation in Implementation in Schools
Interestingly, despite very different levels of freedom with respect to standards and
testing, none of these teachers viewed standards and testing pressures as severe enough to
prevent them from implementing GLOBE. All the schools we visited are active GLOBE
schools. Despite the barriers each of the schools faces in implementing GLOBE, the
teachers all find room for GLOBE in the curriculum and believe the Program makes a
difference in their students’ learning. And although the contexts vary widely with respect
to the kinds of pressures teachers face to teach to standards or improve test scores, each
of the GLOBE teachers we met had some important measure of autonomy in selecting
curriculum. Even if they were not joined by others in their schools, the GLOBE teachers
we visited all had room to innovate and improve their own practice. We will examine
this theme in greater detail in Chapter 8.
5-24

6. GLOBE International Partners
GLOBE is managed internationally as a cooperative science and education program.
GLOBE partner countries have the flexibility to decide how to implement the Program,
providing that GLOBE’s standards for protocols, equipment, and training requirements
are followed according to the country’s bilateral agreement or memorandum of
understanding with the Program.
GLOBE’s international partners continue to expand the Program to more students and
schools. As with schools and classrooms in the United States, there is considerable
diversity in GLOBE implementation, both within individual countries and across
countries. This chapter reports on recent developments in partner teacher training,
teacher support strategies, status of international collaborative projects and local
adaptations of the Program, and strategies for sustainability. Information in this chapter
was obtained from interviews with Country Coordinators attending the GLOBE
conference in July 2001, reports provided by Country Coordinators, and a review of
resources available on the World Wide Web.
Scope of Participation
“GLOBE partners comprise over half the countries in the world, with schools on
every continent, in every time zone, and representing virtually every type of biome.”8 As
of September 2001, 97 countries had signed bilateral agreements or memoranda of
understanding defining partnership in GLOBE, an increase of 6 countries since
September 2000. The six new countries are Cape Verde, India, Qatar, Bangladesh,
Paraguay, and Bahrain.
Portions of the Teacher’s Guide and data-reporting forms are available in the six
United Nations languagesArabic, Chinese, English, French, Russian, and Spanishas
well as in Dutch, German, Greek, Hebrew, Hungarian, Japanese, Latvian, Polish, and
Swedish and Thai. Partner Web sites continue to be used to disseminate information
8 Opening remarks by Tom Pyke, GLOBE Program Director, at The GLOBE Program Sixth Annual Conference, July 2001.
6-1

GLOBE Evaluation Year 6 - Chapter 6: International Partners
about the Program and to provide teachers with translations or adaptations specific to
GLOBE in their countries and with resources for student research.
International Partner Strategies
Making GLOBE sustainable is a challenge for both established and new partners, but
many are finding strategies for securing funding, maintaining student and teacher interest,
and nurturing the growth of the Program.
Partnerships for Sustained Funding As reported in previous years, partnerships with corporations are an important factor
in making the GLOBE Program sustainable, but financing by the local community is also
important. For example, GLOBE in Trinidad and Tobago is funded mostly by
corporations or organizations such as Petrotrin, BP/Amoco, the Rotary Club of East Port
of Spain, and the Royal Bank. China and the United Kingdom have histories of
successful corporate sponsorships and grant-seeking for their programs. Germany is
exploring hiring professional fund-raisers to obtain the type of long-term sources that can
make GLOBE sustainable without relying solely on government funding. The
Netherlands instituted a requirement in 2000 for GLOBE schools to contribute a fee of
$250 (U.S.) each year to participate in GLOBE and is also searching for a long-term
corporate sponsor for the Program.
Volunteers from the Peace Corps and funding from USAID have a significant role in
supporting the expansion of GLOBE in Cameroon, Benin, and Ghana. This assistance
augments the resources of Ministries of Education in these countries by providing trained
staff who can train classroom teachers in the protocols and assist with program
implementation. To augment USAID, Peace Corps, and World Links for Development
support, Reverend Dadebo, the Country Coordinator in Ghana, has formed a national
coalition of agencies to provide support for GLOBE activities. The coalition consists of
universities, the Council for Scientific and Industrial Research, and the Meteorological
Services of the Ministry of Environment and Science, and is chaired by the Ministry of
Education. Dadebo is also working on developing strategic partnerships with local
mining companies and banks to obtain additional funding. The United States Embassy in
Madagascar provides assistance with funding and equipment for the Program.
6-2

GLOBE Evaluation Year 6 Chapter 6: International Partners
Institutional and Political Support Collaborations and partnerships with universities are an important component in most
countries’ programs. Universities provide content experts who assist with teacher
training and with student research projects, helping to form student-scientist
collaborations. Universities also often provide equipment and training facilities.
Environmental institutions and organizations are also important. The Program in the
United Kingdom is sponsored primarily through the nongovernment Wildlife Trusts, and
in the Czech Republic through TEREZA, also a nongovernmental, nonprofit
organization. The Indian Ministry of Environment and Forests has asked the Indian
Environmental Society and the Center for Environment Education to each be responsible
for implementing GLOBE in 50 schools throughout India.
The Netherlands has developed local collaboration partnerships with water districts in
three municipalities so far (initiated by a grant proposal written by Country Coordinator
Michael Van Ypren). The water districts are funding GLOBE schools in their areas to
provide water quality data for approximately 1 year. Water district representatives give
presentations at schools and assign research questions for students to answer with the
data. It’s a “win-win” situation for each of these groups of participants—the schools
receive the funding to implement Hydrology protocols, students get involved in real
science working on real local environmental issues, and the water districts fulfill their
missions to support environmental education.
Teacher Training Models Many European countries are concentrating efforts on supporting existing teachers
and schools in the Program, continuing the trend from last year. Those that are planning
program expansions are putting a lot of thought into how the new and existing teachers
will be supported with the available resources.
The Program in the United Kingdom has taken an approach of “less is more” in its
trainings. Teachers are given a basic 1-day training covering Atmosphere protocols and
GPS, along with strategies for implementing the Program. Additional training is
available for other GLOBE investigation areas once teachers have successfully
implemented Atmosphere protocols.
6-3
GLOBE Evaluation Year 6 - Chapter 6: International Partners
At the Sixth GLOBE Conference, Netherlands Country Coordinator Michael Van
Ypren shared his plan for sustainable expansion to 300 new schools. The Netherlands
model incorporates a goal of training four teachers per school, each with a special
proficiency in one of the four major GLOBE investigation areas: Atmosphere,
Hydrology, Land Cover, and Soil. A “basic” 1-day training encompassing Atmosphere
and GPS protocols is conducted, and then separate trainings are held for the Hydrology,
Land Cover, and Soil investigation areas. Trainers for each of the specialty areas are
provided or partially subsidized by universities and environmental or municipal agencies.
Germany is also experimenting with the 1-day basic training approach, focusing on
Atmosphere protocols, hands-on experiments, core data entry, use of GLOBE
visualizations, and the way GLOBE fits into sustainable development education
curricula. Schools are now required to send at least two teachers per school to be trained
and must have the support of the school administration.
One of Switzerland’s Country Coordinators, Ruedi Schluep, stated that they are
experimenting with different teacher training models to find out which is the most
effective in developing sustained participation by teachers:
• A consecutive 3-day training.
• A 3-day training session with time in between (a full day concentrating on Atmosphere; two half-days, one concentrating on how to implement Atmosphere measurements and integrate them into curriculum, and one spent on Hydrology; a full day spent on Land Cover and Soil).
• Training teachers in grade-level groups so that the training can focus on the specific needs of each level.
Providing Support for Teachers The importance of face-to-face mentoring is recognized by many partners. For
example, Chile’s Country Coordinator, Valeria Fuentealba, is working on extending
mentoring that she personally provides through a collaboration with a university in
Santiago. A cadre of environmental engineering students is interested in assisting
teachers with the implementation of GLOBE protocols.
6-4

GLOBE Evaluation Year 6 Chapter 6: International Partners
The Programs in Switzerland, Germany, Sweden, and Hungary hold annual meetings
and/or refresher trainings for teachers. The Ministry of Education in Croatia sponsors an
annual 3-day workshop for one or two teachers and three student representatives from
each GLOBE school. Benin provides annual training workshops for teachers in computer
and Internet use, as well as GLOBE camp for students and teachers. Estonia organizes a
yearly GLOBE Learning Expedition, which became a regional event this year involving
teachers and students from Estonia, Latvia, Lithuania, Poland, Sweden, Norway, Finland,
and Iceland. The Czech Republic annually holds GLOBE games involving teachers and
students in contests and providing opportunities to practice the protocols.
GLOBE Alignment with Standards Partner countries are continuing to help teachers integrate GLOBE into their national
curricula. Many countries, like many states within the United States, are undergoing
revisions to their science curricula and standards to make science more hands-on and less
lecture driven and to promote the development of the critical-thinking and problem-
solving skills that are part of scientific inquiry. In Europe and India, understanding
sustainable development is a key issue for education, and GLOBE is being used to help
teach these concepts to students.
Sweden’s science curriculum was revised in 2000 to increase the emphasis on
environmental sustainability issues, and integration of GLOBE into this new curriculum
is one of the goals that EvaLotta Nyander, the Swedish Country Coordinator, listed in her
country report. A new Web site is under construction with translations of some materials
into Swedish and links to resources.
The recent effort to map GLOBE to the United Kingdom’s National Curricula 2000 is
enabling teachers to use GLOBE in many subject areas of their teaching—using GLOBE
to help provide a worldwide perspective. John Lockley, Country Coordinator in New
Zealand, is working on curriculum mapping as a support for teachers in GLOBE.
Detlef Kaack, the Education Project Leader for GLOBE in Germany, is providing
curriculum integration support for teachers at each grade level, building a framework of
GLOBE activities that can be used in nonscience subjects, such as communication and
languages.
6-5

GLOBE Evaluation Year 6 - Chapter 6: International Partners
Teachers in a school in Spain recently developed a special environmental course to
make use of GLOBE protocols (see Figure 6.1).
6-6

GLOBE Evaluation Year 6 Chapter 6: International Partners
Figure 6.1 Spanish School Implements Environment Workshop
GLOBE in Spain Inspires Workshop for Environment
Teachers at the I.E.S. "Juan Carlos I" School in Murcia, Spain had long pondered a way to teach students critical thinking as it relates to environmental issues. Almost as if on cue, Spain became a GLOBE Country and some Juan Carlos teachers learned the endless possibilities of the hands-on science education program.
They went to great lengths to create a new course called "Experimental Workshop for the Environment" so they could include GLOBE activities in their official curriculum, according to GLOBE Teacher Rosa Maria Verdu. "We wanted our students to become critical thinkers of environmental issues, especially as the students mature and realize how their knowledge about the environment will help shape their daily decisions as citizens," the teacher said. Today, the Juan Carlos I experimental program has expanded from its charter number of 11 students to 25. Ms. Verdu describes her students as "excited to learn about the environment and participate in GLOBE."
The workshop is for 15 and 16-year-old students. During the course, the teenagers address each of the GLOBE Investigation areas as well as various other key environmental topics. GLOBE fits very well into the course components of Meterology, Hydrology, Soil, Land Cover, and even indirectly in the other topic areas included in the lessons. "Taking regular measurements of the Segura River, and studying other natural areas are some ways how the GLOBE Students at I.E.S. "Juan Carols I" are linking their 'thinking skills' to practical experience, "' said GLOBE Country Coordinator, Clemencia Andres Torres.
*Source: GLOBE Star, March 2001 (http://www.globe.gov/fsl/STARS/ART/Display.opl?star=castao&lang=en&nav=1)
Regional Collaborations Another sustainability strategy to maintain students’ and teachers’ interest in the
Program is the development of regional collaborations. Seeds of several collaborations
last year are now coming to fruition, and new international proposals have been
submitted and are described below.
The POPs (Persistent Organic Pollutants) proposal submitted by GLOBE Norway and
the Norwegian Institute for Air Research to the Norwegian National Committee on Polar
6-7

GLOBE Evaluation Year 6 - Chapter 6: International Partners
Research has been funded, and from it the GLOBE-Arctic Initiative has evolved. The
study involves using student data collected on levels of toxic pollutants in the Arctic food
chain to investigate the movement of these pollutants through the Arctic environment.
The project has attracted additional funding from the Canadian Government’s
Department of Indian Affairs and Northern Development and other country-specific
sponsorships. A special GLOBE training was held in Fairbanks, Alaska, in August 2001,
involving trainers and teachers from two schools from each of the Arctic Rim countries
of Iceland, Canada, United States, Norway, Finland, Russia, and Sweden. This training
covered GLOBE basic protocols and special protocols for the collection of marine life
samples from which the POPs data will be retrieved.
The Estonian Country Coordinator, Ülle Kikas, reported that “Country Coordinators
from six European Countries—Estonia, Czech Republic, the Netherlands, Norway,
Poland, and the U.K.—applied for a grant from the EU Education and Culture program
SOCRATES for a program called e-LSEE (e-Learning in Science and Environmental
Education). The project will develop a transnational collaboration of teachers
implementing GLOBE to promote the use of ICT in teaching science and environmental
education to pupils aged 8-16. Our proposal successfully passed the first selection
process.” Estonia also hosted an international meeting of GLOBE students and teachers
from GLOBE Baltic and Nordic countries.
The Czech Republic, Croatia, and Estonia have all hosted GLOBE Learning
Expeditions, GLOBE Games, or other student-teacher events that involved GLOBE
schools from other partner countries as well as their own.
Germany is collaborating with Switzerland and Austria on a project studying the
water quality of the Rhine River. Students in Germany also are involved in monitoring
the recovery of former strip mining sites in Eastern Germany using GLOBE Remote
Sensing and Soil protocols.
GLOBE as a Catalyst for Environmental Study Environmental sustainability is a major concern of the European Union countries.
Andy Tasker, Country Coordinator for the United Kingdom, is leading an effort to
involve GLOBE partners in the European Union in taking measurements modeled on
GLOBE protocols for environmental sustainability in the areas of transport, energy,
6-8

GLOBE Evaluation Year 6 Chapter 6: International Partners
waste, and biodiversity. Switzerland, Sweden, and Germany have expressed a desire to
collaborate with the United Kingdom in a project to start taking these measurements and
in adapting their programs and curricula to address these sustainability issues.
The Indian Environmental Society (IES) working with GLOBE’s Country
Coordinator in India hosted the VI Global Conference on Environmental Education in
New Delhi in November 2001 (see Figure 6.2). India joined GLOBE in 2000, and the
IES is currently implementing a plan to increase teacher training and school involvement.
6-9
GLOBE Evaluation Year 6 - Chapter 6: International Partners
Figure 6.2 Announcement for VI Global Conference on Environmental Education
6-10

GLOBE Evaluation Year 6 Chapter 6: International Partners
School-to-School Activities School-to-school collaborations between nine Norwegian and nine Estonian
“twinned” schools—funded by a SAS and Coca Cola environmental grant won by their
Country Coordinators Karl Hetland and Ülle Kikas, respectively—is now in full swing.
Students from the “twinned” schools are participating in a larger Phenology project with
schools from the Czech Republic. In addition, each pair is pursuing its own joint
research projects and mutual visits.
Discussion
Partner countries are using GLOBE as a launching point for increasing environmental
awareness and integrating this awareness into national education curricula and local
communities. The most effective strategies continue to be many of those cited in SRI’s
Year 5 Report:
• Linking data collection to a local environmental concern and developing a partnership between GLOBE students and the community to meet a mutual need.
• Providing teachers with sustained support.
• Translating and/or adapting GLOBE materials to suit the unique needs of the country.
• Meeting funding challenges with creative partnerships that extend beyond the support of government and quasi-governmental ministries and environmental agencies to include corporate and private-enterprise sponsors and the local community.
• Providing guidance on how GLOBE fits within the national curriculum and providing support to help teachers meet changing curriculum guidelines, with a focus on sustainable development.
This year, there has been more emphasis on regional collaborations and events and on
the heightening of worldwide environmental awareness—with a focus on helping
students understand how humans affect their environment and how we can build a
sustainable relationship with the planet and each other.
6-11

7. Measuring Student Learning
A major part of SRI’s evaluation activity during 2000-01 was the development and
piloting of an assessment instrument to be used in our evaluation of student learning
outcomes in North Carolina and across the United States. The focus of the GLOBE
assessment of student learning has been on North Carolina since the beginning of Year 6
because there has been a concerted effort within the state to align GLOBE learning
objectives and state science standards in the middle grades. North Carolina presented an
opportunity to learn more about the effectiveness of GLOBE where there is strong
statewide support for GLOBE and where state standards are closely aligned with
GLOBE’s own objectives. With this focus, our task was to develop an assessment of the
science content at the intersection of GLOBE objectives and North Carolina’s objectives
for student learning in middle school science.
Our assessment development process involved identifying existing items, developing
many new items, and pilot-testing the items with a sample of 8th-graders in North
Carolina and with two national samples of 7th- and 8th-graders: students who had
participated in GLOBE activities and students of teachers who had received GLOBE
training but not implemented GLOBE activities. The assessment will be used more
broadly in 2001-02 for the evaluation of learning outcomes. The results of the pilot study
of the instrument were reported at the July 2001 GLOBE conference in Blaine,
Washington (Penuel & Crawford, 2001). This chapter describes the results from the pilot
administration of the instrument.
GLOBE and North Carolina’s Science Standards
North Carolina revised its standards for K-12 science education in 2000 and formally
approved the new standards in 2001. The new standards place a strong emphasis on
developing students’ understanding of science as a process of inquiry advanced by new
technologies. Content standards for each grade level are focused around a single “big
idea” in science, and students are expected to master just four to five content areas at
each grade level. North Carolina wrote its middle school standards to correspond closely
with goals for three GLOBE investigation areas: Soil (6th grade), Atmosphere (7th
7-1

GLOBE Evaluation Year 6 – Chapter 7: Measuring Student Learning
grade), and Hydrology (8th grade). In addition, 8th-graders in North Carolina are
expected to learn how to interpret data from satellite images of Earth, which is part of the
Land Cover/Biology investigation area. Table 7.1 shows the competency goals in the
content areas middle school science teachers are expected to cover in North Carolina.
Table 7.1 Competency Goals for North Carolina Middle School Science
6th Grade 7th Grade 8th Grade
The learner will build an understanding of the lithosphere.
The learner will investigate the characteristics of matter and energy flow through an ecosystem.
The learner will build understanding of the Solar System.
The learner will investigate the characteristics of energy transfer.
The learner will build an understanding of the atmosphere.
The learner will build an understanding of cell theory.
The learner will build an understanding of heredity and genetics.
The learner will build an understanding of the general properties and interactions of matter.
The learner will build an understanding of the hydrosphere.
The learner will build an understanding of population dynamics.
The learner will build an understanding of evidence of change or constancy in organisms and landforms over time.
The learner will build an understanding of motion and forces.
Source: http://www.ncpublicschools.org/curriculum/science/
Since North Carolina’s new standards were first proposed, trainers from GLOBE’s
partners in North Carolina and Clara Stallings, science consultant with the North Carolina
Department of Public Instruction (DPI), have been active in preparing teachers to
implement GLOBE and encouraging teachers to use GLOBE to help meet the middle
school science standards. Teachers in North Carolina interviewed by SRI in spring 2001
saw GLOBE as an important resource, not only for teaching the content standards but
also for helping students develop a deeper understanding of scientific inquiry.
Still, the alignment of North Carolina’s science standards and GLOBE is partial.
Some important science content areas that are “big ideas” or competency goals in the
standards are not covered by GLOBE (e.g., motion and forces and genetics and heredity).
Even in content areas covered by GLOBE, there are some concepts emphasized in North
Carolina’s standards that students would not necessarily learn by following GLOBE
protocols or implementing learning activities from the GLOBE Teacher’s Guide. For
7-2
GLOBE Evaluation Year 6 – Chapter 7: Measuring Student Learning
example, in 8th grade, students are expected to study ocean ecosystems as part of their
study of the hydrosphere. Students are expected to examine relationships among
different organisms in the ocean, a topic that GLOBE does not address directly.
Our Approach to the Assessment
Our plan for 2000-01 was to develop and pilot-test items and to use the resulting
assessment to evaluate GLOBE’s effectiveness in 2001-02. Once the administration of
the assessment was complete, the North Carolina Department of Public Instruction hoped
to be able to use some items for end-of-year content tests in the middle grades and other
items for formative use in the classroom by teachers.
The goal of the instrument development process was to develop items that are
sensitive to instruction (i.e., GLOBE participation in the context of a GLOBE-aligned
science curriculum) but that are not specific to the North Carolina context (i.e., items that
could be used in other states). Therefore, we developed items aligned with the content of
the North Carolina curriculum but whose content was clearly valid for the specific
content of the GLOBE curriculum. This approach would allow us to use the instrument
to compare the effectiveness of GLOBE participation in a state with science standards
alignment (North Carolina) with its effectiveness in other contexts where there is not
explicit alignment (national sample).
To this end, in addition to pilot-testing the instrument with students in North
Carolina, we tested a random national sample of active 7th- and 8th-grade GLOBE
classrooms and a random sample of 7th- and 8th-grade classrooms where teachers had
been trained in GLOBE but were not yet implementing the Program. Testing both a
national sample and a North Carolina sample of students permitted us to compare the
effects of GLOBE in a GLOBE-aligned science curriculum (North Carolina sample) with
the effects of GLOBE in nonaligned curricula (the national sample), so we could better
understand how the variable of “curriculum alignment” affects student performance on
our measure. Inclusion of a national sample of students who had no GLOBE
participation allowed us to determine that the instrument was instructionally sensitive to
GLOBE participation. We expected students with GLOBE participation to outperform
students with no GLOBE participation on all items. If they did not, we would conclude
7-3

GLOBE Evaluation Year 6 – Chapter 7: Measuring Student Learning
that the items did not have adequate instructional sensitivity. Choosing the non-GLOBE
national sample from the group of trained-but-not-implementing GLOBE teachers
offered a degree of matching between the two national samples.
Initial Focus of the Assessment: Hydrology and Land Cover
Researchers from SRI met with Clara Stallings of the North Carolina Department of
Public Instruction in early fall 2000 to identify key goals for our assessment of student
learning outcomes in the GLOBE Program in North Carolina. We decided to develop
measures of student learning of GLOBE Hydrology and Land Cover concepts and skills
that align with the 8th-grade science curriculum in North Carolina.
To determine the specific intersection of GLOBE learning objectives and North
Carolina’s science standards, we developed a matrix showing objectives for student
learning that appear in both GLOBE learning objectives and the North Carolina science
standards. The objectives included both Hydrology and Land Cover/Biology concepts
and skills, as well and concepts and skills related to two aspects of the inquiry process,
planning an investigation and analyzing data. We determined alignment of each item
with the content coverage matrix. In addition to demonstrating the intersection of
GLOBE and North Carolina science learning objectives, the matrix also specified the
detailed conceptual and skill content in each domain (Hydrology, Land Cover/Biology,
and Inquiry Skills). Our goal was to develop or identify at least three items for each
major objective, using three different formats: multiple-choice, short-answer, and long-
answer open-ended items.
To develop items, we drew on previously developed items and created some new
items. In Year 2 of the evaluation, we had created a set of assessment items that cut
across GLOBE investigation areas. We included in the current item pool validated items
on Hydrology and Land Cover/Biology from that assessment. We also consulted SRI’s
assessment group, the Internet, and the TIMSS and NAEP databases for possible items.
We also developed new items and initial scoring rubrics to meet our goals for coverage.
Because we knew we would end up with fewer items for each objective than we piloted,
we developed five to six items for each objective.
7-4

GLOBE Evaluation Year 6 – Chapter 7: Measuring Student Learning
Once our pool of items was developed, we asked GLOBE scientists within the
Hydrology and Land Cover/Biology investigation areas and staff at the GLOBE office to
review items for accuracy of content. In addition, internal assessment experts familiar
with the GLOBE activities and protocols reviewed the items. We revised our items again
on the basis of the comments and feedback.
The Assessment Pilot Sample
We piloted the items in five classrooms in North Carolina in late February and early
March 2001, using the on-line assessment form. The teachers in these classrooms were
all GLOBE-trained teachers. None had implemented GLOBE, but they all planned to
implement GLOBE in the next three months with their classes. We asked these same
classrooms to complete posttests in May, though only two classrooms actually completed
the assessment again. The assessments were administered in five randomly selected
active GLOBE classrooms outside North Carolina and three randomly selected
classrooms where teachers had been trained in GLOBE but had not implemented
GLOBE.
Pilot Test Results: Analyses of Student Learning
When all items, regardless of their power to discriminate GLOBE and non-GLOBE
students, were used in the analysis, there were significant differences across the three
samples on Hydrology content and Inquiry Skills scores (see Table 7.2).
7-5

GLOBE Evaluation Year 6 – Chapter 7: Measuring Student Learning
Table 7.2 Analysis of Differences in Scores across Groups in Assessment Pilot
Hydrology Content
Inquiry Skills
Mean
N
Active GLOBE (National)
SD
10.37
73
3.42
5.35
57
3.03
Mean
N
* Standards Aligned (North Carolina)
SD
9.69
13
2.50
4.04
21
1.94
Non-GLOBE Mean
N
SD
7.12
34
2.91
3.50
34
2.14
F = 12.02 (df = 2,117),
p < .0005
F = 5.84 (df = 2,109),
p < .004 *Standards Aligned refers to the North Carolina sample. This sample did not in fact implement GLOBE to the extent that GLOBE schools did, but did cover more GLOBE content than non-GLOBE classrooms.
Post-hoc comparisons indicate that on the Hydrology content scale, students in the
standards-aligned sample in North Carolina outscored non-GLOBE students and were not
significantly different from the mean of the national active GLOBE sample. On the
Inquiry Skills scale, the North Carolina group mean was not significantly different from
the non-GLOBE group mean. However, the active GLOBE group mean was
significantly greater than the non-GLOBE group mean.
Discussion
These data should be interpreted with caution. Specifically, the following caveats
should be kept in mind: (1) there was significant attrition in the North Carolina sample
from pretest to posttest because of concerns over taking time away from preparation for
the middle school exit examination; (2) the North Carolina sample was much smaller
than the national samples and hence less representative of the population; (3) problems
7-6

GLOBE Evaluation Year 6 – Chapter 7: Measuring Student Learning
associated with on-line administration of the test in some schoolsacross all
groupsmay have affected student performance.
Over the coming year, we expect to refine our assessment further by adding and then
testing the instructional sensitivity of new items to gain broader coverage of the content
and inquiry skills we aim to measure. The need for a large item pool from which to tap
student knowledge and understanding, in order to create a valid assessment that is
representative of the domain, is an important consideration for future efforts. We will be
able to use just under half of our items, and more items will be needed to ensure validity
of the assessment. In addition, we plan to shift our assessment administration time to the
fall when there are fewer competing pressures on students and concerns about
“overtesting” are not as great.
Another area of further refinement of the assessment will be enhancing the usability
of the on-line form of the instrument. In our pilot of the on-line instrument, we found
that students had some difficulty with scrolling down the page. In addition, some schools
with older computer models had long wait times for image loading that may have
negatively affected student performance. In future on-line administration of the
assessment, we will need to match samples on reliability of computer and network
infrastructure to assure that technology performance is not a “nuisance variable” affecting
differences between groups.
7-7


8. Discussion
This year’s evaluation report has focused on issues related to GLOBE
implementation. We examined implementation from a variety of perspectives: the
numbers of teachers who were prepared for implementation through GLOBE training,
data reporting, posttraining supports for implementation, and adaptation of GLOBE to
local standards and testing pressures. We also examined the relationship between
GLOBE implementation and student learning, with special attention paid to the boost in
student achievement that may result from aligning GLOBE closely with state science
standards.
In this chapter, we offer interpretations of how the patterns we found in this year’s
evaluation contribute to a more complete picture of the important factors that predict
GLOBE implementation patterns. We situate our findings about GLOBE in the larger
context of research on the implementation of large-scale reforms that are similar to
GLOBE in reach. In many cases, SRI’s evaluation research is consistent with prior
studies, and we discuss how this research applies to GLOBE as a program. In other
cases, research is presented as a guidepost for helping GLOBE meet its new and
emerging goals, such as encouraging more data reporting and promoting student inquiry.
Teachers’ Goals Shape GLOBE Implementation
Most educational initiatives are concerned, to some degree, with implementation
fidelity, that is, the extent to which teachers enact innovations in ways that either follow
designers’ intentions or replicate practices developed elsewhere (Loucks, 1983). In this
respect, GLOBE is unusual among reform initiatives in that it is concerned with fidelity
of implementation with respect to data collection protocols, but teachers are free to pick
and choose from a variety of protocols and learning activities to suit their classroom
needs. Teachers’ freedom to choose is essential to the Program design: GLOBE’s
philosophy has always been one of providing resources and leaving decisions concerning
curriculum and pedagogy to teachers.
In fact, teachers always adapt programs to their local needs, even if this adaptation is
not always in keeping with designers’ intention. Earlier research on instructional reforms
8-1

GLOBE Evaluation Year 6 – Chapter 8: Discussion
has demonstrated that teachers are key agents in transforming educational reform
initiatives and policy to produce classroom practices with positive student outcomes. In
implementing any curriculum or policy reform, teachers draw on their own
understandings, beliefs, and practices, as well as the resources provided by the school and
other supporting organizations (Cohen & Hill, 1998; Knapp, 1997; McLaughlin &
Talbert, 1993; Spillane, 1999).
In GLOBE, we have found that the primary emphasis of many teachers is on having
students practice doing science. These teachers want students to experience the inquiry
process, either by observation or by participating in it directly. GLOBE data collection is
an activity of scientists; collecting and, especially, reporting data are avenues for
practicing the doing of science. GLOBE was more than just about practicing the doing of
science for these students and their teachers, it was about contributing to science. When
schools place importance on providing students the opportunity to contribute to science,
the GLOBE Program realizes not only its science education goals but also its scientific
goals. Our case study data are consistent with our analyses of GLOBE teacher surveys
from Year 5, in which we found that teachers’ belief that the value of GLOBE lies more
in taking data than in reporting data is associated with not reporting data to the GLOBE
Data Archive.
School-Level Factors Shape GLOBE Implementation
Researchers of reform have pointed to school-level factors in shaping teachers’
implementation of reform. The school context, these researchers have found, shapes
whether and to what extent teachers implement reforms that require them to change their
practice in some way. Some of the factors studied include teachers’ autonomy within the
school and professional climate (see Bryk, Sebring, Kerbow, Rollow, & Easton, 1998).
Other factors, like administrative support for teachers implementing reforms, have also
been examined (Fullan & Stiegelbauer, 1991).
For GLOBE, schools’ priorities for science education and grade-level variations in
how science is organized at a school have a strong influence on teachers’ goals for
implementing the Program. For example, a teacher whose school emphasizes “hands-on”
science may place a strong emphasis on using GLOBE to teach what “doing science”
8-2

GLOBE Evaluation Year 6 – Chapter 8. Discussion
means. By contrast, a school that is involved in a data collection effort designed to
inform decision-makers in its community about an environmental issue may be involved
in GLOBE in order to contribute to science. The relative value that GLOBE teachers
place on reporting data will also be influenced by this contextual variable—if there is no
particular project or learning activity to which data reporting will contribute, teachers are
less likely to see data reporting as a valuable educational activity in its own right.
In 2000-01, we visited six schools that have different cultures, each of which
contributed to how teachers perceived GLOBE. To the extent that teachers were “on
their own” in implementing GLOBE at their schools, GLOBE activities were likely to be
implemented only to the extent that the teachers were personally inspired by the Program.
They faced a much greater burden than teachers whose schools placed a priority on the
kinds of hands-on science learning activities that GLOBE provides to students. In
schools where GLOBE was considered a whole-school program and more than one
teacher was involved in GLOBE, moreover, the work of data collection and reporting
could be distributed across multiple teachers, increasing the likelihood that data is
reported more consistently.
Factors External to the School Shape Implementation
Teachers’ curricular choices are shaped not only by school-level factors but also by
factors external to the school (Fullan & Stiegelbauer, 1991). State- and district-level
policies, including testing and accountability programs, can affect the degree to which
teachers implement reforms, to the degree these reforms are perceived to be well-aligned
with the intended policies (Garet et al., 2001). Teachers’ say in these policies can have
an impact on their implementation, as well (Bryk et al., 1998).
Our case studies pointed to two key dimensions related to standards and testing that
seem to influence GLOBE implementation: teachers’ involvement in defining standards,
and perceived alignment of standards with testing. In schools where teachers were
involved in developing standards themselves, they felt much greater freedom to use
GLOBE as a resource, not only in their classrooms but to help guide the development of
curricular objectives that would be codified in standards. In parochial schools and in
schools perceived as leaders in environmental science, some GLOBE teachers have this
8-3

GLOBE Evaluation Year 6 – Chapter 8: Discussion
kind of autonomy. Elsewhere, however, teachers have not been involved in standards-
setting activities and find themselves in the position of having to find ways that GLOBE
aligns with their standards and testing systems.
In several of the schools we visited, teachers saw the state testing system as not
particularly well aligned with the science standards, which they often endorsed. In North
Carolina, for example, students must take challenging exit exams to advance to high
school at the end of middle school, but science content makes up no more than 10% of
these examinations. Despite the emphasis in the standards on GLOBE content, then,
there is little state-level accountability to motivate teaching of that content, and some
teachers reported that they do much more test preparation and focus more on reading and
mathematics in the spring months, as state-mandated accountability tests approach.
Teachers working in these contexts face special challenges in trying to implement
GLOBE and demonstrate how GLOBE can result in progress on standardized tests in
reading and mathematics.
Teachers’ Ongoing Opportunities to Learn to Shape Implementation
Successfully preparing teachers to implement particular reforms depends on teacher
opportunities to learn about the reforms’ goals and strategies and to gain access to
exemplars of teaching that reflect the reform goals (Cohen & Hill, 1998). Teachers’
opportunities to learn about reforms often take place within workshops, institutes, and
training sessions. Both the amount and duration of these activities significantly affect
teacher learning (Garet et al., 2001; Supovitz & Turner, 2000). Teachers also often
engage in significant learning as they implement reforms, after they have received their
initial training. Coaching and mentoring have been found to be effective forms of teacher
professional development as teachers implement reforms (Darling-Hammond, 1995,
1996; Hargreaves & Fullan, 1992; Sparks & Loucks-Horsley, 1989).
A key reason why the numbers of GLOBE schools reporting data declined more
rapidly in April and May 2001 than in previous years was the decline in teachers’
opportunities to learn about GLOBE through GLOBE training. The number of new
GLOBE teachers trained declined by more than half in the past year, and the number of
months between time trained and first data reports increased significantly. United States
8-4

GLOBE Evaluation Year 6 – Chapter 8. Discussion
partners interviewed as part of a separate study undertaken by the GLOBE office reported
that funding continues to be a major concern for partners and that partners are spending
more of their limited resources on follow-up and encouraging schools to increase data
reporting than on training new teachers.
Although attrition from the Program (as measured by data-reporting trends) is
declining, it is not declining nearly as fast as the rate of new-teacher training. Hence, the
number of new teachers trained is not great enough to offset attrition. Therefore,
partners’ shift in emphasis in their activities has had a significant impact on the overall
slowing of program growth, as measured by number of teachers trained or number of
pieces of data reported. It appears to be having the desired effect on reducing attrition,
however, resulting in longer-term, more consistent implementations and data sets. These
outcomes are considered more important than the number of teachers trained or the
number of data reports per se.
An analysis of posttraining teacher supports suggests that the most valuable resources
to teachers are on-site mentoring and the materials and other incentives provided to make
GLOBE implementation easier. Teachers who made use of these supports from United
States or international partners or elsewhere were much more likely to report data and at
higher levels than those who did not. It appears, however, that the impact of providing
teachers with such supports is limited to the year in which they are provided: none of the
supports teachers said they used in 1999-2000 predicted whether GLOBE schools
persisted in reporting data in 2000-01.
What is particularly important to note is that some of the supports more commonly
available to teachers after training, such as listservs and newsletters, do not appear to
make a difference as to whether schools report data or not. By contrast, providing direct
mentoring assistance by having a GLOBE partner staff person or an experienced GLOBE
teacher visit a GLOBE teacher or providing incentives and equipment to teachers does
have a strong effect on data reporting. Interestingly, these are less frequently available
supports than ongoing communication with trainers and other GLOBE teachers through
listservs and newsletters.
8-5
GLOBE Evaluation Year 6 – Chapter 8: Discussion
Research Guideposts for the Future of GLOBE
As a science program, GLOBE has always placed a strong emphasis in its teacher
training on knowledge of the scientific concepts and procedures needed to implement the
Program. Such a focus is important, because data collected by students must be valid and
reliable to be of use to scientists in their investigations. But GLOBE is increasingly
interested in improving the level of data reporting among schools, a key indicator of the
fidelity of implementation. To understand what it takes to implement GLOBE, however,
requires providing teachers with opportunities both to acquire the science concepts that
underlie GLOBE and to reflect on how students might learn those concepts through
GLOBE participation.
In addition to providing opportunities for teachers to reflect on implementation with
students, recent research has pointed to the need to focus teacher professional
development on what Shulman (1987) has called pedagogical content knowledge.
Pedagogical content knowledge includes knowledge about students and how they learn,
differences in teaching materials and their affordances, schools and their cultures, and
different perspectives on curriculum design. Teachers need to know more than just
“pedagogy” and “content”; they need to know about challenges and strategies for
teaching in particular content areas and how one content area may differ from another.
GLOBE partners to date have emphasized science content knowledge rather than
pedagogical content knowledge, as evidenced by their reports of how they divide time
spent in training (Means et al., 1999). They have relied on teacher-trainers to shape
pedagogical content knowledge primarily toward the end of GLOBE training sessions
and informally during breaks in the formal training schedule. Judging by how important
this kind of knowledge is in shaping implementation, teacher preparation for GLOBE
might benefit from greater and more sustained focus on pedagogical content knowledge.
Other research on science teaching supports this perspective. For example, van Driel,
Verloop, and de Vos (1998) found empirical research that supports the effectiveness of
preparing teachers to teach subject matter by focusing on that subject matter from the
viewpoint of how it could be taught to different groups of students. Part of this focus can
and does take place after training, in the form of on-site supports to GLOBE teachers.
Our finding that incentives, mentoring, and other on-site support to teachers have the
8-6

GLOBE Evaluation Year 6 – Chapter 8. Discussion
greatest impact on data-reporting levels suggests that partners may succeed in their
efforts to sustain GLOBE teachers’ involvement in the Program by providing more
access to such supports. At present, these supports are less ubiquitous than listservs and
e-mail communication with teachers after GLOBE training, but they seem to have more
impact on whether teachers implement GLOBE or not. In posttraining teacher
mentorship programs offered by partners, the close attention paid to local school contexts
and how they shape possible forms of GLOBE implementation seems to pay off. The
payoff, moreover, may help to shape teachers’ pedagogical content knowledge with
respect to implementing GLOBE in their particular schools and with their unique groups
of students. It may be especially beneficial if training offered by partners also addresses
the particulars of the local environment near teachers’ schools, so that students’ learning
about the environment is focused around scientific investigations of issues of central
importance to their communities.
As the GLOBE Program places more and more emphasis on student inquiry with
GLOBE data, even more attention may need to be paid to the pedagogical content
knowledge and supports needed to prepare teachers to lead student inquiry. Previous
research on preparing teachers to support student inquiry in science has emphasized the
importance of opportunities for teachers to do science themselves, contribute to a
scientific endeavor, and discuss scientific ideas with others (Flick, 1990; NRC, 2000).
This research has also noted that providing teachers with opportunities to collaborate with
other teachers implementing inquiry is important (Linn & Hsi, 2000), as is teachers’
understanding of science content (Dobey & Shafer, 1984).
The pedagogical content knowledge teachers need to implement inquiry with GLOBE
is far from trivial. Structuring student inquiry in the classroom is not easy. Among other
necessary skills, leading or supporting student inquiry will require teachers to be able to
help students define relevant questions about data, structure conversations about trends
and interpretations of data, and develop skills in writing and communicating results of an
inquiry. In the context of classes that last 40 minutes or less, teachers have the added
challenge of structuring inquiry across multiple sessions or school days and maintaining
continuity in students’ learning experiences. The GLOBE Program has developed a
number of resources that will be helpful to teachers in preparing them to structure student
8-7
GLOBE Evaluation Year 6 – Chapter 8: Discussion
inquiry. A CD-ROM has been developed in the past year with specific ideas for how
teachers and students can answer questions about GLOBE data. More emphasis in train-
the-trainer sessions is being placed on inquiry. And new assessments being developed to
support GLOBE materials are all expected to be aligned with the NSES Inquiry
standards. No doubt, teachers will need help utilizing these new resources in ways that
localize inquiry, and integrate it into existing curricular activities. Efforts to shape
teachers’ pedagogical content knowledge in training sessions and in posttraining follow-
up will be essential.
8-8

References
Bryk, A., Sebring, P., Kerbow, D., Rollow, S., & Easton, J. (1998). Charting Chicago school reform. Boulder, CO: Westview.
Cohen, D. K., & Hill, H. C. (1998). Instructional policy and classroom performance: The mathematics reform in California (RR-39). Philadelphia: Consortium for Policy Research in Education.
Congalton, R. G., Rowe, R. J., & Becker, M. (2001, July). Using GLOBE student-collected MUC-A-Thon data to aid in assessing the accuracy of a Landsat Thematic Mapper-derived land cover map of Dutchess County, New York. Paper presented at the Sixth Annual GLOBE Conference, Blaine, WA.
Conroy, C. A. (2001). GLOBE US Partners Team Partner Preliminary Needs Assessment. Washington, DC: GLOBE.
Darling-Hammond, L. (1996). What matters most: A competent teacher for every child. Phi Delta Kappan, 78(3), 193-200.
Darling-Hammond, L. (1995). Changing conceptions of teaching and teacher development. Teacher Education Quarterly, 22(4), 9-26.
Dobey, D. C., & Shafer, L. E. (1984). The effects of knowledge on elementary science inquiry teaching. Science Education, 68, 39-51.
Flick, L. (1990, April). Affecting preservice elementary teachers’ attitudes toward inquiry teaching in science through projects with individual children. Paper presented at the Annual Meeting of the National Association for Research in Science Teaching, Atlanta, GA.
Fullan, M., & Stiegelbauer, S. (1991). The new meaning of educational change. New York: Teachers College Press.
Garet, M. S., Porter, A. C., Desimone, L., Birman, B. F., & Yoon, K. S. (2001). What makes professional development effective? Results from a national sample of teachers. American Educational Research Journal, 38(4), 915-945.
Glidden, H., Masur, M. D., & Snowden, J. B. (1999). Making standards matter. Washington, DC: American Federation of Teachers.
Kikas, U. (2001). Country Report: Estonia. Paper presented at the Sixth Annual GLOBE Conference, Blaine, WA.
Hargreaves, A., & Fullan, M. G. (1992). Understanding teacher development. London: Cassell.
Knapp, M. S. (1997). Between systemic reforms and the mathematics and science classroom: The dynamics of innovation, implementation, and professional learning. Review of Educational Research, 76(2), 227-266.
Linn, M., & Hsi, S. (2000). Computers, teachers, peers: Science learning partners. Mahwah, NJ: Erlbaum.
R-1

Loucks, S. (1983). Ensuring success: Good news from a study of school improvement [Special issue]. Educational Leadership, 41(3), .
McLaughlin, M. W., & Talbert, J. E. (1993). Teaching for understanding: Challenges for policy and practice. San Francisco: Jossey-Bass.
Means, B., Coleman, E. B., Baisden, K., Haertel, G., Korbak, C., Lewis, A., McGhee, R., Penuel, W. R., & Valdes, K. (1999). GLOBE Year 4 evaluation: Evolving implementation practices. Menlo Park, CA: SRI International.
Means, B., Coleman, E., Lewis, A., Quellmalz, E., Marder, C., & Valdes, K. (1997). GLOBE Year 2 evaluation: Implementation and progress. Menlo Park, CA: SRI International.
Means, B. & Olson, K. (1995). Technology’s role for education reform: Findings from a national study of innovating schools. Washington, DC: U.S. Department of Education.
National Research Council (NRC) (2000). Inquiry and the National Science Education Standards: A guide for teaching and learning. Washington, DC: National Academy Press.
National Research Council (NRC) (1996). National Science Education Standards. Washington, DC: National Academy Press.
Penuel, W. R. and V. M. Crawford (2001, July). Developing a GLOBE assessment in North Carolina. Paper presented at the Sixth Annual GLOBE Conference, Blaine, WA.
Shulman, L. (1987). Knowledge and teaching: Foundations of the new reform. Harvard Educational Review, 57, 1-22.
Sparks, D., & Loucks-Horsley, S. (1989, Fall). Five models of staff development for teachers. Journal of Staff Development, 10(4), 40-57.
Spillane, J. P. (1999). External reform initiatives and teachers’ efforts to reconstruct their practice: The mediating role of teachers’ zones of enactment. Journal of Curriculum Studies, 31(2), 143-175.
Supovitz, J. A., & Turner, H. M. (2000). The effects of professional development on science teaching practices and classroom culture. Journal of Research in Science Teaching, 37(9), 963-980.
van Driel, J. H., Verloop, N., & de Vos, W. (1998). Developing science teachers’ pedagogical content knowledge. Journal of Research in Science Teaching, 35, 673-695.
R-2

Appendix A
A-1


Appendix B
B-1

Appendix C
C-1


Appendix D
D-1