globalized business of japanese multinationals in latin
TRANSCRIPT

DP2021-18
Globalized Business of Japanese Mult inat ionals in Lat in America: What Trade and Investment Stat ist ics Do Not Show*
Mik io KUWAYAMA
Revised October 18, 2021
* The Discussion Papers are a series of research papers in their draft form, circulated to encourage discussion and comment. Citation and use of such a paper should take account of its provisional character. In some cases, a written consent of the author may be required.

2
Globalized business of Japanese multinationals in Latin America:
What trade and investment statistics do not show*
Mikio Kuwayama
ABSTRACT China has displaced Japan as the most important Asian trading partner for the Latin American and the Caribbean (LAC) region since the turn of the century. However, this rather pessimistic view of the Japan-LAC commercial relationship based on bilateral trade statistics drastically changes when business activities of Japanese subsidiaries and affiliates (S&As) operating in the LAC region are considered. Extrapolating from the annual surveys of “Basic Survey on Overseas Business Activities” conducted by Japan’s Ministry of Economy, Trade, and Industry (METI), this paper brings to light highly globalized and multi-faceted business operations by Japanese multinational companies operating in LAC, the scale of which goes far beyond the magnitude indicated by Japan’s official trade and investment statistics. Notably, a significant part of their global business is exported to, or sourced from, third countries, which significantly underestimates the scale of trade and investment by these S&As in the LAC region. At the same time, almost half of their sales are directed to domestic/local markets of LAC countries, whereas sales back to Japan are minimal. This paper also evaluates the Japanese S&As performance in LAC with that in other regions (the ASEAN countries in particular), with respect to: 1) industrial/sectoral distribution of their sales and procurements, 2) export orientation, and 3) capital investment, R&D expenditure, and ordinary profit. The paper also points out several distinctive features of S&As business in Brazil and Mexico, their two major host countries in the region.
----------------------------------------------------------- */ Mikio Kuwayama is Research Fellow of the Research Institute for Economics and Business Administration, Kobe University (RIEB) and Managing Director of the Japan Association of Latin America and the Caribbean (JALAC). This paper has benefited from valuable comments by Professor Nobuaki Hamaguchi and Associate Professor Yoshimichi Murakami, both of Kobe University. The author is responsible for any errors or omissions. This paper has not undergone formal editing. Please do not cite or distribute without the permission of the author.

3
I. Introduction
Although Latin America and the Caribbean (LAC) trade with Japan has not been as
buoyant compared to that with China in recent years, Japan’s trade relations with the
region show several “qualitative” features, which distinguish Japan from China and other
Asian countries, namely: 1) LAC’s export-basket to Japan is more diversified than that of
China, with the former incorporating in the basket some non-traditional and manufactured
products, 2) LAC’s product composition of exports to Japan is more diversified in terms
of exporting countries in LAC (in the case of China, the share of Brazil is relatively high),
3) the overall trade balance is more favorable for LAC countries with Japan (Kuwayama
2015, 2019),1 and 4) Japan’s public sector has been behind the emblematic export success
stories, such as in Brazil’s soybeans and maize (Hosono et al. 2015), Chile’s salmon (Hosono et al. 2016), and Paraguay’s agroindustry complex (JICA/ECLAC 2014), in
addition to the development of global value chains (GVCs) in Mexico’s automotive sector.
Such achievements result from efforts based on interactions between Japan’s public-
private partnership (PPP) efforts and those of Latin American counterparts (Myers and
Kuwayama 2016, Myers and Hosono 2019).
An additional yet probably a more significant feature of Japan’s commercial relations
with LAC points to the importance of subsidiaries and affiliates (S&As) of Japanese
companies operating in the region (Kuwayama 2019). As argued in this paper, sales by
these companies in LAC’s domestic markets and their exports to third countries are much
larger than S&As exports back to Japan. These observations reveal a very diversified,
multi-faceted, and globalized nature of their business operations in that region. In addition,
these companies show a high propensity to export, especially in the automotive sector
and, to a lesser extent, in manufacturing sectors of metal products, electrical machinery,
chemicals, and foods as well as wholesale and retail trade, services, transport, agriculture,
forestry and fishery in non-manufacturing sectors. Thanks to the long-engagement in
LAC’s manufacturing sectors, their business contributes to employment creation, export
1 Countries such as Bolivia, Chile, and Peru even register a trade surplus with Japan, and when the balance is negative, the size of the deficit is much smaller than with China. In the case of China, the deficit with Mexico has reached an alarming level while Japan continues to expand its trade with the Aztecan country, which has transformed into a major hub of global value chains, especially of the automotive industry.

4
expansion (thereby foreign exchange earnings), and the development of global and
regional value-chains in the region. Japan’s foreign direct investment (FDI), which has
likely acted as a substitute for goods trade in some cases, brings significant benefits for
LAC countries: cutting-edge technology, know-how, employment opportunities, and
foreign exchange earnings (Kuwayama 2015; IDB 2013; IDB 2016).
This paper aims to provide evidence that business activities of Japanese S&As in LAC
are not only highly globalized but also much more complex than what Japan’s official
trade and investment statistics with the LAC region might indicate. This paper will show
that when measured in dollar terms, business operations by Japanese S&As in LAC are
almost triple the size of LAC’s bilateral trade with Japan, a very relevant yet little known
aspect of Japan’s engagement in LAC’s trade and investment.
Following the introductory remarks, Section II will show the rapidly increasing
importance of the Asia-Pacific as a trading partner region for the LAC region over the
last 20 years, catching up with the United States and surpassing the European Union (28)
and LAC countries themselves (LAC intra-regional trade). In this section, LAC’s trade
performance with Japan is also compared to other major trading partners from Asia
(China, the Republic of Korea, the ASEAN countries, and India) to show that not only
Japan has been displaced by China in LAC trade with the Asia Pacific over the years but
also Japan’s presence in that trade has been gradually overtaken by the ASEAN member
countries in recent years.
Against the backdrop of Japan’s declining importance as a LAC’s trading partner,
Chapter III tries to quantify the size of business activities of Japanese S&As operating in
LAC, based on information from the “Basic Survey on Overseas Business Activities”
conducted annually by Japan’s Ministry of Economy, Trade, and Industry (METI 2007-
2021). In Chapter IV, based on the data from the METI’s annual surveys and Japan’s
official statistics of foreign direct investment (FDI), Japanese S&As activities in Brazil
and Mexico, the two largest economies and their most important markets in the LAC
region, are compared to shed light on a distinctive sectoral orientation and business focus
adopted by the S&As between the two countries. The paper ends with a summary of
preliminary findings and conclusions.
5
II. Changing patterns of Trade Relations between Latin America and the
Caribbean and Asia-Pacific regions
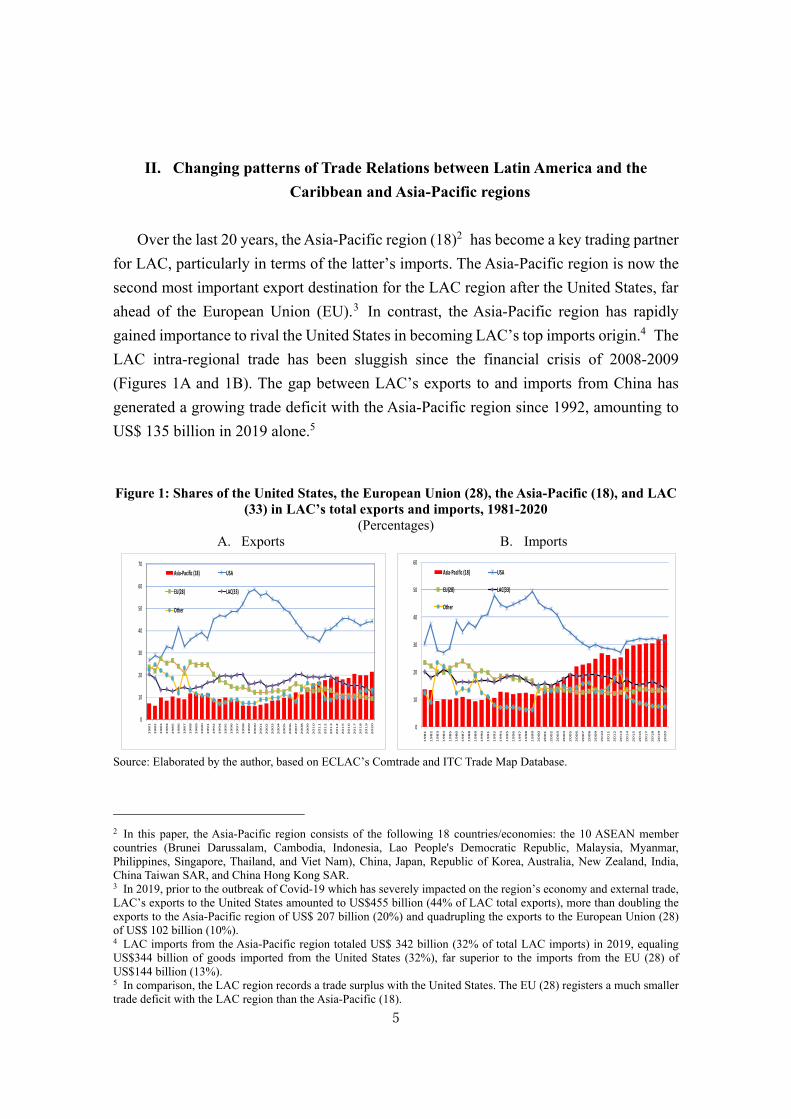
Over the last 20 years, the Asia-Pacific region (18)2 has become a key trading partner
for LAC, particularly in terms of the latter’s imports. The Asia-Pacific region is now the
second most important export destination for the LAC region after the United States, far
ahead of the European Union (EU).3 In contrast, the Asia-Pacific region has rapidly
gained importance to rival the United States in becoming LAC’s top imports origin.4 The
LAC intra-regional trade has been sluggish since the financial crisis of 2008-2009
(Figures 1A and 1B). The gap between LAC’s exports to and imports from China has
generated a growing trade deficit with the Asia-Pacific region since 1992, amounting to
US$ 135 billion in 2019 alone.5 Figure 1: Shares of the United States, the European Union (28), the Asia-Pacific (18), and LAC
(33) in LAC’s total exports and imports, 1981-2020 (Percentages)
A. Exports B. Imports
0
10
20
30
40
50
60
70
1981
1982
1983
1984
1985
1986
1987
1988
1989
1990
1991
1992
1994
1995
1996
1997
1998
1999
2000
2001
2002
2003
2004
2005
2006
2007
2008
2009
2010
2011
2012
2013
2014
2015
2016
2017
2018
2019
2020
Asia‐Pacific (18) USA
EU(28) LAC(33)
Other
0
10
20
30
40
50
60
1981
1982
1983
1984
1985
1986
1987
1988
1989
1990
1991
1992
1994
1995
1996
1997
1998
1999
2000
2001
2002
2003
2004
2005
2006
2007
2008
2009
2010
2011
2012
2013
2014
2015
2016
2017
2018
2019
2020
Asia‐Pacific (18) USA
EU(28) LAC(33)
Other
Source: Elaborated by the author, based on ECLAC’s Comtrade and ITC Trade Map Database.
2 In this paper, the Asia-Pacific region consists of the following 18 countries/economies: the 10 ASEAN member countries (Brunei Darussalam, Cambodia, Indonesia, Lao People's Democratic Republic, Malaysia, Myanmar, Philippines, Singapore, Thailand, and Viet Nam), China, Japan, Republic of Korea, Australia, New Zealand, India, China Taiwan SAR, and China Hong Kong SAR. 3 In 2019, prior to the outbreak of Covid-19 which has severely impacted on the region’s economy and external trade, LAC’s exports to the United States amounted to US$455 billion (44% of LAC total exports), more than doubling the exports to the Asia-Pacific region of US$ 207 billion (20%) and quadrupling the exports to the European Union (28) of US$ 102 billion (10%). 4 LAC imports from the Asia-Pacific region totaled US$ 342 billion (32% of total LAC imports) in 2019, equaling US$344 billion of goods imported from the United States (32%), far superior to the imports from the EU (28) of US$144 billion (13%). 5 In comparison, the LAC region records a trade surplus with the United States. The EU (28) registers a much smaller trade deficit with the LAC region than the Asia-Pacific (18).

6
A. Japan’s displacement by China as Asia’s major trading partner in LAC
In LAC’s trade dynamics described above, Japan has been quickly displaced by China
as the region’s leading trade partner in Asia since the turn of the century (Rosales and
Kuwayama 2012, Kuwayama 2019, Hamaguchi 2018). In 2019, LAC’s exports to and
imports from China reached US$ 128 billion and US$ 196 billion, with corresponding
shares of 62% and 56% of the region’s exports to and imports from the 18
countries/economies of the Asia-Pacific, respectively. LAC’s imports from China have
grown at a faster pace than their exports to the Asian country, and as a result, LAC’s trade
deficit with China has been increasing in the aftermath of the financial crisis of 2008-
2009. A large part of the region’s deficit is closely related to Mexico's rapidly increasing
trade deficit with China. Furthermore, the ten countries of the Association of South-East
Asian Nations (ASEAN) have gained on and even overtaken Japan and the Republic of
Korea as a source of imports for LAC and a destination for the region’s exports (Figure
2A and 2B).
Figure 2: Exports and imports shares of selected Asian countries in LAC (33) and the Asia-Pacific (18) trade, 1981-2020
(Percentages) B. Exports C. Imports
Source: Elaborated by the author based on Comtrade and ITC Trade Map database.
Japan was the largest Asian trading partner (both in exports and imports) for the LAC
region until 2003, when China, for the first time, displaced Japan in that region.
Specifically, Japan accounted for 51% and 57% of total LAC exports and imports,
respectively, with the Asia-Pacific region in 1991. LAC’s trade (exports and imports) with
Japan totaled US$ 23 billion, surpassing US$ 19 billion of LAC trade with China even in
0
10
20
30
40
50
60
70
80
1981
1982
1983
1984
1985
1986
1987
1988
1989
1990
1991
1992
1994
1995
1996
1997
1998
1999
2000
2001
2002
2003
2004
2005
2006
2007
2008
2009
2010
2011
2012
2013
2014
2015
2016
2017
2018
2019
2020
China Japan Korea, Rep. of ASEAN(10) India
0
10
20
30
40
50
60
70
80
1981
1982
1983
1984
1985
1986
1987
1988
1989
1990
1991
1992
1994
1995
1996
1997
1998
1999
2000
2001
2002
2003
2004
2005
2006
2007
2008
2009
2010
2011
2012
2013
2014
2015
2016
2017
2018
2019
2020
China Japan Korea, Rep. of ASEAN(10) India

7
2002. As observed in Figures 2A and 2B, the displacement process of Japan by China
started during LAC’s “Golden Years” of 2003-2013, interrupted shortly by the Lehman-
crisis of 2008-2009, and then accelerated until the outbreak of Covid-19. Even in 2020,
when the region’s trade plummeted due to the pandemic, the region’s exports to China
suffered a minimal decline when LAC’s exports to other Asian countries experienced a
sharp fall (ECLAC 2021b).
Reflecting Japan’s relative decline as a trading partner for the LAC region since the
turn of the century, Japan’s share in total LAC exports to and imports from the Asia-
Pacific (18) in 2019 stood at 9.7% and 10.3%, even below the figures recorded by the
ASEAN (10) countries of 11.7% and 15.1%, respectively. The annual average bilateral
trade (exports and imports combined) with China reached US$ 282 billion during the four
calendar-year CY2016-CY2019 period, which is more than five times Japan’s trade with
the region of approximately US$ 52 billion. LAC’s exports to and imports from Japan
were smaller than that of ASEAN’s total of US$ 71 billion during the same period.
Japan’s trade, however, surpassed the Republic of Korea’s total of US$ 44 billion and
India’s total of US$ 30 billion (Figures 3).
Figure 3: LAC’s trade with major trading partners in Asia, annual average CY2016-CY2019
(Exports and Imports, US$ billions)
Source: The Author’s elaboration based on Comtrade and Trade Map database.

8
In short, whereas Japan was the largest Asian trading partner (both supplier and buyer)
of the LAC region in the 1980s and 1990s, China is currently the dominant trading partner,
both in the region’s exports and imports. Regarding LAC exports to the Asia-Pacific
region, China’s presence is unparalleled: at present, almost 62% of LAC exports to that
region are destined to China. Though to a lesser extent, China’s presence in LAC’s
imports is also overwhelming: close to 56% of LAC’s imports from that region originate
from China.
B. Comparison between LAC-Japan trade vs. sales and procurements by Japanese
S&As in LAC
The rather pessimistic view on Japan’s trade relations with LAC changes when
business activities of Japanese S&As operating in the region are taken into account. As
argued in this paper, the scale of business of Japanese S&As in LAC is quite impressive,
but only a small fraction of that trade is registered in LAC’s bilateral trade statistics with
Japan. A significant part of their global business resources is exported to, or sourced from,
third countries, and this leads to significantly underestimating the magnitude of trade and
investment by these S&As in the LAC region.
For example, the average annual exports to third-country markets by the Japanese
S&As operating in LAC during the four fiscal-year period of FY2016-FY2019 (each
fiscal year starting April 1 and ending on March 31 of the following year) amounted to
US$ 55 billion, accounting for 50% of their total sales (US$ 110 billion). In addition,
during the same period, almost 45% of total sales (US$ 49 billion) corresponded to sales
made in LAC’s domestic/local markets. Sales back to Japan accounted for only 5% of
their total sales (US$ 6 billion) of total S&As sales in LAC. Only a small portion of S&As
business form part of LAC’s bilateral trade statistics with Japan.
On a similar note, the scale of procurements (purchases) by these Japanese S&As in
LAC is also impressive; these firms operating in LAC sourced approximately US$ 65
billion worth of inputs and materials as the annual average during the same four-year
period, with 46% of these procurements being supplied from LAC domestic/local markets
(US$ 30 billion) and 19% from third-country markets (US$ 12 billion) (Figure 4). The
remaining 35% of procurements (US$ 23 billion) were sourced directly from Japan.

9
Although bilateral trade values (recorded by the calendar year) and business
transactions values of these S&As (by the fiscal year) are not strictly comparable, the
scale of S&As’ activities is overwhelming: 1) the annual average during the four-year
period FY2016-FY2019 of sales back to Japan and imports sourced directly from Japan,
2) exports to and imports from third countries, and 3) sales and procurements in domestic
markets, totaled US$ 175 billion, almost tripling LAC’s bilateral trade (exports and
imports combined) with Japan of US 52 billion indicated earlier in Figure 3. These
observations suggest that, in addition to boosting trade between LAC and third countries
and thereby contributing to the country’s foreign exchange earnings, these firms bring not
only logistical, marketing, and distribution expertise but also significant investment and
finance resources to the region (ECLAC 2010: IDB 2013). However, it should be
reminded that activities of these companies with third-country markets and LAC’s
domestic markets are not captured in the LAC-Japan bilateral trade and investment
statistics.
Figure 4: Comparison between LAC- Japan bilateral trade (CY2016-CY20119)
and scale of business activities of Japanese S&As in LAC (FY2016-FY2019)
(Annual Averages in US$ billions)
Source: Author’s elaboration based on information from Japan, METI (Ministry of Economy, Trade and Industry of Japan), “kaigai jigyo katsudo kihon chosa” [The Basic Survey on Overseas Business Activities] Nos. 47-50.
The following chapters will provide a more detailed analysis of the business activities
of overseas Japanese S&As worldwide and LAC, in particular, to illustrate the scale and
complexity of their business, which goes far beyond official trade and investment
statistics.

10
III. Operations of Japanese companies’ subsidiaries and affiliates in
Latin America and the Caribbean
“The Basic Survey on Overseas Business Activities,” which is conducted and
published annually (each fiscal year beginning April 1 and ending March 31 of the
following year) by Japan’s Ministry of Economy, Trade, and Industry (METI various
years) shows business activities by overseas Japanese subsidiaries and affiliates (S&As)6
are not only highly globalized but also much more complex and multi-faceted than what
Japan’s and LAC countries’ official trade and investment statistics might indicate. A. Japanese S&As in LAC in a global context
The annual average number of overseas Japanese S&As worldwide during a four
year-period (FY 2016-FY2019) covered by the above-mentioned annual surveys totaled
some 25,500 firms, excluding those S&As in the finance, insurance, and real estate sectors.
During the four-year period, roughly 67% of these firms were in Asia (approx. 17,000),
with a breakdown of 25% in Mainland China alone (6,400), 28% in ASEAN (10) 7
(7,000), and 5% in the three NIEs3 countries/economies (2,850) (i.e., China Taiwan SAR,
Republic of Korea, and Singapore). The corresponding figures for North America (the
United States and Canada) and the EU were much lower, 13% (3,250) and 10% (2,600),
respectively (Table 1).
Some 1,400 Japanese S&As operating in the LAC region were covered in the surveys
during the four-year period, equivalent to 6% of the number of firms worldwide (Table
1). In that region, Mexico (391 firms as the annual average of the four-year period),
Panama (385), Brazil (306), Chile (64), Argentina (33), Colombia (25), and Peru (25)
have been among principal host countries of these Japanese companies. The number of
S&As in LAC continued to increase until FY2018 (1,457 firms) and then decreased by
67 firms in the following fiscal year.
6 The term, "subsidiary and affiliates", in this survey refers to the overseas subsidiaries and affiliates that meet the following conditions: Overseas subsidiaries that are foreign corporations with a Japanese investment ratio of 10% or more, and overseas affiliates are foreign corporations with a Japanese investment ratio of 50% or more. 7 One of the regional groupings included in the METI survey is ASEAN (4), comprised of Indonesia, Malaysia, Philippines, and Thailand. In this paper, whenever possible, the LAC region is compared to ASEAN (10), consisted of the following 10 member countries: Brunei Darussalam, Cambodia, Indonesia, Lao People’s Democratic Republic, Malaysia, Myanmar, Philippines, Singapore, Thailand, and Viet Nam. The combined GDP of ASEAN (10) in 2019 totaled US$ 3,170 billion, roughly 55% of LAC’s GDP of US$ 5,790 billion. Total exports of goods and services of ASEAN (10) totaled US$ 1,850 billion, surpassing LAC’s US$ 1,380 billion.

11
The annual average sales by overseas Japanese S&As worldwide during the four-year
period totaled ¥241 trillion, or US$ 2.50 trillion. Total sales in US dollars and Japanese
yen fluctuate year to year depending on the international business climate and exchange
rates. For example, sales worldwide in FY2019 amounted to ¥ 263 trillion, down by 9.6%
from the previous fiscal year, when calculated in terms of yens. The decline was smaller
in terms of US dollars, down by 1.3% from US$ 2.63 trillion to US$ 2.41 trillion. The
annual average sales in the LAC region during the four-year period amounted to US$ 110
billion, an equivalent of 4.4% of total overseas S&As sales worldwide (Table 1).
Table 1: Select indicators of overseas Japanese subsidiaries and affiliates,
by geographical regions, annual average (FY2016-FY2019) (Number of firms, persons, in $US million, percentages)
Regions
World 25,480 100.0 5,807,881 100.0 2,496,242 100.0 1,577,310 100.0 112,076 100.0 86,704 100.0 73,541 100.0
North America 3,252 12.8 780,063 13.4 822,012 32.9 502,386 31.9 20,239 18.1 16,789 19.4 32,316 43.9
Latin America andthe Caribbean
1,413 5.5 329,212 5.7 109,669 4.4 65,251 4.1 6,299 5.6 2,996 3.5 5,665 7.7
Asia 17,053 66.9 3,985,736 68.6 1,111,300 44.5 736,892 46.7 59,645 53.2 47,106 54.3 23,915 32.5
Mainland China 6,406 25.1 1,397,488 24.1 390,939 15.7 259,635 16.5 24,308 21.7 18,991 21.9 7,536 10.2
ASEAN(10) 7,057 27.7 2,057,712 35.4 505,976 20.3 329,605 20.9 23,464 20.9 18,774 21.7 12,010 16.3
NIEs3 2,853 11.2 311,943 5.4 234,879 9.4 150,277 9.5 9,535 8.5 7,611 8.8 3,404 4.6
Middle East 153 0.6 18,448 0.3 16,072 0.6 8,967 0.6 1,761 1.6 1,584 1.8 427 0.6
EU 2,606 10.2 557,408 9.6 317,611 12.7 194,407 12.3 12,979 11.6 9,661 11.1 7,358 10.0
Oceania 563 2.2 44,318 0.8 61,429 2.5 33,549 2.1 9,921 8.9 7,829 9.0 2,886 3.9
Africa 172 0.7 39,176 0.7 15,600 0.6 10,629 0.7 144 0.1 122 0.1 344 0.5
Capital investment(US$ million)
No. of affiliatedfirms
No. of employees(persons)
Total sales(US$ million)
Total procurements(US$ million)
Ordinary profits(US$ milions)
Current net profits(US$ million)
Source: Author’s elaboration based on information from Japan, METI (Ministry of Economy, Trade and Industry of Japan), “kaigai jigyo katsudo kihon chosa” [The Basic Survey on Overseas Business Activities] ibid., Nos. 47-50.
Despite a decline from FY2018, the scale of overseas sales by Japanese S&As
worldwide in the following fiscal year is quite impressive. Notably, world sales of
US$ 2.41 trillion recorded in FY2019 were equivalent to 49% of Japan’s GDP in CY2019
(¥ 561 trillion or US$ 5.08 trillion). These figures provide robust evidence for and testify
to S&As’ highly globalized nature and the wide scope of their overseas business
operations. It should be reminded that a large portion of sales and procurements
(purchases) and profits accruing from business overseas are not appropriated in Japan’s
GDP figures. Instead, profits repatriated from S&As overseas form part of “primary
income” in the current account of the balance of payments.

12
The annual average number of employees directly hired by the Japanese S&As during
the four-year period totaled 5.8 million persons (Table 1). Asia accounted for 69% of the
employees hired by the Japanese S&As overseas.8 The share of Asia in S&As total
employment was higher than Asia’s share in world total of sales (45%), procurements
(47%), ordinary profit (53%), and even current net profit (54%). In relative terms, the
share of Asia in capital investment (33%) is much lower. It is noteworthy that the number
of employees in the ASEAN (10) countries is larger than in Mainland China. Relatively,
many persons employed in the ASEAN group seems to reflect the advantages that these
countries have in attracting labor-intensive production-sharing processes, in which
China’s comparative advantages have been gradually eroded in recent years against the
ASEAN competitors. In LAC, the annual average of direct employment reached some
329,000 persons, accounting for 5.7% of the world total (Table 1).
Regarding the number of S&As by industrial distribution, out of approximately
25,300 S&As worldwide covered in the FY-2016-FY2019 surveys, 44% of the S&As
(approx. 11,000 firms) were engaged in the manufacturing sectors, 9 while non-
manufacturing firms accounted for 56% (some 14,300) of the world total. Compared to
the world’s overall breakdown, the industrial distribution of the S&As in LAC is highly
skewed toward non-manufacturing: out of the total (1,391 firms as the annual average
during FY2016-FY2019), only 394 firms were engaged in manufacturing, while the
remaining 997 firms in non-manufacturing (Table 2).
In addition, the number of manufacturing S&As in LAC is much smaller than that in
other regions. For example, the annual average of manufacturing S&As in Mainland
China during the four-year period was 3,725 firms, 3,505 firms in ASEAN (10), and 915
firms in NIEs3, far greater than in LAC. In LAC’s manufacturing, Transportation
Equipment (183 firms)10 is by far the most important host sector of Japanese S&As,
followed by Chemicals (29), ITC Equipment (23), Iron and Steel (22), and General-
Purpose Machinery (18). In non-manufacturing, services sectors such as Transport (391),
Wholesale Trade (289), and Other Services (128) have been major recipient sectors in
LAC (Table 2).
8 The number of employees directly hired by overseas Japanese S&As worldwide declined from 6.05 million persons in FY2018 to 5.64 million in FY2019. 9 The major manufacturing sectors in FY2019 that hosted overseas Japanese S&As worldwide were the following: Transportation Equipment (2,398 firms), Chemicals (1,085), and Information and Communications (ITC) Equipment (972). 10 The data on the FY2019 survey show that the number of S&As in Transportation Equipment in LAC (193 firms) is relatively high when compared with the number of S&As engaged in the same sector of Mainland China (601), ASEAN (10) (799), North America (344), the EU (182), and NIEs3 (90).

13
Table 2: Major indicators by Japanese subsidiaries and affiliates in LAC
annual average FY2016-FY2019 (In US$ million, percentages)
Employees sent Share in Investment Share in
from Japanside Total Value Total
FY2016-FY2019 AVE
(No. firms) (%) (US$ million) (%) (US$ million) (%) (No. of employees) (%) (No. of employees) (%) (US$ million) (%) (%)
All industries 1,413 100.0 109,668 100.0 64,167 100.0 329,212 100.0 2,578 1.4 5,665.4 100.0 5.7
Manufacturing industries 398 28.2 60,729 55.4 37,599 58.6 216,416 65.7 1,620 1.0 2,043.5 36.1 3.3
Food 17 1.2 2,003 1.8 912 1.4 13,701 4.2 83 0.7 75.2 1.3 9.9
Textiles 11 0.8 X X X X X 1.0 12.0 0.2 X
Lumber, wood, paper & pulp 5 0.3 1,158 1.1 723 1.1 5,381 1.6 20 0.4 179.9 3.2 20.6
Chemicals 29 2.0 1,192 1.1 582 0.9 2,886 0.9 39 2.7 44.2 0.8 17.1
Petroleum and coal 4 0.3 25 0.0 17 0.0 X 7 5.4 X X
Ceramics, stone, and clay products 1 0.1 *** *** *** *** *** *** ***
Iron and steel 22 1.6 3,755 3.4 1,780 2.8 9,573 2.9 92 1.1 73.0 1.3 2.3
Non-ferrous metals 10 0.7 827 0.8 703 1.1 3,419 1.0 32 0.9 62.9 1.1 0.4
Metal products 7 0.5 186 0.2 90 0.1 1,081 0.3 13 1.5 22.6 0.4 4.7
General-purpose machinery 18 1.3 551 0.5 321 0.5 5,770 1.8 47 1.0 7.5 0.1 3.4
Production machinery 10 0.7 442 0.4 178 0.3 2,300 0.7 X 3.7 35.3 0.6 0.4
Business-oriented machinery 9 0.6 X X 6,921 2.1 18 0.3 X X
Electrical machinery 15 1.0 640 0.6 464 0.7 4,304 1.3 37 1.7 21.5 0.4 4.3
Information & communications equipment 23 1.6 1,287 1.2 782 1.2 9,391 2.9 1.2 54.8 1.0 0.8
Transportation equipment 183 13.0 47,634 43.4 30,772 48.0 142,253 43.2 1,028 1.0 1,428.1 25.2 2.2
Miscelleneous manufacturing industries 36 2.5 884 0.8 462 0.7 7,370 2.2 103 1.9 63.7 1.1 6.6
Non-manufacturing industries 1,015 71.8 48,939 44.6 26,568 41.4 112,796 34.3 958 3.1 3,622.0 63.9 8.7
Agriculture, forestry and fisheries 20 1.4 494 0.5 202 0.3 3,955 1.2 18 1.4 21.7 0.4 13.5
Mining 27 1.9 3,184 2.9 605 0.9 2,165 0.7 82 6.0 X 43.3
Construction 9 0.6 200 0.2 115 0.2 230 0.1 24 12.3 X 13.0
Informatin and communications 9 0.6 46 0.0 12 0.0 2,573 0.8 8 1.4 X -10.6
Transport 391 27.7 5,361 4.9 3,187 5.0 9,760 3.0 154 1.9 1,734.2 30.6 4.0
Wholesale trade 289 20.4 22,915 20.9 13,578 21.2 53,381 16.2 427 5.6 1,547.4 27.3 1.5
Retail trade 14 1.0 1,077 1.0 642 1.0 1,449 0.4 15 2.2 4.3 0.1 0.3
Services 128 9.1 3,610 3.3 3,117 4.9 32,950 10.0 213 2.0 48.7 0.9 -7.4
Miscelleneous non-manufacturing industries 129 9.1 13,766 12.6 4,924 7.7 6,301 1.9 30 4.9 127.9 2.3 18.2
FY2016-FY 2019 AVEFY2016-FY 2019 AVEFY2016-FY2019 AVE FY2016-FY 2019 AVE FY2016-FY 2019 AVE
Capital Investment Ratio of Ordinary
S&As Sales Procurements Total Employees Profit to Sales (*)By Industry and Sector
Number of Total Total Employees at Affiliates
Notes: (*) Ratio of ordinary profit to sales = Ordinary profit / Sales × 100.0 (Calculated based on overseas subsidiaries and affiliates that responded to questionnaires for both Ordinary profits and sales). Note: Data items by less than three firms are indicated as “X” for confidentiality purposes; In some cases, even when more than three firms are reported, and when the values of “X” can be calculable, confidentiality is also applied. When there are no data reported, it is indicated as “***”. Source: Author’s elaboration based on information from Japan, METI, ibid, Nos. 47-50.
Based on the FY2019 survey alone, out of the 400 manufacturing S&As in LAC, 69
firms belonged to machinery sectors,11 excluding the S&As in the automotive sector. The
number of firms in machinery sectors in LAC (69) is far less than the case of Mainland
China (1,252 firms), ASEAN (10) (946), or NIEs3 (362). A markedly high presence of
11 In the METI’s survey, the machinery industry consists of General-purpose, Production, Business-oriented, Electrical, and Information & Communications. Transportation Equipment is not included in the category of machinery.

14
the machinery sectors in Asia points to the burgeoning and increasingly complex supply
chain networks in the machinery sectors that have developed in that region over the years.
In contrast, compared to other regions (for example, Asia), the number of LAC S&As in
mining, agriculture, and fishery is large in relative terms. This observation, in turn, points
to the Japanese S&As’ strongholds in LAC’s natural resources sectors.
One of the eye-catching features of the S&As in LAC is their export orientation.
During FY2016-FY2019, roughly half of total sales were exported to third-country
markets, showing a similar level of export propensity observed for the Middle East and
the EU (Table 3). Surprisingly, the export propensity of these firms in LAC has been
markedly higher than in Mainland China, ASEAN (10), or NIEs3, countries/regions
commonly acknowledged for their high export-orientation in manufactured goods and as
active participation in global value chains (GVCs). Even in ASEAN (10) and NIEs3
markets, Japanese S&As tend to focus on domestic-market sales and sales back to Japan
than using the S&As as an export platform to third countries. Comparatively, the activities
of the S&As in LAC are export-oriented to third-market economies, thereby revealing
another essential feature of their very diversified and globalized business operations in
that region.
Table 3: Breakdown of sales destinations, by region annual average FY-2016-FY2019
(In US$ Million, Percentages)
Total Sales(US Million)
Sales back toJapan (%)
Sales inDomestic
Markets (%)
Exports toThird CountryMarkets (%)
Total sales
(%)
World 2,496,242 9.1 56.4 34.5 100.0
North America 822,012 4.5 62.3 33.3 100.0
LAC 109,669 5.4 44.6 50.1 100.0
Mainland China 390,939 12.9 65.1 21.9 100.0
ASEAN (10) 505,976 17.6 48.2 34.2 100.0
NIES3 234,879 16.1 47.1 36.8 100.0
Middle East 16,072 2.8 41.6 55.5 100.0
EU 317,611 4.5 45.5 50.0 100.0
Oceania 61,429 13.2 53.7 33.0 100.0
Africa 15,600 9.9 47.8 42.3 100.0 Source: Author’s elaboration based on information from Japan, METI, ibid, Nos. 47-50.

15
On the other hand, the breakdown of procurements by sourcing markets for the LAC
region roughly conforms to that observed for the world: roughly half of total
procurements are sourced from LAC domestic/local markets, one-third are imported from
Japan, while the remaining are imported from third country markets (Table 4). The shares
corresponding to three sourcing markets markedly differ among regions. The LAC case
is similar to that of North America but different to that of Mainland China where the
S&As purchase almost 70% of their inputs and materials from domestic/local markets,
while importing a relatively small amount from third country markets. The annual average
purchases by the S&As in LAC during FY2016-FY2019 amounted to US$ 65 billion,
46% of which are sourced locally, while 35% imported from Japan and 19% imported
from third country markets. It should be noted, however, that the share of “sourced from
domestic/local markets” has been recovering in recent years.
Table 4: Breakdown of procurements by sourcing markets, by region,
annual average FY-2016-FY2019 (In US$ Million, Percentages)
TotalProcurements(US Million)
Importedfrom Japan
(%)
Sourced fromDomestic
Markets (%)
Imported fromThird CountryMarkets (%)
Totalprocurements
(%)
World 1,577,310 32.2 50.4 17.4 100.0
North America 502,386 37.3 50.9 11.8 100.0
LAC 65,251 35.0 46.1 18.9 100.0
Mainland China 259,637 23.6 68.4 8.0 100.0
ASEAN (10) 329,605 21.8 54.7 23.6 100.0
NIES3 150,279 33.9 37.8 28.3 100.0
Middle East 8,967 36.7 34.9 28.4 100.0
EU 194,409 41.1 24.7 34.2 100.0
Oceania 33,549 39.6 51.9 8.5 100.0
Africa 10,629 42.8 23.7 33.4 100.0 Source: Author’s elaboration based on information from Japan, METI, ibid, Nos. 47-50.
B. S&As sales in the LAC region
The business scale of Japanese S&As operating in LAC is impressive; total sales by
these companies reached ¥11.5 trillion (US$ 106 billion) in FY2019 alone, 12 after
12 The sales figures are tabulated from the information by the firms which reported sales values to the survey that year. In the case of the LAC region, out of the total of 1,457 companies, 1,035 companies provided information on sales in

16
reaching a peak of US$ 148 billion in FY2012 until when the prices of commodities of
great interest to LAC countries continued to rise in response to China’s increasing demand
for these products.13 After reaching a trough of US$ 88 billion in FY2015, annual sales
in LAC have recovered and remained relatively stable at a US$ 100 billion mark (Figure
5). This achievement is also true when the sales values are calculated in yens, stabilizing
at a ¥11 trillion mark.
Figure 5: Sales by Japanese subsidiaries and affiliates operating in LAC FY2004-FY2019
(Left scale: US$ millions, Right scale: ¥10 million, percentages)
Source: Author’s elaboration based on information from various issues of METI, ibid, Nos. 34-50.
Notably, sales performance in LAC shows two different growth patterns; one
characterized by a strong and sustained growth observed during the so-called “Golden
Years” of the region (2003-FY2013), except for FY2009 during which the aggregate
demand of LAC countries was severely affected by the 2008/2009 financial crisis. Sales
began to stagnate in the subsequent years (during FY2014-FY2019). In sum, the sales
performance in LAC is characterized by a strong growth until 2013, when commodity
price hikes came to an end and the terms of trade14 started to deteriorate.
As a result, the sales dynamics in LAC has been heavily influenced by the growth
performance of the proper region; sales in LAC grew at a fast rate during the “Golden
Years” with an annual average growth rate of 3.8% for the region, much superior to the
the FY2019 survey (Japan, METI 2021). 13 The sales amount in LAC represented only 4.1% of world sales (¥ 291trillion; US$ 2,634 billion) in FY2018. 14 The Terms of Trade (TOT) represent the ratio between a country's export prices and its import prices.

17
rate of 0.3% registered for the subsequent years of 2014-2019 (Figure 6).15 Furthermore,
the sales dynamics in LAC also roughly coincides with the trend of the terms of trade of
the countries in the region (Figure 6). These observations suggest that determinants of
Japanese S&As sales performance in LAC are economic and business conditions that are
also affected by commodity prices and the resulting terms of trade movements.
Figure 6: LAC: annual growth rates and the terms of trade
(Right scale, growth rates in %: Left scale, Terms of Trade, Base year 2010=100)
79.6 77.7 80.1 84.893.8
100.0105.0
100.588.8
94.195.1
‐4.0
‐2.0
0.0
2.0
4.0
6.0
8.0
0
20
40
60
80
100
120
2000 2001 2002 2003 2004 2005 2006 2007 2008 2009 2010 2011 2012 2013 2014 2015 2016 2017 2018 2019
Terms of Trade GDP Grwoth rates
Source: Elaboration by the author based on ECLAC Statistical Yearbook 2020, online (ECLAC 2021a).
Brazil, Mexico, and Argentina have been the three largest sales markets for the
Japanese S&As in the LAC region. It is important to note that Mexico has taken over
Brazil as the largest sales market destination. Brazil was by far the largest sales market,
accounting for 64% of Japanese S&As sales, followed by Mexico (16%) and Argentina
(3%) in FY2010. Ten years later, in FY2019, however, Mexico’s share more than doubled
to 35%, while that of Brazil declined to 23% (Figure 7). The factors behind the
displacement of Brazil by Mexico will be analyzed in detail in Section IV of this paper.
It is equally important that in addition to Brazil, Mexico, and Argentina, other LAC
countries combined represented 36% of Japanese S&As total sales in LAC, constituting
another important sales destination in the LAC region. The sales by these firms operating
in other LAC countries amounted to US$ 38 billion in FY2019. The figures may suggest
that sales markets in LAC have been more diversified over the last ten years and that these
S&As contribute not only to LAC’s expansion of third-country exports to extra-regional
markets but also to LAC’s intra-regional trade.
15 The annual average growth rate of the “Golden Years” is much higher (4.3%) when 2009 is excluded. The regional GDP contracted by 1.8% in that year as a result of the international economic/financial crisis.

18
Figure 7: Top 3 sales market countries in LAC
FY2010 and FY2019 (US$ billion and percentages)
A. FY2010 B. FY2019
Source: Author’s elaboration based on information from METI, ibid., Nos. 41 and 50.
Admittedly, the overall sales performance in LAC has been less dynamic than that in
ASEAN (10) (Figure 8). Total sales values in the former have been roughly 20% of those
recorded in the latter. Another eye-catching feature is that the LAC share of the
manufacturing industry in total sales has been smaller than in ASEAN (10): in LAC,
manufacturing has represented 47% of total sales during the period FY2007-FY2019,
while non-manufacturing accounting for the remainder of 53%, in contrast to the
corresponding shares for ASEAN (10) of 58% and 42%, respectively (Figure 8).16 The
preceding seems to reflect the productive specialization patterns of the S&As in each
region, with the former’s comparative advantages in natural resource-related industries,
whereas the latter’s in a wide range of manufacturing activities.
In terms of sales by industry/sector, in both LAC and ASEAN (10), Transportation
Equipment has been, by far, the most important sector in manufacturing, while Wholesale
Trade has been the largest host sector in non-manufacturing. For example, Transportation
Equipment accounted for 33.5% of total LAC sales during the thirteen-year period,
followed by Iron and Steel (2.3%), Foods (1.9%), Information & Communications
Equipment (1.4%), and Chemicals (1.2%). In the case of ASEAN (10), in manufacturing,
besides Transportation Equipment (28.7% of total sales in that region), Information &
Communications Equipment (6.7%), Chemicals (4.5%), and Electrical Machinery (3.0%)
have been major target sectors for the Japanese S&As. Among non-manufacturing,
16 It should be noted, however, that the weight of manufacturing in LAC has increased in recent years: LAC, sales values originating from manufacturing have consistently exceeded those from non-manufacturing since FY2015.

19
Wholesale Trade has been the largest sector (18.6% of LAC’s total sales), followed by
Mining (4.9%), Transport (4.1%), and Services (1.8%). In non-manufacturing, the share
of Mining in total sales is higher for LAC than for ASEAN (10).
Figure 8: Sales performance in LAC vs. ASEAN (10) FY2007-FY2019 (In US$ million)
A. LAC B. ASEAN (10)
Source: Author’s elaboration based on information from METI, ibid. Nos. 38-50.
It should be reminded that, as in other regions, the sectoral distribution of sales in
LAC fluctuates year-to-year due in part to the availability of sales values not reported for
some sectors for confidentiality purposes. For instance, sales values of the sectors such
as Lumber, Wood, Paper and Pulp, and Information & Communications Equipment were
reported showing relatively large sales in FY2018, but sales values are not reported in the
subsequent year.
C. High propensity to export
As identified earlier, business activities of Japanese S&As in LAC show a high
export-propensity in sales. Measured as the percentages of total sales by the S&As, during
FY 2019, 42% (US$ 44 billion) of total sales by Japanese S&As in LAC were exported
to third country markets, while some 53% (US$ 55 billion) were sold in domestic/local
markets of proper LAC countries. Sales back to Japan amounted to only 6% (US$ 6
billion) (Figure 9A).
Although exports to third countries continue accounting for a large portion of total
sales, the share of third country exports in total sales has declined in two consecutive
years (FY2018 and FY2019). On the other hand, the share of domestic markets has
0
60,000
120,000
180,000
240,000
300,000
360,000
420,000
480,000
540,000
600,000
2007
2008
2009
2010
2011
2012
2013
2014
2015
2016
2017
2018
2019
Manufacturing industries Non‐manufacturing industries
0
100,000
200,000
300,000
400,000
500,000
600,000
2007
2008
2009
2010
2011
2012
2013
2014
2015
2016
2017
2018
2019
Manufacturing industries Non‐manufacturing industries

20
recovered to some extent (Figure 9B). There seems to be a compensation mechanism in
the works between the two sales destinations (i.e., exports to third-country markets and
domestic/local markets), a factor which might explain relatively stable sales values in
recent years.
Figures 9: Distribution of total sales in LAC, by market destination and by
industry/sector, FY2001-FY2019 (In percentages of total sales %)
A. Composition of total sales by market destination FY2019
(In percentage of total sales %)
B. Composition of total sales by market destination FY2001-FY2019
(In percentage of total sales each year %)
C. Breakdown of exports to third
countries FY2019 (In percentage of total exports to third
countries %)
D. Breakdown of exports to third countries LAC, by major industries/ sectors,
FY2019 (In percentage of LAC’s Exports to Third Country
markets %)
Source: Author’s elaboration based on information from METI, ibid, Nos. 34-50.

21
Major third-country export markets for the S&As in LAC have been in North America
(the United States and Canada), accounting for 45% of total exports, followed by Asia
(7%), Europe (5%), and the remaining countries/regions that include the proper Latin
American and Caribbean countries (with Mexico also included) (43%)17 (Figure 9C). As
noted above, in addition to North America, Latin American intra-regional markets have
also become a major third-country export destination for the Japanese S&As.
LAC’s export propensity towards third-country markets is particularly high for
Transportation Equipment; over 63% of total third-country exports were accounted for by
this sector (US$ 28 billion) during FY2019 (Figure 9D). Of the total third-country auto
exports, US$17 billion, an equivalent of 60% of total third-country exports of autos and
auto-parts, were destined to North America alone. In addition, US$ 423 million (1.5%)
worth of these products to Asia, US$ 875 million (3.2%), and US$ 9.8 billion (35.5%)
were exported to Europe and LAC intra-regional markets respectively. There is US$ 10
billion worth of intra-regional trade in automobiles and related products, apart from the
auto exports destined to the United States and Canada.
In addition to autos and auto parts, a wide range of machinery products, such as
Electrical Machinery, Business-oriented Machinery, and Production Machinery, was
exported to the North American markets in FY2019. In addition to Transportation
Equipment, sectors with a relatively high export propensity to the world in manufacturing
include Metal Products, Electrical Machinery, Chemicals, and Foods, while in non-
manufacturing, Agriculture, Forestry and Fishery, Transport, Services, and Wholesale and
Retail Trade (Figure 10).18
In sum, the S&As’ exports to third-country markets of US$ 44 billion recorded for
FY2019 is more than double of LAC countries’ exports to Japan of US$ 20 billion
registered for the calendar year 2019. This comparison is very illustrative of the export-
orientation of the S&As in LAC. With their high export-orientation, the S&As business
operations in LAC contribute to foreign exchange earnings of the respective host
countries. This contribution may also suggest that LAC has transformed into one of the
essential export platforms toward LAC’s extra-regional and intra-regional markets for
17 The METI surveys specify the following four destinations to third country exports for Japanese S&As operating in LAC: 1) North America, 2) Asia, 3) Europe, and 4) other regions including the proper LAC region. Since export values of third country exports by the S&As to the Oceania, the Middle East, and Africa are estimated small, LAC intra-regional markets are considered to constitute most of the third country exports to “other regions”. 18 Although detailed information on third country exports is not disclosed for some years, sectors such as Lumber, Wood,Paper and Pulp, Petroleum and Coal, and Mining are also known to be export-oriented to third country markets.

22
Japanese companies overseas, where free trade agreements (FTAs) may give preferential
market access as an important incentive for their business operations (Hamaguchi 2018).
Figure 10: Propensity to export to third countries, by industry/sector, FY2019 (As percentages of exports to third countries in total sales in each industry/sector %)
42
55
21
X X
49
*** *** 2
18
63
9 18
X
51
X
64
25 27 21
X 2 X
22 22
39 30
57
010203040506070
Note: Data items by less than three firms are indicated as “X” for confidentiality purposes; In some cases, even when more than three firms are reported, and when the values of “X” can be calculable, confidentiality is also applied. When there are no data reported, it is indicated as “***”. Source: Author’s elaboration based on information from Japan, METI, ibid, No. 50.
D. Procurements (Purchases)
Total procurements (purchases) by the Japanese S&As operating in LAC amounted
to US$ 55 billion in FY2019, down by 19% from US$ 68 billion in FY2017 (Figure 11).
Total procurement values have been declining since FY 2012 when they reached a peak
of US 97 billion (calculated at the exchange rate of ¥79.8 to the US dollar). In LAC, total
procurements have been consistently smaller than total sales (See Figure 5 on Sales). The
trend of procurements follows the growth rate pattern of the LAC region and the terms of
trade (Figure 6).
A breakdown of procurements by the three main sourcing markets shows that during
FY2019, directly sourced imports from Japan amounted to US$ 17 billion, compared with
US$27 billion sourced from LAC’s domestic/local markets and US$ 11 billion imported
from third countries (Figure 12A). Therefore, the Japanese S&As in LAC source a larger
portion of total purchase needs directly from Japan, compared to the case of sales in which
only a small portion of total sales was shipped back to Japan (see Figures 8B and 12B).
Admittedly, the share of procurements “sourced from Japan” fluctuates widely year-to-
year. Meanwhile, the share of “sourced from third countries” has been declining over the
years.

23
Figure 11: Procurements by Japanese subsidiaries and affiliates operating in LAC
FY2004-FY2019 (Left scale: US$ millions, Right scale: ¥10 million, percentages)
Source: Author’s elaboration based on information from various issues of METI, ibid, Nos. 34-50.
In recent years, Japanese S&As in LAC made approximately half of their purchases
from domestic/local sources, half of which are sourced locally from domestic firms and
the remaining from other Japanese S&As operating in LAC domestic/local markets. The
share of purchases from “domestic firms” in total purchases continued rising until
FY2009 when the Lehman financial crisis struck, and then started to fall until FY2012. It
has recovered to the previous levels in recent years (Figure 12B).
When procurements are sourced from Japan, in most cases, parent companies in Japan
are involved. Procurements imported from third countries are of lesser significance,
accounting for 21% of total procurements in FY2019. Some 37% of third-country imports
were sourced from North America, while the other 32% were bought from Asia, apart
from the purchases made directly from Japan (Figure 12C).
By industry, as in the case of sales, when measured in terms of purchased values,
Transportation Equipment accounted for 45% of total procurements in FY2019, followed
by Wholesale Trade with 26% that fiscal year. In turn, Transportation Equipment alone
accounted for 56% of total purchases from domestic/local markets in FY2019, followed
by Wholesale Trade, Services, Iron and Steel, and Retails (Figure 12D). The preceding
suggests that the transportation equipment sector has transformed into a major business
platform for Japanese S&As to promote their intra- and extra-regional activities in LAC.

24
Figures 12: Distribution of total procurements in LAC by sourcing markets and
industry/sector, FY2001-FY2019 (In percentage of total sales %)
A. Composition of total procurements by sourcing markets FY2019
(In percentage of total procurements %)
B. Composition of total procurements by sourcing markets FY2001-FY2019
(In percentages of total procurements each year %)
C. Breakdown of imports from third countries
FY2019 (In percentages of total imports from third
countries %)
D. Breakdown of procurements from LAC domestic markets, by major sectors,
FY2019 (In percentages of total domestic market
procurements %)
Domestic procurement ratio = Domestic procurement (purchases) / Total procurement of the region (total purchases) ×100.0. Source: Author’s elaboration based on information from METI, ibid, Nos. 34-49.
According to the FY2019 survey, Japanese S&As in LAC operating both in
manufacturing (i.e., Chemicals, Iron and Steel, and Transportation Equipment, General-
purpose Machinery, and Production Machinery) and non-manufacturing sectors (i.e.,
Agriculture, Forestry and Fisheries, Retail Trade, and Services) purchase a relatively
large portion of their inputs and related services locally19 (Figure 13). This trend, in turn,
19 It should be reminded that the sectoral distribution of procurements in LAC fluctuates year-to-year and that

25
might suggest that operations of Japanese companies are increasingly integrated into
regional value-chains (RVCs), especially in natural-resources sectors described above.
Figure 13: Propensity to procure from LAC domestic markets, by
industry/sector, FY2019 (In percentages of procurements from domestic markets in total procurements in each
industry/sector %)
Note: Data items by less than three firms are indicated as “X” for confidentiality purposes; In some cases, even when more than three firms are reported, and when the values of “X” can be calculable, confidentiality is also applied. When there are no data reported, it is indicated as “***”. Source: Author’s elaboration based on information from METI (2021), ibid., No. 50.
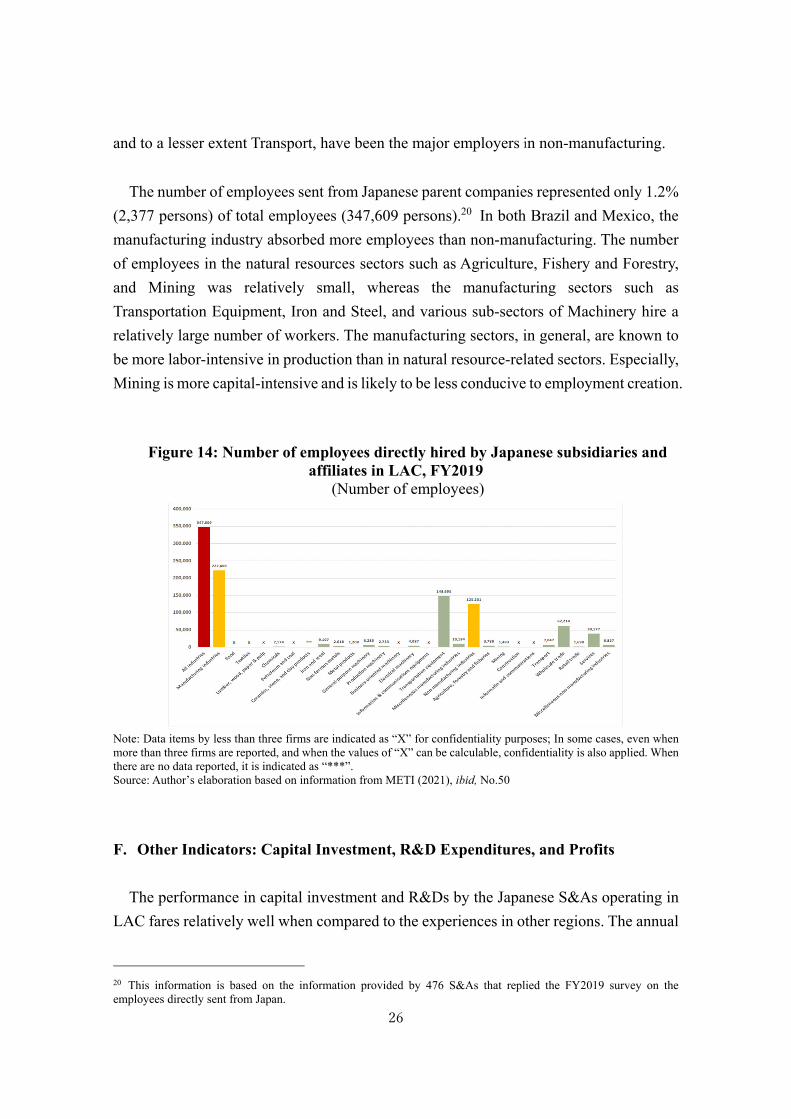
E. Employment
Japanese S&As in LAC contribute to employment creation. Based on the information
from some 800 firms that answered on employment of the FY 2019 survey, The S&As in
LAC directly employed approximately 347,000 persons in FY2019, 100,000 more than
250,000 posts recorded in FY2013. The number of the directly employed in Brazil was
approximately 104,000 persons, while in Mexico 162,000 persons, and 10,000 persons in
Argentina. Some 222,000 (64%) of the employed by the S&As in LAC worked in
manufacturing, and 149,000 posts belonged to Transportation Equipment alone (Table 2,
Figure 14). In Mexico, some 89,000 persons were employed in the same sector, whereas
in Brazil, 49,000 persons, and Argentina, 7,300 persons. Wholesale and Services sectors,
procurements figures for some sectors in some specific years are not available for confidentiality purposes. For example, procurement data for some sectors available for FY2018 were not disclosed for FY2019. According to the FY2018 survey, Japanese S&As in LAC operating both in manufacturing (i.e., Foods, Lumber, Pulp and Paper, Chemicals, Iron and Steel, Non-ferrous Metal) and non-manufacturing sectors (i.e., Construction and Services) show a high propensity to source their inputs and related services locally.
26
and to a lesser extent Transport, have been the major employers in non-manufacturing.
The number of employees sent from Japanese parent companies represented only 1.2%
(2,377 persons) of total employees (347,609 persons).20 In both Brazil and Mexico, the
manufacturing industry absorbed more employees than non-manufacturing. The number
of employees in the natural resources sectors such as Agriculture, Fishery and Forestry,
and Mining was relatively small, whereas the manufacturing sectors such as
Transportation Equipment, Iron and Steel, and various sub-sectors of Machinery hire a
relatively large number of workers. The manufacturing sectors, in general, are known to
be more labor-intensive in production than in natural resource-related sectors. Especially,
Mining is more capital-intensive and is likely to be less conducive to employment creation.
Figure 14: Number of employees directly hired by Japanese subsidiaries and
affiliates in LAC, FY2019 (Number of employees)
Note: Data items by less than three firms are indicated as “X” for confidentiality purposes; In some cases, even when more than three firms are reported, and when the values of “X” can be calculable, confidentiality is also applied. When there are no data reported, it is indicated as “***”. Source: Author’s elaboration based on information from METI (2021), ibid, No.50
F. Other Indicators: Capital Investment, R&D Expenditures, and Profits
The performance in capital investment and R&Ds by the Japanese S&As operating in
LAC fares relatively well when compared to the experiences in other regions. The annual
20 This information is based on the information provided by 476 S&As that replied the FY2019 survey on the employees directly sent from Japan.

27
average capital investments made by Japanese S&As in LAC (according to the data from
491 S&As in LAC) during the seven-year period (FY2013-FY2019) amounted to US$ 6.6
billion. In terms of capital investment per affiliate,21 the average annual investment for
the seven year-period reached US$ 13.1 million, surpassing those values reported for the
EU, the Middle East, ASEAN (10), NIEs3, and Mainland China (Figure 15A). Capital
investment per affiliate in LAC has been increasing both in terms of yens and US dollars.
Japanese S&As in LAC continued to expand their capital investment until 2019, when it
fell by more than 15%.
A relatively large capital investment may be attributed to the LAC region’s
specialization in the natural resources-related sectors, the production structure of which
are capital-intensive in most cases.22 In these sectors, expenditure on the acquisition of
long-term assets such as real estate, plants, and machinery tends to be large. In contrast,
capital investment by Japanese S&As in East and South-East Asia is minimal partly
because Japanese firms in these countries have specialized in more labor-intensive and
export-intensive activities such as textiles and confections, electronics (parts and
components), and assembly operations. In addition, the number of affiliates answering
this part of the annual survey is much larger in Asia than in LAC.23
Figure 15: Trends in capital investment and R&D expenditures of overseas subsidiaries and affiliates by region annual average FY2013-FY2019
(US $ million) A. Capital investment per affiliate B. R&D expenses per affiliate
Source: Author’s elaboration based on information from METI, ibid. Nos. 44-50.
21 Capital investment per affiliate is calculated by dividing total capital investment of each year by the number of affiliates answering the survey in that year. 22 According the METI surveys, during FY2016-FY2019, a relatively large capital investment has been made in manufacturing sectors of Transportation Equipment, Wood, Paper and Pulp, Foods, Iron and Steel, as well as Transport and Wholesale in non-manufacturing sectors. Information regarding Mining, Construction, Information & Communications is not disclosed for some years. 23 In LAC, approximately 490 affiliates answered this part of the survey (the annual average of the seven-year period), while in ASEAN (10), approximately 3,000 S&As, Mainland China, approximately 2,700 S&As, and NIEs3, approximately 1,000 S&As.
3.0
3.4
4.2
4.7
6.8
6.8
7.3
13.0
24.1
0.0 5.0 10.0 15.0 20.0 25.0 30.0
Mainland China
NIEs3
ASEAN(10)
ASEAN(4)
Middle East
EU
World
LAC
North America
1.5
1.6
2.4
2.5
4.4
4.9
6.0
10.1
12.4
0.0 2.0 4.0 6.0 8.0 10.0 12.0 14.0
ASEAN(4)
ASEN(10)
Mainland China
NIEs3
World
LAC
EU
North America
Middle East

28
The indicators on the R&D spending by S&As in LAC are comparable to, or even
better than, those recorded worldwide. For example, LAC outperforms ASEAN (10),
Mainland China, and NIEs3 countries; in LAC, 48 firms together invested in R&D close
to US$ 250 million as the annual average during FY2013-FY2019. R&D expenditures
per affiliate amounted to US$ 4.9 million annually. Although surpassed by the
performance in the Middle East, North America, and the EU, S&As in LAC fare well
compared to their counterparts operating in East or Southeast Asia (Figure 15B). The
information by industry/sector is not disclosed for confidentiality purposes, but Foods
and Chemicals have been identified as the major sectors in the R&Ds for the S&As in
LAC.
The performance in ordinary profit24 earned by the Japanese S&As in LAC during
the period FY2007-FY2019 is characterized by high volatility (Figure 16A). Notably, the
region shows the highest coefficient of variation in ordinary profit among the regions
covered in the METI’s surveys. Ordinary profit earned by the S&As in LAC accounted
for 5.6% (US$ 5.6 billion) of total ordinary profit worldwide (US$ 99.4 billion) in
FY2019. Ordinary profit in LAC declined by 2% from FY2018, although remarkable
against the backdrop of ordinary profit worldwide in FY2019 shrinking by 25% from the
previous year. After recording a negative ordinary profit in FY2015 and making an
impressive recovery in FY2016, ordinary profit of the S&As in LAC has remained
relatively stable since then. This profit performance contrasts to other regions where
ordinary profit plummeted, except for North America. Ordinary profit in FY2019 was
negative in Africa.
When compared to the ratio of ordinary profit to sales in other regions during the
thirteen-year period, LAC outperforms ASEAN (10), ASEAN (4), NIEs3, Africa, the EU,
and North America, but underperforms the Middle East and Oceania, commonly known
as commodity exporting regions (Figure 16B). Based on data from the S&As that
responded to the survey on ordinary profit and sales, the ordinary profit-sales ratio in
LAC was negative in two sectors during FY2016-FY2019, namely, Information &
Communications and Services. High profits-sales ratios were recorded in Mining,
Lumber, Wood and Pulp and relatively high ratios Chemicals, Agriculture, Forestry and
Fisheries, and Construction (see Table 2).
24 In a corporate setting, the term, “ordinary profit” refers to any type of income generated from regular day-to-day business operations, excluding any income earned from the sale of long-term capital assets, such as land or equipment.

29
Figure16: Profit performance of Japanese S&As by major regions, FY2007-FY2019
A. Ordinary Profit: Coefficient of Variation(*)
B. Ratio of Ordinary Profit to Sales (**)
(Percentages)
Notes: (*) the coefficient of variation (CV) is a statistical measure of the relative dispersion of data points in a data series around the mean. (**) Ratio of ordinary profit to sales = Ordinary profit / Sales × 100.0 (Calculated based on overseas affiliates that responded to the survey on both ordinary profits and sales). Source: Author’s elaboration based on information from various years of METI, ibid, Nos. 38-50.
High volatility in ordinary profit in LAC stands out when compared to ASEAN (10).
As shown in Figure 17, the LAC region’s profitability is characterized by year-to-year
variations in profits of the non-manufacturing sectors, which accounts for a large portion
of ordinary profit in that region. Ordinary profit continued to increase until the first half
of 2011, when the commodity price hikes started to slow down. In contrast, year-to-year
variations are minor in the case of ASEAN (10), probably due to a larger and more stable
profit performance in the manufacturing industry.
Figure 17: Performance of ordinary profit LAC vs. ASEAN (10) FY2007-FY2019
(US$ million) A. LAC B. ASEAN (10)
Source: Author’s elaboration based on information from various years of Japan, METI, ibid., Nos 37-50.

30
Similarly, net income earned25 by the Japanese S&As in LAC is characterized by a
high volatility. In fact, The LAC region shows the highest coefficient of variation among
the regions covered by the METI’s annual surveys. For example, net income earned by
Japanese S&As in LAC reached US$ 3.2 billion (¥ 349 billion) in FY2019, up by 15%
from FY2018 but down by 5% from FY2017.26 As such, retained earnings balance also
fluctuates widely from year to year, depending on the business climate and exchange
rates.27 The volatility in earnings may have to do with the macroeconomic “booms and
bust” cycles that characterize the regional economy (Titelman and Pérez Caldentey 2015)
as well as the trade specialization patterns skewed towards commodities, prices of which
also fluctuate widely year to year (Kuwayama 2019).
IV. A Comparison between Brazil and Mexico as a business hub for Japanese
S&As in Latin America and the Caribbean
One of the primary means of financing business operations overseas of any
multinational company is foreign direct investment (FDI), either from a parent company
of the home country or third-country financial markets. Japanese S&As activities are no
exception. Their activities are supported by fresh direct investment from the home country,
third-country markets, or retained earnings of the S&As in host countries. What
distinguishes FDI from ordinary portfolio investment is that the former frequently
includes provisions of management or technology as well. The key feature of FDI is that
it establishes either effective control of or at least substantial influence over the decision-
making of a foreign business.
As has been the case in LAC’s bilateral trade, China has overtaken Japan as a major
FDI investor country from the Asia-Pacific region in recent years. Yet, although Japan’s
FDI flows to LAC in recent years are smaller than those of China, Japan’s FDI is more
diversified in terms of recipient countries and industries (Kuwayama 2019). Although
Chinese FDI in the region started to diversify, the energy and infrastructure sectors have
25 Net income earnings are calculated as sales minus cost of goods sold, general and administrative expenses, operating expenses, depreciation, interest, taxes, and other expenses. 26 Net income earned by Japanese S&As in LAC amounted to US$2.7 billion (¥302 billion) in FY2018 and US$ 3.3 billion (¥366 billion) in FY2017. 27 For example, current retained earnings in FY2019 by the Japanese S&As in LAC increased by 53% to US$2.0 billion (¥ 216 billion) from US$ 1.3 billion (¥ 143 billion) in FY2018 but decreased by 27% from FY2017 (US$2.5 billion or ¥ 283 billion). The balance of retained earnings amounted to US 8.6 billion (¥ 939 billion) in FY2019, down from US$ 10.3 billion (¥ 1,133 billion) in FY2018, but up from US$ 8.2 billion (¥ 916 billion) in FY2017.

31
been major recipient industries, in which M&As have been increasingly used as a means
of investment (ECLAC 2021c). The Japanese FDI is evenly split among the
manufacturing, services, and primary sectors. Among the manufacturing sectors, the
presence of Transportation Equipment as the FDI recipient sector is increasing, while in
non-manufacturing, Communications is gaining its importance. Among the major LAC
recipient countries of the Japanese FDI, Brazil has been gradually displaced by Mexico
as the FDI to Mexico continues to grow (Kuwayama 2019).
A. Japan’s FDI to LAC
According to statistics by the Bank of Japan, Japan’s FDI abroad continued increasing
until 2019, when it reached a peak of US$ 230 billion and then experienced a sharp fall
of US$ 116 billion in 2020 resulting from the COVID-19 pandemic. Interestingly, Japan’s
outward FDI flows to the LAC region show somewhat a different movement; the FDI
toward LAC reached its peak in 2018 totaling $25 billion, declined to US$ 17 billion in
2019, and recovered to US$ 19 billion in 2020. The combined FDI flows toward LAC
amounted to US$ 73 billion for the four-year period CY2017-CY2020, with the annual
average FDI of roughly US$ 18 billion. The LAC region accounted for roughly 11% of
Japan’s FDI abroad for the same four-year period (Bank of Japan 2021).
According to the data from the Japan External Trade Organization (JETRO), annual
FDI flows to the three major FDI destinations in LAC (namely, Brazil, Mexico, and the
Cayman Islands) account for 18.2%, 7.7%, and 42.8% of Japan’s outward FDI to the LAC
region, respectively, during CY 2011-CY2020. “Other” LAC recipient countries
accounted for the remaining 31.3%. Over the last ten years, FDI flows to Mexico continue
to rise, while those destined to Brazil fluctuate widely from year-to-year and show
disinvestment in some years (i.e., 2015 and 2017). FDI flows to the financial centers such
as the Cayman Islands also show wide year-to-year fluctuations.
Despite a slack in 2014 and 2015, Japan’s FDI stock in LAC continued to rise. Brazil
and Mexico have been the largest recipient countries in the region. Japan’s stock in Brazil
remains high, while that in Mexico it continues to rise (Figure 18A). As a result, the stock
in Mexico has been increasing to catch up with Brazil. The stock of Japan’s outward FDI
in Brazil has been declining since 2012 (Figure 18B).

32
Figure 18: Japan’s FDI flows to and stock in Brazil and Mexico
CY1996-CY2020 (In million US dollars)
A. Flows B. Stock
Source: Author’s elaboration based on information from the Central Bank of Japan and JETRO FDI Statistics.
Information on direct investment income payments 28 indicate that income from
Japan’s FDI in Brazil is two and half times greater than that in Mexico: the annual average
direct investment income in Brazil for the four-year period (CY2017-CY2020) amounted
to US$ 1,548 million, while in Mexico, less than half of US$ 695 million (Figures 19A
and 19 B).
In addition, in Brazil, FDI income generating sectors are more diversified than in
Mexico. In Brazil, in manufacturing, Lumber, Pulp and Paper (US$ 280 million), Iron
and Non-ferrous Metals (US$ 120 million), Foods (US$ 116 million) and Transportation
Equipment (US$ 99 million) are the important sources of FDI income for the Japanese
investing firms. In Brazil’s non-manufacturing, Mining (US$ 344 million), Finance and
Insurance (US$ 192 million), and Wholesale and Retail (US$ 170 million), are also direct
investment income generating sectors (Figure 19A).
On the other hand, in Mexico, the share of manufacturing in total direct investment
incomes is much higher than that of non-manufacturing. Among the manufacturing
sectors, Transportation Equipment (US$ 388 million) alone generates 81% of
manufacturing income and 56% of total FDI income (Figure 19B). In other words, the
sectoral distribution of direct investment income in Mexico is dominated by one sector
and is much less diversified than in Brazil. The observation above is likely related to
28 FDI income payments by partner country measure the total returns within a year on direct investment stocks paid by enterprises in the reporting economy to their foreign investors, by destination countries. It consists of earnings on equity investments plus interests on debt payables by enterprises resident in the reporting economy to the destination country.
-4,000
-2,000
0
2,000
4,000
6,000
8,000
10,000
1996
1997
1998
1999
2000
2001
2002
2003
2004
2005
2006
2007
2008
2009
2010
2011
2012
2013
2014
2015
2016
2017
2018
2019
2020
Mexico Brazil
0
5,000
10,000
15,000
20,000
25,000
30,000
35,000
40,000
1996
1997
1998
1999
2000
2001
2002
2003
2004
2005
2006
2007
2008
2009
2010
2011
2012
2013
2014
2015
2016
2017
2018
2019
2020
Mexico Brazil

33
Mexico’s highly export-oriented trade structure to the United States centered around the
automotive sector on the one hand, and Brazil’s larger domestic market size that has
tended to stimulate inward-looking FDI by multinational companies on the other.
Figure 19: Japan’s FDI income (credit) in Brazil and Mexico, breakdown by
industry/sector, annual average CY2017-CY2020 (US$ millions)
A. Brazil
1,548
743
1161
280
33 "." 4 46120
22 1499
4
806
6 "."
344
9 43 X
170 192
X 30
200
400
600
800
1,000
1,200
1,400
1,600
1,800
B. Mexico
695
479
27 X ”." 13 X X 8
‐8
17 16
388
X
216
”.” "."
‐6
X 5 "."115
50X 4
‐200
0
200
400
600
800
1,000
1,200
1,400
1,600
1,800
Notes: */ Data items with less than three reports are indicated as “X” for confidentiality; **/ When there are no reports, it is indicated as“.”. ***/ “Manufacturing (total)” and “non-manufacturing (total)” are not necessarily equal to the sum of the figures on the table. They also include the undisclosed item “X”, and “Other manufacturing”/ “Other non-manufacturing”, respectively. Source: Author’s elaboration based on information from Central Bank of Japan.
B. Comparison of sales performance
Comparing the sales performance of the Japanese S&As in Brazil and Mexico,29 the
annual average sales for the four-year period (FY2016-FY2019) in Mexico (US$ 37
billion) were larger than in Brazil (US$ 33 billion) (Table 4). Therefore, the sales
29 The annual average number of firms covered in the surveys during the four-year period(FY2016-FY2019)was
396 &As in Mexico and 306 S&As in Brazil.

34
dynamics do not necessarily correspond to that of direct investment income described
above; direct investment income in Brazil is much larger than in Mexico, but Brazil
underperforms Mexico in terms of sales.
It is interesting to note that the corresponding shares of the manufacturing and non-
manufacturing industries in total sales between the two countries show a different sectoral
composition: in the case of Mexico, the ratio is 78: 22 (US$ 28.9 billion vs. US$ 8.2
billion) while that in Brazil, 62: 38 (US$ 20.6 billion vs. US$ 12.8 billion), respectively.
Therefore, the S&As operations in Mexico are more manufacturing-oriented, while those
in Brazil are more non-manufacturing-based (Table 5).
Table 5: Comparison of sales between Brazil and Mexico, by industry/sector, annual average FY2016-FY2019
(US$ million)
Note: Data items by less than three firms are indicated as “X” for confidentiality purposes; In some cases, even when more than three firms are reported, and when the values of “X” can be calculable, confidentiality is also applied. When there are no data reported, it is indicated as “***”. Source: Author’s elaboration based on information from Japan, METI, ibid, Nos. 47-50.

35
A sectoral distribution in sales between the two countries almost coincides with
Japanese FDI stock: the sectoral distribution of Brazil is more diversified than Mexico.
In manufacturing, although Transportation Equipment is by far the largest sales-
generating sector in both countries, in Brazil, high sales values are also reported for Foods,
Non-ferrous metals, Lumber, Wood, Paper and Pulp, and Chemicals. In Mexico, in
contrast, Transportation Equipment alone accounted for 87% of total sales in
manufacturing. In non-manufacturing, Wholesale Trade is the largest sales producing
sector for both countries.
Regarding the automotive sector in Mexico, as shown in Table 6, Japanese
automakers accounted for nearly 30% of Mexico’s car production in 2019, of which 76%
were exported abroad. Japanese automakers such as Nissan, Toyota, Mazda, and Honda
together produced approximately 1.1 million passenger cars and exported approximately
883,000 units that year, accounting for 26% of passenger cars exported by the major
automakers operating in Mexico in 2019, including General Motors, Ford, Fiat Chrysler,
Volkswagen, Kia, among others. Except for Nissan, which sells about one-third of car
production in Mexican domestic markets, the other major automakers export almost entire
production abroad, principally to the United States.30
Table 6: Number of light vehicles produced in and exported from Mexico, by automaker, 2019
(Units of vehicles, as percentages in total %)
AutomakersExports/Production
Ratio
Units of vehicles Share in total (%) Units of vehicles Share in total (%) (B)/(A)(%)
Audi 156,661 4.1 156,127 4.6 99.7
BMW Group a/ 24,755 0.7 23,449 0.7 94.7
FCA Mexico b/ 560,141 14.7 554,225 16.4 98.9
Ford Motor 249,605 6.6 251,454 7.4 100.7
General Motors 864,143 22.7 827,843 24.4 95.8
Honda 204,414 5.4 179,174 5.3 87.7
Kia 286,600 7.5 220,587 6.5 77.0
Mazda 91,830 2.4 70,889 2.1 77.2
Mercedes Benz 59,336 1.6 54,719 1.6 92.2
Nissan 672,700 17.7 442,248 13.1 65.7
Toyota 192,722 5.1 191,669 5.7 99.5
Volkswagen 443,414 11.6 415,921 12.3 93.8
Total of the above 12automakers
3,806,321 100.0 3,388,305 100.0 89.0
Japanese automakers (4) 1,161,666 30.5 883,980 26.1 76.1
Production (A) Exports (B)
Notes: a/ BMW reports information starting April 2019. b/ FCA Mexico includes data from Chrysler and Fiat brands.
Sources: The Author’s elaboration based on INEGI.
30 The degree to which destinations passenger cars are exported varies widely from company to company. For Nissan, 34.3% is for Mexico’s domestic market. On the other hand, about 80 to 90 % of passenger cars produced by GM, FCA, Ford, Toyota, and Honda are exported to the United States. The European markets are also important for Daimler, Mazda, VW, and BMW, with 50.3%, 24.2%, 22.7% and 14.2% exported to Europe in 2020, respectively.

36
In Mexico, the automotive sector was the most important export product group to the
United States in 2019; passenger cars (approx. US$ 100 billion) by all automakers in
Mexico accounted for 28% of total Mexican exports to the United States (US$ 359
billion). Overall, exports by Japanese automakers in Mexico alone can be estimated to be
responsible for almost 7% of total Mexican exports to the United States that year.
As a reminder, exports to third-country markets by Japanese S&As are not accounted
for in Japan’s trade statistics. For example, passenger cars fabricated by Japanese
automakers such as Nissan, Honda, Toyota, and Mazda in Mexico are appropriated as
Mexican exports to the United States. In this regard, the “third-market” export orientation
of the Japanese S&As is conducive to the promotion of “intra-industry” trade (i.e., the
exchange of similar products belonging to the same industry) in North America and the
development of supply-chain networks connecting Mexico with Asia and the United
States.
As shown above, the presence of Japanese companies in Mexico’s automobile and
auto parts industry exemplifies one of Japan’s FDI strongholds in the LAC region; the
number of auto and auto-parts makers established with FDI from Japan totaled 204
companies in 2017, accounting for 15.3% of all foreign-affiliated companies of different
nationalities (1,334 companies), such as the United States (695 companies, 52%), and
Germany (184 companies, 14%). Subsidiaries created in Mexico by FDI from Japanese
parent companies in the United States are not counted in the 204 companies mentioned
above; investment from these companies to Mexico is appropriated as investment from
the United States or funded with indirect investment capital. In effect, when FDI
originates from third countries, the presence of Japanese companies in the Mexican
automotive industry can be even greater (JETRO 2018).
V. Preliminary Findings and Conclusions
China has displaced Japan in LAC trade with the Asia Pacific over the years, and the
ASEAN member countries and India have also challenged Japan’s presence in trade
between LAC and the Asia-Asia Pacific in recent years. This rather pessimistic view of
the Japan-LAC commercial relationship based on bilateral trade statistics drastically
changes when business activities of Japanese subsidiaries and affiliates (S&As) operating
in the LAC region are considered. The recent annual surveys of “Basic Survey on

37
Overseas Business Activities” conducted by Japan’s Ministry of Economy, Trade, and
Industry (METI) bring to light the large-scale operations of Japanese S&As, as their
business in LAC is highly globalized and multi-faceted, scale of which goes far beyond
Japan’s official trade and investment statistics, or LAC countries bilateral statistics with
Japan.
Total sales of overseas Japanese S&As worldwide in FY2019 amounted to US$ 2.41
trillion, an equivalent of 49% of Japan’s GDP in CY2019 (US$ 5.08 trillion). Sales by
the Japanese S&As in LAC are quite impressive as well: despite a decline from FY2018,
their sales in FY209 amounted to US$ 106 billion, equivalent to 4.1% of total sales
worldwide. These figures provide robust evidence for and testify to the S&As’ highly
globalized nature and wide scope of business operations of these firms in LAC.
As argued in this paper, the business scale of Japanese S&As in LAC is impressive,
but only a small part of that trade is appropriated in LAC’s bilateral trade statistics with
Japan. Sales values by the S&As in LAC’s domestic markets and their exports to extra-
regional and intra-regional third country markets are much larger compared to their
exports back to Japan. More precisely, Japanese S&As in LAC exported US$ 55 billion
worth of products and services to third country markets accounting for 50% of their total
sales (US$ 110 billion) as the annual average during the four-year period (FY2016-
FY2019). In addition, during the same period, almost 45% of total sales (US$ 49 billion)
corresponded to the sales in LAC’s local/domestic markets. Sales back to Japan
accounted for only 5% of their total sales (US$ 6 billion). In short, sales back to Japan by
the S&As are only a small fraction of LAC's bilateral trade with Japan. Domestic sales in
LAC countries and exports to third-country markets are not included in Japan’s trade
statistics. Profits repatriated to Japan are appropriated in Japan’s current account of the
balance of payments.
Brazil, Mexico, and Argentina are the three largest sales markets for Japanese S&As
in the LAC region. Interestingly, Brazil has been taken over by Mexico as the largest sales
market destination, which has increasingly integrated into global value chains by
Japanese S&As in LAC, centered around the automotive sector. Besides the three
countries, other LAC countries combined represent 36% of the Japanese S&As total sales
in LAC, thereby constituting one of the most important sales destinations in the region.
While Mexico has overtaken Brazil in LAC’s S&As sales, direct investment income
accruing in Brazil from FDI is much higher than in Mexico. This observation suggests

38
that while sales by the S&As remain sluggish in Brazil, in relative terms, profit rates are
higher in Brazil than in Mexico. The scope of S&As activities in Brazil seems more
diversified than that in Mexico.
The S&As in LAC show a high propensity to export, a trait probably attributable to
the bourgeoning automotive sector, which has been the most dynamic exporting sector in
recent years, accounting for 41% of total LAC sales in FY2019. North America is a
principal third-country export market for these firms. Latin American intra-regional
markets have also become major third-country export destinations for these S&As. The
high export-propensity of Japanese affiliates in LAC suggests that Mexico and Brazil,
and to a lesser extent Argentina, have become an important export platform to intra- and
extra-regional third markets in parallel to expanding S&As sales in LAC domestic
markets, which is attributable to the large market-size of some countries and increasing
consumers’ purchasing power.
On a similar note, the scale of procurements by the S&As in LAC is also impressive;
these companies sourced some $ 65 billion worth of inputs and services as the annual
average during the four-year period, with 46% of these procurements being supplied from
LAC local/domestic markets (US$ 30 billion) and some 19% from third country markets
(US$ 12 billion). The remaining 35% of procurements (US$ 23 billion) were sourced
directly from Japan. Only inputs and materials sourced from Japan are included in
bilateral trade statistics of LAC countries with Japan. Notably, the share of purchases
from “domestic/local firms” has been on the rise in recent years. This trend, in turn,
suggests that operations of Japanese companies are increasingly integrated into regional
value-chains (RVCs), especially in the automotive and natural resources sectors.
Compared to the world’s sectoral distribution, S&As operating in the LAC region is
skewed toward non-manufacturing, in terms not only of the number of companies
engaged but also sales and procurement volumes, ordinary profit, and capital investment.
Volatile profits characterize the S&As performance in LAC, some of which might be
explained by LAC’s specialization in natural resource-related sectors, prices of which are
subject to wide cyclical fluctuations. LAC’s sectoral breakdown in sales substantially
differs from that of ASEAN (10) countries, whose sales values in manufacturing are much
larger and more diversified by sectors.
In sum, when measured in dollar terms, business operations by Japanese S&As in

39
LAC are almost triple the size of LAC’s bilateral trade with Japan. A significant part of
their global business resources is exported to, or sourced from, third countries, and this
often leads to seriously underestimating the magnitude of trade and investment by these
S&As in the LAC region. The S&As operations in LAC are very much globalized in their
own light and form an integral part of the parent companies’ global business strategies.
Thanks to the long-standing engagement in the manufacturing industries, their business
operations are conducive not only to employment creation but also to export expansion
(thereby foreign exchange earnings) and global and regional value-chain developments
in the region.
A highly globalized nature and scope of business activities of overseas Japanese
S&As in LAC pointed out in this paper do not necessarily conclude that business
operations of Japanese multinationals in LAC are more globalized than the Chinese or
Korean counterparts. However, detailed information on business activities of overseas
companies tabulated annually by Japan’s METI reveals a highly globalized nature of
business by Japanese multinationals, scope of which goes far beyond what official trade
and investment statistics might indicate.

40
Bibliography Bank of Japan (2021), Outward / Inward Direct Investment, breakdown by Region and Industry, [Online] ECLAC (2021a), Anuario Estadístico de América Latina y el Caribe 2020 = Statistical Yearbook for Latin America and the Caribbean 2020, (LC/PUB.2021/1-P), Santiago de Chile. ECLAC (2021b), International Trade Outlook for Latin America and the Caribbean 2020: Regional integration is key to recovery after the crisis (LC/PUB.2020/21-P), Santiago. ECLAC (2021c), Foreign Direct Investment in Latin America and the Caribbean, 2021, (LC/PUB.2021/8-P), Santiago de Chile. ECLAC (2010), Latin America and the Caribbean in the World Economy 2009-2010: A crisis generated in the centre and a recovery driven by the emerging economies, (LC/G.2467-P), Santiago, Chile, December. Hamaguchi, Nobuaki (2018), “Japan’s International Strategy and Latin America””, in N. Hamaguchi, J. Guo, and C.S. Kim eds., Cutting the Distance: Benefits and Tensions from the Recent Active Engagement of China, Japan, and Korea in Latin America, Kobe University Social Science Research Series, Springer. Hosono, Akio, and Carlos Magno Campos da Rocha, and Yutaka Hongo (2015), Development for Sustainable Agriculture: The Brazilian Cerrado, Palgrave Macmillan, October. Hosono, Akio, Michiko Iizuka and Jorge Katz eds., (2016), Chile’s Salmon Industry: Policy Challenges in Managing Public Goods, Springer. Instituto Nacional de Estadística y Geografía (INEGI), (2020, 2021), “Reporte Mensual: Registro administrative de la industria automotriz de vehículos ligeros”, Mexico, el 8 de enero, 2020, el 8 de enero 2021. Inter-American Development Bank (IDB) (2013), Japan and Latin America and the Caribbean: Building a Sustainable Trans-Pacific Relationship, Washington D.C. Inter-American Development Bank (IDB) (2016), A Virtuous Cycle of Integration: The Past, Present, and Future of Japan-Latin America and the Caribbean Relations, Washington D.C. Japan, METI (Ministry of Economy, Trade, and Industry) (2000, 2001, 2002, 2003, 2004, 2005, 2006, 2007, 2008, 2009, 2010, 2011, 2014, 2015, 2016, 2017, 2018, 2019, 2020, 2021), “kaigai jigyo katsudo kihon chosa” [Basic (trend) survey of overseas business activities] Nos. 31- 50. JETRO (Japan External Trade Organization), (2018), (in Japanese) [izentoshite shinshituyochi ga ookii mekishiko no jidoushabuhinsangyou] (“Still there is a lot of space for Japanese companies expansion in the Mexican autoparts industry”). March. JETRO (Japan External Trade Organization), (2021), Japanese Trade and Investment Statistics, [Online] https://www.jetro.go.jp/en/reports/statistics.html

41
JICA/ECLAC (2014), Study on inclusive development in Paraguay: International cooperation experiences, (LC/L.3711), ECLAC, Santiago de Chile, March. Kuwayama, Mikio (2019), “Reappraisal of Japan-LAC Trade and Investment Relations Amid China’s Ascendance”, Discussion Paper Series (DP2019-18), Research Institute for Economics and Business Administration, Kobe University (RIEB), September. Kuwayama Mikio (2015), “Japan Latin America relations, then and now: The Japan model of economic engagement”, Revista Digital Mundo Asia Pacífico 4 (7), 6-42. Myers, Margaret and Akio Hosono (2019), “Japan Engagement with LAC: Advancing Relations in an Era of Uncertainty”, Japan-Latin America Report, Inter-American Dialogue (IAD) and Japan Association of Latin America and the Caribbean (JALAC), April. Myers, Margaret and Mikio Kuwayama (2016), “A New Phase in Japan-Latin America and the Caribbean Relations”, Japan-Latin America Report, Inter-American Dialogue (IAD) and Japan Association of Latin America and the Caribbean (JALAC), February. Rosales, Osvaldo and Mikio Kuwayama (2012), China and Latin America and the Caribbean: Building a Strategic Economic and Trade Relationship, (LC/G.2519-P), Libro de la CEPAL, No.114, ECLAC, Santiago de Chile. Tajitsu, Naomi, Hyunjoo Jin, Heekyong Yang, Tim Hepher, Ilona Wissenbach and Christoph Steitz (2019), “Factbox: Auto, other industries' manufacturing presence in Mexico”, Reuters. June 1. Titelman, Daniel y Esteban Pérez Caldentey (2015), “Macroeconomía para el desarrollo en América Latina y el Caribe: nuevas consideraciones sobre las políticas anticíclicas”, en Alicia Barcena y Antonio Prado eds., Neoestructuralismo y corrientes heterodoxas en América Latina y el Caribe a inicios del siglo XXI, Libro de la CEPAL, No. 312, ECLAC and International Development Research Centre of Canada (IDRC), Santiago de Chile, abril.