globalization of food systems - agecon searchageconsearch.umn.edu/bitstream/14304/1/tr05-01.pdf ·...
TRANSCRIPT

The Food Industry Center University of Minnesota
Printed Copy $25.50
The Globalization of Food Systems: A Conceptual Framework and Empirical Patterns
Benjamin Senauer and Luciano Venturini
Benjamin Senauer Professor, Applied Economics Co-Director, The Food Industry Center University of Minnesota 332 Classroom Office Building
Luciano Venturini
Professor, Economics Catholic University of Piacenza Piacenza, Italy
St. Paul, MN 55108 1994 Buford Avenue
The work was sponsored by The Food Industry Center, University of Minnesota, 317 Classroom Office Building, 1994 Buford Avenue, St. Paul, Minnesota 55108-6040, USA. The Food Industry Center is an Alfred P. Sloan Foundation Industry Study Center.

2
The Globalization of Food Systems: A Conceptual Framework and Empirical Patterns
Benjamin Senauer and Luciano Venturini
Abstract
This paper discusses a number of stylized facts and empirical patterns regarding agri-food
trade flows as well as foreign direct investments in food processing and retailing. This
evidence supports the hypothesis of an increasingly global food system. We identify the main
factors at work such as push/supply side, pull/demand-side, and enabling/external factors. We
show how the shift from national to global retailing is a recent phenomenon whose relevance
for the globalization of upstream sectors of the food system are not yet appropriately
addressed. Broadly, we argue that while the process of food globalization has long been
regarded as a process largely dominated by the internationalization of food manufacturing,
the emergence of global retailers is a further powerful engine of globalization which will
exert a powerful impact with far reaching implications for the competitive environment and
the rules of the game in food systems.
KEYWORDS: globalization, global food system, food manufacturers, global food retailing

3
Working Paper 05-01 The Food Industry Center University of Minnesota
The Globalization of Food Systems: A Conceptual Framework and Empirical Patterns
Benjamin Senauer and Luciano Venturini
Copyright © 2005 by [Benjamin Senauer and Luciano Venturini]. All rights reserved. Readers may make verbatim copies of this document for non-commercial purposes by any means, provided that this copyright notice appears on all such copies. The analyses and views reported in this paper are those of the authors. They are not necessarily endorsed by the Department of Applied Economics, by The Food Industry Center, or by the University of Minnesota. The University of Minnesota is committed to the policy that all persons shall have equal access to its programs, facilities, and employment without regard to race, color, creed, religion, national origin, sex, age, marital status, disability, public assistance status, veteran status, or sexual orientation. For information on other titles in this series, write The Food Industry Center, University of Minnesota, Department of Applied Economics, 1994 Buford Avenue, 317 Classroom Office Building, St. Paul, MN 55108-6040, USA; phone (612) 625-7019; or E-mail [email protected]. Also, for more information about the Center and for full text of working papers, check our World Wide Web site [http://foodindustrycenter.umn.edu].

4
TABLE OF CONTENTS
1. Introduction.…………………………………………………………………………..6
2. International Trade Patterns…………………………………………………………..7
3. Foreign Direct Investments and the Globalization of the Food Industry…………….11
a. The Globalization of the Food Industry……………………………………...11
b. The Strategies of Leading Food Manufacturers……………………… …… 17
4. The Internationalization of the Retail Industry………………………………….…...21
a. The Strategies and Competitive Position of Leading International Retailers..23
b. The Spread of Supermarkets in Developing Countries………………………26
c. Private Label Foods as a Growing Global Phenomenon……………………28
d. International Restaurant Chains……………………………………………..29
5. Looking for a Conceptual Framework……………………………………………….31
6. Summary and Concluding Remarks………………………………………………….36
7. References……………………………………………………………………………38
TABLES
Table 1..................................................................................................................................8
Table 2................................................................................................................................10
Table 3................................................................................................................................12
Table 4................................................................................................................................13
Table 5................................................................................................................................14
Table 6................................................................................................................................15
Table 7................................................................................................................................17
Table 8................................................................................................................................22

5
Table 9................................................................................................................................23
Table 10..............................................................................................................................27
Table 11..............................................................................................................................29

6
1. Introduction An increasing internationalization of firms and integration of markets are the most relevant
trends in international economy. Several forces combine to drive these trends, including the
decline in barriers to international trade and investment flows and the increasing freedom to
move goods, services and knowledge among countries and different locations. Advances in
transport and communication technologies have created new opportunities for the
development and growth of multinational firms. Advances in information processing and
telecommunications enhance multinationals’ abilities to coordinate complex functions over
great distances resulting in lower costs of cross-border coordination (Baldwin and Winters,
2004). These forces have structural, organizational and strategic consequences in a growing
range of industries and a strong impact on trade patterns, specialization, foreign direct
investments (FDI), and global capital flows. They have also enhanced the globalization of
food systems. If you visit a local supermarket, while travelling abroad, and look closely at the
U.S. or E.U. brands being sold that are familiar, you would find that most were not
manufactured in the United States or European Union. In most cases, they would come from
a plant either in that country or in that region. Similarly, Americans and Europeans have
gotten accustomed to virtually any fruit or vegetable being available year around at their local
supermarket, which is made possible by international sourcing. As a consequence
agricultural producers, food manufacturers and retailers operate in a changing competitive
environment. New views of the food system and new strategic implications are emerging.
The objective of this paper is to examine the development of economic integration and global
configuration in food systems. The issue of globalization of the food system has been
addressed previously, both theoretically and empirically, by focusing on agricultural trade
and FDI in food manufacturing. In this paper, we pay particular attention to the role played

7
by the process of internationalization of the food retail industry. There are two reasons for
this. The first one is the increasing strategic role that retailers play in the evolution of food
systems in advanced countries. The second reason is that retailing internationalization,
although lagging behind that of manufacturing, is now catching up. Retailers are increasingly
involved in processes of international expansion.
The paper is structured as follows. Section 2 gives an overview of a number of empirical
patterns regarding agri-food trade flows. The objective of this section is to describe the recent
evolution of agricultural trade patterns. Section 3 analyzes foreign FDI in food
manufacturing, while Section 4 presents the international activities of retailers. Section 5
develops a conceptual framework to identify the specific nature of the globalization of food
systems. Finally, Section 6 highlights the main findings and offers a few concluding remarks,
as well as some suggestions for future research.
2. International Trade Patterns
In this section, we present a description of a number of empirical patterns regarding agri-food
trade flows. The past two to three decades have seen important changes in the international
trade of agri-food products. One relevant aspect is the increasing importance of processed
agricultural products, as opposed to agricultural raw products. Table 1 shows that over the
period 1970-1999, the share of manufacturing in total exports increased for both developed
and developing countries, with a dramatic increase in developing countries exports. The table
also shows that the share of processed foods in total world agri-food trade increased from
27.4 per cent in 1970 to 58.2 per cent by the end of the 1990s. The increase is similar for both
developing countries (from 24 per cent in 1970 to 52 per cent in 1999) and developed
countries (from 29 per cent to 61 per cent).

8
Several studies have noted that the relative importance of traditional export commodities
(cocoa, coffee, sugar, tea) has declined while the trade in products such as fruits and
vegetables, poultry, and dairy products increased. A large part of these products are exported
in processed form (Athukorala and Sen, 1998; Athukorala and Jayasuriya, 2003; Rae and
Josling, 2003). The shift away from commodities towards processed products in international
agricultural trade is also confirmed by a recent WTO report examining trade patterns over the
period 1985-2003 (WTO, 2004). The report shows that while the total share of agricultural
products in world trade has declined, the trend towards more trade in processed goods can be
observed across regions, countries and agricultural products throughout the 1990-2002
period.
Table 1. World Export Composition, 1970-1999 (selected years; percent)
Developed
Countries Developing Countries
Total
1970 73.5 27.2 66.5 1980 74.2 45.9 69.5 1990 80.6 70.6 78.8
Share of manufacturing in total exports
1999 83.2 81.6 82.8 1970 7.6 11.9 8.5 1980 7.1 5.9 6.6 1990 6.4 7 6.5
Share of processed food in total exports
1999 5.8 5.6 5.8 1970 29.1 23.8 27.4 1980 47.1 39.4 44.6 1990 54.3 47.3 52.4
Share of processed food in agri-food products (including processed food)
1999 60.9 52.3 58.2 Source: Athukorala and Jayasuriya, 2003, pp. 24-25.
Obviously, the decline in the share of agricultural products in total trade is the result of the
relevant increase of exports of several manufactured and service industries. Similarly, the
decline in the share of agricultural commodities is due to the existence of differences in
export value growth between such commodities and processed products. While processed
foods’ share of the value of total global agricultural trade has tended to increase steadily, the
changes in the structure of agricultural trade has been particularly significant in recent years.

9
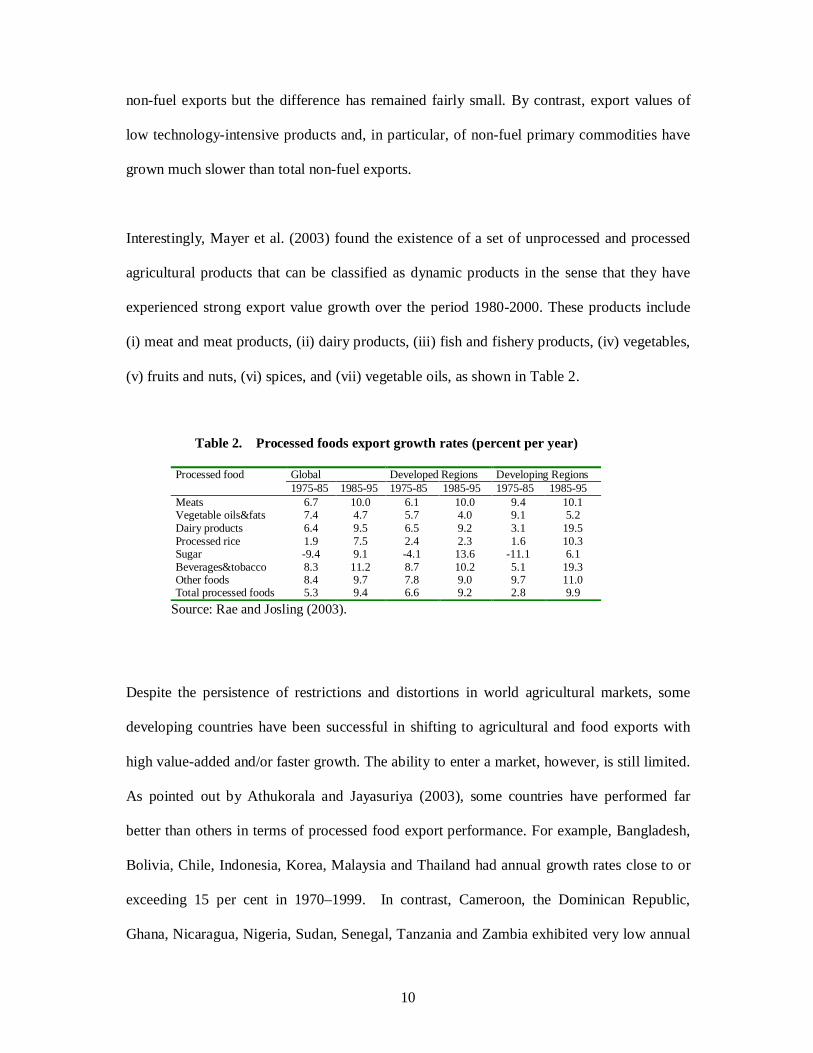
The data presented in Table 2 show that between 1975 and 1985 the value of global
processed food trade increased by 5 percent per year, but grew at almost double that rate from
1985 to 1995.
It is also important to note that developing countries are taking advantage of this growth.
Over the past decade, the growth of processed food exports from these countries has
exceeded that from the developed regions. While the growth in the value of processed food
exports during the former decade was fuelled mainly by exports from developed countries,
processed food exports from developing countries played a more important role over the
latter decade. In 1985 processed foods accounted for 55 percent of the total value of
agricultural exports of developed countries, but only 40 percent of those of developing
countries. Ten years later, processed foods’ contribution had grown to almost 56 percent of
the developing world’s agricultural exports, and 66 percent of those of developed countries
(Rae and Josling, 2003). Although one-half of global processed food trade takes place
between developed countries, trade between the developing regions is increasing in response
to rapid growth in demand for these foods in the developing world (Rae and Josling, 2003, p.
164).
In a recent paper, Mayer et al. (2003) have identified a set of dynamic products in world
exports, namely those products characterized by the highest trend growth rates for the period
1980-2000. Their findings show that export values of all product started to grow rapidly in
the mid-1980s. They also show that export value growth of high-technology intensive
products was strongest, with the growth difference compared to the other product categories
strongly increasing after 1993. Export values of medium technology-intensive products, as
well as of labour- and resource-intensive products have also grown faster than that of total
10
non-fuel exports but the difference has remained fairly small. By contrast, export values of
low technology-intensive products and, in particular, of non-fuel primary commodities have
grown much slower than total non-fuel exports.
Interestingly, Mayer et al. (2003) found the existence of a set of unprocessed and processed
agricultural products that can be classified as dynamic products in the sense that they have
experienced strong export value growth over the period 1980-2000. These products include
(i) meat and meat products, (ii) dairy products, (iii) fish and fishery products, (iv) vegetables,
(v) fruits and nuts, (vi) spices, and (vii) vegetable oils, as shown in Table 2.
Table 2. Processed foods export growth rates (percent per year)
Global Developed Regions Developing Regions Processed food 1975-85 1985-95 1975-85 1985-95 1975-85 1985-95
Meats 6.7 10.0 6.1 10.0 9.4 10.1 Vegetable oils&fats 7.4 4.7 5.7 4.0 9.1 5.2 Dairy products 6.4 9.5 6.5 9.2 3.1 19.5 Processed rice 1.9 7.5 2.4 2.3 1.6 10.3 Sugar -9.4 9.1 -4.1 13.6 -11.1 6.1 Beverages&tobacco 8.3 11.2 8.7 10.2 5.1 19.3 Other foods 8.4 9.7 7.8 9.0 9.7 11.0 Total processed foods 5.3 9.4 6.6 9.2 2.8 9.9
Source: Rae and Josling (2003).
Despite the persistence of restrictions and distortions in world agricultural markets, some
developing countries have been successful in shifting to agricultural and food exports with
high value-added and/or faster growth. The ability to enter a market, however, is still limited.
As pointed out by Athukorala and Jayasuriya (2003), some countries have performed far
better than others in terms of processed food export performance. For example, Bangladesh,
Bolivia, Chile, Indonesia, Korea, Malaysia and Thailand had annual growth rates close to or
exceeding 15 per cent in 1970–1999. In contrast, Cameroon, the Dominican Republic,
Ghana, Nicaragua, Nigeria, Sudan, Senegal, Tanzania and Zambia exhibited very low annual

11
growth rates. There is also evidence that generally countries belonging to the high- and
middle-income groups have performed better compared to the low-income countries.
3. Foreign Direct Investments and the Globalization of the Food Industry
The last two decades have seen very strong growth of multinational activity. Foreign direct
investment (FDI) has grown much faster than either trade or income fuelled by cross-border
mergers and acquisitions.
The Globalization of the Food Industry
Table 3 shows that food transnational companies (TNCs) are well represented in the list of
the largest 100 TNCs. Notwithstanding the reduction of their number in 1999, food
manufacturing (including beverages and tobacco) is one of the industries with a very high
number of entries. Only three industries (petroleum and mining, electronics/electrical
equipment/computers, and motor vehicles and parts) have a number of entries greater than
food manufacturing. The same picture is provided by the analysis of the “transnationality
index” (TNI) This index is calculated by UNCTAD World Investment Reports as the average
of three ratios: foreign assets to total assets, foreign sales to total sales, and foreign
employment to total employment. The table shows that food manufacturing is characterized
by a very high TNI (78.9 percent in 1999), second only to the media industry which topped
the list with 87 percent. Moreover, food manufacturing became more transnationalized over
the period 1990-1999. The transnationality index of food TNCs increased substantially, from
59 to 79 percent. It is interesting to note that this increase of around 20 percentage points is
the greatest. Multinational activity is, therefore, a relevant and increasing phenomenon in
food manufacturing. By contrast, the retail industry has been among the least
transnationalized, being characterized by a very low value of the index (37.4 in 1999).

12
Table 4 again gives the average transnationality index per industry as well as the average
transnationality index of the largest 5 TNCs that have at least five entries on the lists for both
1990 and 1999. The table indicates that, in general, the TNI of the largest TNCs is greater
than the average TNI per industry suggesting a positive relationship between firm’s size and
transnationality. The table also shows that the transnational index of the top five firms
increased substantially over the period 1990-1999. The increase was particularly strong for
the food and beverage firms, which exhibited the largest gains (28 percentage points). In
summary, the trend towards globalization in food manufacturing during the 1990s has been
very strong; food manufacturing is now characterized by one of the greatest degree of
transnationality. A key role in this process has been played by the major food TNCs that
have pursued such strategies much more intensively than TNCs in other industries.
Table 3. Industry Composition of the largest 100 TNCs, 1990, 1995, and 1999
Number of entries Average TNI* (per cent) Industry 1990 1995 1999 1990 1995 1999 Media
2
2 2 82.6 83.4
86.9
Food/beverages/tobacco 9 12 10 59.0 61.0 78.9 Construction 4 3 2 58.8 67.8 73.2 Pharmaceuticals 6 6 7 66.1 63.1 62.4 Chemicals 12 11 7 60.1 63.3 58.4 Petroleum and mining 13 14 13 47.3 50.3 53.3 Electronics/electrical equipment/computers
14 18 18 47.4 49.3 50.7
Motor vehicle and parts 13 14 14 35.8 42.3 48.4 Metals 6 2 1 55.1 27.9 43.5 Diversified 2 2 6 29.7 43.6 38.7 Retailing - - 4 - - 37.4 Utilities - - 5 - - 32.5 Telecommunications 2 5 3 46.2 46.3 33.3 Trading 7 5 4 32.4 30.5 17.9 Machinery/engineering 3 1 - 54.5 37.9 - Other 7 5 4 57.6 59.4 65.7 Total/average 100 100 100 51.1 51.5 52.6
* The “transnationality index” (TNI) is calculated as the average of three ratios: foreign assets to total assets, foreign sales to total sales, and foreign employment to total employment. Source: UNCTAD, World Investment Report (2001, p. 101).

13
Table 5 presents the geographical patterns of multinational activities. The table shows that
there is an uneven geographical distribution of FDI by industry. In other words, the level of
geographic concentration varies by industry. It is interesting to note that the food and
beverage industries present the lowest levels of geographical concentration. Foreign affiliates
in food and beverages operate in 101 countries while those in semiconductors are located in
only 31 countries. According to the World Investment Report (Unctad, 2001), this evidence
suggests that the more advanced the technology, the higher the level of concentration. This
assessment is based on the two following assumptions. First, the location of foreign affiliates
tends to agglomerate in a small number of selected locations in the case of high-technology
industries, because only locations with appropriate technological capabilities can receive high
technology FDI. Second, in terms of technological intensity, food manufacturing is a low
technology industry. However, this conclusion may be misleading to the extent that it is
based on a partial view of the nature of the food industry and, consequently, may suggest an
inappropriate analysis of food industry globalization.
Table 4. Average transnationality index per industry and of the largest 5 TNCs in each industry, 1990, 1995 and 1999 (percent)
Industry Year Average TNI per
industry Average TNI of the largest 5 TNCs
1990 47.3 57.7 1995 50.3 64.8
Petroleum
1999 53.3 70.1 1990 35.8 34.7 1995 42.3 38.6
Motor vehicols
1999 48.4 41.4 1990 47.4 36.1 1995 49.3 61.1
Electronics/electrical equipment
1999 50.7 59.6 1990 66.1 47.1 1995 63.1 68.0
Pharmaceuticals
1999 62.4 67.3 1990 60.1 51.6 1995 63.3 61.1
Chemicals
1999 58.4 53.9 1990 59.0 60.8 1995 61.0 76.9
Food/beverages
1999 78.9 88.7 Source: UNCTAD, World Investment Report (2001, p. 101-102).

14
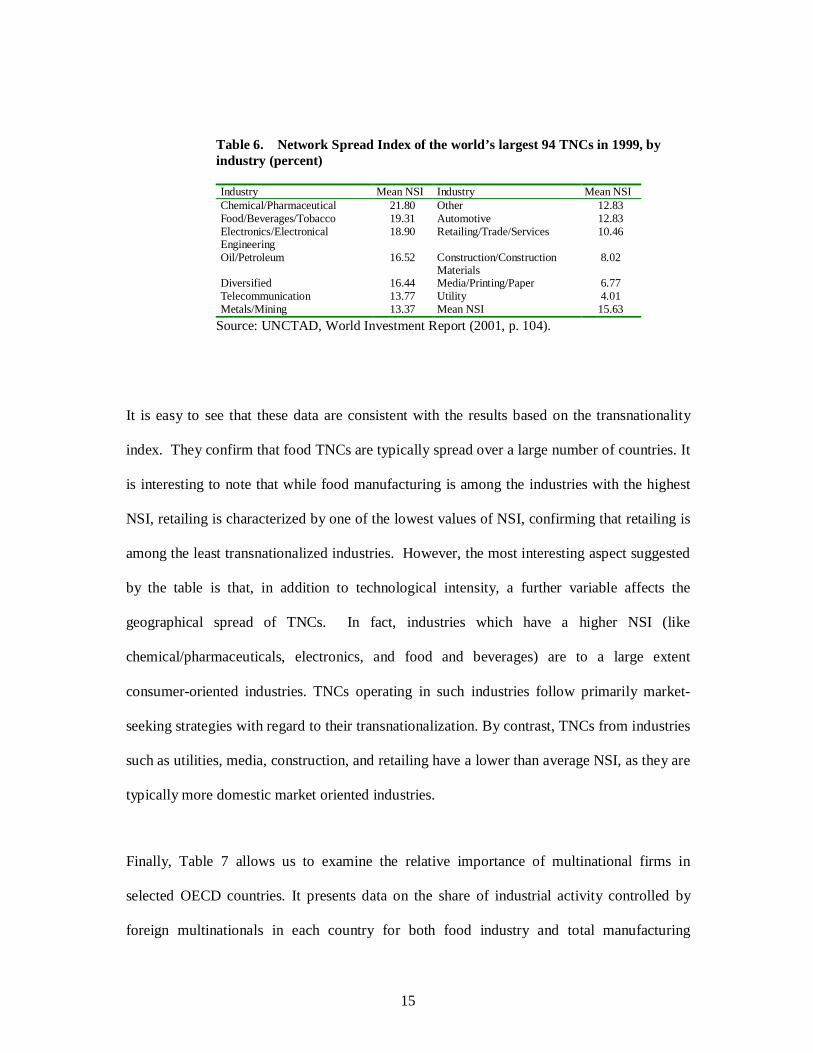
For this reason, it is important to complete the analysis with the data presented in Table 6.
This table allows a richer picture based on the analysis of the Network Spread Index (NSI) of
the world’s largest TNCs. While the transnationality index assesses the degree to which
companies expand their activities outside of their home countries, the NSI represents a
complementary concept of measuring the transnationalization of companies focused on the
extent to which firms follow strategies of cross-border geographical diversification by
locating their activities in foreign countries. The index is calculated by UNCTAD World
Development Reports as a ratio of the number of foreign countries in which a TNC locates its
activities (N) as a percentage of the number of foreign countries in which it could,
potentially, have located (N*). The latter is taken as the number of countries that have inward
stocks of FDI (minus 1, excluding the home country of the TNC) in the particular year to
which the calculations refer.
Table 5. Geographical concentration of foreign affiliates in selected manufacturing industries, by technological intensitya, 1999 (share of total number of affiliates)
High technology Medium Technology Low Technology Share of
industry total Semi-conductors
Biotechnology Automobile TV and radio
receivers
Food and beverages
Textile
Top 3 host countries
0.496 0.627 0.294 0.356 0.237 0.287
Top 5 host countries
0.629 0.710 0.440 0.502 0.353 0.401
Top 10 host countries
0.787 0.852 0.710 0.696 0.561 0.601
Top 20 host countries
0.945 0.953 0.884 0.893 0.747 0.795
Memorandum Total number of foreign affiliates
272 169 1296 253 2250 1445
Total number of host countries
31 28 55 36 101 77
a Calculated as the share of the number of foreign affiliates compared to total foreign affiliates in the world in each specific industry. Source: UNCTAD, World Investment Report (2001, p. 68).
15
It is easy to see that these data are consistent with the results based on the transnationality
index. They confirm that food TNCs are typically spread over a large number of countries. It
is interesting to note that while food manufacturing is among the industries with the highest
NSI, retailing is characterized by one of the lowest values of NSI, confirming that retailing is
among the least transnationalized industries. However, the most interesting aspect suggested
by the table is that, in addition to technological intensity, a further variable affects the
geographical spread of TNCs. In fact, industries which have a higher NSI (like
chemical/pharmaceuticals, electronics, and food and beverages) are to a large extent
consumer-oriented industries. TNCs operating in such industries follow primarily market-
seeking strategies with regard to their transnationalization. By contrast, TNCs from industries
such as utilities, media, construction, and retailing have a lower than average NSI, as they are
typically more domestic market oriented industries.
Finally, Table 7 allows us to examine the relative importance of multinational firms in
selected OECD countries. It presents data on the share of industrial activity controlled by
foreign multinationals in each country for both food industry and total manufacturing
Table 6. Network Spread Index of the world’s largest 94 TNCs in 1999, by industry (percent) Industry Mean NSI Industry Mean NSI Chemical/Pharmaceutical 21.80 Other 12.83 Food/Beverages/Tobacco 19.31 Automotive 12.83 Electronics/Electronical Engineering
18.90 Retailing/Trade/Services 10.46
Oil/Petroleum 16.52 Construction/Construction Materials
8.02
Diversified 16.44 Media/Printing/Paper 6.77 Telecommunication 13.77 Utility 4.01 Metals/Mining 13.37 Mean NSI 15.63
Source: UNCTAD, World Investment Report (2001, p. 104).

16
provided by a recent report of OECD. Unfortunately, the number of countries for which data
are available is limited to 12. The table shows that cross-country differences are very
relevant. By the end of the 1990s the percentage of turnover (sales) generated by food firms
under foreign control varied from 57.0 per cent in Hungary to less than 1.0 per cent in Japan.
In most other countries, this percentage was 15-30 per cent. The table also shows that in food
manufacturing the percentage of production controlled by foreign multinationals is lower
than that in most other manufacturing industries. The unweighed average share for food
industries in 1998-99 is 23.1 percent, lower than the average share for total manufacturing,
which is 30.5 percent. This is consistent with the well-known importance of local/national
production in food processing. Over time, however, the patterns are similar. The presence of
foreign affiliates increased for both food industry and total manufacturing. In the case of food
industry, between 1994-95 and 1998-99, the share of production controlled by foreign
multinationals increased in most countries. There are, however, notable exceptions such as
Germany, the UK and Turkey where the share tends to decrease. Although these data reveal
that the role of food TNCs activity appears to be weaker than in other industries, they confirm
the increasing presence of TNCs in several countries and the contribution of these firms to
the strengthening of the process of food globalization.

17
The Strategies of Leading Food Manufacturers Nestlé, headquartered in Vevey, Switzerland, has become the world’s largest food processor
with such brands as Perrier bottled water, Nescafè coffee and a product mix that includes
pastas, dairy products, and chocolates. Kraft Foods, the largest U. S.-based food
manufacturer, was divested by Philip Morris the giant tobacco company, which has changed
its name to Altria. Although an independent company with brands such as Kraft cheeses,
Nabisco crackers and cookies, and Oscar Mayer processed meats, Kraft is still 84 percent
owned by Altria. ConAgra has over 30 lines of branded packaged and frozen food products,
which include Banquet, Chef Boyardee, Healthy Choice and Van Camp's. It is also a large
supplier to the food service industry. Unilever Group combines the Dutch Unilever N V. and
the British Unilever PLC. In addition to well known food brands, such as Birds Eye and
Table 7. Share of turnover (sales) or production controlled by foreign affiliates in food , beverages and tobacco industries (ISIC 15/16 and in total manufacturing). 1994 1995 1996 1997 1998 1999 Czech Rep. F 11.4 13.6 18.7 TM 17.8 21.7 27.1 Finland F 6.7 6.0 7.7 5.3 14.5 TM 10.1 12.7 13.7 14.3 16.2 Germany F 13.3 12.6 11.9 11.8 .. TM 13.1 12.8 12.5 10.8 .. Hungary F 52.9 51.4 51.5 57.0 59.7 TM 56.6 62.4 66.1 70.1 73.3 Ireland F 35.8 36.1 38.1 39.0 36.6 TM 61.6 65.2 66.4 69.2 72.3 Japan F 0.7 0.7 0.9 0.9 1.0 TM 1.4 1.3 1.2 1.6 1.8 Netherland F 28.8 29.4 30.1 32.5 TM 30.3 29.7 30.4 32.1 Norway F 3.8p 13.2p 11.5 10.6 15.6 TM 13.0p 19.5p 18.9 19.9 23.9 Poland F 19.8 31.5 TM 19.4 33.8 Sweden F 17.4 19.9 26.9 26.4 25.8 TM 17.4 21.6 20.8 19.6 21.9 Turkey F 14.0 15.4 16.4 13.4 11.0 TM 11.1 12.4 12.8 12.3 11.5 U.K. F 23.7 21.8 19.1 TM 33.2 31.4 40.9
F = food industry, TM = total manufacturing, p = production. Source: OECD Statistics, ‘Measuring Globalization: the role of multinationals in OECD Economies’, 2001 edition.

18
Lipton, Unilever also markets a broad mix of non-food products.i PepsiCo is thought as a
soft drink company, but it's fastest growing business segment has been Frito-Lay, which sells
snack products in over 120 countries through company-owned businesses and affiliated
companies. Archer Daniels Midland is a large oilseed and corn processor. Tyson, which was
already the largest chicken processor, purchased the beef and pork giant IBP, to become the
world's largest meat processor serving both food retailers and food service. Cargill, the
largest U.S. private corporation, is still 85 percent owned by the descendants of the founding
families. Cargill has increasingly become a value-added, first-stage processor supplying
second-stage food manufacturers who make and sell consumer food products. Good
examples would be the high fructose corn syrup used in soft drinks as a sweetener or the
cooking oil for fast food operators. Cargill has also moved into branded products such as
Excel beef and Honeysuckle White poultry. Coca-Cola has a truly global brand and sells soft
drinks and other beverages in almost 200 countries. In fact, only 32 percent of its 2002 sales
revenue came from the North American market, 27 percent form Europe, Eurasia and the
Middle East, 11 percent from Latin America, 26 percent from Asia, and 3 percent from
Africa.
This evidence also confirms that food manufacturing is characterized by a small number of
very large firms and a large number of small local companies. Primarily only the former
have entered global markets. Consolidation and international expansion are strictly
associated. The 1990’s were an active period of consolidation in food manufacturing through
mergers and acquisitions. Consolidation allows a company to improve production efficiency
through scale economies and the closing of less efficient plants. It is also a quick way for a
firm to expand its product offerings and gain market share. Some mergers and acquisitions
are also undertaken defensively to block another company from becoming a greater

19
competitive threat. According to the U. S. Department of Agriculture, U. S. food processing
firms made an average of 187 acquisitions per year during the period 1993-1999.
Increasingly, foreign companies are being acquired. Processed food sales from the foreign
subsidiaries of U.S. companies reached an estimated $150 billion in 2002, compared to
exports of some $30 billion. These operations are the result of the foreign direct investment
(FDI) undertaken by U.S. food companies. The sales from foreign subsidiaries have grown
since they are typically a more cost-effective way to supply a foreign market than exporting
the product from the U.S. Companies are under pressure from their stockholders or private
owners to increase the value of the company, and its stock, by continuously growing the
business’ profits and the value of its assets. Facing a mature domestic market, major food
and beverage manufacturers have focused on three primary strategies to achieve continued
growth: acquisitions and mergers, new product introductions, and expansion into new
markets. In seeking new markets, the largest food processors all operate internationally and in
most cases have done so for many years. Most of these companies make and market some of
the most widely recognized branded products in the world. They were pushed into the
international market by saturation of their domestic markets and pulled by the market
potential abroad and the economies of scale that could be achieved in manufacturing and
marketing with greater volumes. Companies with strong consumer brands or proprietary
technologies can further capitalize on such assets by expansion in the global market.
The structure of control that determines the geographic and functional distribution of foreign
activities and ensures their coordination, may occur in several forms such as ownership (or
equity) linkages providing direct managerial supervision, non-equity linkages in which
formally independent firms are linked through a variety of relationships such as franchising,
licensing, subcontracting, marketing contracts, common technical standards or stable, trust-

20
based business relationships. To implement their international strategies, food companies
may utilize a number of different production and distribution arrangements. One option is to
produce in the home market and then export, making use of a foreign licensee or joint venture
to handle foreign distribution and marketing. Another approach is to license a local company
to produce and market the product in the foreign market. A company might also form a joint
venture with a local business. A firm would need to make the greatest investment and expose
itself to the most risk if it decided to acquire or create a wholly owned foreign affiliate to
handle production and marketing. Finally, the decision might be made to supply one foreign
market from a foreign affiliate, joint venture, or licensee in another foreign country. The
approach chosen depends on an assessment of the market opportunities and the barriers to
entry faced in the foreign market, plus the feasibility of production outside the domestic
market. Management would also weigh the trade-off between the risk of the foreign
operation and the need to maintain direct control over production and marketing (Malanoski
et al., 1996; Malanoski, et al., 1997).
The most common means for food manufacturers to enter foreign markets is through foreign
direct investment as is well documented by the FDI data presented in previous tables.
However, there is also evidence that although food firms have historically preferred mergers
and acquisitions to partnerships, this attitude is changing. Indeed, several consumer-
packaged-goods companies are turning to a range of alliance opportunities to achieve growth.
A few companies, such as Nestlé, Procter & Gamble, and Starbucks, are already realizing
good returns on their alliance activity. A recent analysis of Cook et al. (2003) found that of
77 leading consumer-packaged-goods firms the 10 most alliance-intensive ones delivered
average total returns to shareholders nearly four times larger than the rest. In addition, the
highest-performing companies captured a disproportionate share of the alliance opportunities
and locked in the best partners. Cook’s findings also show that one key to success is pursuing

21
a full range of alliance opportunities—not just geographic-expansion or simple co-marketing
deals, but also cost reduction programmes and partnerships for innovation.
4. The Internationalization of the Retail Industry This section examines the international operations of retailers. As we have already noted in
discussing Tables 3 and 6, the retail industry is characterized by a low level of
internationalization. As measured by TNI and NSI, retailing is clearly lagging behind
manufacturing in terms of international expansion. The retail industry is, however, drastically
changing its structure through a process of consolidation and major retailers are increasingly
adopting strategies of internationalization. According to recent estimates, the top 200
retailers have captured 29 per cent of the worldwide market. In particular, the largest retailers
have increased their market share. Sales for the top 10 retailers reached $650 billion, which
represents 29.2 per cent of the sales from the top 200 retailers. Five years ago, the top 10
share was only 23 per cent (Kutyla, 2004). Grocery and food retailing is becoming
increasingly concentrated. A substantial consolidation took place in the last decade through
both organic expansion and a number of high-profile domestic and international mergers and
acquisitions (M&A). Both the process of consolidation and international expansion are
expected to continue. For example, there is speculation that Carrefour, the world’s second-
biggest retailer by revenue may be in the sights of Wal-Mart, the only retailer that is bigger,
which unsurprisingly, recently signalled it would like to start expanding more aggressively in
Europe (White et al., 2004).
Table 8 lists the largest food retailers. The ranking is in accordance with their retail sales in
2002. Of the top 20 retailers, 8 are American, one is Japanese, and the remaining are
European (5 of German, 3 French, and 2 British. Figures in the three right-hand columns
present the number of countries in which each retailer is operative. As an index of

22
globalization, a simple count measure has obviously it limits, but it is enough to give an idea
of how relevant the international expansion of large retailers is. The average number of
countries of operation has increased from 6.7 in 1997 to 10.5 in 2002. The table reveals that a
small number of European companies (mainly Carrefour, Ahold and Metro) along with Wal-
Mart are dominating the global expansion of food retailing. The table also shows that retailers
pursue multi-format strategies and that format diversification is increasing and positively
associated with international expansion. In the process of international expansion and
organizational change of the retail industry, therefore, a key role is played by a very small
number of major retailers.
Not only major retailers are pursuing international expansion programmes, but there is
evidence that the relative importance of their cross-border expansion accelerated in the recent
years. Figures that show the value of cross-border M&As in the sectors of the food system
(agriculture, food processing, and trade or retail/wholesale) between 1988 and 2001, are
Table 8. Top 20 Largest Food Retailers in 2002
Number of formats Countries of operation Retailer Country
of origin 2002 2000 1997 Retail sales (millions of US dollars)
2002 2000 1997
1 Wal-Mart US 5 2 2 229,617 12 10 8 2 Carrefour Fr 6 5 2 65,011 31 24 14 3 Kroger US 5 5 2 51,760 1 1 1 4 Metro Ger 6 6 5 48,349 26 22 18 5 Target US 3 2 2 42,722 1 1 1 6 Ahold Neth 7 7 3 40,755 27 25 13 7 Tesco UK 5 3 1 40,071 10 10 6 8 Costco US 1 1 1 37,993 8 7 6 9 Sears US 4 3 2 35,698 3 3 1 10 Albertson US 3 2 1 35,626 1 1 1 11 Aldi Einkauf Ger 2 2 2 33,837E 12 11 8 12 Safeway US 1 1 1 32,399 3 2 3 13 Intermarchè Fr 8 7 3 31,688E 7 8 9 14 Rewe Ger 8 8 1 31,404 12 11 9 15 Kmart US 2 1 1 30,762 1 4 6 16 Edeka/AVA Ger 6 5 2 26,514E 6 7 5 17 J Sainsbury UK 4 3 4 26,460 2 3 3 18 Ito-Yokado Japan 6 7 7 26,179 18 15 2 19 Auchan Fr 4 6 3 26,071 15 14 10 20 Tengelmann Ger 8 6 3 23,209E 14 16 10
E = estimate Source: Stores (2002, 2004).

23
given in Table 9. Looking at the composition of M&As, it is possible to note that M&As in
downstream stages play the crucial role. In particular, the retail industry has increased its
participation. The trade (retail/wholesale) sector accounted for only 17.9 percent of the total
by the end of the 1980s. But its share increased to almost half (49.1 percent) in 2001-2002.
The share of food manufacturing decreased over the same period from 75 to 50 percent.
Trade M&A growth has been particularly significant in the 1990s. Whereas the value of
cross-border trade sector M&As in 1988-89 was only $US4.3 billion, it increased to $21.7
billion in 2001-02. As a consequence, by the end of the period, the composition of M&As in
the food system drastically changed: the share of trade and food manufacturing in cross-
border M&As is quite similar. Retailers are playing an increasing role in the globalization of
food systems (Lal, 2004).
Table 9. Cross-border M&As by Industry of Purchaser, 1988-2002 (millions of dollars)
1988-1989 1993-1994 2001-2002 Sector/industry % % %
Agriculture 1772 7.5 109.5 0.8 410.5 0.9 Food manufacturing 17629 74.6 7770 56.3 22117 50.0 Trade 4232.5 17.9 5911 42.9 21713.5 49.1 Total food system 23633.5 100.0 13790.5 100.0 44241 100.0
Source: UNCTAD, World Investment Report (2001, p. 297). The Strategies and Competitive Position of Leading International Retailers WAL-MART. Sales outside the United States accounted for 16 percent of the total for Wal-
Mart. Wal-Mart had 597 discount stores, 455 supercenters, 64 Sam's Clubs and 54
supermarkets in other countries at the end of 2002.ii Wal-Mart's international expansion only
began in 1991 with a joint venture with the Mexican retailer Cifra, which is now 50 percent
owned by Wal-Mart. Wal-Mart has limited its operations to a fairly small number of
countries in Europe: Germany and the United Kingdom, in Asia: China, Japan, Singapore,

24
South Korea and Vietnam, and in Latin America: Argentina, Brazil, and Mexico, plus
Canada. In the countries it has entered Wal-Mart has quickly become a major operator in
many. Wal-Mart was estimated to have a 30 percent share of the retail food market in
Mexico by 2002. Wal-Mart has entered some markets from which it has withdrawn, such as
Indonesia. In more recent moves Wal-Mart acquired the Asda supermarket chain in Great
Britain and a stake in Seiyi in Japan, that country's second largest grocer. Wal-Mart has had
the most problems with its operations in Germany. Looking out to 2005, Wal-Mart continues
to expect to get 60-70 percent of its growth in sales and earnings from the U. S. market.
However, the expected contribution of international operations is growing over time (Fernie,
2004).
CARREFOUR. After Wal-Mart the next several global food retailers are European companies,
which is a reflection of the saturation of their home markets. Carrefour is actually much more
focused on international operations than Wal-Mart. In 2001, for the first time, international
sales exceeded domestic sales in France. France accounted for 49 percent of Carrefour’s sales,
the rest of Europe 32 percent, South America 12 percent and Asia 7 percent. Carrefour had 517
hypermarkets, 1,298 supermarkets, 3,300 discount stores, and 716 convenience stores in other
countries at the end of 2001. The first foreign market Carrefour entered was Spain through a
joint venture in 1973. It has continued to expand internationally primarily through organic
growth, although some key acquisitions have been made, such as Promodes in Argentina in
1982. Interestingly, they now consider all Europe a home market, not just France. Their
private label products are an important part of the company's strategy. Carrefour has very
ambitious expansion plans stating that they want to "open one discount store a day and one
hypermarket a week worldwide."

25
AHOLD. Although tarred by serious problems with their financial reporting, the Dutch
company Ahold was ranked number one with the highest foreign sales. They accounted for
85 percent of its total sales with only 15 percent coming from operations in the Netherlands.
Ahold's primary international format is the supermarket of which it had 3,885 in other
countries, along with 209 hypermarkets, which are similar to supercenters, and 1,487
convenience stores. Ahold's international operations were primarily in the United States,
which accounted for 59 percent of the company's total sales, and are concentrated on the U.
S. East Coast. It entered the U.S. market with the acquisition of Bi-Lo and Giant Food Stores
in 1977. Since then Ahold has entered markets in Eastern Europe, Asia and Latin America.
However, Ahold lacks a presence in the three largest European countries: Germany, France
and the United Kingdom.
METRO. Some 45 percent of Metro's sales are outside of Germany its home market: 29
percent in other Western European countries, 14 percent in Eastern Europe and 2 percent in
Asia and Africa. Metro has an array of formats in its international operations with cash and
carry stores, consumer electronics stores, and hypermarkets, but not any supermarkets.
DELHAIZE is similar to Ahold in that it was "pushed" out of a small country, Belgium, with
little opportunity for domestic supermarket growth. It receives 85 percent of its total sales
from foreign operations and only 15 percent from its home market. Likewise, Delhaize is
essentially a supermarket company with most of its foreign operations in the United States,
where it operated 1,769 supermarkets that accounted for 79 percent of the company's total
sales. Delhaize entered the U. S. market in 1974 purchasing 32 percent ownership in Food
Town, which became Food Lion in 1983, with Delhaize gaining full control in 2001. Most of
the rest of its foreign operations are in other European countries.

26
TENGELMANN got 56 percent of its sales outside its home country, Germany, with Canada
and the United States accounting for 44 percent and other European countries 12 percent. In
1979 Tengelmann acquired a 54 percent stake in A & P in Canada and the United States.
Tengelmann’s primary international formats were 858 discount stores and 769 supermarkets.
ALDI had 2,554 stores outside of Germany that generated 40 percent of its net sales. Most of
these were deep-discount limited assortment stores in Europe and the United States, which.
The French company, AUCHAN, had 163 hypermarkets and 310 supermarkets in other
countries, contributing 35 percent of its net sales.
The Spread of Supermarkets in Developing Countries Supermarkets, including supercenters, hypermarkets and other modern food retail formats,
have been gaining market share at a phenomenal rate in many countries in Asia, Latin
America and some African nations (Roe, 2004). The rates of diffusion are so rapid that
supermarkets have become the dominant food retailer in many countries in Latin American
and Asia in a matter of years rather than the decades that process took in the United States.
Much of this expansion has been by the major global retailers, such as Ahold, Carrefour and
Wal-Mart, discussed in the previous section. Successful Third World retailers have also
undertaken regional expansion. CSU, a Costa Rican supermarket chain, has expanded into
other Central American countries and Chile’s Santa Isabel has stores in Peru, Ecuador and
Paraguay (Balsevich et al., 2003; Reardon et al., 2003).
Table 10 provides the estimates made by Thomas Reardon of the percent of food retail
expenditures captured by supermarkets and related formats in various countries. The spread
of multinational retailers in these countries prior to about 1990 was quite slow, but since then
the rate of diffusion has been dramatic. In general, the countries in East and Southeast Asia

27
are about five years behind Latin America, but supermarket growth is occurring even more
rapidly there. With rapid expansion by Wal-Mart and other global retailers, Reardon
estimates that between just 1999 and 2001 supermarkets went from 30 percent to 48 percent
of the retail food market in China’s cities. By 2002 they had a 60 percent market share in
Shanghai, the economic capital of China, according to Reardon. The dramatic growth of
supermarkets in these countries is being fueled by a massive infusion of foreign direct
investment, by the likes of Carrefour and Wal-Mart, which liberalized investment policies
have facilitated.
The supermarket expansion occurred first in the most developed of the Asian and Latin
American countries, such as Korea, Taiwan and Chile, in the largest cities, and typically in
the more wealthy neighborhoods first. More recently supermarkets have spread to other
countries in the regions, to smaller cities and towns, and into less well-to-do areas. The
supermarkets, hypermarkets and other modern retailers are not just drawing their customers
Table 10. Supermarket Share in National Food Retailing (percent)
Country Earlier Year Circa 2000 Latin America Brazil 30 (1990) 75 Argentina 17 (1985) 57 Chile 50 Costa Rica 50 Mexico 45 Honduras 42 Guatemala 30 (1999) 35 (2001) 1999 2001 Asia South Korea 61 65 Philippines 52 57 China (urban) 30 48 Thailand 35 43 Malaysia 27 31 Indonesia 20 25
Source: Reardon (2002).
28
from wealthy and middle class households, as might be assumed. The poor are also shopping
there. To get to these stores the poor either use public transportation or go together to hire a
taxi. The savings on bulk food purchases, for example on a 10 kg bag of rice, may be so
great that it pays for several women living in the slums to get a taxi together to go to the
nearest hypermarket. The rapid spread of supermarkets is driving many traditional food
retailers, particularly the small “mom and pop” stores, out of business in these countries with
relevant implications for local supply chains (Senauer and Goetz, 2003; Sexton, 2004).
Private Label Foods as a Growing Global Phenomenon Sales of private label foods are a large and growing global phenomenon (Table 11). A recent
report of ACNielsen (2003) shows that Latin America, Asia Pacific and the Emerging
Markets all have very small Private Label markets in terms of overall retail sales. All these
regions are, however, experiencing much more rapid sales growth. For example, the
Emerging Markets of Czech Republic, Hungary, Poland and South Africa saw a collective
growth rate of 48% compared to 2002, while Latin America and Asia Pacific saw year over
year growth rates of 16% and 14% respectively. European growth was 6%, while North
America, excluding Wal-Mart in the US, remained unchanged from 2002. The high growth
rates for Private Label in the developing markets are directly related to the international
expansion of global retailers. In addition, it is worth noting that ACNielsen report found that,
overall, growth rates for Private Label products outpaced those of manufacturers’ brands in
nearly two-thirds of the countries studied.

29
International Restaurant Chains
Food service is a further increasingly powerful engine of change and globalization of food
systems. Burger King and McDonalds were the first to venture outside the borders of the
United States in the 1960s. Since then dozens of food service chains have moved into the
international marketplace. The expansions abroad have ranged from tentative entries into a
few low-risk markets to a vast global operation. McDonald’s is by far the most globalized of
the restaurant chains with over 15, 000 outlets in other countries and international sales of
almost $20 billion. In recent years McDonald’s has opened new outlets far more rapidly in
foreign markets than at home and international sales growth has outpaced domestic growth.
In addition, KFC, previously Kentucky Fried Chicken, Pizza Hut, and Burger King have
extensive international operations. In addition to the fast food chains, other American food
service operators have entered the international market. Starbucks, the coffee house chain,
has opened outlets in Europe, Asia and recently Mexico. Morton's, a Chicago steakhouse, is
operating in Hong Kong.
Table 11. Top Ten Fastest Growing Private Label Markets (Based on Value Sales)
Country Region PL Growth
Manufacturer Brands Growth
PL Value ($000)
PL Share
1 Poland Emerging Markets 115% 4% 171,413 2% 2 Philippines Asia Pacific 48% 2% 158 0% 3 Czech
Republic Emerging Markets 44% -2% 114,006 4%
4 Hungary Emerging Markets 44% 8% 250,227 8% 5 Thailand Asia Pacific 35% 9% 38,123 1% 6 Colombia Latin America 31% 11% 48,632 2% 7 Argentina Latin America 31% 19% 96,526 2% 8 South Africa Emerging Markets 28% 7% 272,987 6% 9 Sweden Europe 25% 2% 640,663 11%
10 Japan Asia Pacific 23% 3% 1,252,454 4% Source: ACNielsen (2003).

30
Succeeding in the global marketplace is a substantial challenge requiring planning, patience
and flexibility to overcome problems associated with government regulations, cultural
differences, training staff, and sourcing ingredients. Greater risk is typically inherent in
foreign operations than domestic ones, but the market potential may be large. Most restaurant
companies have used a franchise format to expand internationally, with a small proportion
relying on full ownership, joint ventures or licensing agreements. A 1996 Survey of
International Restaurant Operators reported that almost two-thirds of the multinational food
service operators franchise all their international units. Only 9 percent owned them and 20
percent reported a combination of methods. The study found that foreign franchised outlets
became profitable in an average of 16 months, whereas company-owned ones required 25
months (Masur, 1997).
A local franchisee with good connections and business experience can be very helpful in
overcoming many obstacles in a foreign country. The prospect of sharing in the profits
provides franchisees a strong motivation to work for the success of the enterprise, as it does
in the U.S. market. The 1996 Survey also found that finding and keeping good unit managers
was the most the most important element for success in both the U.S. and foreign markets.
Sourcing ingredients had a greater impact on foreign than domestic operations, since it is
more challenging to find and retain reliable suppliers.
McDonald's currently has operations in 119 countries. McDonald's approach is an excellent
example of the adage, "think globally and act locally." The company rigorously insures
consistency in all its global operations of key attributes associated with the McDonald’s
brand. These include a family atmosphere, cleanliness, public rest rooms, and air
conditioning, plus the trade mark of fast, efficient service. Although such services are not
31
unique and do not provide a competitive advantage in the U.S., they are seen as innovations
in many countries. When one of the authors asked where the rest rooms were in a London
department store, he was told they are for employees only, but you can go to the McDonald’s
next door and use theirs (American Forum, 2003). On the other hand, McDonald’s also “acts
locally” and adapts to foreign cultures. McDonald’s operates its international restaurants
with franchisees who have an understanding of the local culture and business environment.
McDonald’s tries to source ingredients locally, if possible, and will go to a considerable
effort to develop local suppliers. The menus reflect local preferences.
5. Looking for a Conceptual Framework The factors driving the increasing globalization of the food system can be roughly placed in
three categories: push/supply-side, pull/demand-side and enabling/external factors. The
importance of these factors affect the industries of the food system differently given that
some of these factors affect one industry more than others. While several forces on both
demand and supply sides have, for example, determined the changes in world agricultural
trade, the widening and deepening of trade flows in processed agricultural foods appear
essentially due to demand-side factors, such as the increasing taste of final consumers for
variety and well-known differences in the income elasticity of demand, with low elasticity
levels for unprocessed agricultural products and high levels for attributes tied to qualities and
services. Income growth, urbanisation, and lifestyle changes affect food consumption
patterns, in developed countries and in many developing countries, in such a way that the
substitution of high-value processed foods for traditional foods is increasing.
Factors such as international migration, the communications revolution and international
tourism have contributed to a internationalisation of food habits. While the demand for

32
variety may explain why most food trade is intra-industry trade between similar developed
countries as noted by Traill (1997), income growth is transforming food demand in many
developing countries. Food expenditures are rising as per capita incomes rapidly grow in
some developing countries, especially the largest ones. China has experienced phenomenal
rates of economic growth and more recently India's growth has been robust. According to
Engel's Law, the lower the initial per capita income level of a population the greater will be
the expansion in food demand for a given rise in income. One of the primary things the poor
of the world want to do with added income is improve their diets with more animal protein,
more variety and improved quality. In addition to the impact of rising incomes, the
increasing urbanization and growing participation of women in jobs outside the home and off
the farm have created attractive opportunities for food retailers, food service providers and
food manufacturers.
A rapidly growing middle class is emerging in some developing countries. Based on a per
capita gross national income level equivalent to U. S. $6,000 per year, a study by The Food
Industry Center estimated the emerging middle class in China to number some 290 million
people, in India over 90 million, and in Brazil almost 60 million in 2000. Given the rising
incomes and very large populations in these countries, the market potential is very attractive.
Moreover, although birth rates are declining virtually worldwide, population growth is far
higher in Third World nations than in industrial countries (Senauer and Goetz, 2003). But
these demand-side factors have been supported by supply-side factors such as improvements
in food technology, refrigeration facilities and improvements in transportation that have made
processed food items more easily tradable (Athukorala and Sen, 1998; Rae and Josling,
2003). There are several theoretical explanations for why firms invest abroad. Firms are
going international because of slow growth in domestic markets and to capitalize on their

33
specific advantages (e.g., technology, marketing skills, reputation) as well as the location
advantages of specific foreign countries. Theoretical models and empirical evidence support
the hypothesis that FDI is generally high in sectors where firm-specific advantages are an
important determinant of performance (Helpman and Krugman, 1985; Ethier, 1986; Dunning,
1993; Caves, 1996). Rather than technology providing the firm-specific advantages
associated with FDI, in the case of the food industry it is intangible assets associated with
branding policies that is of key importance (Henderson and Handy, 1993; Henderson and
Handy, 1994). Porter (1990) defined food multinationals as ‘multidomestic’ ones for the
relevance of their ‘market seeking’ strategies closely related to competitive advantages
associated with branding. Our stylized facts in the previous section confirm the ‘multi-
domestic’ nature of food multinationals.
Theoretical literature adopts an important taxonomy based on the distinction between
horizontal and vertical multinational firms (Ethier and Markusen, 1996). The fact that
affiliates in the food industries are so geographically spread supports and confirms the
hypothesis that most foreign investments in these industries are of horizontal type and
essentially market driven. Vertical specialization and patterns of international fragmentation
of production through which firms move production of parts and components or product
assembly abroad have become increasingly relevant in several industries. Traill (1997) had
argued that the food industry is also moving in this direction with major food manufacturers
assembling ingredients coming from international sourcing. However, a crucial characteristic
of agri-food trade is that it is not a trade in fragmented components, but rather a trade in final
goods. Vertical specialization is not as relevant in the food industries as a consequence of the
fact that the scope for dividing production into discrete stages and subcontracting out large

34
parts to independent firms is much more limited in food manufacturing compared to other
manufacturing industries.
This has relevant implications for the volume of trade flows. There is theoretical and
empirical evidence that vertical fragmentation explains the strong increases in trade for many
manufactured products. The reason is that the disintegration of production itself leads to more
trade since traded products are neither basic raw materials, nor finished consumer goods, but
are intermediate inputs at different stage of processing which may cross borders several times
during the manufacturing process (Ethier and Markusen, 1996; Feenstra, 1998). While there
is some evidence that trade flows in processed foods have increased also as a consequence of
a larger use of imported intermediate inputs, these trade patterns remain less relevant than
those of manufacturing industries involved in deep processes of vertical fragmentation.
Unsurprisingly, as we have already noted, the products identified by Mayer et al. (2003) as
those whose export values have grown most rapidly during the period 1980-2000 are also the
products affected the most by vertical fragmentation of production processes at the
international level.
While the process of multinationalization of food manufacturing is well explored both
theoretically and empirically, the internationalization of the retail industry is much less
analysed. Clearly, this depends on the fact that prior to the 1980’s, the retail industry was
essentially a localized, domestic industry. The same theoretical debate in the specialized
literature has not solved the issue of whether theoretical models and paradigms developed to
analyze the determinants of FDI in manufacturing may be used also for retailing given the
organizational differences in these two sectors (see, for example, Dawson, 1994). In any
case, push and pull factors seem at work in retailing as well. Push factors concern the
saturation and the lack of growth in domestic markets. Pull factors regard the attractiveness

35
of foreign markets. In terms of push factors, home market saturation has been a major factor
behind the international expansion of the European grocery retailers, such as Ahold and
Carrefour, and the American fast food chains, like McDonald's and KFC, especially.
Supermarkets and other retail operators also face significant land use and labor restrictions in
Europe. In the United States, for example, the major fast food chains have literally exhausted
most of the opportunities for expanding their traditional format. Increasing the density of
McDonald's in an area may increase overall sales somewhat through the increased
accessibility, but also reduce sales per site to the displeasure of franchisees.
Domestic market saturation and the reduced growth in food spending has led to increasing
competitive pressures on company profits. At the same time, efficiency gains in supply chain
management have allowed operators to reduce their costs and helped maintain profitability.
The advances in information technology, that have transformed logistics and replenishment
operations, also make it far easier to manage multinational operations. A company, such as
Wal-Mart, possesses a competitive advantage through the ability to transfer its highly-
efficient supply chain practices and technologies to its international operations. A final push
factor that should not be overlooked is the fear of being left behind. Strategic interaction
creates strong pressures and incentives to retail internationalization (Abate, 1997). If
competitors are establishing a multinational presence, it is likely to prove more difficult to
break into these markets after others are firmly established there.
In terms of enabling factors, the greater the political instability in a country the more the risk
to foreign business operations. Although the news is full of examples of civil unrest,
terrorism and actual warfare around the world, many of the largest developing countries and
transition economies, such as China, have achieved levels of political stability that make
foreign commercial investment attractive. Trade liberalization through the World Trade
36
Organization (WTO), regional agreements such as the North American Free Trade
Agreement (NAFTA), and bilateral accords have lowered trade barriers and protectionist
measures and opened up international trade and investment opportunities. In addition, the
globalization of various industries complement and support one another. The
internationalization of the food system has been facilitated by the global nature of several
industries, such as airline travel, communications and finance. Vast improvements in
communication and transportation technology have contributed to the growing global inter-
connection. Globalization is also facilitated by air travel and shipping. The international
spread of many industries has both contributed to and benefited from cultural globalization. It
should also be noted that an important factor of interaction operates within the food system
itself through changing vertical relationships between food manufacturers and retailers.
Finally, the end of the Cold War opened up Eastern Europe and the former Soviet Union to
Western businesses. One of the major regions of expansion for Western European food
retailers and manufacturers has been in countries, such as Poland, that were formerly behind
the Iron Curtain. The recent period of globalization accelerated in the 1990’s with the end of
the Cold War during which much of the world was divided into opposing camps aligned with
either the Soviet Union or the West.
6. Summary and Concluding Remarks
This paper has reviewed some empirical evidence and identified a set of stylized facts
concerning the globalization of food systems. The main findings are the following: (1) some
unprocessed agricultural products may be classified as dynamic agricultural products; (2)
processed foods are increasingly important in agricultural trade as opposed to trade in
traditional agricultural commodities; (3) food manufacturing is characterized by one of the

37
greatest degrees of transnationality and foreign production by food multinationals is
increasing; (4) a key role in this process is played by the major companies; (5) despite the
increasing role of multinationals, local players remain more important in the food industry
when compared with most manufacturing industries; (6) an important process of international
expansion and organizational change of the retail industry is taking place; (7) there has been a
significant increase in the relevance of cross-border M&A of retailers; (8) a very small
number of major retailers is playing an increasing role in the globalisation of food systems,
and (9) private label foods are a large and growing global phenomenon.
By and large such empirical facts support the hypothesis that food systems have increasingly
become integrated mainly through trade and particularly FDI in the last several decades. An
increasing part of consumption patterns in developed countries, as well in large sections of
the populace in many developing countries, involves imported food items, both unprocessed
and processed. The largest food multinational firms pursuing their growth market-oriented
strategies have played a crucial role in the process of globalization. But, in more recent
years, a key role has also been played by the largest retailers’ international expansion
strategies.
Even if we do not provide in this paper a complete analysis of the determinants and of the
consequences of the globalization of food systems, it seems possible to conclude that the
changes underway are here to stay. On the one hand, this means that several features and
dynamics of contemporary food systems can only be understood in the context of
globalization; on the other hand, several issues of the globalization of food systems will
increasingly be worth researching for both their positive dimensions and their strategic as
well as public policy implications. In particular, we suggest that future research should focus

38
on the internationalization strategies pursued by retailers and explore carefully their
implications. The globalization of food systems has long been regarded as a process largely
dominated by the internationalization of food manufacturing. We would like to stress what
seems to be the most relevant of the paper’s findings, which is the increasing role played by
retailers. Indeed, the most important conclusion from our work is that the globalization of
food systems seems to proceed through a sequence of stages quite similar and related to the
domestic evolution of food systems. The first stage during which the main engine of
structural and strategic change is played by food manufacturing, is followed by a stage
characterized by an increasing role played by food retailing. The same process seems at work
at a global level.
While retail internationalization may be expected to have several and complex implications,
the shift from a local, domestic-oriented food retailing to an increasingly global retailing is a
recent phenomenon whose relevance for upstream sectors of food systems is not yet
appropriately addressed. Particular attention should be paid to issues such as retailers’ entry
and expansion strategies into international markets and their consequences for the intensity of
competition in domestic retailing markets, the nature of the vertical relationships between
global retailers and food manufacturers, the development of global branding and international
sourcing, the extent of global buyer power, and the emergence of global food supply chains
with far-reaching implications for both developed and developing countries in terms of static,
allocative and dynamic efficiency.
References Abate R. (1997), Retailing's Global Imperative: An Insider's View, January 1, The Boston Consulting Group.
39
AcNielsen (2003), The Power of Private Label - A Review of Growth Trends Around teh World: http://acnielsen.com American Forum (2003), Handout # 8: McCola World – Global Perspectives on Fast-Food History: www.globaled.org/curriculum/ffood8.html, August 27. Athukorala, P. and K. Sen (1998), Processed Food Exports from Developing Countries: Patterns and Determinants, Food Policy, 23(1), 41–54. Athukorala P. and S. Jayasuriya (2003), Food safety issues, trade and WTO rules: a developing country perspective. Technical Report Working papers in Trade and Development no.2003/13, Economics, RSPAS, ANU. Baldwin R. E. and L. A.Winters (eds.) (2004), Challenges to Globalization, Analyzing the Economics, The University of Chicago Press. Balsevich F., Julio A. Berdegué, Luis Flores, Denise Mainville, Thomas Reardon (2003), Supermarkets and Produce Quality and Safety Standards in Latin America, American Journal of Agricultural Economics, 85(5), 1147-1154. Caves R. (1996), Multinational Enterprise and Economic Analysis, Second Edition, Cambridge, Cambridge University Press. Cook J. D., Tammy Halevy, and C. Brent Hastie (2003), Alliances in Consumer Goods, The McKinsey Quarterly, Number 3. Dawson J. (1994), Internationalization of retailing operations, Journal of Marketing Management, 10, 267–282. Dunning J.H. (1993), Multinational Enterprises and the Global Economy, Wokingham, England, Addison-Wesley Publishing Company. Ethier W. J. (1986), The Multinational Firm, Quarterly Journal of Economics, 101(4), 805-33. Ethier W. and J. Markusen (1996), Multinational firms, technology diffusion, and trade, Journal of International Economics, 41, 1-28. Feenstra R. C. (1998), Integration of Trade and Disintegration of Production in the Global Economy, Journal of Economic Perspectives, 12(4), 31-50. Fernie J. (2004), The impact of Wal-Mart in international markets, EAAE Seminar: Retailing and Producer-Retailer Relationships in the Food Chains, May, 5-6, Paris. Helpman E. and P. R. Krugman (1985), Market Structure and Foreign Trade: Increasing Returns, Imperfect Competition and the International Economy, Cambridge MA: MIT Press. Henderson, Dennis R. and Charles R. Handy (1993), Globalization of the Food Industry, in D. Padberg, (ed.), Food and Agricultural Marketing Issues for the 21st Century. The Food and Agricultural Marketing Research Consortium, FAMC 93-1. Henderson D.R., and C. Handy (1994), International Dimensions of the Food Marketing System, in L.P. Schertz and L.M. Daft (eds.), Food and Agricultural Markets: The Quiet Revolution, Washington DC: National Planning Association. Kutyla D. M. (2004), Global 200 Highlights, in Deloitte and Stores, 2004 Global Powers of Retailing, January, Section 2: www.stores.org Lal R. (2004), Retailers’ Strategies for Global Expansion, EAAE Seminar, Retailing and Producer-Retailer Relationships in the Food Chains, May, 5-6, Paris. Malanoski M., C.R. Handy, and D. Henderson (1997), Time Dependent Relationships in U.S. Processed Trade and Foreign Direct Investment. Foreign Direct Investment and Processed Food Trade: Proceedings of the Conference of NCR-182. S.R. Henneberry (ed.), Stillwater, OK: Oklahoma State University. Malanoski C. Handy, N. Seigle, and D. Henderson (1996), International Strategies in the Global Market, Chapter 4 in Dennis Henderson, Charles R. Handy and Steven A. Neff (eds.), Globalization of the Processed Foods Market, Agric. Economic Report no. 742, Economic Research Service, U. S. Dept. of Agriculture, Washington, D. C.

40
Mayer J, A. Butkevicius, A. Kadri, and J. Pizarro, Dynamic Products in World Exports, Review of World Economics, 139(4), 762-795. Masur D. (1997), Going Global, Restaurant USA, January: www.restaurant.org/rusa.magArticle.cfm?ArticleID=215, August 28, 2003. Mosley P. (2000), Globalization, economic policy and convergence, World Economy, 23(5), 613-634. OECD, Measuring Globalisation 2001, Volume I. Porter M. E (1990), The Competitive Advantage of Nations, London: Macmillan. Rae A. and T. Josling (2003), Processed food trade and developing countries: protection and trade liberalization, Food Policy, 28, 147-166. Reardon T.(2002), The Rapid Rise of Supermarkets in Latin America and Asia: Fundamental Effects on Domestic Agrifood Systems and Trade, presentation made at the Global Market for High-Value Food Workshop, Economic Research Service, U.S. Dept. of Agriculture, Washington, D. C. , February 14, 2003: www.farmfoundation.org/03-38 summary and presentations.htm, August 27. Reardon T, C. Peter Timmer, Christopher B. Barrett, and Julio Berdegue (2003). The Rise of Supermarkets in Africa, Asia and Latin America, American Journal of Agricultural Economics, 85(5), 1140-1146. Roe T. (2004), Supermarkets and farm sector links in developing countries: a macro-economic structural model with illustrations from Morocco, 88th EAAE Seminar, Retailing and Producer-Retailer Relationships in the Food Chains, May, 5-6, Paris. Senauer B. and L. Goetz (2003), The Growing Middle Class in Developing Countries And The Market For High-Value Food Products, The Food Industry Center, University of Minnesota, Working Paper no. 03-02, March. Sexton J.R. (2004), Grocery Retailer Behavior in the Procurement and Sale of Perishable Fresh Produce Commodities, EAAE Seminar, Retailing and Producer-Retailer Relationships in the Food Chains, May, 5-6, Paris. Stores (2004), Top 200 Global Retailers: www.stores.org Traill B. (1997), Globalisation in the Food Industries? European Review of Agricultural Economics, 24(3-4), 390-410. UNCTAD (2001), World Investment Reports. White E., J. Singer and A. Raghavan (2004), Big Changes Could Be in Store for Carrefour, The Wall Street Journal Europe, July 9-11, M1. WTO (2004), Recent Trends in International Trade Policy Developments: www.wto.int/english/news_e/pres04_e/pr378_e.htm