globalization of alternative investments · pdf filethe globalization of alternative...
TRANSCRIPT
Globalization of Alternative InvestmentsWorking Papers Volume 3
The Global Economic Impact of Private Equity Report 2010

The Globalization of Alternative Investments Working Papers Volume 3: The Global Economic Impact of Private Equity Report 2010 is published by the World Economic Forum. It is the result of collaboration with researchers and faculty at various institutions.
The Working Papers in this volume are the work of the authors and do not represent the views of the World Economic Forum.
World Economic Forum 91-93 route de la Capite CH-1223 Cologny/Geneva Switzerland Tel.: +41 (0)22 869 1212 Fax: +41 (0)22 786 2744 E-mail: [email protected] www.weforum.org
© 2009 World Economic Forum USA Inc. All rights reserved. No part of this publication may be reproduced or transmitted in any form or by any means, including photocopying and recording, or by any information storage and retrieval system without explicit written permission from the World Economic Forum USA and the respective authors.
REF: 151209
World Economic Forum USA Inc. 3 East 54th Street 18th Floor New York, NY 10022 Tel.: +1 212 703 2300 Fax: +1 212 703 2399 E-mail: [email protected] www.weforum.org/usa
World Economic ForumGeneva, Switzerland
December 2009
Globalization of Alternative InvestmentsWorking Papers Volume 3
The Global Economic Impact of Private Equity Report 2010
World Economic Forum USA Inc. New York, USA

Contributors
CO-EDITORS
Anuradha Gurung Associate Director, Investors Industries, World Economic Forum USAJosh Lerner Jacob H. Schiff Professor of Investment Banking at Harvard Business School RESEARCH TEAM
Lead Academic:Josh LernerJacob H. Schiff Professor of Investment Banking at Harvard Business SchoolResearch team members:Shai Bernstein Doctoral Candidate, Harvard UniversityJames Brander Asia-Pacific Professor of International Trade and Faculty of Commerce, Sauder School of Business, University of British ColumbiaQianqian Du Assistant Professor, Shanghai Advanced Institute of Finance (SAIF), Shanghai Jiao Tong UniversityThomas Hellmann B.I. Ghert Family Foundation Professor of Finance and Policy and Director of the W. Maurice Young Entrepreneurship and Venture Capital Research Centre, Sauder School of Business, University of British ColumbiaMorten Sørensen Daniel W. Stanton Associate Professor of Business, Columbia Business SchoolPer Strömberg Associate Professor of Finance, Stockholm School of Economics and Director, Swedish Institute for Financial Research FROM THE WORLD ECONOMIC FORUM
Max von Bismarck Head of Investors Industries, World Economic Forum USAAnuradha GurungAssociate Director, Investors Industries, World Economic Forum USAKevin Steinberg Chief Operating Officer and Head of the Centre for Global Industries (New York), World Economic Forum USA
ADVISORY BOARD
Chair:Joseph L. Rice, III Chairman of Clayton, Dubilier & Rice, Inc. Board Members:Wim BorgdorffManaging Partner, AlpInvest PartnersJames W. BreyerManaging Partner, Accel PartnersHareb Al DarmakiExecutive Director, Head of Private Equity, Abu Dhabi Investment AuthorityNick FergusonChief Executive, SVG Capital and Chairman, SVG AdvisersEmil W. Henry, Jr Managing Partner, Tiger Infrastructure Partners and Former Assistant Secretary of the United States Treasury for Financial InstitutionsHuh Yong-Hak Head, Direct Investment Division, Reserves Management Department, Hong Kong Monetary AuthorityPhilip JenningsGeneral Secretary, UNI Global UnionMichael KleinFormer Chairman and Co-Chief Executive Officer Markets and Banking, Citi Inc.Joel KurtzmanChairman, Kurtzman Group, Senior Fellow, Milken Institute and Senior Fellow, SEI Center for Advanced Studies in Management, Wharton School, University of PennsylvaniaJoncarlo MarkSenior Portfolio Manager, CalPERS and Chairman, Institutional Limited Partners AssociationDominique SenequierChief Executive Officer, AXA Private EquityKevin SteinbergChief Operating Officer and Head of the Centre for Global Industries (New York), World Economic Forum USADavid Swensen Chief Investment Officer, Yale UniversityMark Wiseman Senior Vice President, Private Investments, CPP Investment BoardJohn Zhao Chief Executive Officer, Hony Capital
The Global Economic Impact of Private Equity Report 2010 iContents
Preface .............................................................................. iiiLetter on behalf of the Advisory Board .............................. vExecutive Summary ..........................................................vii
Part 1Private Equity, Industry Performance and Cyclicality ....1I. Introduction ....................................................................32. Industry Performance and Private Equity .......................43. Data Sources and Sample Construction ........................64. Analysis .........................................................................75. Conclusions ...................................................................8References ........................................................................9
Part 2Governments as Venture Capitalists: Striking the Right Balance ................................................................25I. Introduction ..................................................................272. Literature Review .........................................................283. Data Description ..........................................................294. Analysis and Results ....................................................325. Discussion and Interpretation .......................................366. Concluding Remarks ...................................................37References ......................................................................37
About the Contributors ....................................................53Note from the Editors ......................................................57
Contents
The Global Economic Impact of Private Equity Report 2010 1Private Equity, Industry Performance and Cyclicality
Part 1Private equity, industry performance and cyclicality

The Global Economic Impact of Private Equity Report 20102 Private Equity, Industry Performance and Cyclicality
The Global Economic Impact of Private Equity Report 2010 3Private Equity, Industry Performance and Cyclicality
1. INTRODUCTIONIn response to the global financial crisis that began in 2007, governments worldwide are rethinking their approach to regulating financial institutions. Among the financial institutions that have fallen under the gaze of regulators have been private equity (PE) funds (see, for instance, European Commission (2009)). There are many open questions regarding the economic impact of PE funds, many of which cannot be definitively answered until the aftermath of the buyout boom of the mid-2000s can be fully assessed.
This paper addresses one of these open questions, by examining the impact of PE investments across 20 industries in 26 major nations between 1991 and 2007. We focus on whether PE investments in an industry affect aggregate growth and cyclicality. In particular, we look at the relationship between the presence of PE investments and the growth rates of productivity, employment and capital formation. For our productivity and employment measures, we find that PE investments are associated with faster growth. One natural concern is that this growth may have come at the expense of greater cyclicality in the industry, which would translate into greater risks for investors and stakeholders. Thus, we also examine whether economic fluctuations are exacerbated by the presence of PE investments, but we find little evidence that this is the case.
Throughout our analysis we measure the growth rate in a particular industry relative to the average growth rate across countries in the same year. In addition, we use country and industry fixed effects, so that the impact of PE activity is measured relative to the average performance in a given country, industry, and year. For instance, if the Swedish steel industry has more PE investment than the Finnish one, we examine whether the steel industry in these two countries performs better or worse over time relative to the average performance of the steel industry across all countries in our sample, and whether the variations in performance over the industry cycles are more or less dramatic.
Overall, we are unable to find evidence supporting the detrimental effects of PE investments on industries:
• Industries where PE funds have been active in the past five years grow more rapidly than other sectors, whether measured using total production, value added, or employment. In industries with PE investments, there are few significant differences between industries with a low and high level of PE activity.
• Activity in industries with PE backing appears to be no more volatile in the face of industry cycles than in other industries, and sometimes less so. The reduced volatility is particularly apparent in employment.
• These patterns continue to hold when we focus on the impact of private equity in continental Europe, where concerns about these investments have been most often expressed.
• We believe it is unlikely that these results are driven by reverse causality, i.e. PE funds selecting to invest in industries that are growing faster and/or are less volatile. The results are essentially unchanged if we only consider the impact of PE investments made between five and two years earlier on industry performance.
It is important to note that there are a number of limitations to this analysis. First, the question of economic growth and volatility is only one of many questions that regulators must grapple with when assessing the impact of PE investment. Second, we hope to deal more fully with the question of reverse causality in subsequent versions of the study. Finally, it is still too early to assess the consequences of the economic conditions in 2008 and 2009, a period where the decrease of investment and absolute volume of distressed private equity-backed assets was far greater than in earlier cycles.
The plan of this study is as follows: In the second section, we develop the hypotheses to be tested. The third section describes the construction of the dataset and the results are presented in Section 4. The final section concludes.
Private equity, industry performance and cyclicality*
SHAI BERNSTEIN
Harvard University
JOSH LERNER
Harvard University and National Bureau of Economic
Research (NBER)
MORTEN SØRENSEN,
Columbia Business School, NBER and Swedish Institute
for Financial Research (SIFR)
PER STRÖMBERG
Stockholm School of Economics, SIFR, NBER and Centre
for Economic Policy Research (CEPR).
* We thank the World Economic Forum and Harvard Business School’s Division of Research for financial support and members of the Globalization of Alternative Investments project’s advisory board for helpful comments. All errors and omissions are our own.
4 The Global Economic Impact of Private Equity Report 2010Private Equity, Industry Performance and Cyclicality
2. INDUSTRY PERFORMANCE AND PRIVATE EQUITY There are several alternative perspectives that can be offered as to how PE investments can affect the prospects of an industry. In this section, we begin by reviewing the suggestions about changes regarding overall performance; we then turn to hypotheses regarding the interaction between economic cycles and PE investments.
2.A: The impact of PE investments on industry performanceOur initial examination focuses on the performance of industries where PE funds have been active relative to industries where these investors have not been active.
A central hypothesis since Jensen (1989) has been that private equity has the ability to improve the operations of firms. By closely monitoring managers, restricting free cash flow through the use of leverage and incentivizing managers with equity, it is argued, private equity-backed firms are able to improve operations in the firms they back. In this article, Jensen suggested that these leveraged buyouts (LBOs) may not only affect the bought-out firm itself but may also increase competitive pressure and force competitors to improve their own operations. John et al. (1992) present supporting empirical evidence that the threat of takeover serves as a spur for firms to voluntarily undertake restructurings.
The claim that private equity-backed firms have improved operations has been supported by a number of empirical studies, which focus on the effects on the individual private equity-backed companies. Kaplan (1989) examines changes in accounting performance for 76 large management buyouts of public companies between 1980 and 1986. He shows that in the three years after the transaction operating income, cash flow and market value all increase. He argues that these increases reflect the impact of improved incentives rather than layoffs. (Looking at more recent US public-to-private transactions, however, Guo et al. (2009) find only weak evidence that gains in operating performance of bought-out firms exceed those of their peers.) Muscarella and Vetsuypens (1990) examine 72 “reverse LBOs” (RLBOs), that is, companies taken private which went public once again. These firms experienced a dramatic increase in profitability, which they argue is a reflection of cost reductions.
More recent studies have used large samples and a variety of performance measures to more directly assess whether private equity makes a difference in the management of the firms in which they invest. Bloom et al. (2009) survey over 4,000 firms in Asia, Europe and the US to assess their management practices. They show that private equity-backed firms are on average the best-managed ownership group in the sample, though they cannot rule out the possibility these firms were better managed before the
PE transaction. Davis et al. (2009) compare all US-based manufacturing establishments that received PE investments between 1980 and 2005 with similar establishments that did not receive PE investments.1 They show that private equity-backed firms experienced a substantial productivity growth advantage (about two percentage points) in the two years following the transaction. About two-thirds of this differential is due to improved productivity among continuing establishments of the firms. Cao and Lerner (2009) examine the three- and five-year stock performance of 496 RLBOs between 1980 and 2002. RLBOs appear to consistently outperform other IPOs and the stock market as a whole. Large RLBOs that are backed by PE firms with more capital under management perform better, while quick flips – when PE firms sell off an investment soon after acquisition – underperform.
These findings might suggest that we would see superior performance for PE firms, regardless of the economic conditions. Moreover, if PE firms represent a significant fraction of the activity in certain industries (and tabulations in several countries, including the US and UK, suggest that this is the case), there may also be a positive effect at the industry level. Investigating the industry level also allows us to capture the ‘contagion’ effects arising if improvements in bought-out firms spur their competitors to improve. This effect is not captured by studies focusing on the individual portfolio companies.
While there has been little systematic evidence regarding the deleterious effects of private equity on firms and industries, critics have pointed to case studies that illustrate negative consequences of transactions. For instance, Rasmussen (2008) points to the buyout of Britain’s Automobile Association, which led to large-scale layoffs and service disruptions while generating substantial profits for the transaction’s sponsor, Permira. The Service Employees International Union has prepared a series of studies (for example, 2007, 2008) showing the deleterious effect that excessive leverage, cost-cutting and poor managerial decisions by PE groups can have on firms and industries through case studies such as Hawaiian Telecom, Intelsat, KB Toys and TDC. These cases suggest that the impact of private equity on industries may be more negative than suggested by the previous studies.
1 Establishments are specific factories, offices, retail outlets and other distinct physical locations where business takes place.
5The Global Economic Impact of Private Equity Report 2010 Private Equity, Industry Performance and Cyclicality
2.B: The impact of economic cyclesNumerous practitioner accounts over the years have suggested that the PE industry is highly cyclical, with periods of easy financing availability (often in response to the successes of earlier transactions) leading to an acceleration of deal volume, greater use of leverage, higher valuations, and ultimately more troubled investments (akin to the well-known ‘corn-hog cycle’ in agricultural economics).
This pattern is corroborated in several academic studies. Axelson et al. (2009) document the cyclical use of leverage in buyouts. Using a sample of 1,157 transactions completed by major groups worldwide between 1985 and 2008, they show that the level of leverage is driven by the cost of debt, rather than the more industry- and firm-specific factors that affect leverage in publicly traded firms. The availability of leverage is also strongly associated with higher valuation levels. Kaplan and Stein (1993) documented that the 1980s buyout boom saw an increase in valuations, reliance on public debt and incentive problems (for example, parties cashing out at the time of transaction). Moreover, in the transactions done at the market peak, the outcomes were disappointing: of the 66 largest buyouts completed between 1986 and 1988, 38% experienced financial distress, which they define as default or an actual or attempted restructuring of debt obligations due to difficulties in making payments. 27% actually did default on debt repayments, often in conjunction with a Chapter 11 filing. Kaplan and Schoar (2005) and other papers provide indirect supporting evidence, showing that the performance of funds is negatively correlated with inflows into these funds. Private equity funds raised during periods of high capital inflows – which are typically associated with market peaks – perform far worse than their peers.
These findings corroborate the suggestions that availability of financing impacts booms and busts in the PE market. If firms completing buyouts at market peaks employ leverage excessively, we may expect industries with heavy buyout activity to experience more intense subsequent downturns. Moreover, the effects of this overinvestment would be exacerbated if PE investments drive rivals, not backed by private equity, to aggressively invest and leverage themselves. Chevalier (1995) shows that in regions with supermarkets receiving PE investments, rivals responded by adding and expanding stores.
An alternative perspective is suggested by some recent events in the PE industry, even though it has not been articulated by economic theorists or explored empirically. This suggestion is that private equity-backed firms may do better during downturns because their investors constitute a concentrated shareholder base, which can continue to provide equity financing in a way that might be difficult to arrange for other companies during downturns. To cite two recent examples of ‘equity cures,’ Terra Firma made a number of investments in EMI, while Kraton Polymers’
equity investors (Ripplewood and CCMP) did likewise during the recent recession.2 This perspective would imply that private equity-backed companies may actually outperform their peers during downturns, as they have access to equity financing that other firms did not have. The presence of liquid PE funds as shareholders may lead to fewer failures in difficult economic conditions.
A related argument, originally proposed by Jensen (1989), is that the high levels of debt in PE transactions force firms to respond earlier and more forcefully to negative shocks to their business. As a result, private equity-backed firms may be forced to adjust their operations more rapidly at the beginning of an industry downturn, enabling them to better weather a recession. Even if some private equity-backed firms eventually end up in financial distress, their underlying operations may thus be in better shape than their peers. This facilitates an efficient restructuring of their capital structure and lowers the deadweight costs on the economy. Consistent with this argument, Andrade and Kaplan (1998) study 31 distressed leveraged buyouts from the 1980s that subsequently became financially distressed, and found that the value of the firms post-distress was slightly higher than the value before the buyout, suggesting that even the leveraged buyouts that were hit most severely by adverse shocks added some economic value.
Finally, the structural differences between PE funds and other financial institutions may make them less susceptible to industry shocks. A major source of concern for financial institutions is the so-called ‘run on the bank’ phenomenon. Runs occur when holders of short-term liabilities, for example, depositors or repo counterparties, simultaneously refuse to provide additional financing and demand their money back. Other versions of this phenomenon arise when companies simultaneously draw down lines of credit, hedge fund investors simultaneously ask for redemptions of their investments, or a freeze in the market for commercial paper prevents structured investment vehicles (SIVs) from rolling over short-term commercial paper. It is unlikely that PE investments create dangers through this mechanism. Private equity funds are typically prevented from borrowing themselves, and the funds’ only claimants are their limited partners (LPs), which are typically bound by 10-year lock-up agreements. Hence, the funds have no short-term creditors that can run. By way of contrast, extensive loans are provided to the individual portfolio companies. However, these loans are typically made by a concentrated set of lenders, and are without recourse to other portfolio companies or the fund generally. Hence, an individual creditor’s ability to be repaid is largely unaffected by the actions of other creditors, mitigating the incentive to run.
2 See Sabbagh (2009) and http://www.sec.gov/Archives/edgar/data/1321730/000119312509171893/d10q.htm (accessed 27 August 2009).
6 The Global Economic Impact of Private Equity Report 2010Private Equity, Industry Performance and Cyclicality
3. DATA SOURCES AND SAMPLE CONSTRUCTIONTo analyze how PE investments affect industries, we combine two datasets, one containing information about PE investments compiled by Capital IQ, and another with industry activity and performance across the Organisation for Economic Cooperation and Development (OECD) member countries included in the OECD’s Structural Analysis Database (STAN).
PE investment sample: We use the Capital IQ database to construct a base sample of PE transactions. The base sample contains all private placements and M&A transactions in Capital IQ where the list of acquirers includes (at least) one investment firm that has a reported investment interest in one of the following stages: Seed/startup, Early venture, Emerging growth, Growth capital, Bridge, Turnaround, Middle market, Mature, Buyout, Mid-venture, Late venture, Industry consolidation, Mezzanine/subdebt, Incubation, Recapitalization, or PIPES.
From the base sample, we select all M&A transactions classified as ‘leveraged buyout,’ ‘management buyout,’ or ‘going private’ that were announced between January 1986 and December 2007 and where the target company is located in an OECD country included in the STAN database. We exclude transactions that were announced but not yet completed as well as transactions that did not involve a financial investor (for example, a buyout led and executed by the management team itself was excluded).
This results in a sample of about 14,300 transactions, involving 13,100 distinct firms. Since we only have information about the deal size for 50% of our transactions (though more of the larger transactions), we impute missing deal sizes by constructing fitted values from a regression of deal size on fixed effects for country, investment year and target industry. Using the imputed transaction sizes, we generate aggregate country-year-industry measures of PE volume in the form of summed deal sizes.
Industry data: The STAN database provides industry data across OECD countries compiled from national statistics offices. It contains economic information at the country, year and industry level. Thus, a typical observation would be the German transport equipment industry in 1999. STAN includes measures of productivity, employment and capital formation, as described in Table 1. Throughout this paper, we focus on the following measures of industry activity:
• Production (gross output), the value of goods and/or services produced in a year, whether sold or stocked, in current prices.
• Value added represents the industry’s contribution to national GDP, i.e. output net of materials purchased. While the methodology for constructing this measure differs across nations, our focus here is on differences across time, which should reduce the effect of national differences in the measure.
• Labor costs, which comprise wages and salaries of employees paid by producers as well as supplements such as contributions to social security, private pensions, health insurance, life insurance and similar schemes.
• Number of employees, which is the traditional measure of employment, excluding self-employed and unpaid family members working in the business.
• Gross capital formation is acquisitions, less disposals, of new tangible assets, as well as such intangible assets as mineral exploration and computer software. This variable is the closest aggregate to capital expenditures. The two capital stock measures are indicators of the value of all capital equipment held. The gross stock measure does not factor in depreciation, while the net stock does reflect write-downs.
• Consumption of fixed capital measures the reduction in the value of fixed assets used in production resulting from physical deterioration or normal obsolescence.
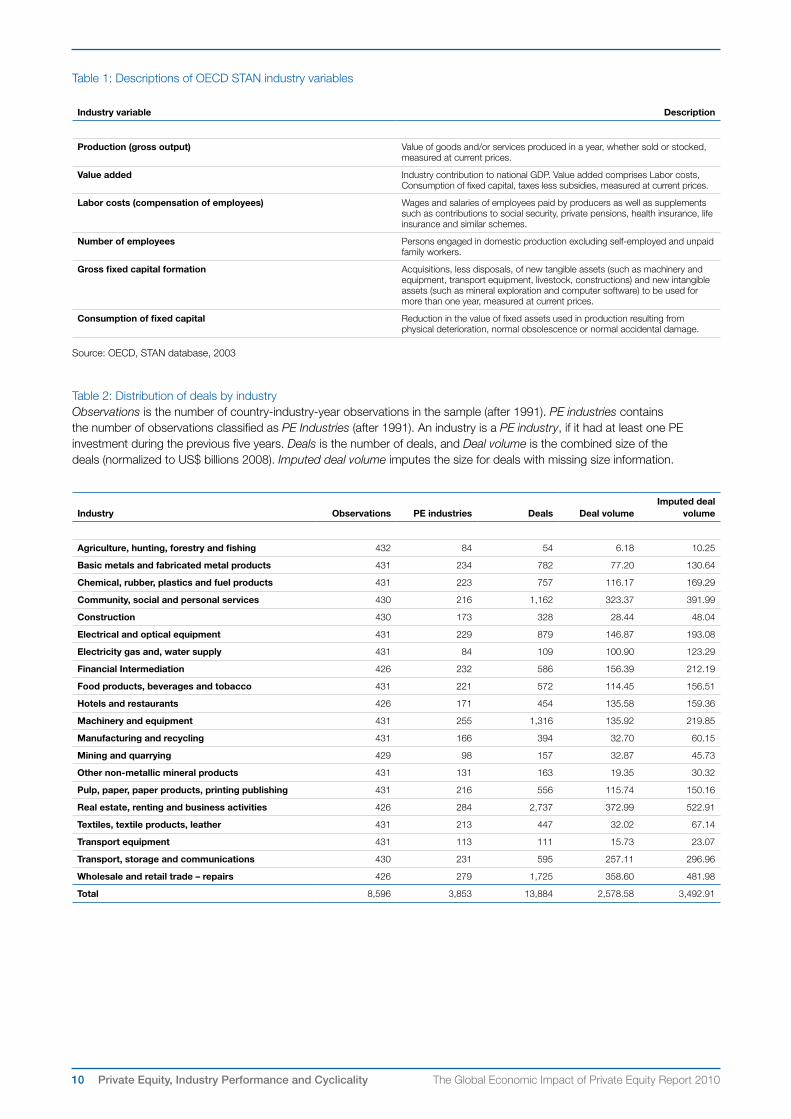
Mapping Capital IQ and STAN industries: Industries in the STAN database are classified by the International Standard Industrial Classification (ISIC) code. To link these data to the industry-aggregated PE activity, we matched the ISIC codes with Capital IQ’s industry classifications. We used the existing mapping from Capital IQ industry classification into SIC codes, and then used the existing matching between SIC and ISIC industries. The mapping of Capital IQ industry classifications to SIC codes includes only matches for the most detailed levels of the Capital IQ classifications. This poses a problem for more aggregated industries for which Capital IQ does not provide a match to a SIC and ultimately to ISIC. When the Capital IQ target industry is at a more aggregated industry level, we mapped all four-digit SIC codes that belong to the sub-categories of the industry classification of Capital IQ. In these cases, we had multiple four-digit SIC codes for a single Capital IQ industry. In some of the transactions all of the four-digit SICs corresponded to the same ISIC industry classification, creating a one-to-one mapping. In cases where the four-digit SIC codes corresponded to different industries in the ISIC scheme, we considered the particular deals and selected the most suitable industry. In 390 transactions, we were not able to determine with certainty the appropriate match in ISIC, and those transactions were dropped, leaving us with 13,910 PE transactions with ISIC classifications. Finally, we grouped ISIC sub-industries to balance PE activity across industries. Table 2 presents the distribution of deals across industries.
This results in a sample of 11,135 country-industry-year observations during the years 1986 to 2007. For each country, industry and year, we measure PE activity as the volume of PE deals occurring in this country and industry during the previous five years. In particular, an observation is a PE industry if it had at least one PE investment in one of those five years. (This definition was motivated by holding periods reported by Strömberg (2008)). With this definition, we can only compare activity during 1991 to 2007, leaving us with 8,596 country-industry-year observations.
7The Global Economic Impact of Private Equity Report 2010 Private Equity, Industry Performance and Cyclicality
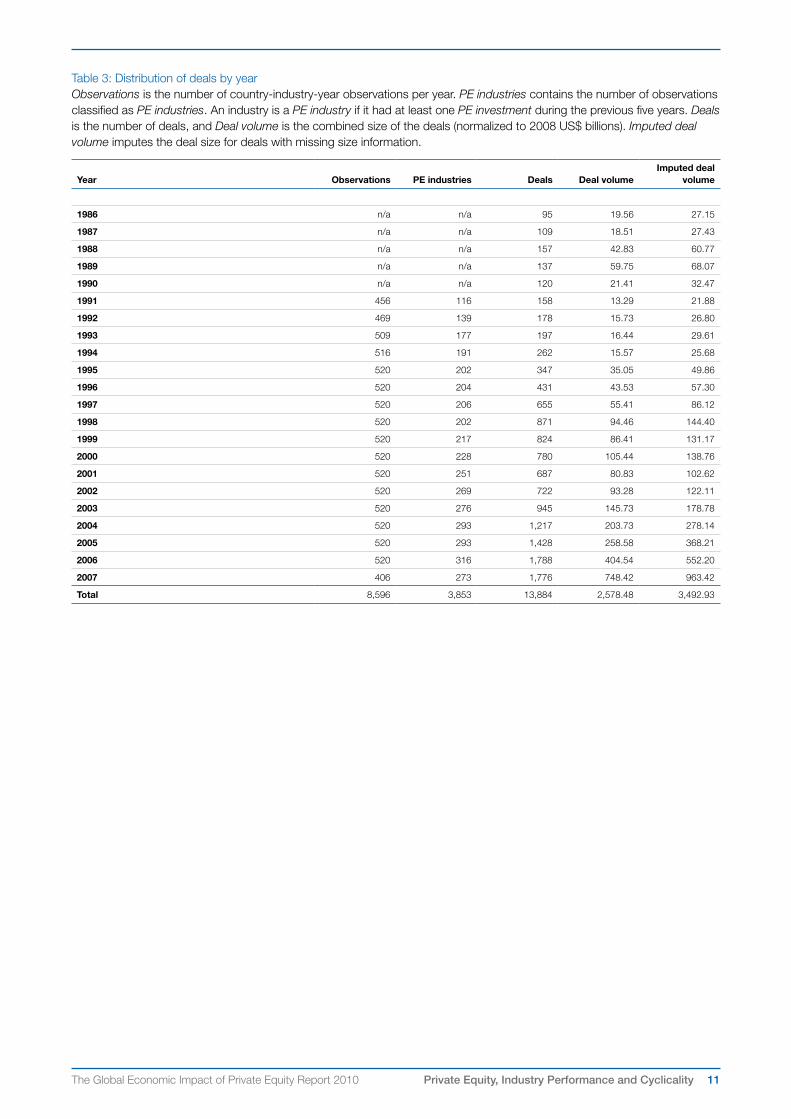
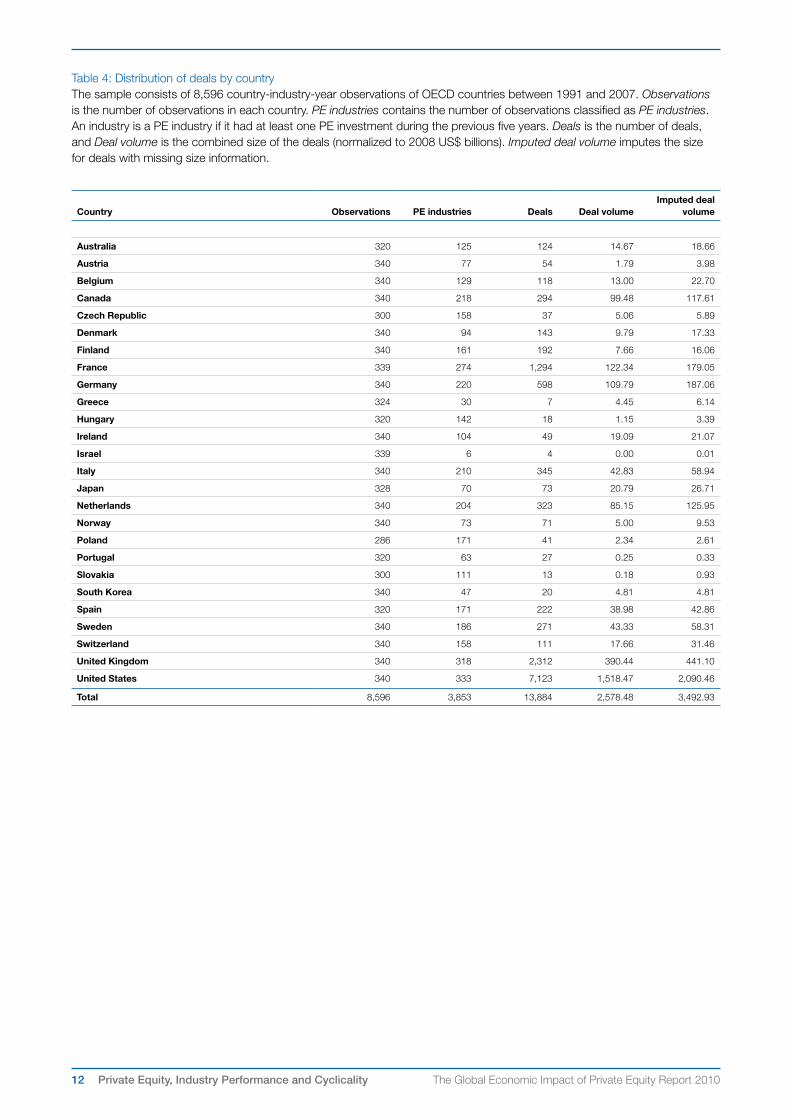
Tables 2, 3 and 4 present the distribution of deals across industries, years and countries. In each table, we first present the number of observations (an observation is a country-industry-year pair) and the number of those that were PE industries, as defined above. We then present the number of deals, transaction volume and the transaction volume including the imputed sizes of deals with missing information.
Several patterns are visible from Tables 2 through 4:
• The heavy representation of buyouts as a share of economic activity in traditional industries, such as ‘Textiles, textile products, leather,’ ‘Machinery and equipment,’ ‘Pulp, paper, paper products, printing,’ ‘Electrical and optical equipment,’ and ‘Chemical, rubber, plastics and fuel products’.
• The acceleration in buyout activity, first modestly during the late 1980s and then especially in the mid-2000s.
• The greater level of activity in a handful of traditional hubs for PE funds, including the United States, the Netherlands, Sweden, and the United Kingdom.3
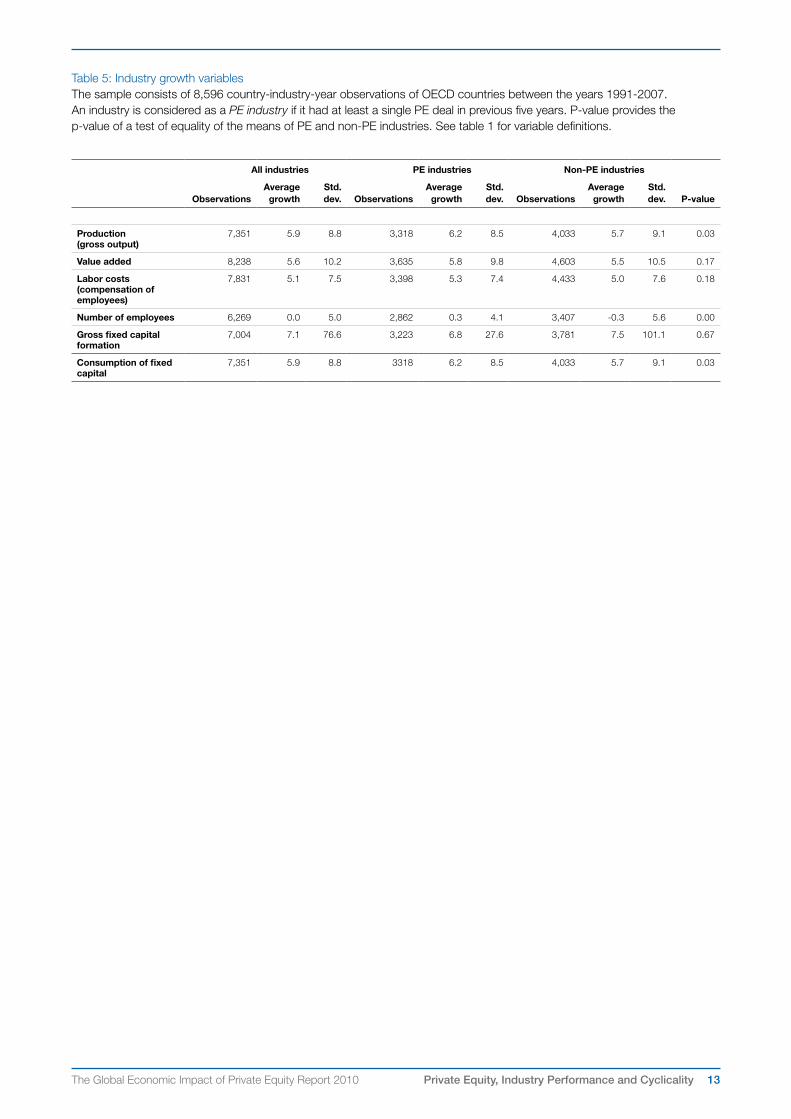
In Table 5, we compare the changes in the industry measures over time for PE and non-PE industries. The PE industries grow more quickly in terms of output and value added, as well in terms of employment. But for gross fixed capital formation, the PE industries have a slower growth rate.
4. ANALYSIS4.A: Industry performanceWe begin by examining the relationship between various industry characteristics and the role of private equity in the industry. In each case, we use the industry-country-year as an observation, and the explanatory variable is the relative growth rate along a given dimension (for example, employment). This adjusted rate is computed by subtracting the growth rate experienced in that industry, country and year from the average growth rate across countries in that same industry and year. Demeaning the growth rate in this way is largely equivalent to including year-industry fixed effects, but it allows for an easier interpretation of the estimated parameters.
We employ several specifications. First, we look at specifications that include controls for each year, industry and country. For the exogenous variable, we include an indicator which denotes whether the industry is a PE industry or not, using the definition above. This definition does not use the imputed deal values, since it only depends on the presence of PE deals. Second, we use two indicators to capture whether an industry is a low or high PE industry. A low PE industry (PE Low) is a PE industry where the fraction of total imputed PE investments divided by total production (both normalized to 2008 USD) is smaller than the median (conditional on having a non-zero level of PE investment). Empirically, this median is 0.61%. Correspondingly, a high PE industry (PE High) is one where the fraction is greater than 0.61%. We also perform the analysis dividing PE activity into quartiles to better measure the differential
effects of different activity levels. Third, we include dummies that are interactions between countries and industries (Co-Ind FE). These controls allow us to more precisely capture national differences in the industry dynamics: if there is any effect from a PE investment, it is because the growth rate is fast during that specific period.
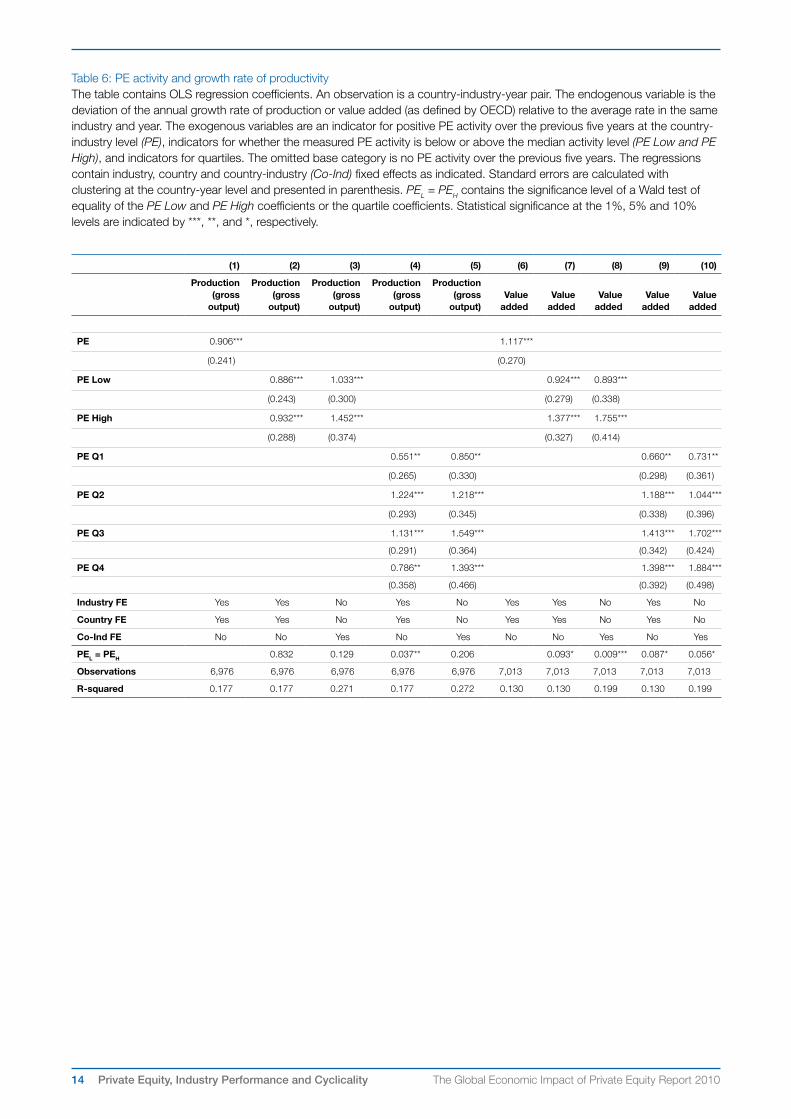
The results in Table 6 indicate that industries with PE deals have significantly higher growth rates of production and value added. For instance, in the first regression, the coefficient of 0.906 implies that the total production of an average PE industry grows at an annual rate that is 0.906% higher than a non-PE industry. (Table 5 reports that the mean growth rate is 5.9%.) We report the significance of a statistical test for differences between high and low PE industries and differences between the four quartiles of PE activity (all reported as PEL = PEH). We find few differences in total production between high and low PE industries, although the specification using quartiles suggests that the positive effect may be particularly strong for industries with an intermediate level of PE activity. Value added for an industry appears to be increasing in the amount of PE activity, with the differences between high and low PE industries being statistically and economically significant.
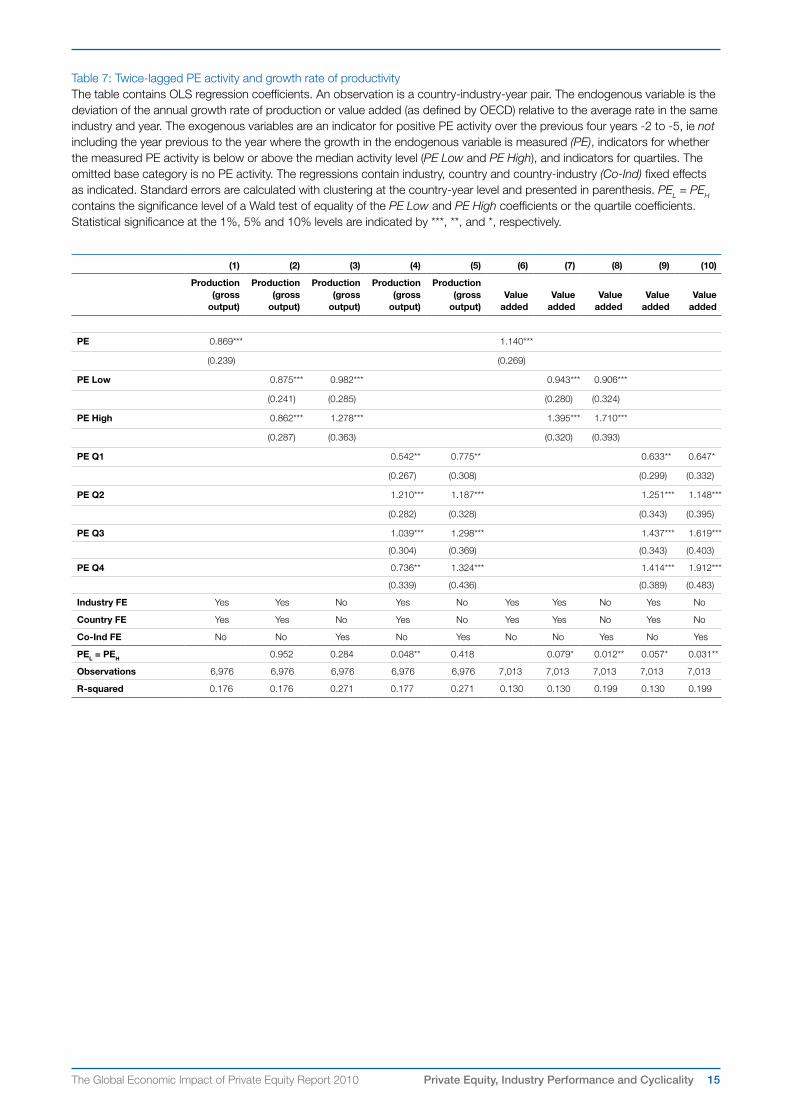
One concern is the direction of causality. It is possible that PE investors pick industries that are about to start growing and our results may reflect this industry choice rather than the causal effect of the investments on the industry. To mitigate this concern, we change our definition of the PE industry measure to only include investments during the period from two to five years prior to the observation, called the twice-lagged measure (the original PE measure included all five years prior to the observation). The results are reported in Table 7. We find that the results are very similar, indicating that the effect that we find is unlikely to be driven by PE investors entering countries and industries where they expect stronger immediate growth.
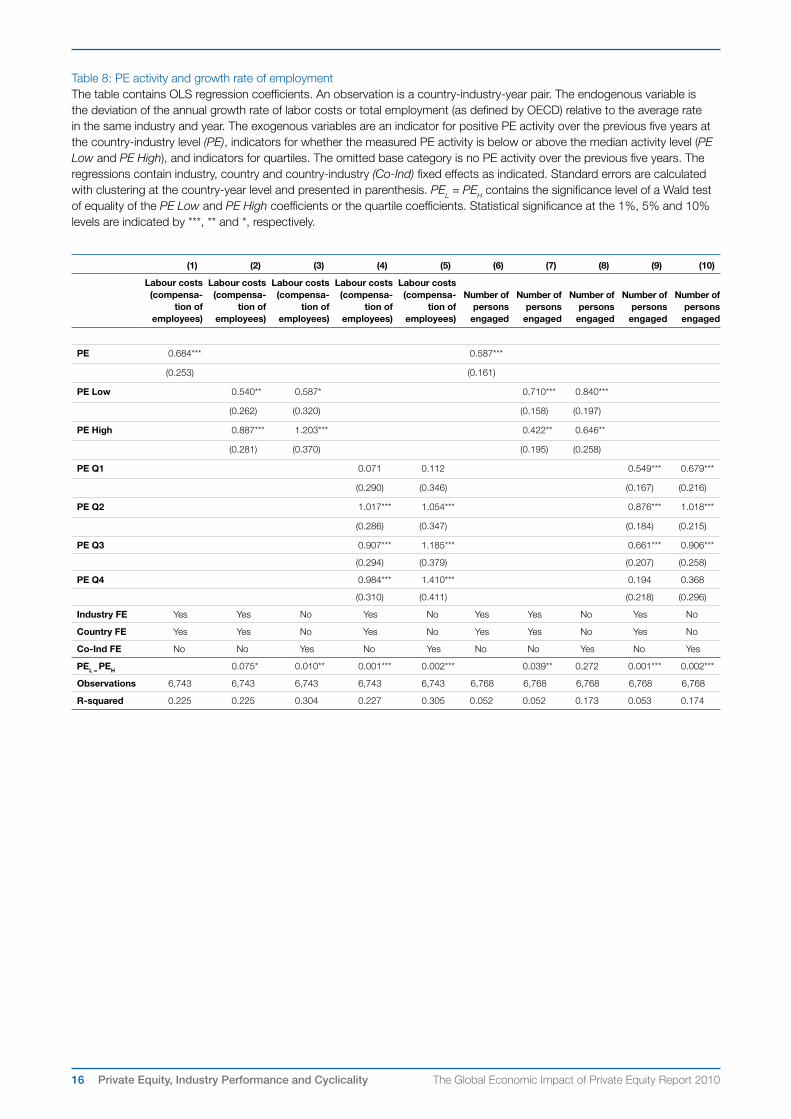
Table 8 considers measures of employment. PE industries appear to grow significantly faster in terms of labor costs and the number of employees. The annual growth rate of total labor cost is 0.5 to 1.4 percentage points greater for PE industries, and the number of employees grows at an annual rate that is 0.4 to 1.0 percentage points greater. These findings are particularly surprising, since a common concern is that PE investors act aggressively to reduce costs with little concern for employees. This concern is not necessarily inconsistent with our results. Despite initial employment reductions at private equity-backed firms, the greater subsequent growth in total production, observed in Table 6, may lead to subsequent employment growth in the industry overall. Considering the specifications with PE activity quartiles, industries with more PE activity appear to have more rapid growth of total labor costs, but the growth rate of the number of employees is fastest in industries with more moderate levels of PE activity. Regardless of the level of PE activity, however, the PE industries’ growth rates of labor costs and employment always exceed the rates for non-PE industries.
3 The level of transactions is extremely high in Luxembourg, due to the tendency of many firms to domicile there for tax reasons, even though the bulk of their operations are elsewhere. As a result, we omit Luxembourg from the analyses below.
8 The Global Economic Impact of Private Equity Report 2010Private Equity, Industry Performance and Cyclicality
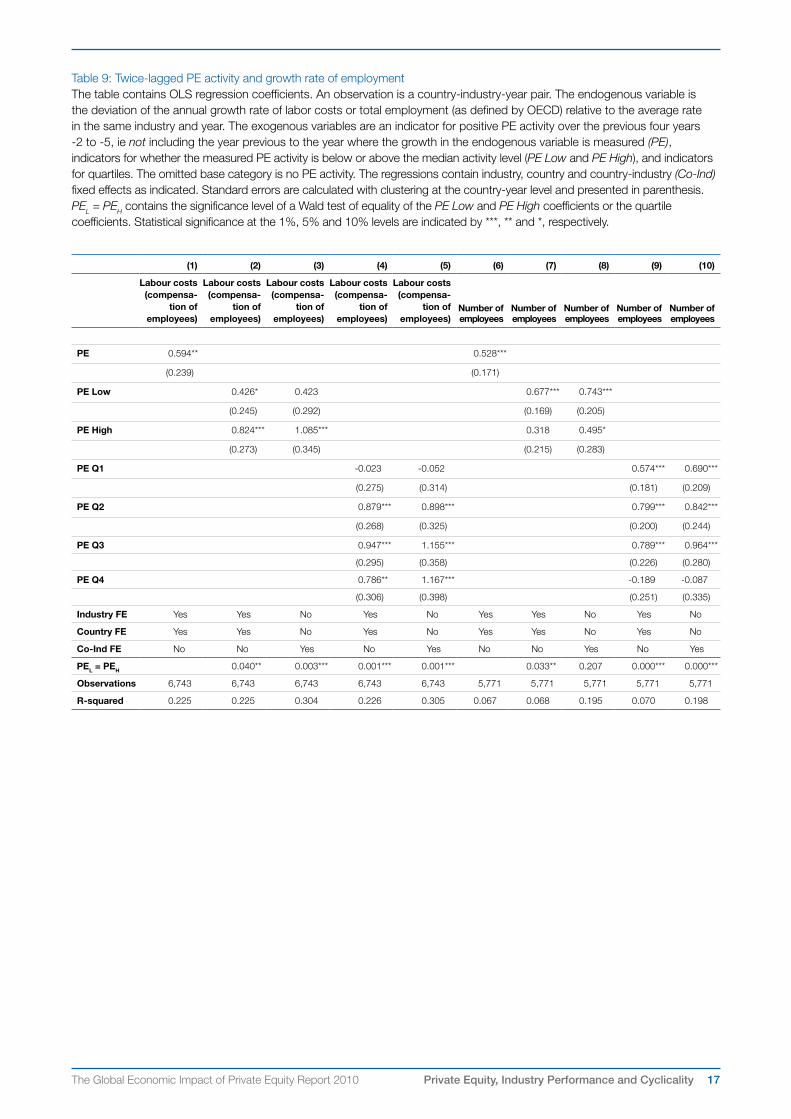
As above, we are concerned about the direction of causality, and Table 9 repeats the analysis using the twice-lagged PE measure. The magnitudes in Tables 8 and 9 are largely similar, suggesting that the effect we find is not mainly driven by PE investors picking industries with expectations of immediate employment growth.
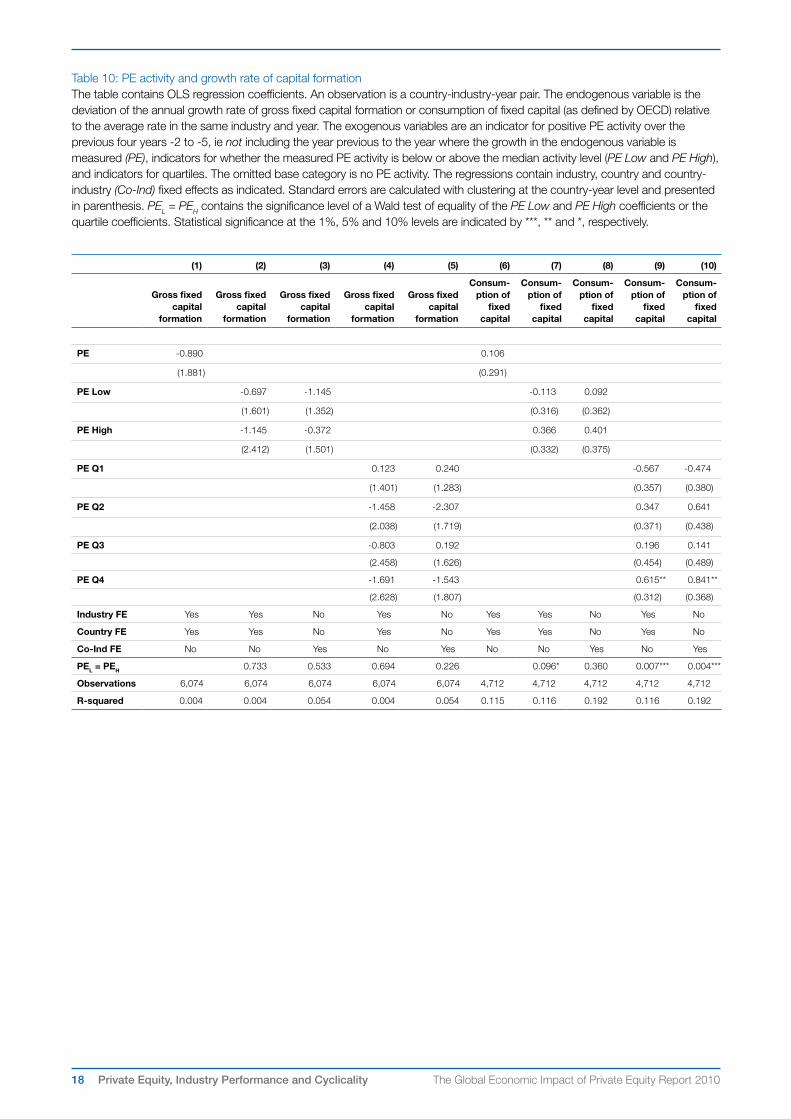
Finally, in Table 10 we examine measures of fixed capital formation and consumption of fixed capital. These measures appear much more volatile than the production and employment measures, making it difficult to discern any relationship between PE investments and capital formation.
4.B: Cyclical patternsWe next turn to analyzing how private equity relates to industry cycles. For each industry and year, we calculate the average growth by averaging the growth rate of the productivity and employment measures across countries. This measures the annual aggregate shock in these variables (for example, production output in the steel industry fell by 2% on average in 2002 across the nations in our sample). We then investigate whether PE industries are more or less exposed to this shock by including the PE measure interacted with this average growth measure in the regressions. If PE industries are more sensitive to economic conditions, the coefficient on the interaction term is positive: during upturns, these industries grow faster and during downturns they decline faster. A negative coefficient indicates a lower exposure to the aggregate shock than industries without PE investments. Once again, we use country and industry fixed effects, as well as country-industry fixed effect interactions.
In Tables 11 and 12, we examine the impact on production and employment. In the first table, the interaction terms are negative, which implies that PE industries are less sensitive to industry shocks. To interpret the coefficients, using the estimates in the first regression in Table 12, if an industry on average experiences a 5% increase in total labor costs in a given year (the aggregate shock), a PE industry will experience, on average, a 5.576% increase (5% + 1.591% + 5% x –0.203 = 5.576%). Conversely, following a 5% decrease in the wage bill, a PE industry will only experience, on average, a 2.394% decline (–5% + 1.591% + (–5%) x –0.203 = –2.394%). Hence, an aggregate swing from +5% to –5% (10% total difference) in aggregate growth rates translates into a swing from 5.6% to –2.4% (8% total difference) in the growth rates for PE industries. Both for the productivity and employment analyses, the coefficients are significantly negative in the simple specification and most of the coefficients in the employment analysis remain statistically significant when high and low PE industries are included separately. Overall, it appears that some PE activity translates into an industry whose employment changes less than average, but industries with a larger amount of PE activity may follow a growth pattern that is closer to that of the industry as a whole.
4.C: Geographic patternsOne concern is that the impact of private equity is different in continental Europe than in the United States and United Kingdom. Not only is the level of PE activity higher in the US and UK than in most other nations, but the industry is more established, having begun in these two nations. We thus repeat the analysis, looking at US and UK versus Continental Europe (investments in Japan and South Korea are excluded from these analyses).
We report the results in Tables 13 and 14, which repeat the base specifications reported in Tables 6 and 8. All the main effects remain largely unchanged for the Continental Europe sample. The coefficients in the US and UK sample are generally not statistically significant but they are not statistically different from the coefficients for the Continental Europe sample either. This probably reflects the small size of the US and UK sample and the resulting large standard errors: for productivity, value added and labor costs the coefficients are smaller than in Continental Europe; for total employment the coefficient is larger.
4.D: Addressing causality concernsOne natural concern relates to the interpretation of these results. While it appears that private equity is associated with more rapid growth at an industry level in our analyses, it is natural to wonder which way the causation runs. Does the presence of private equity lead to better performance, or do PE investors invest where they (correctly) anticipate industries will grow?
We respond to this question in several ways. First, we look at PE investments during the five years before the measured growth. Second, as discussed above, we have also narrowed our measure to only include deals in the second through fifth year prior to the investment. If our effects are due to PE investors anticipating growth, they would have to be quite prescient.
In subsequent versions of this paper, we will also attempt to address this concern using an instrumental variables technique. To identify exogenous variation, we may use the size of the private pension pool in the nation and year, expressed as a percentage of GDP. This is similar in spirit to other papers in the venture capital literature, such as Kortum and Lerner (2000) and Mollica and Zingales (2007). In the nations with larger pension pools, domestic PE funds are more likely to raise capital and invest it locally. This is an attractive instrumental variable, because pension policy is typically driven by broader socio-economic considerations, and not by the relative health of the local PE industry.
5. CONCLUSIONSThe growth of the PE industry has spurred concerns about its potential impact on the economy more generally. In this analysis, we look across nations and industries to assess the impact of private equity on industry performance.
The key results are, first, that industries where PE funds have invested in the past five years have grown more quickly, using a variety of measures. There are few significant differences between industries with limited and high PE
9The Global Economic Impact of Private Equity Report 2010 Private Equity, Industry Performance and Cyclicality
activity. Second, it is hard to find support for claims that economic activity in industries with PE backing is more exposed to aggregate shocks. The results using lagged PE investments suggest that the results are not driven by reverse causality. Finally, these patterns are not driven solely by common law nations such as the United Kingdom and United States, but also hold in Continental Europe.
These findings suggest a number of avenues for future research. First, it would be interesting to look at finer data on certain critical aspects of industry performance, such as the rates of layoffs, plant closings and openings, and product and process innovations. Second, it is important to better understand the mechanisms by which the presence of private equity-backed firms affects their peers. While Chevalier’s (1995) study of the supermarket industry during the 1980s was an important first step, much more remains to be explored here. Finally, we are only able to look backwards in this analysis. The buyout boom of the mid 2000s was so massive, and the subsequent crash in activity so dramatic, that the consequences may have been substantially different from other economic cycles (see Kosman (2009)). The impact of the recent cycle will be an important issue to explore in the years to come.
REFERENCES Andrade, G. and Kaplan, S. (1998) How Costly is Financial (Not Economic) Distress? Evidence from Highly Leveraged Transactions that Became Distressed. In Journal of Finance 53(5), 1443-1493.
Axelson, U., Strömberg, P., Jenkinson, T. et al (2009) Leverage and Pricing in Buyouts: An Empirical Analysis. EFA 2009 Bergen Meetings Working Paper. Available at http://ssrn.com/abstract=1344023.
Bloom, N., Sadun, R. and Van Reenen, J. (2009) Do Private Equity-Owned Firms Have Better Management Practices? In Gurung, A. and Lerner, J. (eds.) Globalization of Alternative Investments Working Papers Volume 2: Global Economic Impact of Private Equity 2009, New York: World Economic Forum USA, 2009, 1-23. Available at http://www.weforum.org/pdf/cgi/pe/Full_Report2.pdf.
Cao, J. and Lerner, J. (2009) The Performance of Reverse-Leveraged Buyouts. In Journal of Financial Economics 91 (February), 139-157.
Chevalier, J. (1995) Capital Structure and Product-Market Competition: Empirical Evidence from the Supermarket Industry. In American Economic Review 85 (June), 415-435.
Davis, S., Haltiwanger, J., Jarmin, R., et al (2009) Private Equity, Jobs and Productivity. In Gurung, A. and Lerner, J. (eds.) Globalization of Alternative Investments Working Papers Volume 2: Global Economic Impact of Private Equity 2009, New York: World Economic Forum USA, 2009, 27-43. Available at http://www.weforum.org/pdf/cgi/pe/Full_Report2.pdf.
European Commission (2009), Commission Staff Working Document Accompanying the Proposal for a Directive of the European Parliament and of the Council on Alternative Investment Fund Managers and amending Directives 2004/39/
EC and 2009/…/EC: Impact Assessment, COM(2009) 207/SEC (2009) 577. Brussels: European Commission.
Guo, S., Hotchkiss, E. and Song, W. (2009) Do Buyouts (Still) Create Value? In Journal of Finance, forthcoming. Available at http://ssrn.com/abstract=1108808.
Jensen, M. (1986) Agency Costs of Free Cash Flow, Corporate Finance and Takeovers. In American Economic Review Papers and Proceedings 76 (May), 323-329.
Jensen, M. (1989) The Eclipse of the Public Corporation. In Harvard Business Review 67 (September/October), 61-74.
John, K., Lang, L. and Netter, J.(1992) The Voluntary Restructuring of Large Firms in Response to Performance Decline. In Journal of Finance 47 (July), 891-917.
Kaplan, S. (1989) The Effects of Management Buyouts on Operating Performance and Value. In Journal of Financial Economics 24 (October), 217-254.
Kaplan, S. and Schoar, A. (2005) Private Equity Performance: Returns, Persistence and Capital Flows. In Journal of Finance 60 (August), 1791-1823.
Kaplan, S. and Stein, J. (1993) The Evolution of Buyout Pricing and Financial Structure in the 1980s. In Quarterly Journal of Economics 108 (May), 313-357.
Kortum, S. and Lerner, J. (2000) Assessing the Contribution of Venture Capital to Innovation. In RAND Journal of Economics 31 (Winter), 674-692.
Kosman, J. (2009) The Buyout of America: How Private Equity Will Cause the Next Great Credit Crisis, New York: Penguin, 2009.
Mollica, M. and Zingales, L. (2007) The Impact of Venture Capital on Innovation and the Creation of New Business. Unpublished Working Paper, University of Chicago.
Muscarella, C. and Vetsuypens, M. (1990) Efficiency and Organizational Structure: A Study of Reverse LBOs. In Journal of Finance 45 (December), 1389-1413.
Rasmussen, P. (2008) Taming the Private Equity Fund “Locusts”. In Europe Today 8 (Spring), 130-133.
Sabbagh, D. (2009) Terra Firma Injects Cash into Struggling EMI. In The Times newspaper. London, 30 January.
Service Employees International Union (2007) Behind the Buyouts: Inside the World of Private Equity. Washington, DC: SEIU.
Service Employees International Union (2008) Private Equity’s Appetite for Infrastructure Could Put State and Local Taxpayers and Services at Risk. Draft policy discussion paper SEIU. Available at http://www.behindthebuyouts.org/storage/Copy_of_DRAFT_SEIU_Infrastructure_Policy_Paper_Oct_2008.pdf.
Strömberg, P. (2008) The New Demography of Private Equity. In Gurung, A. and Lerner, J. (eds.) Globalization of Alternative Investments Working Papers Volume 1: Global Economic Impact of Private Equity 2008, New York: World Economic Forum USA, 2008, 3-26. Available at http://www.weforum.org/pdf/cgi/pe/Full_Report.pdf.
10 The Global Economic Impact of Private Equity Report 2010Private Equity, Industry Performance and Cyclicality
Table 1: Descriptions of OECD STAN industry variables
Industry variable Description
Production (gross output) Value of goods and/or services produced in a year, whether sold or stocked, measured at current prices.
Value added Industry contribution to national GDP. Value added comprises Labor costs, Consumption of fixed capital, taxes less subsidies, measured at current prices.
Labor costs (compensation of employees) Wages and salaries of employees paid by producers as well as supplements such as contributions to social security, private pensions, health insurance, life insurance and similar schemes.
Number of employees Persons engaged in domestic production excluding self-employed and unpaid family workers.
Gross fixed capital formation Acquisitions, less disposals, of new tangible assets (such as machinery and equipment, transport equipment, livestock, constructions) and new intangible assets (such as mineral exploration and computer software) to be used for more than one year, measured at current prices.
Consumption of fixed capital Reduction in the value of fixed assets used in production resulting from physical deterioration, normal obsolescence or normal accidental damage.
Source: OECD, STAN database, 2003
Table 2: Distribution of deals by industry Observations is the number of country-industry-year observations in the sample (after 1991). PE industries contains the number of observations classified as PE Industries (after 1991). An industry is a PE industry, if it had at least one PE investment during the previous five years. Deals is the number of deals, and Deal volume is the combined size of the deals (normalized to US$ billions 2008). Imputed deal volume imputes the size for deals with missing size information.
Industry Observations PE industries Deals Deal volumeImputed deal
volume
Agriculture, hunting, forestry and fishing 432 84 54 6.18 10.25
Basic metals and fabricated metal products 431 234 782 77.20 130.64
Chemical, rubber, plastics and fuel products 431 223 757 116.17 169.29
Community, social and personal services 430 216 1,162 323.37 391.99
Construction 430 173 328 28.44 48.04
Electrical and optical equipment 431 229 879 146.87 193.08
Electricity gas and, water supply 431 84 109 100.90 123.29
Financial Intermediation 426 232 586 156.39 212.19
Food products, beverages and tobacco 431 221 572 114.45 156.51
Hotels and restaurants 426 171 454 135.58 159.36
Machinery and equipment 431 255 1,316 135.92 219.85
Manufacturing and recycling 431 166 394 32.70 60.15
Mining and quarrying 429 98 157 32.87 45.73
Other non-metallic mineral products 431 131 163 19.35 30.32
Pulp, paper, paper products, printing publishing 431 216 556 115.74 150.16
Real estate, renting and business activities 426 284 2,737 372.99 522.91
Textiles, textile products, leather 431 213 447 32.02 67.14
Transport equipment 431 113 111 15.73 23.07
Transport, storage and communications 430 231 595 257.11 296.96
Wholesale and retail trade – repairs 426 279 1,725 358.60 481.98
Total 8,596 3,853 13,884 2,578.58 3,492.91
11The Global Economic Impact of Private Equity Report 2010 Private Equity, Industry Performance and Cyclicality
Table 3: Distribution of deals by yearObservations is the number of country-industry-year observations per year. PE industries contains the number of observations classified as PE industries. An industry is a PE industry if it had at least one PE investment during the previous five years. Deals is the number of deals, and Deal volume is the combined size of the deals (normalized to 2008 US$ billions). Imputed deal volume imputes the deal size for deals with missing size information.
Year Observations PE industries Deals Deal volumeImputed deal
volume
1986 n/a n/a 95 19.56 27.15
1987 n/a n/a 109 18.51 27.43
1988 n/a n/a 157 42.83 60.77
1989 n/a n/a 137 59.75 68.07
1990 n/a n/a 120 21.41 32.47
1991 456 116 158 13.29 21.88
1992 469 139 178 15.73 26.80
1993 509 177 197 16.44 29.61
1994 516 191 262 15.57 25.68
1995 520 202 347 35.05 49.86
1996 520 204 431 43.53 57.30
1997 520 206 655 55.41 86.12
1998 520 202 871 94.46 144.40
1999 520 217 824 86.41 131.17
2000 520 228 780 105.44 138.76
2001 520 251 687 80.83 102.62
2002 520 269 722 93.28 122.11
2003 520 276 945 145.73 178.78
2004 520 293 1,217 203.73 278.14
2005 520 293 1,428 258.58 368.21
2006 520 316 1,788 404.54 552.20
2007 406 273 1,776 748.42 963.42
Total 8,596 3,853 13,884 2,578.48 3,492.93
12 The Global Economic Impact of Private Equity Report 2010Private Equity, Industry Performance and Cyclicality
Table 4: Distribution of deals by country The sample consists of 8,596 country-industry-year observations of OECD countries between 1991 and 2007. Observations is the number of observations in each country. PE industries contains the number of observations classified as PE industries. An industry is a PE industry if it had at least one PE investment during the previous five years. Deals is the number of deals, and Deal volume is the combined size of the deals (normalized to 2008 US$ billions). Imputed deal volume imputes the size for deals with missing size information.
Country Observations PE industries Deals Deal volumeImputed deal
volume
Australia 320 125 124 14.67 18.66
Austria 340 77 54 1.79 3.98
Belgium 340 129 118 13.00 22.70
Canada 340 218 294 99.48 117.61
Czech Republic 300 158 37 5.06 5.89
Denmark 340 94 143 9.79 17.33
Finland 340 161 192 7.66 16.06
France 339 274 1,294 122.34 179.05
Germany 340 220 598 109.79 187.06
Greece 324 30 7 4.45 6.14
Hungary 320 142 18 1.15 3.39
Ireland 340 104 49 19.09 21.07
Israel 339 6 4 0.00 0.01
Italy 340 210 345 42.83 58.94
Japan 328 70 73 20.79 26.71
Netherlands 340 204 323 85.15 125.95
Norway 340 73 71 5.00 9.53
Poland 286 171 41 2.34 2.61
Portugal 320 63 27 0.25 0.33
Slovakia 300 111 13 0.18 0.93
South Korea 340 47 20 4.81 4.81
Spain 320 171 222 38.98 42.86
Sweden 340 186 271 43.33 58.31
Switzerland 340 158 111 17.66 31.46
United Kingdom 340 318 2,312 390.44 441.10
United States 340 333 7,123 1,518.47 2,090.46
Total 8,596 3,853 13,884 2,578.48 3,492.93
13The Global Economic Impact of Private Equity Report 2010 Private Equity, Industry Performance and Cyclicality
Table 5: Industry growth variables The sample consists of 8,596 country-industry-year observations of OECD countries between the years 1991-2007. An industry is considered as a PE industry if it had at least a single PE deal in previous five years. P-value provides the p-value of a test of equality of the means of PE and non-PE industries. See table 1 for variable definitions.
All industries PE industries Non-PE industries
ObservationsAverage
growthStd. dev. Observations
Average growth
Std. dev. Observations
Average growth
Std. dev. P-value
Production (gross output)
7,351 5.9 8.8 3,318 6.2 8.5 4,033 5.7 9.1 0.03
Value added 8,238 5.6 10.2 3,635 5.8 9.8 4,603 5.5 10.5 0.17
Labor costs (compensation of employees)
7,831 5.1 7.5 3,398 5.3 7.4 4,433 5.0 7.6 0.18
Number of employees 6,269 0.0 5.0 2,862 0.3 4.1 3,407 -0.3 5.6 0.00
Gross fixed capital formation
7,004 7.1 76.6 3,223 6.8 27.6 3,781 7.5 101.1 0.67
Consumption of fixed capital
7,351 5.9 8.8 3318 6.2 8.5 4,033 5.7 9.1 0.03
14 The Global Economic Impact of Private Equity Report 2010Private Equity, Industry Performance and Cyclicality
Table 6: PE activity and growth rate of productivityThe table contains OLS regression coefficients. An observation is a country-industry-year pair. The endogenous variable is the deviation of the annual growth rate of production or value added (as defined by OECD) relative to the average rate in the same industry and year. The exogenous variables are an indicator for positive PE activity over the previous five years at the country-industry level (PE), indicators for whether the measured PE activity is below or above the median activity level (PE Low and PE High), and indicators for quartiles. The omitted base category is no PE activity over the previous five years. The regressions contain industry, country and country-industry (Co-Ind) fixed effects as indicated. Standard errors are calculated with clustering at the country-year level and presented in parenthesis. PEL = PEH contains the significance level of a Wald test of equality of the PE Low and PE High coefficients or the quartile coefficients. Statistical significance at the 1%, 5% and 10% levels are indicated by ***, **, and *, respectively.
(1) (2) (3) (4) (5) (6) (7) (8) (9) (10)
Production (gross
output)
Production (gross
output)
Production (gross
output)
Production (gross
output)
Production (gross
output)Value
addedValue
addedValue
addedValue
addedValue
added
PE 0.906*** 1.117***
(0.241) (0.270)
PE Low 0.886*** 1.033*** 0.924*** 0.893***
(0.243) (0.300) (0.279) (0.338)
PE High 0.932*** 1.452*** 1.377*** 1.755***
(0.288) (0.374) (0.327) (0.414)
PE Q1 0.551** 0.850** 0.660** 0.731**
(0.265) (0.330) (0.298) (0.361)
PE Q2 1.224*** 1.218*** 1.188*** 1.044***
(0.293) (0.345) (0.338) (0.396)
PE Q3 1.131*** 1.549*** 1.413*** 1.702***
(0.291) (0.364) (0.342) (0.424)
PE Q4 0.786** 1.393*** 1.398*** 1.884***
(0.358) (0.466) (0.392) (0.498)
Industry FE Yes Yes No Yes No Yes Yes No Yes No
Country FE Yes Yes No Yes No Yes Yes No Yes No
Co-Ind FE No No Yes No Yes No No Yes No Yes
PEL = PEH 0.832 0.129 0.037** 0.206 0.093* 0.009*** 0.087* 0.056*
Observations 6,976 6,976 6,976 6,976 6,976 7,013 7,013 7,013 7,013 7,013
R-squared 0.177 0.177 0.271 0.177 0.272 0.130 0.130 0.199 0.130 0.199
15The Global Economic Impact of Private Equity Report 2010 Private Equity, Industry Performance and Cyclicality
Table 7: Twice-lagged PE activity and growth rate of productivityThe table contains OLS regression coefficients. An observation is a country-industry-year pair. The endogenous variable is the deviation of the annual growth rate of production or value added (as defined by OECD) relative to the average rate in the same industry and year. The exogenous variables are an indicator for positive PE activity over the previous four years -2 to -5, ie not including the year previous to the year where the growth in the endogenous variable is measured (PE), indicators for whether the measured PE activity is below or above the median activity level (PE Low and PE High), and indicators for quartiles. The omitted base category is no PE activity. The regressions contain industry, country and country-industry (Co-Ind) fixed effects as indicated. Standard errors are calculated with clustering at the country-year level and presented in parenthesis. PEL = PEH contains the significance level of a Wald test of equality of the PE Low and PE High coefficients or the quartile coefficients. Statistical significance at the 1%, 5% and 10% levels are indicated by ***, **, and *, respectively.
(1) (2) (3) (4) (5) (6) (7) (8) (9) (10)
Production (gross
output)
Production (gross
output)
Production (gross
output)
Production (gross
output)
Production (gross
output)Value
addedValue
addedValue
addedValue
addedValue
added
PE 0.869*** 1.140***
(0.239) (0.269)
PE Low 0.875*** 0.982*** 0.943*** 0.906***
(0.241) (0.285) (0.280) (0.324)
PE High 0.862*** 1.278*** 1.395*** 1.710***
(0.287) (0.363) (0.320) (0.393)
PE Q1 0.542** 0.775** 0.633** 0.647*
(0.267) (0.308) (0.299) (0.332)
PE Q2 1.210*** 1.187*** 1.251*** 1.148***
(0.282) (0.328) (0.343) (0.395)
PE Q3 1.039*** 1.298*** 1.437*** 1.619***
(0.304) (0.369) (0.343) (0.403)
PE Q4 0.736** 1.324*** 1.414*** 1.912***
(0.339) (0.436) (0.389) (0.483)
Industry FE Yes Yes No Yes No Yes Yes No Yes No
Country FE Yes Yes No Yes No Yes Yes No Yes No
Co-Ind FE No No Yes No Yes No No Yes No Yes
PEL = PEH 0.952 0.284 0.048** 0.418 0.079* 0.012** 0.057* 0.031**
Observations 6,976 6,976 6,976 6,976 6,976 7,013 7,013 7,013 7,013 7,013
R-squared 0.176 0.176 0.271 0.177 0.271 0.130 0.130 0.199 0.130 0.199
16 The Global Economic Impact of Private Equity Report 2010Private Equity, Industry Performance and Cyclicality
Table 8: PE activity and growth rate of employment The table contains OLS regression coefficients. An observation is a country-industry-year pair. The endogenous variable is the deviation of the annual growth rate of labor costs or total employment (as defined by OECD) relative to the average rate in the same industry and year. The exogenous variables are an indicator for positive PE activity over the previous five years at the country-industry level (PE), indicators for whether the measured PE activity is below or above the median activity level (PE Low and PE High), and indicators for quartiles. The omitted base category is no PE activity over the previous five years. The regressions contain industry, country and country-industry (Co-Ind) fixed effects as indicated. Standard errors are calculated with clustering at the country-year level and presented in parenthesis. PEL = PEH contains the significance level of a Wald test of equality of the PE Low and PE High coefficients or the quartile coefficients. Statistical significance at the 1%, 5% and 10% levels are indicated by ***, ** and *, respectively.
(1) (2) (3) (4) (5) (6) (7) (8) (9) (10)
Labour costs (compensa-
tion of employees)
Labour costs (compensa-
tion of employees)
Labour costs (compensa-
tion of employees)
Labour costs (compensa-
tion of employees)
Labour costs (compensa-
tion of employees)
Number of persons
engaged
Number of persons
engaged
Number of persons
engaged
Number of persons
engaged
Number of persons
engaged
PE 0.684*** 0.587***
(0.253) (0.161)
PE Low 0.540** 0.587* 0.710*** 0.840***
(0.262) (0.320) (0.158) (0.197)
PE High 0.887*** 1.203*** 0.422** 0.646**
(0.281) (0.370) (0.195) (0.258)
PE Q1 0.071 0.112 0.549*** 0.679***
(0.290) (0.346) (0.167) (0.216)
PE Q2 1.017*** 1.054*** 0.876*** 1.018***
(0.286) (0.347) (0.184) (0.215)
PE Q3 0.907*** 1.185*** 0.661*** 0.906***
(0.294) (0.379) (0.207) (0.258)
PE Q4 0.984*** 1.410*** 0.194 0.368
(0.310) (0.411) (0.218) (0.296)
Industry FE Yes Yes No Yes No Yes Yes No Yes No
Country FE Yes Yes No Yes No Yes Yes No Yes No
Co-Ind FE No No Yes No Yes No No Yes No Yes
PEL = PEH 0.075* 0.010** 0.001*** 0.002*** 0.039** 0.272 0.001*** 0.002***
Observations 6,743 6,743 6,743 6,743 6,743 6,768 6,768 6,768 6,768 6,768
R-squared 0.225 0.225 0.304 0.227 0.305 0.052 0.052 0.173 0.053 0.174
17The Global Economic Impact of Private Equity Report 2010 Private Equity, Industry Performance and Cyclicality
Table 9: Twice-lagged PE activity and growth rate of employmentThe table contains OLS regression coefficients. An observation is a country-industry-year pair. The endogenous variable is the deviation of the annual growth rate of labor costs or total employment (as defined by OECD) relative to the average rate in the same industry and year. The exogenous variables are an indicator for positive PE activity over the previous four years -2 to -5, ie not including the year previous to the year where the growth in the endogenous variable is measured (PE), indicators for whether the measured PE activity is below or above the median activity level (PE Low and PE High), and indicators for quartiles. The omitted base category is no PE activity. The regressions contain industry, country and country-industry (Co-Ind) fixed effects as indicated. Standard errors are calculated with clustering at the country-year level and presented in parenthesis. PEL = PEH contains the significance level of a Wald test of equality of the PE Low and PE High coefficients or the quartile coefficients. Statistical significance at the 1%, 5% and 10% levels are indicated by ***, ** and *, respectively.
(1) (2) (3) (4) (5) (6) (7) (8) (9) (10)
Labour costs (compensa-
tion of employees)
Labour costs (compensa-
tion of employees)
Labour costs (compensa-
tion of employees)
Labour costs (compensa-
tion of employees)
Labour costs (compensa-
tion of employees)
Number of employees
Number of employees
Number of employees
Number of employees
Number of employees
PE 0.594** 0.528***
(0.239) (0.171)
PE Low 0.426* 0.423 0.677*** 0.743***
(0.245) (0.292) (0.169) (0.205)
PE High 0.824*** 1.085*** 0.318 0.495*
(0.273) (0.345) (0.215) (0.283)
PE Q1 -0.023 -0.052 0.574*** 0.690***
(0.275) (0.314) (0.181) (0.209)
PE Q2 0.879*** 0.898*** 0.799*** 0.842***
(0.268) (0.325) (0.200) (0.244)
PE Q3 0.947*** 1.155*** 0.789*** 0.964***
(0.295) (0.358) (0.226) (0.280)
PE Q4 0.786** 1.167*** -0.189 -0.087
(0.306) (0.398) (0.251) (0.335)
Industry FE Yes Yes No Yes No Yes Yes No Yes No
Country FE Yes Yes No Yes No Yes Yes No Yes No
Co-Ind FE No No Yes No Yes No No Yes No Yes
PEL = PEH 0.040** 0.003*** 0.001*** 0.001*** 0.033** 0.207 0.000*** 0.000***
Observations 6,743 6,743 6,743 6,743 6,743 5,771 5,771 5,771 5,771 5,771
R-squared 0.225 0.225 0.304 0.226 0.305 0.067 0.068 0.195 0.070 0.198
18 The Global Economic Impact of Private Equity Report 2010Private Equity, Industry Performance and Cyclicality
Table 10: PE activity and growth rate of capital formationThe table contains OLS regression coefficients. An observation is a country-industry-year pair. The endogenous variable is the deviation of the annual growth rate of gross fixed capital formation or consumption of fixed capital (as defined by OECD) relative to the average rate in the same industry and year. The exogenous variables are an indicator for positive PE activity over the previous four years -2 to -5, ie not including the year previous to the year where the growth in the endogenous variable is measured (PE), indicators for whether the measured PE activity is below or above the median activity level (PE Low and PE High), and indicators for quartiles. The omitted base category is no PE activity. The regressions contain industry, country and country-industry (Co-Ind) fixed effects as indicated. Standard errors are calculated with clustering at the country-year level and presented in parenthesis. PEL = PEH contains the significance level of a Wald test of equality of the PE Low and PE High coefficients or the quartile coefficients. Statistical significance at the 1%, 5% and 10% levels are indicated by ***, ** and *, respectively.
(1) (2) (3) (4) (5) (6) (7) (8) (9) (10)
Gross fixed capital
formation
Gross fixed capital
formation
Gross fixed capital
formation
Gross fixed capital
formation
Gross fixed capital
formation
Consum-ption of
fixed capital
Consum-ption of
fixed capital
Consum-ption of
fixed capital
Consum-ption of
fixed capital
Consum-ption of
fixed capital
PE -0.890 0.106
(1.881) (0.291)
PE Low -0.697 -1.145 -0.113 0.092
(1.601) (1.352) (0.316) (0.362)
PE High -1.145 -0.372 0.366 0.401
(2.412) (1.501) (0.332) (0.375)
PE Q1 0.123 0.240 -0.567 -0.474
(1.401) (1.283) (0.357) (0.380)
PE Q2 -1.458 -2.307 0.347 0.641
(2.038) (1.719) (0.371) (0.438)
PE Q3 -0.803 0.192 0.196 0.141
(2.458) (1.626) (0.454) (0.489)
PE Q4 -1.691 -1.543 0.615** 0.841**
(2.628) (1.807) (0.312) (0.368)
Industry FE Yes Yes No Yes No Yes Yes No Yes No
Country FE Yes Yes No Yes No Yes Yes No Yes No
Co-Ind FE No No Yes No Yes No No Yes No Yes
PEL = PEH 0.733 0.533 0.694 0.226 0.096* 0.360 0.007*** 0.004***
Observations 6,074 6,074 6,074 6,074 6,074 4,712 4,712 4,712 4,712 4,712
R-squared 0.004 0.004 0.054 0.004 0.054 0.115 0.116 0.192 0.116 0.192
19The Global Economic Impact of Private Equity Report 2010 Private Equity, Industry Performance and Cyclicality
Table 11: PE activity and productivity cycles The table contains OLS regression coefficients. An observation is the annual growth rate of the indicated productivity measure (subtracting its average growth rate across countries) at the country-industry-year level. The exogenous variable PE x Avg growth contains the interaction between PE and the average growth rate of the endogenous variable, averaged over countries. PE is an indicator for positive PE activity in the country-industry during the previous five years. The variables PE Low x Avg growth and PE High x Avg growth are constructed similarly, where PE Low and PE High are indicators for below or above median PE activity. The regressions contain industry, country, and country-industry (Co-Ind FE) fixed effects as indicated. Standard errors are calculated with clustering at the country-year level and presented in parenthesis. PAL = PAH contains the significance level of a Wald test of equality of the PE Low x Avg growth and PE High x Avg growth coefficients. Statistical significance at the 1%, 5% and 10% levels are indicated by ***, ** and *, respectively.
(1) (2) (3) (4) (5) (6)
Production (gross output)
Production (gross output)
Production (gross output) Value added Value added Value added
PE x Avg growth -0.085** -0.102*
(0.042) (0.058)
PE Low x Avg growth -0.124** -0.085 -0.159* -0.112
(0.057) (0.060) (0.088) (0.095)
PE High x Avg growth -0.051 -0.021 -0.036 -0.013
(0.042) (0.045) (0.061) (0.065)
PE 1.357*** 1.678***
(0.311) (0.390)
PE Low 1.641*** 1.517*** 1.870*** 1.568**
(0.374) (0.425) (0.539) (0.612)
PE High 1.123*** 1.365*** 1.549*** 1.732***
(0.350) (0.422) (0.451) (0.523)
Industry FE Yes Yes No Yes Yes No
Country FE Yes Yes No Yes Yes No
Co x Ind FE No No Yes No No Yes
PAL = PAH 0.167 0.254 0.200 0.338
Observations 6,976 6,976 6,976 7,013 7,013 7,013
R-squared 0.177 0.178 0.271 0.131 0.131 0.199
20 The Global Economic Impact of Private Equity Report 2010Private Equity, Industry Performance and Cyclicality
Table 12: PE activity and productivity cycles The table contains OLS regression coefficients. An observation is the annual growth rate of the indicated employment measure (subtracting its average growth rate across countries) at the country-industry-year level. The exogenous variables PE x Avg growth contains the interaction between PE and the average growth rate of the endogenous variable, averaged over countries. PE is an indicator for positive PE activity in the country-industry during the previous five years. The variables PE Low x Avg growth and PE High x Avg growth are constructed similarly, where PE Low and PE High are indicators for below or above median PE activity. The regressions contain industry, country, and country-industry (Co-Ind FE) fixed effects as indicated. Standard errors are calculated with clustering at the country-year level and presented in parenthesis. PAL = PAH contains the significance level of a Wald test of equality of the PE Low x Avg growth and PE High x Avg growth coefficients. Statistical significance at the 1%, 5% and 10% levels are indicated by ***, ** and *, respectively.
(1) (2) (3) (4) (5) (6)
Labour costs (compensation of employees)
Labour costs (compensation of employees)
Labour costs (compensation of employees)
Number of employees
Number of employees
Number of employees
PE x Avg growth -0.203*** -0.098**
(0.041) (0.045)
PE Low x Avg growth -0.277*** -0.229*** -0.172*** -0.114**
(0.049) (0.055) (0.050) (0.054)
PE High x Avg growth -0.112** -0.111* -0.039 -0.036
(0.050) (0.059) (0.055) (0.063)
PE 1.591*** 0.538***
(0.306) (0.171)
PE Low 1.910*** 1.657*** 0.750*** 0.792***
(0.361) (0.415) (0.173) (0.206)
PE High 1.295*** 1.517*** 0.324 0.493*
(0.345) (0.431) (0.215) (0.282)
Industry FE Yes Yes No Yes Yes No
Country FE Yes Yes No Yes Yes No
Co x Ind FE No No Yes No No Yes
PAL = PAH 0.004*** 0.080* 0.016** 0.213
Observations 6,743 6,743 6,743 5,771 5,771 5,771
R-squared 0.228 0.228 0.306 0.068 0.069 0.196
21The Global Economic Impact of Private Equity Report 2010 Private Equity, Industry Performance and Cyclicality
Table 13: International PE activity and productivityThe table contains OLS regression coefficients. An observation is the annual growth rate of the indicated productivity measure (subtracting its average growth rate across countries) at the country-industry-year level, separating US/UK and Continental European countries. The exogenous variables are an indicator for positive PE activity over the previous five years at the country-industry level (PE), and indicators for whether the measured PE activity is below or above the median activity level (PE Low and PE High). The omitted base category is no PE activity over the previous five years. The regressions contain industry and country fixed effects as indicated. Standard errors are robust and presented in parenthesis and PEL = PEH contains the significance level of a t-test of equality of the PE Low and PE High coefficients. PEUS = PECON contains the significance level of a test for equality of the coefficients PE for US/UK and PE for Continental Europe. Statistical significance at the 1%, 5% and 10% levels are indicated by ***, ** and *, respectively.
(1) (2) (3) (4) (5) (6) (7) (8)
Production (gross
output)
Production (gross
output)
Production (gross
output)
Production (gross
output)Value
addedValue
addedValue
addedValue
added
US/UK US/UK CON CON US/UK US/UK CON CON
PE -0.299 0.878*** 0.289 1.225***
(1.001) (0.187) (1.430) (0.231)
PE Low -0.535 0.893*** -0.208 0.951***
(1.006) (0.213) (1.444) (0.260)
PE High 0.050 0.861*** 1.024 1.526***
(1.069) (0.227) (1.499) (0.293)
Industry FE Yes Yes Yes Yes Yes Yes Yes Yes
Country FE Yes Yes Yes Yes Yes Yes Yes Yes
PEL = PEH 0.257 0.892 0.049** 0.057*
PEUS= PECON 0.245 0.245 0.473 0.473
Observations 660 660 5,037 5,037 660 660 5,074 5,074
R-squared 0.141 0.143 0.175 0.175 0.101 0.107 0.135 0.135
22 The Global Economic Impact of Private Equity Report 2010Private Equity, Industry Performance and Cyclicality
Table 14: International PE activity and employment The table contains OLS regression coefficients. An observation is the annual growth rate of the indicated employment measure (subtracting its average growth rate across countries) at the country-industry-year level, separating US/UK and Continental European countries. The exogenous variables are an indicator for positive PE activity over the previous five years at the country-industry level (PE), and indicators for whether the measured PE activity is below or above the median activity level (PE Low and PE High). The omitted base category is no PE activity over the previous five years. The regressions contain industry and country fixed effects as indicated. Standard errors are robust and presented in parenthesis and PEL = PEH contains the significance level of a Wald test of equality of the PE Low and PE High coefficients. PEUS = PECON contains the significance level of a t-test of equality of the coefficients PE for US/UK and PE for Continental Europe. Statistical significance at the 1%, 5%, and 10% levels are indicated by ***, ** and **, respectively.
(1) (2) (3) (4) (5) (6) (7) (8)
Labour costs (compen- sation of
employees)
Labour costs (compen- sation of
employees)
Labour costs (compen- sation of
employees)
Labour costs (compen- sation of
employees)Number of employees
Number of employees
Number of employees
Number of employees
US/UK US/UK CON CON US/UK US/UK CON CON
PE -0.237 0.639*** 1.736** 0.400***
(1.258) (0.156) (0.768) (0.127)
PE Low -0.295 0.408** 1.965** 0.554***
(1.239) (0.183) (0.800) (0.140)
PE High -0.150 0.906*** 1.396* 0.213
(1.332) (0.186) (0.774) (0.160)
Industry FE Yes Yes Yes Yes Yes Yes Yes Yes
Country FE Yes Yes Yes Yes Yes Yes Yes Yes
PEL = PEH 0.734 0.010** 0.108 0.033**
PEUS= PECON 0.372 0.372 0.131 0.131
Observations 660 660 4,804 4,804 660 660 4,245 4,245
R-squared 0.058 0.058 0.266 0.267 0.144 0.148 0.082 0.082

23The Global Economic Impact of Private Equity Report 2010 Private Equity, Industry Performance and Cyclicality

The Global Economic Impact of Private Equity Report 201024 Private Equity, Industry Performance and Cyclicality