globalization, diversity and higher education anantha s. babbili college of mass communication...
TRANSCRIPT

Globalization, Diversity Globalization, Diversity and and
Higher EducationHigher Education
Anantha S. Babbili
College of Mass Communication
SHOWCASE SERIES
Learning, Teaching & Innovative Technologies Center
Middle Tennessee State University
February 22, 2007

What we will do in this sessionWhat we will do in this session
Intended to be engaging & interactiveIntended to be engaging & interactive Examine boundaries of GlobalizationExamine boundaries of Globalization Analyze changing realities in Analyze changing realities in
American Diversity American Diversity Probe prospects for cultural competence in:Probe prospects for cultural competence in:
LearningLearningTeaching Teaching Innovative uses of technologyInnovative uses of technology

Globalization:Globalization:Contents & DiscontentsContents & Discontents
The World The World OutsideOutside & Pictures & Pictures
in our Headsin our Heads
The World The World InsideInside & Pictures & Pictures
in our Headsin our Heads

GlobalizationGlobalization
Elusive DefinitionsElusive Definitions
Multi-layered PhenomenaMulti-layered Phenomena
OppositionalOppositional Views ofViews of
HistoryHistory
IdeologiesIdeologies
EconomicsEconomics
Cultural ImaginationCultural Imagination

Snapshot History of Snapshot History of Globalization Globalization
Philosophical/Theological StudyPhilosophical/Theological Study
Expansionist RegimesExpansionist Regimes
Manifest doctrinesManifest doctrines
Trade and MarketsTrade and Markets
Loss of indigenous narrativesLoss of indigenous narratives

Globalization NowGlobalization Now
U.S. View of the WorldU.S. View of the World
TourismTourism
MissionaryMissionary
Business IntelligenceBusiness Intelligence
Ideological StrugglesIdeological Struggles
Scholarly IntelligenceScholarly Intelligence

Constructions of GlobalizationConstructions of Globalizationand the Flow of Informationand the Flow of Information
Representation Representation versusversus
Self-RepresentationSelf-Representation
Knowledge Knowledge
and and
New TechnologiesNew Technologies

Old Patterns & New Information Old Patterns & New Information TechnologyTechnology
Colonization and theColonization and theMonopoly of KnowledgeMonopoly of Knowledge
Centralization of PowerCentralization of Power
Orientalist Orientalist DiscoursesDiscourses
in Globalizationin Globalization

Diversity:Diversity:Stretching our ImaginationStretching our Imagination
Cultural meaning of “Diaspora” --Cultural meaning of “Diaspora” --
the new immigrants in the U.S.the new immigrants in the U.S.
Understand the “invisible diversity” --Understand the “invisible diversity” --
of ethnic groups within the U.S.of ethnic groups within the U.S.

Understanding Understanding DiversityDiversity
Total Hispanic population in the U.S. is 41.3 Total Hispanic population in the U.S. is 41.3 million (as of June 2005)million (as of June 2005)
28.4 million immigrants now live in the U.S. -- 28.4 million immigrants now live in the U.S. -- the largest number everthe largest number ever recorded recorded
in history.in history.

Understanding DiversityUnderstanding Diversity
Immigrants now comprise 12.8% of the Immigrants now comprise 12.8% of the nation’s workforcenation’s workforce
7 million unauthorized immigrants7 million unauthorized immigrants Politics closely linked to religious beliefsPolitics closely linked to religious beliefs Immigrant voters divided on issues like Immigrant voters divided on issues like
abortion, gay rights, gender roles and abortion, gay rights, gender roles and religion in public lifereligion in public life

Top ten counties in Tennessee Top ten counties in Tennessee with Hispanic population with Hispanic population
& Projections& Projections
CountyCounty 20002000 20052005 20102010
DavidsonDavidson 26,09126,091 37,79637,796 50,39750,397ShelbyShelby 23,36423,364 34,69634,696 46,59446,594MontgomeryMontgomery 6,9606,960 8,306 8,306 9,653 9,653HamiltonHamilton 5,481 5,481 6,706 6,706 7,621 7,621RutherfordRutherford 5,065 5,065 7,409 7,409 9,873 9,873KnoxKnox 4,803 4,803 6,191 6,191 7,5947,594HamblenHamblen 3,299 3,299 4,866 4,866 6,460 6,460WilliamsonWilliamson 3,197 3,197 4,601 4,601 6,0846,084BedfordBedford 2,811 2,811 4,418 4,418 6,1636,163SumnerSumner 2,291 2,291 3,321 3,321 4,448 4,448
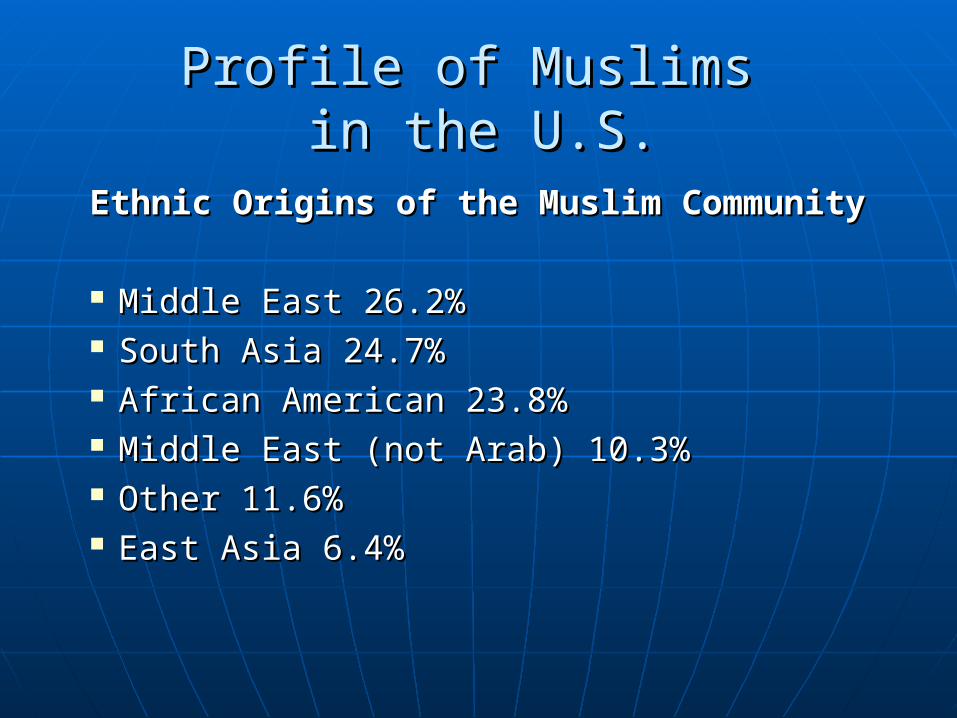
Profile of Muslims Profile of Muslims in the U.S.in the U.S.
Ethnic Origins of the Muslim CommunityEthnic Origins of the Muslim Community
Middle East 26.2%Middle East 26.2% South Asia 24.7%South Asia 24.7% African American 23.8%African American 23.8% Middle East (not Arab) 10.3%Middle East (not Arab) 10.3% Other 11.6%Other 11.6% East Asia 6.4%East Asia 6.4%

Profile of Muslims Profile of Muslims in the U.S.in the U.S.
Regional DistributionRegional Distribution
East Coast 32.2%East Coast 32.2% South 25.3%South 25.3% Central/Great Lakes Region 24.3%Central/Great Lakes Region 24.3% West 18.2%West 18.2%

Profile of Muslims in the U.S.Profile of Muslims in the U.S.
There are 1,209 mosques in U.S.There are 1,209 mosques in U.S. 3,000 informal places of prayer and 3,000 informal places of prayer and
congregation on Fridayscongregation on Fridays Mosques are the main social unit of Mosques are the main social unit of
Muslims.Muslims. Majority of mosques are run by doctors, Majority of mosques are run by doctors,
engineers and businessmen.engineers and businessmen. 1200 Muslims in custody today1200 Muslims in custody today

Profile of Muslims in the U.SProfile of Muslims in the U.S..
Vocations and IncomeVocations and Income
1/3 of the Muslims are in engineering and 1/3 of the Muslims are in engineering and medicine.medicine.
Average income for Muslims is higher than Average income for Muslims is higher than the U.S. national average.the U.S. national average.

Profile of Muslims in the U.S.Profile of Muslims in the U.S.
Political Party PreferencePolitical Party Preference
Democrats 46%Democrats 46%
Republican 15.8Republican 15.8
Independent 26.4%Independent 26.4%
Other (party) 11.9%Other (party) 11.9%

Profile of Muslims in the U.S.Profile of Muslims in the U.S.
80,000 of America’s Muslims are of 80,000 of America’s Muslims are of European origin.European origin.
10,000 Muslims serving in the U.S. 10,000 Muslims serving in the U.S. military. military.

Arab Americans in the U.S.Arab Americans in the U.S.
Ancestry groupAncestry group NumberNumber PercentagePercentage
LebaneseLebanese 408,851408,851 40.5%40.5%
SyrianSyrian 189,532189,532 18.8%18.8%
EgyptiansEgyptians 93,85493,854 9.3%9.3%
PalestiniansPalestinians 48,48048,480 4.8%4.8%
MoroccanMoroccan 31,56531,565 3.1%3.1%
IraqiIraqi 29,11529,115 2.9%2.9%
JordanianJordanian 23,42323,423 2.3%2.3%
All other ArabsAll other Arabs 185,537185,537 18.418.4

Arab American in the U.S.Arab American in the U.S.
Arab Americans now number more than 3 Arab Americans now number more than 3 million, Muslims roughly 6 million (though million, Muslims roughly 6 million (though estimates range from 3 million to 10 estimates range from 3 million to 10 million.)*million.)*
*Source: Shibley Telhami, *Source: Shibley Telhami, Brookings ReviewBrookings Review, Winter 2002, , Winter 2002,
v20 p14(2) “Arab and Muslim America: A Snap Shot.”v20 p14(2) “Arab and Muslim America: A Snap Shot.”

Diversity & the New AmericanDiversity & the New American
35.2 m New Americans-- the largest 35.2 m New Americans-- the largest number ever recorded in the U.S. historynumber ever recorded in the U.S. history
New Americans now 14.7% of the New Americans now 14.7% of the
U.S. populationU.S. population

Asian AmericansAsian AmericansPolitical profilePolitical profile
Registered Voters:Registered Voters:
Japanese 88.0%Japanese 88.0%
Filipino 85.8% Filipino 85.8%
Chinese 84.3% Chinese 84.3%
Asian Indians 82.5%Asian Indians 82.5%
Koreans 67.1%Koreans 67.1%

Political Inclinations of Political Inclinations of Asian AmericansAsian Americans
Asian AmericansAsian Americans DemocratsDemocrats RepublicanRepublican Ind.Ind.
Asian IndiansAsian Indians 52.5%52.5% 23.8%23.8% 20.0%20.0%ChineseChinese 26.95%26.95% 27.7%27.7% 27.7%27.7%FilipinoFilipino 35.8%35.8% 23.3%23.3% 22.5%22.5%JapaneseJapanese 35.0%35.0% 41.8%41.8%
19.0%19.0%KoreanKorean 30.0%30.0% 41.8%41.8% 19.0%19.0%

Total Population of Religious Total Population of Religious Ethnic Groups in the U.S.Ethnic Groups in the U.S.
AdherentAdherent Population Population % of total pop. % of total pop. (in numbers) (in numbers)
NonreligiousNonreligious 24.5 m 24.5 m 8.8%8.8%JewishJewish 5.5 m5.5 m 2.0%2.0%MuslimsMuslims 3.95 m3.95 m 1.4%1.4%BuddhistsBuddhists 2.0 m2.0 m 0.7%0.7%African American MuslimsAfrican American Muslims 1.65 m1.65 m 0.6%0.6%HindusHindus 1.1 m1.1 m 0.3%0.3%AtheistsAtheists 1.3 m1.3 m 0.3%0.3%Baha`isBaha`is 750,000*750,000* 0.3% 0.3%New ReligionistsNew Religionists 95,968*95,968* 0.2%0.2%Tribal ReligionistsTribal Religionists 350,000350,000 0.1%0.1%SikhsSikhs 220,000220,000 0.1%0.1%Chinese Folk Chinese Folk 70,000 70,000 0.0%0.0%Other ReligionistsOther Religionists 1.11 m1.11 m 0.4%0.4%
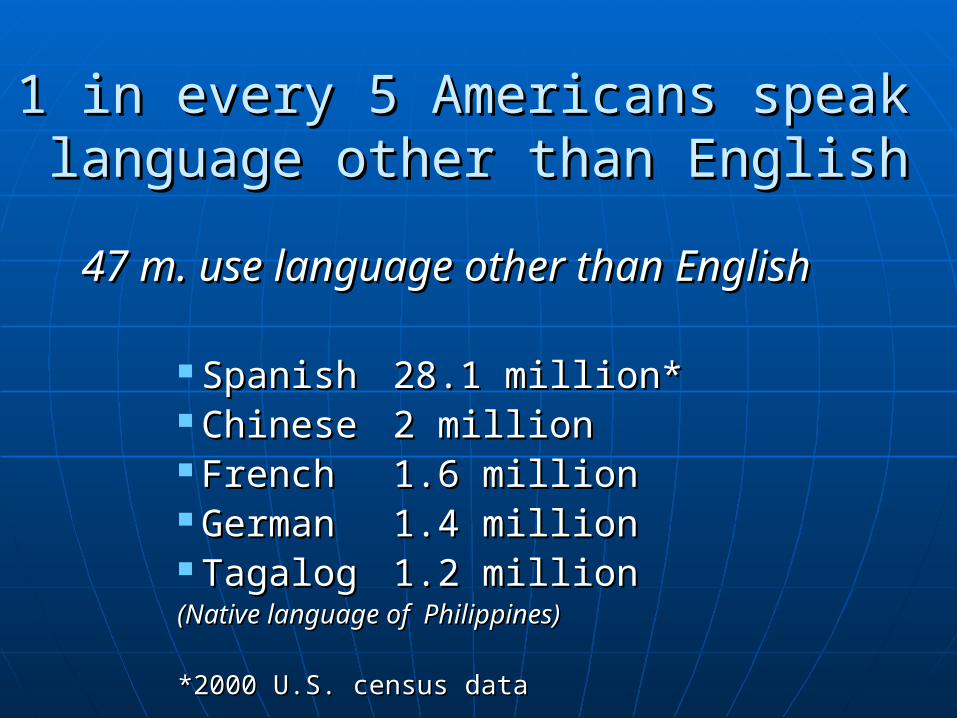
1 in every 5 Americans speak 1 in every 5 Americans speak language other than Englishlanguage other than English
47 m. use language other than English47 m. use language other than English
SpanishSpanish 28.1 million*28.1 million* ChineseChinese 2 million2 million FrenchFrench 1.6 million1.6 million GermanGerman 1.4 million1.4 million TagalogTagalog 1.2 million1.2 million(Native language of Philippines)(Native language of Philippines)
*2000 U.S. census data*2000 U.S. census data

Tennessee as a Case Study: Tennessee as a Case Study: Top home countries of Top home countries of foreign-born populationforeign-born population
MexicoMexico GermanyGermany IndiaIndia CanadaCanada United KingdomUnited Kingdom China/Hong Kong/Taiwan China/Hong Kong/Taiwan
Source:Source:The Tennessean The Tennessean


Information Literacy &Information Literacy &Higher Education?Higher Education?
Critical Thinking Skills (to judge content)Critical Thinking Skills (to judge content) Understanding how Information comes to beUnderstanding how Information comes to be Knowledge of IT consequences/impactKnowledge of IT consequences/impact Strategies to analyze messagesStrategies to analyze messages Messages as cultural “texts”Messages as cultural “texts” Becoming aware of the global/local intersectionsBecoming aware of the global/local intersections Technological fluencyTechnological fluency

Cultural Competence & Cultural Competence & Information TechnologyInformation Technology
Three Spheres of Information Three Spheres of Information LiteracyLiteracy
1. Information Retrieval/1. Information Retrieval/Gathering & StorageGathering & Storage
2. Information Processing2. Information Processing
3. Information Dissemination3. Information Dissemination

IT Pedagogical ToolsIT Pedagogical Toolsfor Cultural Learning & Instructionfor Cultural Learning & Instruction
Global EmailingGlobal EmailingInstant MessagingInstant Messaging
Skype (Voice)Skype (Voice)Video ConferencingVideo ConferencingVirtual Field TripsVirtual Field Trips
Augmented /Virtual RealitiesAugmented /Virtual RealitiesDigital Games for Foreign Language Digital Games for Foreign Language
AcquisitionAcquisition