globalization and urban environmental change in the asia ... · global urbanization, internal...
TRANSCRIPT

UN DESA International workshop onGlobal urbanization, internal migration, population distribution and development
21-23 January 2008
Globalization and urban environmental change in the Asia Pacific RegionPeter J. MarcotullioHunter College, CUNYUnited Nations University
Outline of talk
• Background – Socio-ecological systems (SESs) and urban
development– Globalization and urban development
• Selected evidence of unique urban SES relationships in the Asia Pacific region
• Conclusions

Background

Socio-ecological systems
• Socio-ecological systems are composed of coupled “human” or “social” spheres and “environmental” or “ecological” spheres (SES). AKA as “coupled human and natural systems (CHANS)”
• Activities and changes in one sphere are dependent upon and interact with elements and processes in the other
• One way to make these linkages is through the concept of “ecosystem services”
Socio-ecological system change over time
• The social or human sphere has dramatically changed over the past 150 years in terms of absolute size and intensity of activities as well as in relative size and interaction with the ecological sphere;
• The implication is that the social sphere has grown and has increasingly linked (in more, deeper and more complex ways) to the environmental or ecological sphere;
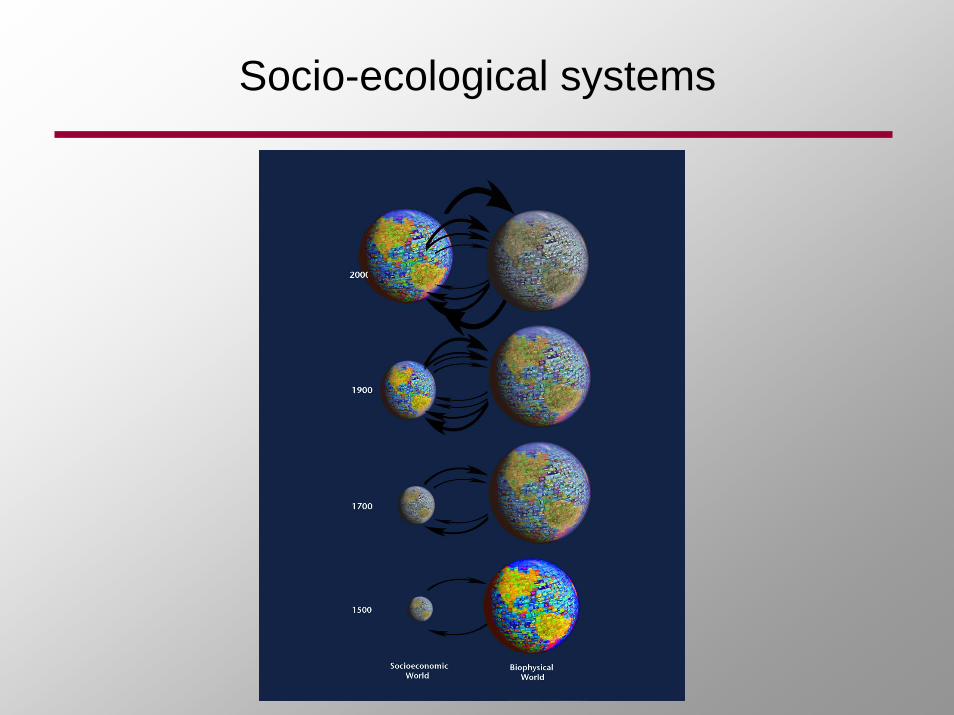
Socio-ecological systems

Globalization
• Globalization is defined as:
“…the widening, deepening and speeding up of worldwide interconnectedness in all aspects of contemporary social life, from the cultural to the criminal, the financial to the spiritual” (Held, et al, 1999)
• Globalization is not a single variable but a complex set of phenomena, captured in a large number of different variables

Globalization
• Previously indicators of the widening and deepening focused on, inter alia, the increasing number of multi-lateral and bi-lateral agreements and levels of trade, the increasing number of countries receiving Foreign Direct Investments (FDI) and other forms of capital and quantity of inflows and stocks, international travel, immigration sources and destinations, etc
Globalization
• Emphasis on socio-ecological development includes additional indicators such as increasing number and size of impacted ecosystems, spread of diseases, movements and concentrations of toxics, air pollutants, energy supplies, invasive species, etc;
Globalization
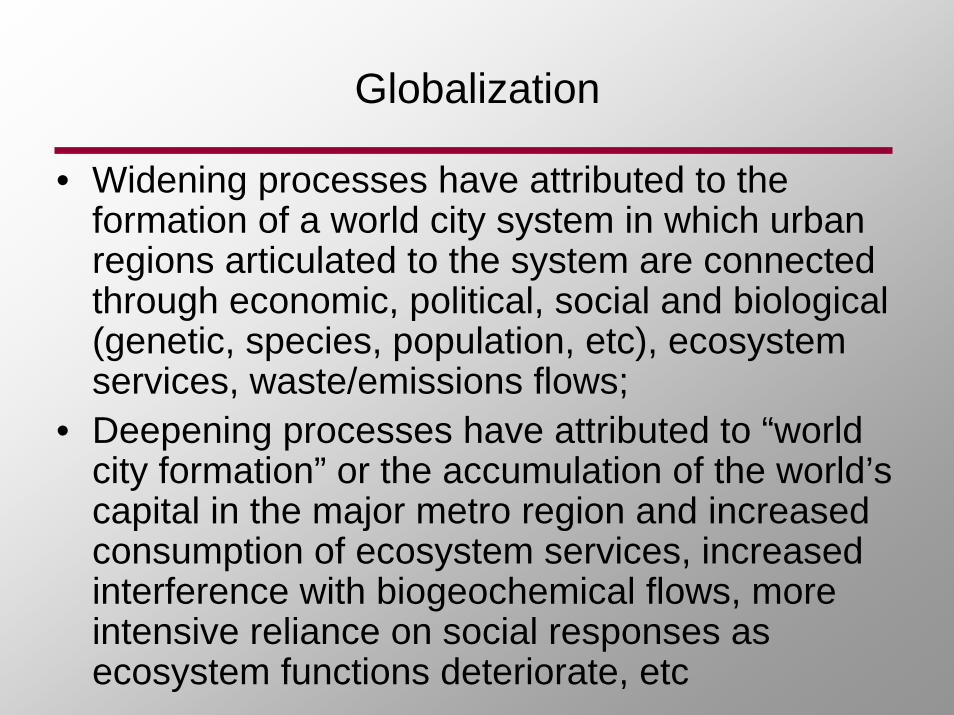
• Widening processes have attributed to the formation of a world city system in which urban regions articulated to the system are connected through economic, political, social and biological(genetic, species, population, etc), ecosystemservices, waste/emissions flows;
• Deepening processes have attributed to “world city formation” or the accumulation of the world’s capital in the major metro region and increased consumption of ecosystem services, increased interference with biogeochemical flows, more intensive reliance on social responses as ecosystem functions deteriorate, etc

Globalization
• The speeding up of interconnections have been facilitated by advanced technologies in telecommunications and transport and indicators of increasing speed include, for example, in the speed of transactions (and the lower relative costs of communications and people and goods movement)
• Increasing rates of change can also beenobserved in the socio-ecological systems, which are changing faster than previously experienced

Globalization
• Moreover, changing speeds and timing also influences the patterning of “environmental transitions” (McGranahan et al, 2001). In the past the transition from one set of environmental conditions to another took a longer period of time than it does today and occurred in a more simultaneous fashion.
• Given current patterns experienced by rapidly developing world cities, relationships that define the structure of urban environmental transition may no longer exit;
Selected evidence of unique urban SES relationships in the Asia Pacific region
associated with globalization
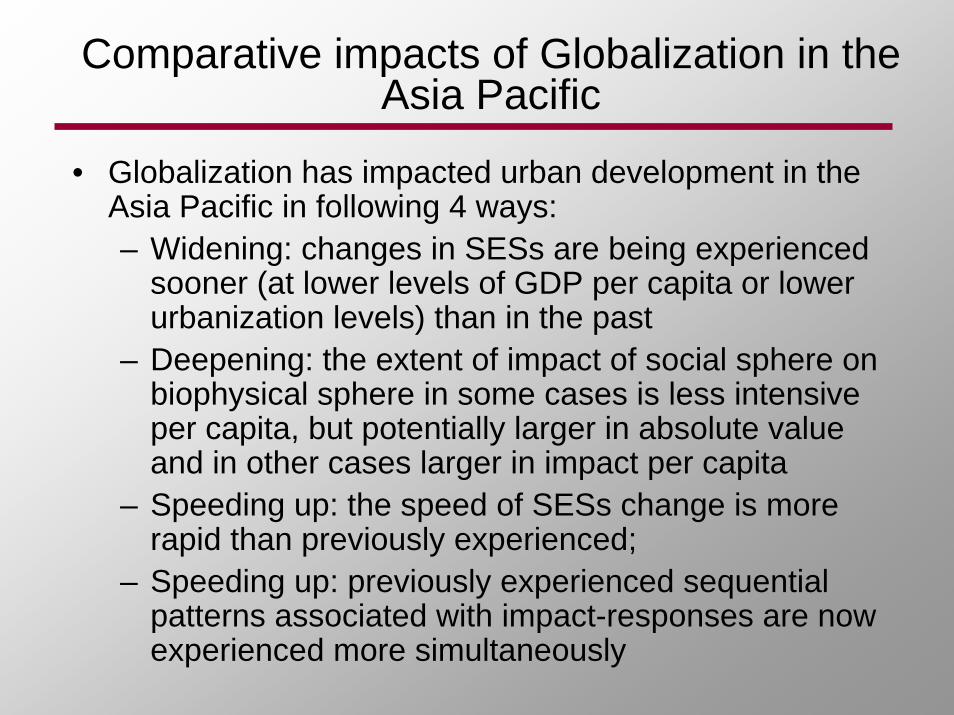
Comparative impacts of Globalization in the Asia Pacific
• Globalization has impacted urban development in the Asia Pacific in following 4 ways:– Widening: changes in SESs are being experienced
sooner (at lower levels of GDP per capita or lower urbanization levels) than in the past
– Deepening: the extent of impact of social sphere on biophysical sphere in some cases is less intensive per capita, but potentially larger in absolute value and in other cases larger in impact per capita
– Speeding up: the speed of SESs change is more rapid than previously experienced;
– Speeding up: previously experienced sequential patterns associated with impact-responses are now experienced more simultaneously

Comparative widening
• Some changes within urban regions of the Asia Pacific are being experienced at lower economic or urbanization levels than in the past– Major development patterns, such as
urbanization, are occurring at lower levels of income
– Technologies are diffusing at lower levels of income
– Ecological degradation, such as transportation CO2 emissions, is occurring at lower levels of income
– Shifts in energy sources are occurring at lower levels of urbanization

Comparative changes in urbanization levels: USA and selected Asian economies
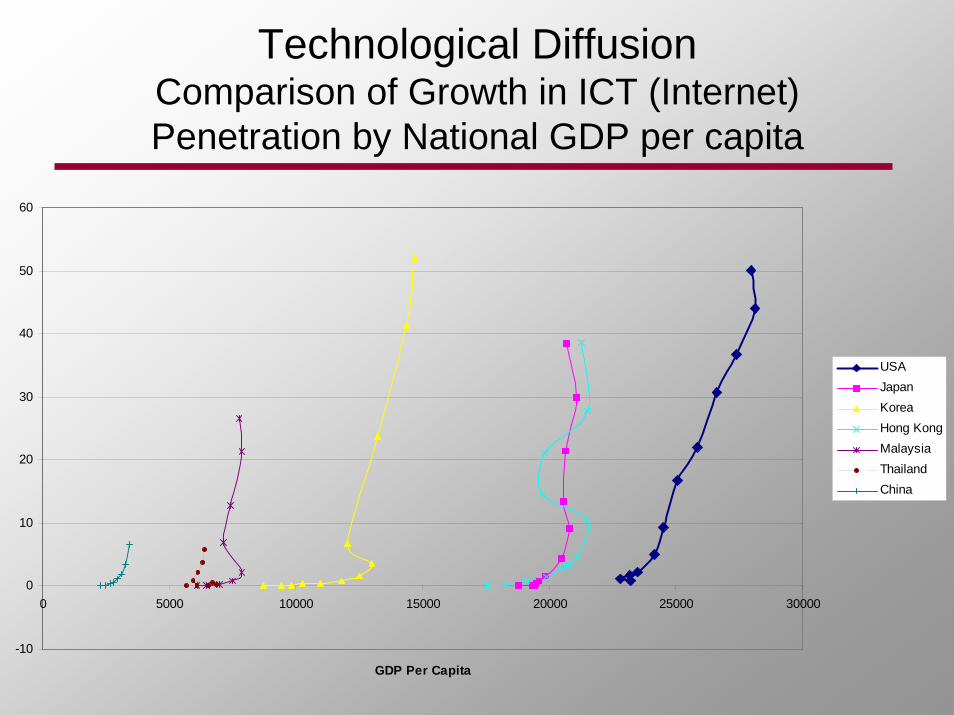
Technological DiffusionComparison of Growth in ICT (Internet) Penetration by National GDP per capita
-10
0
10
20
30
40
50
60
0 5000 10000 15000 20000 25000 30000
GDP Per Capita
USAJapanKoreaHong KongMalaysiaThailandChina

Total transportation CO2 emissions (kg) per capita per GDP per capita
0
500
1000
1500
2000
2500
3000
0 2000 4000 6000 8000
GDP per capita
CO
2 em
issi
ons
(kg)
pe
r cap
ita
ASEAN-4 Least Developed AsianAsian Tigers Latin AmericanNorthern AfricanJapanEuropeanCentral and Eastern European USA
Comparative emergence of transportation CO2 emissions

Share of Coal in TFC by Urbanization level
-
10
20
30
40
50
60
70
80
90
0 10 20 30 40 50 60 70 80 90Urbanization level
USAJapanPhilippinesPeople's Republic of ChinaKoreaMalaysiaIndonesiaThailand
Comparative deepening
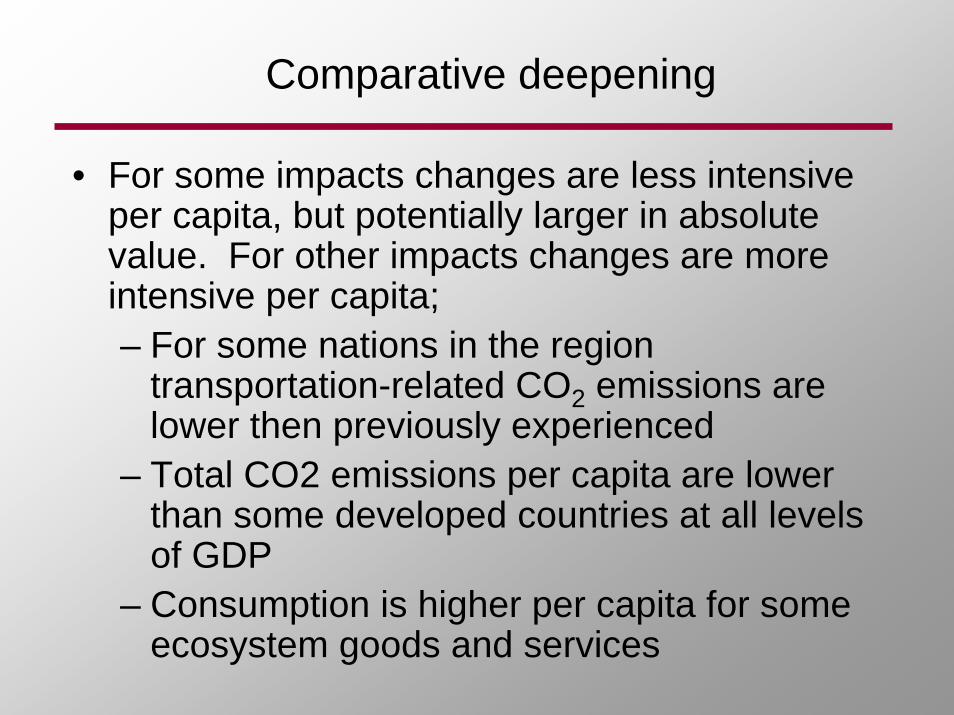
• For some impacts changes are less intensive per capita, but potentially larger in absolute value. For other impacts changes are more intensive per capita; – For some nations in the region
transportation-related CO2 emissions are lower then previously experienced
– Total CO2 emissions per capita are lower than some developed countries at all levels of GDP
– Consumption is higher per capita for some ecosystem goods and services
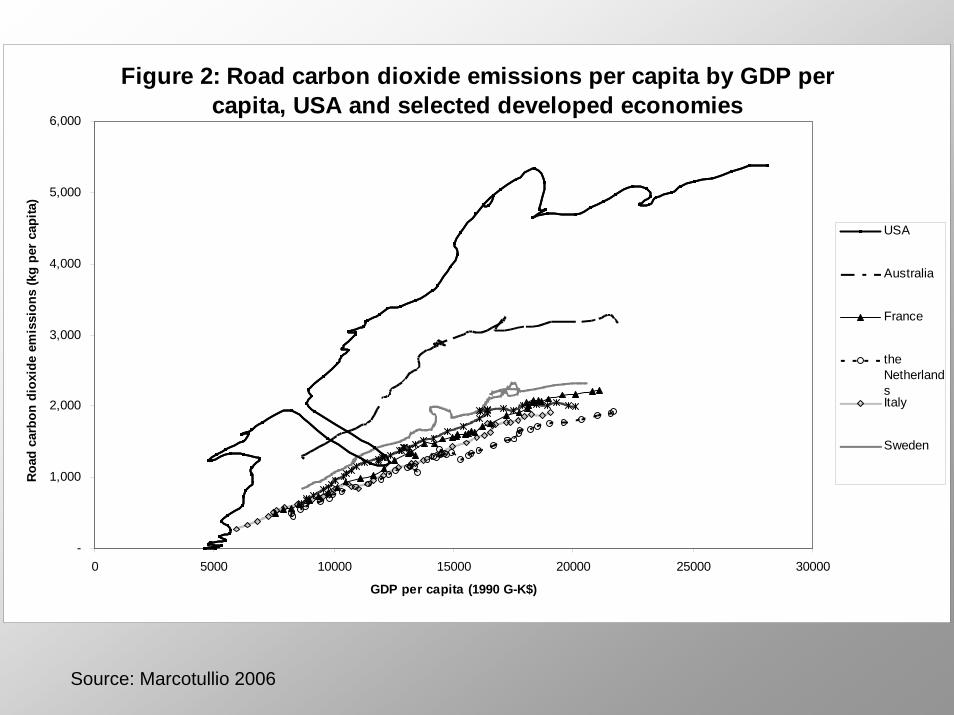
Figure 2: Road carbon dioxide emissions per capita by GDP per capita, USA and selected developed economies
-
1,000
2,000
3,000
4,000
5,000
6,000
0 5000 10000 15000 20000 25000 30000
GDP per capita (1990 G-K$)
Roa
d ca
rbon
dio
xide
em
issi
ons
(kg
per
capi
ta)
USA
Australia
France
theNetherlandsItaly
Sweden
Source: Marcotullio 2006
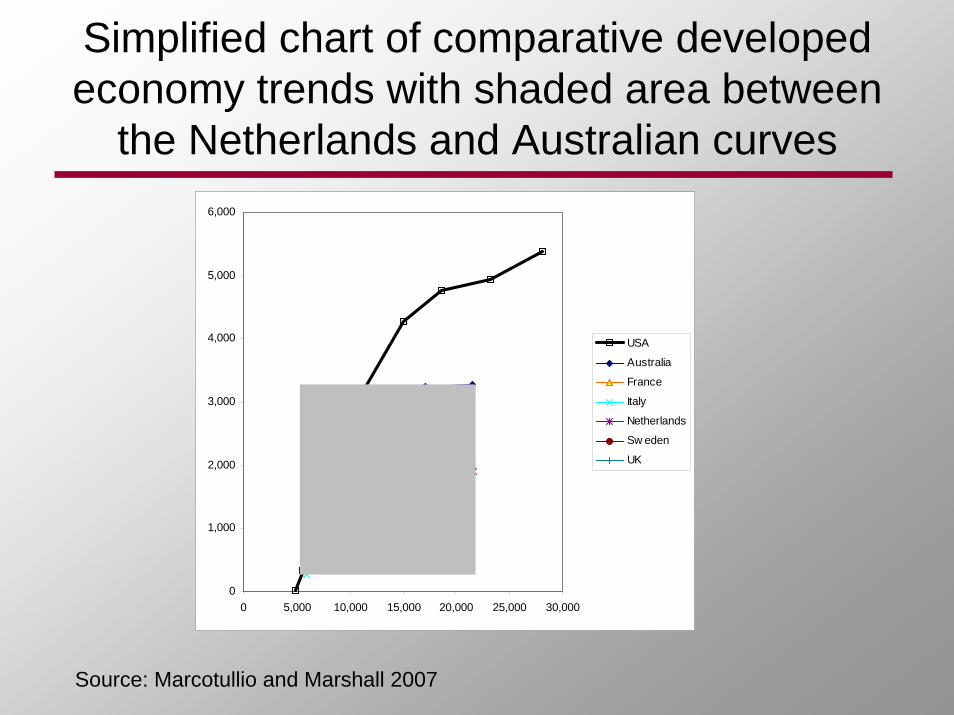
Simplified chart of comparative developed economy trends with shaded area between
the Netherlands and Australian curves
0
1,000
2,000
3,000
4,000
5,000
6,000
0 5,000 10,000 15,000 20,000 25,000 30,000
USA
Australia
France
Italy
Netherlands
Sw eden
UK
Source: Marcotullio and Marshall 2007
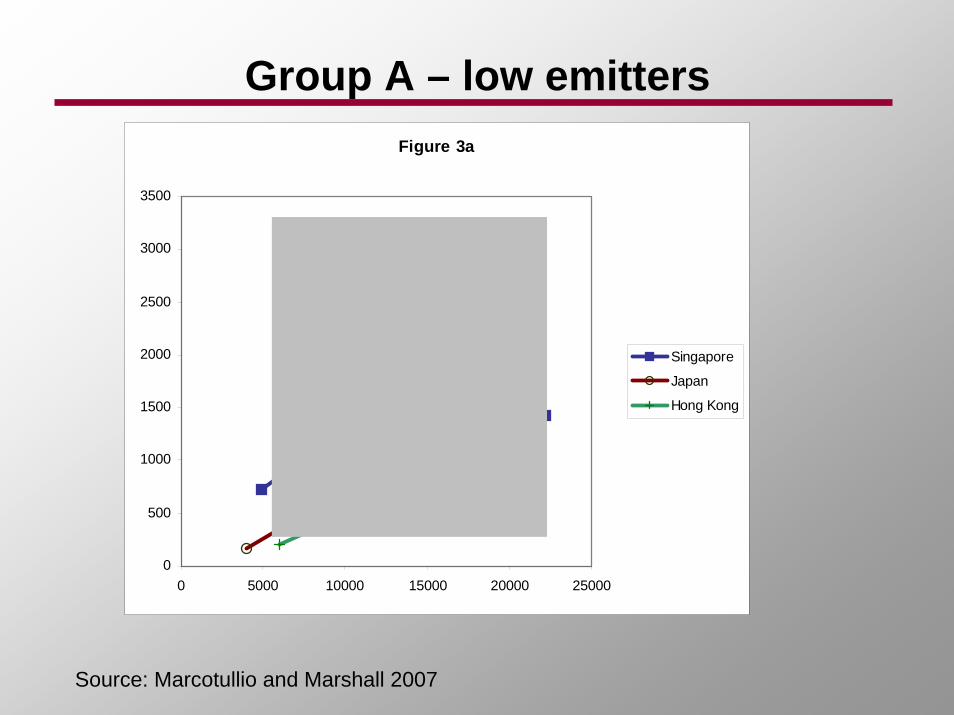
Group A – low emittersFigure 3a
0
500
1000
1500
2000
2500
3000
3500
0 5000 10000 15000 20000 25000
Singapore
Japan
Hong Kong
Source: Marcotullio and Marshall 2007
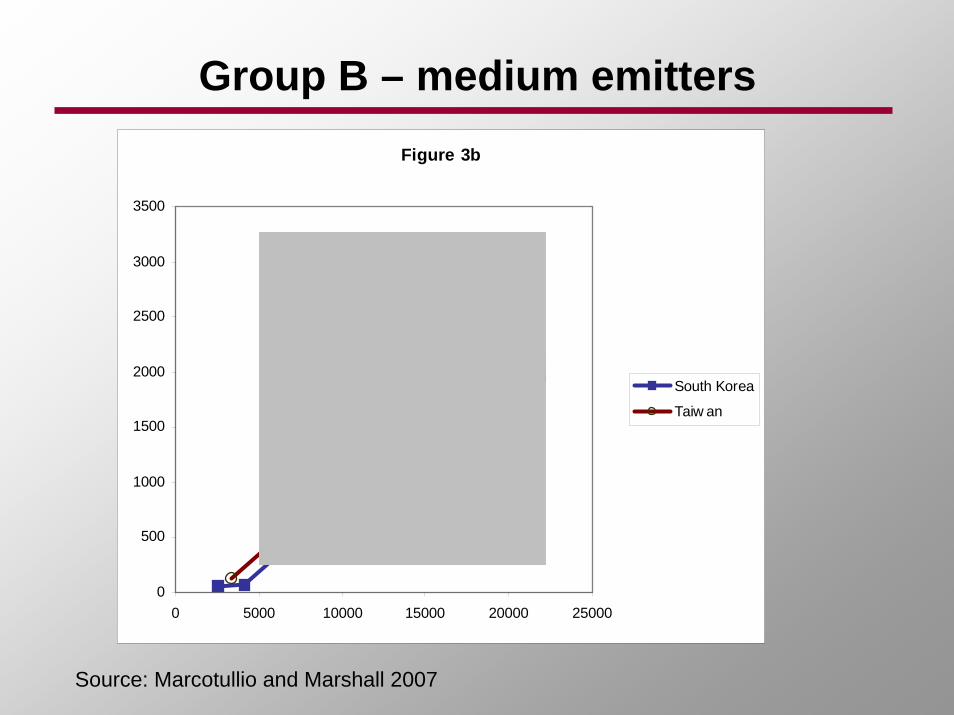
Figure 3b
0
500
1000
1500
2000
2500
3000
3500
0 5000 10000 15000 20000 25000
South Korea
Taiw an
Group B – medium emitters
Source: Marcotullio and Marshall 2007
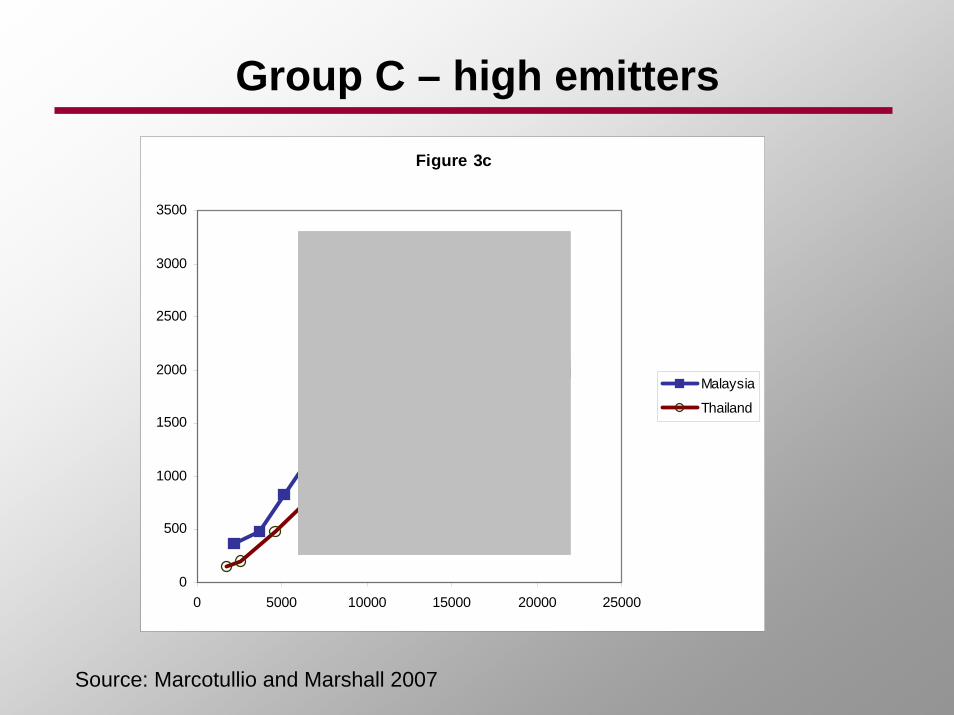
Group C – high emitters
Source: Marcotullio and Marshall 2007
Figure 3c
0
500
1000
1500
2000
2500
3000
3500
0 5000 10000 15000 20000 25000
Malaysia
Thailand
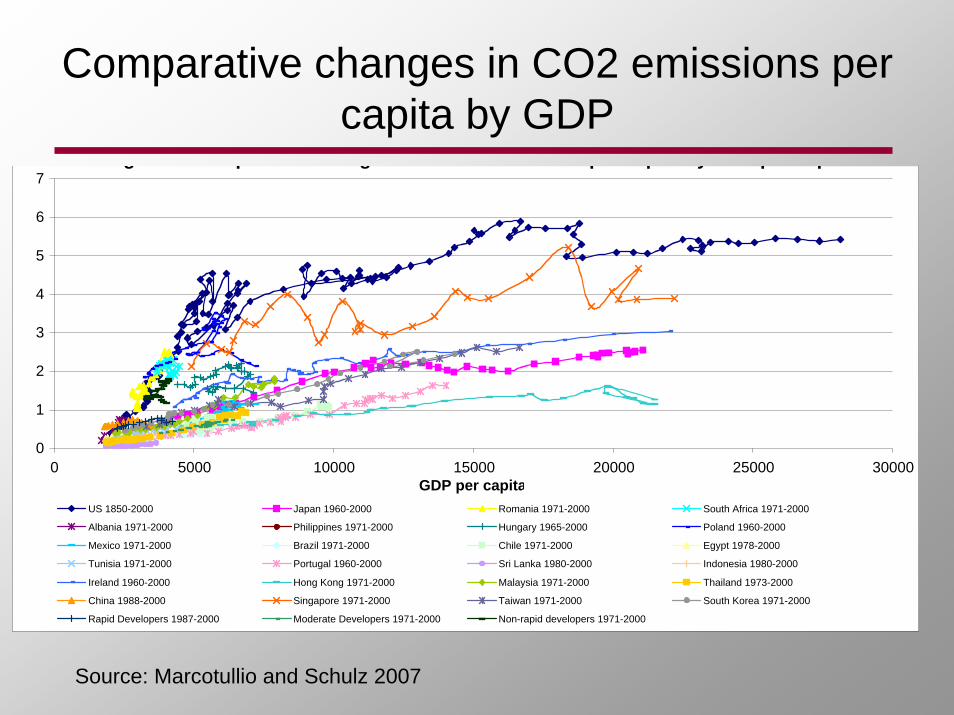
Comparative changes in CO2 emissions per capita by GDP
g p g p p y p p
0
1
2
3
4
5
6
7
0 5000 10000 15000 20000 25000 30000GDP per capita
US 1850-2000 Japan 1960-2000 Romania 1971-2000 South Africa 1971-2000
Albania 1971-2000 Philippines 1971-2000 Hungary 1965-2000 Poland 1960-2000
Mexico 1971-2000 Brazil 1971-2000 Chile 1971-2000 Egypt 1978-2000
Tunisia 1971-2000 Portugal 1960-2000 Sri Lanka 1980-2000 Indonesia 1980-2000
Ireland 1960-2000 Hong Kong 1971-2000 Malaysia 1971-2000 Thailand 1973-2000
China 1988-2000 Singapore 1971-2000 Taiwan 1971-2000 South Korea 1971-2000
Rapid Developers 1987-2000 Moderate Developers 1971-2000 Non-rapid developers 1971-2000
Source: Marcotullio and Schulz 2007

Cumulative impact may be larger
Between now and 2030, a predicted additional 600 million people in developing countries will become middle class bringing the total population in these regions to 1 billion;
By 2040, consumption of motor vehicles in China and India alone is predicted to match total global figures of today (800 million vehicles in use) (Goldman Saks, 2005, The Economist, 2006);

Average Daily Consumption per Capita by GDP
1500
1800
2100
2400
2700
3000
3300
3600
3900
0 5,000 10,000 15,000 20,000 25,000 30,000
GDP per capita (G-K International dollars)
Cal
orie
s pe
r day
per
cap
ita ChinaIndiaIndonesiaJapanMalaysiaPhilippinesSouth KoreaThailandViet NamUnited States of America

Comparative speeding up
• Changes are more rapid than previously experienced;– Speed of urbanization is faster in many Asia
Pacific nations when compared to the developed world
– Growth in energy supply is faster

Comparative speed of urbanization: USA and selected Asian economies
Source: Marcotullio and Schulz 2008

Comparison in speed of increases in energy supply: USA and selected Asian economies
Source: Marcotullio and Schulz 2007
Comparative speeding up: timing of impacts
• Previously experienced sequential development patterns are now experienced simultaneously
• Sets of multi-scale environmental conditions within urban populations of different income in the region
• Multi-scale urban water related conditions in Southeast Asia

Current SituationUrban Environmental Transitions
-0.20
-0.10
0.00
0.10
0.20
0.30
0.40
0.50
0.60
0.70
0.80
Log GDP Per Capita
Stan
dard
ized
Val
ue Percent Non-access to Safe WaterY = -0.448 (2.087/X)R2 = .28 sign .000
SO2 Emissions Per CapitaY = -4.381+(2.574X)+(-0.346X2)
R2 = .22 sign .010
CO2 Emissions Per CapitaY = 0.0002(e 1.793X)
R2 = .68 sign .000
Source: Marcotullio and Lee, 2003
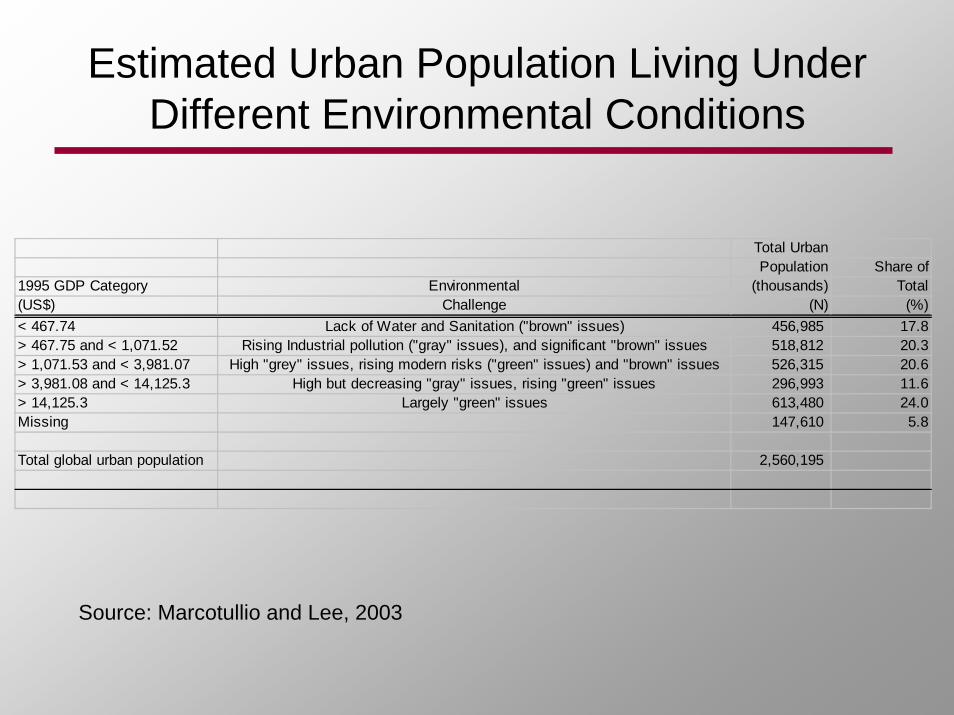
Total UrbanPopulation Share of
1995 GDP Category Environmental (thousands) Total(US$) Challenge (N) (%)< 467.74 Lack of Water and Sanitation ("brown" issues) 456,985 17.8> 467.75 and < 1,071.52 Rising Industrial pollution ("gray" issues), and significant "brown" issues 518,812 20.3> 1,071.53 and < 3,981.07 High "grey" issues, rising modern risks ("green" issues) and "brown" issues 526,315 20.6> 3,981.08 and < 14,125.3 High but decreasing "gray" issues, rising "green" issues 296,993 11.6> 14,125.3 Largely "green" issues 613,480 24.0Missing 147,610 5.8
Total global urban population 2,560,195
Estimated Urban Population Living Under Different Environmental Conditions
Source: Marcotullio and Lee, 2003

Sets of urban water related issues by scalewithin urban regions of ASEAN
City Local Metro-wide Regional and globalLow-income cities
Low levels water supply coverage River and coastal water pollution Economic water scarcityLow levels of sanitation coverage Overdrawn groundwater Vulnerability due to climate change
Poor drainage SubsistenceCoastal area degradation
FloodingMiddle-income cities
Low levels of water supply coverage River and coastal water pollution Economic water scarcityLow levels of sanitation coverage Overdrawn groundwater Vulnerability due to climate change
Poor drainage SubsistenceCoastal area degradation
FloodingUpper-middle income cities
Low levels to incomplete sanitation coverage River and coastal water pollution Increasing water consumption per capitaWater supply coverage not complete Overdrawn groundwater Vulnerability due to climate change
poor to inadequate drainage SubsistenceCoastal area degradation
FloodingHigh income cities
River and coastal water pollution Physical water scarcityCoastal area degradation Increasing water consumption per capita
Vulnerability due to climate change
Notes:Cities in low income category include Vientiane, Phnom Phen, Hanoi, Ho Chi Minh, among othersCities in the middle income category include Manila, Jakarta, among othersCities in the upper-middle income category include Bangkok, Kuala Lumpur, among othersCities in the high income category include Singapore

Conclusions
• Globalization, at least at a theoretical level, is implicated in the structural differences between rapidly developing and developed world experiences with environmental conditions
• Widening, deepening and speeding up have underpinned increasingly diverse phenomenalocated in increasingly centralized nodes (cities) and altered time-space dynamics;

Conclusions
• While there is some evidence for the sooner (at lower levels of income and urbanization), faster (over time) and more simultaneous experiences of socio-ecological conditions, the impacts of these seemingly chaotic conditions have been both alowering of levels of per capita impact in some areas (i.e., transportation CO2 emissions, energy consumption) and an increasing impact in other areas (i.e., ecosystem service consumption)
Conclusions
• The differences between these two results may be due to both the advantages of technology and public policy. In the rapidly developing worldtransportation emissions reductions have been due to a combination of motor vehicle reduction or control policies and the diffusion of low fuel consumption technologies;
• In the areas where there is higher impact, there is less or no policies;
Conclusions
• These broad observations demonstrate differences dependent upon the data sources (UN DESA, IEA, OECD, US Census, etc) andtherefore require further exploration at both the global and regional scale and through local scale case study comparisons
Globalization and urban environmentalchange in the Asia Pacific Region
The EndThe End