globalization and international commodity trade with specific reference to the west african
TRANSCRIPT

131
4.1 Introduction
Since the early 1980s, dramatic changes in export commodity markets,shocks associated with price declines, and changing views on the role of thegovernment have ushered in widespread market-liberalization programsto agricultural commodity markets in Africa. These programs have signif-icantly reduced government participation in marketing and pricing of ex-port commodities. Market liberalization entails a greater reliance on mar-kets to direct resource utilization and investment. In the context of thispaper, market liberalization refers to steps taken toward opening domesticand export markets to competition and toward putting in place public andprivate institutions consistent with and supportive of private markets.1
Critics have raised several concerns about the trend toward market lib-eralization. These include the claim that, although liberalization may makesense for an individual exporting country, when several countries do it si-multaneously, they increase exports so strongly that they drive down theprices and revenues that they receive from exporting and make themselvesworse off. Critics also sometimes argue that liberalization has openedfarmers up to price and income fluctuations from which they were previ-
4Globalization and InternationalCommodity Trade with SpecificReference to the West AfricanCocoa Producers
Christopher L. Gilbert and Panos Varangis
Christopher L. Gilbert is professor in the Faculty of Economics, University of Trento, Italy.Panos Varangis is lead economist at the Agriculture and Rural Development Department,The World Bank.
This paper was prepared for the International Seminar on International Trade (ISIT), 24–25 May 2002, Stockholm. We are grateful to participants at the ISIT conference in particular,to Joshua Aizenman and Bob Baldwin for comments on the presentation of earlier material;and to Erin Bryla for research assistance.
1. Bates (1989) notes that markets adjust automatically, leaving the realignment of govern-ment institutions as the real task of structural adjustment.

ously insulated. Economic theory makes it clear that all these problemscan arise in particular circumstances, so the real questions are empirical.This chapter provides some answers by exploring one case of primary-commodity liberalization in some detail: cocoa in West Africa. We showthat such distributional issues are of first-order importance to the politicaldebate about globalization.
We need to distinguish between liberalization and globalization. Liber-alization is the move to market-determined prices from what was previ-ously a regulated regime. One of the implications of liberalization is thatthe prices received by farmers in different producing countries move to-gether much more closely than prior to liberalization. It also implies thatmarkets in each producing country are more closely interconnected thanpreviously, with the result that decisions taken in one country affect farm-ers in each of the other producing countries. We refer to these two aspectsof liberalization as globalization. Governments decided (or agreed) to lib-eralize, while globalization was a consequence of these decisions and notan objective in itself.
For commodity markets, liberalization has meant reducing governmentinvolvement in marketing and in production, increasing participation ofthe private sector in these activities, and reducing distortions in commod-ity prices, especially producer prices. Measures implemented to achievethese goals vary, but often they have included the elimination of govern-ment marketing agencies, the introduction of competition in marketing,the elimination of administered prices, reduction in explicit and implicittaxes, and the privatization of government-owned assets.
Events triggering market liberalization were not independent of broaderpolitical and economic changes in most countries, and the consequences ofliberalization are often linked as well. However, issues related to the ap-proaches and effects of general and agricultural market liberalization havebeen discussed elsewhere and receive minimal treatment here (for fulltreatment, see World Bank 1994; Engberg-Pedersen et al. 1996; and Mos-ley, Harrington, and Toye 1991). Instead, our purpose is to discuss mar-ket liberalization in the specific context of cocoa and, particularly, to ex-amine the impact of liberalization on the prices obtained by west Africancocoa producers and the revenues they receive. We also empirically esti-mate supply and demand elasticities for west African producers and usethese to simulate the welfare effects of liberalization on west African cocoaproducers, non-African producers and world consumers of cocoa prod-ucts, and the revenue loss to west African governments.
West Africa accounts for nearly two-thirds of the world’s cocoa produc-tion. Before the late 1980s, west African cocoa was entirely produced andmarketed under government-controlled systems. However, starting in thelate 1980s and continuing into the 1990s, all four of west Africa’s largestcocoa-producing countries—Cameroon, Côte d’Ivoire, Ghana, and Ni-
132 Christopher L. Gilbert and Panos Varangis

geria, together with Togo (a smaller cocoa producer)—took steps towardliberalizing their cocoa markets. Much of the aim of the reforms was to im-prove efficiency by reducing domestic marketing costs, provide a higherpass-through of international prices to producer prices, and increase theproducer share of the free on board (f.o.b.) price. According to Akiyama etal. (2001), market liberalization in cocoa had a positive effect on producerprices, relative to both f.o.b. prices and production.
The claimed increase in production raises the question of whether or notliberalization by the west African producers, despite the relative rise in pro-ducer prices, may have led to a net loss in total welfare in these countries asthe result of the likely negative impact of the production increase on theworld cocoa price. To the extent that this occurred, the incidence of thebenefits from liberalization will have been on cocoa consumers, most ofwhom are in the developed market economies. Developed country govern-ments already have to counter the charge of hypocrisy (“incoherence,” inofficial parlance) in that they advocate market liberalization in the ThirdWorld while maintaining regulated and subsidized domestic agriculturalmarkets. If it is also the case that the incidence of the liberalization bene-fits is significantly enjoyed by developed-country consumers, it may bedifficult to avoid the impression that these governments and the interna-tional agencies are guilty of pursuing self-interested policies in the devel-oping world.
This is an instance of the well-known adding-up problem. Here, theproblem arises as the welfare effects of unilateral liberalization by an indi-vidual and relatively small cocoa producer will differ from and be lowerthan the welfare effects of multilateral liberalization by a group of produc-ing countries, which collectively constitute a large proportion of the worldmarket. In the former case, it may be reasonable to take the world price asunaffected by the liberalization, while in the latter case, this assumptionwould be absurd. The adding-up problem has generated a large literaturestarting from Johnson (1953, 1958) and Bhagwati (1958) and, more re-cently, Krishna (1995). Schiff (1994) states that countries with marketpower in commodities should proceed with trade and domestic liberaliza-tion and should apply optimal export taxes to those commodities in whichthey have market power. Akiyama and Larson (1994) argued as a practicalmatter that it is not feasible to design a regional commodity-productionand trade policy for cocoa-producing countries in Africa mainly becauseof the difficulty of equitably distributing the benefits of such a policy.
In a related literature, Evenson (2002) looks at the impact of technologyon agricultural prices. He finds that there are significant costs to countriesthat do not adopt new technology because they suffer from low prices andlack of production growth. New technologies have led to lower prices, butcountries that have adopted new technologies have benefited from ex-panded production. Liberalization has lowered marketing costs and mar-
Globalization and International Commodity Trade 133
gins in the same way as has technological advance, and its impact on pro-duction should therefore also be similar. Countries cannot afford to be leftbehind in this process.
The choice of cocoa to examine these questions is deliberate and ad-vised.
• Along with coffee, rice, sugar, and wheat, cocoa has historically beenone of the most heavily regulated commodity markets.
• In common with coffee, but unlike sugar and wheat, it is almost en-tirely a developing-country commodity.2
• Unlike coffee, regulation was predominantly at a national rather thanan international level.3
• The liberalization process can be fairly cleanly dated in the cocoa mar-ket. The rice, sugar, and wheat markets remain less fully liberalized.
It is our belief that the concentration of production in four west Africancountries, all of which had heavily regulated internal markets, makes itlikely that the adverse (from the point of view of the liberalizing countries)adding-up effects of liberalization will be both larger and more clear thanin any other major market.
The present paper is structured as follows. Section 4.2 discusses the eco-nomics of liberalization, while section 4.3 highlights certain aspects of theworld cocoa market, particularly in relation to market liberalization. Insection 4.4, we look at the direct consequences of liberalization and glob-alization in the world cocoa market. Section 4.5 presents a world cocoa-market model, and section 4.6 indicates the beneficiaries of market liber-alization based on the results of the model simulations. Section 4.7concludes.
4.2 The Economics of Market Liberalization
The market-liberalization programs enjoined upon developing-countrygovernments in the markets for tropical commodities had two comple-mentary objectives. The first was to ensure that farmers would receive ahigher proportion of world prices than had been the case in the preliberal-ization period. This often involved a reduction in (implicit or explicit) ex-port tax rates. The second objective was to align incentives with worldprices, both for farmers and more generally in the marketing chain, withthe expectation that production and marketing would be more efficient. Itwas hoped that these incentives would increase both production and rev-enues in the liberalizing economies. This price-realignment process in-
134 Christopher L. Gilbert and Panos Varangis
2. There is a very small quantity of OECD cocoa production in Australia.3. See Gilbert (1987, 1996) for a discussion regarding international commodity-market reg-
ulation in cocoa and coffee.

volved an ending of previous interannual, intra-annual, and intranational(interregional) price stabilization arrangements and paralleled the simul-taneous abandonment of attempts to stabilize international prices throughcommodity agreements. At the same time, previously monopsonistic mar-keting systems were opened up to competition. See Akiyama et al. (2001)and Gilbert and ter Wengel (2001) for a summary of these developments.
Market liberalization is part of the globalization phenomenon in thatproducers of tropical commodities now react in a more or less uniformmanner to a common world price whereas, previously, domestic and inter-national marketing arrangements often shielded them from the worldprice.
The practical effects of market liberalization are often both complicatedand controversial. We will accept that liberalization has indeed increasedthe farmers’ share of the port (f.o.b.) price, because of both reduced taxa-tion and reductions in marketing cost. Varangis and Schreiber (2001) dis-cuss the cocoa outcomes. The balance between these two effects, the first ofwhich is a transfer and the second a pure efficiency gain, undoubtedlyvaries across commodities and also across countries for the same com-modity.4
The globalization aspects of market liberalization align domestic pricesmore closely with the volatile world cocoa price, and the reining back of themarketing boards and caisses de stabilisation (see section 4.3) reduces gov-ernments’ capacities to offset this volatility. The consequence is that farm-ers, in general, will be more exposed to commodity-price variability. Thisimposes additional costs on them, both through the costs of uncertainty aswell as from the direct costs of low prices (see Gilbert 2002). We make thestandard assumption that developing-country farmers lack access to eithercredit or risk-management instruments. They are therefore obliged to self-insure through diversification.5
Proponents of liberalization hoped and intended that, by ensuring thatfarmers would get a higher share of f.o.b. prices, they would be better off.The farmers themselves note that, in practice, they have been rewarded bya higher share of a lower price. They often go on to argue that they are nobetter off and perhaps worse off than before liberalization. Of course, be-cause prices are volatile, these complaints are more often heard in low-pricethan in high-price years. It is also possible to respond with the counterfac-tual argument that, because of continued productivity advances in tropicalagriculture, prices would have fallen relative to the prices of manufacturesin the absence of liberalization so that, even if it is true that farmers are no
Globalization and International Commodity Trade 135
4. There are also arguments, which we do not explore in this paper, that market liberaliza-tion may have resulted in a deterioration in crop quality (see Gilbert and Tollens 2003).
5. It might be suggested that even if farmers lack access to credit, they are always able tosave in good times, but not in bad times (see Paxson 1993). However, the almost complete ab-sence of rural banks in West Africa makes it difficult even to save.

better off than previously, they are at least better off than they would havebeen in the absence of liberalization. In our experience, it is difficult to per-suade developing-country farmers that this is more than self-justifyingsophistry. Furthermore, farmers believe that the fall in tropical-commodityprices has been induced in large measure by the liberalization process itself.
It is easy to see why this should be the case. Holding the world price con-stant, the farmers will be willing to supply more at that world-price level tothe extent that market liberalization has increased the price obtained bythose farmers. They can do this either by exploiting existing capital moreintensively (by increased application of effort and purchased inputs) or byexpanding the area under cultivation. The supply curve from the liberaliz-ing country therefore shifts right and, so long as the supply of the liberal-izing country is not negligible compared to world supply, the aggregatesupply function will also shift right. This will induce a fall in the world pricewhich will be larger to the extent that (a) a significant fraction of world pro-duction is affected in this way and (b) the demand curve is inelastic.
This is a standard instance of the old Johnson (1953, 1958) and Bhagwati(1958) adding-up problem. If one confines attention to market liberaliza-tion in a single “small” country, it is legitimate to hold the world price con-stant, at least as a first approximation. However, if one considers liberal-ization either in a major producer of the commodity or in a significantgroup of individually small producers, it will be important to take into ac-count the effect on the world price. The implication is that the sum of thebenefits to each of the individual liberalizers, under the assumption theworld price does not change, will exceed the actual total welfare effects inthe liberalizing countries, taking into account the decline in the world co-coa price. Proponents of liberalization have always admitted the principleof this argument but have proceeded on the basis that the adding-up effectis of the second order of importance. Instead, the anti-liberalizers may beinterpreted as suggesting that the adding-up costs are of a comparable or-der to the original liberalization benefits, and indeed that they may even ex-ceed these benefits (see figure 4.1 where supply shifts from S to S � and theworld price falls from P to P �).
It is straightforward to obtain a first-order approximation for the size ofthe adding-up effect.6 The international price of the commodity is P; thedomestic-producer price in producing country j is pj ( j � 1, . . . , n); and theproduction in country j is Qj � Q j ( pj , �j ), where we have supposed that pro-duction depends not only on the price received by farmers in j, but also onthe variability of the price as measured by the log standard deviation of do-mestic prices. The aggregate (world) demand for the commodity is D(P).Suppose the effects of liberalization on the level of the domestic price incountry j can be represented as
136 Christopher L. Gilbert and Panos Varangis
6. The estimates reported in section 4.6 are based on exact numerical solution of the model.

(1) � ln pj � � ln P � �j ,
This equation states that the direct effect of liberalization is to raise the pro-ducer price in the country by the proportion �j, but there may also be an in-direct effect through the (negative) impact of liberalization on the worldprice P.7 Making the reasonable assumption that liberalization has noeffect on desired inventory holdings, market clearing requires
(2) ∑n
j�1
Qj ( pj , �j ) � D(P),
and differentiating and approximating by finite differences,
(3) ∑n
j�1
�∂∂p
Q
j /p
j
j
� (� ln P � �j ) � ∑n
j�1
�∂∂Q�j
j���j � �
∂∂PD/P� � ln P.
The supply elasticity in country j is εj � ∂ ln Qj /∂ ln pj , the volatility semi-elasticity is �j � ∂ ln Qj / ∂�j, and the aggregate price elasticity of demand is� � –∂ ln D/∂ ln P, and we define the production share of country j as j
� Qj /Σni�1Qi . Using this notation, we may approximate equation (3) to give
(4) � ln P � .∑ n
i�1 iεi�i ∑ ni�1 i�i ��i
���� � ∑ n
i�1 iεi
Globalization and International Commodity Trade 137
Fig. 4.1 The price impact of market liberalization
7. It is possible that this volatility effect may be sufficiently large as to dominate the impactof the higher price on production. This would result in an increase in the world price (see New-bery and Stiglitz 1981, 327–29). Kanbur (1984) shows that in the case of cocoa, under plaus-ible assumptions, the risk benefits from stabilization are lower than the transfer benefits.

Consider the simple case in which supply elasticities and volatility semi-elasticities are equal in all producing countries. Suppose further that thereare m liberalizing countries (aggregate share �) each of which sees pro-ducer prices rise relative to the world price by a uniform amount of � andprice volatility rise by the uniform amount �. By implication, there are n –m nonliberalizers with share 1 – �. Equation (4) simplifies to
(5) � ln P � ��ε�
�
�
�
ε�
� ,
and the domestic price in liberalizing country j rises by
(6) � ln pj ��[� �
�
(1�
ε�)ε]
�� � ��
�
�
��
ε� .
Consider first the case in which production is unaffected by changes inprice variability (� � 0). A unilateral liberalization by a small producer willbe associated with a value of � close to zero. The impact on the world pricewill be negligible, and the incidence of the producer price will be entirelyon the producers in the liberalizing country. However, the larger the shareof the liberalizing countries and the higher the supply elasticities relative tothe demand elasticity, the greater the dissipation of the effects of liberal-ization through decline in the world price. The limiting case is if demand iscompletely inelastic (� � 0), and the entire set of producers liberalize (� �1). In this case, � ln pj � 0 ( j � 1, . . . , n) and � ln P � –�, implying thatliberalization results in a transfer from producing-country governments toconsumers with farmers unaffected. Farmers are never made worse off byliberalization, but they may not be much better off. Consumers will alwaysbe better off, and producing-country governments worse off. Dependingon the welfare weight given to government, producing countries as a wholemay well be worse off.
Allowing a production response to increased volatility reduces the im-pact of globalization on the world price, hence raising local prices ceterisparibus, but also opens the possibility that liberalization may worsen theposition of farmers.
4.3 The World Cocoa Market and Cocoa-Market Liberalization
Cocoa is a tropical-tree-crop commodity. Furthermore, it is the westAfrican crop par excellence. Côte d’Ivoire is the single largest producer andexporter of cocoa and Côte d’Ivoire, Ghana, Nigeria, and Cameroon, to-gether, are responsible for over 60 percent of world production (see figure4.2, which gives averages for the 1990s). In west Africa, cocoa is almostentirely a smallholder crop. All four of the major west African cocoa-producing countries had regulated marketing structures that they inher-ited from their colonial administrations. The major non-African cocoa ex-
138 Christopher L. Gilbert and Panos Varangis

porters are Indonesia (the second most important exporter) followed byMalaysia and Brazil where, for different reasons, production has been de-clining.
The standard crop marketing structure adopted in countries with aBritish colonial history was of monopoly-monopsony marketing boards.In the ex-French colonies ownership of the crop remained with the privatesector, but the state intervened by setting producer and export prices, by is-suing export licenses, and by stabilizing prices through a caisse de stabili-sation. In cocoa, Ghana and Nigeria operated marketing boards, whileCôte d’Ivoire operated a caisse system. Cameroon, which combines ex-British and ex-French colonial territories, adopted a hybrid model. Mar-keting boards and caisses were never a feature of non-African cocoa-producing countries.
Marketing board and caisse structures were justified in terms of pricestabilization (interyear and intrayear), quality assurance, and provision ofservices to farmers (subsidized-input purchase and extension). These sys-tems came under significant pressure over the 1980s and 1990s, in particu-lar from the two major donor institutions—the World Bank and the Euro-pean Union (EU), which was involved as the consequence of the Stabexprogram established under the succession of Lomé Treaties with the ACP(Asian, Caribbean, and Pacific) group of countries.
Donor pressure is often seen as having been ideologically motivated,and there is no doubt an element of truth in this, although it is difficult toargue that the EU has always exhibited an overriding general commitment
Globalization and International Commodity Trade 139
Fig. 4.2 Cocoa production 1990–1991 to 1999–2000

to liberalized agricultural markets. In any case, other factors were ofgreater importance.
• Primary-commodity prices were at historically low levels in the secondhalf of the 1980s. The cocoa price fell more or less steadily from its1977 peak to a low in the early 1990s, and subsequently has recoveredonly to a modest extent. Stabilization agencies that attempted tomaintain cocoa-producer prices at levels that had been feasible in the1970s and early 1980s consequently found themselves in financialproblems. In certain countries, these were exacerbated by the fact thataccumulated stabilization surpluses from earlier years had typicallybeen “invested” in illiquid and poorly performing assets. The resultwas that a number of boards and caisses became technically insolvent.
• Marketing-board and caisse arrangements were viewed as nontrans-parent. Accounts were often late and opaque. It was difficult to distin-guish taxes, which were potentially available to finance governmentexpenditure, from marketing costs.
• The stabilization agencies became large organizations, often exercis-ing significant political power and absorbing a substantial share ofcountries’ cocoa-export earnings. Cocoa-marketing costs were there-fore significantly higher in African producing countries than else-where, and there was reason to suppose that this involved a significantelement of rent extraction. For example, Williams (1985) wrote of theNigerian agricultural-marketing boards shortly before their abolitionin 1986, “They have replaced the European firms at the apex of thebuying system and shaped it to serve the needs of ruling parties, gov-ernments and the Northern aristocracy to expand and consolidatetheir networks of patronage” (13).
• Farmers have the residual claim on crop revenues. Falling world pricesin conjunction with an unchanged marketing wedge exerted signifi-cant downward pressure on farm incomes.
• Stabilization also proved to be expensive for farmers. For them, stabi-lization often meant lower overall prices in exchange for stable prices.McIntire and Varangis (1999) evaluated the trade-off between stabil-ity and level of prices for the case of Côte d’Ivoire. They found that thebenefits of stable prices did not compensate for the overall lower levelof prices paid to the Ivorian cocoa farmers.
Donor institutions balked at refinancing the insolvent stabilizationagencies, perhaps in part because they preferred free markets, but also be-cause it was clear that the major beneficiaries of refinancing would be thestabilization agencies, themselves, and the political causes they espoused.Furthermore, nontransparency made it difficult to account for uses offunds provided. Farmers were seen by the donors as being poorly repre-sented in the African political process, particularly in countries where
140 Christopher L. Gilbert and Panos Varangis

regimes are less than fully democratic. Liberalization therefore came to beseen as a means of reducing marketing costs and raising farmers’ share ofthe f.o.b. price.
The first African cocoa liberalization was that of Nigeria in 1986. Al-though the World Bank had argued that the Nigerian agricultural-marketing boards were ineffective and had sought their abolition as part ofa structural adjustment program, the Nigerian government rejected thatprogram but decided to abolish the marketing boards unilaterally. TheWorld Bank would have preferred agricultural liberalization to be se-quenced after foreign-exchange liberalization, which was not implementedat that time. There was little preparation for liberalization, and the processis regarded as having been unnecessarily chaotic (see Gilbert 1997).
Cameroon, the smallest of the major African producers, was next tomove. This liberalization took place in stages starting in 1989 and con-cluding in 1995 (see Gilbert 1997 for details). The major impetus to liber-alization was the insolvency of the stabilization agency, the Office Nationaldu Commercialisation des Produits de Base (ONCPB), which had respon-sibility for coffee as well as cocoa. The EU made replacement of the ON-CPB by an organization with a more limited role (the Office National duCafé et du Cacao; ONCC) a condition of Stabex financial support and re-quired a sharp reduction in the price offered to farmers. The World Bankwas never significantly involved with the Cameroon cocoa sector. Unlikethe Nigerian liberalization, the Cameroonian reforms were never fully“owned” by the government or the Cameroonian media, which has consis-tently seen them as imposed by the donors. But despite the questionableownership of reforms in Cameroon and problems in Nigeria, cocoa farm-ers in these two countries benefited significantly as prices paid to them rosesubstantially following the reforms.
Both Nigeria and Cameroon may be seen as small producers (see figure4.1). This cannot be said of Côte d’Ivoire. Ivorian cocoa policy was ad-ministered through the Caisse de Stabilisation et du Soutien des Prix desProduits Agricoles, normally known simply as the Caistab. Prior to 1989,Ivorian cocoa prices were set at levels very similar to those in Cameroon,partly reflecting the common currency, but possibly also on the basis ofcommon external advice. Caistab therefore experienced financial problemsin the late 1980s similar to those of the Cameroonian ONCPB. However,the EU was prepared to offer greater assistance to the Ivorians. A sequenceof piecemeal reforms was made through the 1990s with the objective ofincreasing the transparency of the process by which exporters bid fordéblocage (i.e., permission to export). Supposedly complete liberalizationcame in 1999, largely as the consequence of World Bank insistence, al-though in practice there has been considerable back-tracking on the spiritof those commitments. As in the Cameroonian case, reform ownership re-mains problematic.
Globalization and International Commodity Trade 141

It is notable that the 1999 Ivorian liberalization coincided with a sharpfall in cocoa prices attributed by many farmers and also by some govern-ment officials and their advisors to the liberalization process. Our view,which coincides with that of the cocoa industry, is that this price fall wasdue to lack of growth in cocoa consumption and was completely unrelatedto the liberalization process.8 In any case, the fall in price led to significantcivil disobedience and put pressure on the government to assist cocoafarmers. Cocoa prices recovered sharply in 2001 and 2002 as consumptionrose in the context of weak production, which reflects the neglect of cocoatrees during the previous low-price years.
Ghana is the remaining major African cocoa producer. Currently(2003), it has only liberalized partially and tentatively. The Ghana CocoaBoard, generally referred to as Cocobod, historically enjoyed monopsony-monopoly power. Licenced private buyers are now permitted to operate,but they are still required to sell to Cocobod and, in principle, are requiredto buy from farmers at a uniform regulated price. Ghanaian farmers, how-ever, are now obtaining a significantly higher share of the f.o.b. price thanduring the 1980s, reflecting a partial retreat from the interannual-stabilization objective, some reduction in cocoa taxation, and a sharp fallin the Cocobod establishment.
Ghanaian cocoa sells at a significant premium relative to cocoa fromother origins, in part because of a good fat content, but most importantlybecause of the reliability and rigor of Cocobod quality controls. These con-trols depend in large measure on Cocobod’s monopoly-monopsony pow-ers. Although there is an issue of the size of the Ghanaian premium in re-lation to the cost of producing cocoa of this quality,9 the Ghanaians areclearly correct to worry that liberalization could result in an erosion of thispremium.
4.4 The Direct Impact of Liberalization and Globalization
The complexity and diversity of the west African cocoa-market-liberalization process makes it difficult to identify the appropriate dates forbefore-and-after comparisons. Liberalization is a legal act and can there-fore be dated precisely—1986–1987 for Nigeria, 1989, 1991, and 1995 forCameroon, and 1999 for Côte d’Ivoire, with Ghana still to fully liberalize.By contract, globalization is a process that is partially consequential on lib-eralization, as in Nigeria and Cameroon, but that may also anticipate lib-
142 Christopher L. Gilbert and Panos Varangis
8. Cocoa grindings were effectively constant in 1998–1999 (2.77 tonnes against 2.78 tonnesin 1997–1998), while production rose 4.5 percent over the same period (from 2.61 tonnes to2.80 tonnes; ICCO 2002).
9. The major cost arises from the diversion of sub-export-quality beans to domestic pro-cessing, for which purpose they are sold at what is believed to be a significant discount toworld prices.

Globalization and International Commodity Trade 143
Fig. 4.3 Deflated cocoa producer prices and deflated ICCO indicator price (1985 � 100)
eralization if, as in Côte d’Ivoire and Ghana, administered prices arebrought increasingly into line with the world price.
Figure 4.3 charts producer prices in the four west African countries andalso the International Cocoa Organization (ICCO) indicator price, whichwe interpret as the world price.10 It is apparent that these five prices havemoved much more closely together since 1990 than in earlier years. This vi-sual impression is broadly confirmed by the correlations shown in table 4.1.The nonitalic correlations above the diagonal give correlations between theproportionate price changes in the four producing countries over crop years1968–1969 to 1985–1986 (the year prior to the Nigerian liberalization). Theitalicized correlations beneath the diagonal give the same correlations overcrop years 1989–1990 to 1998–1999. The table also includes the correlationswith changes in the ICCO indicator price lagged one year. The table showsthe prices in Cameroon, Côte d’Ivoire, and Ghana (as well as Nigeria, al-though to a much lesser extent) moving much more closely together after1990 than before 1986. The leading principal component of the four price-change series accounts for 43.9 percent of the price variation prior to liber-alization and 69.8 percent after liberalization. All four prices also movemore closely with the ICCO price in the postliberalization period.
On the basis of these figures, we conclude that the west African cocoa
10. The four producer prices are in domestic-currency units and are deflated by nationalconsumer price indexes. The ICCO price is in U.S.$ and is deflated by the U.S. CPI (Interna-tional Monetary Fund [IMF] 2001). The five prices are measured as indexes normalized at100 in 1990. There is, however, no implication that the five 1990 prices are equal.

producers globalized, in the sense of moving to a common world-cocoaprice from the start of the 1990s. The Nigerian liberalization was threeyears prior to this, and the institutional liberalizations in Cameroon andCôte d’Ivoire came over the course of the following decade. However, cru-cially, the start of the 1990s saw the move away from interannual price sta-bilization in both these two countries (under EU pressure) and also inGhana. In the calculations that we report in section 4.6, we therefore re-gard the period up to (and including) 1985–1986 as preglobalization andthe period from 1989–1990 to date as postglobalization.
The principal objective of liberalization was to raise the share of thef.o.b. price received by farmers. There are two possible approaches to theproblem of measuring this impact.
• The first approach is to take time averages of the shares of the pro-ducer prices, converted into dollars, in the world price before and af-ter liberalization. However, this exercise is complicated by the compli-cated nonmarket-exchange-rate regimes operated by Ghana andNigeria over the periods of interest.
• The second uses point estimates of the shares of producer prices inf.o.b. port prices, both measured in local currency. This proceduregives a clearer comparison but necessarily introduces a degree of arbi-trariness in the dates selected for the comparison; it is apparent fromfigure 4.1 that the extent to which the various producer prices were di-vorced from the world price varies considerably over time.
We adopt the second of these procedures. Table 4.2 brings together someestimates of the effects of liberalization on the farmers’ share of the f.o.b.price. These figures allow comparison of the four liberalizing origins inwest Africa with Brazil, Indonesia, and Malaysia, which have no history ofinternally regulated cocoa markets. Figures relating to liberalized marketsare italicized. There is broad agreement between the Ruf and de Milly
144 Christopher L. Gilbert and Panos Varangis
Table 4.1 Price Correlations 1968–1969 to 1985–1986 (above diagonal) and1989–1990 to 1998–1999 (beneath diagonal)
1968–1969 to 1985–1986
1989–1990 to 1998–1999 Cameroon Côte d’Ivoire Ghana Nigeria ICCO
Cameroon 0.1183 –0.0404 0.5161 0.6345Côte d’Ivoire 0.4773 0.0816 0.3703 0.6035Ghana 0.7011 0.8038 0.2950 0.0170Nigeria 0.6395 0.4334 0.5061 0.6251ICCO 0.8051 0.7820 0.7575 0.8115
Note: Correlations are between annual changes in the logarithms of the producer prices. TheICCO price change is lagged one year.

(1990) figures for 1989 and those taken from the World Bank, LMC Inter-national,11 and Gilbert and Tollens (1999). This comparison highlights notonly the sharp jump in the Cameroonian share after liberalization, but alsothe steady increase in the Ivorian share prior to the formal liberalization inthe 1999–2000 season.
On the basis of these figures, we take the preliberalization shares inCameroon and Côte d’Ivoire to be those given by Ruf and de Milly (1990)and the postliberalization shares to be equal to the 81 percent average re-ported by LMC for 1996. Ghana and Nigeria pose greater problems. InGhana, which has yet to fully liberalize, we lack a postliberalization share,while for Nigeria, which liberalized before the Ruf and de Milly (1990) sur-vey, we lack a preliberalization estimate. Furthermore, it is apparent fromfigure 4.1 that Ghana had already commenced raising its producer-priceshare prior to 1989. We take a starting value for both countries of 47 percent,the nonliberalized average from Ruf and de Milly (1990), and see the Niger-ian share rising by 41 percent to the LMC figure of 88 percent, with theGhanaian share rising by 34 percent to the LMC liberalized average of 81percent.12 These estimates are clearly orders of magnitude at best and shouldbe treated as such. The impact of rises in the producers’ share of the f.o.b.price on actual producer prices will depend on the impact on the world price.
These increases in the farmers’ share of the world price result from two
Globalization and International Commodity Trade 145
Table 4.2 Producer Prices as Share of F.O.B. Price (%)
Ruf and World Gilbert andde Milly (1990) Bank LMC Tollens (1999)
1989 1994–95 1996 1998–99
Cameroon 41 71 75 73Côte d’Ivoire 48 48 47 63Ghana 52 49 56 56Nigeria 74 72 88 90Brazil 79 72 72 n.s.Indonesia 87 78 78 88Malaysia 72 94 91 n.s.
Average, liberalized 78.0 77.4 80.8 84.0Average, nonliberalized 47.0 48.5 51.2 59.7Liberalization effect 31.0 28.9 29.6 24.3
Note: Figures relating to liberalized markets are italicized. n.s. � not stated.
11. The figures were received by private communication (LMC International is a commod-ity consulting firm).
12. The very high LMC estimate of the share of the Nigerian producer price in the f.o.b.price reflects the lack of dependence of the Nigerian government on taxes on agricultural ex-ports. We would expect Ghana to continue to tax cocoa-export revenues even after full liber-alization. Note that, because intermediation costs are largely independent of the cocoa price,the producer share, which is a residual, will be positively correlated with the price.

separate effects. The first is cost reductions arising out of more efficient in-termediation. The second is the reduction in taxation. One might, in prin-ciple, regard the administrative expenses of the stabilization agencies aseither taxation or as an intermediation-cost item—we follow the latterapproach. Figure 4.4, which is based on statistics taken from Gilbert andTollens (1999), shows the dramatic differences between tax levels in the twononliberalized countries (Côte d’Ivoire and Ghana) compared with that inthe liberalized economies. On the basis of these statistics, we estimate that75 percent of the increase in the producers’ share in the liberalization pro-cess arises from reduced taxation.
That estimate is conjectural. Reductions in intermediation costs are im-portant in the welfare analysis we perform in section 4.6 because these maybe interpreted as efficiency gains, while reductions in taxation generatetransfers. Relatively little information is available on the scale of these ben-efits. Gilbert and Tollens (1999), who interviewed new and established co-coa exporters in Cameroon, estimated that intermediation costs had fallenby 5 percent (relative to the producer price) in the three years following fullliberalization.13
Globalization will also have affected, and generally increased, the vari-ability of the prices received by farmers. Figure 4.5 shows the uncondi-tional, interannual, logarithmic standard deviations of the four (deflated)
146 Christopher L. Gilbert and Panos Varangis
Fig. 4.4 Taxes and marketing costs as shares of the producer price, 1998–1999
13. They attributed these differences to the fact that newer exporters utilized less capitaland made greater use of specialized intermediaries (such as transportation companies). De-spite this, Cameroonian intermediation costs remained (and remain) high.

Fig
. 4.5
Pro
duce
r pr
ice
vola
tilit
y be
fore
and
aft
er g
loba
lizat
ion

producer prices before and after globalization. Farmers in Cameroon haveexperienced the largest increase in price variability—a 32 percent rise from12 percent to 44 percent. Instead, Côte d’Ivoire and Nigeria have seenmore modest rises, while volatility in Ghana has actually fallen. This last,paradoxical, finding is the consequence of the lack of success of Cocobodin its declared stabilization objective during the 1980s, when sharp move-ments in inflation movements resulted in the supposedly stabilized domes-tic price becoming, in real terms, more variable than the world price. Notethat, except in Ghana, where the nominal producer price continues to befixed for the entire crop-year, the figures tabulated in figure 4.4 may under-estimate the extent to which the increase in variability experienced byfarmers since liberalization has also increased intra-annual-price variabil-ity.
Figure 4.4 also reports the variability of the world (ICCO indicator)price over the same period. The modest decline in world-price variabilityimplies that the rises in Cameroon, Côte d’Ivoire, and Nigeria cannot beattributable to any greater variability in the postglobalization world price.
4.5 A Model of the World Cocoa Market
Because our interest is in the four major west African producing coun-tries that have liberalized their cocoa sectors, our strategy is to model pro-duction in these countries in detail but to embed these equations in what isotherwise a highly aggregated world model. A benefit of this approach isthat we do not need to make gratuitous assumptions about other aspectsof the cocoa market. A cost is that highly stylized modeling of consump-tion and non-African production may distort our results.
For each of the four origins ( j � 1, . . . , 4) we consider, we model pro-duction Qjt in period t as a linear function of a quadratic time trend, cur-rent and lagged expected prices, and price volatility.
(7) ln Qjt � j 0 � j1t � j 2 �1t0
2
0� � j 3Et1 ln Pjt � j4Et2 ln Pjt1
� j5�jt � ujt
The quadratic trend is required to account for the declines and subsequentrises in production in Ghana and Nigeria. It may be argued that thesechanges were determined, in fact, by the movements in producer prices inthose countries; if this is so, these effects arise from the cumulative effectsof prices over a long period and are not easily modeled in terms of simplelag distributions. In any case, part of these two declines and the subsequentreversals reflect changes in infrastructure investment, the provision of ex-tension, and other factors that cannot be directly related to price levels.
The expected producer prices Et–1 ln Pjt and Et–2 ln Pjt–1 in equation (7) are
148 Christopher L. Gilbert and Panos Varangis

generated as the one-period predictions from estimated trend-augmentedfirst-order autoregressions.
(8) ln Pjt � �0 � �1 ln Pj,t1 � vjt
Equation (8) is estimated separately for each country for the preglobaliza-tion and postglobalization periods.14 This specification supposes thatfarmers form price expectations rationally on the basis of the limited in-formation set consisting of the local price history and without any need tolearn the price processes.15 In principle, one would expect only the current-period expectations Et–1 ln Pjt to explain production, but in practice thelagged expectation Et–1 ln Pjt–1 is also required.
The price volatility �jt is the unconditional standard deviation of pro-portionate price changes in country j estimated separately for the pre- andpostglobalization periods.16 The expected sign of the coefficient j5 is neg-ative as farmers self-insure by diversifying effort away from the risky crop.
The estimated-price autoregressions (equation [8]) are given in table 4.3.The divide between the preglobalization sample I and the postglobaliza-tion sample II is taken as between the 1988–1989 and 1989–1990 crop yearsfor Cameroon, Côte d’Ivoire, and Ghana, and between the 1986–1987 and1987–1988 crop years for Nigeria. The trend terms are dropped from theCameroonian and Ivorian price autoregression equations, as they are in-significant (real producer prices in these two countries dropped sharply in1989, but not within the two samples). Chow tests give clear rejections ofsample homogeneity for Cameroon and Côte d’Ivoire, but not for Ghana,where full liberalization has yet to take place, or (more surprisingly) forNigeria.17
Estimates of the production equations (equation [7]) are given in table 4.4.The first set of estimates for each origin employs ordinary least squares
Globalization and International Commodity Trade 149
14. The time periods are as follows: Cameroon and Côte d’Ivoire, 1960–1961 to 1988–1989and 1990–1991 to 1998–1999; Ghana, 1964–1965 to 1988–1989 and 1989–1990 to 1999–2000;Nigeria, 1968–1969 to 1985–1986 and 1988–1989 to 1998–1999; and the ICCO, 1962–1963 to1988–1989 and 1989–1990 to 2000–2001.
15. We explored two alternative specifications for the price-expectations variables. The firstwas to allow the preliberalization expectations to be formed on the basis of actual, an-nounced, nominal-producer prices in conjunction with a rational expectation of the rate ofinflation. This specification gave a significantly inferior fit in the production equations. Thesecond alternative was to allow price expectations to be formed on the basis of the laggedworld (i.e., ICCO indicator) price in addition to the lagged domestic price. This gave qualita-tively similar results for the estimated production equations to the specification employed andwas marginally inferior in terms of fit for Cameroon, Côte d’Ivoire, and Ghana, and margin-ally superior for Nigeria.
16. An alternative would have been to use a volatility conditional on generalized autore-gressive conditional heteroscedasticity (GARCH). The only price equation that showed evi-dence of GARCH effects and was the preliberalization equation for Cameroon.
17. The differences between the two samples are more evident in the set of estimates (notreported) based on the specification that also includes the lagged world price. These estimatesshow the burden of the dependence shifting from the lagged domestic price in sample I to thelagged world price in sample II.

Tab
le 4
.3E
stim
ated
Dom
esti
c P
rice
Equ
atio
ns
Cam
eroo
nC
ôte
d’Iv
oire
Gha
naN
iger
ia
Dep
ende
nt V
aria
ble
lnP j,
tI
III
III
III
II
Con
stan
t1.
8946
5.42
882.
0176
4.87
121.
9997
2.22
731.
1496
1.42
81(2
.58)
(1.5
8)(0
.64)
(2.5
6)(1
.97)
(2.1
1)(1
.69)
(1.1
1)ln
P j,t–
10.
6404
–0.1
925
0.61
73–0
.058
70.
6085
0.29
750.
7843
0.59
76(2
.58)
(0.5
5)(5
.31)
(0.1
4)(3
.30)
(1.1
8)(5
.30)
(2.8
0)T
rend
–0.0
088
0.03
01–0
.015
30.
0073
(0.8
0)(2
.26)
(2.5
2)(0
.38)
Sam
ple
1960
–61
1990
–91
1960
–61
1990
–91
1965
–65
1989
–90
1968
–69
1987
–88
1988
–89
1999
–200
019
88–8
919
99–2
000
1988
–89
2000
–01
1985
–86
1999
–200
0N
o. o
f obs
erva
tion
s29
1029
1025
1218
13
R2
0.44
380.
0371
0.51
100.
0025
0.53
520.
5667
0.82
260.
4445
SE0.
1075
0.29
650.
0900
0.18
940.
3071
0.13
980.
1127
0.24
98D
.W.
2.00
2.01
1.93
1.83
2.00
1.84
1.60
1.60
Cho
w te
stF
(2,3
5) �
15.3
2F
(2,3
5) �
10.2
8F
(3,3
1) �
0.77
F(3
,25)
�1.
82[0
.00%
][0
.03%
][5
2.22
%]
[16.
99%
]
Not
es:t
-sta
tist
ics
in p
aren
thes
es. T
he C
how
test
test
s fo
r co
mm
on c
oeffi
cien
ts in
sam
ples
I a
nd I
I (t
ail p
roba
bilit
ies
in s
quar
e br
acke
ts).
Bla
nk c
ells
indi
cate
that
the
vari
able
is o
mit
ted
from
the
equa
tion
sp
ecifi
cati
on. S
E �
stan
dard
err
or; D
.W. �
Dur
bin
Wat
son.

Tab
le 4
.4E
stim
ates
of P
rodu
ctio
n E
quat
ions
(196
9–19
70 to
199
9–20
00)
Cam
eroo
nC
ôte
d’Iv
oire
Gha
naN
iger
ia
Dep
ende
nt V
aria
ble
lnQ
jtO
LS
FIM
LO
LS
FIM
LO
LS
FIM
LO
LS
FIM
L
Con
stan
t2.
6155
2.75
183.
0137
2.26
002.
8578
4.99
554.
2815
4.62
99(4
.61)
(7.9
1)(4
.86)
(13.
4)(1
.17)
(6.0
2)(6
.24)
(7.3
0)T
rend
–0.0
326
–0.0
361
0.06
870.
0507
–0.0
667
–0.1
114
–0.0
907
–0.0
952
(2.2
1)(2
.93)
(3.8
1)(3
.48)
(2.1
6)(4
.65)
(4.3
5)(4
.67)
Tre
nd2 /
100
0.09
810.
1110
0.01
850.
0700
0.13
950.
2204
0.14
930.
1617
(2.8
7)(4
.22)
(0.4
4)(2
.43)
(2.3
5)(4
.84)
(3.6
2)(4
.07)
Et–
1ln
P j,t
0.18
330.
1705
0.36
830.
2359
0.34
060.
3150
(1.3
2)(1
.97)
(2.2
0)(1
.59)
(2.5
2)(0
.43)
Et–
2ln
P j,t–
10.
2599
0.25
520.
2560
0.42
580.
3832
0.18
990.
1519
0.11
08(1
.80)
(2.9
2)(2
.01)
(*)
(2.3
6)(*
)(1
.14)
(*)
Ela
stic
ity
0.44
310.
4258
0.25
600.
4258
0.71
150.
4258
0.49
25F
(2,2
6)6.
918.
687.
27[0
.39%
][0
.13%
][0
.31%
]V
olat
ility
–0.2
423
–0.2
423
–0.2
423
–0.2
423
(2.8
3)(*
)(*
)(*
)
R2
0.39
400.
9733
0.83
370.
7602
SE0.
0811
0.08
710.
1104
0.11
440.
1298
0.13
340.
1445
0.14
04D
.W.
1.66
1.93
2.13
2.40
Not
es:
t-st
atis
tics
(no
t co
rrec
ted
for
gene
rate
d va
riab
le b
ias)
in p
aren
thes
es, (
*) in
dica
tes
a re
stri
cted
coe
ffici
ent;
SE
�st
anda
rd e
rror
; D.W
. �D
urbi
n W
atso
n.T
he F
-sta
tist
ic te
sts
the
join
t sig
nific
ance
of t
he tw
o ex
pec
ted
pric
e co
effici
ents
in th
e O
LS
esti
mat
es (t
ail p
roba
bilit
y in
squ
are
brac
kets
). L
ikel
ihoo
d ra
tio
test
on
FIM
L r
estr
icti
ons
�2(3
9) �
47.9
7 [1
5.4%
].

(OLS). The coefficient 23 in the Ivorian equation, where the unrestricted es-timate was negative, was set to zero. The significance of the individual-pricecoefficients for the remaining three origins is not high in every case, but thejoint significance of the two coefficients, examined by the standard F-test, ishigh. Estimated supply elasticities j3 � j4 vary from 0.26 (Côte d’Ivoire) to0.71 (Ghana).
These single-equation estimates suffer from two problems.
• They result in different supply elasticities for the different origins. It isplausible to argue that these differing estimated responses reflect sam-pling error rather than genuine differences in farmers’ behavior.
• They do not permit estimation of the volatility effects (since thevolatility variable for a single country is indistinguishable from a shiftdummy at the sample break).
We address these two problems by reestimating the model as a system us-ing full information maximum likelihood (FIML).18 The system estimatesallow us to impose the restriction of equal supply elasticities across all fourproducing countries.
(9) j3 � j4 � 13 � 14 ( j � 2, 3, 4)
It also allows us to estimate the volatility coefficients by imposing the re-strictions
(10) j5 � 15 ( j � 2, 3, 4).
The estimated equations using the FIML procedure are given in the sec-ond set of country columns in table 4.3. The (uniform) estimated supplyelasticity is 0.43, and the volatility response is estimated as –0.24, in bothcases the coefficients being significantly different from zero. A standardlikelihood-ratio test establishes that coefficient restrictions in equations (9)and (10) are acceptable.19
Ideally, we should also estimate supply elasticities for the remainder ofthe world. Unfortunately, we have not been able to obtain producer-priceseries of sufficient length for the other major origins to estimate realisticequations. This is in part a consequence of the fact that, in a liberalizedregime, domestic prices are not uniform and that there is seldom any offi-cial interest in collecting information on prices actually paid. Pursing thealternative track of specifying equations in terms of the world (ICCO indi-cator) price failed to generate a production elasticity that was either eco-
152 Christopher L. Gilbert and Panos Varangis
18. A third problem is that the standard errors in the reported OLS regressions will sufferfrom generated regressor bias (see Pagan 1984). We do not correct for this because we will beprimarily interested in the FIML estimates.
19. The most problematic restriction is that relating to the Ivorian price elasticity 24. Onemay have some confidence that the estimated volatility coefficient is indeed measuring avolatility effect due to the fact that volatility has declined in one the four origins (Ghana) inthe period since 1989, while it has increased in the remaining three origins.

nomically or statistically significant. Since it would be unreasonable tosuppose that non-African cocoa production is unresponsive to prices, wehave chosen to suppose that the estimated non-African elasticity is equalto the elasticity previously reported for the major African origins.
We also require a demand-elasticity estimate. Apparent consumption ofcocoa is referred to in the trade as grindings. We estimate a standard, log-arithmic, partial-adjustment-demand function relating aggregate worldgrindings Gt to the gross domestic product (GDP) of the industrializedcountries (GDPt ), a linear time trend, and the current-dollar world pricedeflated by the U.S. consumer price index (CPI; PWt ). The resulting esti-mates only conform moderately well with theory—there is evidence of acontinuing shift in taste toward cocoa consumption at around 2 percentper annum but no evidence that this is related to income, at least as mea-sured by GDP.20 The estimated price elasticity is relatively small at 0.19.This may seem surprising, but it should be noted that cocoa now onlymakes up between 5 percent and 10 percent, by value, of a chocolate barand even less of a chocolate-covered confectionary product. Estimation isby instrumental variables,21 treating the current world price as endoge-nous. The estimated equation is (t-statistics in parentheses)
(11) ln Gt � 4.1567 � .0100t � 0.4812 ln Gt1
(3.73) (3.88) (3.50)
� 0.5991� ln GDPt 0.0961 ln PWt
(1.71) (3.08)
Sample: 1969–1970 to 1998–1999Standard errors: 0.0266Instrument validity: �2(7) � 3.04 [88.1%]
In section 4.6, we use the estimated elasticity from this equation in con-junction with the supply-elasticity and volatility coefficient from the FIMLestimates reported in table 4.3 to evaluate the effects of globalization of thecocoa market.
4.6 Incidence—Who Benefited?
We consider two scenarios:
• Unilateral liberalization-globalization by each country consideredseparately and
• Joint liberalization by all four origins.
Globalization and International Commodity Trade 153
20. The t-statistic on the variable ln GDPt, dropped from equation, was 0.19.21. We use as instruments the exogenous variables included in the production equations.
These are the current and lagged expected producer prices in the four west African origins(only the lagged expected price for Côte d’Ivoire was dropped since the current price was in-correctly signed from the Ivorian production equation) and the quadratic trend.

As discussed in section 4.3, the actual liberalization process was less clear-cut than this and indeed is still incomplete; globalization has—to some ex-tent—anticipated full liberalization.
Table 4.5 collects together the parameter values that we use in the inci-dence calculations. We do this in conjunction with equation (4) to estimatethe effects of unilateral and joint (multilateral) liberalization, which are re-ported in table 4.6. The small-country assumption appears reasonable forCameroon and Nigeria, where liberalization is seen as having depressedthe world price by 3 percent in each case, but not for Côte d’Ivoire, whereliberalization is seen as reducing the world price by 10 percent. Ghana,where liberalization would push the world price down by 5 percent, is in-termediate. It is notable that Nigeria and Cameroon were the first majorAfrican cocoa producers to liberalize and that liberalization was resistedin Ghana and Côte d’Ivoire, where the spillover effects onto the world priceare larger. The impact of increased volatility on the world price is seen assmall but nonnegligible. Turning to the multilateral liberalization, theworld price is seen as falling by 20 percent in conjunction with a weighted-average rise in African producer prices of 76 percent.
The global-welfare impact of these changes may be analyzed by refer-ence to figure 4.6, which has the world price on its vertical axes. The first
154 Christopher L. Gilbert and Panos Varangis
Table 4.5 Parameter Values
Côte WeightedCameroon d’Ivoire Ghana Nigeria Average Source
� increase in producers’ share of world price (%) 83 73 72 87 75 Table 4.2
ε production elasticity 0.45 0.45 0.45 0.45 0.45 Table 4.4� demand elasticity 0.19 0.19 0.19 0.19 0.19 Equation (11)� increase in price volatility (%) 32.2 13.7 –14.8 14.8 9.0 Figure 4.4� volatility semi-elasticity 0.24 0.24 0.24 0.24 0.24 Table 4.4 share of liberalizing countries 5.6 30.9 11.2 6.1 53.7 1985–86 to
in world production (%) (total) 1989–90
Table 4.6 Impacts of Unilateral and Multilateral Liberalization (%)
Côte MultilateralCameroon d’Ivoire Ghana Nigeria Impact
Producer price shock 95.0 56.8 66.8 84.4Unilateral impact on
world price –3.7 –12.4 –4.2 –3.3 –20.0Impact of volatility shock 0.7 1.6 –0.6 0.3 2.0Total unilateral impact –3.0 –10.8 –4.8 –3.0 –19.3Net unilateral price rise 91.6 50.6 64.1 81.7Net multilateral price rise 59.5 36.2 39.1 51.1
Notes: Calculated using parameter values given in table 4.5. Blank cells indicate that noeffects are calculated.

Fig
. 4.6
Wel
fare
ana
lysi
s: (a
),N
on-A
fric
an s
uppl
y; (b
),A
fric
an s
uppl
y; (c
),W
orld
sup
ply
and
dem
and

panel (a) shows the non-African supply curve SR, while the second panel(b) displays the preliberalization African supply curve SA, which is abovethe marginal cost curve CA by the taxation wedge. The producer price is PA.The initial world price is P but this falls to P� after liberalization.
We see liberalization as shifting the marginal-cost curve in the liberaliz-ing economy down to CCA through cost reductions and as eliminating thetax wedge. This shifts the postliberalization supply function to SSA, whichis coincident to the new marginal cost schedule CCA. The producer price isshown as rising to PA�.22 World supply SW is the horizontal sum of SA and SR
(QW � QA � QR), which becomes SSW after liberalization (see panel [c]). Theworld-demand curve is DW. Production in the nonliberalizing economiesfalls from QR to QR�, and consumption rises from QW to QW�. Ignoring thecomplicating factor of price volatility, welfare changes are as follows.
Farmers in nonliberalizing economies: –AGovernments of liberalizing economies: – (C � D � E � F )Farmers in liberalizing economies: E � F � G � H � I � JConsumers: K � L � M
Provided we count one dollar to an African government as equivalent toone dollar to an African farmer, the net benefit to the liberalizing countryis (G � H ) � (I � J ) – (C � D). The country benefits in net terms so longas the efficiency gains (I � J ) exceed the transfer to foreign consumers (C� D). With the same assumption and noting that A � C � K and B � D �L, the net world benefit is B � (G � H ) � (I � J ) � M. Triangle B is theefficiency gain from substituting low-cost cocoa in the liberalizing econ-omies for higher-cost cocoa in the rest of the world; rectangle G � H is thecost reduction on the original quantity QA in the liberalizing economies;23
triangles I � J represent the efficiency gain from cost reduction in theliberalizing countries; and triangle M is additional consumer surplus aris-ing from the lower world price.
We evaluate these quantities using the parameters displayed in table 4.5and in relation to average price and production levels for the period 1985–1986 to 1989–1990 (i.e., prior to the impact of all the liberalizations exceptthat of Nigeria). The effect of liberalization-globalization on the worldprice is obtained by numerical solution of the production and consump-tion equations through the market-clearing identity. The results of this ex-ercise are given in table 4.7 (unilateral, country-by-country liberalization)and table 4.8 (multilateral liberalization and globalization by the fourAfrican cocoa-producing countries). Table 4.9 gives a break down of theestimated efficiency gains.
156 Christopher L. Gilbert and Panos Varangis
22. If the cost reduction is large relative to the tax reduction, PA� can be beneath PA.23. One might argue that G � H is not entirely a benefit to the liberalizing economy if the
resources liberated by the cost reduction do not find alternative use.

Considering first the unilateral liberalization calculations (table 4.7), themajor effect is a transfer of resources from government to farmers. Farm-ers benefit most in Côte d’Ivoire (nearly $500 million per annum), followedby Ghana (nearly $225 million per annum) and then Cameroon and Nige-ria (around $125 million per annum). These benefits are in proportion tothe size of the respective producing sectors. However, they are offset bygovernmental losses of tax revenue, which are of the same order of magni-tude, so the net dollar benefits to the countries are much smaller—a littleless than $40 million on an annual basis for each of Cameroon, Côted’Ivoire, and Nigeria, and a little more than $55 million for Ghana.24 TheIvorian benefits are relatively modest since the producer price is seen as ris-
Globalization and International Commodity Trade 157
Table 4.8 Incidence of Multilateral Liberalization and Globalization Benefits (annual $US millions)
Côte Africa Other TotalCameroon d’Ivoire Ghana Nigeria Total Producers Consumers World
Benefit to farmers 92.3 382.8 154.8 83.5 713.4
Benefit to government –92.7 –446.5 –164.6 –89.7 –793.4
Total benefit –0.3 –63.8 –9.8 –6.1 –80.0 –315.8 730.2 334.4Total benefit
(%) –0.2 –5.7 –2.4 –2.9 –4.1 –18.6 20.1 9.2
Notes: Parameter values as in table 4.5. Prices and quantities are averages of 1985–1986 to 1989–1990.Percentage benefit is relative to average revenues or expenditures over that period. Blank cells indicatethat no effects are calculated.
Table 4.7 Incidence of Unilateral Liberalization Benefits (annual $US millions)
Relation to CôteFigure 4.6 Cameroon d’Ivoire Ghana Nigeria
Benefit to farmers E � F � G � H � I � J – N 130.8 486.3 221.4 126.8Benefit to government –(C � D � E � F ) –92.7 –446.5 –164.6 –89.7Total producing
country benefit (G � H ) � (I � J ) – (C � D) – N 38.2 39.8 56.8 37.1
Benefit to other African producers A (part) –53.2 –89.3 –74.7 –52.3
Benefit to non-African producers A (part) –51.2 –180.6 –81.2 –50.8
Benefit to consumers K � L � M 111.8 404.6 178.3 110.9Total world benefit B � G � H � I �J �M – N 45.5 174.6 79.1 44.9
Notes: Parameter values as in table 4.5. Area N is not identifiable on figure 4.6.
24. If one were to take the view that one dollar to a government is worth less than one dol-lar to a smallholder farmer, then the producing countries would benefit more substantially.
158 Christopher L. Gilbert and Panos Varangis
Table 4.9 Analysis of Efficiency Gains (annual $US millions)
Unilateral
Cameroon Côte d’Ivoire Ghana Nigeria Multilateral
Allocation gainsLiberalizing producers 15.0 32.8 19.2 14.7 57.8Other producers 0.7 6.9 1.7 0.7 15.2Consumers 0.3 4.4 0.8 0.3 14.9
Cost reductions 30.9 148.8 54.9 29.9 264.5Volatility costs –1.4 –18.3 2.6 –0.8 –17.9
Total 45.5 174.6 79.1 44.9 334.4
ing by less than in the other origins (the preliberalization level was higher),and the price rise is dissipated to a greater extent through a fall in the worldprice. Consumers, who are predominantly in the developed economies, areseen as major beneficiaries, particularly from an Ivorian liberalization,while nonliberalizing producers lose heavily. Total world benefits are mod-est and in broad proportion to sectoral size—around $45 million annuallyfrom Cameroonian and Nigerian liberalizations, $80 million from Ghana-ian liberalization, and $175 million from Ivorian liberalization. They aredominated by the transfer benefits both within the liberalizing economy(from the government to farmers) and from nonliberalizing producers toconsumers.
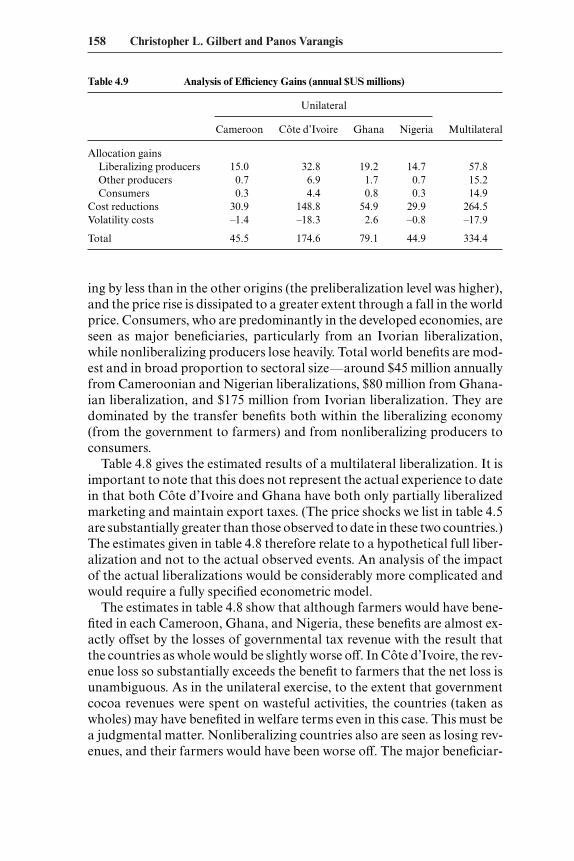
Table 4.8 gives the estimated results of a multilateral liberalization. It isimportant to note that this does not represent the actual experience to datein that both Côte d’Ivoire and Ghana have both only partially liberalizedmarketing and maintain export taxes. (The price shocks we list in table 4.5are substantially greater than those observed to date in these two countries.)The estimates given in table 4.8 therefore relate to a hypothetical full liber-alization and not to the actual observed events. An analysis of the impactof the actual liberalizations would be considerably more complicated andwould require a fully specified econometric model.
The estimates in table 4.8 show that although farmers would have bene-fited in each Cameroon, Ghana, and Nigeria, these benefits are almost ex-actly offset by the losses of governmental tax revenue with the result thatthe countries as whole would be slightly worse off. In Côte d’Ivoire, the rev-enue loss so substantially exceeds the benefit to farmers that the net loss isunambiguous. As in the unilateral exercise, to the extent that governmentcocoa revenues were spent on wasteful activities, the countries (taken aswholes) may have benefited in welfare terms even in this case. This must bea judgmental matter. Nonliberalizing countries also are seen as losing rev-enues, and their farmers would have been worse off. The major beneficiar-

ies would have been consumers in the developed-market economies, whowould have benefited to the order of $725 million per annum, around 20percent of their cocoa expenditures.
The analysis of the net efficiency gains reported in table 4.9 shows thatcost reductions consequential on liberalization are the major source of netbenefit. We have supposed that 25 percent of the increase in the producer-price share may be attributed to cost reductions, but we acknowledge thatthis figure is highly conjectural. Allocational gains in the liberalizingeconomies are the next largest item. These arise from elimination of the taxwedge between the producer price and marginal-production costs. Alloca-tional gains in consuming and nonliberalizing producer countries aresmall, reflecting low elasticities. The increased volatility arising out of glob-alization imposes only small costs, except in Côte d’Ivoire.
These exercises assume that liberalizing governments totally eliminateexport taxes. The unilateral liberalization exercise reported in table 4.7shows that Cameroon, Ghana, and Nigeria all benefit from increasing pro-duction and would therefore lose revenues from export taxes. In Côted’Ivoire, the net benefit is small in relation to production, implying thatrevenues would be broadly unaffected by restricting production. The re-sults of the multilateral exercise reported in table 4.8 further show that thefour African producers would all benefit substantially from a coordinatedrestriction of production. This must be subject to the qualifications thatprolonged periods of high prices may provoke new production in othercountries (including countries that are not currently significant cocoa ex-porters) and that the conclusion will not follow if government revenues areless highly valued than farmers’ incomes. However, our model, which isspecified as having isoelastic demand and supply functions, is not wellsuited to the calculation of optimal export taxes.
4.7 Conclusions
Donor agents and the developed-country governments have exertedconsiderable pressure on African producers of tropical export crops to lib-eralize their internal marketing systems for these products. They have alsopressed for the elimination or reining back of intertemporal and interre-gional stabilization schemes, which were seen as responsible for fiscal ex-cess and manifest waste. The major objective of these liberalization pro-grams has been to ensure that farmers obtain a higher share in the f.o.b.prices for which the crop is sold at the ports.
Globalization of these markets is a direct consequence of liberaliza-tion—the prices in the now liberalized markets move substantially moreclosely together than did the preliberalized prices so that the world pricehas become the effective pricing basis in the producing as well as the con-
Globalization and International Commodity Trade 159

suming countries. Globalization has two unsought consequences for pro-ducing countries:
• The prices received by farmers have become more volatile (except inGhana, where the nominal price stabilization had been counter pro-ductive).
• The effects of one country’s actions in the market have a much moredirect impact on farmers in other producing countries than previously.
This second aspect of globalization is the cause of the adding-up problem.A cost-reducing market liberalization in a small producing country raisesthe share of the world price obtained by farmers and has a negligible effecton the world price itself. However, if a country with a large share of theworld market liberalizes, this will shift the world-supply curve to the rightand, in conjunction with highly inelastic demand, will depress the worldprice. Farmers will then find that they obtain a larger share of a lower price.The same is true if one considers multilateral liberalization in a large groupof individually small producers.
Cocoa is produced entirely in developing countries and largely in westAfrica, where a system of internal market regulation inherited from colo-nial governments prevailed until the late 1980s. In our view, these unin-tended consequences of globalization are likely to be more apparent in thecocoa market than in any other commodity market. The first African pro-ducers to liberalize their internal cocoa-marketing systems were Nigeria in1986 and Cameroon in 1989–1995, both of which had small shares inworld exports. Adding-up effects were therefore unimportant. In 1999, af-ter a long period of pressure, the donors pushed Côte d’Ivoire, the largestproducer with one-third of world production, into reluctant liberalization.Ghana, which is also a significant producer, still maintains significant con-trols. If both of these producers fully liberalize their markets, the impacton the world price will be significant. Our calculations indicate that theworld price would fall in total by around one third of the rise in producerprices calculated on a constant world-price basis. This figure reflects theinelasticity of demand and the high market share of the African produc-ers.
Despite the projected fall in the world cocoa price, African farmers dobenefit from liberalization, so in that sense the liberalization programsachieve their intended objective. However, these benefits are largely theconsequence of a transfer from governments to farmers. The net dollarbenefit to the country is positive for a country that liberalizes unilaterally,but the depressing effect on the world price is such that these benefits be-come negative if all four African cocoa-producing countries liberalize. Forthis reason, consumers, most of whom live in the developed-marketeconomies, turn out to be the major beneficiaries from lower cocoa prices.The scale of this benefit is substantial. The losers are non-African farmers
160 Christopher L. Gilbert and Panos Varangis

and the governments (and hence the taxpayers) of the African producingcountries. The overall efficiency gains to the world are dominated by costreductions consequent on liberalization, but it is difficult to be confidentabout the size of these gains.
One reaction to these results would be to argue that producing countriesare better advised not to liberalize their agricultural-export sectors, andthere are many who have taken this position. We regard this view as illadvised. First, the policy is not obviously feasible since individual produc-ing countries each do have an incentive to liberalize. (In cocoa, this incen-tive is relatively small for Côte d’Ivoire.) The result is a classic Prisoners’Dilemma in which the cooperative nonliberalization equilibrium is notsustainable. But even if the African producers were able to devise an en-forcement mechanism to support the nonliberalization equilibrium, theywould be unable to prevent increased production elsewhere, includingfrom countries that are currently not major cocoa exporters. Furthermore,to the extent that liberalization does significantly reduce production costs,intermediation costs or both (and we have discussed some evidence thatsuggests this is the case), nonliberalizing producers will find that any com-petitive advantage they currently possess will be steadily eliminated.
The development agencies have tended to see liberalization as a meansof redistributing resources back to farmers. We have shown, however, thatthe incidence of the long-run benefits of liberalization is predominantly fordeveloped-country consumers. It is therefore essential that liberalizationshould be accompanied by policies that attempt to redress the unfavorableredistributive effects arising from global liberalization.
Our thesis is not about market liberalization per se, but about the globalimpact of multilateral liberalizations by a group of commodity-producingcountries responsible for a large share of the world market. Liberalizationbenefits each country taken individually; but, with inelastic demand, mul-tilateral liberalization shifts the benefits away from the producers and to-ward the consumers. At the country level, primary-producing developingcountries will feel that they have been cheated if, collectively, they do notreceive a significant share of the benefits. Political support for liberaliza-tion will depend on the distribution of the gains both within the producingcountries themselves and on a global level. Governments need to applycomplementary policies to accompany liberalization, and the interna-tional agencies should be prepared to advise and assist in this process.
Clearly, one case study is insufficient to allow generalizations aboutglobalization even in the primary sector. Furthermore, we have focused oncocoa as presenting what is possibly the most extreme case of an adversedistributional impact. We hope that our analysis and results will shed lighton the globalization process affecting all primary-commodity markets andprovide a benchmark against which other commodity markets and coun-tries might be compared.
Globalization and International Commodity Trade 161
References
Akiyama, T., J. Baffes, D. Larson, and P. Varangis. 2001. Market reforms: lessonsfrom country and commodity experiences. In Commodity market reforms:Lessons from two decades, ed. T. Akiyama, J. Baffes, D. Larson, and P. Varangis,5–34. Washington, D.C.: World Bank.
Akiyama, T., and D. Larson. 1994. The adding-up problem: Strategies for primarycommodity exports in sub-Saharan Africa. Policy Research Paper no. 1245.Washington, D.C.: World Bank.
Bates, R. H. 1989. The reality of structural adjustment: A skeptical appraisal. InStructural adjustment and agriculture: Theory and practice in Africa and LatinAmerica, ed. S. Commander, 221–227. London: Overseas Development Insti-tute.
Bhagwati, J. 1958. Immiserizing growth: A geometrical note. Review of EconomicStudies 25, 201–05.
Engberg-Pederson, P., P. Gibbon, P. Raikes, and L. Udshott. 1996. Limits of ad-justment in Africa: The effects of economic liberalization 1986–94. Portsmouth,N.H.: Heinemann.
Evenson, R. E. 2002. Technology and prices in agriculture. Yale University, De-partment of Economics. Manuscript.
Gilbert, C. L. 1987. International commodity agreements: design and perfor-mance. World Development 15, 591–616.
———. 1996. International commodity agreements: an obituary notice. World De-velopment 24, 1–19.
———. 1997. Cocoa market liberalization. London: Cocoa Association of London.———. 2002. Commodity risk management: preliminary lessons from the Inter-
national Task Force. In Resource management in Asia Pacific developing coun-tries, ed. R. Garnault, 39–69. Canberra: Asia Pacific Press.
Gilbert, C. L., and E. Tollens. 1999. Effets de la libéralisation dans les sous-secteurscafé-cacao au Cameroun (Effects of liberalization in the Cameroonian Cocoa-Coffee Sector). Vol. 1. Yaoundé, Cameroon: European Commission.
———. 2003. Does market liberalization jeopardize export quality? Camerooniancocoa, 1985–2000. Journal of African Economics.
Gilbert, C. L., and J. ter Wengel. 2001. The production and marketing of primarycommodities. In Commodities and development at the turn of the Millennium, 21–62. Amsterdam: Common Fund for Commodities.
International Cocoa Organization (ICCO). 2002. Quarterly Bulletin of Cocoa Sta-tistics, Cocoa Year 1999–2000. 26 (3). London: ICCO.
International Monetary Fund (IMF). 2001. International financial statistics. Wash-ington, D.C.: IMF.
Johnson, H. G. 1953. Equilibrium growth in an international economy. CanadianJournal of Economics and Political Science 19, 478–500.
———. 1958. International trade and economic growth. London: George Allen andUnwin.
Kanbur, S. M. R. 1984. How to analyse commodity price stabilisation: A review ar-ticle. Oxford Economic Papers 36, 336–58.
Krishna, K. 1995. The adding-up problem: A targeting approach. NBER WorkingPaper no. 4999. Cambridge, Mass.: National Bureau of Economic Research,January.
McIntire, J., and P. Varangis. 1999. Reforming Côte d’Ivoire’s Cocoa Marketingand Pricing System, World Bank Policy Research Working Paper no. 2081.Washington, D.C.: World Bank.
162 Christopher L. Gilbert and Panos Varangis
Pagan, A. R. 1984. Econometric issues in the analysis of regressions with generatedregressors. International Economic Review 25, 221–47.
Paxson, C. 1993. Consumption and income seasonality in Thailand. Journal of Po-litical Economy 101, 39–72.
Ruf, F., and H. de Milly. 1990. Comparison of cocoa production costs in seven pro-ducing countries. Paper presented at the International Cocoa Organization(ICCO) Advisory Group on the World Economy. 18–20 June, Accra, Ghana.
Schiff, M. 1994. Commodity exports and the adding-up problem in developingcountries: Trade, investment, and lending policy. Policy Research Working Pa-per no. 1338. Washington, D.C.: World Bank.
Varangis, P., and G. Schreiber. 2001. Cocoa market reforms in West Africa. InCommodity market reforms: Lessons from two decades, ed. T. Akiyama, J. Baffes,D. Larson, and P. Varangis, 35–82. Washington, D.C.: World Bank.
Williams, G. 1985. Marketing with and without marketing boards: The origin ofstate marketing boards—Nigeria. Review of African Political Economy 34, 4–15.
World Bank. 1994. Adjustment in Africa. New York: Oxford University Press.
Comment Joshua Aizenman
This interesting paper deals with a case study of the effects of liberalizingthe cocoa market. The facts that make this study interesting are that cocoais produced exclusively by developing countries. The demand for cocoa isrelatively inelastic. The major suppliers are located in Africa. Hence, thiscase study provides insight into the challenges facing attempts to liberalizethe production of major crops and commodities that are frequently domi-nated by the supply of developing countries.
The objective of the liberalization was to increase farmers’ share of thecrop’s prices. Prior to the liberalization, most farmers obtained artificiallylow prices for their crops as part of the operation of schemes intended totax exports, either for the direct benefit of the taxpayer or for the indirectbenefits of the holders of the quasi rent generated by this tax.
The liberalization was initiated by countries that are minor players in theglobal market: Nigeria in 1986, and Cameroon in 1989–1995. The largestproducer, Ivory Coast (counting for one-third of the global share), liberal-ized in 1999. Ghana, another large producer, still maintains controls.
By-products of the liberalization have been the following:
• The domestic price facing farmers moved closer to the internationalprice.
• The prices facing farmers are more volatile.• Global supply rose, thereby reducing the global prices.• Farmers are getting a greater share of a lower global price.
Globalization and International Commodity Trade 163
Joshua Aizenman is professor of economics at the University of California, Santa Cruz,and a research associate of the National Bureau of Economic Research.

The paper conducts an estimation of the global market for cocoa, and asimulation in order to evaluate two scenarios: unilateral liberalization byeach country separately, and joint liberalization by all four countries. Theestimated effects are as follows:
• African governments in the producing countries are worse off.• African farmers and world consumers are better off.• The losers are non-African farmers, and the agents in Africa that ben-
efited from the quasi rents prior to the liberalization (taxpayers, agen-cies, etc.).
• Multilateral liberalization would imply that the gains of the farmers inthe liberalized countries would be almost exactly offset by the losses ofgovernmental tax revenue, with the result that the countries as a wholeshould be slightly worse off. To the extent that government cocoa rev-enues were spent on wasteful activities, the countries, taken as wholes,will have benefited in welfare terms even in this case.
• The world price would fall by about one-third of the rise in producerprices. The major beneficiaries would have been the consumers in theimporting OECD countries, who would have benefited on the order of20 percent of their cocoa expenditure (about $0.7 billion per annum).
164 Christopher L. Gilbert and Panos Varangis
Fig. 4C.1 Optimal export tax for the African producers, and the welfare cost of liberalizationNotes: For simplicity, we assume a negligible share of domestic consumption of the majorsupplies of Cocoa in Africa. Right-hand side: global demand and non-African supply of co-coa. Left-hand side: the market for cocoa facing the African countries. Price A � world pricebefore liberalization; Price C � price paid to farmers before liberalization; A – C � export taxprior to liberalization; and Price B � price paid to farmers after liberalization � world priceafter liberalization. The rectangle is the tax revenue lost following liberalization; the trapezoidis the farmers’ gain following liberalization; and the triangle is the welfare cost of liberaliza-tion to African countries.

Ignoring coordination costs and rent seeking, the optimal policy for theAfrican cocoa producers is to impose an export tax. This is a classical ap-plication of the market power enjoyed by the “cartel” of cocoa producers.As farmers are atomistic, the optimal policy requires an export tax, or theadaptation of institutions that would deliver a similar outcome. Figure4C.1 summarizes this argument. For simplicity, it is drawn for the casewhere the share of domestic cocoa consumption is negligible relative to thesupply of the African exporting nations. The right-hand side plots theworld demand (W. D.) and the supply of the non-African producers(N. A. S.). The left-hand side focuses on the situation confronting theAfrican exporters. The derived demand facing these exports is obtained bythe horizontal subtraction W. D. – N. A. S. The marginal revenue curvecorresponding to the derived demand is MR. The competitive supply ofcocoa of the African countries is the upward-sloping curve. The optimalpolicy for the African cocoa-producing countries is to restrict the supplyto the level where the marginal cost equals the marginal revenue. This canbe accomplished by imposing an export tax of A – C. Such a tax will artifi-cially depress the prices facing the farmers, to the benefit of the tax au-thorities. A complete liberalization will eliminate the tax revenue (given bythe rectangle corresponding to the tax A – C), and will increase farmers’rents by the trapezoid. The net welfare effect is the difference between thetwo, as is captured by the shaded triangle. Starting from the optimal tax,the liberalization reduces welfare. The main beneficiaries are the worldconsumers, benefiting by about $0.7 billion dollars a year.
Secondary beneficial effects of the liberalization may include a drop inrent seeking associated with the “tax rectangle.” An issue that deserves fur-ther attention is to what degree such benefits had been observed in the re-forming countries. Indeed, one wonders why the African countries wouldnot link the liberalization process with foreign aid (AIDS funds, education,etc.).
Globalization and International Commodity Trade 165
