globalisation, transport and the environment
DESCRIPTION
Libro OCDETRANSCRIPT
www.oecd.org/publishing
ISBN 978-92-64-07290-9 97 2009 10 1 P -:HSTCQE=U\W^U^:
Globalisation, Transport and the EnvironmentWhat impact has globalisation had on transport? And what have been the consequences for the environment? This book aims to answer these questions and more. It looks in detail at how globalisation has affected activity levels in maritime shipping, aviation, and road and rail freight, and assesses the impact that changes in activity levels have had on the environment. The book also discusses policy instruments that can be used to address negative environmental impacts, both from an economic perspective and from the point of view of international law.
Related reading
Environmental Outlook to 2030 (2008)
The Economics of Climate Change Mitigation: Policies and Options for a Post-Kyoto Global Action Plan (2009)
The full text of this book is available on line via these links: www.sourceoecd.org/environment/9789264072909 www.sourceoecd.org/transport/9789264072909
Those with access to all OECD books on line should use this link: www.sourceoecd.org/9789264072909
SourceOECD is the OECD online library of books, periodicals and statistical databases. For more information about this award-winning service and free trials, ask your librarian, or write to us at [email protected].
GLOBALISATION
environment transport
TRANSPORT ENVIRONMENT
transport globalisation environment
ENVIRONMENT GLOBALISATION TRANSPORT
globalisation environment transport globalisation environment transport
GLOBALISATION TRANSPORT ENVIRONMENT GLOBALISATION TRANSPORT ENV
environment transport globalisation environment transport globalisation environment transport globalisation
TRANSPORT ENVIRONMENT GLOBALISATION TRANSPORT ENVIRONMENT GLOBALISATION TRANSPORT ENVIRONMENT GLOB
transport globalisation environment transport globalisation environment transport globalisation environment transport globalisation enviro
ENVIRONMENT GLOBALISATION TRANSPORT ENVIRONMENT GLOBALISATION TRANSPORT ENVIRONMENT GLOBALISATION TRA
globalisation environment transport globalisation environment transport globalisation environment transport globalisation environment trans
GLOBALISATION TRANSPORT ENVIRONMENT GLOBALISATION TRANSPORT ENVIRONMENT GLOBALISATION TRANSPORT ENVI
environment transport globalisation environment transport transport globalisation environment transport globalisation environment transpo
TRANSPORT ENVIRONMENT GLOBALISATION TRANSPORT ENVIRONMENT GLOBALISATION TRANSPORT ENVIRONMENT GLOBA
globalisation environment transport globalisation environment transport globalisation environment transport globalisation environment trans
ENVIRONMENT GLOBALISATION TRANSPORT ENVIRONMENT GLOBALISATION TRANSPORT ENVIRONMENT GLOBALISATION TRA
environment transport globalisation environment transport globalisation environment transport globalisation environment transport globalisa
GLOBALISATION TRANSPORT ENVIRONMENT GLOBALISATION TRANSPORT ENVIRONMENT GLOBALISATION TRANSPORT ENVIR
transport globalisation environment transport globalisation environment transport globalisation environment transport globalisation environm
TRANSPORT ENVIRONMENT GLOBALISATION TRANSPORT ENVIRONMENT GLOBALISATION TRANSPORT ENVIRONMENT GLOBA
globalisation environment transport globalisation environment transport globalisation environment transport globalisation environment trans
ENVIRONMENT GLOBALISATION TRANSPORT ENVIRONMENT GLOBALISATION TRANSPORT ENVIRONMENT GL
environment transport globalisation environment transport globalisation environment transport globalis
GLOBALISATION TRANSPORT ENVIRONMENT GLOBALISATION TRANSPORT E
transport globalisation environment transport globalisation enviroi
TRANSPORT ENVIRONMENT GLOBALISATIO
globalisation environment tran
Globalisation, Transport and the Environment
Glo
balisatio
n, Transpo
rt and the E
nvironm
ent

Globalisation, Transport and the Environment
ORGANISATION FOR ECONOMIC CO-OPERATION AND DEVELOPMENT
The OECD is a unique forum where the governments of 30 democracies work together to
address the economic, social and environmental challenges of globalisation. The OECD is also at
the forefront of efforts to understand and to help governments respond to new developments and
concerns, such as corporate governance, the information economy and the challenges of an
ageing population. The Organisation provides a setting where governments can compare policy
experiences, seek answers to common problems, identify good practice and work to co-ordinate
domestic and international policies.
The OECD member countries are: Australia, Austria, Belgium, Canada, the Czech Republic,
Denmark, Finland, France, Germany, Greece, Hungary, Iceland, Ireland, Italy, Japan, Korea,
Luxembourg, Mexico, the Netherlands, New Zealand, Norway, Poland, Portugal, the Slovak Republic,
Spain, Sweden, Switzerland, Turkey, the United Kingdom and the United States. The Commission of
the European Communities takes part in the work of the OECD.
OECD Publishing disseminates widely the results of the Organisation’s statistics gathering and
research on economic, social and environmental issues, as well as the conventions, guidelines and
standards agreed by its members.
ISBN 978-92-64-07919-9 (print)ISBN 978-92-64-07291-6 (PDF)
Also available in French: Mondialisation, transport et environnement
Corrigenda to OECD publications may be found on line at: www.oecd.org/publishing/corrigenda.
© OECD 2010
You can copy, download or print OECD content for your own use, and you can include excerpts from OECD publications, databases and multimedia
products in your own documents, presentations, blogs, websites and teaching materials, provided that suitable acknowledgment of OECD as source
and copyright owner is given. All requests for public or commercial use and translation rights should be submitted to [email protected]. Requests for
permission to photocopy portions of this material for public or commercial use shall be addressed directly to the Copyright Clearance Center (CCC)
at [email protected] or the Centre français d’exploitation du droit de copie (CFC) at [email protected].
This work is published on the responsibility of the Secretary-General of the OECD. The
opinions expressed and arguments employed herein do not necessarily reflect the officialviews of the Organisation or of the governments of its member countries.

FOREWORD
Foreword
What impact has globalisation had on transport? And what have been the consequences for the
environment? This book analyses these issues in detail. It is based on a series of papers prepared for
an OECD/ITF Global Forum on Transport and Environment in a Globalising World, held in
Guadalajara, Mexico, 10-12 November 2008 (see www.oecd.org/env/transport/GFSD). The
original papers have been updated and edited, primarily in order to avoid overlap from chapter to
chapter, and have been brought together in this volume to provide policy makers with a
comprehensive overview of the interactions between globalisation, transport and the environment.
This book looks in detail at how globalisation has affected activity levels in maritime shipping,
aviation, and road and rail freight, and assesses the impact that changes in activity levels have had
on the environment. The book also discusses policy instruments that can be used to address negative
environmental impacts, both from an economic perspective and from the point of view of
international law.
It is emphasised that the main research for all the chapters was carried out prior to the sharp
deterioration of the global economic situation in the autumn of 2008. The economic recession has,
inter alia, lead to an unprecedented contraction of international trade.
The editing of the chapters was done by Nils Axel Braathen of OECD’s Environment Directorate.
OECD and ITF would like to thank the Mexican authorities for having hosted the Global Forum.
GLOBALISATION, TRANSPORT AND THE ENVIRONMENT © OECD 2010 3

TABLE OF CONTENTS
Table of Contents
Acronyms . . . . . . . . . . . . . . . . . . . . . . . . . . . . . . . . . . . . . . . . . . . . . . . . . . . . . . . . . . . . . . . . . . 11
Executive Summary . . . . . . . . . . . . . . . . . . . . . . . . . . . . . . . . . . . . . . . . . . . . . . . . . . . . . . . . . 13
Chapter 1. Introduction and Main Findings . . . . . . . . . . . . . . . . . . . . . . . . . . . . . . . . . . . . 19
1.1. Introduction . . . . . . . . . . . . . . . . . . . . . . . . . . . . . . . . . . . . . . . . . . . . . . . . . . . . . . . 20
1.2. Main findings . . . . . . . . . . . . . . . . . . . . . . . . . . . . . . . . . . . . . . . . . . . . . . . . . . . . . . 20
References . . . . . . . . . . . . . . . . . . . . . . . . . . . . . . . . . . . . . . . . . . . . . . . . . . . . . . . . . . . . . . 29
Chapter 2. Globalisation’s Direct and Indirect Effects on the Environment. . . . . . . . . . 31
2.1. Introduction . . . . . . . . . . . . . . . . . . . . . . . . . . . . . . . . . . . . . . . . . . . . . . . . . . . . . . . 32
2.2. Growth of trade and FDI . . . . . . . . . . . . . . . . . . . . . . . . . . . . . . . . . . . . . . . . . . . . . 32
2.3. Early research . . . . . . . . . . . . . . . . . . . . . . . . . . . . . . . . . . . . . . . . . . . . . . . . . . . . . . 33
2.4. Indirect effects . . . . . . . . . . . . . . . . . . . . . . . . . . . . . . . . . . . . . . . . . . . . . . . . . . . . . 33
2.5. Composition effect . . . . . . . . . . . . . . . . . . . . . . . . . . . . . . . . . . . . . . . . . . . . . . . . . 34
2.6. Global net composition effect . . . . . . . . . . . . . . . . . . . . . . . . . . . . . . . . . . . . . . . . 37
2.7. The technique effect . . . . . . . . . . . . . . . . . . . . . . . . . . . . . . . . . . . . . . . . . . . . . . . . 38
2.8. Scale effect . . . . . . . . . . . . . . . . . . . . . . . . . . . . . . . . . . . . . . . . . . . . . . . . . . . . . . . . 43
2.9. Globalisation and the environment – Direct effects . . . . . . . . . . . . . . . . . . . . . . 44
2.10. Conclusions . . . . . . . . . . . . . . . . . . . . . . . . . . . . . . . . . . . . . . . . . . . . . . . . . . . . . . . 46
Notes . . . . . . . . . . . . . . . . . . . . . . . . . . . . . . . . . . . . . . . . . . . . . . . . . . . . . . . . . . . . . . . . . . 47
References . . . . . . . . . . . . . . . . . . . . . . . . . . . . . . . . . . . . . . . . . . . . . . . . . . . . . . . . . . . . . . 49
Chapter 3. International Maritime Shipping: The Impact of Globalisationon Activity Levels . . . . . . . . . . . . . . . . . . . . . . . . . . . . . . . . . . . . . . . . . . . . . . . . . 55
3.1. Introduction . . . . . . . . . . . . . . . . . . . . . . . . . . . . . . . . . . . . . . . . . . . . . . . . . . . . . . . 56
3.2. Global economic role of maritime shipping. . . . . . . . . . . . . . . . . . . . . . . . . . . . . 57
3.3. Maritime transformations responding to globalisation . . . . . . . . . . . . . . . . . . . 60
3.4. Maritime shipping activity . . . . . . . . . . . . . . . . . . . . . . . . . . . . . . . . . . . . . . . . . . . 64
3.5. Future developments. . . . . . . . . . . . . . . . . . . . . . . . . . . . . . . . . . . . . . . . . . . . . . . . 73
3.6. Conclusions . . . . . . . . . . . . . . . . . . . . . . . . . . . . . . . . . . . . . . . . . . . . . . . . . . . . . . . 76
Notes . . . . . . . . . . . . . . . . . . . . . . . . . . . . . . . . . . . . . . . . . . . . . . . . . . . . . . . . . . . . . . . . . . 77
References . . . . . . . . . . . . . . . . . . . . . . . . . . . . . . . . . . . . . . . . . . . . . . . . . . . . . . . . . . . . . . 77
Chapter 4. International Air Transport: The Impact of Globalisationon Activity Levels . . . . . . . . . . . . . . . . . . . . . . . . . . . . . . . . . . . . . . . . . . . . . . . . . 81
4.1. Introduction . . . . . . . . . . . . . . . . . . . . . . . . . . . . . . . . . . . . . . . . . . . . . . . . . . . . . . . 82
4.2. Globalisation and internationalisation. . . . . . . . . . . . . . . . . . . . . . . . . . . . . . . . . 82
4.3. The basic features of international air transport . . . . . . . . . . . . . . . . . . . . . . . . 83
GLOBALISATION, TRANSPORT AND THE ENVIRONMENT © OECD 2010 5
TABLE OF CONTENTS
4.4. Effect of globalisation on airline markets . . . . . . . . . . . . . . . . . . . . . . . . . . . . . . 87
4.5. Institutional changes in airline regulation. . . . . . . . . . . . . . . . . . . . . . . . . . . . . . 87
4.6. Technological developments . . . . . . . . . . . . . . . . . . . . . . . . . . . . . . . . . . . . . . . . . 100
4.7. The shifting situation . . . . . . . . . . . . . . . . . . . . . . . . . . . . . . . . . . . . . . . . . . . . . . . 103
4.8. Conclusions . . . . . . . . . . . . . . . . . . . . . . . . . . . . . . . . . . . . . . . . . . . . . . . . . . . . . . . 115
Notes . . . . . . . . . . . . . . . . . . . . . . . . . . . . . . . . . . . . . . . . . . . . . . . . . . . . . . . . . . . . . . . . . . 116
References . . . . . . . . . . . . . . . . . . . . . . . . . . . . . . . . . . . . . . . . . . . . . . . . . . . . . . . . . . . . . . 118
Chapter 5. International Road and Rail Freight Transport: The Impactof Globalisation on Activity Levels . . . . . . . . . . . . . . . . . . . . . . . . . . . . . . . . . . 121
5.1. Introduction . . . . . . . . . . . . . . . . . . . . . . . . . . . . . . . . . . . . . . . . . . . . . . . . . . . . . . . 122
5.2. Recent trends in international trade activity. . . . . . . . . . . . . . . . . . . . . . . . . . . . 122
5.3. International trade and transport: Policy and economics . . . . . . . . . . . . . . . . . 125
5.4. Other considerations in international trade of physical goods. . . . . . . . . . . . . 127
5.5. Recent trends in international freight transport volumes by road
and rail . . . . . . . . . . . . . . . . . . . . . . . . . . . . . . . . . . . . . . . . . . . . . . . . . . . . . . . . . . . 130
5.6. Factors influencing recent trends in international road freight transport . . . 133
5.7. Factors influencing recent trends in international rail freight transport . . . . 143
5.8. Future perspectives . . . . . . . . . . . . . . . . . . . . . . . . . . . . . . . . . . . . . . . . . . . . . . . . . 149
5.9. Conclusions . . . . . . . . . . . . . . . . . . . . . . . . . . . . . . . . . . . . . . . . . . . . . . . . . . . . . . . 155
Notes . . . . . . . . . . . . . . . . . . . . . . . . . . . . . . . . . . . . . . . . . . . . . . . . . . . . . . . . . . . . . . . . . . 157
References . . . . . . . . . . . . . . . . . . . . . . . . . . . . . . . . . . . . . . . . . . . . . . . . . . . . . . . . . . . . . . 157
Chapter 6. International Maritime Shipping: Environmental Impactsof Increased Activity Levels . . . . . . . . . . . . . . . . . . . . . . . . . . . . . . . . . . . . . . . . 161
6.1. Introduction . . . . . . . . . . . . . . . . . . . . . . . . . . . . . . . . . . . . . . . . . . . . . . . . . . . . . . . 162
6.2. Modelling of air emissions from shipping . . . . . . . . . . . . . . . . . . . . . . . . . . . . . . 164
6.3. Geographically resolved emission inventory . . . . . . . . . . . . . . . . . . . . . . . . . . . . 166
6.4. Atmospheric impacts . . . . . . . . . . . . . . . . . . . . . . . . . . . . . . . . . . . . . . . . . . . . . . . 167
6.5. Other environmental impacts from shipping . . . . . . . . . . . . . . . . . . . . . . . . . . . 174
6.6. Conclusions . . . . . . . . . . . . . . . . . . . . . . . . . . . . . . . . . . . . . . . . . . . . . . . . . . . . . . . 177
Notes . . . . . . . . . . . . . . . . . . . . . . . . . . . . . . . . . . . . . . . . . . . . . . . . . . . . . . . . . . . . . . . . . . 178
References . . . . . . . . . . . . . . . . . . . . . . . . . . . . . . . . . . . . . . . . . . . . . . . . . . . . . . . . . . . . . . 178
Chapter 7. International Air Transport: Environmental Impactsof Increased Activity Levels . . . . . . . . . . . . . . . . . . . . . . . . . . . . . . . . . . . . . . . . 185
7.1. Introduction . . . . . . . . . . . . . . . . . . . . . . . . . . . . . . . . . . . . . . . . . . . . . . . . . . . . . . . 186
7.2. Aviation growth and the environment . . . . . . . . . . . . . . . . . . . . . . . . . . . . . . . . . 186
7.3. Hub-and-spoke networks . . . . . . . . . . . . . . . . . . . . . . . . . . . . . . . . . . . . . . . . . . . . 191
7.4. Effect of aviation on house prices . . . . . . . . . . . . . . . . . . . . . . . . . . . . . . . . . . . . . 193
7.5. Conclusions . . . . . . . . . . . . . . . . . . . . . . . . . . . . . . . . . . . . . . . . . . . . . . . . . . . . . . . 193
Notes . . . . . . . . . . . . . . . . . . . . . . . . . . . . . . . . . . . . . . . . . . . . . . . . . . . . . . . . . . . . . . . . . . 195
References . . . . . . . . . . . . . . . . . . . . . . . . . . . . . . . . . . . . . . . . . . . . . . . . . . . . . . . . . . . . . . 195
GLOBALISATION, TRANSPORT AND THE ENVIRONMENT © OECD 20106
TABLE OF CONTENTS
Chapter 8. International Road and Rail Freight Transport: Environmental Impactsof Increased Activity Levels . . . . . . . . . . . . . . . . . . . . . . . . . . . . . . . . . . . . . . . . 197
8.1. Introduction . . . . . . . . . . . . . . . . . . . . . . . . . . . . . . . . . . . . . . . . . . . . . . . . . . . . . . . 198
8.2. Trends in environmental impacts from transport . . . . . . . . . . . . . . . . . . . . . . . 200
8.3. Developments in emission factors of road and rail vehicles. . . . . . . . . . . . . . . 206
8.4. Perspectives for improving environmental performance
of freight transport . . . . . . . . . . . . . . . . . . . . . . . . . . . . . . . . . . . . . . . . . . . . . . . . . 213
8.5. Conclusions . . . . . . . . . . . . . . . . . . . . . . . . . . . . . . . . . . . . . . . . . . . . . . . . . . . . . . . 221
Notes . . . . . . . . . . . . . . . . . . . . . . . . . . . . . . . . . . . . . . . . . . . . . . . . . . . . . . . . . . . . . . . . . . 221
References . . . . . . . . . . . . . . . . . . . . . . . . . . . . . . . . . . . . . . . . . . . . . . . . . . . . . . . . . . . . . . 222
Chapter 9. Policy Instruments to Limit Negative Environmental Impacts:An Economic Perspective. . . . . . . . . . . . . . . . . . . . . . . . . . . . . . . . . . . . . . . . . . . 225
9.1. Introduction . . . . . . . . . . . . . . . . . . . . . . . . . . . . . . . . . . . . . . . . . . . . . . . . . . . . . . . 226
9.2. The problem of climate change and current responses. . . . . . . . . . . . . . . . . . . 226
9.3. Transport and CO2 emissions: Where demand would like to go . . . . . . . . . . . 229
9.4. Road transport . . . . . . . . . . . . . . . . . . . . . . . . . . . . . . . . . . . . . . . . . . . . . . . . . . . . . 231
9.5. Maritime transport . . . . . . . . . . . . . . . . . . . . . . . . . . . . . . . . . . . . . . . . . . . . . . . . . 237
9.6. Aviation . . . . . . . . . . . . . . . . . . . . . . . . . . . . . . . . . . . . . . . . . . . . . . . . . . . . . . . . . . . 241
9.7. Conclusions . . . . . . . . . . . . . . . . . . . . . . . . . . . . . . . . . . . . . . . . . . . . . . . . . . . . . . . 243
Notes . . . . . . . . . . . . . . . . . . . . . . . . . . . . . . . . . . . . . . . . . . . . . . . . . . . . . . . . . . . . . . . . . . 244
References . . . . . . . . . . . . . . . . . . . . . . . . . . . . . . . . . . . . . . . . . . . . . . . . . . . . . . . . . . . . . . 246
Chapter 10. Policy Instruments to Limit Negative Environmental Impacts:International Law . . . . . . . . . . . . . . . . . . . . . . . . . . . . . . . . . . . . . . . . . . . . . . . . . 249
10.1. Introduction . . . . . . . . . . . . . . . . . . . . . . . . . . . . . . . . . . . . . . . . . . . . . . . . . . . . . . . 250
10.2. International air transport . . . . . . . . . . . . . . . . . . . . . . . . . . . . . . . . . . . . . . . . . . . 250
10.3. International space transport . . . . . . . . . . . . . . . . . . . . . . . . . . . . . . . . . . . . . . . . 258
10.4. International maritime transport . . . . . . . . . . . . . . . . . . . . . . . . . . . . . . . . . . . . . 259
10.5. International land transport . . . . . . . . . . . . . . . . . . . . . . . . . . . . . . . . . . . . . . . . . 267
10.6. Other international legal regimes . . . . . . . . . . . . . . . . . . . . . . . . . . . . . . . . . . . . . 268
10.7. Conclusions . . . . . . . . . . . . . . . . . . . . . . . . . . . . . . . . . . . . . . . . . . . . . . . . . . . . . . . 268
Notes . . . . . . . . . . . . . . . . . . . . . . . . . . . . . . . . . . . . . . . . . . . . . . . . . . . . . . . . . . . . . . . . . . 269
References . . . . . . . . . . . . . . . . . . . . . . . . . . . . . . . . . . . . . . . . . . . . . . . . . . . . . . . . . . . . . . 272
Boxes
1.1. What is globalisation?. . . . . . . . . . . . . . . . . . . . . . . . . . . . . . . . . . . . . . . . . . . . . . . . . . 20
5.1. Border problems. . . . . . . . . . . . . . . . . . . . . . . . . . . . . . . . . . . . . . . . . . . . . . . . . . . . . . . 129
5.2. The Trans-European Transport Network “TEN-T” . . . . . . . . . . . . . . . . . . . . . . . . . . 135
5.3. The Beijing-Brussels international truck caravan . . . . . . . . . . . . . . . . . . . . . . . . . . 140
5.4. RailNetEurope . . . . . . . . . . . . . . . . . . . . . . . . . . . . . . . . . . . . . . . . . . . . . . . . . . . . . . . . 145
5.5. European expansion of Railion Logistics . . . . . . . . . . . . . . . . . . . . . . . . . . . . . . . . . . 147
5.6. China-Germany container train trial . . . . . . . . . . . . . . . . . . . . . . . . . . . . . . . . . . . . . 148
5.7. Technologies to enhance interoperability in the European Union. . . . . . . . . . . . . 148
5.8. Trade and Transport Facilitation in Southeast Europe Program. . . . . . . . . . . . . . . 152
5.9. Priority Rail Freight Network . . . . . . . . . . . . . . . . . . . . . . . . . . . . . . . . . . . . . . . . . . . . 153
GLOBALISATION, TRANSPORT AND THE ENVIRONMENT © OECD 2010 7
TABLE OF CONTENTS
5.10. The proposed Northern East West Sea-Rail Freight Corridor . . . . . . . . . . . . . . . . . 155
8.1. Trends in transport accidents . . . . . . . . . . . . . . . . . . . . . . . . . . . . . . . . . . . . . . . . . . . 198
8.2. Sulphur content of fuels . . . . . . . . . . . . . . . . . . . . . . . . . . . . . . . . . . . . . . . . . . . . . . . . 209
8.3. A system-efficiency perspective . . . . . . . . . . . . . . . . . . . . . . . . . . . . . . . . . . . . . . . . . 219
Tables
3.1. World total merchant fleet by form of motive power. . . . . . . . . . . . . . . . . . . . . . . . 65
3.2. Estimated global coal bunker sales and CO2 emissions. . . . . . . . . . . . . . . . . . . . . . 66
3.3. Profile of 2002 world fleet, number of main engines,
and main engine power . . . . . . . . . . . . . . . . . . . . . . . . . . . . . . . . . . . . . . . . . . . . . . . . 67
4.1. Top ten international airlines by scheduled passenger-kilometres . . . . . . . . . . . . 85
4.2. Top 20 international airports by passengers . . . . . . . . . . . . . . . . . . . . . . . . . . . . . . . 85
4.3. European low-cost carriers that ceased to exist . . . . . . . . . . . . . . . . . . . . . . . . . . . . 97
4.4. Strategic Airline Alliances . . . . . . . . . . . . . . . . . . . . . . . . . . . . . . . . . . . . . . . . . . . . . . 98
4.5. Scheduled freight tonne-kilometres flown . . . . . . . . . . . . . . . . . . . . . . . . . . . . . . . . 112
4.6. Selected indices of China’s civil air transport system . . . . . . . . . . . . . . . . . . . . . . . 114
5.1. Intra- and inter-regional merchandise trade flows, 2006 . . . . . . . . . . . . . . . . . . . . 123
5.2. Annual percentage change of value of goods in world merchandise trade
by region . . . . . . . . . . . . . . . . . . . . . . . . . . . . . . . . . . . . . . . . . . . . . . . . . . . . . . . . . . . . . 123
5.3. Involvement of major trading blocs in world merchandise trade . . . . . . . . . . . . . 124
5.4. Growth in global freight transport volumes . . . . . . . . . . . . . . . . . . . . . . . . . . . . . . . 130
5.5. US trade with Canada and Mexico by road and rail, 2006 . . . . . . . . . . . . . . . . . . . . 132
5.6. Estimated transport of full-load containers between Europe and China . . . . . . . 133
5.7. Institutional differences between North America and Europe. . . . . . . . . . . . . . . . 145
5.8. Sea and rail distances between China and Rostock, Germany (km) . . . . . . . . . . . 155
6.1. Examples of air pollution control-technologies for maritime shipping . . . . . . . . 163
6.2. Radiative forcing for year 2000 of different components. . . . . . . . . . . . . . . . . . . . . 173
6.3. Overview of types of ocean-shipping pollution . . . . . . . . . . . . . . . . . . . . . . . . . . . . 174
7.1a. Calculated NOx emissions from aviation . . . . . . . . . . . . . . . . . . . . . . . . . . . . . . . . . . 187
7.1b. Calculated CO2 emissions from aviation . . . . . . . . . . . . . . . . . . . . . . . . . . . . . . . . . . 187
7.2. CO2 emissions from aviation under different assumptions . . . . . . . . . . . . . . . . . . 187
7.3. Estimates of emissions from aviation over the long term. . . . . . . . . . . . . . . . . . . . 188
7.4. Average external costs of transport in the EU17 countries . . . . . . . . . . . . . . . . . . . 189
7.5. Average external costs of aviation . . . . . . . . . . . . . . . . . . . . . . . . . . . . . . . . . . . . . . . 190
9.1. Modal shares in world vehicle CO2 emissions . . . . . . . . . . . . . . . . . . . . . . . . . . . . . 230
9.2. Marginal external costs from automobiles . . . . . . . . . . . . . . . . . . . . . . . . . . . . . . . . 235
Figures
3.1. Ocean shipping as (A) a substitute and (B) a complement
to other freight modes . . . . . . . . . . . . . . . . . . . . . . . . . . . . . . . . . . . . . . . . . . . . . . . . . 56
3.2. Comparison of demand and carbon emissions by freight-mode share
for the US . . . . . . . . . . . . . . . . . . . . . . . . . . . . . . . . . . . . . . . . . . . . . . . . . . . . . . . . . . . . 57
3.3. The effect of globalisation on unitised cargoes. . . . . . . . . . . . . . . . . . . . . . . . . . . . . 59
3.4. Trends in OECD GDP, exports and imports
and international bunker fuel supply. . . . . . . . . . . . . . . . . . . . . . . . . . . . . . . . . . . . . 59
GLOBALISATION, TRANSPORT AND THE ENVIRONMENT © OECD 20108
TABLE OF CONTENTS
3.5. Relationship between OECD economic growth and growth in exports
and imports . . . . . . . . . . . . . . . . . . . . . . . . . . . . . . . . . . . . . . . . . . . . . . . . . . . . . . . . . . 60
3.6. Relationship between cargo shipments and container traffic and GDP . . . . . . . . 60
3.7. Gross maritime shipping tonnage by vessel technology . . . . . . . . . . . . . . . . . . . . . 61
3.8. Number of ships by vessel technology . . . . . . . . . . . . . . . . . . . . . . . . . . . . . . . . . . . . 61
3.9. Gross tonnage by vessel flag . . . . . . . . . . . . . . . . . . . . . . . . . . . . . . . . . . . . . . . . . . . . 63
3.10. Flags of employment for selected nationalities . . . . . . . . . . . . . . . . . . . . . . . . . . . . 63
3.11. Development of world fleet of ocean-going vessels and transport work . . . . . . . 64
3.12. Average installed power (kW) for worldwide vessel fleet . . . . . . . . . . . . . . . . . . . . 68
3.13. Comparison of some estimates of ships’ fuel consumption. . . . . . . . . . . . . . . . . . 70
3.14. Sensitivity analysis of estimated fuel consumption
in international shipping . . . . . . . . . . . . . . . . . . . . . . . . . . . . . . . . . . . . . . . . . . . . . . . 70
3.15. Calculated days at sea for different vessel categories . . . . . . . . . . . . . . . . . . . . . . . 71
3.16. Activity-based estimates of energy use and international marine sales . . . . . . . 71
3.17. Correlation between IEA-reported sales of marine oil products
and transport work . . . . . . . . . . . . . . . . . . . . . . . . . . . . . . . . . . . . . . . . . . . . . . . . . . . . 73
3.18. Modelling future fuel use and emissions in shipping . . . . . . . . . . . . . . . . . . . . . . . 75
3.19. Some possible developments for ships’ fuel use and emissions . . . . . . . . . . . . . . 76
4.1. World international trade and airline revenue passenger-kilometres . . . . . . . . . 86
4.2. Short-term links between world trade in manufactures
and air freight volumes . . . . . . . . . . . . . . . . . . . . . . . . . . . . . . . . . . . . . . . . . . . . . . . . 86
4.3. The simple economics of Open Skies policies . . . . . . . . . . . . . . . . . . . . . . . . . . . . . 87
4.4. Implications of globalisation on air transport markets . . . . . . . . . . . . . . . . . . . . . . 89
4.5. “Dog-bone” international air transport network . . . . . . . . . . . . . . . . . . . . . . . . . . . 90
4.6. Network configuration . . . . . . . . . . . . . . . . . . . . . . . . . . . . . . . . . . . . . . . . . . . . . . . . . 92
4.7. Operating margins of airlines . . . . . . . . . . . . . . . . . . . . . . . . . . . . . . . . . . . . . . . . . . . 93
4.8. Airline profitability by region. . . . . . . . . . . . . . . . . . . . . . . . . . . . . . . . . . . . . . . . . . . . 94
4.9. CO2-intensity of passenger transport. . . . . . . . . . . . . . . . . . . . . . . . . . . . . . . . . . . . . 100
4.10. Fuel use per available tonne-kilometre . . . . . . . . . . . . . . . . . . . . . . . . . . . . . . . . . . . 102
4.11. Operating cost per seat . . . . . . . . . . . . . . . . . . . . . . . . . . . . . . . . . . . . . . . . . . . . . . . . . 102
4.12. Alternative views of the implications of migration . . . . . . . . . . . . . . . . . . . . . . . . . 105
4.13. The notion of gateways. . . . . . . . . . . . . . . . . . . . . . . . . . . . . . . . . . . . . . . . . . . . . . . . . 107
4.14. Impacts of gateways on air transport networks and flows . . . . . . . . . . . . . . . . . . . 108
4.15. Air travel between the UK and selected transition economies. . . . . . . . . . . . . . . . 109
4.16. Throughput of freight at major Chinese cargo hub airports . . . . . . . . . . . . . . . . . . 114
5.1. World merchandise trade volume by major product group . . . . . . . . . . . . . . . . . . 123
5.2. Sectoral structure of merchandise exports by region, 2006 . . . . . . . . . . . . . . . . . . 124
5.3. Selected border crossing times for road and rail . . . . . . . . . . . . . . . . . . . . . . . . . . . 128
5.4. Selected border crossing costs for road and rail . . . . . . . . . . . . . . . . . . . . . . . . . . . . 128
5.5. International E-road Network . . . . . . . . . . . . . . . . . . . . . . . . . . . . . . . . . . . . . . . . . . . 134
5.6. Asian highway network project. . . . . . . . . . . . . . . . . . . . . . . . . . . . . . . . . . . . . . . . . . 135
5.7. Trans-Asian railway network. . . . . . . . . . . . . . . . . . . . . . . . . . . . . . . . . . . . . . . . . . . . 144
5.8. Liberalisation of rail freight transport in Europe . . . . . . . . . . . . . . . . . . . . . . . . . . . 146
5.9. Projected road and rail freight transport activity by region to 2050. . . . . . . . . . . . 150
5.10. Projected road and rail freight transport activity by mode to 2050 . . . . . . . . . . . . 150
5.11. Indicative scope for a rail freight-oriented network. . . . . . . . . . . . . . . . . . . . . . . . . 154
GLOBALISATION, TRANSPORT AND THE ENVIRONMENT © OECD 2010 9
TABLE OF CONTENTS
5.12. Freight costs and transit times for containerised freight between Asia
and Europe . . . . . . . . . . . . . . . . . . . . . . . . . . . . . . . . . . . . . . . . . . . . . . . . . . . . . . . . . . . 156
6.1. Integrated modelling of fuel consumption, emissions and impacts
from shipping. . . . . . . . . . . . . . . . . . . . . . . . . . . . . . . . . . . . . . . . . . . . . . . . . . . . . . . . . 164
6.2. Estimates of CO2 and SO2 emissions from ships . . . . . . . . . . . . . . . . . . . . . . . . . . . 165
6.3. Estimates of world fleet CO2 emissions . . . . . . . . . . . . . . . . . . . . . . . . . . . . . . . . . . . 166
6.4. Vessel traffic densities for year 2000, based on the AMVER data . . . . . . . . . . . . . . 167
6.5. Relative contribution to ozone concentrations at the surface
due to emissions from ships . . . . . . . . . . . . . . . . . . . . . . . . . . . . . . . . . . . . . . . . . . . . 169
6.6. Yearly average contribution from ship traffic to wet disposition. . . . . . . . . . . . . . 171
6.7. Relationship between right whale strikes
and global average ship momentum . . . . . . . . . . . . . . . . . . . . . . . . . . . . . . . . . . . . . 175
8.1. Energy-use in the transport sector . . . . . . . . . . . . . . . . . . . . . . . . . . . . . . . . . . . . . . . 201
8.2. Projections of transport energy consumption by mode and region. . . . . . . . . . . . 201
8.3. Evolution of oil consumption per sector in Mtoe . . . . . . . . . . . . . . . . . . . . . . . . . . . 202
8.4. Energy-related CO2 emissions of various sectors worldwide . . . . . . . . . . . . . . . . . 203
8.5. CO2 emissions of the transport sector worldwide . . . . . . . . . . . . . . . . . . . . . . . . . . 203
8.6. Historical and projected CO2 emissions from transport by mode worldwide . . . 204
8.7. Transport emissions of air pollutants in EEA countries. . . . . . . . . . . . . . . . . . . . . . 205
8.8. Transport emissions of air pollutants in EEA countries. . . . . . . . . . . . . . . . . . . . . . 205
8.9. NOx emission standards for heavy duty vehicles in selected countries . . . . . . . . 207
8.10. PM10 emission standards for heavy duty vehicles in selected countries . . . . . . . 207
8.11. Standards for NOx emissions for diesel vehicles in the European Union . . . . . . . 208
8.12. Standards for PM10 emissions for diesel vehicles in the European Union . . . . . . 209
8.13. “Well-to-wheel” analysis of energy chains and “life-cycle analysis”
of products . . . . . . . . . . . . . . . . . . . . . . . . . . . . . . . . . . . . . . . . . . . . . . . . . . . . . . . . . . . 210
8.14a. NOx emissions per tkm for long-distance container
and other freight transport . . . . . . . . . . . . . . . . . . . . . . . . . . . . . . . . . . . . . . . . . . . . . 212
8.14b. PM10 emissions per tkm for long-distance container
and other freight transport . . . . . . . . . . . . . . . . . . . . . . . . . . . . . . . . . . . . . . . . . . . . . 212
8.14c. CO2 emissions per tkm for long-distance container
and other freight transport . . . . . . . . . . . . . . . . . . . . . . . . . . . . . . . . . . . . . . . . . . . . . 212
8.15. Primary energy sources, secondary energy carriers and use of energy
in vehicles. . . . . . . . . . . . . . . . . . . . . . . . . . . . . . . . . . . . . . . . . . . . . . . . . . . . . . . . . . . . 216
8.16. Global ethanol fuel production . . . . . . . . . . . . . . . . . . . . . . . . . . . . . . . . . . . . . . . . . . 218
8.17. Global biodiesel production . . . . . . . . . . . . . . . . . . . . . . . . . . . . . . . . . . . . . . . . . . . . . 218
8.18. Noise levels of heavy duty vehicles . . . . . . . . . . . . . . . . . . . . . . . . . . . . . . . . . . . . . . 220
9.1. World tank-to-wheel CO2 emissions . . . . . . . . . . . . . . . . . . . . . . . . . . . . . . . . . . . . . 230
9.2. Comparison of fuel economy and GHG standards . . . . . . . . . . . . . . . . . . . . . . . . . . 234
10.1. Take-off and landing cycle . . . . . . . . . . . . . . . . . . . . . . . . . . . . . . . . . . . . . . . . . . . . . . 251
GLOBALISATION, TRANSPORT AND THE ENVIRONMENT © OECD 201010

ACRONYMS
Acronyms
AIS Automatic Identification Systems
AMVER Automated Mutual-assistance Vessel Rescue system
ASA Air Service Agreement
ATK Available Tonne-Kilometre
BOD Biological Oxygen Demand
CER Community of European Railway and Infrastructure Companies
CH4 Methane
CIT Comité International du Transport Ferroviaire
– International Railway Transport Committee
CNG Compressed Natural Gas
COD Chemical Oxygen Demand
COADS Comprehensive Ocean-Atmosphere Data Set
CTL Coal-to-Liquid
DME Dimethyl Ether
dwt Deadweight Tonnage
EEA European Environment Agency
ERTMS European Rail Traffic Management System
FDI Foreign Direct Investment
FEH Factor Endowments Hypothesis
FTK Freight Tonne-Kilometre
GATS General Agreement on Trade in Services
GATT General Agreement on Tariffs and Trade
GT Gross Tonnage
Gtkm Giga-Tonne-Kilometre (= 109 tkm)
GTL Gas-to-Liquid
HFO Heavy Fuel Oil
IATA International Air Transport Association
ICAO International Civil Aviation Organization
ICT Information and Communication Technologies
IFO Intermediate Fuel Oil
IMO International Maritime Organization
IPCC Intergovernmental Panel on Climate Change
ITF International Transport Forum
LPG Liquefied Petroleum Gas
LPI Logistics Performance Index
LRIT Long Range Identification and Tracking
MDO Marine Diesel Oil
MGO Marine Gasoil
GLOBALISATION, TRANSPORT AND THE ENVIRONMENT © OECD 2010 11
ACRONYMS
MOU Memorandum of Understanding
Mt Million tons
NEDC New European Driving Cycle
N2O Nitrous Oxide
NOx Nitrogen Oxide
OECD Organisation for Economic Co-operation and Development
OH Hydroxyl
PHE Pollution Haven Effect
PHH Pollution Haven Hypothesis
PRK Passenger Revenue Kilometre
RF Radiative Forcing
RFID Radio-Frequency Identification
SARP Standards and Recommended Practices
SECA Sulphur Emissions Control Area
SO2 Sulphur Dioxide
TEU Twenty-foot Equivalent Units containers
tkm Tonne-Kilometre
TTFSE Trade and Transport Facilitation in Southeast Europe Program
UIC Union Internationale des Chemins de Fer – International Union of Railways
UNCTAD United Nations Conference on Trade and Development
UNFCCC United Nations Framework Convention on Climate Change
VOC Volatile Organic Components
VER Voluntary Export Restraint
WHO World Health Organization
WTO World Trade Organization
GLOBALISATION, TRANSPORT AND THE ENVIRONMENT © OECD 201012
Globalisation, Transport and the Environment
© OECD 2010
Executive Summary
The increased flow of knowledge, resources, goods and services among nations that has
occurred as a result of globalisation has led to a major increase over the years in transport
activity. This has had an impact on the environment in a number of ways: through
increased economic activity in general; through shifts in the location of production
activities; and through developments in the volume and type of transportation required to
meet demands of global trade. This report reviews the linkages between globalisation,
transport and the environment, and identifies the policy challenges and potential
solutions to address the environmental consequences that arise.
Globalisation and environment: Overall impacts
In general, increased economic openness seems to have had, at worst, a benign effect on
emissions of localised pollutants, such as SO2, NO2 and PM (particulate matter). However,
it is not clear how the relative price changes that result from openness will affect the
environmental composition of economic activity: some countries will produce more
environmentally intensive goods, others will produce fewer. On the other hand,
liberalisation will raise incomes, perhaps increasing the willingness-to-pay for
environmental improvements: such income effects could well outweigh the negative scale
effects associated with increased economic activity. When combined with the positive
effects associated with technology transfer, the net effect of globalisation on local
pollutants is quite possibly a positive one.
However, the evidence concerning carbon dioxide and other greenhouse gas emissions is
less encouraging. Here, the evidence suggests that the net effect of trade liberalisation
could be negative. One of the explanations for the pessimistic assessments of trade’s
impact on greenhouse gas emissions is their global nature. Not only are the costs of CO2
emissions shared with citizens abroad, but many greenhouse gas emissions are associated
with fossil fuel use, for which few economically viable substitutes have emerged to date.
The income and other technique effects that are largely responsible for reductions in local
air pollutants do not seem to have the same force when the pollutant in question burdens
the global population – and requires global solutions – rather than just citizens residing
within any one government’s jurisdiction.
13
EXECUTIVE SUMMARY
Globalisation and transport activity levels
Increasing globalisation has led to strong growth in international shipping activity. Trade
and shipping are closely linked, although some disagreement remains about the degree to
which energy use in shipping is coupled with the activity level. Considering the range of
current estimates, ocean-going ships now consume about 2% to 3% – and perhaps even as
much as 4% – of world fossil fuels.
Air transport has also played a key part in fostering globalisation. However, airlines have
had to respond to changing demands for their services. These demands come from the
requirements for high-quality, fast and reliable international transport. Many structural
changes have taken place in the aviation sector as a result of globalisation. Air markets
have been liberalised, the networks that airline companies operate have changed (often to
hub-and-spoke networks), many new (often low-cost) companies have entered the market,
and many airline companies have gone out of business or merged. Some 40% of world trade
by value now moves by air.
With new developments to remove bottlenecks, combined with operational improvements,
there is scope for considerable improvement in the efficiency of international road and rail
freight in many regions. Of course, it is not simply a question of transit time and reliability;
it is also a question of cost. Air transport has the highest cost, but very short transit times.
Sea transport provides the lowest cost, but long transit times. Road freight falls between air
and sea, both in terms of cost and transit time. Rail transport has a very wide range of costs
and transit times, and major differences between the officially scheduled transit times and
the actual transit times achieved.
Within the next 15 years, there seem to be limited opportunities to dramatically increase
the speed of either ships or aircraft. Indeed, concern about CO2 emissions could lead to
changes in the role of air freight within the supply chain. There have even been calls for sea
freight transport to operate at slower speeds, in order to save fuel. Given these
uncertainties, the potential for rail movement to offer opportunities for shorter transit
times, and possibly, reduced costs is interesting. Road freight times may not have the scope
to be reduced to the same extent. For both road and rail freight transport, border crossings
represent an important barrier. Safety for drivers and cargo is also a major issue, especially
for road transport.
Environmental impacts of increased activity levels
The climate change issue clearly lies at the heart of efforts to deal with the environmental
impacts of transport that result from globalisation. No other environmental issue has so
many potential implications for transport sector policy today.
Global CO2 emissions from maritime shipping almost tripled between 1925 and 2002. The
corresponding SO2 emissions more than tripled over the same period. The majority of
today’s ship emissions occur in the northern hemisphere, within a well-defined system of
international sea routes. Most studies so far indicate that ship emissions, in contrast to
emissions from other transport sectors, lead to a net global cooling, due i.a. to cooling
effect stemming from sulphur emissions. However, it is stressed that the uncertainties
with this conclusion are large, in particular for indirect effects, and global temperature is
in any event only a first measure of the extent of climate change.
GLOBALISATION, TRANSPORT AND THE ENVIRONMENT © OECD 201014
EXECUTIVE SUMMARY
Projections up to 2020 indicate growth in maritime fuel consumption and emissions in the
range of 30%. However, even larger increases in ship emissions could take place in the
coming decades. By 2050, CO2 emissions from maritime shipping could reach two to three
times current levels. Most scenarios for the next 10 to 20 years indicate that the effects of
regulations and other policy measures will be outweighed by increases in traffic, leading to
a significant global increase in emissions from shipping. Global emission scenarios also
indicate that the relative contribution to other pollutants from shipping could increase,
especially in regions like the Arctic and South-East Asia, where substantial increases in
ship traffic are expected.
Expected technological innovations are unlikely to prevent an increase in CO2 emissions
from aviation either, in light of the expected increase in demand – but the rate of
technological progress will likely depend on the extent to which the sector faces a price on
the CO2 it emits. Depending on the technology and scenario used, the average external
environmental cost of air travel is about EUR 0.01 to EUR 0.05 per passenger-kilometre.
Major airlines use hub-and-spoke networks, which means that selected airports receive a
relatively large share of all take-offs and landings in the network. As a result, noise
pollution in the surrounding areas is relatively high, and passengers travelling indirectly
have to make a detour (thereby increasing the total emissions related to their trip). But
hub-and-spoke networks might also have environmental benefits, due to environmental
economies-of-scale: larger aircraft with lower emissions per seat can be used because
passenger flows are concentrated on fewer links. The literature suggests, however, that the
negative environmental effects of hub-and-spoke networks tend to exceed the positive
effects. If the large airline companies focus their networks on a few intercontinental hubs,
traffic levels will increase at these hubs due to the generally expected increase in demand,
but also because more people need to make transfers.
International road and rail freight transport account for a minor share of global transport
emissions of local air pollutants (e.g. NOx) and noise. The contribution of these emissions
to local air pollution is actually decreasing in most parts of the world, mainly due to various
vehicle emission standards that have been implemented (and periodically tightened) all
over the world. Only in those parts of the world that have an extremely high growth in
transport volumes have overall transport-related emissions of local air pollutants not yet
decreased.
On the other hand, CO2 emissions from international road freight transport are increasing
all over the world and there is no sign as yet that this trend is to be curbed soon. For this
challenging problem, there is no single cure available, and the scale effects will likely
outweigh the technological options unless price signals are radically changed. A mix of
measures, such as road pricing, higher fuel taxes, stricter fuel efficiency standards for
vehicles, use of alternative fuels and logistical improvements, will be needed to limit these
trends.
Policy instruments
The international regulatory framework for greenhouse gases does not assign responsibility
to nations for managing emissions from shipping and aviation. A multilateral approach may
be preferable on both efficiency and effectiveness grounds (especially over the long term),
provided sufficient political will exists internationally to co-operate on solving the
GLOBALISATION, TRANSPORT AND THE ENVIRONMENT © OECD 2010 15

EXECUTIVE SUMMARY
underlying environmental problems. Although international regimes can sometimes
constrain governments’ ability to regulate activities that are harmful to the environment,
this study demonstrates that international law does provide many opportunities to adopt
new instruments to regulate environmental impacts from increased international transport.
International coalitions to address problems like climate change or acidification may need
to be built from the bottom up. One element of this approach would involve regional
arrangements among like-minded countries, or among countries that share a common
environmental problem (e.g. SOx). These regional agreements can then serve as building
blocks or demonstration experiments toward broader international action over the longer
term (e.g. linking up emission trading systems in different regions). One caveat here, of
course, is the difficulty of regional systems to include important emitters (e.g. China, and
India, in the case of greenhouse gas emissions). This will inevitably mean that a regional
approach would be less efficient than a global approach.
Unilateral action also has a role to play, even at the international level. Not only is
unilateral action often the most appropriate approach (especially when the pollution
involved affects only the national territory, which is mostly the case for much of land-
based transport); local policies can sometimes help to force subsequent changes within the
international regime (e.g. EU noise standards for airplanes were eventually adopted by
ICAO). This example could also play an important role regarding climate change in the
future, inasmuch as the EU is poised to apply its greenhouse gas emission trading system
unilaterally to international air (and potentially, even to sea) transport.
The most suitable use of policy instruments vary among environmental problems.
Movements of highly hazardous substances should continue to be controlled essentially by
regulatory means: bans, prior informed consent rules, etc. Some other environmental
impacts, e.g. exhaust emissions, may most effectively be addressed by standards, which,
however, should provide as much flexibility as possible for producers to come up with low-
cost solutions. But the bulk of the “heavy lifting” in the policy response should be given
over to market-based instruments (taxes and tradable permits).
Inclusion of aviation and maritime transport in cap-and-trade systems would be especially
desirable from a cost-effectiveness point of view. For both of these modes, technological
abatement options are limited in the short run because of slow fleet turnover. In the
maritime sector, operational measures seem capable of reducing CO2 emissions in the
short run, and at low cost. In aviation, there is also some scope for abatement through
better air traffic control and airport congestion management, but the main abatement is
likely to come from lower demand. Available estimates put an upper bound of about 5% on
demand reductions, at prices of around EUR 20 per tonne of CO2. Imperfect competition
and airport congestion limit the extent of pass-through, and hence limit the demand
responses. The aviation sector, hence, is likely to be a net buyer of emission allowances.
When it comes to road transport, the optimal policy response to fuel-related externalities
(such as climate change) is different from the optimal policy responses to distance-related
externalities (such as congestion, accidents and air pollution). Imposing a fuel tax induces
some improvement in both distances travelled and fuel efficiency. But it does not reduce
distance-related externalities much, while most studies suggest that distance-related
externalities in road transport are significantly higher than fuel-related ones.
A more efficient approach would therefore seem to be to use distance-related taxes such as
road pricing. But the problem with this approach is that the distance travelled is not the
GLOBALISATION, TRANSPORT AND THE ENVIRONMENT © OECD 201016
EXECUTIVE SUMMARY
most important contributor to GHG emissions. For climate change, fuel efficiency will
remain the primary goal, and distance-related taxes would be too indirect.
It is sometimes argued that stricter standards are needed to increase the dispersion of
more fuel-efficient vehicles through the fleet, because the market provides relatively weak
incentives to improve fuel economy. If consumers are not willing to pay much now for fuel
economy improvements that only provide economic benefits over a long timescale,
producers may not be willing to supply fuel-efficient vehicles either. One way around this
problem could be for the government to force fuel economy into the marketplace via a fuel-
economy standard. The case for such standards would be strongest if fuel taxes were low
and incomes were high (in these cases, drivers care even less about the fuel economy of
their vehicles). However, in such a situation, it could be more cost-efficient to increase the
fuel taxes.
GLOBALISATION, TRANSPORT AND THE ENVIRONMENT © OECD 2010 17


Globalisation, Transport and the Environment
© OECD 2010
Chapter 1
Introduction and Main Findings
19

1. INTRODUCTION AND MAIN FINDINGS
1.1. IntroductionOECD and the International Transport Forum (ITF) held a Global Forum on Transport and
Environment in a Globalising World, 10-12 November 2008 in Guadalajara, Mexico.* There
were around 200 participants from 23 countries at the Global Forum, representing national
and local governments, academia, business, environmental organisations, etc. The main
purpose of the Global Forum, and of this book, was to discuss the impact globalisation has
had on transport levels, the consequences for the environment and the policy instruments
that can be used to limit any negative impacts for the environment. This book is based on
the papers addressing globalisation issues that were prepared for that forum. The papers
have been somewhat edited, in an attempt to present a continuous story, and to avoid
much overlap among chapters. Some additional or updated material has also been added,
but the systematic research for the various chapters was ended in the autumn of 2008.
1.2. Main findings
How globalisation affects the environment – Overall impacts
In general, increased economic openness (mainly trade and investment liberalisation)
seems to have had, at worst, a benign effect on emissions of localised pollutants. It has, for
example, been found that (for the statistically average country), a 10% increase in trade
intensity leads to approximately a 4% to 9% reduction in SO2 concentrations (Antweiler,
* See www.oecd.org/env/transport/GFSD.
Box 1.1. What is globalisation?
The term “globalisation” is often used to describe the increased flow of knowledge,resources, goods and services among nations. The term is sometimes defined as “thedevelopment of an increasingly integrated global economy marked especially by free trade,free flow of capital and the tapping of cheaper foreign labour markets”.*
Globalisation can also be described as a process by which the people of the world areunified into a single society and function together. This process is a combination ofeconomic, technological, socio-cultural and political forces. The term is, however, oftenused to refer in the narrower sense of economic globalisation, involving integration ofnational economies into the international economy through trade, foreign directinvestment, capital flows, migration and the spread of technology.
OECD (2005) highlights that three major forces have contributed importantly to theglobalisation process: i) the liberalisation of capital movements and deregulation, offinancial services in particular; ii) the further opening of markets to trade and investment,spurring the growth of international competition; and iii) the pivotal role played byinformation and communication technologies (ICT) in the economy.
* See www.merriam-webster.com/dictionary/globalization.
GLOBALISATION, TRANSPORT AND THE ENVIRONMENT © OECD 201020
1. INTRODUCTION AND MAIN FINDINGS
Copeland and Taylor, 2000). Other studies have found that openness appears to have a
beneficial impact on SO2 and NO2, but no statistically significant impact on PM emissions.
Still another study found that trade intensity increases land releases, but either reduces or
has no statistically significant effect on air, water and underground releases (Chintrakarn
and Millimet, 2006).
In broad terms, the evidence suggests that it is not clear how the relative price changes
that result from openness will affect the environmental composition of economic activity:
some countries will produce more environmentally intensive goods, others will produce
fewer. On the other hand, liberalisation will raise incomes, perhaps increasing the
willingness to pay for environmental improvements: these potential income effects could
well outweigh the negative scale effects associated with increased economic activity. When
combined with the positive effects associated with technology transfer, the net effect on
local pollutants is quite possibly a positive one.
However, the evidence concerning carbon dioxide and other greenhouse gas emissions is
less encouraging. Here, the evidence suggests that the net effect of trade liberalisation is
likely to be negative. One study, using a cross-section of 63 countries (and correcting for
trade intensity and income) concluded that a 1% increase in trade leads to a 0.58% increase
in CO2 emissions for the average country in her sample (Magani, 2004). Other studies
similarly find openness raises CO2 emissions, but also find the detrimental impact
disappears when corrections are made for income levels, etc.
One of the explanations for the consistently pessimistic assessments of trade’s impact
on greenhouse gas emissions is their global nature. Not only are the costs of CO2 emissions
shared with citizens abroad, but many greenhouse emissions are associated with fossil
fuel use, for which few economically viable substitutes have emerged to date. The income
and other technique effects that are largely responsible for reductions in local air pollutants
do not seem to have the same force when the pollutant in question burdens the global
population – and requires global solutions – rather than just citizens residing within any
one government’s jurisdiction.
For example, unlike emissions by nationally based emission sources, international
transport-related emissions often involve third parties, i.e. many goods are moved via
vessels not bound by operational regulations in the importing or exporting country. This is
a particular issue for ocean shipping. Thus, even if voters in high-income countries want
stringent environmental regulations attached to the transport of traded goods they
consume, shipping emissions may be outside their government’s jurisdiction. An
international response may be the only practical approach to this problem.
Globalisation and international transport activity
The 21st century has seen the continued internationalisation of the world’s economy.
There is also evidence of greater globalisation of cultures and politics. Economically,
globalisation helps to facilitate the greater division of labour, and to exploit its comparative
advantage more completely. In the longer term, globalisation also stimulates technology
and labour transfers, and allows the dynamism that accompanies entrepreneurial
activities to stimulate the development of new technologies and processes that lead to
global welfare improvements.
GLOBALISATION, TRANSPORT AND THE ENVIRONMENT © OECD 2010 21

1. INTRODUCTION AND MAIN FINDINGS
Increasing globalisation has led to a strong increase in international shipping activity.
Trade and shipping are closely linked, although some disagreement remains about the
degree to which energy use in shipping is coupled with the movement of waterborne
commerce. The estimates depend inter alia on the number of at-sea or in-port days that are
assumed in the analysis. The available evidence largely indicates that world marine fleet
energy demand is the sum of international fuel sales, plus domestically assigned fuel sales.
Some debate continues about the best estimates of global fuel usage, but the major
elements of activity-based inventories are widely accepted. Considering the range of
current estimates using activity-based input parameters, ocean-going ships now consume
about 2% to 3% – and perhaps even as much as 4% – of world fossil fuels (see Chapter 3).
Air transport has also played a key part in fostering globalisation. However, airlines
(and to an even greater degree, air transport infrastructure) have had to respond to
changing demands for their services. These demands come from the requirements for
high-quality, fast and reliable international transport. Globalisation, almost by definition,
means demands for greater mobility and access, but these demands are increasingly
different for different types of passengers and cargoes, to different places, and over
different distances, than was previously the norm.
Many structural changes have taken place in the aviation sector as a result of
globalisation. Air markets have been liberalised, the networks that airline companies
operate have changed (often to hub-and-spoke networks), many new (often low-cost)
companies have entered the market, and many (low-cost and other) airline companies
have gone out of business or merged (most of the remaining airlines have already united
into three major alliances).
International air transport is now a major contributor to globalisation and is
continually reshaping to meet the demands of the economic and social integration that
globalisation engenders. Some 40% of world trade (by value) now moves by air (see
Chapter 4). To allow the flows of ideas, goods and persons that facilitate efficiency on a
global scale, air transport has played a key role in the past, and is poised to continue this
role in the future. Yet, as the strong growth in air transport activity is straining air-related
infrastructure (such as airports), future economic growth in the sector could well be
constrained by capacity limits.
With new developments to remove bottlenecks, combined with operational
improvements, there is scope for considerable improvement in the efficiency of
international road and rail freight in many regions. Of course, it is not simply a question of
transit time and reliability (although both are important), it is also a question of cost.
One study has compared total door-to-door transport costs and transit times for a
range of transport solutions carrying cargo from Asia to Europe (Chamber of Commerce of
the United States, 2006). Air transport had the highest cost, but very short transit times. Sea
transport provided the lowest cost, but had long transit times. The road freight results fall
between air and sea, both in terms of cost and transit time. Rail transport exhibited a very
wide range of costs and transit times, and showed major differences between the officially
scheduled transit times and the actual transit times achieved.
Within the next 15 years, there seem to be limited opportunities to dramatically
increase the speed of either ships or aircraft. Indeed, concern about CO2 emissions could
lead to changes in the role of air freight within the supply chain. There have even been calls
for sea freight transport to operate at slower speeds, in order to save fuel. Given these
GLOBALISATION, TRANSPORT AND THE ENVIRONMENT © OECD 201022
1. INTRODUCTION AND MAIN FINDINGS
uncertainties, it is interesting to note the particular potential for rail movement to offer
opportunities for shorter transit times, and possibly, reduced costs. Road freight times may
not have the scope to be reduced to the same extent. For both road and rail freight
transport, border crossings represent an important barrier to trade. Safety for drivers and
cargo is a major issue, especially for road transport.
A major increase in road and rail transport from eastern parts of Asia to Europe would
require major infrastructure investments, in particular for road transport. Although the
Trans-Siberian rail connection already exists, gauges of rail networks still differ among
countries involved.
There are many opportunities to improve the efficiency and reduce the environmental
impact of international road and rail freight transport. Many of these developments require
government intervention in the form of changes to regulatory policy, improvements to
infrastructure and the breaking up of public monopolies that currently often offer ill-
adapted services. This is a complex area when considered within one country; when it
concerns international developments, it is even more complicated.
When looking ahead 15 years, it is important to note the growing role played in
international transport by major logistics companies. The consolidation that is evident means
that single companies are now able to provide truly integrated services in a way that was
not possible a few years ago.
Environmental impacts of increased international transport
Shipping
Global CO2 emissions from maritime shipping (estimated based on sales of bunker)
almost tripled between 1925 and 2002 (Endresen et al., 2007). The corresponding SO2
emissions more than tripled over the same period. The majority of today’s ship emissions
occur in the northern hemisphere, within a well-defined system of international sea routes.
Activity-based modelling for 1970-2000 indicates that the size and the degree of
utilisation of the fleet, combined with the shift to diesel engines, have been the major factors
determining yearly energy consumption. One study indicates that (from about 1973 – when
bunker prices started to raise rapidly) growth in the fleet was not necessarily accompanied
by increased energy consumption (Endresen et al., 2007). The main reason for a large
deviation among activity-based emissions estimates is the number of days assumed at sea.
Data indicate a strong dependency on ship type and size: activity-based studies have not
considered ships less than 100 GT (e.g. some 1.3 million fishing vessels), and this fleet could
account for a substantial part of additional fuel consumption.
Recent studies indicate that the emission of CO2, NOx, and SO2 by ships correspond to
about 2% to 3% (perhaps 4%), 10% to 15%, and 4% to 9% of global anthropogenic emissions,
respectively. Ship emissions of e.g. NO2, CO, NMVOCs, SO2, primary particles, heavy metals
and waste cause problems in coastal areas and harbours with heavy traffic. Particularly
high increases of short-lived pollutants (e.g. NO2) are found close to regions with heavy
traffic e.g. around the North Sea and the English Channel. Model studies tend to find NO2
concentrations to be more than doubled along the major world shipping routes. Absolute
increases in surface ozone (O3) due to ship emissions are pronounced during summer
months, with large increases again found in regions with heavy traffic. Increased ozone
levels in the atmosphere are also of concern with regard to climate change, since ozone is
an important greenhouse gas.
GLOBALISATION, TRANSPORT AND THE ENVIRONMENT © OECD 2010 23
1. INTRODUCTION AND MAIN FINDINGS
Formation of sulphate and nitrate resulting from sulphur and nitrogen emissions causes
acidification that might be harmful to ecosystems in regions with low buffering capacity, and
lead to harmful health effects. Coastal countries in western Europe, western North America
and the Mediterranean are substantially affected by ship emissions in this way.
The large NOx emissions from ship traffic lead to significant increases in hydroxyl
(OH), which is the major oxidant in the lower atmosphere. Since reaction with OH is a
major way of removing methane from the atmosphere, ship emissions decrease methane
concentrations. (Reductions in methane lifetimes due to shipping-based NOx emissions
vary between 1.5% and 5% in different calculations, see Chapter 6.) The effect on
concentrations of greenhouse gases (CO2, CH4 and O3) and aerosols have differing impacts
on the radiation balance of the earth-atmosphere system. Ship-derived aerosols also cause
a significant indirect impact, through changes in cloud microphysics.
In summary, most studies so far indicate that ship emissions actually lead to a net
global cooling. This net global cooling effect is not being experienced in other transport
sectors. However, it should be stressed that the uncertainties with this conclusion are
large, in particular for indirect effects, and global temperature is only a first measure of the
extent of climate change in any event.
The contribution to climate change from the different components also acts at
different temporal and spatial scales. A long-lived well-mixed component like CO2 has
global effects that last for centuries. Shorter-lived species like ozone and aerosols might
have effects that are strongly regional and last for only a few days to weeks. The net cooling
effect that so far has been found primarily affects ocean areas, and thus does not help
alleviate negative impacts of global warming for human habitats.
Projections up to year 2020 indicate growth in maritime fuel consumption and
emissions in the range of 30%. However, if more weight is given to the large increase in
emissions during the last few years, even larger increases in ship emissions could take
place in the coming decades. By 2050, CO2 emissions from maritime shipping could reach
two to three times current levels (Eyring et al., 2005).
More specifically, most scenarios for the next 10 to 20 years indicate that the effects of
regulations and other policy measures will be outweighed by increases in traffic, leading to
a significant global increase in emissions from shipping. Global emission scenarios for
non-ship (land-based) sources also indicate that the relative contribution to pollutants
from shipping could increase, especially in regions like the Arctic and South-East Asia,
where substantial increases in ship traffic are expected.
Limiting the sulphur content in fuel in the North Sea and English Channel seems to be
an efficient measure to reduce sulphate deposition in nearby coastal regions. Several
technologies also exist to reduce emissions from ships beyond what is currently legally
required (e.g. by the use of scrubbers and filters to capture emissions from the exhaust
gases and by the use of low-NOx engines).
Aviation
Expected technological innovations will probably not prevent an increase in CO2
emissions from aviation either, in light of expected increase in demand – but the rate of
technological progress will likely depend on the extent to which the sector faces a price on
GLOBALISATION, TRANSPORT AND THE ENVIRONMENT © OECD 201024
1. INTRODUCTION AND MAIN FINDINGS
the CO2 it emits. Depending on the technology and scenario used, the average “external”
(i.e. environmental) cost of air travel is about EUR 0.01 to EUR 0.05 per passenger-kilometre
(Dings et al., 2003).
Major airlines use “hub-and-spoke” networks, which means that selected airports
receive a relatively large share of all take-offs and landings in the network. As a result,
noise pollution in the surrounding areas is relatively high, and passengers travelling
indirectly have to make a detour (thereby increasing the total emissions related to their
trip). But hub-and-spoke networks might also have environmental benefits, due to
environmental economies of scale: larger aircraft with lower emissions per seat can be
used because passenger flows are concentrated on fewer links. The literature suggests,
however, that the negative environmental effects of hub-and-spoke networks tend to
exceed the positive effects. If the large airline companies focus their networks on a few
intercontinental hubs, traffic levels will increase at these hubs due to the generally
expected increase in demand, but also because more people need to make transfers.
Air travel connects regions to the world economy, and gives individual travellers the
opportunity to explore the world. But as long as the full external cost is not covered by the
ticket price, environmental damage caused by aviation will continue to grow beyond
socially optimal levels.
Road and rail
International road and rail freight transport account for a minor, but increasing, share
of global transport emissions of air pollutants (e.g. NOx) and noise emissions. The
contribution of these emissions to local air pollution is actually decreasing in most parts of
the world, mainly due to various vehicle emission standards that have been implemented
(and periodically tightened) all over the world. Only in those parts of the world that have
an extremely high growth in transport volumes have overall transport-related emissions of
local air pollutants not yet decreased.
On the other hand, CO2 emissions from international road freight transport are increasing
all over the world (and could roughly double to 2050), and there is not yet a sign that this trend
is to be curbed soon. For this challenging problem, there is no single cure available, and the
scale effects will likely outweigh the technological options. A mix of measures, such as road
pricing, higher fuel taxes, stricter fuel efficiency standards for vehicles, use of alternative fuels
and logistical improvements, will be needed to reverse these trends.
Policy instruments
Theory suggests that all policy instruments, if properly designed, will reflect the right level
of policy ambition (i.e. where marginal benefits just equal marginal costs). However, theory also
suggests that a cost-effective result is more likely to be realised via market-based instruments
(such as taxes and tradable permits) than by using regulatory or voluntary approaches.
On the other hand, there is no silver bullet that can solve all the environmental
problems created by transport activity. In some cases, for example regarding emissions of
local air pollutants, standards will be the most effective and efficient instruments. A mix of
instruments will in many cases be needed. It is, however, important to assess carefully what
each instrument adds to the mix, and how the instruments interact. Policy needs in OECD
countries are likely to be different from policy needs in developing countries. The optimal
instrument mix will therefore vary from situation to situation.
GLOBALISATION, TRANSPORT AND THE ENVIRONMENT © OECD 2010 25
1. INTRODUCTION AND MAIN FINDINGS
On the one hand, a multilateral approach is preferable on both efficiency and effectiveness
grounds (especially over the long term), provided sufficient political will exists internationally
to co-operate on solving the underlying environmental problem. The international regulatory
framework for greenhouse gases does, however, not assign responsibility to nations for
managing emissions from shipping and aviation. Although international regimes can
sometimes constrain governments’ ability to regulate activities that are harmful to the
environment, international law does provide many opportunities to adopt new instruments to
regulate environmental impacts from increased international transport.
On the other hand, the constraints to successful international negotiations will
sometimes be rather imposing. International agreements take a long time to put in place;
they are also hard to enforce. They might also be characterised by significant “leakage”
problems, in the sense that emitters might be able to shop around for less stringent
jurisdictions. It may also be that emission control is actually too narrow an approach for
such a complex sector as transport. In principle, an optimal international agreement
related to transport and climate change should also include such elements as adaptation
and technology development, rather than being limited to just controlling emissions.
International coalitions may also need to be built from the bottom up. One element of
this approach would involve regional arrangements among like-minded countries, or among
countries that share a common (regional) environmental problem (e.g. SOx). These regional
agreements can then serve as building blocks or demonstration experiments toward more
international action over the longer term (e.g. linking up emission trading systems in
different regions). One caveat here, of course, is that the difficulty of regional systems to
draw important emitters into the regional system (e.g. China, and India, in the case of
greenhouse gas emissions) will inevitably mean that a regional approach would be less
efficient than a global approach.
Unilateral action also has a role to play, even at the international level. Not only is
unilateral action often the most appropriate approach (e.g. when the pollution involved
affects only the national territory, which is mostly the case for much of land-based
transport), local policies can sometimes help to force subsequent changes within the
international regime (e.g. EU noise standards for airplanes were eventually adopted by
ICAO). In the case of climate change, this example could also play an important role in the
future, inasmuch as the EU is poised to apply its greenhouse gas emission trading system
unilaterally to international air (and potentially, even to sea) transport. The power of
unilateral action to eventually lead to positive outcomes at the international level over the
medium term should therefore not be underestimated.
Although international transport regimes have historically focused on protecting
transport activity, there is now a trend toward countries recognising the need for the global
transport regimes to deal with environmental problems. Two international organisations in
particular – ICAO and IMO – have been explicitly tasked to address climate change and
other environmental challenges arising from international transport. These are
encouraging developments.
The interface between global and local regulation is key. Both forms of regulation are
clearly legitimate in their own contexts, but there should be more energy expended on
making these two sets of objectives compatible with each other. In particular:
● Global regimes should not be perceived as limitations on intelligent national action.
National action has historically been the cornerstone of environmental policy, and this
GLOBALISATION, TRANSPORT AND THE ENVIRONMENT © OECD 201026
1. INTRODUCTION AND MAIN FINDINGS
important role deserves explicit recognition when international agreements are being
negotiated.
● On the other hand, any national action that is being considered should explicitly respect
the basic principles of non-discrimination and national treatment, principles that are
systematically built into all existing international regimes to protect against economic
distortions.
Lowest priority for international action would seem to be to try to use Article XX of the
GATT. Using trade-based regulation to resolve environmental problems in the transport sector
seems a very indirect way of reaching transport-environment policy integration objectives.
Priorities for policy action
The climate change issue will clearly lie at the heart of efforts to deal with the
environmental impacts of transport that result from globalisation. No other environmental
issue has so many potential implications for transport sector policy today. Although the
specific estimates vary, transport-based CO2 emissions are projected to grow significantly
in the coming years. Light duty vehicles on roads will continue to be the largest
contributors to this problem, but air-based emissions will grow more rapidly. Some shift
toward less carbon-intensive technologies is foreseen, but no significant shift to truly low-
carbon technologies is anticipated in most of the current estimates. In other words,
incremental, rather than drastic, technological change is foreseen.
Modes for which pre-existing policies are relatively weak, such as shipping and
aviation, seem to be ideal candidates for integration into broader efforts to introduce
climate change policy frameworks. Surface transport, on the other hand, is characterised
by stronger existing policies, so its further integration into such broader frameworks seems
less straightforward.
Global economic activity also leads to problems other than climate change (including
local air pollutants, such as NOx, SOx, particulates and noise): these problems will need to
be addressed.
At the national or local level, the road transport sector is already quite heavily regulated
in one form or another (through standards, taxes, etc.). This implies that further abatement
in road transport emissions may be relatively more costly. More cost-effective opportunities
may exist in other transport sectors (especially in aviation and shipping) but measures in
these sectors will primarily have an impact near airports, harbours and major sea lanes.
At the international level, it may be possible to develop common fuel-efficiency
standards, but this would not be straightforward. The international regime related to
shipping in particular is still in its early stages of development, so there are opportunities
to mould that regime. The IMO/MEPC is trying to work toward effective and efficient
control polices for shipping, so there are some initiatives being taken toward this goal:
● First, movements of highly hazardous substances should continue to be controlled essentially
by regulatory means: bans, prior informed consent rules (e.g. Rotterdam Convention), etc.
When the problem involves serious health hazards, the environmental effectiveness
objective should always take precedence over the economic efficiency goal. Outright bans,
combined with total transparency, are the safest ways forward in these circumstances.
GLOBALISATION, TRANSPORT AND THE ENVIRONMENT © OECD 2010 27

1. INTRODUCTION AND MAIN FINDINGS
● Second, some environmental impacts, e.g. exhaust emissions, may effectively be
addressed by standards, which should provide as much flexibility as possible for
producers to come up with low-cost solutions.
● Third, as mentioned above, the bulk of the “heavy lifting” in the policy response should
be given over to market-based instruments (taxes and tradable permits).
Inclusion of aviation and maritime transport in cap-and-trade systems would be
especially desirable from a cost-effectiveness point of view. For both of these modes,
technological abatement options are limited in the short run because of slow fleet
turnover. In the maritime sector, operational measures seem capable of reducing CO2
emissions in the short run, and at low cost. In aviation, there is also some scope for
abatement through better air traffic control and airport congestion management, but the
main abatement is likely to come from lower demand. Available estimates put an upper
bound of about 5% on demand reductions, at prices of around EUR 20 per tonne of CO2.
Imperfect competition and airport congestion limit the extent of pass-through, and hence
limit the demand responses. The aviation sector, hence, is likely to be a net buyer of
emission allowances. Both in aviation and in shipping, there is considerable scope for
leakage as long as trading schemes are not comprehensive. Nevertheless, inclusion of
these modes in trading schemes is desirable if overall abatement is to be cost effective in
the long run.
When it comes to road transport, however, taxes and tradable permits present a
particular problem. The optimal policy response to fuel-related externalities (such as
climate change) is different from the optimal policy responses to distance-related
externalities (such as congestion, accidents and air pollution). Imposing a fuel tax induces
some improvement in both distances travelled and fuel efficiency. But it does not reduce
distance-related externalities much, while most studies suggest that distance-related
externalities in road transport are significantly higher than fuel-related ones.
A more efficient approach would therefore seem to be to use distance-related taxes, such
as road pricing. But the problem with this approach is that the distance travelled is not the
most important contributor to GHG emissions – the most important target of climate
policies. For climate change, fuel efficiency will remain the primary goal, and distance-
related taxes would be too indirect.
For example, the EU has high fuel taxes and may soon introduce fuel economy
standards. The US has relatively low fuel taxes, but fuel economy is regulated by a
fuel-economy standard that is now being tightened. In the EU, road transport is not included
in CO2 emission trading system. In various US proposals, one idea is to eventually include the
sector in carbon trading schemes, possibly through “upstream” trading. Since existing
policies are relatively stringent, abatement costs for CO2 in road transport are also relatively
high (and exceed current and expected prices for carbon permits). Further tightening of
regulations would therefore seem undesirable from only a climate change point of view, but
since these prevailing policies serve other purposes than just greenhouse gas reductions, it
is not clear if the welfare cost of further tightening would be very high. For example, higher
fuel taxes in the US seem justified if the primary policy goal is to reduce congestion; this policy
would also reduce greenhouse gas emissions.
On the other hand, the case for tighter fuel economy standards taxes in road transport
to reduce greenhouse gas emissions is weak, at least within the static welfare economic
framework used above. It is, however, sometimes argued that these policies are needed to
GLOBALISATION, TRANSPORT AND THE ENVIRONMENT © OECD 201028
1. INTRODUCTION AND MAIN FINDINGS
increase the dispersion of more fuel-efficient vehicles through the fleet. The reason is said
to be that the market provides relatively weak incentives to improve fuel economy, given
consumers’ response to various uncertainties surrounding investments in fuel economy. If
consumers are not willing to pay very much now for fuel economy improvements that only
provide economic benefits over a long timescale, producers may not be willing to supply
fuel-efficient vehicles either. If the goal is to change engine technologies, one way around
this problem could be for the government to force fuel economy into the marketplace via a
fuel-economy standard. The case for such standards would be strongest if fuel taxes are
low and incomes are high (in these cases, drivers care even less about the fuel economy of
their vehicles). However, a more cost-efficient approach could be to increase the fuel taxes.
Possibilities exist in both IMO and ICAO to find new ways of regulating GHG emissions
(see Chapter 10). This could follow the partly successful model of regulating NOx, SOx and
noise emissions from air and sea transport.
Aggressive GHG emission abatement strategies will inevitably require technological
change. In particular, because of the point made earlier that the road transport market will
not provide enough private incentives to improve fuel economy, government technology
policies will be needed to overcome this reluctance. Similarly, the slow fleet turnover rates
in both aviation and shipping may also need to be increased, via technology-based public
policies. Carrots are always more easily implemented in policy practice than sticks, so well-
designed subsidy arrangements could hold some promise for future policy directions – but
there is always a risk that the cost-effectiveness could be low, as the subsidised activities
would have been undertaken in any case.
A few other policy approaches also seem to have some issues associated with them:
● Public procurement policies can create competition problems.
● Labelling runs the risk of not generating more environmental benefits than would have
been generated in any case (the “baseline” problem).
More generically, wider use could be made of the common interest of shipping ports in
controlling environmental pollutants. Ports also have a regional context (not only a local/
domestic one) that could be built upon more creatively in designing response strategies.
Most shipping passes through a port of an OECD country at some time during the course of
a shipment: this represents a key opportunity for more concerted action.
The corporate responsibility angle should also be more fully exploited. Although 75% of
the global merchant vessel fleet is registered in non-Annex 1 countries, this fleet is mostly
owned by shipping interests in Annex 1 countries. This represents an interesting
opportunity to work towards coalitions of shippers that might eventually develop common
guidelines related to environmental protection in the shipping community.
And finally, information programmes could be aimed at Flag states to illustrate that
their competitiveness need not suffer from a more environmentally friendly approach, and
might therefore be in their own long-term marketing interests.
References
Antweiler, Werner, Brian R. Copeland and M. Scott Taylor (2000), “Is Free Trade Good for theEnvironment?”, American Economic Review, 91(4), pp. 877-908.
Chamber of Commerce of the United States (2006), Land Transport Options between Europe and Asia:Commercial Feasibility Study, Chamber of Commerce of the United States.
GLOBALISATION, TRANSPORT AND THE ENVIRONMENT © OECD 2010 29
1. INTRODUCTION AND MAIN FINDINGS
Chintrakarn, P. and D.L. Millimet (2006), “The Environmental Consequences of Trade: Evidence fromSubnational Trade Flows”, Journal of Environmental Economics and Management, 52(1), pp. 430-453.
Dings, J.M.W. et al. (2003), External Costs of Aviation, Environmental Research of the Federal Ministry of theEnvironment, Nature Conservation and Nuclear Safety, Research Report 299 96 106, UBA-FB 000411.
Endresen, Ø. et al. (2007), “A Historical Reconstruction of Ships’ Fuel Consumption and Emissions”,Journal of Geophysical Research, 112(D12301).
Eyring, V. et al. (2005), “Emissions from International Shipping: 2. Impact of Future Technologies onScenarios Until 2050”, Journal of Geophysical Research, 110(D17306), doi: http://dx.doi.org/10.1029/2004JD005620.
Magani, S. (2004), “Trade Liberalization and the Environment: Carbon Dioxide for 1960-1999”, EconomicsBulletin, 17(1), pp. 1-5.
OECD (2005), Measuring Globalisation: OECD Handbook on Economic Globalisation Indicators 2005, OECD, Paris.
GLOBALISATION, TRANSPORT AND THE ENVIRONMENT © OECD 201030

Globalisation, Transport and the Environment
© OECD 2010
Chapter 2
Globalisation’s Direct and Indirect Effects on the Environment
byCarol McAusland1
This chapter explores research into the relationship between globalisation and theenvironment, looking at patterns and rates of growth in international trade andforeign direct investment. It provides a summary of knowledge of globalisation’sindirect effects, focusing largely on current estimates of the size of the scale,composition and technique effects of globalisation. The chapter concludes with a briefdiscussion of the various direct effects of globalisation, notably transport-relatedemissions and biological invasions, and attempts to put these into the broader contextof overall effects. The chapter concludes that, although recent evidence concerningtrade and local pollution is encouraging, the evidence concerning carbon and othergreenhouse gas emissions is less so. One explanation for the pessimistic assessmentsof trade’s impact on greenhouse gas emissions is their global nature. Not only are thecosts of CO2 emissions shared with citizens abroad (who have no political voiceoutside their own country), but many greenhouse emissions are associated with fossilfuel use, for which few economically viable substitutes have emerged to date. Theincome and technique effects that are largely responsible for reductions in local airpollutants do not seem to have the same force when the pollutant in question burdensthe global population.
31

2. GLOBALISATION’S DIRECT AND INDIRECT EFFECTS ON THE ENVIRONMENT
2.1. IntroductionFor over a quarter century, researchers have recognised the potential for increasing
trade to negatively impact the environment. Highly publicised events, such as the fate of
the Khian Sea,2 the leak of an internal World Bank memo signed by Chief Economist
Lawrence Summers (in which Summers appeared to urge World Bank economists to
encourage pollution-intensive industry migrate to developing countries3) and riots at
the 1999 World Trade Organization meetings in Seattle brought the question of whether
the surge in international trade is good or bad for the environment onto the world stage.
Research into the net effect of globalisation on the environment has matured,
although there remain many outstanding questions. Moreover, there has been little or no
effort at linking up the two broad schools of thought on the direct and indirect effects of
globalisation on our natural environment. The direct effects include emissions and
environmental damage associated with the physical movement of goods between
exporters and importers. This includes emissions from fossil fuel use, oil spills and
introductions of exotic species. At the same time, growth in trade and foreign direct
investment (FDI) has numerous indirect effects. These indirect effects are often classified in
scale, composition and technique effects.
2.2. Growth of trade and FDITrade has grown substantially over the past 50 years, in both value and volume.
Between 1951 and 2004, the average annual growth rate of world trade by tonnage was 5.7%.
When measured by present value, the average growth rate was 7.4% (Hummels, 2007).4
Projections are for continued strong growth in the longer term. Using a gravity model of
trade, based on measures of economic, geographical, political and cultural variables over
the 1948 to 1999 period, the Hamburg Institute of International Economics (HWWI)
forecasted trade value among industrialised countries to grow at 5.7% per annum until 2030,
while trade within South Asia, East Asia and Pacific, and Latin America was projected to grow
at 10.9%, 12.6%, and 8.5% per annum respectively (Berenburg Bank and HWWI, 2006).
FDI has also been growing at a rapid pace. Between 1986 and 2000, 65 countries saw
inward FDI grow by 30% or more. The growth rates in 29 other countries ranged between
20 and 29% (UNCTAD, 2003). FDI has increased most quickly for industrialised countries.
During the 1998-2000 period, just three regions accounted for over 75% of global inward FDI
and 85% of global outward FDI: the European Union, the United States and Japan.
Developed countries account for more than 75% of global inward FDI (UNCTAD, 2003).
A number of factors explain the growth of trade and FDI. Bilateral and multilateral
negotiations have reduced average tariff rates on manufactured goods to 1.8% in high-income
countries, 5.5% in middle-income countries and 14.2% in low-income countries5 (World Bank,
2007). At the same time, technological improvements have lowered shipping and
communication costs.
GLOBALISATION, TRANSPORT AND THE ENVIRONMENT © OECD 201032

2. GLOBALISATION’S DIRECT AND INDIRECT EFFECTS ON THE ENVIRONMENT
2.3. Early researchThe earliest empirical research on how globalisation impacts the environment tended to
ask the reverse question: how does environmental regulation impact trade? The prevailing
wisdom was that, if trade impacts the environment, it must be the case that environmental
regulation affects trade flows. Only then would the argument that trade worsens the
environment by shifting pollution-intensive production to low-regulation (and often
low-income) countries make sense. This proposition – that globalisation facilitates the
relocation of dirty industry to poor countries – is known as the Pollution Haven Hypothesis
(PHH). The earliest empirical work found little evidence in support of a PHH. In fact, by the
time of Levinson’s 1997 survey, the general consensus was that, while the PHH was
theoretically persuasive, the data just did not support it.
Nevertheless, subsequent empirical research has found evidence of a weaker
relationship between regulatory stringency and trade patterns and volumes, known as the
Pollution Haven Effect (PHE). The PHE is the hypothesis that stringent environmental
regulation has an impact on comparative advantage at the margin, but that it does not
necessarily lead to a wholesale migration of industry to regions with weaker regulation. This
research has focused on providing econometric solutions to problems plaguing the early
studies, most notably the endogeneity of regulation, trade flows and investment in the first
place. For example, Levinson and Taylor (2008) examined the relationship between industry
spending on abatement and pollution control on the one hand and import penetration
(measured as the sum of imports and exports as a ratio to total domestic output) on the other
side, in the United States. Amongst other things, they found that industries whose
abatement costs increased the most experienced the largest increases in net imports. They
also found that for the 20 industries facing the largest relative pollution control costs, more
than half of the increase in trade volume can be attributed to changes in domestic regulation.
Similarly, Ederington et al. (2005) found that import penetration is higher for industries with
high pollution abatement and control expenditures relative to total costs. This correlation is
stronger for industries protected by import tariffs. They also found that the pro-import effect
of tariff reductions is stronger for clean industries than for dirty ones. They concluded that “if
anything, trade liberalisation has shifted US industrial composition toward dirtier industries,
by increasing imports of polluting goods by less than clean goods”, a result at odds with the
popular sentiment that trade liberalisation has shifted dirty industry out of the United States
and into its less-developed trading partners, but consistent with the proposition that the
United States has a comparative advantage in dirty goods (to be discussed further below).
2.4. Indirect effectsIn their review of the literature on the PHH and PHE, Copeland and Taylor (2004) credited
some of the recent success in uncovering impacts of globalisation on the environment to the
pairing of theory and empirics. In the early 1990s, researchers identified that globalisation is
likely to impact the environment through three principle channels – composition, scale and
technique effects:
● The composition effect measures changes in emissions arising from the change in a
country’s industrial composition following trade liberalisation.6 If, for example,
liberalisation induces an economy’s service sector to expand and its heavy industry to
contract, the country’s total emissions will likely fall, since the expanding sector is less
emission intensive.
GLOBALISATION, TRANSPORT AND THE ENVIRONMENT © OECD 2010 33
2. GLOBALISATION’S DIRECT AND INDIRECT EFFECTS ON THE ENVIRONMENT
● Under the scale effect, more efficient allocation of resources within countries shifts the
global production possibilities frontier, raising the size of the industrial pollution base
and resulting in greater global emissions.
● The technique effect refers to the plethora of channels through which trade liberalisation
impacts the rate at which industry and households pollute. These channels include
changes in the stringency of environmental regulation in response to income growth or
the political climate surrounding regulation. The technique effect also includes
technology transfer facilitated by trade.
2.5. Composition effectTrade liberalisation changes relative prices: eliminating tariffs and non-tariff barriers
lowers the relative price of import-competing goods. Suppose this leads to an increase in the
output of Sector E (for Expanding) and a reduction in the output of Sector C (for Contracting).
Changes result from, say, capital and labour moving from the contracting sector to the
expanding sector in response to a change in relative goods prices. This resource reallocation
will lower a country’s total emissions if the expanding sector is less pollution-intensive than
the contracting sector. Specifically, holding the scale of economic activity and production
techniques constant, the composition effect can be summarised as the following change in
the country’s total emissions Z: Z = eEQE + eCQC where indicates changes, ei indicates
emission intensity in Sectors i and Qi is output. If, for example, prices were equal across
sectors, then an income- and scale-preserving reallocation of resources across sectors would
require QE = –QC, such that the change in emissions can be written as Z = [eE – eC]QE.
That is, trade will lower national emissions if and only if the expanding sector is relatively
less pollution intensive.
This begs the question of which sectors will expand as a result of liberalising trade. The
Heckscher-Ohlin theory of trade suggests that the industries most likely to face competition
from imports (and so to contract following tariff liberalisation) are those that depend relatively
heavily on the country’s scarce factor. A case in point: textiles and clothing are amongst the
most heavily protected sectors in the United States, a country whose endowment of unskilled
labour is small relative to its capital and land endowments (when compared to international
averages). Moreover, for some pollutants at least, there is a strong correlation between an
industry’s emissions and its capital intensity. Using OECD’s Environmental Data Compendium
(1999), Cole and Elliot (2003) calculated: a 0.42 correlation between SO2 intensity and capital
intensity; the correlation for NOx was 0.44; both correlations were statistically significant.7
Similarly, Cole and Elliot (2005) calculated a correlation between pollution abatement and
operating costs (per dollar of value added) and physical capital per worker of 0.69 and 0.53 at
the 2- and 3-digit SIC code levels respectively.
Because of the often strong correlation between emission intensity and capital intensity,
Antweiler et al. (2001) postulated a Factor Endowments Hypothesis (FEH). This predicts that
trade liberalisation will lead to an increase in emissions in capital-abundant countries, and a
reduction in capital-scarce countries. They tested this hypothesis, as well as several other
hypotheses maintained in the literature, using panel data on city-level ambient SO2
concentrations, and found evidence that concentrations of SO2 were increasing in a
country’s capital-to-labour ratio. They calculated the composition elasticity, and found that,
for most specifications, “a 1-per cent increase in a nation’s capital-to-labour ratio – holding
scale, income and other determinants constant – leads to perhaps a 1-per cent point increase
GLOBALISATION, TRANSPORT AND THE ENVIRONMENT © OECD 201034
2. GLOBALISATION’S DIRECT AND INDIRECT EFFECTS ON THE ENVIRONMENT
in pollution”. Cole and Elliot (2003) replicated Antweiler et al.’s (2001) study for SO2 and
extended the analysis to consider CO2, NOx, and biological oxygen demand (BOD) as well;
their estimated composition elasticities are 2.3 and 0.45 for SO2 and CO2, and statistically
indistinguishable from zero for NOx and BOD. Using Chinese data, Shen (2007) calculated
composition effects for SO2, dust fall, chemical oxygen demand (COD), arsenic and
cadmium, in each case finding that higher capital/labour abundance corresponds to more
pollution (with elasticities of 3.025, 1.079, 0.788, 1.325 and 2.416 respectively).
Another source of comparative advantage is regulatory stringency itself. The
preponderance of microlevel studies of the relationship between income and willingness-to-
pay (WTP) for environmental amenities suggests that demand for environmental quality
increases with income. This is consistent with the logic that environmental amenities are
“normal” goods: as we get richer, we want more of them. To the extent that demand for
environmental amenities influences environmental regulation, high-income countries are
likely to set stricter environmental regulation than do low-income countries, giving rich
countries a comparative advantage in relatively clean industries. Accordingly, trade
liberalisation that drives each country’s industry to restructure along the lines of its
comparative advantage should lead clean industries (e.g. services) to expand in rich countries.
Similarly, dirty industries will expand in poor countries. This can generate a Pollution Haven
Effect as discussed above, whereby strict regulation gives countries a comparative
disadvantage in dirty goods. There is evidence that income and regulatory stringency are
highly correlated. Thus one interpretation of the PHE is that poor countries have a comparative
advantage in dirty goods, other things (specifically capital abundance) being equal.
Because there is a strong correlation between per capita income and capital abundance
per capita (Welsch [2002] calculated a raw correlation of 0.95), in theory we expect the PHE
and FEH to offset each other in empirical tests that only control for either national income or
factor abundance, but not both. Recognising this, Antweiler et al. (2001) and Cole and Elliot
(2003) each constructed indices of comparative advantage, where the comparative advantage
index is the sum of quadratic functions of per capita gross domestic product (GDP) and
capital-labour ratios, each measured relative to a global average. They then interacted these
comparative advantage indices with measures of openness, to calculate trade-induced
composition elasticities. In the Antweiler et al. (2001) sample, the statistically average
country had a comparative advantage in clean goods, with a corresponding trade-induced
composition elasticity between –0.4 and –0.9. Stated alternately, for the mean city in their
sample, Antweiler et al. (2001) calculated that a 1% increase in openness reduced SO2
concentrations by between 0.4 and 0.9%, holding income and scale constant.
Santos-Pinto (2002) similarly estimated a trade-induced composition elasticity, focusing
exclusively on CO2 emissions (as imputed using United Nations data on fossil fuel use). For
the average country in his sample, Santos-Pinto (2002) estimated that a 1% increase in the
trade ratio (exports plus imports, divided by gross national product, GNP) leads to a 0.1%
reduction in CO2 emissions, holding income and scale constant. Santos-Pinto points out that
this trade-induced composition effect, although favourable to the environment for the
average country in his sample, is only about one-fifth as large as the (negative) scale and pure
composition effects. In contrast, in the Cole and Elliot (2003) sample, the median observation
had a comparative advantage in dirty goods; specifically, for the statistically median country
in their sample, a 1% increase in trade (holding income and scale constant) raised SO2, CO2
and BOD levels by 0.3%, 0.049% and 0.05% respectively.8 Shen (2007) used concentration data
from China and found mixed effects. Shen’s (2007) estimates of the trade-induced
GLOBALISATION, TRANSPORT AND THE ENVIRONMENT © OECD 2010 35
2. GLOBALISATION’S DIRECT AND INDIRECT EFFECTS ON THE ENVIRONMENT
composition elasticity were as follows: 1.556, 1.962, –2.148, –0.236 and –3.884 for SO2, dust
fall, COD, arsenic and cadmium respectively, such that, holding income/scale and
composition fixed, an increase in trade intensity leads to higher SO2 and dust
concentrations, but lower COD, arsenic and cadmium for the average province in China.
Frankel and Rose (2002, 2005) similarly tested whether the impacts of openness on the
environment are stronger when a country has a capital-labour ratio that is above the global
average, or per capita income that is below average. They tested the impact of openness on
concentrations of NO2, SO2 and particulate matter (PM), CO2 emissions, deforestation,
energy depletion and rural clean water access. Their approach was distinct from earlier
assessments in that they used instrumental variables to account for the endogeneity of
trade volumes and income levels. Because there was little variation in their instrument for
trade volumes, they restricted their attention to cross-sectional data. They included an
interaction term between relative capital abundance and openness to see whether capital-
abundant countries have a comparative advantage in dirty goods, and found the signs are
mixed and the large standard errors render the interaction term statistically insignificant.
To test the PHE, Frankel and Rose (2002, 2005) ran separate regressions that included
an interaction between income and openness; their results were statistically insignificant
except for PM and SO2, for which they found that income has a deleterious effect on
concentrations in more open economies. They concluded “there is no evidence that poor… or
capital-abundant countries use trade to exploit a ‘comparative advantage’ in pollution” (Frankel
and Rose, 2005). Although their evidence is informative, one should hesitate to conclude it
refutes the FEH and PHE. As noted above, income and capital abundance are highly
correlated. If only one variable is included in the interaction, the fitted coefficient may well
reflect the influence of the excluded variable. Since the FEH and PHE work in opposite
directions on pollution levels, a statistically insignificant interaction between capital
abundance and openness, for example, may simply reflect two counteracting effects,
rather than absence of a factor endowment effect.
The majority of the empirical evidence seems to suggest that there is an economically
and statistically significant interaction between measures of trade intensity and relative
capital abundance for local air pollutants. Whether this interaction favours or harms the
environment varies among countries, depending on whether they are capital rich or poor,
relative to the rest of the global economy.
Measures of aggregate capital and labour supplies are crude measures of comparative
advantage. Other industry characteristics, such as the importance of transport costs and
timeliness, may be equally important. Hummels (2007) argued that transport costs and
times are currently a larger barrier to trade than tariffs9 in industrialised countries. “[F]or
the median individual shipment in US imports in 2004, exporters paid USD 9 in transport
costs for every USD 1 they paid in tariff duties.” Reduced transport times favour industries
with time-sensitive products disproportionately, but no empirical investigation seems to
have been made into the relative pollution intensity of time-sensitive and -insensitive
products. Reduced transport costs will similarly favour industries for which transport costs
make up a large portion of delivered costs (Hummels, 2007). Investigating the relationship
between import penetration and abatement costs at the industry level in the United States,
Ederington et al. (2005) found evidence that industries facing substantial transport costs
are relatively insensitive to changes in environmental regulation.
GLOBALISATION, TRANSPORT AND THE ENVIRONMENT © OECD 201036
2. GLOBALISATION’S DIRECT AND INDIRECT EFFECTS ON THE ENVIRONMENT
Another dimension where empirical evidence into the composition effects of trade is
lacking concerns consumers and agriculture. For example, Costello and McAusland (2003)
argued that an increase in the volume of trade expands the platform for biological invasions
(more goods coming in on more ships translates to more material in which an exotic species
can stow away), but that crop-related damages from exotic species may nevertheless decline
with trade, if the agricultural sector contracts as a result of trade liberalisation. They pointed
to the protection of the US sugar industry as an example of how protectionism can therefore
raise damages from invasive species. The price of sugar in the US is roughly twice that in
international markets. This has led the land area in the US planted with sugar to expand
even though land planted for all crops has been contracting. The accidental introduction of
Mexican Rice Borer now leads to damages of between USD 10 million and USD 20 million for
the sugar sector in Texas alone, compared to annual revenue from the Texas sugarcane crop
of USD 64 million (Costello and McAusland, 2003).
Trade liberalisation also alters prices facing households, inducing consumers to
change the mix of goods consumed. To the extent that consumers generate emissions or
deplete resources when goods are consumed, trade liberalisation should have an impact on
the emission intensity of a dollar’s worth of goods consumed. For example, many countries
subsidise (at least implicitly) fossil fuel consumption. Some countries do this through
implicit export taxes on energy, or implicit subsidies to consumption. Venezuela is an
extreme example, where the 2006 price per litre of premium gasoline was only USD 0.05.10
2.6. Global net composition effectThe discussion above focused on the impact of trade liberalisation on industrial
composition at a national level. Holding the scale and techniques of production constant,
trade liberalisation will lead to a reduction in national emissions if the contracting sector
is more pollution intensive than the expanding sector, i.e. if eE < eC. A similar analysis
holds for changes in global emissions. Suppose reductions in output of Sector C in one
country are exactly matched by increased output in that sector abroad. Then whether a
scale- and income-neutral trade liberalisation raises or lowers global emissions depends
on the relative emission intensity in each trading partner. Specifically, using asterisks to
indicate changes in the rest of the world, the change in global emissions, ZG, will be
ZG=[eE – eC – (eE* – eC*) + 2eT]QE, where eT are emissions per unit traded.11 Thus, total
emissions will rise unless production techniques in the rest of the world are relatively
clean by a non-negligible margin. But there is evidence that, for some products at least,
countries with a natural comparative advantage in production of agricultural goods, for
example, use less energy-intensive production techniques.
A case in point is the distinction between food miles and carbon footprints. Since
the 1990s, it has been increasingly common for retailers in the UK and Europe to label food
products indicating the number of miles a food item was transported. The presumption
has been that food shipped smaller distances is less pollution intensive. However,
Saunders, Barber and Taylor (2006) showed that importing dairy and meat into the UK from
New Zealand would lead to fewer, not more, carbon releases than producing the same
goods locally, even accounting for emissions associated with transport. For example,
Saunders et al. (2006) calculated that raising (and transporting to the UK) one tonne carcass
of lamb in New Zealand resulted in 688 kilograms of CO2 emissions, while producing that
same amount of lamb in the UK and forgoing transport would result in 2 849 kilograms of
CO2 emissions.12 Similar carbon savings are associated with importing dairy and
GLOBALISATION, TRANSPORT AND THE ENVIRONMENT © OECD 2010 37
2. GLOBALISATION’S DIRECT AND INDIRECT EFFECTS ON THE ENVIRONMENT
out-of-season apples into the UK: 1422.5 vs. 2902.7 per tonne of milk solids, and 185 vs.
271.8 per tonne of apples (Saunders et al., 2006). In some cases the differences in emission
intensity stem from something as simple as differences in energy sources. Based on
estimates of total primary energy supply, IEA (2007) estimated that carbon emissions
per million tons of oil equivalent (MTOE) vary by as much as 100 times across countries:
CO2 emissions per MTOE are 0.13 and 0.15 for Democratic Republic of Congo and
Mozambique, compared to 3.46 and 3.75 for North Korea and Mongolia.13
2.7. The technique effectHow much a country emits per unit of a particular good produced or consumed
depends on the techniques of production or consumption. To the extent that globalisationchanges these techniques, either through policy channels or technological changes,globalisation impacts the environment itself. Most attention to technique effects hasfocused on changes in environmental policy associated with income gains from trade.Accordingly, much of the discussion below addresses empirical estimates of incomeeffects. However, subsequent sections also discuss evidence concerning additionalchannels through which globalisation impacts techniques, such as changes in the politicalenvironment shaping regulation, regulators’ ability to assess abatement potential andproducers’ ability to abate in the first place.
Technique effect – IncomeThe most widely studied channel through which liberalisation affects emission
intensities is the income growth associated with trade liberalisation. Estimates indicate that
the impacts of trade on income may be substantial. Using cross-country data on per capita
incomes, instrumented measures of trade shares (specifically, the value of a country’s
imports plus exports, divided by the value of its national output) and other control variables,
Frankel and Romer (1999) concluded that “a one percentage point increase in the trade share
raises income per person by 2.0 per cent”.14, 15 Frankel and Rose (2002, 2005) similarly
estimated per capita income as a function of (instrumented) trade shares, population (levels
and growth rates), per capita income (measured at a 20-year lag), investment per capita and
school enrolment rates. They did not, however, test for interactions between trade and any
measures of factor abundance. Frankel and Rose (2002) found that a one percentage point
increase in the ratio of trade to GDP led to a 1.6% increase in income.16
Any trade-generated income growth is important for the environment, as there is general
consensus from microlevel studies that raising incomes fuels demand for environmental amenities.
In fact, even though a handful of studies find a negative relationship between income and
environmental demand, the debate instead is whether demand for environmental amenities
rises more or less than proportionately with income;17 this is equivalent to asking whether the
income elasticity of the demand for environmental quality is above or below unity. Examining
parkland and forestation, Antle and Heidebrink (1995) found “the income elasticity of demand
for environmental services… [for high-income countries is] positive and generally greater than
one”. Shafik (1994) found an income elasticity of demand greater than one for a variety of
environmental amenities, including access to clean water and sanitation, as well as ambient
air quality. Boercherding and Deacon (1972), and Bergstrom and Goodman (1973) found
evidence that WTP for environmental improvements increased more than proportionately
with income. However, McFadden and Leonard (1992), and Kriström and Riera (1996) found
GLOBALISATION, TRANSPORT AND THE ENVIRONMENT © OECD 201038

2. GLOBALISATION’S DIRECT AND INDIRECT EFFECTS ON THE ENVIRONMENT
WTP as a fraction of income declined with income (suggesting an income elasticity of WTP of
less than unity).
There is a separate body of evidence using macrolevel data and environmental outcomes
that posits an inverted U-shape relationship between pollution concentrations (on the vertical
axis) and per capita income (on the horizontal axis); this inverted-U is known as an
Environmental Kuznets Curve (EKC). In one of the earliest papers on the subject, Grossman and
Krueger (1995) used GEMS data to estimate the cubic relationship between economic growth
(as proxied by per capita income) and concentrations of urban air pollutants and other
contaminants. They found that the negative relationship between growth and pollution
reversed itself at turning points. For example, for SO2, smoke, BOD, arsenic and mercury,
concentrations fall with income when per capita income exceeded USD 4 053, USD 6 151,
USD 7 263, USD 4 900 and USD 5 247 respectively. However, subsequent authors raised several
concerns with the EKC estimation exercise. Holtz-Eakin and Selden (1995) found that, even
though the marginal propensity to emit ultimately declines with income, rapid growth in
developing countries dominates, such that global CO2 emissions were projected to rise at
roughly 1.8% per year for the foreseeable future.
Theoretically, an EKC can be explained using Engel curves or changes in the types of
factor accumulation (see Copeland and Taylor, 2003). However, a decomposition of
emissions into emission intensities and input (e.g. energy) use suggest that regulation
likely plays an important role. Hilton and Levinson (1998) examined the relationship
between automotive lead emissions and income, for which they found an EKC. However,
they decomposed lead emissions into emissions intensity and energy use. Because energy
use is consistently increasing in per capita income, any emission reductions must come
through declining emission intensity, for which regulation is necessary. They also pointed
out that emissions intensity was declining, even holding income constant, for countries on
the upward sloping portion of the EKC. They took this as evidence that, during their study
period, there were technological changes that cannot be explained by income.
Others have raised issue with the econometrics underlying research finding evidence of
an EKC. Harbaugh et al. (2002) showed that the evidence for an inverted U in the GEMS data
“is much less robust than previously thought. … [T]he locations of the turning points, as
well as their very existence, are sensitive both to slight variations in the data and to
reasonable permutations of the econometric specification. Merely cleaning up the data,
or including newly available observations, makes the inverse-U shape disappear”.
Another problem with interpreting results from the EKC literature as measuring a causal
relationship between income growth and environmental quality is that most of these analyses
do not investigate the underlying causes of income growth. Frankel and Rose (2002, 2005)
provided an exception. Using instrumental variables to account for the endogeneity of income
and trade intensity, Frankel and Rose tested the relationship between predicted per capita
income and pollution concentrations. Their estimates confirmed an inverted U-shape
relationship between instrumented per capita income and concentrations of air pollutants.
Based on the point estimates from one of their estimations, PM peaks at an income level of
USD 3 217 per capita, SO2 at USD 5 710 per capita and NO2 at USD 8 134 per capita.18 For CO2,
however, Frankel and Rose found no evidence of a turning point.19, 20
Frankel (2009a) updated the Frankel Rose (2002, 2005) study, to include data more
recent than 1990. The results were not quite as strong as before, especially for particulate
matter.21 The results for CO2 are interesting. An Environmental Kuznets Curve appeared
GLOBALISATION, TRANSPORT AND THE ENVIRONMENT © OECD 2010 39
2. GLOBALISATION’S DIRECT AND INDIRECT EFFECTS ON THE ENVIRONMENT
this time, suggesting that emissions may eventually turn down at high levels of income22
after all, perhaps as a result of efforts among some high-income countries since the 1997
Kyoto Protocol established a modicum of multilateral governance. Trade, however,
continues to show up as exacerbating CO2 emissions.
In light of the micro- and (controversial) macrolevel evidence that incomes and
environmental quality are positively correlated, it seems logical then that income gains
from trade will translate into increased demand for environmental quality. One channel
through which consumers express this demand is calls for tighter environmental
regulation. Using panel data on SO2 concentrations in 108 cities from 43 countries,
Antweiler, Copeland and Taylor (2001) obtained point estimates of the technique elasticity
between –1.577 and –0.905. Accordingly, they argued that if trade raises incomes by 1%, the
technique effect will lead to a reduction of SO2 concentrations of approximately 0.9% to
1.6%. Looking at the relationship between trade restrictions, income growth and COD in
China, Dean (2002) similarly found evidence of a technique effect. A “1 per cent reduction
in the level of trade restrictiveness produces an increase of 0.09 per cent in the growth rate
of income… (which) causes a decline in the growth rate of emissions by… –0.03 per cent”.
Needless to say, growth in trade is not the only channel through which globalisation
may raise incomes. FDI has also increased substantially over the past quarter century. FDI
now accounts for “over 60 per cent of private capital flows” (Carkovic and Levine, 2005) and
is four times as large as commercial lending was to developing countries in the 1970s.
Although inward FDI should have many of the same composition, income and scale effects
as trade, researchers have instead focused on the reverse question: do strict environmental
regulations attract or repel inward FDI? As with early research on the Pollution Haven Effect,
the evidence is mixed. Some of the earliest complaints about FDI (in an environmental
context at least) have concerned the Pollution Haven Hypothesis: the supposition that
freeing up trade and investment rules will lead multinational corporations (MNCs) to
relocate their production activities to low-income and inadequately regulated developing
countries. There has, however, been little evidence that such capital flight has occurred.
Explanations include the substantial disparity between pollution abatement and control
costs relative to capital and labour costs. For example, in the United States, the ratio of
pollution abatement and operating costs (PAOC) to value added is 9.9% in the US petroleum
and coal products sector, but no more than 3.5% in any other sector (primary metal
industries: 3.5%; paper and allied products: 2.7%; chemicals and allied products: 2.4%;
tobacco products: 2.3%) (see Cole and Elliot, 2005). At a country level, Jaffe et al. (1995)
calculated pollution abatement and control expenditures (PACE) as a percentage of GDP in
the 1980s, finding highs of 1.6% in West Germany and 1.5% in the US,23 the Netherlands and
the United Kingdom. Instead, the lion’s share of payments goes to labour and capital. In the
US, labour’s share of national income is consistently about two-thirds (Pakko, 2004).
Subsequent research asked whether differences across countries, provinces or states
might influence the pattern of inward or outward FDI. See, for example, Becker and
Henderson (2000),24 List and Co (2000),25 Keller and Levinson (2002),26 and Fredriksson, List
and Millimet (2003).27 Brunnermeier and Levinson (2004) provided a review of this
literature. By and large these studies took environmental outcomes as a given and asked
how variation in regulations impact investment flows. In this chapter, the interest is in the
flip side of this question: how does FDI affect environmental outcomes? This question
seems not to have been answered empirically.28 However, it is reasonable to expect that
lowering barriers to international investment may raise GDP in recipient countries, largely
GLOBALISATION, TRANSPORT AND THE ENVIRONMENT © OECD 201040
2. GLOBALISATION’S DIRECT AND INDIRECT EFFECTS ON THE ENVIRONMENT
through the technology transfer imbedded in FDI. Borensztein, De Gregorio and Lee (1998)
examined the impact of inward FDI on per capita income in developing countries,
concluding that, for the statically average country in their sample, “an increase of 0.005 in
the FDI-to-GDP ratio (equivalent to one standard deviation) raises the growth rate of the
host economy by 0.3 percentage point per year”.
Should this causal relationship bear scrutiny, one would expect the income boost
associated with inward FDI to have beneficial impacts on the environment akin to trade. In
the same vein, some FDI advocates suggest that outward FDI may also raise incomes in the
source country (for example, by increasing demand for white collar employment at a
multinational’s home office), with potential impacts on the environment via the income
effect, but empirical evidence is lacking. Similarly, the environmental scale and
composition effects of inward and outward FDI seem to have gone without scrutiny.
Technique effect – Environmental politics
Much of the research on income effects assumes that households are effective at
translating their preferences to policy. The usual presumption is that regulators and politicians
are sensitive to the tastes of their constituents, and so will tighten environmental regulations
in response to increased demand for such. In practice, of course, voters are only one input in
the political process; industry and factor owners may be similarly interested in influencing
policy in their favour. Moreover, trade liberalisation can alter the political economy surrounding
regulation. McAusland (2003) showed that opening a country to trade changes the incidence
associated with regulating industrial emissions: in a closed economy, the burden of regulation
is shared by dirty good producers and consumers through price changes. However, in an open
economy, consumers are insulated from the price effects of local industrial regulation since
they are able to buy substitutes from unregulated competitors. McAusland (2003) argued that,
even if trade liberalisation leaves the price of dirty goods unaffected (so composition, income
and scale effects are absent), this incidence-shifting will lead to stronger industry opposition to
regulation and weaker environmental policy if industry has undue influence over regulators.
Conversely, if the regulation in question concerns consumer-generated pollution, openness shifts
incidence in the opposite direction: producers will be the ones whose payoffs are insulated in
the open economy, reducing industry opposition to environmentally motivated product
standards (McAusland 2008). Gulati and Roy (2007) similarly argued that trade liberalisation
can lead an import-competing industry to prefer stricter environmental regulations when
exposed to international competition. They showed that this “greening” of domestic industry
can occur whenever domestic firms have a cost advantage in complying with regulation, such
that strict product standards have a “raising rival’s cost” effect. McAusland (2004) similarly
argued industry may want strict local product standards governing the intermediate products
they use (even if these standards are not legally binding on overseas competitors) if there is a
“California effect” via international input markets.
Aside from changes in regulatory incidence, trade liberalisation also changes the
stakes associated with lobbying. Fredriksson (1999) argued that an increase in the price of
dirty goods (as per trade liberalisation in a country with a comparative advantage in
pollution-intensive industrial goods) raises the stakes for industry and environmental
lobbyists alike, with ambiguous effects on environmental regulation.
Another concern surrounding trade liberalisation is that it will facilitate inter-
jurisdictional competition. If footloose firms can serve their markets from any number of
locations, this may give governments an incentive to bid down their environmental regulation
GLOBALISATION, TRANSPORT AND THE ENVIRONMENT © OECD 2010 41
2. GLOBALISATION’S DIRECT AND INDIRECT EFFECTS ON THE ENVIRONMENT
so as to attract industry. Oates and Schwab (1998) argued that governments may set
inefficiently weak environmental regulation so as to attract capital that complements local
fixed factors. Markusen et al. (1995) argued that governments attempting to attract lumpy
investment might similarly bid down environmental regulations. Levinson (2003) provided
some evidence that governments do indeed “compete” in environmental regulation. Using
the 1992 US Supreme Court decision prohibiting discriminatory taxation as a turning point,
Levinson (2003) found that the slope of state government’s reaction functions (mapping local
regulation to that of geographic neighbours) is statistically insignificant before the 1992
decision, but statistically significant and positive in the post-1992 era.
Technique effect – Technology transfer
There are several channels through which globalisation may facilitate technology transfer
between countries. Trade is one obvious channel: engineering firms that develop clean
technologies engage in the direct sale (and support) of their technologies to firms overseas.
Alternately, technology may be embodied in traded capital equipment; additionally, these
products may be reverse engineered, allowing competitors in the importing country to
incorporate the new technology into domestically produced capital goods.
Another channel is through subsidiaries of multinationals. There is substantive
evidence that the technology embodied in inward FDI is greener than local technology.
Eskeland and Harrison (2003) looked at plant-level energy use in Mexico, Venezuela and
Côte d’Ivoire. Using the ratio of energy inputs to output (both measured in value), they
concluded that:
“[F]oreign ownership is associated with lower levels of energy use in all three
countries. To the extent that energy use is a good proxy for air pollution emissions,
this suggests that foreign-owned plants have lower levels of emissions than
comparable domestically owned plants. The results are robust to the inclusion of plant
age, number of employees, and capital intensity – suggesting that foreign plants are
more fuel efficient even if we control for the fact that foreign plants tend to be
younger, larger, and more capital-intensive”, Eskeland and Harrison (2003).
Blackman and Wu (1998) similarly pointed to embodied technology as an explanation
for the high fuel efficiency of foreign-owned energy-generation plants in China (relative to
domestically owned), noting that 52% of the generating capital used in the foreign-owned
generating plants in their sample was foreign produced, while in domestic plants, only 24%
of equipment was foreign produced. Observations that inward FDI tends to be more energy
efficient than domestic enterprises is consistent with a 1990 survey of 169 MNCs; most of
these firms indicated their overseas health, safety and environmental practices reflect
regulations in their home country (Brunnermeier and Levinson [2004], UNCTAD [1993]).
If inward FDI displaces local producers, this embodied technological transfer can
reduce domestic emissions. Alternately, even if inward FDI does not displace local
production, there may be spillovers to local producers. Research on the strength of
technology spillovers usually focuses on wages and output. Most early research on this
topic found positive spillovers; see, for example, Caves (1974), Globerman (1979),
Blomström and Persson (1983), and Blomström (1986). However, subsequent work using
plant-level data (and which controlled for the endogeneity of the siting and sectoral
allocation of inward FDI) found evidence of negative spillovers. For example, Aitken and
Harrison (1999) looked at productivity spillovers in Venezuela and found a negative impact
GLOBALISATION, TRANSPORT AND THE ENVIRONMENT © OECD 201042
2. GLOBALISATION’S DIRECT AND INDIRECT EFFECTS ON THE ENVIRONMENT
of inward FDI on domestic productivity. They calculated that an increase in a sector’s
foreign ownership from 0% to 10% can lower overall productivity in that sector by as much
as 3%. Görg and Strobl (2001) provided a survey of the FDI spillover literature.
Even if the technology accompanying inward FDI is not shared with domestic firms,
there may still be a spillover via yardstick competition: regulators set standards for one
region or firm based on what its neighbours are doing. Fredriksson and Millimet (2002)
examined the relationship between the stringency of a US state’s environmental regulations
and that of its neighbours. They found that, in the Northeast US, “a 10% increase in [income-
weighted] neighboring relative abatement costs increases own state environmental
stringency by over 30%”. Moreover, the pull is asymmetric: while stricter standards next door
pull up local standards, Fredriksson and Millimet (2002) found that relatively weak standards
in a neighbouring state have no statistically significant impact on local regulation. Although
there is evidence that regulators use yardstick competition at the firm level, Bhaskar et al.
(2001) found evidence that local governments use yardstick competition between firms to
restrict rents accruing to public sector managers in Bangladesh. Estache et al. (2002) found
evidence that yardstick competition in regulation of port infrastructure operators in Mexico
would enhance efficiency. Yardstick competition at the firm level does not seem to have been
studied in an environmental context.
Technique effect – Trade-induced innovation
Globalisation may also affect the environment through globalisation-induced
technological change. An example is containerisation, which reduces the amount of time
ships must spend in port loading and unloading, raising the rate-of-return on capital
investments, leading to investment in larger, faster ships (Hummels, 2007). One of the
by-products of containerisation has been the emergence of a hub-and-spoke system, which
has two potential impacts on the environment. First, the hub-and-spoke system may
increase the effective distance between a given exporter-importer pair, potentially increasing
the amount of transport-related emissions associated with USD 1 worth of trade. The hub-
and-spoke system also creates stepping stones for biological invasions: if exports from
region A to region B are routed through a hub in region C, the pool of species region B is
exposed to is the set of all species in region A and in every other region whose exported goods
travel through the hub in region C. Simulating a network-flows model, Drake and Lodge (2004)
found that seven key ports serve as bottlenecks for pathways for marine invasions: Chiba
(Japan), Durban (South Africa), Las Palmas de Gran Cana (Spain), Long Beach (US), Piraeus
(Greece), Singapore (Singapore) and Tubarao (Brazil). Nevertheless, they concluded that
changes in technology that reduce the per-ship propogule pressure would be a more effective
means of reducing marine invasions worldwide than rerouting shipping traffic away from
these seven hotspots. Fernandez (2007) collected data on marine transport and biological
invasions at ports along the pacific coast of Mexico, the United States and Canada and
argued that co-operative prevention strategies dominate reactive strategies for all parties.
2.8. Scale effectAlthough they are quite different in theory, in many empirical applications the scale and
technique effects are difficult to separate. Using GDP per km2 as a proxy for scale, Antweiler
et al. (2001) estimated a scale elasticity of between 0.112 and 0.398 for SO2: holding income
and capital per capita constant, a 1% increase in the density of economic activity
corresponds to an increase in SO2 emissions of between 0.1% and 0.4%. Because they use
GLOBALISATION, TRANSPORT AND THE ENVIRONMENT © OECD 2010 43

2. GLOBALISATION’S DIRECT AND INDIRECT EFFECTS ON THE ENVIRONMENT
country-level data, Cole and Elliot (2003) were unable to measure scale and technique effects
independently of one another. Using per capita national income as the independent variable,
Cole and Elliot (2003) found that, for a statistically median country in their sample, a 1%
increase in national output or income through trade lowers SO2 and BOD by 1.7% and 0.06%,
respectively. In short, for SO2 and BOD, the technique effect appears to dominate. However
their results suggest that for NOx and CO2, the scale effect dominates: a 1% increase in
national output or income corresponds to 1% and 0.46% increases in NOx and CO2 through
the combined scale and technique effects. (In comparison, Antweiler et al.’s combined scale
and technique elasticity was approximately 1.0.) Using Chinese data, Shen (2007) calculated
net scale and technique elasticities, finding a negative net environmental effect of income or
scale for SO2 and dust fall, while for COD, arsenic and cadmium, the net effect was beneficial
to the environment (with elasticities of 4.0, 2.4, –0.982, –1.659 and –3.039 respectively).
2.9. Globalisation and the environment – Direct effectsThe scale, composition and technique effects considered above are best described as
the indirect effects of globalisation. They all stem from changes in relative prices that result
from integration with the global economy. Surprisingly, much of the economics literature
has ignored the direct effects of increased trade, specifically increases in emissions and
other externalities from the transport sector responsible for moving goods and embodied
services (personnel and tourists) between countries. The following section provides a very
brief overview of environmental damages and other spillovers from the transport sector.
These impacts are discussed in further detail in subsequent chapters.
Surface transport
Just under one quarter of global trade (measured by value) is between countries sharing
a land border, although this average largely reflects the trade patterns within North America
and Europe, where between-neighbour trade accounts for between 25% and 35% of trade. In
Africa, Asia and the Middle East, in contrast, between-neighbour trade accounts for between
1% and 5% of trade. For Latin America, between 10 and 20% of trade is between land
neighbours (Hummels, 2007). Data concerning the mode of neighbour trade is not available
at the global level, however, Hummels (2007) reported that “US and Latin American data
suggest that trade with land neighbours is dominated by surface modes like truck, rail, and
pipeline, with perhaps 10 per cent of trade going via air or ocean”. Fernandez (2008)
calculated that 90% of US-Mexico trade and 66% of US-Canada trade is by truck.
Environmental damages arising from land transport vary considerably depending on,
amongst other things, the density of the area through which traded goods are routed.29
Forkenbrock (2001) estimated the costs associated with one ton-mile of rail transport in rural
counties (based on volatile organic compound [VOC], NOx and PM10 emission intensity
estimates): heavy unit train: 0.009; mixed freight train: 0.011; intermodal train: 0.020; and
double-stack train: 0.013 (all numbers are 1994 USD 0.001 per ton-mile). Forkenbrock (2001)
compared these with estimates of the damages from transport via truck: USD 0.0023 per
ton-mile. Notably, these are estimates of average damage from transport within the
United States.30 For comparison, Parry and Small (2002, 2005) concluded that environmental
damage per passenger-vehicle mile within urban areas is approximately USD 0.02 per mile. For
Europe, Bickel et al. (2005) calculated the marginal damage from transport, paying particular
attention to how it can vary across mode, energy source and location. They found that
damages from air pollution associated with inter-urban transport via heavy goods vehicles
GLOBALISATION, TRANSPORT AND THE ENVIRONMENT © OECD 201044
2. GLOBALISATION’S DIRECT AND INDIRECT EFFECTS ON THE ENVIRONMENT
(HGV) ranges from EUR 0.0209 to EUR 0.0746 per vehicle-km, while the damages from global
warming (associated with exhaust greenhouse gas emissions) for HGV ranges from EUR 0.0203
to EUR 0.0328 per vehicle-km.
As with other modes of transport, the fuel efficiency of surface transport continues to
improve. For example, the US Department of Energy reports that average fuel economy
improved by 3.2% for light trucks, 9.6% for medium trucks and 3.6% for heavy trucks, over
the 1992-2002 period (Davis and Diegel, 2007).
One issue often overlooked in analyses of trade-related transport emissions concerns
wait times at borders. Fernandez (2008) reported that wait times are often twice as long for
northbound commercial traffic at US-Mexico border crossings as for southbound. In the
El Paso-Ciudad Juarez area, as much as 22% of emissions may be attributable to vehicles
idling at border crossings (Fernandez 2008).
Shipping-related emissions
For trade between countries that do not share a land border, the vast majority of goods are
moved by ocean or air. Ton-miles transported by ship dominate shipments by air by a factor
of 100. For example, in 2004, 8 335 billion ton-miles of non-bulk cargoes were transported
internationally by ocean vessel, compared to only 79.2 billion ton-miles by air. However,
growth rates are higher for air: for non-bulk cargoes, the annual growth rate of ton-miles was
11.7% for air shipments and 4.4% for ocean shipments (Hummels, 2007). Of course, an increase
in the volume of trade need not imply an increase in emissions if the emission intensity of a
ton-mile falls; this is plausible given that vessels have become more fuel efficient (as well as
faster) over the past half century, in large part due to containerisation (Hummels, 2007).
Some projections for the future, though, suggest emissions will rise faster than fuel
use. The International Maritime Organization projects fuel use by marine transport will
increase by approximately one third over the 2007-20 period, with corresponding increases
in marine CO2, NOx and PM10 by approximately one third, and a 40% increase in SOx
emissions (International Maritime Organization, 2007). Corbett et al. (2007) predicted that
the number of deaths attributable to shipping-related PM10 emissions will rise by 40%
by 2012,31 with most of the deaths occurring in coastal Europe and East and South Asia.
The majority of these deaths will be due to cardiopulmonary disease and lung cancer.
Another negative externality from ocean transport is the risk of oil spills. In the 1970s,
total oil spilled averaged at 314 200 tons per year. In the 1980s and 1990s the average annual
spill rate was 117 600 tons and 113 800 tons respectively. For the first eight years of the 2000s,
the average spill rate was only 21 778 tons. The number of spills larger than 7 tons similarly
declined: 25.2, 9.3, 7.8 and 3.4 spills per year for the periods 1970-79, 1980-89, 1990-99,
and 2000-08 respectively (ITOPF, no date).
Aviation
The global transport sector accounts for approximately 14% of anthropogenic
greenhouse gas emissions. Of this 14%, freight trucks account for 23%, ships 10% and
international aviation 7% (Stern, 2007). Although aviation’s direct greenhouse gas
emissions are the smallest of the group, greenhouse gas emissions from aviation under-
represent their actual contribution to climate change. “For example, water vapour emitted
at high altitude often triggers the formation of condensation trails, which tend to warm the
earth’s surface. There is also a highly uncertain global warming effect from cirrus clouds
GLOBALISATION, TRANSPORT AND THE ENVIRONMENT © OECD 2010 45

2. GLOBALISATION’S DIRECT AND INDIRECT EFFECTS ON THE ENVIRONMENT
(clouds of ice crystals) that can be created by aircraft” (Stern, 2007). Although there is no
agreed-upon conversion rate, the warming ratio is thought to be between 2 and 4, raising
aviation’s contribution to global greenhouse emissions from 1.7% to over 3%.
Moreover, the growth rate of air transport is nearly twice that of ocean transport. Over
the 1975-2004 period, the annualised growth rate for ocean transport was 3.8%, while for
air transport the growth rate was 8.4% (Hummels, 2007). Consistent with the disparity
between growth rates of aviation and other modes of transport, Stern (2007) projected that
“between 2005 and 2050, emissions are expected to grow fastest from aviation (tripling
over the period, compared to a doubling of road transport emissions)”.
2.10. ConclusionsAs with any body of research, there are always exceptions to the general rule. The
general rule concerning the indirect effects of trade on the environment seems to be that
increased openness has a benign to beneficial effect on the local environment. Antweiler
et al. (2001) concluded that, for the statistically average country in their sample, a 1%
increase in trade leads to an approximately 1% lower concentration of SO2. One concern
regarding the Antweiler et al. (2001) approach is that the potential endogeneity of trade
volumes was not accounted for. Frankel and Rose (2002, 2005) used instruments for trade
volume and found that openness nevertheless appears to have a beneficial impact
(i.e. lower concentrations) on SO2 and NO2, but no statistically significant impact on PM.
Chintrakarn and Millimet (2006) similarly used instrumental variables to control for
endogeneity, focusing instead on the relationship between subnational trade and toxic
releases. They found that trade-intensity increases land releases, but either reduces or has
no statistically significant effect on air, water and underground releases. One advantage of
the Chintrakarn and Millimet (2006) approach is that the instruments employed control for
endogeneity, while the use of data from a single federal jurisdiction entails some
comparability of data across units. The drawback is that there is no reason a priori to expect
that international and subnational trade flows impact the environment similarly.
McAusland and Millimet (2008) built a theoretical model arguing that the pro-environment
effects of subnational trade should in fact be smaller than those of international trade.
They found that increasing the international trade intensity of the statistically average
province or state by 10% lowers its total toxic releases by roughly 9%, while changes in
subnational trade intensity, ceteris paribus, do not have a statistically meaningful effect on
total toxic releases.
Although the recent evidence concerning trade and local pollution is encouraging, the
evidence concerning carbon and other greenhouse gas emissions is less so. Using a
cross-section of 63 countries and instruments for trade intensity and income, Magani (2004)
calculated the scale, technique and composition effects of trade and concluded that the
combined effect of a 1% increase in trade leads to a 0.58% increase in CO2 emissions for the
average country in her sample. Frankel (2009a) found that CO2 emissions might start to
decrease with income at some (as yet unquantified) point – but also that trade tended to
exacerbate CO2 emissions. In the EKC context, Neumayer (2004), Holtz-Eakin and Selden
(1995), and Schmalensee et al. (1998) similarly observed a positive relationship between
income and carbon emissions.
One of the most likely explanations for the consistently pessimistic assessments of
trade’s impact on greenhouse gas emissions is their global nature. Not only are the costs of
CO2 emissions shared with citizens abroad (who have no political voice outside their own
GLOBALISATION, TRANSPORT AND THE ENVIRONMENT © OECD 201046

2. GLOBALISATION’S DIRECT AND INDIRECT EFFECTS ON THE ENVIRONMENT
country), but many greenhouse emissions are associated with fossil fuel use, for which few
economically viable substitutes have emerged to date (again, arguably as a result of the
international free-rider problem). The income and other technique effects that are largely
responsible for reductions in local air pollutants do not seem to have the same force when
the pollutant in question burdens the global population – and requires global solutions –
rather than just the citizens residing within any one government’s jurisdiction.
Seemingly, no studies have looked at how the income gains from trade will impact
demand for, and ultimately regulation of, transport-related externalities. On the one hand,
it seems hard to imagine that citizens suffering from transport-related damage, such as
PM10-related deaths along shipping corridors, will not demand stricter regulation as they
become richer. But, as noted above, transport emissions associated with ocean and air
travel are global and/or transboundary in nature, and so may suffer the same fate as CO2
emissions absent global action. Moreover, unlike emissions by point sources (like power
plants and factories), international transport-related emissions often involve third parties:
many goods are moved via vessels not bound by operational regulations in either the
importing or exporting country. This is a particular issue for ocean shipping. Although
open registry fleets – ships registered under flags of convenience – accounted for only 5%
of ocean trade (by weight) in 1950, by 2000 its share had expanded to 48.5% (Hummels,
2007). Thus, even if voters in high-income countries want stringent environmental
regulations attached to the transport of traded goods they consume, shipping emissions
may be outside their government’s jurisdiction.
Notes
1. This chapter is an edited version of the paper Globalisation’s Direct and Indirect Effects on theEnvironment, written by Carol McAusland, University of Maryland, United States, for the OECD/ITFGlobal Forum on Transport and Environment in a Globalising World, held in Guadalajara, Mexico,10-12 November 2008, see www.oecd.org/dataoecd/10/60/41380703.pdf. The strong deterioration ineconomic prospects for the short to medium term that has taken place since the paper was draftedhas only to a limited extent been incorporated into the present chapter.
2. The Khian Sea was a ship flying a Liberian flag that was hired to take incinerator ash fromPhiladelphia, United States, to dump at an artificial island in the Bahamas. The local governmentrefused dumping permission and the ship began a 16-month journey which included requests tounload the ash in the Dominican Republic, Honduras, Panama, Bermuda, Guinea Bissau, the DutchAntilles, Senegal, Morocco, Yugoslavia, Sri Lanka and Singapore, all of which were denied. Someash was unloaded in the Bahamas under a false label (as topsoil) and the rest was later admittedto have been dumped into the Atlantic and Indian Oceans (Sinha, 2004; Wikipedia)
3. Although Summers took responsibility for the memo, it was originally written by staff economistLant Pritchett who claimed editing of the memo prior to its leak changed its tenor. See HarvardMagazine, May-June 2001 for an interview with Pritchett.
4. Growth rates vary considerably by country. According to World Bank Trade Indicators (http://info.worldbank.org/etools/tradeindicators/), in the 2005-06 period, the countries experiencing thefastest real growth in total trade in goods and services were Mauritania (42.3%), Iran (38.0%),Azerbaijan (29.3%), Viet Nam (22.1%) and China (20.9%). The countries with slowest trade growthwere New Zealand (–10.4%), Chad (–4. 8%), Benin (–0.2%), Senegal (0.0%), Tunisia (0.2%) and SyrianArab Republic (0.4%). Trade growth rates for the United States, Canada and Mexico were 6.9%, 2.8%and 11.7% respectively.
5. Rates given are weighted mean tariffs for manufactured products. For countries reporting, thelowest mean tariff rate on manufactures is 0.0% (Singapore), the highest 76.7% (Bangladesh). Otherrates are as follows: Canada (1.0%), China (5.3%), the European Union (1.8%), Japan (1.4%), Mexico(3.1%), the United States (1.8%) (World Bank, 2007).
GLOBALISATION, TRANSPORT AND THE ENVIRONMENT © OECD 2010 47

2. GLOBALISATION’S DIRECT AND INDIRECT EFFECTS ON THE ENVIRONMENT
6. As much of the econometric evidence concerning globalisation’s environmental effects hasconcentrated on the growth in international trade in goods (as opposed to services), this discussionwill similarly focus on goods trade.
7. For other indicators of resource use, the correlation is weaker. Cole and Elliot (2003) calculated acorrelation between biological oxygen demand (BOD) and capital intensity of only 0.12. Theyspeculated this correlation is weak because the major contributor to BOD is agriculture.
8. The trade-elasticity for NOx is statistically insignificant.
9. This analysis does not include non-tariff barriers to trade, such as quotas and voluntary exportrestraints (VERs).
10. http://dotstat.oecd.org/wbos/ViewHTML.aspx?Theme=OLADE&DatasetCode=OLADE.
11. This formulation assumes all production reallocated to/from the rest of the world is subsequentlytraded.
12. Of course, producing agricultural goods abroad is not always more carbon efficient. Saunders et al.(2006) calculated that the CO2 footprint of a tonne of onions shipped from New Zealand to the UKis 184.6 kg, while the comparable emissions from UK production were only 170 kg.
13. For comparison, CO2 emissions per MTOE for other major countries are 1.57 (Brazil), 2.02 (Canada),2.95 (China), 1.41 (France), 2.36 (Germany), 3.09 (Greece), 3.07 (Israel), 2.21 (Mexico), 2.99 (Morocco),the Russian Federation (2.39), 3.02 (Serbia and Montenegro), 2.27 (UK), and 2.49 (US).
14. A 95% confidence interval for the elasticity of per capita income with respect to trade share is(0.03, 3.9104).
15. They also estimated the channels for this income growth. They decomposed output intocontributions from capital and labour stocks, education and productivity. “The estimates implythat a one-percentage point increase in the trade share raises the contributions of both physicalcapital depth and schooling to output by about one-half of a percentage point, and the contributionof productivity to output by about two percentage points.”
16. Gains in per capita income may underestimate the actual consumption benefits from trade. Muchof the trade between developed countries is intra-industry (i.e. a country imports goods in the sameproduct class as it exports), which is often explained by trade in distinct varieties of otherwisesimilar goods. Some economists believe the variety gains from trade may be as large as the gainsin nominal income. Broda and Weinstein (2006) estimated that “US welfare is 2.6 per cent higherdue to gains accruing from the import of new varieties”. Klenow and Rodriguez-Clare (1997)estimated that ignoring the benefits from increased variety can underestimate the benefits fromtrade liberalisation anywhere from 33% to 80%.
17. For example, Kahn and Matsusaka (1997) found that high-income voters are less likely to supportcertain environmental initiatives in California referenda. However, as McAusland (2003) pointedout, many of the initiatives in question were to be funded by bond measures, so the no vote byhigh-income voters may be explained by Ricardian Equivalence.
18. Based on calculations by Carol McAusland, using point estimates reported in Frankel and Rose(2005, Table 1).
19. Frankel and Rose (2002, 2005) concluded that for a given level of income, on average trade has abeneficial impact on the environment. Moreover, because there is evidence that trade raisesincomes, trade also has an indirect effect on the environment, which is beneficial for high incomelevels but negative for low levels.
20. Kellenberg (2008) used a panel of 128 countries to study the relationship between trade intensity andemissions of four local pollutants (SO2, NOx, CO, and VOCs). He found that the trade intensity effectis negative and significant for the average country. However, trade intensity effects were not uniformacross countries of different income levels. Countries with relative world incomes less than 0.5 orgreater than 2.5 tended to have positive trade intensity elasticities, while countries with relativeworld incomes between 0.5 and 2.5 tended to have negative trade intensity elasticities.
21. While Frankel and Rose (2002, 2005) considered impacts on concentrations of pollutants, Frankel(2009a) estimates impacts of trade on emissions of the pollutants. And while Frankel and Rose(2002, 2005) covered all sizes of particulate matter, Frankel (2009a) focuses on PM10.
22. According to Frankel (2009b), the author had not yet computed whether the CO2 turning point thatis implied by Frankel (2009a) occurs within a relevant income range.
23. Using EPA data, Jaffe et al. (1995) arrived at a higher 2.6% figure for the United States.
GLOBALISATION, TRANSPORT AND THE ENVIRONMENT © OECD 201048
2. GLOBALISATION’S DIRECT AND INDIRECT EFFECTS ON THE ENVIRONMENT
24. “Becker and Henderson (2000) examined the effect of air quality regulations on plant births in UScounties between 1963-92. They estimated a conditional poisson model and found that at thecounty level, NAAQS nonattainment status reduced the births of new plants belonging to fourheavily polluting industries by 26% to 45% during this period” (Brunnermeier and Levinson, 2004).
25. List and Co (2000) used cross-sectional data to examine the impact of state regulatory spending oninward FDI. They found environmental regulation has a negative and statistically significantimpact on planned new foreign-owned manufacturing plants, but that the effects were strongerfor cleaner industries.
26. Keller and Levinson (2002) used panel data to look at inward FDI into the United States. Based ontheir calculations, “a doubling of their industry-adjusted index of abatement cost is associatedwith a less than 10% decrease in foreign direct investment” (Brunnermeier and Levinson, 2004).
27. Fredriksson, List and Millimet (2003) used measures of per capita gross state product (GSP) and theshare of legal services in GSP to create an instrument for environmental policy. They found evidenceof a U-shaped relationship between regulatory stringency and inward FDI. They pointed out that, forCalifornia, a one-standard deviation increase in regulatory stringency “reduces employment by over2 500 jobs, or about 6% of foreign affiliates’ employment in the chemicals sector”.
28. Although some authors have used instrumental variables (IV) to control for the endogeneity ofpollution abatement policy – see Xing and Kolstad (2002), Ederington and Minier (2003), andLevinson and Taylor (2008) – none have estimated the elasticity of emissions with respect to FDI.
29. See Chapter 8 for further discussion.
30. These estimates are based on damage estimates obtained from Cambridge SystematicsIncorporated, who assessed the costs per ton of VOC, NOx, SOx and PM10 emissions in US ruralcounties at 385, 213, 263 and 3 943 (1994 USD), respectively.
31. Corbett et al. (2007) estimated that current shipping PM10 emissions lead to 60 000 deaths per year.
References
Aitken, B.J. and A.E. Harrison (1999), “Do Domestic Firms Benefit from Foreign Investment? Evidencefrom Venezuela”, American Economic Review, 89(3), pp. 605-618.
Antle, J.M. and G. Heidebrink (1995), “Environment and Development: Theory and InternationalEvidence”, Economic Development and Cultural Change, 43, pp. 603-625.
Antweiler, Werner, Brian R. Copeland and M. Scott Taylor (2000), “Is Free Trade Good for theEnvironment?”, American Economic Review, 91(4), pp. 877-908.
Becker, Randy and Vernon Henderson (2000), “Effects of Air Quality Regulations on PollutingIndustries”, Journal of Political Economy, 108(2), pp. 379-421.
Berenberg Bank and HWWI (2006), Strategy 2030 – Maritime Trade and Transport Logistics, BerenbergBank, Hamburg.
Bergstrom, T.C. and R.P. Goodman (1973), “Private Demands for Public Goods”, American EconomicReview, 63(3), pp. 280-296.
Bhaskar, V., Bishnupriya Gupta and Mushtaq Khan (2001), Privatization, Yardstick Competition andEmployment Dynamics: Evidence from Bangladesh, mimeo, University of Essex.
Bickel, Peter, Stephan Schmid and Rainer Friedrich (2005), “Environmental Costs”, in Christopher Nashand Bryan Matthews (eds.), Measuring the Marginal Social Cost of Transport Research in TransportationEconomics, Vol. 14, Elsevier, Oxford.
Blackman, Allen and Xun Wu (1998), Foreign Direct Investment in China’s Power Sector: Trends, Benefits andBarriers, Resources for the Future Discussion Paper 98-50, Resources for the Future, Washington DC.
Blomström, M. (1986), “Foreign Investment and Productive Efficiency: The Case of Mexico”, Journal ofIndustrial Economics, 35, pp. 97-112.
Blomström, M. and H. Persson (1983), “Foreign Investment and Spillover Efficiency in an Under-developed Economy: Evidence from the Mexican Manufacturing Industry”, World Development, 11,pp. 493-501.
Boercherding, T.E. and R.T. Deacon (1972), “The Demand for the Services of Non-federal Governments”,American Economic Review, 62, pp. 891-901.
GLOBALISATION, TRANSPORT AND THE ENVIRONMENT © OECD 2010 49
2. GLOBALISATION’S DIRECT AND INDIRECT EFFECTS ON THE ENVIRONMENT
Borensztein, E., J. De Gregoriob and J.W. Lee (1998), “How does Foreign Direct Investment AffectEconomic Growth?”, Journal of International Economics, 45(1), pp. 115-135.
Broda, C. and D.E. Weinstein (2004), “Globalization and the Gains from Variety”, Quarterly Journal ofEconomics, 121, pp. 541-585.
Brunnermeier, Smita B. and Arik Levinson (2004), “Examining the Evidence on EnvironmentalRegulations and Industry Location”, Journal of Economic Development, 13(1), pp. 6-41.
Carkovic, Maria and Ross Levine (2005), “Does Foreign Direct Investment Accelerate EconomicGrowth?”, Chapter 8 in Theodore H. Moran, Edward Montgomery Graham and Magnus Blomström(eds.), Does Foreign Direct Investment Promote Development?, Peterson Institute, Washington DC.
Caves, R.E. (1974), “Multinational Firms, Competition, and Productivity in Host-Country Markets”,Economica, 38(149), pp. 1-27.
Chintrakarn, P. and D.L. Millimet (2006), “The Environmental Consequences of Trade: Evidence fromSubnational Trade Flows”, Journal of Environmental Economics and Management, 52(1), pp. 430-453.
Cole, Matthew A. and Robert J.R. Elliott (2003), “Determining the Trade-environment CompositionEffect: The Role of Capital, Labour and Environmental Regulations”, Journal of EnvironmentalEconomics and Management, 46(3), pp. 363-383.
Cole, Matthew A. and Robert J.R. Elliott (2005), “FDI and the Capital Intensity of ‘Dirty’ Sectors: AMissing Piece of the Pollution Haven Puzzle”, Review of Development Economics, 9(4), pp. 530-548.
Copeland, Brian R. and M. Scott Taylor (2003), Trade and the Environment: Theory and Evidence, PrincetonUniversity Press, Princeton NJ.
Copeland, Brian R. and M. Scott Taylor (2004), “Trade, Growth, and the Environment”, Journal ofEconomic Literature, 42(1), pp. 7-71.
Corbett , James J. et al. (2007), “Mortality from Ship Emissions: A Global Assessment”, EnvironmentalScience and Technology, 41(24), pp. 8512-8518.
Costello, C. and C. McAusland (2003), “Protectionism, Trade, and Measures of Damage from ExoticSpecies Introductions”, American Journal of Agricultural Economics, 85(4), pp. 964-975.
Costello, Christopher, Mike Springborn, Carol McAusland and Andy Solow (2007), “UnintendedBiological Invasions: Does Risk Vary by Trading Partner?”, Journal of Environmental Economics andManagement, 54(3), pp. 262-276.
Davis, Stacy C. and Susan W. Diegel (2007), Transportation Energy Data Book, 26th edition, US Departmentof Energy, Washington DC.
Dean, Judith M. (2002), “Does Trade Liberalization Harm the Environment? A New Test”, The CanadianJournal of Economics, 35(4), pp. 819-842.
Djankov, S. and B. Hoekman (2000), “Foreign Investment and Productivity Growth in CzechEnterprises”, World Bank Economic Review, 14, pp. 49-64.
Drake, J.M. and D.M. Lodge (2004), “Hotspots for Biological Invasions Determined from Global Pathwaysfor Non-indigenous Species in Ballast Water”, Proceed. Royal Society London Ser. B, 271, pp. 575-580.
Ederington, Josh, Arik Levinson and Jenny Minier (2005), “Footloose and Pollution-Free”, Review ofEconomics and Statistics, 87(1), pp. 92-99.
Eskeland, Gunnar S. and Ann E. Harrison (2003), “Moving to Greener Pastures? Multinationals and thePollution Haven Hypothesis”, Journal of Development Economics, 70(1), pp. 1-23.
Estache, Antonio, Marianela González and Lourdes Trujillo (2002), “Efficiency Gains from Port Reformand the Potential for Yardstick Competition: Lessons from Mexico”, World Development, 30(4),pp. 545-560.
Fernandez, L. (2007), “Maritime Trade and Migratory Species Management to Protect Biodiversity”,Environmental and Resource Economics, October.
Fernandez, Linda (2008), Transportation Services, Air Quality and Trade, Report for the Environment andTrade Program, Commission on Environmental Co-operation, Montreal.
Forkenbrock. David J. (2001), “Comparison of External Costs of Rail and Truck Freight Transportation”,Transportation Research Part A, 35(4), pp. 321-337.
Frankel, Jeffrey A. (2009a), Environmental Effects of International Trade, Expert Report No. 31 to Sweden’sGlobalisation Council, http://ksghome.harvard.edu/~jfrankel/Swenvirinlaga31proofs.pdf.
GLOBALISATION, TRANSPORT AND THE ENVIRONMENT © OECD 201050

2. GLOBALISATION’S DIRECT AND INDIRECT EFFECTS ON THE ENVIRONMENT
Frankel, Jeffrey A. (2009b), Personal communication.
Frankel, Jeffrey A. and Andrew K. Rose (2002), Is Trade Good or Bad for the Environment? Sorting Out theCausality, NBER Working Paper # 9210.
Frankel, Jeffrey A. and Andrew K. Rose (2005), “Is Trade Good or Bad for the Environment? Sorting Outthe Causality”, Review of Economics and Statistics, 87(1), pp. 85-91.
Frankel, Jeffrey A. and David Romer (1999), “Does Trade Cause Growth?”, American Economic Review,89(3), pp. 379-399.
Fredriksson, P.G. (1999), “The Political Economy of Trade Liberalization and Environmental Policy”,Southern Economic Journal, 65(3), pp. 513-525.
Fredriksson, P.G. and D.L. Millimet (2002), “Strategic Interaction and the Determination of EnvironmentalPolicy across US States”, Journal of Urban Economics, 51(1), pp. 101-122.
Fredriksson, P.G., J. List and D.L. Millimet (2003), “Bureaucratic Corruption, Environmental Policy andInbound US FDI: Theory and Evidence”, Journal of Public Economics, 87(7-8), pp. 1407-1430.
Globerman, S. (1979), “Foreign Direct Investment and ‘Spillover’ Efficiency Benefits in CanadianManufacturing Industries”, Canadian Journal of Economics, 12, pp. 42-56.
Görg, H. and E. Strobl (2001), “Multinational Companies and Productivity Spillovers: A Meta-analysis”,Economic Journal, 111, pp. F723-39.
Graham, D.J. and S. Glaister (2002), “The Demand for Automobile Fuel: A Survey of Elasticities”, Journalof Transport Economics and Policy, 36(1), pp. 1-25.
Grossman, Gene M. and Alan B. Krueger (1995), “Economic Growth and the Environment”, QuarterlyJournal of Economics, 110(2), pp. 353-377.
Gulati, Sumeet and Devesh Roy (2007), Free Trade and the Greening of Domestic Industry, Food andResource Economics Working Paper, University of British Columbia.
Harbaugh, William T. Arik Levinson and David M.Wilson (2002), “Re-examining Empirical Evidence foran Environmental Kuznets Curve”, Review of Economics and Statistics, 84(3), pp. 541-51.
Hilton, F.G. Hank and Arik Levinson (1998), “Factoring the Environmental Kuznets Curve: Evidence fromAutomotive Lead Emissions”, Journal of Environmental Economics and Management, 35(2), pp. 126-141.
Holtz-Eakin, Douglas and Thomas M. Selden (1995), “Stoking the Fires? CO2 Emissions and EconomicGrowth”, Journal of Public Economics, 57(1), pp. 85-101.
Hummels, David (2007), “Transportation Costs and International Trade in the Second Era of Globalization”,Journal of Economic Perspectives, 21(3), pp. 131-154.
International Maritime Organization (IMO) (2007), Sub-Committee on Bulk Liquids and Gases,12th session, Agenda Item 6, Review of MARPOL Annex VI and the NOx Technical Code: Report on theOutcome of the Informal Cross Government/Industry Scientific Group of Experts Established to Evaluate theEffects of the Different Fuel Options Proposed under the Revision of MARPOL Annex VI.
International Energy Agency (IEA) (2007), Key World Energy Statistics, OECD/IEA, Paris.
International Tanker Owners Pollution Federation Limited (ITOPF) (No date), website www.itopf.com/information-services/data-and-statistics/statistics/.
Jaffe, A., S. Peterson, P. Portney and R. Stavins (1995), “Environmental Regulations and theCompetitiveness of US Manufacturing: What does the Evidence Tell us?”, Journal of EconomicLiterature, 33(1), pp. 132-163.
Jenkins, P. (1996), “Free Trade and Exotic Species Introductions”, Conservation Biology, 10(1), pp. 300-302.
Kahn, M.E. and J.G. Matsusaka (1997), “Demand for Environmental Goods: Evidence from VotingPatterns on California Initiatives”, Journal of Law and Economics, 40, pp. 137-173.
Kellenberg, Derek K. (2008), “A Reexamination of the Role of Income for the Trade and EnvironmentDebate”, Ecological Economics, Vol. 68, pp. 106-115.
Klenow, P.J. and A. Rodríguez-Clare (1997), Quantifying Variety Gains from Trade Liberalization, mimeo,University of Chicago.
Kriström, B. and P. Riera (1996), “Is the Income Elasticity of Environmental Improvements Less ThanOne?”, Environmental and Resource Economics, 7, pp. 45-55.
GLOBALISATION, TRANSPORT AND THE ENVIRONMENT © OECD 2010 51
2. GLOBALISATION’S DIRECT AND INDIRECT EFFECTS ON THE ENVIRONMENT
Keller, W. and A. Levinson (2002), “Environmental Regulations and FDI to US States”, Review ofEconomics and Statistics, 84(4), pp. 691-703.
Levinson, Arik (1997), “Environmental Regulations and Industry Location: International and DomesticEvidence”, in Jagdish Bhagwati and Robert E. Hudec (eds.), Fair Trade and Harmonization: Prerequisitesfor Free Trade?, Vol. 1, MIT Press, Cambridge, MA.
Levinson, Arik (2003), “Environmental Regulatory Competition: A Status Report and Some NewEvidence”, National Tax Journal, 56(1), pp. 91-106.
Levinson, Arik and M. Scott Taylor (2008), “Unmasking the Pollution Haven Effect”, InternationalEconomic Review, 49(1), pp. 223-254.
List, J.A. and C.Y. Co (2000), “The Effects of Environmental Regulations on Foreign Direct Investment”,Journal of Environmental Economics and Management, 40(1), pp. 1-20.
Magani, S. (2004), “Trade Liberalization and the Environment: Carbon Dioxide for 1960-1999”, EconomicsBulletin, 17(1), pp. 1-5.
Markusen, James, Edward Morey and Nancy Olewiler (1995), “Competition in Regional EnvironmentalPolicies When Plant Locations are Endogenous”, Journal of Public Economics, 56(1), pp. 55-77.
Mattoo, Aadity A., Randeep Rathindran and Arvind Subrananian (2001), Measuring Services TradeLiberalization and its Impact on Economic Growth: An Illustration, World Bank Working Paper.
McAusland, Carol (2003), “Voting for Pollution Policy: The Importance of Income Inequality andOpenness to Trade”, Journal of International Economics, 61(2), pp. 425-451.
McAusland, Carol (2004), “Environmental Regulation as Export Promotion: Product Standards for DirtyIntermediate Goods”, Contributions to Economic Analysis and Policy, 3(2).
McAusland, Carol (2008), “Trade, Politics, and the Environment: Tailpipe vs. Smokestack”, Journal ofEnvironmental Economics and Management, 55(1), pp. 52-71.
McFadden, D.L. and G.K. Leonard (1992), “Issues in the Contingent Valuation of Environmental Goods:Methodologies for Data Collection and Analysis,” in Contingent Valuation: A Critical Assessment,Cambridge Economics, Inc.
Neumayer, E. (2004), “National Carbon Dioxide Emissions: Geography Matters”, Area, 36(1), pp. 33-40.
Oates, Wallace and Robert M. Schwab (1988), “Economic Competition Among Jurisdictions: EfficiencyEnhancing or Distortion Inducing?”, Journal of Public Economics, 35(3), pp. 333-354.
OECD (1999), Environmental Data Compendium 1999, OECD, Paris.
Pakko, Michael R. (2004), “Labor’s Share”, National Economic Trends, August, Federal Reserve of Saint Louis.
Parry, Ian W.H. and Kenneth A. Small (2002), “Does Britain or the United States Have the Right GasolineTax?”, March (rev. September 2004), RFF Discussion Paper 02-12 rev, Resources for the Future,Washington DC.
Parry, Ian W.H. and Kenneth A. Small (2005), “Does Britain or the United States Have the Right GasolineTax?”, American Economic Review, 95(4), pp. 1276-1289.
Santos-Pinto, L. (2002), The Relation Between Openness to International Trade and Carbon Dioxide Emissions,UC San Diego Department of Economics Working Paper.
Saunders, Caroline, Andrew Barber and Greg Taylor (2006), Food Miles: Comparative Energy/EmissionsPerformance of New Zealand’s Agriculture Industry, Lincoln University Research Report No. 285.
Schmalensee, R., T.M. Stoker and R.A. Judson (1998), “World Carbon Dioxide Emissions: 1950-2050”,Review of Economics and Statistics, 80(1), pp. 15-27.
Shafik, Nemat (1994), “Economic Development and Environmental Quality: An Econometric Analysis”,Oxford Economic Papers, 46, pp. 757-773.
Shen, J. (2007), “Trade Liberalization and Environmental Degradation in China”, Applied Economics, pp. 1-8.
Sinha, P.C. (ed.) (2004), Toxic and Hazardous Wastes, Anmol Publications Pvt. Ltd., New Delhi.
Stern, Nicholas (2007), Report on the Economics of Climate Change: The Stern Review, Cambridge UniversityPress, Cambridge, UK.
United Nations Conference on Trade and Development (UNCTAD), Program on TransnationalCorporations (1993), Environmental Management in Transnational Corporations: Report on the BenchmarkEnvironmental Survey, United Nations, New York.
GLOBALISATION, TRANSPORT AND THE ENVIRONMENT © OECD 201052
2. GLOBALISATION’S DIRECT AND INDIRECT EFFECTS ON THE ENVIRONMENT
US Bureau of the Census (USBC) (2001), Statistical Abstract of the United States 2001, US Bureau of theCensus, US Government Printing Office, Washington DC.
Welsch, Heinz (2002), Corruption, Growth, and the Environment: A Cross-country Analysis, German Institutefor Economic Research Discussion Paper No. 357, German Institute for Economic Research, Berlin.
World Bank (2007), World Development Indicators, World Bank, Washington DC.
Xing, Y. and C.D. Kolstad (2002), “Do Lax Environmental Regulations Attract Foreign Investment?”,Environmental and Resource Economics, 21(1), pp. 1-22.
GLOBALISATION, TRANSPORT AND THE ENVIRONMENT © OECD 2010 53


Globalisation, Transport and the Environment
© OECD 2010
Chapter 3
International Maritime Shipping: The Impact of Globalisation
on Activity Levels
byJames J. Corbett, James Winebrake, Øyvind Endresen, Magnus Eide, Stig Dalsøren,
Ivar S. Isaksen and Eirik Sørgård1
This chapter explores how the maritime industry has transformed its technologies,national registries and labour resources over the past decades to serve the demandsof globalisation. It looks at the global economic role of shipping, describing the marinetransport system as a network of specialised vessels, the ports they visit, andtransport infrastructure from factories to terminals to distribution centres to markets.
The chapter presents maritime transport as a necessary complement to, andoccasionally a substitute for, other modes of freight transport. For many commoditiesand trade routes, there is no direct substitute for waterborne commerce. On otherroutes, such as some coastwise or shortsea shipping or within inland river systems,marine transport may provide a substitute for roads and rail, depending upon cost,time and infrastructure constraints. The chapter traces maritime transformations inresponse to globalisation, from the shift of human labour (oars) to wind-driven sail,and the shift from sail to combustion. Two primary motivators for energy technologyinnovation – greater performance at lower cost – caused this conversion. It explorescurrent maritime shipping activity to explain why ocean-going ships now have anactivity level making them consume about 2% to 3% – and perhaps even as much as4% – of world fossil fuels. The chapter examines future developments by extrapolatinghistorical growth trends, and looking at scenario-based estimates.
55
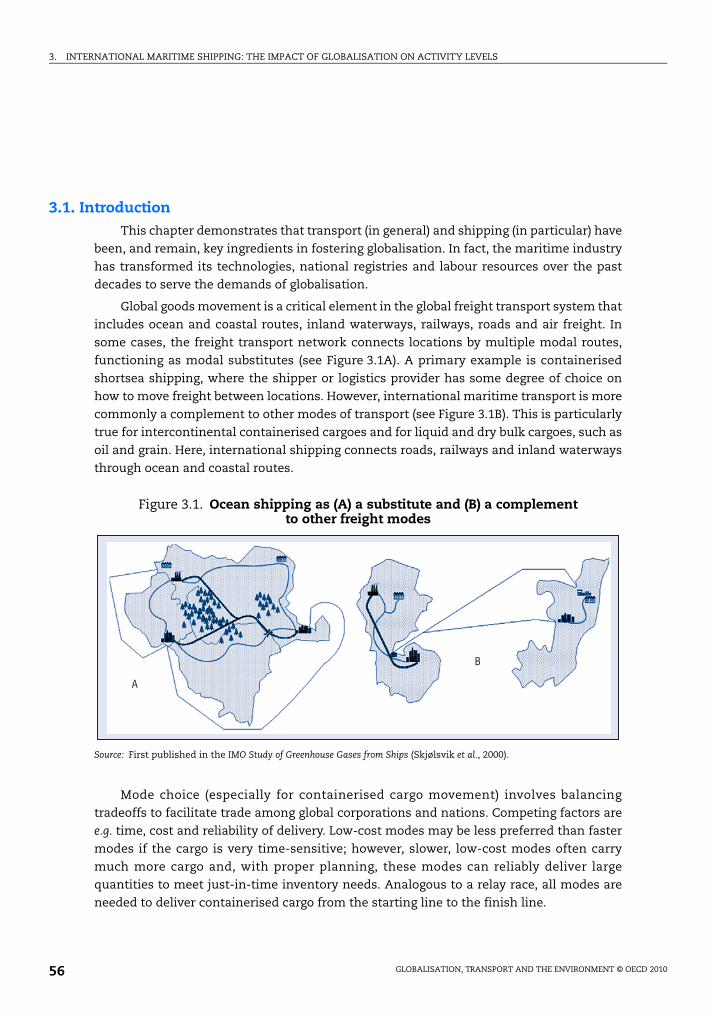
3. INTERNATIONAL MARITIME SHIPPING: THE IMPACT OF GLOBALISATION ON ACTIVITY LEVELS
3.1. IntroductionThis chapter demonstrates that transport (in general) and shipping (in particular) have
been, and remain, key ingredients in fostering globalisation. In fact, the maritime industry
has transformed its technologies, national registries and labour resources over the past
decades to serve the demands of globalisation.
Global goods movement is a critical element in the global freight transport system that
includes ocean and coastal routes, inland waterways, railways, roads and air freight. In
some cases, the freight transport network connects locations by multiple modal routes,
functioning as modal substitutes (see Figure 3.1A). A primary example is containerised
shortsea shipping, where the shipper or logistics provider has some degree of choice on
how to move freight between locations. However, international maritime transport is more
commonly a complement to other modes of transport (see Figure 3.1B). This is particularly
true for intercontinental containerised cargoes and for liquid and dry bulk cargoes, such as
oil and grain. Here, international shipping connects roads, railways and inland waterways
through ocean and coastal routes.
Mode choice (especially for containerised cargo movement) involves balancing
tradeoffs to facilitate trade among global corporations and nations. Competing factors are
e.g. time, cost and reliability of delivery. Low-cost modes may be less preferred than faster
modes if the cargo is very time-sensitive; however, slower, low-cost modes often carry
much more cargo and, with proper planning, these modes can reliably deliver large
quantities to meet just-in-time inventory needs. Analogous to a relay race, all modes are
needed to deliver containerised cargo from the starting line to the finish line.
Figure 3.1. Ocean shipping as (A) a substitute and (B) a complement to other freight modes
Source: First published in the IMO Study of Greenhouse Gases from Ships (Skjølsvik et al., 2000).
A
B
GLOBALISATION, TRANSPORT AND THE ENVIRONMENT © OECD 201056
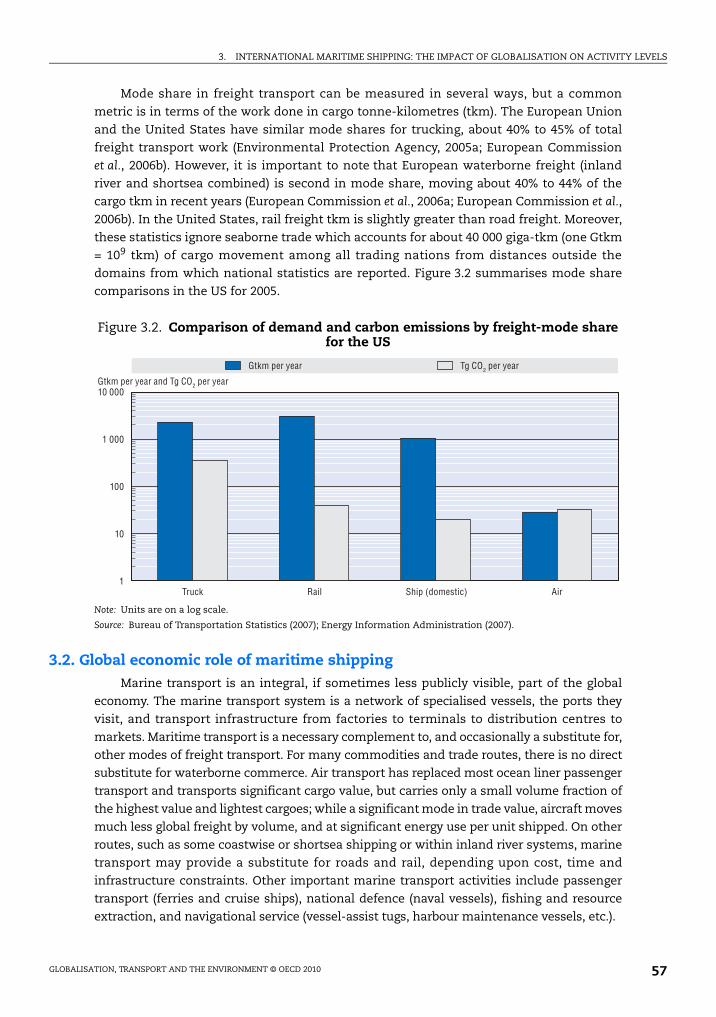
3. INTERNATIONAL MARITIME SHIPPING: THE IMPACT OF GLOBALISATION ON ACTIVITY LEVELS
Mode share in freight transport can be measured in several ways, but a common
metric is in terms of the work done in cargo tonne-kilometres (tkm). The European Union
and the United States have similar mode shares for trucking, about 40% to 45% of total
freight transport work (Environmental Protection Agency, 2005a; European Commission
et al., 2006b). However, it is important to note that European waterborne freight (inland
river and shortsea combined) is second in mode share, moving about 40% to 44% of the
cargo tkm in recent years (European Commission et al., 2006a; European Commission et al.,
2006b). In the United States, rail freight tkm is slightly greater than road freight. Moreover,
these statistics ignore seaborne trade which accounts for about 40 000 giga-tkm (one Gtkm
= 109 tkm) of cargo movement among all trading nations from distances outside the
domains from which national statistics are reported. Figure 3.2 summarises mode share
comparisons in the US for 2005.
3.2. Global economic role of maritime shippingMarine transport is an integral, if sometimes less publicly visible, part of the global
economy. The marine transport system is a network of specialised vessels, the ports they
visit, and transport infrastructure from factories to terminals to distribution centres to
markets. Maritime transport is a necessary complement to, and occasionally a substitute for,
other modes of freight transport. For many commodities and trade routes, there is no direct
substitute for waterborne commerce. Air transport has replaced most ocean liner passenger
transport and transports significant cargo value, but carries only a small volume fraction of
the highest value and lightest cargoes; while a significant mode in trade value, aircraft moves
much less global freight by volume, and at significant energy use per unit shipped. On other
routes, such as some coastwise or shortsea shipping or within inland river systems, marine
transport may provide a substitute for roads and rail, depending upon cost, time and
infrastructure constraints. Other important marine transport activities include passenger
transport (ferries and cruise ships), national defence (naval vessels), fishing and resource
extraction, and navigational service (vessel-assist tugs, harbour maintenance vessels, etc.).
Figure 3.2. Comparison of demand and carbon emissions by freight-mode share for the US
Note: Units are on a log scale.
Source: Bureau of Transportation Statistics (2007); Energy Information Administration (2007).
10 000
1 000
100
10
1Truck Rail Ship (domestic) Air
Gtkm per year and Tg CO2 per year
Gtkm per year Tg CO2 per year
GLOBALISATION, TRANSPORT AND THE ENVIRONMENT © OECD 2010 57
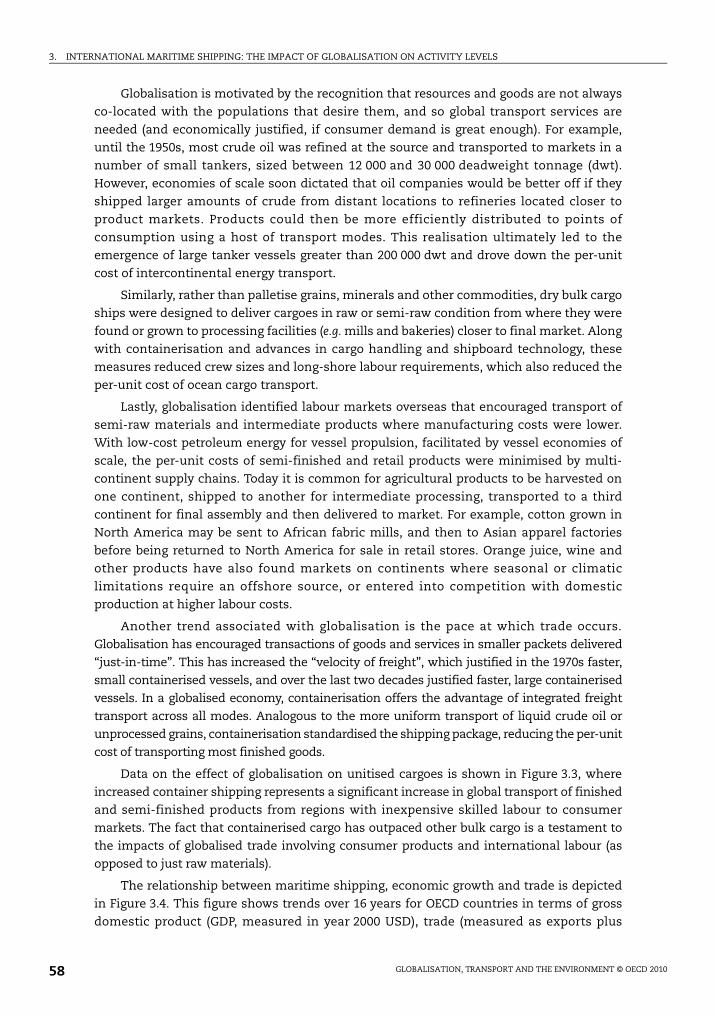
3. INTERNATIONAL MARITIME SHIPPING: THE IMPACT OF GLOBALISATION ON ACTIVITY LEVELS
Globalisation is motivated by the recognition that resources and goods are not always
co-located with the populations that desire them, and so global transport services are
needed (and economically justified, if consumer demand is great enough). For example,
until the 1950s, most crude oil was refined at the source and transported to markets in a
number of small tankers, sized between 12 000 and 30 000 deadweight tonnage (dwt).
However, economies of scale soon dictated that oil companies would be better off if they
shipped larger amounts of crude from distant locations to refineries located closer to
product markets. Products could then be more efficiently distributed to points of
consumption using a host of transport modes. This realisation ultimately led to the
emergence of large tanker vessels greater than 200 000 dwt and drove down the per-unit
cost of intercontinental energy transport.
Similarly, rather than palletise grains, minerals and other commodities, dry bulk cargo
ships were designed to deliver cargoes in raw or semi-raw condition from where they were
found or grown to processing facilities (e.g. mills and bakeries) closer to final market. Along
with containerisation and advances in cargo handling and shipboard technology, these
measures reduced crew sizes and long-shore labour requirements, which also reduced the
per-unit cost of ocean cargo transport.
Lastly, globalisation identified labour markets overseas that encouraged transport of
semi-raw materials and intermediate products where manufacturing costs were lower.
With low-cost petroleum energy for vessel propulsion, facilitated by vessel economies of
scale, the per-unit costs of semi-finished and retail products were minimised by multi-
continent supply chains. Today it is common for agricultural products to be harvested on
one continent, shipped to another for intermediate processing, transported to a third
continent for final assembly and then delivered to market. For example, cotton grown in
North America may be sent to African fabric mills, and then to Asian apparel factories
before being returned to North America for sale in retail stores. Orange juice, wine and
other products have also found markets on continents where seasonal or climatic
limitations require an offshore source, or entered into competition with domestic
production at higher labour costs.
Another trend associated with globalisation is the pace at which trade occurs.
Globalisation has encouraged transactions of goods and services in smaller packets delivered
“just-in-time”. This has increased the “velocity of freight”, which justified in the 1970s faster,
small containerised vessels, and over the last two decades justified faster, large containerised
vessels. In a globalised economy, containerisation offers the advantage of integrated freight
transport across all modes. Analogous to the more uniform transport of liquid crude oil or
unprocessed grains, containerisation standardised the shipping package, reducing the per-unit
cost of transporting most finished goods.
Data on the effect of globalisation on unitised cargoes is shown in Figure 3.3, where
increased container shipping represents a significant increase in global transport of finished
and semi-finished products from regions with inexpensive skilled labour to consumer
markets. The fact that containerised cargo has outpaced other bulk cargo is a testament to
the impacts of globalised trade involving consumer products and international labour (as
opposed to just raw materials).
The relationship between maritime shipping, economic growth and trade is depicted
in Figure 3.4. This figure shows trends over 16 years for OECD countries in terms of gross
domestic product (GDP, measured in year 2000 USD), trade (measured as exports plus
GLOBALISATION, TRANSPORT AND THE ENVIRONMENT © OECD 201058
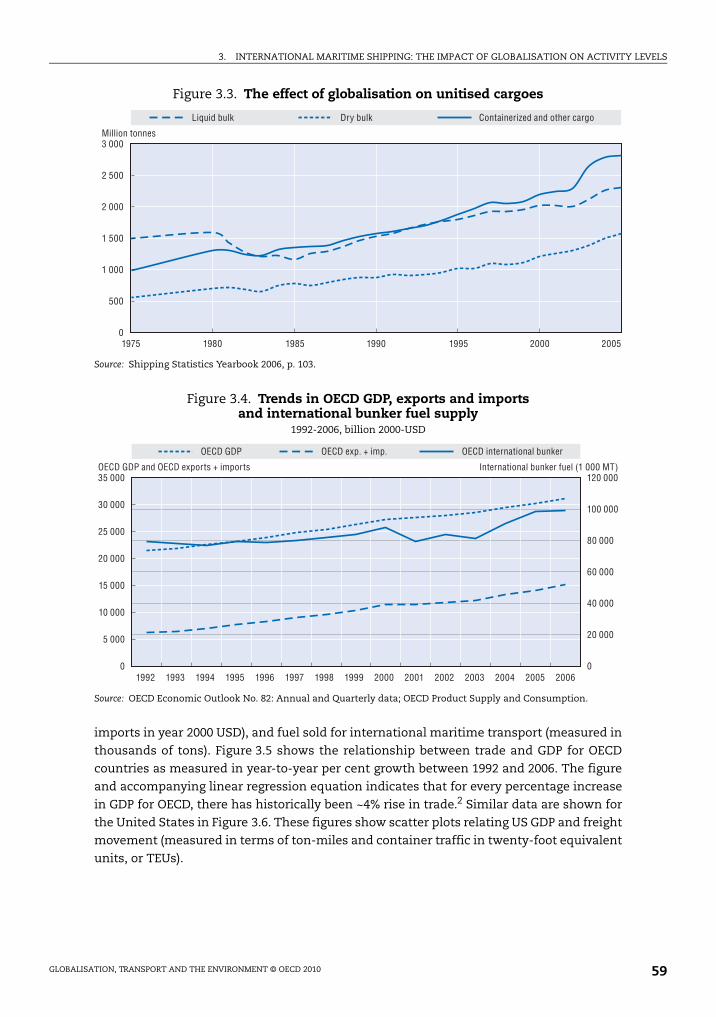
3. INTERNATIONAL MARITIME SHIPPING: THE IMPACT OF GLOBALISATION ON ACTIVITY LEVELS
imports in year 2000 USD), and fuel sold for international maritime transport (measured in
thousands of tons). Figure 3.5 shows the relationship between trade and GDP for OECD
countries as measured in year-to-year per cent growth between 1992 and 2006. The figure
and accompanying linear regression equation indicates that for every percentage increase
in GDP for OECD, there has historically been ~4% rise in trade.2 Similar data are shown for
the United States in Figure 3.6. These figures show scatter plots relating US GDP and freight
movement (measured in terms of ton-miles and container traffic in twenty-foot equivalent
units, or TEUs).
Figure 3.3. The effect of globalisation on unitised cargoes
Source: Shipping Statistics Yearbook 2006, p. 103.
Figure 3.4. Trends in OECD GDP, exports and imports and international bunker fuel supply
1992-2006, billion 2000-USD
Source: OECD Economic Outlook No. 82: Annual and Quarterly data; OECD Product Supply and Consumption.
3 000
2 500
2 000
1 500
1 000
500
01975 1980 1985 1990 1995 2000 2005
Million tonnes
Liquid bulk Dry bulk Containerized and other cargo
35 000
30 000
25 000
20 000
15 000
10 000
5 000
0
120 000
100 000
80 000
60 000
40 000
20 000
01992 1993 1994 1995 1996 1997 1998 1999 2000 2001 2002 2003 2004 2005 2006
OECD GDP and OECD exports + imports International bunker fuel (1 000 MT)
OECD GDP OECD exp. + imp. OECD international bunker
GLOBALISATION, TRANSPORT AND THE ENVIRONMENT © OECD 2010 59
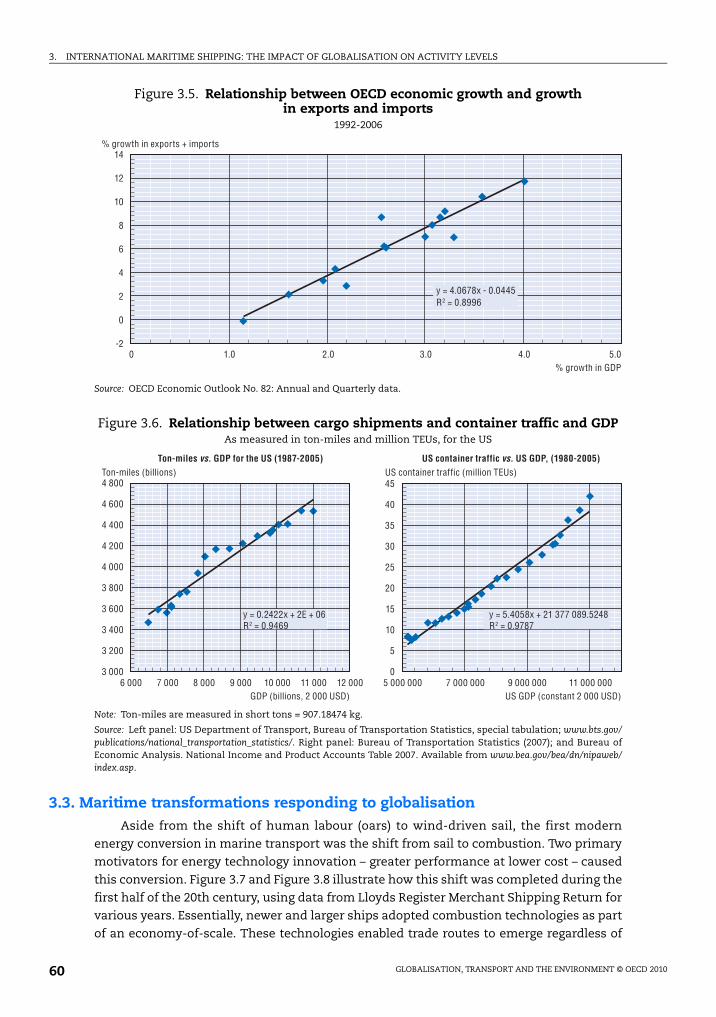
3. INTERNATIONAL MARITIME SHIPPING: THE IMPACT OF GLOBALISATION ON ACTIVITY LEVELS
3.3. Maritime transformations responding to globalisationAside from the shift of human labour (oars) to wind-driven sail, the first modern
energy conversion in marine transport was the shift from sail to combustion. Two primary
motivators for energy technology innovation – greater performance at lower cost – caused
this conversion. Figure 3.7 and Figure 3.8 illustrate how this shift was completed during the
first half of the 20th century, using data from Lloyds Register Merchant Shipping Return for
various years. Essentially, newer and larger ships adopted combustion technologies as part
of an economy-of-scale. These technologies enabled trade routes to emerge regardless of
Figure 3.5. Relationship between OECD economic growth and growth in exports and imports
1992-2006
Source: OECD Economic Outlook No. 82: Annual and Quarterly data.
Figure 3.6. Relationship between cargo shipments and container traffic and GDPAs measured in ton-miles and million TEUs, for the US
Note: Ton-miles are measured in short tons = 907.18474 kg.
Source: Left panel: US Department of Transport, Bureau of Transportation Statistics, special tabulation; www.bts.gov/publications/national_transportation_statistics/. Right panel: Bureau of Transportation Statistics (2007); and Bureau ofEconomic Analysis. National Income and Product Accounts Table 2007. Available from www.bea.gov/bea/dn/nipaweb/index.asp.
14
12
10
8
6
4
2
0
-20 1.0 2.0 3.0 4.0 5.0
% growth in exports + imports
% growth in GDP
y = 4.0678x - 0.0445R2 = 0.8996
4 800
4 600
4 400
4 200
4 000
3 800
3 600
3 400
3 200
3 000 0
5
10
15
20
25
30
35
40
45
6 000 7 000 8 000 9 000 10 000 11 000 12 000 5 000 000 7 000 000 9 000 000 11 000 000US GDP (constant 2 000 USD)GDP (billions, 2 000 USD)
Ton-miles (billions)
y = 0.2422x + 2E + 06R2 = 0.9469
y = 5.4058x + 21 377 089.5248R2 = 0.9787
US container traffic (million TEUs)US container traffic vs. US GDP, (1980-2005)Ton-miles vs. GDP for the US (1987-2005)
GLOBALISATION, TRANSPORT AND THE ENVIRONMENT © OECD 201060
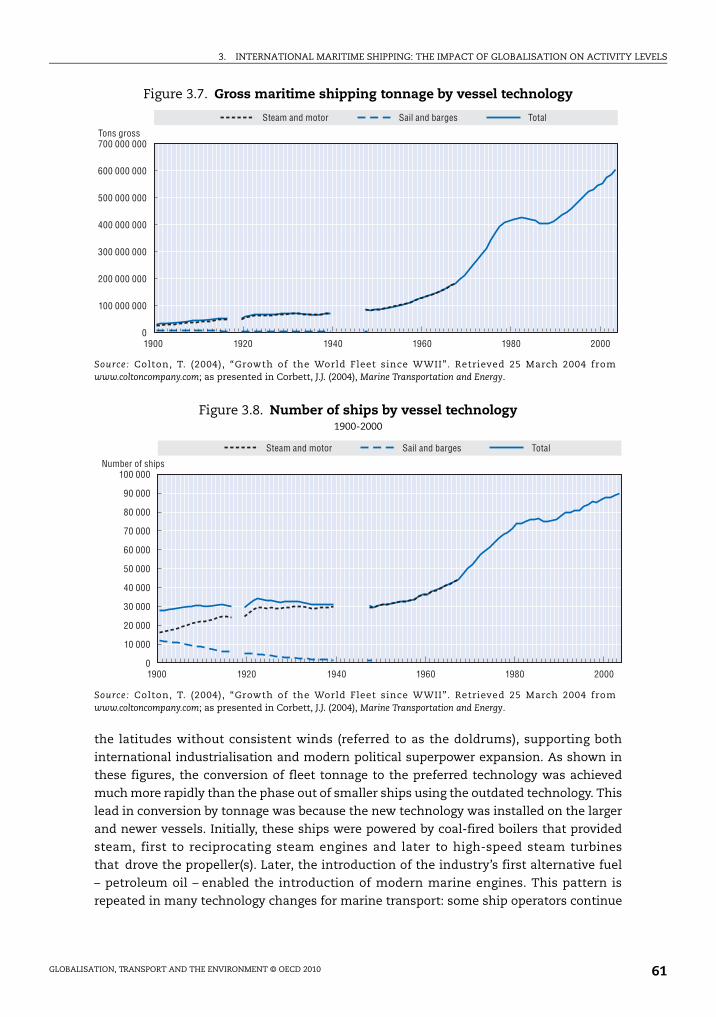
3. INTERNATIONAL MARITIME SHIPPING: THE IMPACT OF GLOBALISATION ON ACTIVITY LEVELS
the latitudes without consistent winds (referred to as the doldrums), supporting both
international industrialisation and modern political superpower expansion. As shown in
these figures, the conversion of fleet tonnage to the preferred technology was achieved
much more rapidly than the phase out of smaller ships using the outdated technology. This
lead in conversion by tonnage was because the new technology was installed on the larger
and newer vessels. Initially, these ships were powered by coal-fired boilers that provided
steam, first to reciprocating steam engines and later to high-speed steam turbines
that drove the propeller(s). Later, the introduction of the industry’s first alternative fuel
– petroleum oil – enabled the introduction of modern marine engines. This pattern is
repeated in many technology changes for marine transport: some ship operators continue
Figure 3.7. Gross maritime shipping tonnage by vessel technology
Source: Colton, T. (2004), “Growth of the World Fleet since WWII”. Retrieved 25 March 2004 fromwww.coltoncompany.com; as presented in Corbett, J.J. (2004), Marine Transportation and Energy.
Figure 3.8. Number of ships by vessel technology1900-2000
Source: Colton, T. (2004), “Growth of the World Fleet since WWII”. Retrieved 25 March 2004 fromwww.coltoncompany.com; as presented in Corbett, J.J. (2004), Marine Transportation and Energy.
700 000 000
600 000 000
500 000 000
400 000 000
300 000 000
200 000 000
100 000 000
01900 1920 1940 1960 1980 2000
Tons gross
Steam and motor Sail and barges Total
100 000
90 000
80 000
70 000
60 000
50 000
40 000
30 000
20 000
10 000
01900 1920 1940 1960 1980 2000
Number of ships
Steam and motor Sail and barges Total
GLOBALISATION, TRANSPORT AND THE ENVIRONMENT © OECD 2010 61
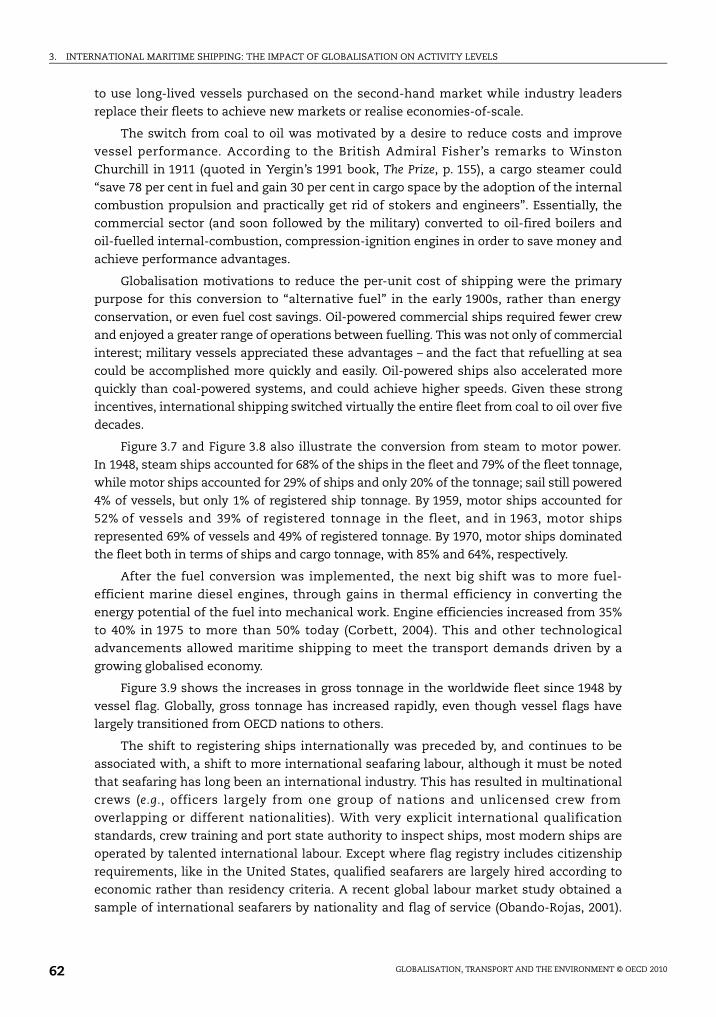
3. INTERNATIONAL MARITIME SHIPPING: THE IMPACT OF GLOBALISATION ON ACTIVITY LEVELS
to use long-lived vessels purchased on the second-hand market while industry leaders
replace their fleets to achieve new markets or realise economies-of-scale.
The switch from coal to oil was motivated by a desire to reduce costs and improve
vessel performance. According to the British Admiral Fisher’s remarks to Winston
Churchill in 1911 (quoted in Yergin’s 1991 book, The Prize, p. 155), a cargo steamer could
“save 78 per cent in fuel and gain 30 per cent in cargo space by the adoption of the internal
combustion propulsion and practically get rid of stokers and engineers”. Essentially, the
commercial sector (and soon followed by the military) converted to oil-fired boilers and
oil-fuelled internal-combustion, compression-ignition engines in order to save money and
achieve performance advantages.
Globalisation motivations to reduce the per-unit cost of shipping were the primary
purpose for this conversion to “alternative fuel” in the early 1900s, rather than energy
conservation, or even fuel cost savings. Oil-powered commercial ships required fewer crew
and enjoyed a greater range of operations between fuelling. This was not only of commercial
interest; military vessels appreciated these advantages – and the fact that refuelling at sea
could be accomplished more quickly and easily. Oil-powered ships also accelerated more
quickly than coal-powered systems, and could achieve higher speeds. Given these strong
incentives, international shipping switched virtually the entire fleet from coal to oil over five
decades.
Figure 3.7 and Figure 3.8 also illustrate the conversion from steam to motor power.
In 1948, steam ships accounted for 68% of the ships in the fleet and 79% of the fleet tonnage,
while motor ships accounted for 29% of ships and only 20% of the tonnage; sail still powered
4% of vessels, but only 1% of registered ship tonnage. By 1959, motor ships accounted for
52% of vessels and 39% of registered tonnage in the fleet, and in 1963, motor ships
represented 69% of vessels and 49% of registered tonnage. By 1970, motor ships dominated
the fleet both in terms of ships and cargo tonnage, with 85% and 64%, respectively.
After the fuel conversion was implemented, the next big shift was to more fuel-
efficient marine diesel engines, through gains in thermal efficiency in converting the
energy potential of the fuel into mechanical work. Engine efficiencies increased from 35%
to 40% in 1975 to more than 50% today (Corbett, 2004). This and other technological
advancements allowed maritime shipping to meet the transport demands driven by a
growing globalised economy.
Figure 3.9 shows the increases in gross tonnage in the worldwide fleet since 1948 by
vessel flag. Globally, gross tonnage has increased rapidly, even though vessel flags have
largely transitioned from OECD nations to others.
The shift to registering ships internationally was preceded by, and continues to be
associated with, a shift to more international seafaring labour, although it must be noted
that seafaring has long been an international industry. This has resulted in multinational
crews (e.g., officers largely from one group of nations and unlicensed crew from
overlapping or different nationalities). With very explicit international qualification
standards, crew training and port state authority to inspect ships, most modern ships are
operated by talented international labour. Except where flag registry includes citizenship
requirements, like in the United States, qualified seafarers are largely hired according to
economic rather than residency criteria. A recent global labour market study obtained a
sample of international seafarers by nationality and flag of service (Obando-Rojas, 2001).
GLOBALISATION, TRANSPORT AND THE ENVIRONMENT © OECD 201062

3. INTERNATIONAL MARITIME SHIPPING: THE IMPACT OF GLOBALISATION ON ACTIVITY LEVELS
As shown in Figure 3.10, most seafarers work on vessels that are registered in nations other
than their nationality.
Maintaining a professionally skilled and motivated labour force of seafarers across
ranks and nationalities remains an issue of international importance. Maritime transport
involves labour that resides at their place of work, where between 10 and 35 crew per ship
Figure 3.9. Gross tonnage by vessel flag1948-2006
Source: Lloyd’s Register of Shipping Statistical Tables; Lloyd’s Register of Shipping, London, 1947, 1948, 1958, 1963,1967, 1970; Lloyd’s Register Merchant Shipbuilding Return; Lloyd’s Register of Shipping, London, various years1970-1994, Lloyd’s Register of Shipping, Extracts from the World merchant fleet database for 2001 to 2006, Lloyd’sRegister of Shipping, London.
Figure 3.10. Flags of employment for selected nationalities
Source: Obando-Rojas, B. (2001), The Global Labour Market Study (GLMS). Proceedings of SIRC’s Second Symposium,Cardiff University, Seafarers International Research Centre, Data PG 91.
700 000 000
600 000 000
500 000 000
400 000 000
300 000 000
200 000 000
100 000 000
01948 1958 1968 1978 1988 1998 2008
Gross tons in fleet
Liberia Panama Other selected nationsWorld total OECD nations OECD with second flag
100
90
80
70
60
50
20 000
18 000
16 000
14 000
8 000
6 000
4 000
12 000
10 000
2 000
0
40
30
20
10
0
Unit
ed Stat
es
Nor
way
Unit
ed King
dom
Germ
any
Gree
ce
Rus
sia
Chin
a
Cro
atia
Pola
nd
Ukra
ine
Phil
ippine
s In
dia
Latv
ia
Percent of national sample Number of seafarers in sample
Own flag Foreign flag
GLOBALISATION, TRANSPORT AND THE ENVIRONMENT © OECD 2010 63

3. INTERNATIONAL MARITIME SHIPPING: THE IMPACT OF GLOBALISATION ON ACTIVITY LEVELS
operate the largest moving vehicles ever constructed, 24 hours per day for most of the year.
The working conditions routinely involve motion, noise, vibration and highly technical
tasks that are associated with long working hours, varying shift patterns – all elements
contributing to workplace fatigue that increases risk of human error during operations that
can lead to environmental incidents and catastrophes. Although full discussion is beyond
the scope of this chapter, these issues are part of the globalisation of maritime transport
and of the environmental performance of shipping.
3.4. Maritime shipping activityThere is an ongoing scientific debate regarding both the historical and present activity
level in maritime shipping; see for example Buhaug et al. (2008), Corbett and Koehler (2003),
Dalsøren et al. (2009), Endresen et al. (2003), Endresen et al. (2007) and Eyring, et al. (2005).
This section presents some of the evidence available.
The annual fuel consumption by the fleet is strongly affected by the demand for sea
transport, technical and operational improvements, as well as changes in the fleet
composition (Endresen et al., 2007). During the 20th century, total fuel consumption of the
ocean-going civil world fleet increased significantly, as the fleet expanded by 72 000 motor
ships, to a total of 88 000 in year 2000. The corresponding increase in gross tonnage (GT) was
from 22 million GT to 558 million GT (Figure 3.11). This growth was driven by increased
demand for passenger and cargo transport, with 300 million tons (Mt) cargo transported
in 1920 (Stopford, 1997) and 5 400 Mt in 2000 (Fearnleys, 2002). Up to around 1960, the world
fleet still transported large numbers of passengers, and the passenger ships were the largest
ship type in the fleet. It was not until 1958 that airplanes transported more transatlantic
passengers than large passenger ships (Hansen, 2004). More efficient and specialised ships
have also pushed their way into the market. The specialised ships have different operational
Figure 3.11. Development of world fleet of ocean-going vessels and transport work
Civil vessels, 100 GT or larger
Left: Development of size and tonnage (data from Lloyd’s Register of Shipping). Right: The development of averagesize (including non-cargo ships) and transport work (billion tonne-miles) (Stopford, 1997; Fearnleys, 2002). No data isavailable for the World-War periods.
Source: Endresen et al. (2007).
25 000
20 000
15 000
10 000
5 000
01900 1920 1940 1960 1980 2000 1900 1920 1940 1960 1980 2000
100
90
80
70
60
50
40
30
20
10
0
700
600
500
400
300
200
100
0
7 500
6 500
5 500
4 500
3 500
2 500
1 500
500
Number of ships (1 000) GT(106) Transport work (Btm)Average size of ships (GT)
YearYear
Average size steam and motor
Transport work (Btm)
Number of ships (all)
GT ships (all)
Number of sail ships
GT sail ships
GLOBALISATION, TRANSPORT AND THE ENVIRONMENT © OECD 201064
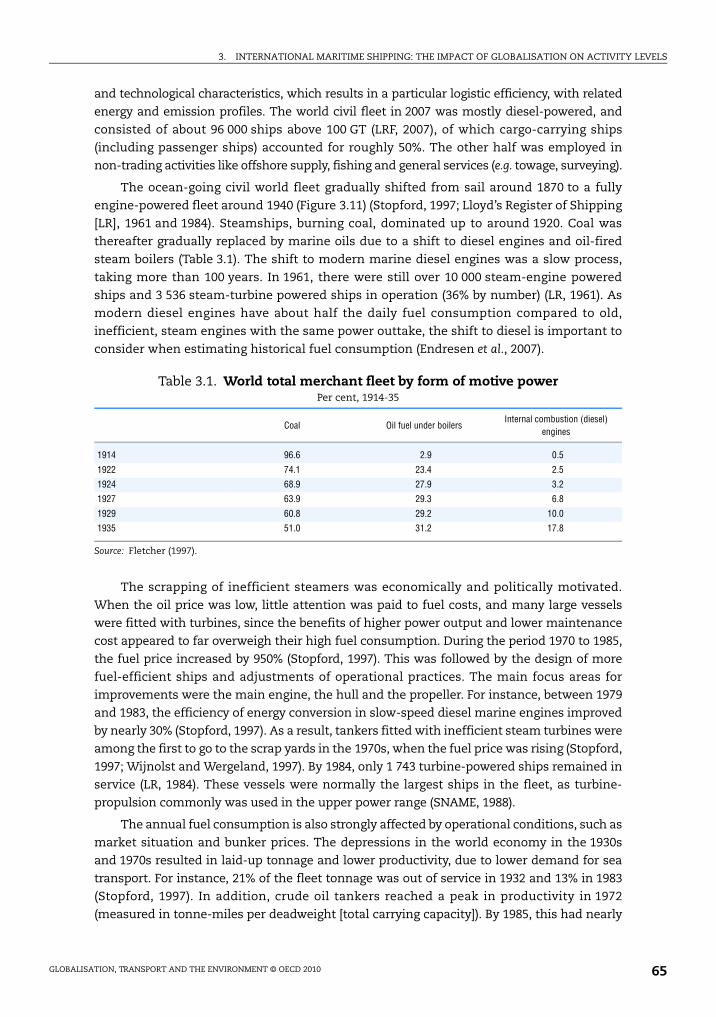
3. INTERNATIONAL MARITIME SHIPPING: THE IMPACT OF GLOBALISATION ON ACTIVITY LEVELS
and technological characteristics, which results in a particular logistic efficiency, with related
energy and emission profiles. The world civil fleet in 2007 was mostly diesel-powered, and
consisted of about 96 000 ships above 100 GT (LRF, 2007), of which cargo-carrying ships
(including passenger ships) accounted for roughly 50%. The other half was employed in
non-trading activities like offshore supply, fishing and general services (e.g. towage, surveying).
The ocean-going civil world fleet gradually shifted from sail around 1870 to a fully
engine-powered fleet around 1940 (Figure 3.11) (Stopford, 1997; Lloyd’s Register of Shipping
[LR], 1961 and 1984). Steamships, burning coal, dominated up to around 1920. Coal was
thereafter gradually replaced by marine oils due to a shift to diesel engines and oil-fired
steam boilers (Table 3.1). The shift to modern marine diesel engines was a slow process,
taking more than 100 years. In 1961, there were still over 10 000 steam-engine powered
ships and 3 536 steam-turbine powered ships in operation (36% by number) (LR, 1961). As
modern diesel engines have about half the daily fuel consumption compared to old,
inefficient, steam engines with the same power outtake, the shift to diesel is important to
consider when estimating historical fuel consumption (Endresen et al., 2007).
The scrapping of inefficient steamers was economically and politically motivated.
When the oil price was low, little attention was paid to fuel costs, and many large vessels
were fitted with turbines, since the benefits of higher power output and lower maintenance
cost appeared to far overweigh their high fuel consumption. During the period 1970 to 1985,
the fuel price increased by 950% (Stopford, 1997). This was followed by the design of more
fuel-efficient ships and adjustments of operational practices. The main focus areas for
improvements were the main engine, the hull and the propeller. For instance, between 1979
and 1983, the efficiency of energy conversion in slow-speed diesel marine engines improved
by nearly 30% (Stopford, 1997). As a result, tankers fitted with inefficient steam turbines were
among the first to go to the scrap yards in the 1970s, when the fuel price was rising (Stopford,
1997; Wijnolst and Wergeland, 1997). By 1984, only 1 743 turbine-powered ships remained in
service (LR, 1984). These vessels were normally the largest ships in the fleet, as turbine-
propulsion commonly was used in the upper power range (SNAME, 1988).
The annual fuel consumption is also strongly affected by operational conditions, such as
market situation and bunker prices. The depressions in the world economy in the 1930s
and 1970s resulted in laid-up tonnage and lower productivity, due to lower demand for sea
transport. For instance, 21% of the fleet tonnage was out of service in 1932 and 13% in 1983
(Stopford, 1997). In addition, crude oil tankers reached a peak in productivity in 1972
(measured in tonne-miles per deadweight [total carrying capacity]). By 1985, this had nearly
Table 3.1. World total merchant fleet by form of motive powerPer cent, 1914-35
Coal Oil fuel under boilersInternal combustion (diesel)
engines
1914 96.6 2.9 0.5
1922 74.1 23.4 2.5
1924 68.9 27.9 3.2
1927 63.9 29.3 6.8
1929 60.8 29.2 10.0
1935 51.0 31.2 17.8
Source: Fletcher (1997).
GLOBALISATION, TRANSPORT AND THE ENVIRONMENT © OECD 2010 65
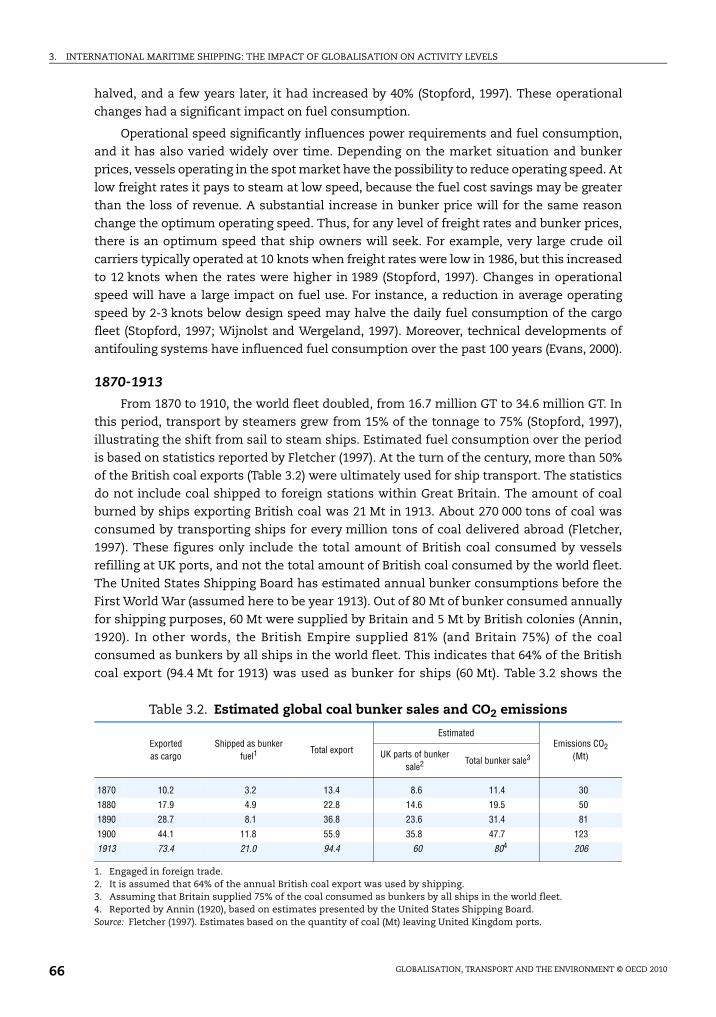
3. INTERNATIONAL MARITIME SHIPPING: THE IMPACT OF GLOBALISATION ON ACTIVITY LEVELS
halved, and a few years later, it had increased by 40% (Stopford, 1997). These operational
changes had a significant impact on fuel consumption.
Operational speed significantly influences power requirements and fuel consumption,
and it has also varied widely over time. Depending on the market situation and bunker
prices, vessels operating in the spot market have the possibility to reduce operating speed. At
low freight rates it pays to steam at low speed, because the fuel cost savings may be greater
than the loss of revenue. A substantial increase in bunker price will for the same reason
change the optimum operating speed. Thus, for any level of freight rates and bunker prices,
there is an optimum speed that ship owners will seek. For example, very large crude oil
carriers typically operated at 10 knots when freight rates were low in 1986, but this increased
to 12 knots when the rates were higher in 1989 (Stopford, 1997). Changes in operational
speed will have a large impact on fuel use. For instance, a reduction in average operating
speed by 2-3 knots below design speed may halve the daily fuel consumption of the cargo
fleet (Stopford, 1997; Wijnolst and Wergeland, 1997). Moreover, technical developments of
antifouling systems have influenced fuel consumption over the past 100 years (Evans, 2000).
1870-1913
From 1870 to 1910, the world fleet doubled, from 16.7 million GT to 34.6 million GT. In
this period, transport by steamers grew from 15% of the tonnage to 75% (Stopford, 1997),
illustrating the shift from sail to steam ships. Estimated fuel consumption over the period
is based on statistics reported by Fletcher (1997). At the turn of the century, more than 50%
of the British coal exports (Table 3.2) were ultimately used for ship transport. The statistics
do not include coal shipped to foreign stations within Great Britain. The amount of coal
burned by ships exporting British coal was 21 Mt in 1913. About 270 000 tons of coal was
consumed by transporting ships for every million tons of coal delivered abroad (Fletcher,
1997). These figures only include the total amount of British coal consumed by vessels
refilling at UK ports, and not the total amount of British coal consumed by the world fleet.
The United States Shipping Board has estimated annual bunker consumptions before the
First World War (assumed here to be year 1913). Out of 80 Mt of bunker consumed annually
for shipping purposes, 60 Mt were supplied by Britain and 5 Mt by British colonies (Annin,
1920). In other words, the British Empire supplied 81% (and Britain 75%) of the coal
consumed as bunkers by all ships in the world fleet. This indicates that 64% of the British
coal export (94.4 Mt for 1913) was used as bunker for ships (60 Mt). Table 3.2 shows the
Table 3.2. Estimated global coal bunker sales and CO2 emissions
Exportedas cargo
Shipped as bunker fuel1
Total export
EstimatedEmissions CO2
(Mt)UK parts of bunker sale2 Total bunker sale3
1870 10.2 3.2 13.4 8.6 11.4 30
1880 17.9 4.9 22.8 14.6 19.5 50
1890 28.7 8.1 36.8 23.6 31.4 81
1900 44.1 11.8 55.9 35.8 47.7 123
1913 73.4 21.0 94.4 60 804 206
1. Engaged in foreign trade.2. It is assumed that 64% of the annual British coal export was used by shipping.3. Assuming that Britain supplied 75% of the coal consumed as bunkers by all ships in the world fleet.4. Reported by Annin (1920), based on estimates presented by the United States Shipping Board.Source: Fletcher (1997). Estimates based on the quantity of coal (Mt) leaving United Kingdom ports.
GLOBALISATION, TRANSPORT AND THE ENVIRONMENT © OECD 201066

3. INTERNATIONAL MARITIME SHIPPING: THE IMPACT OF GLOBALISATION ON ACTIVITY LEVELS
estimated coal sales (and CO2 emissions) (SNAME, 1983; Endresen et al., 2007). The sales to
shipping increased by a factor of about 7 from 1870 to 1913. As the tonnage with steamers
increased by a factor of 6 from 1870 to 1910 (see above), this estimate may be reasonable.
1925-2007
Estimates of the more recent activity level and fuel use in the shipping sector vary
considerably (see Figure 3.13 for some examples). While some estimates are based on
reported fuel sales, other estimates are based on attempts to calculate how much fuel
ships of different categories and sizes would have used.
Transport vessels account for almost 60% of the ships of the internationally registered
fleet (not including military ships). Including military ships, cargo ships accounted for 40%
of the world fleet of vessels and 66% of world fleet fuel use in 2002 (see Table 3.3). The
registered fleet had approximately 84 000 four-stroke engines, with total installed power of
109 000 MW and some 27 000 two-stroke engines with total installed power of 164 000 MW.
Engines with “unknown” cycle types and turbines together made up about 2.5% of total
installed power for main engines.
Fuel types used in marine transport are different from most transport fuels. Marine
fuels, or bunkers, can be generally classified into two categories: residual fuels and other
fuels. Residual fuels, also known as heavy fuel oil (HFO) or intermediate fuel oil (IFO), are a
blend of various oils obtained from the highly viscous residue of distillation, or cracking,
after the lighter (and more valuable) hydrocarbon fractions have been removed. Since
the 1973 fuel crisis, refineries adopted secondary refining technologies (known as thermal
cracking) to extract the maximum quantity of refined products (distillates) from crude oil.
As a consequence, the concentration of contaminants such as sulphur, ash, asphaltenes
and metals has increased in residual fuels.
Table 3.3. Profile of 2002 world fleet, number of main engines, and main engine power
Ship typeNumberof ships
Per cent of world fleet
Number of main engines
Per cent of main engines
Installed power (MW)
Per cent of total power
Per cent of energy demand1
Cargo fleet 43 852
Container vessels 2 662 2 2 755 2 43 764 10 13
General cargo vessels 23 739 22 31 331 21 72 314 16 22
Tankers 9 098 8 10 258 7 48 386 11 15
Bulk/combined carriers 8 353 8 8 781 6 51 251 11 16
Non-cargo fleet 44 808
Passenger 8 370 8 15 646 10 19 523 4 6
Fishing vessels 23 371 22 24 009 16 18 474 4 6
Tugboats 9 348 9 16 000 11 16 116 4 5
Other (research, supply) 3 719 3 7 500 5 10 265 2 3
Registered fleet total 88 660 82 116 280 77 280 093 62 86
Military vessels 19 646 18 34 633 23 172 478 38 14
World fleet total 108 306 100 150 913 100 452 571 100 100
1. Per cent of energy demand is not directly proportional to the installed power because military vessels typicallyuse much less than their installed power except during battle. Average military deployment rate is 50% underwaytime per year (Navy, 1996); studies indicate that when underway, naval vessels operate below 50% power for 90%of the time (NAVSEA, 1994). Therefore, energy demand was adjusted in this table to reflect these facts. The dataupon which military vessel power was based specified the number of engines aboard naval ships.
Sources: Corbett and Koehler (2003), and Corbett (2004).
GLOBALISATION, TRANSPORT AND THE ENVIRONMENT © OECD 2010 67
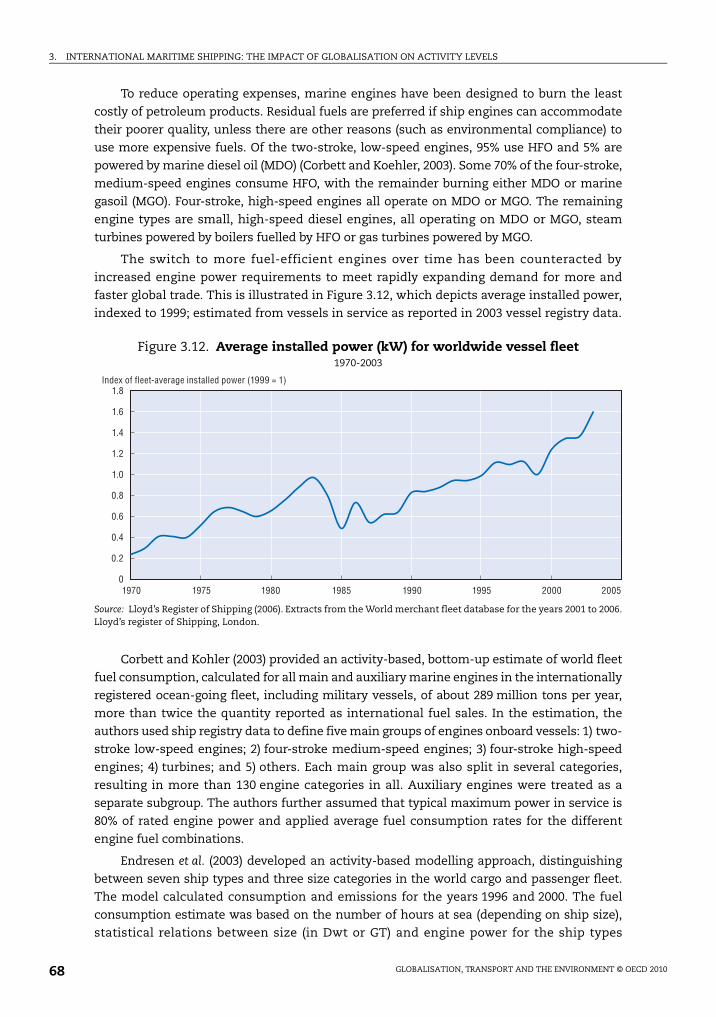
3. INTERNATIONAL MARITIME SHIPPING: THE IMPACT OF GLOBALISATION ON ACTIVITY LEVELS
To reduce operating expenses, marine engines have been designed to burn the least
costly of petroleum products. Residual fuels are preferred if ship engines can accommodate
their poorer quality, unless there are other reasons (such as environmental compliance) to
use more expensive fuels. Of the two-stroke, low-speed engines, 95% use HFO and 5% are
powered by marine diesel oil (MDO) (Corbett and Koehler, 2003). Some 70% of the four-stroke,
medium-speed engines consume HFO, with the remainder burning either MDO or marine
gasoil (MGO). Four-stroke, high-speed engines all operate on MDO or MGO. The remaining
engine types are small, high-speed diesel engines, all operating on MDO or MGO, steam
turbines powered by boilers fuelled by HFO or gas turbines powered by MGO.
The switch to more fuel-efficient engines over time has been counteracted by
increased engine power requirements to meet rapidly expanding demand for more and
faster global trade. This is illustrated in Figure 3.12, which depicts average installed power,
indexed to 1999; estimated from vessels in service as reported in 2003 vessel registry data.
Corbett and Kohler (2003) provided an activity-based, bottom-up estimate of world fleet
fuel consumption, calculated for all main and auxiliary marine engines in the internationally
registered ocean-going fleet, including military vessels, of about 289 million tons per year,
more than twice the quantity reported as international fuel sales. In the estimation, the
authors used ship registry data to define five main groups of engines onboard vessels: 1) two-
stroke low-speed engines; 2) four-stroke medium-speed engines; 3) four-stroke high-speed
engines; 4) turbines; and 5) others. Each main group was also split in several categories,
resulting in more than 130 engine categories in all. Auxiliary engines were treated as a
separate subgroup. The authors further assumed that typical maximum power in service is
80% of rated engine power and applied average fuel consumption rates for the different
engine fuel combinations.
Endresen et al. (2003) developed an activity-based modelling approach, distinguishing
between seven ship types and three size categories in the world cargo and passenger fleet.
The model calculated consumption and emissions for the years 1996 and 2000. The fuel
consumption estimate was based on the number of hours at sea (depending on ship size),
statistical relations between size (in Dwt or GT) and engine power for the ship types
Figure 3.12. Average installed power (kW) for worldwide vessel fleet1970-2003
Source: Lloyd’s Register of Shipping (2006). Extracts from the World merchant fleet database for the years 2001 to 2006.Lloyd’s register of Shipping, London.
1970 1975 1980 1985 1990 1995 2000 2005
1.8
1.6
1.4
1.2
1.0
0.8
0.6
0.4
0.2
0
Index of fleet-average installed power (1999 = 1)
GLOBALISATION, TRANSPORT AND THE ENVIRONMENT © OECD 201068
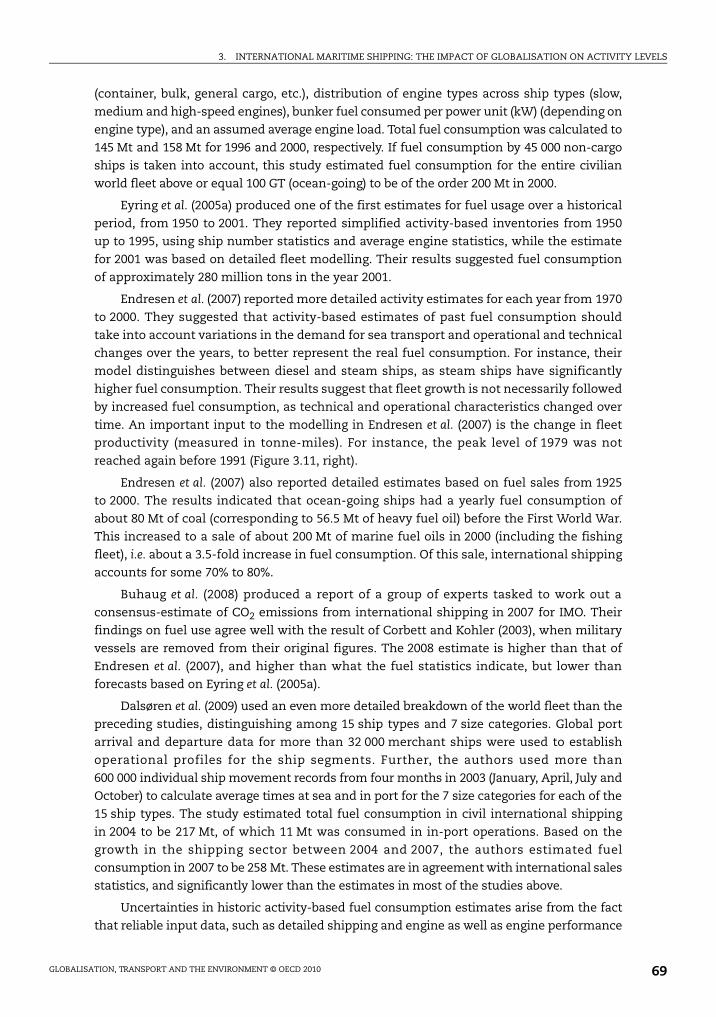
3. INTERNATIONAL MARITIME SHIPPING: THE IMPACT OF GLOBALISATION ON ACTIVITY LEVELS
(container, bulk, general cargo, etc.), distribution of engine types across ship types (slow,
medium and high-speed engines), bunker fuel consumed per power unit (kW) (depending on
engine type), and an assumed average engine load. Total fuel consumption was calculated to
145 Mt and 158 Mt for 1996 and 2000, respectively. If fuel consumption by 45 000 non-cargo
ships is taken into account, this study estimated fuel consumption for the entire civilian
world fleet above or equal 100 GT (ocean-going) to be of the order 200 Mt in 2000.
Eyring et al. (2005a) produced one of the first estimates for fuel usage over a historical
period, from 1950 to 2001. They reported simplified activity-based inventories from 1950
up to 1995, using ship number statistics and average engine statistics, while the estimate
for 2001 was based on detailed fleet modelling. Their results suggested fuel consumption
of approximately 280 million tons in the year 2001.
Endresen et al. (2007) reported more detailed activity estimates for each year from 1970
to 2000. They suggested that activity-based estimates of past fuel consumption should
take into account variations in the demand for sea transport and operational and technical
changes over the years, to better represent the real fuel consumption. For instance, their
model distinguishes between diesel and steam ships, as steam ships have significantly
higher fuel consumption. Their results suggest that fleet growth is not necessarily followed
by increased fuel consumption, as technical and operational characteristics changed over
time. An important input to the modelling in Endresen et al. (2007) is the change in fleet
productivity (measured in tonne-miles). For instance, the peak level of 1979 was not
reached again before 1991 (Figure 3.11, right).
Endresen et al. (2007) also reported detailed estimates based on fuel sales from 1925
to 2000. The results indicated that ocean-going ships had a yearly fuel consumption of
about 80 Mt of coal (corresponding to 56.5 Mt of heavy fuel oil) before the First World War.
This increased to a sale of about 200 Mt of marine fuel oils in 2000 (including the fishing
fleet), i.e. about a 3.5-fold increase in fuel consumption. Of this sale, international shipping
accounts for some 70% to 80%.
Buhaug et al. (2008) produced a report of a group of experts tasked to work out a
consensus-estimate of CO2 emissions from international shipping in 2007 for IMO. Their
findings on fuel use agree well with the result of Corbett and Kohler (2003), when military
vessels are removed from their original figures. The 2008 estimate is higher than that of
Endresen et al. (2007), and higher than what the fuel statistics indicate, but lower than
forecasts based on Eyring et al. (2005a).
Dalsøren et al. (2009) used an even more detailed breakdown of the world fleet than the
preceding studies, distinguishing among 15 ship types and 7 size categories. Global port
arrival and departure data for more than 32 000 merchant ships were used to establish
operational profiles for the ship segments. Further, the authors used more than
600 000 individual ship movement records from four months in 2003 (January, April, July and
October) to calculate average times at sea and in port for the 7 size categories for each of the
15 ship types. The study estimated total fuel consumption in civil international shipping
in 2004 to be 217 Mt, of which 11 Mt was consumed in in-port operations. Based on the
growth in the shipping sector between 2004 and 2007, the authors estimated fuel
consumption in 2007 to be 258 Mt. These estimates are in agreement with international sales
statistics, and significantly lower than the estimates in most of the studies above.
Uncertainties in historic activity-based fuel consumption estimates arise from the fact
that reliable input data, such as detailed shipping and engine as well as engine performance
GLOBALISATION, TRANSPORT AND THE ENVIRONMENT © OECD 2010 69
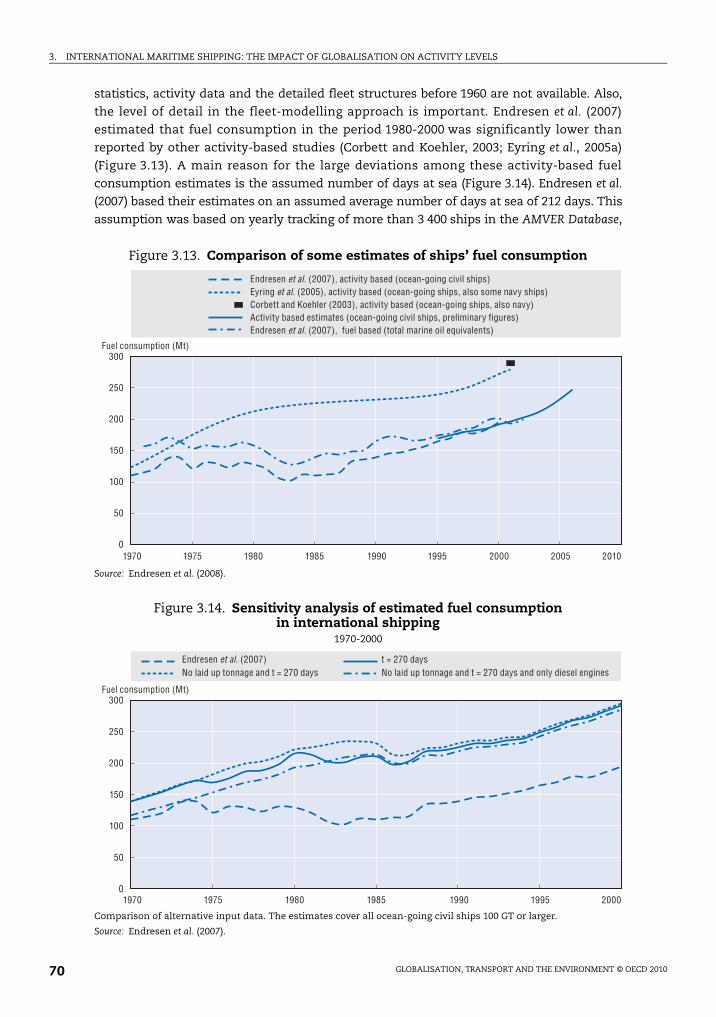
3. INTERNATIONAL MARITIME SHIPPING: THE IMPACT OF GLOBALISATION ON ACTIVITY LEVELS
statistics, activity data and the detailed fleet structures before 1960 are not available. Also,
the level of detail in the fleet-modelling approach is important. Endresen et al. (2007)
estimated that fuel consumption in the period 1980-2000 was significantly lower than
reported by other activity-based studies (Corbett and Koehler, 2003; Eyring et al., 2005a)
(Figure 3.13). A main reason for the large deviations among these activity-based fuel
consumption estimates is the assumed number of days at sea (Figure 3.14). Endresen et al.
(2007) based their estimates on an assumed average number of days at sea of 212 days. This
assumption was based on yearly tracking of more than 3 400 ships in the AMVER Database,
Figure 3.13. Comparison of some estimates of ships’ fuel consumption
Source: Endresen et al. (2008).
Figure 3.14. Sensitivity analysis of estimated fuel consumption in international shipping
1970-2000
Comparison of alternative input data. The estimates cover all ocean-going civil ships 100 GT or larger.
Source: Endresen et al. (2007).
1970 1975 1980 1985 1990 1995 2000 2005 2010
300
250
200
150
100
50
0
Fuel consumption (Mt)
Endresen et al. (2007), activity based (ocean-going civil ships)Eyring et al. (2005), activity based (ocean-going ships, also some navy ships)Corbett and Koehler (2003), activity based (ocean-going ships, also navy)Activity based estimates (ocean-going civil ships, preliminary figures)Endresen et al. (2007), fuel based (total marine oil equivalents)
300
250
200
150
100
50
01970 1975 1980 1985 1990 1995 2000
Fuel consumption (Mt)
Endresen et al. (2007) t = 270 daysNo laid up tonnage and t = 270 days No laid up tonnage and t = 270 days and only diesel engines
GLOBALISATION, TRANSPORT AND THE ENVIRONMENT © OECD 201070
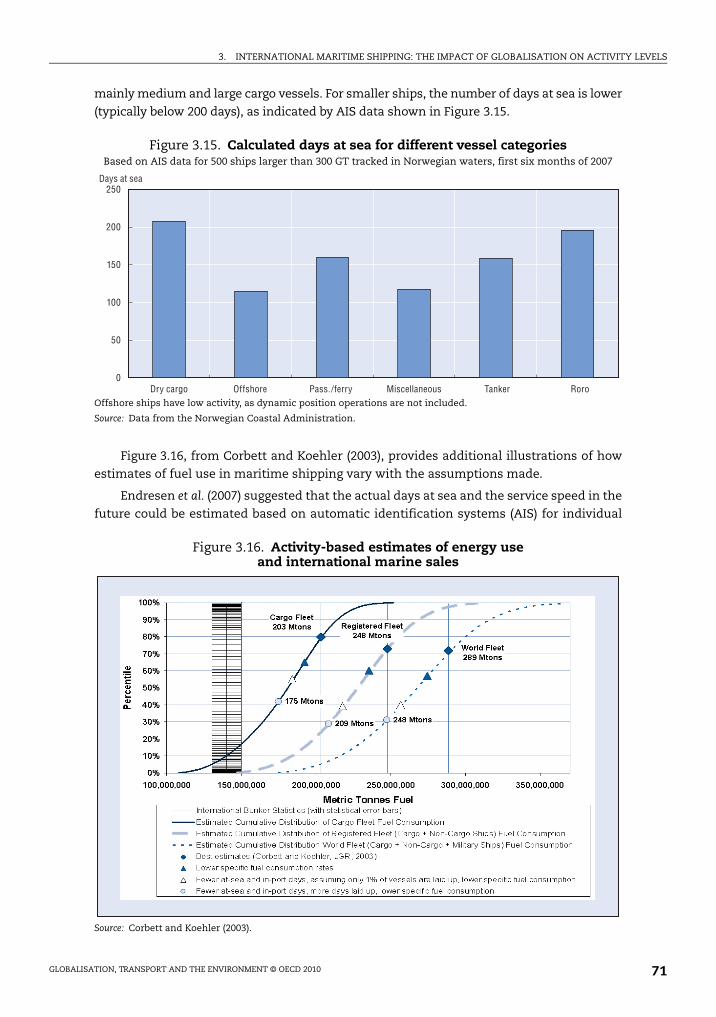
3. INTERNATIONAL MARITIME SHIPPING: THE IMPACT OF GLOBALISATION ON ACTIVITY LEVELS
mainly medium and large cargo vessels. For smaller ships, the number of days at sea is lower
(typically below 200 days), as indicated by AIS data shown in Figure 3.15.
Figure 3.16, from Corbett and Koehler (2003), provides additional illustrations of how
estimates of fuel use in maritime shipping vary with the assumptions made.
Endresen et al. (2007) suggested that the actual days at sea and the service speed in the
future could be estimated based on automatic identification systems (AIS) for individual
Figure 3.15. Calculated days at sea for different vessel categoriesBased on AIS data for 500 ships larger than 300 GT tracked in Norwegian waters, first six months of 2007
Offshore ships have low activity, as dynamic position operations are not included.
Source: Data from the Norwegian Coastal Administration.
Figure 3.16. Activity-based estimates of energy use and international marine sales
Source: Corbett and Koehler (2003).
250
200
150
100
50
0
Days at sea
Dry cargo Offshore Pass./ferry Miscellaneous Tanker Roro
GLOBALISATION, TRANSPORT AND THE ENVIRONMENT © OECD 2010 71
3. INTERNATIONAL MARITIME SHIPPING: THE IMPACT OF GLOBALISATION ON ACTIVITY LEVELS
ocean-going ships. Such data will also make it possible to indirectly estimate the engine
power utilisation per ship (and for fleet segments) by combining recorded service speed
with installed main engine power for each individual ship (available from Lloyds’ Fleet
Databases). AIS is primarily an anticollision system, and is designed to automatically
provide position and identification information about the ship to other ships and to coastal
authorities (United States Coast Guard, 2002). The International Maritime Organization
requires AIS to be fitted aboard all international ships above a certain size. A preliminary
analysis based on AIS data and individual profiles for 500 small- and medium-sized ships
(greater than 300 GT) sailing in Norwegian waters does not support the activity level of 225-
270 days at sea assumed by recent activity-based studies (Figure 3.13). Buhaug et al. (2008)
made a first attempt to establish global operational profiles using AIS data, but the
reported profiles represent small vessels only crudely. This issue should be addressed in
new studies, also considering larger ships. When the global identification and tracking of
ships is implemented, using long-range identification and tracking (LRIT) technology, the
potential for effective monitoring on an individual ship basis would increase further. LRIT
is a satellite-based system with planned global coverage of maritime traffic (IMO, 2006).
Ships operate differently depending on type and size, but cargo ships mostly operate
in a similar way, transporting cargo between ports (the length of the voyages will vary).
Endresen et al. (2004a) reported the average number of days at sea for five size categories
and six ship types, based on yearly tracking of cargo ships in the AMVER database. Number
of days at sea was found to vary by about 50 days between the cargo ship types, for a given
ship size category. Also, the difference between a small and a large ship can be 100 days for
a defined ship type.
Dalsøren et al. (2009) studied the number of days at sea in greater detail and found that
the number varies between 136 days for small bulk vessels to 280 days for large liquefied
gas tankers. Ships of the same type show a variation as large as 120 days between size
categories. For cargo ships of similar size, the variation was as large as 114 days between
ship types. Non-cargo ships of similar size have a variation up to 98 days between ship
types. Thus, ship type and size should be taken into account when modelling activity level
in the shipping sector.
The engine load assumed for different types and sizes is also an important input. The
cargo fleet, accounting for about 80% of the installed power in non-military vessels (Table 3.3
and Endresen et al., 2007), will normally have a higher engine utilisation (load) and a higher
number of sailing days compared to non-cargo ships (Endresen et al., 2004a). The relative
energy production (kWh) will then exceed 80%, and could be as high as 90%. Consequently,
to reduce the uncertainty in activity modelling, it is important to apply pre-defined size and
type categories (with mostly the same characteristic of the input variables) which resolve
main characteristics. Alternatively, the non-linear effects have to be taken into account
when simplified models are used. Yearly movement and tracking data (e.g. AIS data) available
for individual ships can be used to increase the reliability of model results.
Several studies have indicated that significant under-reporting of bunker sales has
occurred.3 However, activity-based studies have reported fuel consumption excluding
ocean-going ships less than 100 GT. The fuel consumption by these ships is not addressed
in the literature, and could be significant. For instance, in 1998, there were about
1.3 million engine-powered fishing vessels globally (Food and Agriculture Organization,
2006), while only some 23 000 of these vessels were larger than 100 GT in year 2000
GLOBALISATION, TRANSPORT AND THE ENVIRONMENT © OECD 201072
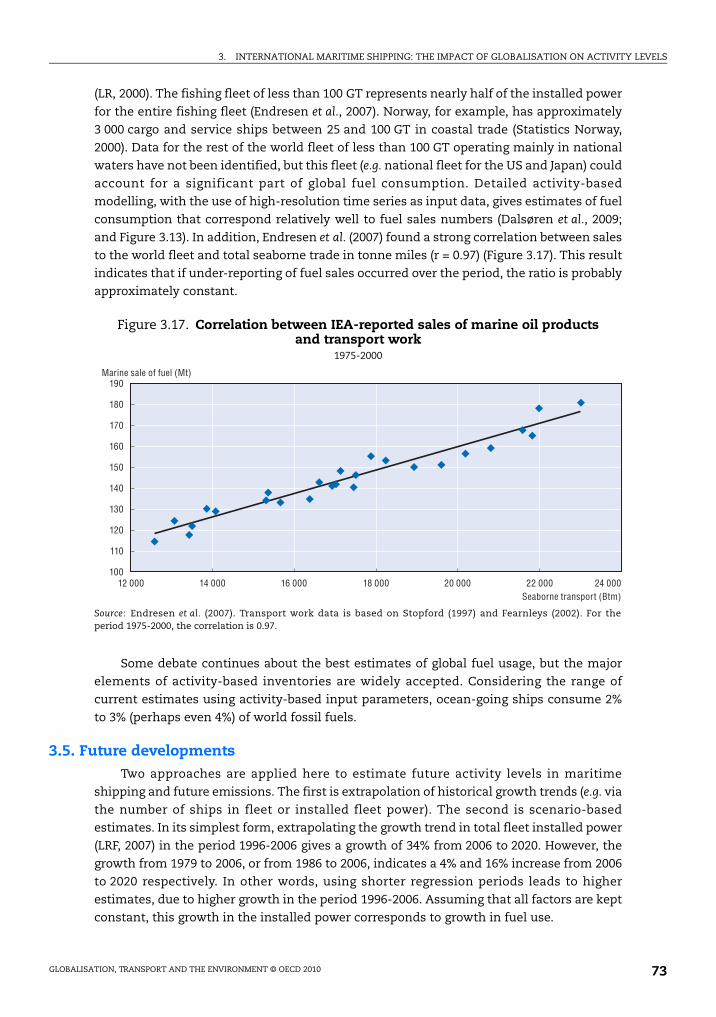
3. INTERNATIONAL MARITIME SHIPPING: THE IMPACT OF GLOBALISATION ON ACTIVITY LEVELS
(LR, 2000). The fishing fleet of less than 100 GT represents nearly half of the installed power
for the entire fishing fleet (Endresen et al., 2007). Norway, for example, has approximately
3 000 cargo and service ships between 25 and 100 GT in coastal trade (Statistics Norway,
2000). Data for the rest of the world fleet of less than 100 GT operating mainly in national
waters have not been identified, but this fleet (e.g. national fleet for the US and Japan) could
account for a significant part of global fuel consumption. Detailed activity-based
modelling, with the use of high-resolution time series as input data, gives estimates of fuel
consumption that correspond relatively well to fuel sales numbers (Dalsøren et al., 2009;
and Figure 3.13). In addition, Endresen et al. (2007) found a strong correlation between sales
to the world fleet and total seaborne trade in tonne miles (r = 0.97) (Figure 3.17). This result
indicates that if under-reporting of fuel sales occurred over the period, the ratio is probably
approximately constant.
Some debate continues about the best estimates of global fuel usage, but the major
elements of activity-based inventories are widely accepted. Considering the range of
current estimates using activity-based input parameters, ocean-going ships consume 2%
to 3% (perhaps even 4%) of world fossil fuels.
3.5. Future developmentsTwo approaches are applied here to estimate future activity levels in maritime
shipping and future emissions. The first is extrapolation of historical growth trends (e.g. via
the number of ships in fleet or installed fleet power). The second is scenario-based
estimates. In its simplest form, extrapolating the growth trend in total fleet installed power
(LRF, 2007) in the period 1996-2006 gives a growth of 34% from 2006 to 2020. However, the
growth from 1979 to 2006, or from 1986 to 2006, indicates a 4% and 16% increase from 2006
to 2020 respectively. In other words, using shorter regression periods leads to higher
estimates, due to higher growth in the period 1996-2006. Assuming that all factors are kept
constant, this growth in the installed power corresponds to growth in fuel use.
Figure 3.17. Correlation between IEA-reported sales of marine oil products and transport work
1975-2000
Source: Endresen et al. (2007). Transport work data is based on Stopford (1997) and Fearnleys (2002). For theperiod 1975-2000, the correlation is 0.97.
190
180
170
160
150
140
130
120
110
10012 000 14 000 16 000 18 000 20 000 22 000 24 000
Marine sale of fuel (Mt)
Seaborne transport (Btm)
GLOBALISATION, TRANSPORT AND THE ENVIRONMENT © OECD 2010 73
3. INTERNATIONAL MARITIME SHIPPING: THE IMPACT OF GLOBALISATION ON ACTIVITY LEVELS
Another approach is to extrapolate the growth in transport work (tonne-miles) (Fearnleys,2006). Transport work is linearly correlated with installed fleet power for historic data (LRF,2007) (correlation coefficient higher than 0.95). If this linear correlation is assumed valid alsofor the future, the extrapolated values for transport work yields estimates for future fleetpower by the same linear function. If the extrapolation is based on the growth trend intransport work from 1995 to 2005, the growth in installed fleet power to 2020 would be 33%.However, if the extrapolation is based on the trend from 2002 to 2005, the growth to 2020 willbe 64%. Again, using shorter regression periods leads to higher estimates due to higher growthin transport activity in the years preceding the current severe economic recession.
Of course, the above growth trends (in installed power) do not directly translate intofuel use growth rates. Most studies on future scenarios, however, take historic trends forsome recent period and extrapolate, with adjustments for expected changes in trends.Often these adjustments are the responses to economic and population drivers affectingglobal trade or consumption. The TREMOVE maritime model (Ceuster et al., 2006;Zeebroeck et al., 2006), is an example of such a model. It estimates fuel consumption (andemissions) trends derived from forecasted changes in ship voyage distances (maritimemovements in km) and the number of port calls.
An IMO study on greenhouse gas emissions from ships (Skjølsvik et al., 2000)forecasted a growth rate in seaborne trade (in terms of tonnage) of 1.5% to 3% annually. Thestudy applied these growth rates in trade to represent growth in energy requirements.
Eyring et al. (2005b) estimated future world seaborne trade in terms of volume in tonsfor a specific ship traffic scenario in a future year based on the historical correlationbetween the total seaborne trade and world gross domestic product (GDP) from 1985to 2001. Following the annual growth rate in GDP for four Intergovernmental Panel onClimate Change (IPCC) storylines (varying between 2.3% and 3.6%) (IPCC, 2000), seabornetrade increased by 2.6% to 4.0% per year. According to this study, fuel consumption by theworld fleet may increase from 280 Mt in 2001 to 409 Mt in 2020 and 725 Mt in 2050. It shouldbe noted that the calculations done by Eyring et al. (2005b) starts in 2002 and does notinclude the unexpectedly high growth between 2002 and 2007.
Buhaug et al. (2008) reported scenarios for 2020 and 2050, with even higher projections,and an IMO working group estimated marine fuel consumption of 486 Mt in 2020 (IMO, 2007).
In the Quantify project,4 future fuel consumption, emissions and geographicaldistribution of emissions for shipping in the years 2025, 2050 and 2100 were modelled basedon four IPCC scenarios. The IPCC storylines were translated into maritime scenarios,exploring the major factors expected to determine the development in shipping, mostnotably GDP development, environmental policy development and pace of technologydevelopment. Separate models for fuel consumption, total emissions and geographicaldistribution of ship emissions were made for each scenario, taking into consideration futurechanges in world trading patterns. Cargo and non-cargo ships were modelled separately inthis study. This allowed alternative input data per scenario (e.g. based on availability of fossilfuel and ship power supply). Two of these scenarios are presented below.
Primary input from the IPCC scenario descriptions are projections of growth in the worldeconomy, expressed as gross domestic product (GDP). Using historical data, aggregatedglobal GDP is linked to the size of the world fleet, through world seaborne trade volumes.Hence, future expectation of economic development stipulates the future world shippingfleet which, along with historical data for average installed engine power, gives an estimateof the future fleet’s total installed engine power (Figure 3.18). The future fuel consumption
GLOBALISATION, TRANSPORT AND THE ENVIRONMENT © OECD 201074
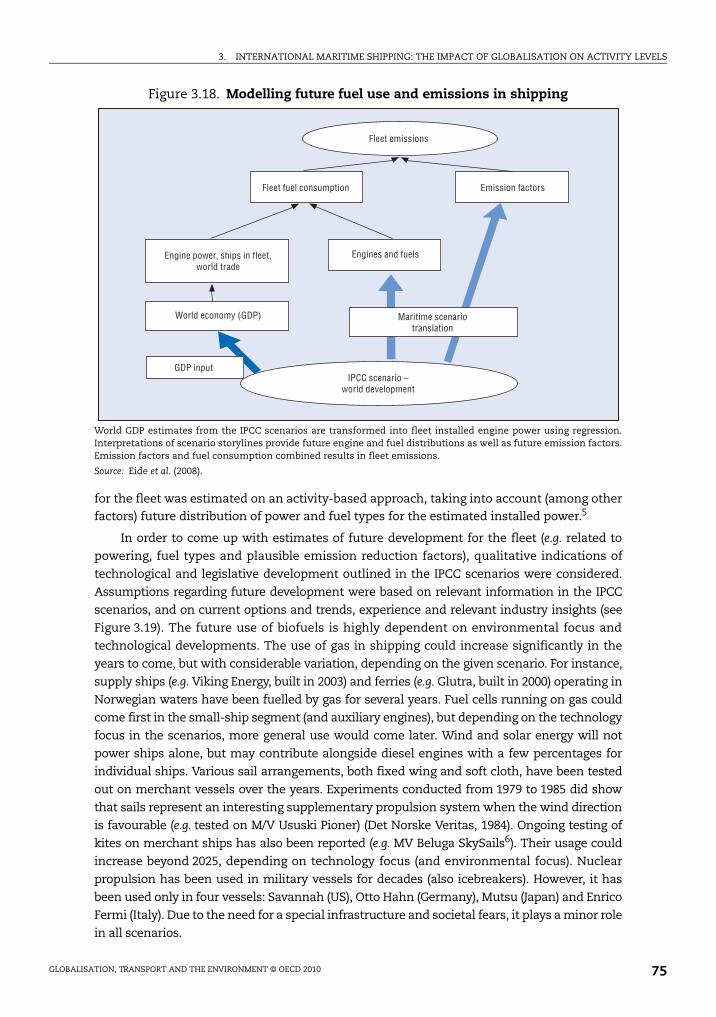
3. INTERNATIONAL MARITIME SHIPPING: THE IMPACT OF GLOBALISATION ON ACTIVITY LEVELS
for the fleet was estimated on an activity-based approach, taking into account (among otherfactors) future distribution of power and fuel types for the estimated installed power.5
In order to come up with estimates of future development for the fleet (e.g. related to
powering, fuel types and plausible emission reduction factors), qualitative indications of
technological and legislative development outlined in the IPCC scenarios were considered.
Assumptions regarding future development were based on relevant information in the IPCC
scenarios, and on current options and trends, experience and relevant industry insights (see
Figure 3.19). The future use of biofuels is highly dependent on environmental focus and
technological developments. The use of gas in shipping could increase significantly in the
years to come, but with considerable variation, depending on the given scenario. For instance,
supply ships (e.g. Viking Energy, built in 2003) and ferries (e.g. Glutra, built in 2000) operating in
Norwegian waters have been fuelled by gas for several years. Fuel cells running on gas could
come first in the small-ship segment (and auxiliary engines), but depending on the technology
focus in the scenarios, more general use would come later. Wind and solar energy will not
power ships alone, but may contribute alongside diesel engines with a few percentages for
individual ships. Various sail arrangements, both fixed wing and soft cloth, have been tested
out on merchant vessels over the years. Experiments conducted from 1979 to 1985 did show
that sails represent an interesting supplementary propulsion system when the wind direction
is favourable (e.g. tested on M/V Ususki Pioner) (Det Norske Veritas, 1984). Ongoing testing of
kites on merchant ships has also been reported (e.g. MV Beluga SkySails6). Their usage could
increase beyond 2025, depending on technology focus (and environmental focus). Nuclear
propulsion has been used in military vessels for decades (also icebreakers). However, it has
been used only in four vessels: Savannah (US), Otto Hahn (Germany), Mutsu (Japan) and Enrico
Fermi (Italy). Due to the need for a special infrastructure and societal fears, it plays a minor role
in all scenarios.
Figure 3.18. Modelling future fuel use and emissions in shipping
World GDP estimates from the IPCC scenarios are transformed into fleet installed engine power using regression.Interpretations of scenario storylines provide future engine and fuel distributions as well as future emission factors.Emission factors and fuel consumption combined results in fleet emissions.
Source: Eide et al. (2008).
Fleet emissions
Engines and fuelsEngine power, ships in fleet,world trade
Maritime scenariotranslation
World economy (GDP)
GDP inputIPCC scenario –
world development
Emission factorsFleet fuel consumption
GLOBALISATION, TRANSPORT AND THE ENVIRONMENT © OECD 2010 75
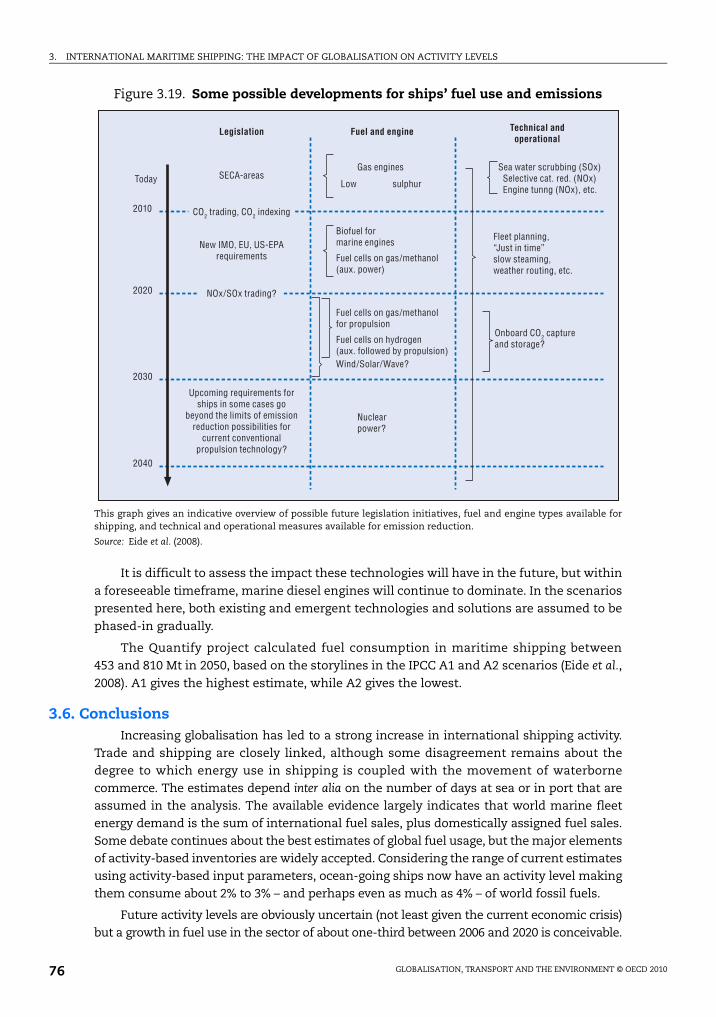
3. INTERNATIONAL MARITIME SHIPPING: THE IMPACT OF GLOBALISATION ON ACTIVITY LEVELS
It is difficult to assess the impact these technologies will have in the future, but withina foreseeable timeframe, marine diesel engines will continue to dominate. In the scenariospresented here, both existing and emergent technologies and solutions are assumed to bephased-in gradually.
The Quantify project calculated fuel consumption in maritime shipping between453 and 810 Mt in 2050, based on the storylines in the IPCC A1 and A2 scenarios (Eide et al.,2008). A1 gives the highest estimate, while A2 gives the lowest.
3.6. ConclusionsIncreasing globalisation has led to a strong increase in international shipping activity.
Trade and shipping are closely linked, although some disagreement remains about thedegree to which energy use in shipping is coupled with the movement of waterbornecommerce. The estimates depend inter alia on the number of days at sea or in port that areassumed in the analysis. The available evidence largely indicates that world marine fleetenergy demand is the sum of international fuel sales, plus domestically assigned fuel sales.Some debate continues about the best estimates of global fuel usage, but the major elementsof activity-based inventories are widely accepted. Considering the range of current estimatesusing activity-based input parameters, ocean-going ships now have an activity level makingthem consume about 2% to 3% – and perhaps even as much as 4% – of world fossil fuels.
Future activity levels are obviously uncertain (not least given the current economic crisis)but a growth in fuel use in the sector of about one-third between 2006 and 2020 is conceivable.
Figure 3.19. Some possible developments for ships’ fuel use and emissions
This graph gives an indicative overview of possible future legislation initiatives, fuel and engine types available forshipping, and technical and operational measures available for emission reduction.
Source: Eide et al. (2008).
Nuclearpower?
Fuel cells on gas/methanolfor propulsion
Fuel cells on hydrogen(aux. followed by propulsion)
Biofuel formarine engines
Fuel cells on gas/methanol(aux. power)
Wind/Solar/Wave?
Gas enginesSECA-areas
CO2 trading, CO2 indexing
NOx/SOx trading?
New IMO, EU, US-EPArequirements
Upcoming requirements forships in some cases go
beyond the limits of emissionreduction possibilities for
current conventionalpropulsion technology?
Low sulphur
Onboard CO2 captureand storage?
Fleet planning,“Just in time”slow steaming,weather routing, etc.
Sea water scrubbing (SOx) Selective cat. red. (NOx) Engine tunng (NOx), etc.
Today
2020
2010
2030
2040
Technical andoperational
Fuel and engineLegislation
GLOBALISATION, TRANSPORT AND THE ENVIRONMENT © OECD 201076
3. INTERNATIONAL MARITIME SHIPPING: THE IMPACT OF GLOBALISATION ON ACTIVITY LEVELS
Notes
1. This chapter is an edited version of two papers: The Impact of Globalisation on International MaritimeTransport Activity: Past Trends and Future Perspectives, written by James J. Corbett and JamesWinebrake, Energy and Environmental Research Associates, the United States, for the OECD/ITFGlobal Forum on Transport and Environment in a Globalising World, held in Guadalajara, Mexico,10-12 November 2008 (www.oecd.org/dataoecd/10/61/41380820.pdf) and The Environmental Impacts ofIncreased International Maritime Shipping: Past Trends and Future Perspectives, written by ØyvindEndresen and Magnus Eide, Det Norske Veritas, Høvik; Stig Dalsøren and Ivar S. Isaksen, Universityof Oslo; and Eirik Sørgård, Pronord AS, Bodø, Norway, for the same event (www.oecd.org/dataoecd/52/30/41373767.pdf).
2. A somewhat similar relationship could also hold in the current economic recession. While OECD(2009) foresees a 2.75% reduction in world GDP in 2009, a 13.2% reduction in world trade is expected.
3. See Corbett and Winebrake (2008) for further elaboration.
4. www.pa.op.dlr.de/quantify/.
5. Future emissions from shipping are then estimated based on the calculated fuel consumption andthe assumed time-dependent technological factors.
6. http://skysails.info/index.php?id=6&L=1.
References
American Bureau of Shipping (2005), Guide for Marine Health, Safety, Quality, and EnvironmentalManagment, edited, American Bureau of Shipping, Houston, TX.
Annin, R.E. (1920), Ocean Shipping, Elements of Practical Steamship Operation, Century Co., New York.
Bates, J. et al. (2001), Economic Evaluation of Emissions Reductions in the Transport Sector of the EU: Bottom-upAnalysis, UPDATED, Final Report, AEA Technology Environment, Abingdon, UK.
Buhaug, Ø. et al. (2008), Updated Study on Greenhouse Gas Emissions from Ships: Phase I Report, InternationalMaritime Organization (IMO), London, UK, www.imo.org/includes/blastDataOnly.asp/data_id%3D23703/INF-6.pdf.
Bureau of Transportation Statistics (2007), National Transportation Statistics 2007, US Department ofTransportation, Research and Innovation Technology Administration, Washington DC.
Corbett, C.J. and D.A. Kirsch (2001), “International Diffusion of ISO 14000 Certification”, Production andOperations Management, 10(3), pp. 327-342.
Corbett, C.J. (2005), Global Diffusion of ISO 9000 Certification through Supply Chains, SSRN.
Corbett, J.J. (2004), “Marine Transportation and Energy Use”, in Encyclopedia of Energy, edited byC.J. Cleveland, pp. 745-748, Elesvier Science, San Diego, CA.
Corbett, J.J. et al. (1999), “Global Nitrogen and Sulphur Emissions Inventories for Oceangoing Ships”,Journal of Geophysical Research, 104(D3), pp. 3457-3470.
Corbett, J.J. et al. (2007), “Mortality from Ship Emissions: A Global Assessment”, Environmental Scienceand Technology, 41(24), pp. 8233-8239.
Corbett, J.J. and P.S. Fischbeck (1997), “Emissions From Ships”, Science, 278(5339), pp. 823-824.
Corbett, J.J. and P.S. Fischbeck (2002), “Commercial Marine Emissions and Life-Cycle Analysis of RetrofitControls in a Changing Science and Policy Environment”, Naval Engineers Journal, 114(1), pp. 93-106.
Corbett, J.J. and H.W. Koehler (2003), “Updated Emissions from Ocean Shipping”, Journal of GeophysicalResearch – Atmospheres, 108(D20), pp. 4650-4666.
Corbett, J.J. and H.W. Koehler (2004), “Considering Alternative Input Parameters in an Activity-BasedShip Fuel Consumption and Emissions Model”, Journal of Geophysical Research – Atmospheres,109(D23303), p. 8.
Corbett, J.J. and J.J. Winebrake (2007), “Sustainable Movement of Goods: Energy and EnvironmentalImplications of Trucks, Trains, Ships, and Planes”, Environmental Management, November.
Corbett, J.J. and J.J. Winebrake (2008), The Impact of Globalisation on International Maritime Transport Activity:Past Trends and Future Perspectives, Paper prepared for the OECD/ITF Global Forum on Transport andEnvironment in a Globalising World, held in Guadalajara, Mexico, 10-12 November 2008, available atwww.oecd.org/dataoecd/10/61/41380820.pdf.
GLOBALISATION, TRANSPORT AND THE ENVIRONMENT © OECD 2010 77
3. INTERNATIONAL MARITIME SHIPPING: THE IMPACT OF GLOBALISATION ON ACTIVITY LEVELS
Dalsøren, S.B. et al. (2009), “Update on Emissions and Environmental Impacts from the InternationalFleet of Ships: The Contribution from Major Ship Types and Ports”, Atmospheric Chemistry andPhysics, 9, pp. 2171-2194, available at www.atmos-chem-phys.org/9/2171/2009/acp-9-2171-2009.pdf.
Eide, M.S. et al. (2008), EU Project Quantify Delivery: Ship Emissions of the Future, Report No. 2007-1325, DetNorske Veritas AS, Høvik, Norway.
Endresen, Ø. et al. (2003), “Emission from International Sea Transportation and EnvironmentalImpact”, Journal of Geophysical Research, 108(D17), p. 4560.
Endresen, Ø. et al. (2004a), “Substantiation of a Lower Estimate for the Bunker Inventory: Comment on‘Updated Emissions from Ocean Shipping’”, by James J. Corbett and Horst W. Koehler, Journal ofGeophysical Research – Atmospheres, 109(D23302).
Endresen, Ø. et al. (2004b), “Challenges in Global Ballast Water Management”, Marine Pollution Bulletin,48(7-8), pp. 615-623.
Endresen, Ø. et al. (2007), “A Historical Reconstruction of Ships’ Fuel Consumption and Emissions”,Journal of Geophysical Research, 112(D12301).
Endresen, Ø. et al. (2008), The Environmental Impacts of Increased International Maritime Shipping – PastTrends and Future Perspectives, Paper prepared for the OECD/ITF Global Forum on Transport andEnvironment in a Globalising World, Guadalajara, Mexico, 10-12 November 2008, available atwww.oecd.org/dataoecd/52/30/41373767.pdf.
Energy Information Administration (1998), Energy Efficiency Initiative, Vol. 1, Energy Policy Analysis,193 pp., International Energy Agency, Paris, France.
Energy Information Administration (2001), World Energy Database and International Energy Annual 2001,edited, Energy Information Administration (EIA).
Energy Information Administration (2007), Annual Energy Outlook 2007 with Projections to 2030,Supplemental Transportation Tables, Department of Energy, Washington DC.
Environmental Protection Agency (2005a), Inventory of US Greenhouse Gas Emissions and Sinks: 1990-2003,432 pp., US Environmental Protection Agency, Washington DC.
Environmental Protection Agency (2005b), National Air Pollutant Emission Trends, 1970-2002, edited, USEnvironmental Protection Agency, Washington DC.
European Commission et al. (2006a), European Energy and Transport in Figures 2006, EuropeanCommission, Brussels, Belgium.
European Commission et al. (2006b), European Energy and Transport, Trends to 2030 – Update 2005,European Commission, Brussels, Belgium.
Evans, S.M. (2000), “Marine Antifoulants”, in Seas at the Millennium, An Environmental Evaluation, Vol. III,edited by C. Sheppard, Chapter 124, pp. 247-256, Pergamon, New York.
Eyring, V. et al. (2005a), “Emissions from International Shipping: 1. The Last 50 Years”, Journal ofGeophysical Research – Atmospheres, 110(D17), D17305, doi: http://dx.doi.org/10.1029/2004JD005619.
Eyring, V. et al. (2005b), “Emissions From International Shipping: 2. Impact of Future Technologies onScenarios Until 2050”, Journal of Geophysical Research, 110, D17306, doi: http://dx.doi.org/10.1029/2004JD005620.
Fearnleys (2002), Review 2001, Fearnresearch, Oslo, Norway.
Finland et al. (2005), MARPOL Annex VI – Proposal to Initiate a Revision Process, edited, InternationalMaritime Organization, Marine Environment Protection Committee, London.
Fletcher, M. (1997), “From Coal to Oil in British Shipping”, in The World of Shipping, edited byD.M. Williams, pp. 153-171, Ashgate, Brookfield.
Hansen, L.E. (2004), Hvordan kan fusjonen mellom P&Q og Carnival påvirke konkurransedynamikken icruisemarkedet? (How Can the Merger of P&Q and Carnival Affect Competition-Dynamics in theCruise Market?) (in Norwegian), thesis, Norwegian School of Economics and BusinessAdministration, Bergen, Norway.
ICF Consulting (2005), Best Practices in Preparing Port Emission Inventories: Draft for Review, prepared forOffice of Policy, Economics and Innovation, United States Environmental Protection Agency,Fairfax, Virginia.
GLOBALISATION, TRANSPORT AND THE ENVIRONMENT © OECD 201078

3. INTERNATIONAL MARITIME SHIPPING: THE IMPACT OF GLOBALISATION ON ACTIVITY LEVELS
IMO Working Group on Air Pollution from Ships (2006), Review of MARPOL Annex VI and the NOx TechnicalCode: Report of the Working Group, edited by IMO Submittal, Intersessional Meeting of the BLG WorkingGroup on Air Pollution, 1st session, Agenda Item 2.
International Energy Agency (IEA) (1977-97), Quarterly Oil Statistics, Various Issues, IEA/OECD, Paris.
IEA (1987), Energy Statistics 1970-1985 and Main Series from 1960, IEA/OECD, Paris.
IEA (2007a), Oil Information 2007, edited, p. 746, IEA/OECD, Paris.
IEA (2007b), Energy Statistics of Non-OECD Countries, 2004-2005, edited, p. 786, IEA/OECD, Paris.
International Maritime Organization (IMO) (1998), Annex VI of MARPOL 73/78 and NOx Technical Code,IMO-664E ed., 150 pp., IMO, London, UK.
IMO (2004), International Convention for the Control and Management of Ships’ Ballast Water and Sediments,IMO, London.
IMO (2007), Review of MARPOL Annex VI and the NOx Technical Code, Report on the outcome of theInformal Cross Government/Industry Scientific Group of Experts established to evaluate the effectsof the different fuel options proposed under the revision of MARPOL Annex VI, p. 48, IMO, London.
Kumar, S. and J. Hoffmann (2002), “Chapter 3 Globalization: The Maritime Nexus”, in Handbook ofMaritime Economics and Business, edited by C. Grammenos, pp. 35-62, Informa, Lloyds List Press,London.
Lloyds Maritime Information System (LMIS) (2002), The Lloyds Maritime Database, edited, Lloyd’sRegister – Fairplay Ltd.
Lloyd’s Register of Shipping (LR) (1961), Statistical Tables, 1961, United Kingdom.
Lloyd’s Register of Shipping (LR) (1984), Statistical Tables, 1984, United Kingdom.
Lloyd’s Register Fairplay (LRF) (2007), Extracts from the World Merchant Fleet Database (all civil ocean-goingcargo and passenger ships above or equal to 100 GT), Redhill, UK.
NAVSEA (1994), US Navy Marine Diesel Engine and Gas Turbine Exhaust Emissions, US Government, NavalSea Systems Command 03X31, Washington DC.
Navy, US (1996), Navy News Service Message, edited, Navy Media Center Publishing.
Obando-Rojas, B. (2001), The Global Labour Market Study (GLMS), paper presented at Proceedings of SIRC’ssecond symposium, Seafarers International Research Centre (SIRC), Cardiff University, 29 June.
Organisation for Economic Co-operation and Development (OECD) and J. Hecht (1997), TheEnvironmental Effects of Freight, Trade Directorate, OECD, Paris.
Skjølsvik, K.O. et al. (2000), Study of Greenhouse Gas Emissions from Ships (MEPC 45/8 Report toInternational Maritime Organization on the outcome of the IMO Study on Greenhouse GasEmissions from Ships), IMO contract report, MARINTEK Sintef Group, Carnegie Mellon University,Center for Economic Analysis, and Det Norske Veritas, Norway.
Society of Naval Architects and Marine Engineers (SNAME) (1983), A Guide for a Coal Fired Boiler System,Tech. Res. Bull., 3-34, New York.
SNAME (1988), The Principles of Naval Architecture, Vol. II, Resistance, Propulsion and Vibration, 2nd rev.,edited by E.V. Lewis, Jersey City, NJ.
Stopford, M. (1997), Maritime Economics, 2nd ed., Routledge, London.
Thomas, R. et al. (2002), “Shipping Activities”, Chapter B842, in EMEP/CORINAIR Emission InventoryGuidebook – October 2002 UPDATE, edited by K. Lavender et al., European Environment Agency,Copenhagen, Denmark.
United Nations Framework Convention on Climate Change (UNFCCC) and Subsidiary Body for Scientificand Technological Advice (2004), Methodological Issues Relating to Emissions from International Aviationand Maritime Transport, Note by the Secretariat, United Nations Framework Convention on ClimateChange, Subsidiary Body for Scientific and Technological Advice, Bonn, Germany.
Wijnolst, N. and T. Wergeland (1997), Shipping, Delft University Press, Delft, Netherlands.
Woodfield, M. and K. Rypdal (2003), Atmospheric Emission Inventory Guidebook, 3rd edition, September 2003update ed., European Environmental Agency, Copenhagen, Denmark.
GLOBALISATION, TRANSPORT AND THE ENVIRONMENT © OECD 2010 79


Globalisation, Transport and the Environment
© OECD 2010
Chapter 4
International Air Transport: The Impact of Globalisation on Activity Levels
byKen Button and Eric Pels1
This chapter describes the basic features of international air transport. It opens witha historical perspective from the 1930s to modern day. The modern air transportindustry is one that increasingly operates within a liberal market context. Whilegovernment controls over fares, market entry and capacity continue in manysmaller countries, they are gradually and almost universally being removed orrelaxed. The chapter explains why the air transport industry is now large – itaccounts for about 1% of the GDP of both the EU and the United States. It is animportant transporter of high-value, low-bulk cargoes. International aviationmoves about 40% of world trade by value, although far less in physical terms.
The chapter explores the effects of globalisation on airlines, not just on the demandside – where the scale, nature and geography of demand in global markets has ledto significant shifts – but also on the supply side, where government policies(e.g. regarding safety, security and the environment) require internationalco-ordination. It examines technological developments. Two major innovations in airtransport were the introduction of jet engines, which considerably shortened traveltimes, and the introduction of wide-bodied aircraft, which gave airlines theopportunity to reduce the cost per seat. Both developments reduced the generalisedcost of travel, so that they had a positive impact on demand. And in closing, thechapter explores changing industrial needs.
81

4. INTERNATIONAL AIR TRANSPORT: THE IMPACT OF GLOBALISATION ON ACTIVITY LEVELS
4.1. IntroductionAir transport is a major industry in its own right and it also provides important inputs into
wider economic, political and social processes. The demand for its services, as with most
transport, is a derived one that is driven by the needs and desires to attain some other, final
objective. Air transport can facilitate, for example, the economic development of a region or of
a particular industry such as tourism, but there has to be a latent demand for the goods and
services offered by a region or by an industry. Lack of air transport, as with any other input into
the economic system, can stymie efficient growth, but equally inappropriateness or excesses
in supply are wasteful.
Economies, and the interactions between them, are in a continual state of flux. This
dynamism has implications for industries such as air transport. But there are also feedback
loops, because developments in air transport can shape the form and the speed at which
globalisation and related processes take place. In effect, while the demand for air transport
is a derived demand, the institutional context in which air transport services are delivered
have knock-on effects on the economic system. These feedback loops may entail direct
economic, political and social effects that, for example, accompany enhanced trade and
personal mobility, but they may also be indirect, as for example through the impacts of air
transport on the environment.
The analysis here focuses on one small sector, international commercial aviation, and on
only one direction of causality, the implications of globalisation for this sector. Some related
considerations are embraced where particularly important. For example, there is an increasing
blurring of international and domestic air transport as airlines form alliances and invest in
each other to form global networks. Indeed, the domestic and international air transport
market within the European Union (EU) is de facto one market. Also, not all feedback loops are
ignored, particularly when changes in air transport facilitate global trends that then, in turn,
feed back on the air transport industries; migration of labour is one example of this.
4.2. Globalisation and internationalisationThe reasons for the contemporary globalisation processes from the latter part of the
20th century, and their larger implications, are much debated. Thomas Friedman (2005) for
example, suggested the world is “flat”, in the sense that globalisation has levelled the
competitive playing fields between industrial and emerging market countries. The
globalisation of trade, outsourcing, supply-chaining and political forces have changed the
world permanently, for both better and worse. He also argued that the pace of globalisation is
quickening and will continue to have a growing impact on business organisation and
practice.This flattening is seen as a product of a convergence of the emergence of the personal
computer and the fibre-optic micro cable, combined with the rise of work-flow software. He
called this “Globalization 3.0”, which is different from “Globalization 1.0” (when countries and
governments were the main protagonists in globalisation) and “Globalization 2.0” (in which
multinational companies led the way in driving global integration). Cairncross (1997) looked at
GLOBALISATION, TRANSPORT AND THE ENVIRONMENT © OECD 201082
4. INTERNATIONAL AIR TRANSPORT: THE IMPACT OF GLOBALISATION ON ACTIVITY LEVELS
it from only a slightly different perspective. The growing ease and speed of communication
was seen as creating a world where distance has little to do with abilities to work or interact
together. Much work that can be done on a computer may be done from anywhere; workers
can code software in one part of the world and pass it to a company thousands of kilometres
away that will assemble the code for marketing. With workers able to earn a living anywhere,
countries will find themselves competing for citizens as individuals relocate for reasons
ranging from lower taxes to nicer weather.
Much of these processes have been technology-driven, although facilitated by broad
political shifts, such as the demise of the Soviet system, the gradual emergence of
international free trade bodies, such as the EU and World Trade Organization, and reductions
in global political tensions. Many of the technical changes have been in transport. In particular,
there have been massive developments in the technologies used to transport information.
While traditional transport analysts often see the “telecommunications revolution” as
somehow different and outside their field of study, it is, in fact, the first major transport change
since the widespread adoption of mechanised transport in mid-19th century. Air transport,
although still a child of the mechanised age, has been closely linked with globalisation and
the telecommunications revolution. It has been important in the opening up of labour
markets, along the lines indicated by Cairncross, and in its role as a facilitator for
the development of industry allowing the production and maintenance of cheap
telecommunications hardware. It has also, in turn, benefited from the communications
revolution in terms of air traffic control, navigation and safety enhancement, but also in
making possible the logistics of bringing together the elements required in moving millions of
people and tons of cargo across complex networks.
4.3. The basic features of international air transport
Historical perspective
Air transport has always been seen to have an inherently strategic role. It has obvious
direct military applications, but it is also highly visible and, for a period, and in some
countries still, was seen as a “flag carrier”, a symbol of international commercial presence.
From their earliest days, airlines were seen as having potential for providing high-speed mail
services, and subsequently medium- and long-term passenger transport. Technology now
allows the transportation of much larger cargo payloads in a more reliable way. These
strategic functions were used to pursue internal national policies of social, political, and
economic integration within large countries such as Canada, the US and Australia, but also
took on international significance from the 1930s within the imperial geopolitical systems
focused mainly on the UK, France, Germany and other European countries, when technology
allowed for intercontinental services to be developed.
Air transport was highly regulated and protected in this environment, to be used as a lever
for larger political and economic objectives. But even in these roles, its importance was small.
British Imperial Airways, for example, only carried about 50 000 passengers to the colonies in
the 1930s, a figure hidden in the public media coverage given to the importance of colonial air
networks. Technology shifts as an offshoot of military developments in World War II changed
this with the introduction of planes with far longer ranges, faster speeds, enhanced lift and
increasing ability to cope with adverse weather conditions. Air traffic control, navigation,
communications and airport facilities have also improved considerably, and more recently, the
underlying management structure of the supplying industries has enhanced efficiency.
GLOBALISATION, TRANSPORT AND THE ENVIRONMENT © OECD 2010 83
4. INTERNATIONAL AIR TRANSPORT: THE IMPACT OF GLOBALISATION ON ACTIVITY LEVELS
The Chicago Convention of 1944 confronted the new international potentials of civil
aviation and initiated an institutional structure that laid common ground rules for bilateral
air service agreements (ASAs) between nationals. The result, however, while providing a
formal basis for negotiation, was essentially one of protectionism, with pairs of countries
agreeing on which airlines could offer services between them, the fares to be changed and,
often, how the revenues could be shared. Added to this, with the major exception of the
United States, most international airlines were state-owned flag carriers that operated to
fulfil often vague, national objectives of prestige, as well as linking colonies. Internal
markets within countries were regulated in similar fashion, and it was not uncommon for
wealthier countries to have one airline to provide primarily domestic and short-haul
services, and one for long-haul, international markets.
The breakdown of the domestic regulatory structure within the United States from the
late 1970s (Morrison, and Winston, 1995) provided a demonstration for other countries to
follow in deregulating their own domestic regimes. It also led to the (initially unsuccessful)
US initiative from 1979 to liberalise international services on a bilateral basis, based on a
common “Open Skies” recipe to bring about wider reforms. This was coupled with more
generic moves towards withdrawal of government in market-oriented countries such as
New Zealand and the United Kingdom, that saw airports and air traffic control privatised,
or at least operated on a more commercial footing. The move to a single European market
within the EU from 1992 represented a broader trend, both in terms of the sectors and the
geography involved, towards market liberalisation of air transport infrastructure, as did the
collapse of the Soviet economic system. Not all countries moved completely in this
direction; the United States for example, rather perversely, continued with its policy of air
traffic control being a state-owned, tax-financed monopoly and airports, with few
exceptions, being owned by local governments (Button and McDougall, 2006).
There has been almost universal tightening of regulations that run counter to market
liberalisation in what the United States calls “social regulation” and Europe calls “quality
regulation”. This concerns such matters as the environment, safety, security, and
consumer and labour protection. These are areas that have been traditionally dealt with at
the international level by the International Civil Aviation Organization (ICAO) set up under
the Chicago Convention, in accordance with international accords such as the Warsaw
Convention, that dates back to 1929 and deals with liabilities in the case of accidents.2
More recently, regional or national actions have also taken on international significance
(e.g. the extension of carbon trading within the EU to embrace all air transport, and the US
introduction of stricter security measures, such as the provision of passenger information
for all flights into the country).
Modern aviation
The modern air transport industry is thus one that increasingly operates within a
liberal market context. While government controls over fares, market entry and capacity
continue in many smaller countries, they are gradually and almost universally being
removed or relaxed. International controls under the bilateral ASA structure are
increasingly moving towards broad Open Skies formulations, allowing free provision of
services between countries. However, progress on an open market, where nationality of
ownership of airlines is unrestricted, is coming more slowly. The EU area3 has effectively
been the largest international free market in air transport services in the world since 1997,
and this has grown as the EU has expanded. The supply and operation of air transport
GLOBALISATION, TRANSPORT AND THE ENVIRONMENT © OECD 201084

4. INTERNATIONAL AIR TRANSPORT: THE IMPACT OF GLOBALISATION ON ACTIVITY LEVELS
infrastructure is also becoming more market driven with privatisation of airports and air
traffic control systems, or the use of franchising mechanisms to involve private capital and
expertise (Button, 2008). It is also becoming more co-ordinated.4
The air transport industry is now large – it accounts for about 1% of the GDP of both the
EU and the United States – and is vital in many industries such as tourism, exotic plants and
fruits, and high technology.5 It is an important transporter of high-value, low-bulk cargoes.
International aviation moves about 40% of world trade by value, although far less in physical
terms. The market is served by a diversity of carriers, some specialising in long-haul
international routes and others in short-haul markets.6 Table 4.1 offers some indication of
the scale of larger airlines involved. To handle the interface between land and air transport,
the world’s major airports have grown to handle millions of international passengers
(Table 4.2) and tons of cargo7 each year, and many have been significant catalysts facilitating
Table 4.1. Top ten international airlines by scheduled passenger-kilometres2007
Airline Scheduled passenger-kilometres (million)
Air France 112 689
British Airways 111 336
Lufthansa 109 384
Singapore Airlines 87 646
American Airlines 81 129
United Airlines 74 578
Emirates Airline 74 578
KLM 71 761
Cathay Pacific 71 124
Japan Airlines 59 913
Source: International Air Transport Association.
Table 4.2. Top 20 international airports by passengers2007
Airport International passengers
London Heathrow Airport 62 099 530
Charles de Gaulle International Airport 54 901 564
Amsterdam Airport Schiphol 47 677 570
Frankfurt Airport 47 087 699
Hong Kong International Airport 46 281 000
Singapore Changi Airport 35 221 203
Narita International Airport 34 289 064
Dubai International Airport 33 481 257
Suvarnabhumi Airport 31 632 716
London Gatwick Airport 31 139 116
Incheon International Airport 30 753 225
Madrid Barajas International Airport 29 339 784
Kuala Lumpur International Airport 26 938 970
Chatrapati Shivaji International Airport 25 360 860
Munich Airport 23 988 612
Dublin Airport 22 339 673
John F. Kennedy International Airport 21 521 711
London Stansted Airport 21 201 543
Taiwan Taoyuan International Airport 20 855 186
Malpensa International Airport 20 627 846
Source: Airports Council International.
GLOBALISATION, TRANSPORT AND THE ENVIRONMENT © OECD 2010 85

4. INTERNATIONAL AIR TRANSPORT: THE IMPACT OF GLOBALISATION ON ACTIVITY LEVELS
the growth of modern high technology industries and tourism. In 2008, passenger air
services globally linked around 15 500 airports, with the fastest growth in air services over
the past two decades being in the Europe-Asian Pacific markets.8
If one looks at the basic aggregate data, there is clear general link (although causality
is another matter) between the growth in global GDP and international trade and air
transport. Figure 4.1 provides aggregate information on the trends in world trade and
international air transport from the mid-1990s. A similar picture emerges if one plots world
GDP against air traffic. In each case, air volumes have risen albeit slightly less rapidly than
GDP. Figure 4.2 gives details of the shorter-run trends in growth in world trade and air
freight traffic volumes, and shows the common cyclical effects. While the ups and downs
broadly coincide, little by way of a consistent lag structure emerges.
Figure 4.1. World international trade and airline revenue passenger-kilometres
Note: RPK are revenue passenger-kilometres.
Source: International Civil Aviation Organisation.
Figure 4.2. Short-term links between world trade in manufactures and air freight volumes
Source: International Civil Aviation Organisation.
14 000 000
12 000 000
10 000 000
8 000 000
6 000 000
4 000 000
2 000 000
01995 1996 1997 1998 1999 2000 2001 2002 2003 2004 2005
World imports (USD millions) RPK (thousands)
20
15
10
5
0
-5
-101981 1986 1991 1996 2001 2006
Change in world trade (%) Change in air freight volumes (%)
GLOBALISATION, TRANSPORT AND THE ENVIRONMENT © OECD 201086
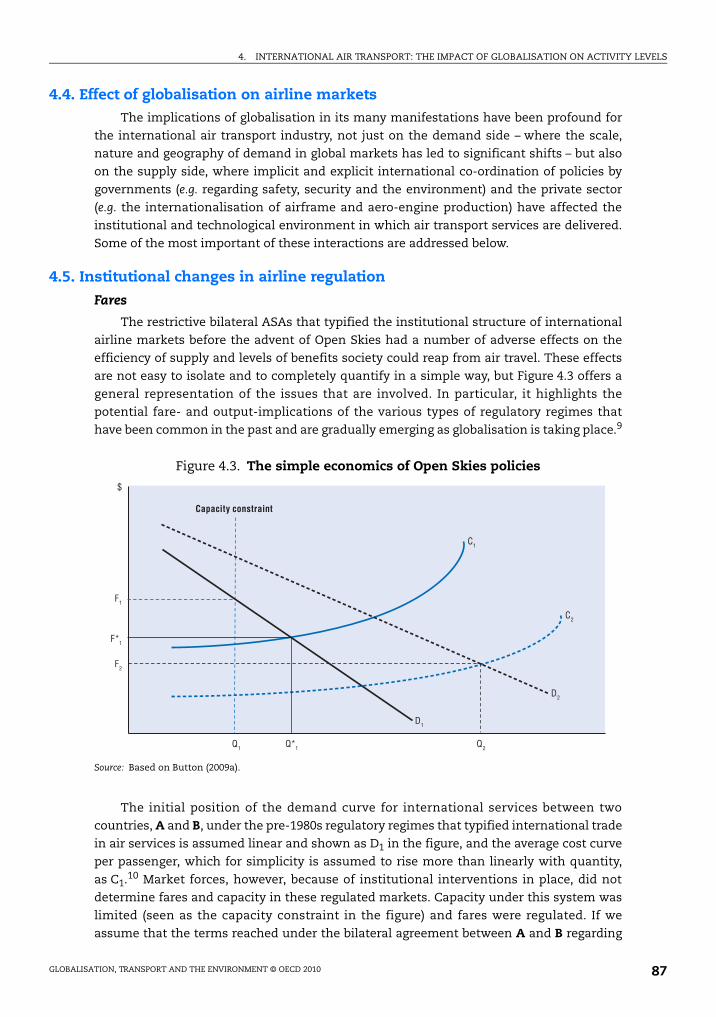
4. INTERNATIONAL AIR TRANSPORT: THE IMPACT OF GLOBALISATION ON ACTIVITY LEVELS
4.4. Effect of globalisation on airline marketsThe implications of globalisation in its many manifestations have been profound for
the international air transport industry, not just on the demand side – where the scale,
nature and geography of demand in global markets has led to significant shifts – but also
on the supply side, where implicit and explicit international co-ordination of policies by
governments (e.g. regarding safety, security and the environment) and the private sector
(e.g. the internationalisation of airframe and aero-engine production) have affected the
institutional and technological environment in which air transport services are delivered.
Some of the most important of these interactions are addressed below.
4.5. Institutional changes in airline regulation
Fares
The restrictive bilateral ASAs that typified the institutional structure of international
airline markets before the advent of Open Skies had a number of adverse effects on the
efficiency of supply and levels of benefits society could reap from air travel. These effects
are not easy to isolate and to completely quantify in a simple way, but Figure 4.3 offers a
general representation of the issues that are involved. In particular, it highlights the
potential fare- and output-implications of the various types of regulatory regimes that
have been common in the past and are gradually emerging as globalisation is taking place.9
The initial position of the demand curve for international services between two
countries, A and B, under the pre-1980s regulatory regimes that typified international trade
in air services is assumed linear and shown as D1 in the figure, and the average cost curve
per passenger, which for simplicity is assumed to rise more than linearly with quantity,
as C1.10 Market forces, however, because of institutional interventions in place, did not
determine fares and capacity in these regulated markets. Capacity under this system was
limited (seen as the capacity constraint in the figure) and fares were regulated. If we
assume that the terms reached under the bilateral agreement between A and B regarding
Figure 4.3. The simple economics of Open Skies policies
Source: Based on Button (2009a).
Capacity constraint
$
D1
C1
D2
C2
F1
F*1
F2
Q2Q*1Q1
GLOBALISATION, TRANSPORT AND THE ENVIRONMENT © OECD 2010 87
4. INTERNATIONAL AIR TRANSPORT: THE IMPACT OF GLOBALISATION ON ACTIVITY LEVELS
fares allowed for at least cost recovery by the partners’ airlines, this implies a fare level up
to F1.11 The removal of both this capacity constraint and of negotiated pricing, as happens
under a typical Open Skies arrangement, results in competition for air services, and a move
toward cost-recovery pricing strategies by the carriers. This would reduce fares to F*1.
Open Skies policies, coupled with allowing strategic alliances, not only remove the
capacity constraint, but also affects both the demand and supply curves for international
air travel between A and B. The ability of airlines to more effectively feed their transatlantic
routes and co-ordinate their activities, through the restructuring of their business and
networks will reduce the average cost of carriage to C2 in the figure. The effect is often
reinforced due to downward pressures on costs because, although not strictly part of the
Open Skies framework, the wider competitive environment within Europe, and the
privatisation of many carriers, by heightening commercial pressures, reduces the amount
of static and dynamic X-inefficiency in the airline industry. In other words, there is the
combined pressure of both free airline markets across the Atlantic and within the two
feeder markets at either end.
The Open Skies policy also has stimulation effects on the demand side. By allowing
more effective feed to the long-haul stage of transatlantic services through the
concentration of traffic at international hub airports, it increases the geographical market
being serviced and also generates economies of scope and scale. The larger physical
market demand, combined usually with the improved quality of the “product” that
accompanies more integrated services, such as code sharing, interchangeable frequent
flier programmes, common lounges and through baggage checking, pushes out the
demand for international air services to D2 in Figure 4.3.
The outcome of lowering costs and the outward shift in demand is that the number of
passengers travelling increases to Q2 and, because Open Skies allow price flexibility, the
fare falls to F2 in the way our example is drawn. It should be noted that fares might not
actually fall; indeed, they may rise as the result of the freer market conditions. The reason
for this is that the outward shift in demand reflects a better quality of service – e.g. more
convenient flights, transferability of frequent flier miles and seamless ticketing – and that,
on average, potential travellers are willing to pay more for this than the generic portfolio of
features that were found under the old bilateral ASA structure. (In Figure 4.3, the shift out
in demand may counteract the fall in costs resulting in F*1 < F2.)12
What does become pertinent, however, is the extent to which the fare structure is
influenced by the market power of the airlines. The analysis presented in Figure 4.3
assumes that in the Open Skies environment, fares are set to recover costs; in other words,
competition and mergers policy can effectively fulfil the role of regulation. This raises
issues as to the nature of markets that are generally served by a relatively small number of
large network carriers, often involving alliances. A degree of competition exists among the
various alliances for the trunk hauls market, and there is also competition at either end of
routes with many other (including low-cost) carriers competing for passengers in
overlapping feeder and origin-destination traffic to international hub airports. There are
also theoretical reasons derived from game theory suggesting that the outcome in a
market with three players approaches that of competition. Nevertheless, each alliance by
dint of product differentiation (e.g. they serve different airports) inevitably enjoys some
degree of monopoly power. This could lead to fares higher than F2 and a smaller output
than Q2, with consequential reductions in consumer surplus.13
GLOBALISATION, TRANSPORT AND THE ENVIRONMENT © OECD 201088
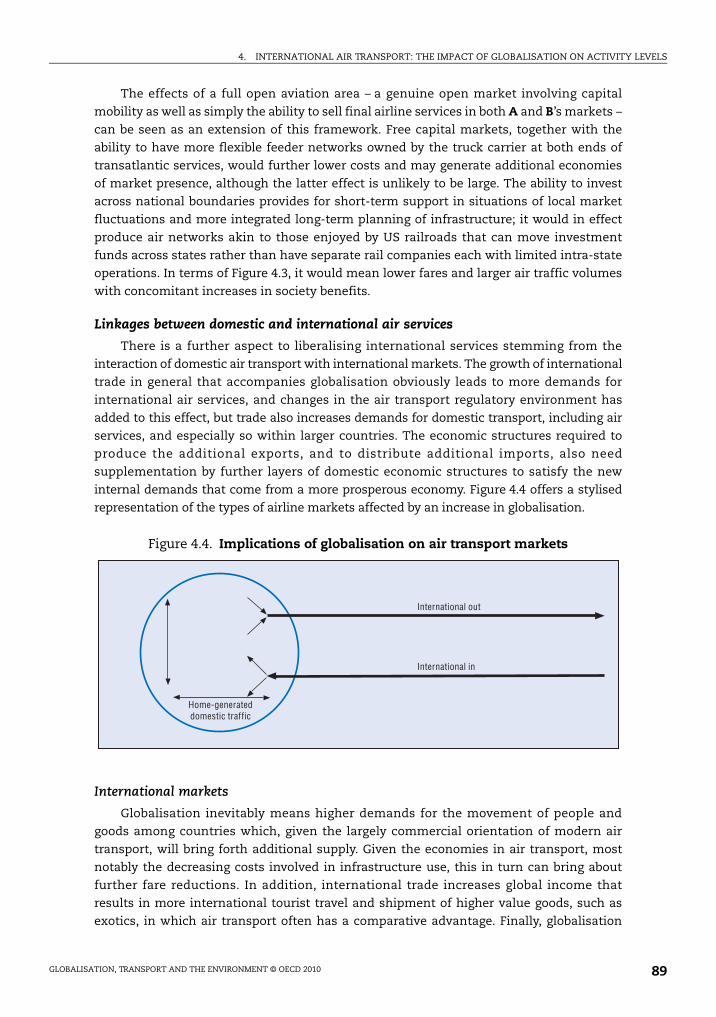
4. INTERNATIONAL AIR TRANSPORT: THE IMPACT OF GLOBALISATION ON ACTIVITY LEVELS
The effects of a full open aviation area – a genuine open market involving capital
mobility as well as simply the ability to sell final airline services in both A and B’s markets –
can be seen as an extension of this framework. Free capital markets, together with the
ability to have more flexible feeder networks owned by the truck carrier at both ends of
transatlantic services, would further lower costs and may generate additional economies
of market presence, although the latter effect is unlikely to be large. The ability to invest
across national boundaries provides for short-term support in situations of local market
fluctuations and more integrated long-term planning of infrastructure; it would in effect
produce air networks akin to those enjoyed by US railroads that can move investment
funds across states rather than have separate rail companies each with limited intra-state
operations. In terms of Figure 4.3, it would mean lower fares and larger air traffic volumes
with concomitant increases in society benefits.
Linkages between domestic and international air services
There is a further aspect to liberalising international services stemming from the
interaction of domestic air transport with international markets. The growth of international
trade in general that accompanies globalisation obviously leads to more demands for
international air services, and changes in the air transport regulatory environment has
added to this effect, but trade also increases demands for domestic transport, including air
services, and especially so within larger countries. The economic structures required to
produce the additional exports, and to distribute additional imports, also need
supplementation by further layers of domestic economic structures to satisfy the new
internal demands that come from a more prosperous economy. Figure 4.4 offers a stylised
representation of the types of airline markets affected by an increase in globalisation.
International markets
Globalisation inevitably means higher demands for the movement of people and
goods among countries which, given the largely commercial orientation of modern air
transport, will bring forth additional supply. Given the economies in air transport, most
notably the decreasing costs involved in infrastructure use, this in turn can bring about
further fare reductions. In addition, international trade increases global income that
results in more international tourist travel and shipment of higher value goods, such as
exotics, in which air transport often has a comparative advantage. Finally, globalisation
Figure 4.4. Implications of globalisation on air transport markets
International out
International in
Home-generateddomestic traffic
GLOBALISATION, TRANSPORT AND THE ENVIRONMENT © OECD 2010 89

4. INTERNATIONAL AIR TRANSPORT: THE IMPACT OF GLOBALISATION ON ACTIVITY LEVELS
entails greater factor mobility, with an increase in both temporary and permanent
migration. Over longer distances, international air transport is normally the cheapest
mode for this.
Domestic feeder services
International air transport enjoys significant economies of scale, scope and density.
The main international airports, and their associated long-haul carriers, benefit from
feeder services that take domestic traffic to and from more distant locations within a
country. Increasingly, major international airlines operate “dog-bone” networks (Figure 4.5)
with their trunk haul operations between international city hubs in countries A and Bsupplemented by local services at each main hub that the international carriers either
provide for themselves or (and mainly in the non-home country) by partners of various
kinds.14 Increases in international air transport inevitably have implications on the
demands for feeder air services as well as for the main international service. In some
countries, these feeder services may involve collecting and distributing passengers from
nearby countries as well as domestically.
Trade-generated domestic air services
Globalisation involves increased economic activity, and this in turn leads to the need
for more domestic transport as part of the enlarged value chain. In countries with a small
land mass, much of this additional transport is provided by surface modes that enjoy a
comparative advantage over shorter distances, although adverse terrain may give a
comparative advantage to air transport in some contexts. In larger countries, however,
personnel and freight movements where speed is important will require more air transport
as the globalisation process takes place. This is a purely domestic implication of increased
globalisation, and may be quite remote from the international air transport market.
Income-generated domestic air services
Globalisation leads to higher income and consumption in each country (see again
Figure 4.4), although the affluence is not spread evenly. Air transport facilitates some of this
consumption. Again, in larger countries, as incomes rise, people spend more on domestic
vacations and make more frequent visits to family and friends. Again, as with trade-generated
domestic air movement, this internal activity may be remote economically and institutionally
from international movements, but it is nevertheless a result of it.
Figure 4.5. “Dog-bone” international air transport network
BA
a
b
c
i
x
y
z
j
GLOBALISATION, TRANSPORT AND THE ENVIRONMENT © OECD 201090
4. INTERNATIONAL AIR TRANSPORT: THE IMPACT OF GLOBALISATION ON ACTIVITY LEVELS
From an analytical perspective, it is convenient to isolate these four distinct types of
air transport influenced by globalisation trends, but from an empirical basis, it is virtually
impossible to isolate their relative magnitudes from available data. There are two major
problems. First, the air transport sector provides network services, and any shock to one
link or node has implications throughout other parts of the network. This is not simply a
matter of additional demands on an international route affecting the domestic feeder
services of that airline, but rather it has ripple effects across the networks of all carriers in
the domestic market because aircraft carrying feed traffic also carry purely domestic
traffic. Thus, a change in international demand affects the basis of competition among all
domestic services. Disentangling these effects even for a marginal change in the
international market affecting one airline and one route is empirically impossible at
present, let along larger changes involving numerous international routes.
Second, there are the problems in defining the counterfactual. At the simplest
intellectual level there is the challenge of saying what would have happened if the new
trades with their associated demands on air transport had not arisen; in other words, if
past trends had continued or alternative background variables had changed. Technically
one could compare a simple extrapolation of the past with actual events. Predicting
economic growth is, however, a treacherous task. Where there have been partial attempts
to look at the wider implications of growth in international air traffic as the result of some
external change, the ripple effects through the network were frequently large. For example,
the Brattle Group (2002) study of the effects of relaxing entry to the North Atlantic air traffic
market suggested significant implications for demand on the internal European market,
and this did not allow for any trade- or income-induced effects.
Hub-and-spoke networks
Following the adoption of the Chicago Convention, there was (as illustrated above) no
market mechanism that led to economically efficient prices and frequencies. As a result,
costs were high and prices did not reflect supply and demand. Customer preferences,
frequencies and routes operated were a political issue rather than an outcome of market
forces. Already in 1960, The Economist wrote: “The basic trouble remains that the world has
too many airlines, most of them inefficient, undercapitalised and unprofitable.”
Also within the United States markets were closed. The Civil Aeronautics Authority,
later renamed as the Civil Aeronautics Board (CAB), determined routes and regulated fares
in the US to protect the carriers from “destructive” competition and protect consumers,
while allowing airlines to obtain a reasonable return on ticket sales. During the 1960s
and 1970s it became more and more clear that government regulations were too restrictive
for the airline industry. In 1978, the Airline Deregulation Act was passed. All restrictions on
domestic routes, fares and schedules were to be removed. Increased airline operating
efficiency and competition were expected to benefit both airlines and passengers.
Following this deregulation of the US aviation market, there was a large-scale entry of new
carriers, followed by the rapid departure of almost all of them. Immediately after the
deregulation, there were about 40 major carriers, while some 15 years later, there were 6 or 7.
It thus appears that competition did not increase following the deregulation, albeit fares
decreased in real terms since deregulation. The decline in fares from 1976 to 1985 represented
a savings of USD 11 billion to passengers in 1986 (Kahn, 1988). The disciplining effect of
competition was, however, geographically unevenly distributed. Airlines were free to operate
their most efficient networks, and most airlines decided to operate a hub-and-spoke network,
GLOBALISATION, TRANSPORT AND THE ENVIRONMENT © OECD 2010 91
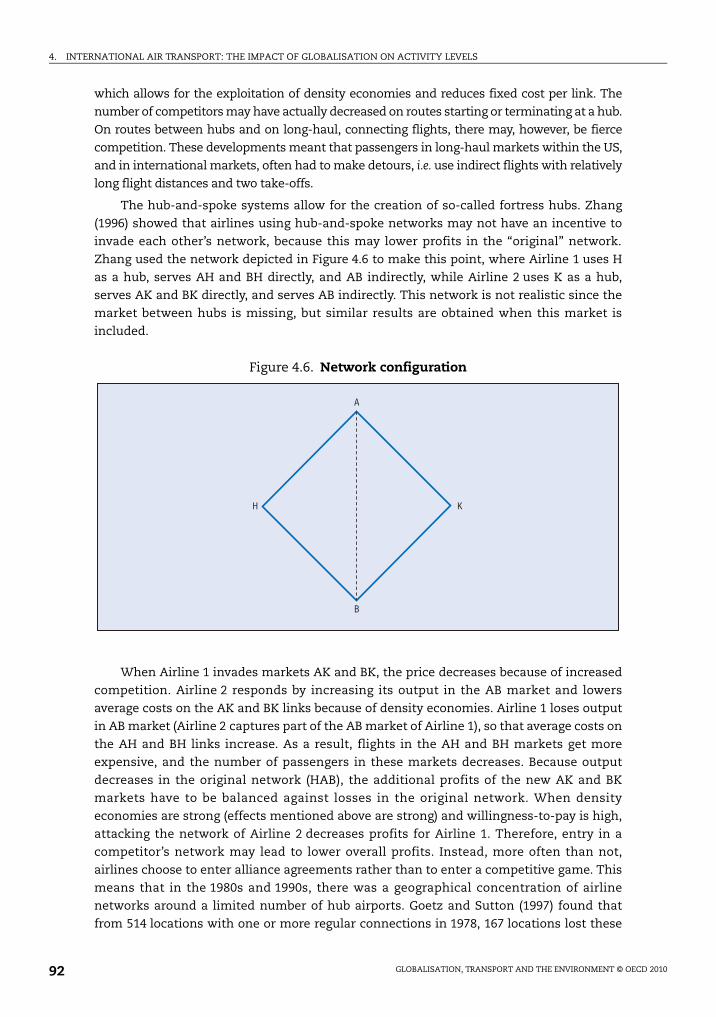
4. INTERNATIONAL AIR TRANSPORT: THE IMPACT OF GLOBALISATION ON ACTIVITY LEVELS
which allows for the exploitation of density economies and reduces fixed cost per link. The
number of competitors may have actually decreased on routes starting or terminating at a hub.
On routes between hubs and on long-haul, connecting flights, there may, however, be fierce
competition. These developments meant that passengers in long-haul markets within the US,
and in international markets, often had to make detours, i.e. use indirect flights with relatively
long flight distances and two take-offs.
The hub-and-spoke systems allow for the creation of so-called fortress hubs. Zhang
(1996) showed that airlines using hub-and-spoke networks may not have an incentive to
invade each other’s network, because this may lower profits in the “original” network.
Zhang used the network depicted in Figure 4.6 to make this point, where Airline 1 uses H
as a hub, serves AH and BH directly, and AB indirectly, while Airline 2 uses K as a hub,
serves AK and BK directly, and serves AB indirectly. This network is not realistic since the
market between hubs is missing, but similar results are obtained when this market is
included.
When Airline 1 invades markets AK and BK, the price decreases because of increased
competition. Airline 2 responds by increasing its output in the AB market and lowers
average costs on the AK and BK links because of density economies. Airline 1 loses output
in AB market (Airline 2 captures part of the AB market of Airline 1), so that average costs on
the AH and BH links increase. As a result, flights in the AH and BH markets get more
expensive, and the number of passengers in these markets decreases. Because output
decreases in the original network (HAB), the additional profits of the new AK and BK
markets have to be balanced against losses in the original network. When density
economies are strong (effects mentioned above are strong) and willingness-to-pay is high,
attacking the network of Airline 2 decreases profits for Airline 1. Therefore, entry in a
competitor’s network may lead to lower overall profits. Instead, more often than not,
airlines choose to enter alliance agreements rather than to enter a competitive game. This
means that in the 1980s and 1990s, there was a geographical concentration of airline
networks around a limited number of hub airports. Goetz and Sutton (1997) found that
from 514 locations with one or more regular connections in 1978, 167 locations lost these
Figure 4.6. Network configuration
A
B
KH
GLOBALISATION, TRANSPORT AND THE ENVIRONMENT © OECD 201092
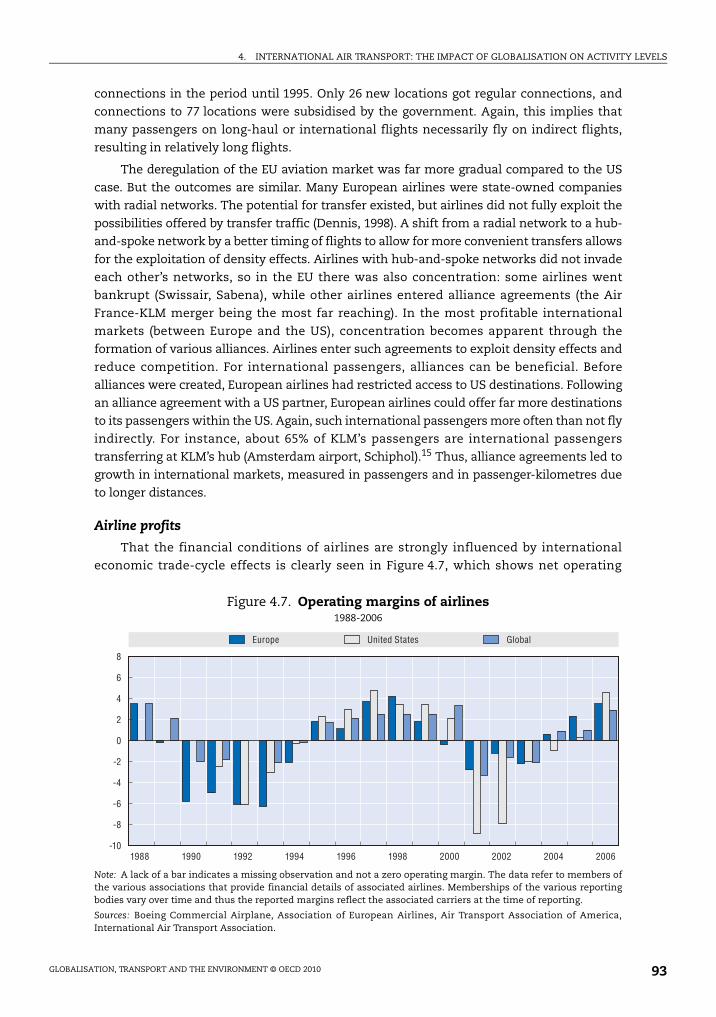
4. INTERNATIONAL AIR TRANSPORT: THE IMPACT OF GLOBALISATION ON ACTIVITY LEVELS
connections in the period until 1995. Only 26 new locations got regular connections, and
connections to 77 locations were subsidised by the government. Again, this implies that
many passengers on long-haul or international flights necessarily fly on indirect flights,
resulting in relatively long flights.
The deregulation of the EU aviation market was far more gradual compared to the US
case. But the outcomes are similar. Many European airlines were state-owned companies
with radial networks. The potential for transfer existed, but airlines did not fully exploit the
possibilities offered by transfer traffic (Dennis, 1998). A shift from a radial network to a hub-
and-spoke network by a better timing of flights to allow for more convenient transfers allows
for the exploitation of density effects. Airlines with hub-and-spoke networks did not invade
each other’s networks, so in the EU there was also concentration: some airlines went
bankrupt (Swissair, Sabena), while other airlines entered alliance agreements (the Air
France-KLM merger being the most far reaching). In the most profitable international
markets (between Europe and the US), concentration becomes apparent through the
formation of various alliances. Airlines enter such agreements to exploit density effects and
reduce competition. For international passengers, alliances can be beneficial. Before
alliances were created, European airlines had restricted access to US destinations. Following
an alliance agreement with a US partner, European airlines could offer far more destinations
to its passengers within the US. Again, such international passengers more often than not fly
indirectly. For instance, about 65% of KLM’s passengers are international passengers
transferring at KLM’s hub (Amsterdam airport, Schiphol).15 Thus, alliance agreements led to
growth in international markets, measured in passengers and in passenger-kilometres due
to longer distances.
Airline profits
That the financial conditions of airlines are strongly influenced by international
economic trade-cycle effects is clearly seen in Figure 4.7, which shows net operating
Figure 4.7. Operating margins of airlines1988-2006
Note: A lack of a bar indicates a missing observation and not a zero operating margin. The data refer to members ofthe various associations that provide financial details of associated airlines. Memberships of the various reportingbodies vary over time and thus the reported margins reflect the associated carriers at the time of reporting.
Sources: Boeing Commercial Airplane, Association of European Airlines, Air Transport Association of America,International Air Transport Association.
1988 1990 1992 1994 1996 1998 2000 2002 2004 2006
8
6
4
2
0
-2
-4
-6
-8
-10
Europe United States Global
GLOBALISATION, TRANSPORT AND THE ENVIRONMENT © OECD 2010 93
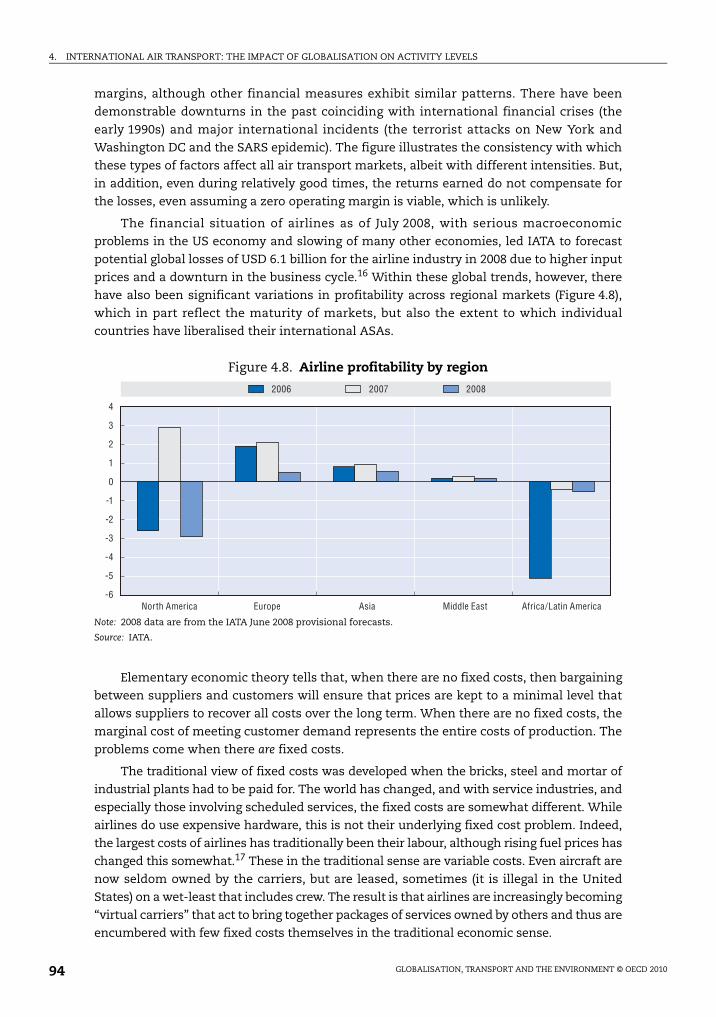
4. INTERNATIONAL AIR TRANSPORT: THE IMPACT OF GLOBALISATION ON ACTIVITY LEVELS
margins, although other financial measures exhibit similar patterns. There have been
demonstrable downturns in the past coinciding with international financial crises (the
early 1990s) and major international incidents (the terrorist attacks on New York and
Washington DC and the SARS epidemic). The figure illustrates the consistency with which
these types of factors affect all air transport markets, albeit with different intensities. But,
in addition, even during relatively good times, the returns earned do not compensate for
the losses, even assuming a zero operating margin is viable, which is unlikely.
The financial situation of airlines as of July 2008, with serious macroeconomic
problems in the US economy and slowing of many other economies, led IATA to forecast
potential global losses of USD 6.1 billion for the airline industry in 2008 due to higher input
prices and a downturn in the business cycle.16 Within these global trends, however, there
have also been significant variations in profitability across regional markets (Figure 4.8),
which in part reflect the maturity of markets, but also the extent to which individual
countries have liberalised their international ASAs.
Elementary economic theory tells that, when there are no fixed costs, then bargaining
between suppliers and customers will ensure that prices are kept to a minimal level that
allows suppliers to recover all costs over the long term. When there are no fixed costs, the
marginal cost of meeting customer demand represents the entire costs of production. The
problems come when there are fixed costs.
The traditional view of fixed costs was developed when the bricks, steel and mortar of
industrial plants had to be paid for. The world has changed, and with service industries, and
especially those involving scheduled services, the fixed costs are somewhat different. While
airlines do use expensive hardware, this is not their underlying fixed cost problem. Indeed,
the largest costs of airlines has traditionally been their labour, although rising fuel prices has
changed this somewhat.17 These in the traditional sense are variable costs. Even aircraft are
now seldom owned by the carriers, but are leased, sometimes (it is illegal in the United
States) on a wet-least that includes crew. The result is that airlines are increasingly becoming
“virtual carriers” that act to bring together packages of services owned by others and thus are
encumbered with few fixed costs themselves in the traditional economic sense.
Figure 4.8. Airline profitability by region
Note: 2008 data are from the IATA June 2008 provisional forecasts.
Source: IATA.
4
3
2
1
-3
-4
-5
0
-1
-2
-6
2006 2007 2008
North America Europe Asia Middle East Africa/Latin America
GLOBALISATION, TRANSPORT AND THE ENVIRONMENT © OECD 201094
4. INTERNATIONAL AIR TRANSPORT: THE IMPACT OF GLOBALISATION ON ACTIVITY LEVELS
Fixed costs in a modern service industry, therefore, can take an entirely form. An airline
is committed to a scheduled service some six months or so before the flight: it is committed
to have a plane, crew, fuel, gates, landing and take-off slots, etc., available at a scheduled
time and designated place. This does have the advantage that fares are often collected before
the airlines has to provide the service, but in a highly competitive market, this is generally
more than offset by the limited amount of revenue that is ultimately collected.
Airlines in deregulated markets engage in price discrimination and charge passengers
different fares to try to extract as much revenue as possible. In generally, this means that
lower fares are offered initially when a flight is some way off, because leisure travellers are
willing to pay less for a seat and are more flexible in their scheduling and will seek lower
fares if available. They are caught early by the airline. Towards the time of take-off, fares rise
as last-minute travellers, often business travellers, seek seats. These people are less sensitive
to fares, meeting a last-minute business deadline can make or break a deal, and tax
deductions are normally allowed for the offsetting of higher fares. The problem is that with
a fixed schedule in a competitive market, the various airlines set take-off times for each
destination at about the same time. These leads to intense competition to fill seats and
forces fares down to levels that do not allow all the costs of service to be met.18 It is worth
filling a seat once it is there with anyone willing to pay for the additional costs of handling.
The problem is exacerbated when taken over a business cycle, and when there is new
entry to markets. In the longer term, it leads to instability in the market as airlines enter
and leave. It also leads to sub-optimal levels of investment, despite excess capacity during
peaks in the cycle. When full costs are not recovered, and an airline ultimately withdraws
a service or goes out of business, is known as the “empty core problem” in economic
analysis. It is neither a new concept (developed in the 1880s by a largely forgotten Oxford
economist, Francis Edgeworth), nor is it one that has limited application. In the long term,
as potential investors become aware of this problem, they will reduce or cease to put new
capital into the industry. However, the complexity of the underlying economic model has
hindered the communication of the issue to decision makers.19 This situation also runs
counter to some traditional views of competition policy that hold that there can “never be
too much competition”.
The current situation, with large parts of the airline industry haemorrhaging cash,
while widespread, has impacted individual markets differently. The domestic US market,
which is possibly the most competitive in the world, has been the hardest hit, and although
low-cost domestic carriers, such as Southwest, has been adding some routes, the vast
majority of airlines have been retracting, pulling services and some (such as ATA Airlines,
Skybus, and the legacy airline, Aloha) have simply vanished from the market. European
airlines (although some like Ryanair, British Airways and Air France have been recording
profits) are also being badly hit financially by a rise in fuel cost, as are carriers elsewhere.
The airlines have historically reacted to the situation in a number of ways, essentially
trying to glean a degree of short-term monopoly power wherever and whenever the
opportunity has arisen. Many of the initiatives have been extensions or modifications to
existing strategies that have been used in previous market downturns, but which, as has
been seen, have not prevented long-term financial problems for the airlines. The measures
that have been taken, and in turn influenced the international air transport market include:
GLOBALISATION, TRANSPORT AND THE ENVIRONMENT © OECD 2010 95
4. INTERNATIONAL AIR TRANSPORT: THE IMPACT OF GLOBALISATION ON ACTIVITY LEVELS
Loyalty payments
Major international partners operate frequent-flier programmes that reward regular
customers with free flights and bonuses, such as upgrades to higher classes of service and
access to airport lounges. The “miles” earned on carriers within airline alliances are
normally interchangeable, albeit not perfectly, providing passengers with an extensive
range of services for redemption. More recently, it has been possible in many programmes
to obtain miles with non-airline purchases such as credit card use, car rentals and dining.
The airlines effectively sell their miles to other industries that then give them as rewards
to their own customers – the value of this business to the airlines was about USD 3 billion
in 2005. The long-term problem is that there is an inherent tendency for the “currency” to
be debased, with ever-increasing numbers of miles being required to buy flights and the
number of flights for sale shrinking. The impact has been that loyalty incentives have been
weakened, reducing the incentive to make multiple trips by one carrier.
Cost cutting
To gain an advantage over competitors, many airlines have sought to reduce costs. If
other carriers cannot match the lower costs, then either fares remain at the competitive
level of the higher-cost airlines, allowing the low-cost carrier to earn a margin towards
fixed costs, or the higher-cost airlines leave the market. This has been the strategy of low-
cost international airlines like Ryanair in Europe. The low-cost carrier business model,
with numerous variants, centres on the ability of an airline to undercut its rivals, and thus
obtain market power. This generally entails standardisation in its operations (the use of a
common family of aircraft and a homogeneous network of services), maximising the use of
its labour force, serving less congested airports, providing a “no-frills” service on the plane
and at the airport, limiting methods of booking to the web, charging for non-core services
(such as refreshments) and offering only one class of service. Such measures can reduce
costs by 30% or so compared to those of traditional airlines. Low-cost carriers have thus
trimmed their costs considerably and the traditional carriers have been forced to follow
(Morrison, 2001), often going through bankruptcy, by re-negotiating labour contracts,
replacing older aircraft with fuel-efficient planes, increasing automation and unbundling
some services. There are technical limits, however, to which viable and safe services can be
offered and, in many cases, airlines may well be approaching these.
There are also more fundamental issues. The successful low-cost carriers have tended
to be the first in the market and to enjoy a “first mover advantage”. The list of failed
low-cost airlines in Europe (Table 4.3) and elsewhere, however, is long. One problem is that
as low-cost carriers have expanded, they have moved into increasingly thin and less
suitable markets for their style of operations. Additionally, as more carriers have emerged,
so competition between low-cost airlines has grown, hitting their bottom lines (Button and
Vega, 2007). The traditional airlines have also become leaner and more skilled at resisting
the challenges associated with low-cost carriers trying to enter their routes. While the
low-cost model may continue to produce winners, it does not solve the problem of market
stability. Even if all airlines were low-cost, competition among them would erode their
revenue streams.
Subsidies
Subsidies have long been used to recover capital costs. One argument is that once an
investment has been made, it becomes economically efficient to maximise its use subject to
GLOBALISATION, TRANSPORT AND THE ENVIRONMENT © OECD 201096
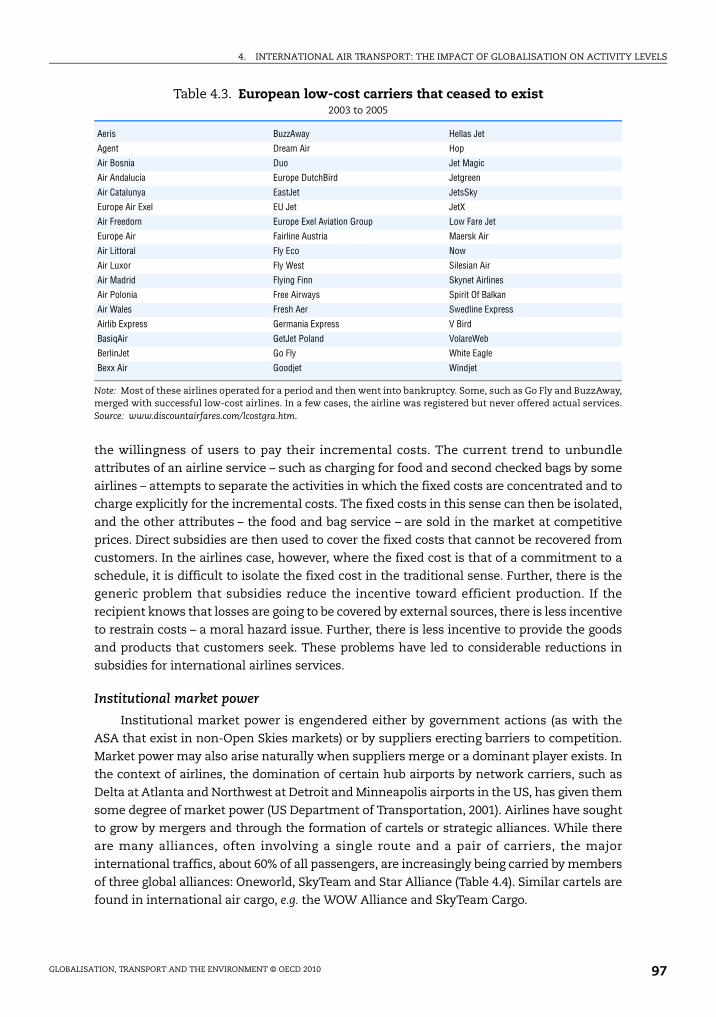
4. INTERNATIONAL AIR TRANSPORT: THE IMPACT OF GLOBALISATION ON ACTIVITY LEVELS
the willingness of users to pay their incremental costs. The current trend to unbundle
attributes of an airline service – such as charging for food and second checked bags by some
airlines – attempts to separate the activities in which the fixed costs are concentrated and to
charge explicitly for the incremental costs. The fixed costs in this sense can then be isolated,
and the other attributes – the food and bag service – are sold in the market at competitive
prices. Direct subsidies are then used to cover the fixed costs that cannot be recovered from
customers. In the airlines case, however, where the fixed cost is that of a commitment to a
schedule, it is difficult to isolate the fixed cost in the traditional sense. Further, there is the
generic problem that subsidies reduce the incentive toward efficient production. If the
recipient knows that losses are going to be covered by external sources, there is less incentive
to restrain costs – a moral hazard issue. Further, there is less incentive to provide the goods
and products that customers seek. These problems have led to considerable reductions in
subsidies for international airlines services.
Institutional market power
Institutional market power is engendered either by government actions (as with the
ASA that exist in non-Open Skies markets) or by suppliers erecting barriers to competition.
Market power may also arise naturally when suppliers merge or a dominant player exists. In
the context of airlines, the domination of certain hub airports by network carriers, such as
Delta at Atlanta and Northwest at Detroit and Minneapolis airports in the US, has given them
some degree of market power (US Department of Transportation, 2001). Airlines have sought
to grow by mergers and through the formation of cartels or strategic alliances. While there
are many alliances, often involving a single route and a pair of carriers, the major
international traffics, about 60% of all passengers, are increasingly being carried by members
of three global alliances: Oneworld, SkyTeam and Star Alliance (Table 4.4). Similar cartels are
found in international air cargo, e.g. the WOW Alliance and SkyTeam Cargo.
Table 4.3. European low-cost carriers that ceased to exist2003 to 2005
Aeris BuzzAway Hellas Jet
Agent Dream Air Hop
Air Bosnia Duo Jet Magic
Air Andalucia Europe DutchBird Jetgreen
Air Catalunya EastJet JetsSky
Europe Air Exel EU Jet JetX
Air Freedom Europe Exel Aviation Group Low Fare Jet
Europe Air Fairline Austria Maersk Air
Air Littoral Fly Eco Now
Air Luxor Fly West Silesian Air
Air Madrid Flying Finn Skynet Airlines
Air Polonia Free Airways Spirit Of Balkan
Air Wales Fresh Aer Swedline Express
Airlib Express Germania Express V Bird
BasiqAir GetJet Poland VolareWeb
BerlinJet Go Fly White Eagle
Bexx Air Goodjet Windjet
Note: Most of these airlines operated for a period and then went into bankruptcy. Some, such as Go Fly and BuzzAway,merged with successful low-cost airlines. In a few cases, the airline was registered but never offered actual services.Source: www.discountairfares.com/lcostgra.htm.
GLOBALISATION, TRANSPORT AND THE ENVIRONMENT © OECD 2010 97
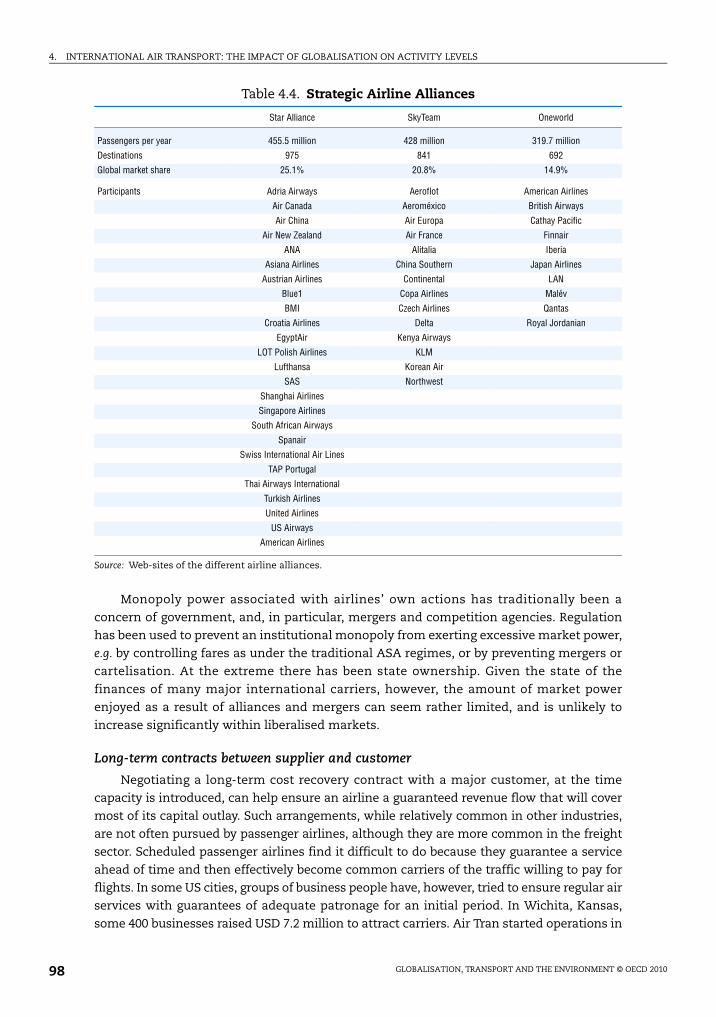
4. INTERNATIONAL AIR TRANSPORT: THE IMPACT OF GLOBALISATION ON ACTIVITY LEVELS
Monopoly power associated with airlines’ own actions has traditionally been a
concern of government, and, in particular, mergers and competition agencies. Regulation
has been used to prevent an institutional monopoly from exerting excessive market power,
e.g. by controlling fares as under the traditional ASA regimes, or by preventing mergers or
cartelisation. At the extreme there has been state ownership. Given the state of the
finances of many major international carriers, however, the amount of market power
enjoyed as a result of alliances and mergers can seem rather limited, and is unlikely to
increase significantly within liberalised markets.
Long-term contracts between supplier and customer
Negotiating a long-term cost recovery contract with a major customer, at the time
capacity is introduced, can help ensure an airline a guaranteed revenue flow that will cover
most of its capital outlay. Such arrangements, while relatively common in other industries,
are not often pursued by passenger airlines, although they are more common in the freight
sector. Scheduled passenger airlines find it difficult to do because they guarantee a service
ahead of time and then effectively become common carriers of the traffic willing to pay for
flights. In some US cities, groups of business people have, however, tried to ensure regular air
services with guarantees of adequate patronage for an initial period. In Wichita, Kansas,
some 400 businesses raised USD 7.2 million to attract carriers. Air Tran started operations in
Table 4.4. Strategic Airline Alliances
Star Alliance SkyTeam Oneworld
Passengers per year 455.5 million 428 million 319.7 million
Destinations 975 841 692
Global market share 25.1% 20.8% 14.9%
Participants Adria Airways Aeroflot American Airlines
Air Canada Aeroméxico British Airways
Air China Air Europa Cathay Pacific
Air New Zealand Air France Finnair
ANA Alitalia Iberia
Asiana Airlines China Southern Japan Airlines
Austrian Airlines Continental LAN
Blue1 Copa Airlines Malév
BMI Czech Airlines Qantas
Croatia Airlines Delta Royal Jordanian
EgyptAir Kenya Airways
LOT Polish Airlines KLM
Lufthansa Korean Air
SAS Northwest
Shanghai Airlines
Singapore Airlines
South African Airways
Spanair
Swiss International Air Lines
TAP Portugal
Thai Airways International
Turkish Airlines
United Airlines
US Airways
American Airlines
Source: Web-sites of the different airline alliances.
GLOBALISATION, TRANSPORT AND THE ENVIRONMENT © OECD 201098
4. INTERNATIONAL AIR TRANSPORT: THE IMPACT OF GLOBALISATION ON ACTIVITY LEVELS
May 2002 with services to Atlanta and Chicago’s Midway airport. The agreement included up
to USD 3 million to cover losses in its first year and USD 1.5 million in the second. Similarly,
Pensacola, Florida, raised USD 2.1 million from 319 businesses to attract Air Tran while
companies and individuals in Stockton, California, bought USD 800 000 of prepaid tickets to
attract American West (Nolan et al., 2005).20 In a different context, the US’s Civil Reserve Air
Fleet programme may be seen as a long-term contract to buy military support from
commercial airlines.
Vertical integration
If one link in the overall air transport value chain fails to recover its full long-run costs,
but the chain in its entirety is viable, then one option is for the loss-making element to
vertically integrate with profitable links, or to in some way be subsidised by them.
Historically, airlines such as American initiated the computer reservation system (CRS),
Sabre, that was subsequently separated but provided a revenue flow to the airline. There
were historically strong ties between Boeing and Pan American, and between Lockheed
and TWA in terms of aircraft development and use. Outside the US, airlines have a major
stake in the UK’s public-private air traffic control system – NATS – and airlines like
Lufthansa have invested in catering and in railway services. While in some cases these
activities produce direct revenue flows – American Airlines enjoyed considerable incomes
when it owned a CRS system – such involvements up and down the chain offered an
assurance of stable cost and other controls over inputs that potentially give a carrier a cost
advantage over competitors. The problem is that airline management is often not adept at
managing non-airline activities. United Airline’s ownership of Hertz rental cars in
the 1980s is a classic case of the problems encountered. This inevitably limits the extent to
which airlines should become integrated with other elements in the supply chain.
Discriminate pricing
The US domestic air transport market developed and refined price discrimination(the charging of customers different fares according to their willingness to pay) that hasnow become almost universal. There are several forms of price discrimination deployedby airlines, but yield management – essentially dynamic temporal pricing – is the mostpotent (Dana, 1998). An airline revises the fare charged as seats are filled. The advent ofsophisticated information systems allows an airline to offer seats at various prices, andto continue to vary these offers, as seats are purchased. Generally, leisure travellers arerelatively sensitive to fares, but know in advance when they wish to travel and thus lowerfares are offered well before a particular flight. As the departure date is approached,fewer cheap seats become available, as the focus is on attracting less price-sensitivebusiness traffic that requires flexibility in its travel planning. The conditions pertainingto a seat can also differ; for example, the ticket may be refundable, it may be upgradeable,or it may be at a particular location on a plane (e.g. a seat at an emergency exit row) andprices are adjusted according to these quality factors.
Yield management is designed to extract as much revenue from customers as possibleby levying prices that reflect the willingness of customers to pay. Consequently, customerswho are less sensitive to price pay more, and contribute to the capital cost of the service,while those who are less willing to pay are charged lower prices that at least cover theirmarginal costs. While it can be used to generate large profits, and this has been done inmany industries, its main purpose in air transport is to generate sufficient revenue to earnan acceptable return after all costs (including those of capital) have been covered.
GLOBALISATION, TRANSPORT AND THE ENVIRONMENT © OECD 2010 99
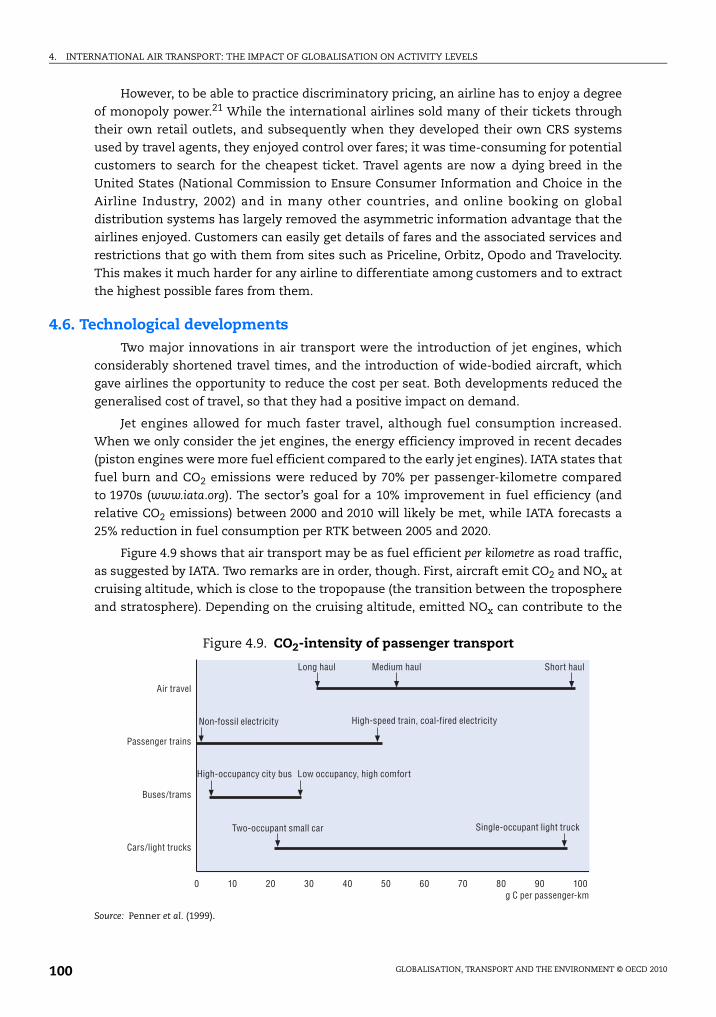
4. INTERNATIONAL AIR TRANSPORT: THE IMPACT OF GLOBALISATION ON ACTIVITY LEVELS
However, to be able to practice discriminatory pricing, an airline has to enjoy a degree
of monopoly power.21 While the international airlines sold many of their tickets through
their own retail outlets, and subsequently when they developed their own CRS systems
used by travel agents, they enjoyed control over fares; it was time-consuming for potential
customers to search for the cheapest ticket. Travel agents are now a dying breed in the
United States (National Commission to Ensure Consumer Information and Choice in the
Airline Industry, 2002) and in many other countries, and online booking on global
distribution systems has largely removed the asymmetric information advantage that the
airlines enjoyed. Customers can easily get details of fares and the associated services and
restrictions that go with them from sites such as Priceline, Orbitz, Opodo and Travelocity.
This makes it much harder for any airline to differentiate among customers and to extract
the highest possible fares from them.
4.6. Technological developmentsTwo major innovations in air transport were the introduction of jet engines, which
considerably shortened travel times, and the introduction of wide-bodied aircraft, which
gave airlines the opportunity to reduce the cost per seat. Both developments reduced the
generalised cost of travel, so that they had a positive impact on demand.
Jet engines allowed for much faster travel, although fuel consumption increased.
When we only consider the jet engines, the energy efficiency improved in recent decades
(piston engines were more fuel efficient compared to the early jet engines). IATA states that
fuel burn and CO2 emissions were reduced by 70% per passenger-kilometre compared
to 1970s (www.iata.org). The sector’s goal for a 10% improvement in fuel efficiency (and
relative CO2 emissions) between 2000 and 2010 will likely be met, while IATA forecasts a
25% reduction in fuel consumption per RTK between 2005 and 2020.
Figure 4.9 shows that air transport may be as fuel efficient per kilometre as road traffic,
as suggested by IATA. Two remarks are in order, though. First, aircraft emit CO2 and NOx at
cruising altitude, which is close to the tropopause (the transition between the troposphere
and stratosphere). Depending on the cruising altitude, emitted NOx can contribute to the
Figure 4.9. CO2-intensity of passenger transport
Source: Penner et al. (1999).
0 10 20 30 40 50 60 70 80 90 100
Air travel
Medium haulLong haul
Non-fossil electricity High-speed train, coal-fired electricity
High-occupancy city bus
Two-occupant small car Single-occupant light truck
Low occupancy, high comfort
Short haul
Passenger trains
Buses/trams
Cars/light trucks
g C per passenger-km
GLOBALISATION, TRANSPORT AND THE ENVIRONMENT © OECD 2010100
4. INTERNATIONAL AIR TRANSPORT: THE IMPACT OF GLOBALISATION ON ACTIVITY LEVELS
production of the greenhouse gas ozone (troposphere) or the destruction of ozone levels,
which leads to increased UV radiation exposure (stratosphere) (Royal Commission on
Environmental Pollution, 2007). IPCC reported that ozone increased at cruising altitudes for
sub-sonic aircraft, while predicted changes in UV-radiation are minimal (Royal
Commission on Environmental Pollution, 2007).
Second, air travel in most cases covers far longer distances than road travel. Although
one can argue that because of these longer distances, the environmental impact of aviation
is bigger, one needs to look at total passenger-kilometres. According to IATA, all modes of
transport together account for 23% of global CO2 emissions (www.iata.org). Road traffic
accounts for the vast majority, 74%, of the transport sector’s CO2 emissions because of the
sheer magnitude of road use worldwide. Air transport accounts for 12% of the transport
sector’s CO2 emissions, or about 3% to 4% of global carbon emissions (Penner et al., 1999).
Even though the availability of international air travel at low prices (i.e. low-cost travel and
indirect flights) can cause an increase in CO2 emissions, the increasing demand for
short-haul car trips (e.g. for commuting) could cause an even higher increase in CO2
emissions. Finally, as mentioned above, the concentration in the aviation markets caused an
increase in flight distance and the need for two landing and take-off cycles for many
passengers, which have different fuel burn rates (Pejovic et al., 2008). Fuel burn during the
take-off and landing cycle is much higher than during the climb, cruise and descent cycle, so
that network configurations with indirect travel have relatively large environmental impacts.
The environmental effects of the growth in aviation may be mitigated by technological
developments, such as more efficient engines. In the literature, an increase in fuel
efficiency of 70% between 1960 and 2000 is often mentioned. Peeters et al. (2005) argued
that the often-cited 70% improvement in fuel efficiency as reported by the IPCC (Penner
et al., 1999) is somewhat optimistic because it uses a De Havilland Comet 4 as the reference
aircraft, while this aircraft was only used for a brief period and gained little market share.
If, instead, the successful Boeing 707 is used as the reference, fuel efficiency improved by
55% rather than 70% over the same period. Although the analysis of Peeters et al. (2005)
confirms that jet aircraft fuel efficiency increased over time, the authors also conclude that
the target for 2020 as mentioned by ATAG (2005), and based on an annual reduction of fuel
consumption per ASK of 3%, is probably too optimistic. Peeters et al. (2001) pointed out that
technological developments in the last decades were mostly made for small and medium-
sized aircraft. Under the simple assumption that these aircraft are used in short to
medium-haul markets, it appears that in long-haul (international) markets, there were
relatively few gains. But newer aircraft (the latest B777 and A380) now allow for gains to be
made in international markets.
If considering the fuel burn per available tonne-kilometre of a number of popular
aircraft (Figure 4.10), it appears that smaller aircraft (in terms of passengers carried) have
higher energy use, although the number of observations is too small to find a reliable
statistical relation.
The adoption of hub-and-spoke networks meant that an increasing number of
passengers are concentrated on a relatively small number of links. Because larger aircraft are
cheaper to operate per seat (see Figure 4.11), airlines could reduce their cost. Moreover, if
there are economies of scale in environmental terms (see e.g. Schipper, 2004), meaning that
an aircraft with 300 seats emits less noise or CO2 per seat than two aircraft with 150 seats,
larger aircraft also provide environmental benefits.
GLOBALISATION, TRANSPORT AND THE ENVIRONMENT © OECD 2010 101

4. INTERNATIONAL AIR TRANSPORT: THE IMPACT OF GLOBALISATION ON ACTIVITY LEVELS
Interestingly, the average plane size in the transatlantic markets peaked at about
320 seats in 1985, after which it rapidly decreased to about 260 seats in 1995. After 1995,
there was a steady increase, with an expected size of about 300 in 2010 (Penner et al., 1999).
Brueckner and Zhang (1999) indicated that the frequency of service in hub-and-spoke
networks may be increased to attract additional traffic in the face of competition. When a
number of competitors offer a high frequency, this may create over-capacity in the market.
Airlines can counter this by using smaller aircraft.
To summarise, the introduction of jet engines meant faster travel, but also a decrease in
fuel efficiency. The fuel efficiency of jet aircraft increased over the last decades, although one
can wonder whether the 70% estimate improvement compared to the De Havilland Comet 4
provides useful information. If more successful early jet aircraft are used as the base for the
comparison, the efficiency improvement is less. The introduction of wide-bodied aircraft
meant that the cost per seat decreased due to density economies, and that the
environmental cost per seat could be reduced due to economies of scale in environmental
Figure 4.10. Fuel use per available tonne-kilometre
Source: Adapted from Peeters et al. (2005).
Figure 4.11. Operating cost per seat
Source: Adapted from Connekt (2001).
1993 1994 1995 1996 1997 1998 1999 2000 2001 2002 2003
20
18
16
14
12
2
10
8
6
4
0
Year of introduction
Energy per ATK (MJ/tkm)
A340-300 (298 seats)
B777-200 (316 seats)
A330-300 (298 seats)
B777-200-IGW
B737-800 (158 seats)
0 100 200 300 400 500 600 700
18
16
14
12
2
10
8
6
4
0
Do 328
Do 428F50
Do728
F100
A320-200B737-800
A321-200B757-300
B767-ERA330-200
A340-300
A330-300
B777-200 A340-600
B777-300ERX
B747-400 A380
F70
Number of seats
Operating cost per seatkilometre (€-cent)
GLOBALISATION, TRANSPORT AND THE ENVIRONMENT © OECD 2010102
4. INTERNATIONAL AIR TRANSPORT: THE IMPACT OF GLOBALISATION ON ACTIVITY LEVELS
terms. The formation of hub-and-spoke networks concentrates large passenger flows on a
limited number of links, allowing the use of relatively large aircraft. Hub-and-spoke
networks thus offer potential reductions in environmental damage per seat because of the
possibility to use larger aircraft. On the other hand, hub-and-spoke networks are centred on
large airports, which are often congested, while passengers travelling indirectly cause a
relatively large amount of pollution because of the detour, and more importantly, the double
take-off and landing.
4.7. The shifting situationThe difficulty with trying to look into the future of international air transport is that it
is going to be influenced not only by ongoing trends, but also by trend breaks and new
trends. While current trends can be generally extrapolated, economists and others sink
when it comes to projecting trend breaks or the implications of new trends. Thus, here the
focus is mainly on emerging trends and the way they are shaping the international air
transport as globalisation takes place, and is assumed to continue. Initially, some forecasts
in the public arena are reproduced. In doing so, one very important factor is emitted: the
role of public policy, and in particular that which relates to environment policy. This is
emerging as a key area of global concern, particularly with regard to global warming gases.
Related to these environmental concerns, albeit at a local level, is the provision of
infrastructure, and particularly airports. Additional capacity will be needed to cope with
growing demands for international air transport services, but providing this generally
meets with considerable local opposition. The discussion of environmental topics is left to
Chapter 7.
Traffic forecasts
Air transport requires forecast: airlines have to plan their commercial strategies;
suppliers of hardware, such as airframe and aero engine manufacturers, need to plan
investment and production schedules; those responsible for stationary hardware such as
airports and air traffic control need to develop their capacity; and surface land-use/
transport planners need to construct roads and railroads to service airports. Government
policy makers need forecasts to allow for the development of overall institutional and
regulatory structures. International forecasts are largely based on trends in economic
drivers, most notably growth in world GDP and emerging patterns of trade and tourism.
Their accuracy in the short term, because of unexpected shocks to the aviation market, is
not high, but the main concern of many of the users of forecasts is the longer-term
magnitudes and patterns of air travel. Like much transport forecasting, there is often little
attempt to embrace feedback effects, such as capacity constraints or changing input prices,
making them de facto extrapolations of experiences.22
What the current forecasts, which normally have a 20-year time horizon, suggest is
that air travel will continue to grow, albeit at different rates in different geographical
markets, and for different types of service (e.g. for passengers and cargo). Below are some
examples of recent forecasts.
Boeing updates its forecasts annually. The 2007 predictions from Boeing were that
passenger traffic (RPK) will grow over the next 20 years at 5% and cargo at 6.1% per year
(Boeing Commercial Airplane, 2007). (This contrasts, for example, with the 4.8% average
annual passenger traffic growth of the previous two decades, although the prediction for
cargo broadly follows the historic pattern.) Since it was forecast by Boeing that passenger
GLOBALISATION, TRANSPORT AND THE ENVIRONMENT © OECD 2010 103

4. INTERNATIONAL AIR TRANSPORT: THE IMPACT OF GLOBALISATION ON ACTIVITY LEVELS
numbers would increase by 4% per annum, this implies a larger increase in longer-distance
traffic. In terms of the global commercial aircraft fleet, Boeing predicted an increase from
18 230 in 2007 to 36 420 airplanes in 2026. In terms of geographic markets, Boeing
predicted Europe’s passenger demand will grow at 4.2% per year, North America at 4% and
Asia-Pacific at 6.7% a year (including China at 8%).
The aggregate Airbus (2007) forecasts were similar. World passenger traffic was
expected to grow at 4.9% per annum for the period 2007 to 2026 with service frequencies
doubling. This would imply the world’s commercial aircraft fleet, including passenger
(from 100 seats to very large aircraft) and freighter aircraft, will grow from 14 980 at the end
of 2006 to nearly 33 000 by 2026.23 While passenger traffic demand will nearly triple,
airlines will more than double their fleets of passenger aircraft (with more than 100 seats)
from 13 284 in 2006 to 28 534 in 2026. In terms of geographic markets, Airbus predicted
Europe will receive 24% of new aircraft, with North America and Asia-Pacific taking 27%
and 31% respectively.
Regarding infrastructure, Airbus estimated 93 major airports around the world are
stretched to capacity, representing 63% of passenger traffic. A key airport on the list is
London’s Heathrow Airport, which is operating at about 99% of its permitted runway
capacity. Its forecasts implicitly assume capacity expansion, either through physical
construction or making better use of what is already available.
IATA’s short-term forecasts made in 2007, based upon a survey of the airline industry,
suggested that passenger and freight demand growth would continue to provide a positive
boost to airline revenues over the five years to 2011, although the profile of growth would
differ. Compared to 2006, international passenger growth was expected to slow slightly,
domestic passenger growth to improve slightly and international freight growth to remain
at a similar level. International passenger volume growth was expected to remain strong
and passenger numbers were expected to grow at 5.1% annually between 2007 and 2011,
lower than the average rate of 7.4% seen between 2002 and 2006. Demand was expected to
be weakened by slightly slower global economic growth, but also to be boosted by the
liberalisation of markets and the emergence of new routes and services. Domestic
passenger growth was expected to pick up slightly, growing at an annual rate of 5.3%
between 2007 and 2011, led by strong growth in the Chinese and Indian domestic markets.
International air freight traffic was forecast to increase at 4.8% a year, lower than that seen
between 2002 and 2006, but similar to its 2006 growth level of 5.0%.
Globalised labour markets, migration and international air transport
The role of international air transport has continually been changing since the early
days when it was seen as a sort of “Pony Express of the skies”, carrying express mail. It then
became a mode for the wealthy and for governments to reach the extremes of their spheres
of influence. It subsequently became the mode of choice for long-distance business travel
as trade expanded after World War II, and then as a mass mode for leisure and personal
travel, as technology advances and regulatory reform reduced its costs and increased
leisure time, while higher disposable income stimulated tourism. While all these demands
for international air services remain, there has been an added one that may be important
in the future, namely the demand for air transport to facilitate labour migration (Button
and Vega, 2008).
GLOBALISATION, TRANSPORT AND THE ENVIRONMENT © OECD 2010104

4. INTERNATIONAL AIR TRANSPORT: THE IMPACT OF GLOBALISATION ON ACTIVITY LEVELS
Labour migration is growing, and about 3% of the world’s population lives outside their
country of birth for one year or more. The role of transport in carrying these migrants
depends on a variety of factors, but distance and the income of the migrants are critical
factors. Much of the migration today involves developing countries: the World Bank
estimated that in 2005, two in every five migrants reside in a developing country, and most
have come from developing countries.24 Most of this is relatively short distance and
between countries with contiguous borders. It, therefore, seems that air transport plays an
insignificant role for this large group. In cases of movement between developing and
higher-income countries, there may be more scope for migration by air. While the two
largest single corridors for migration – Mexico to the United States and Bangladesh to India
– are mainly served by surface modes, geography means that the next three largest
corridors – Turkey to Germany, India to the United Arab Emirates, and the Philippines to
the United States – have significant flows by airlines.
The pattern of labour migration has also varied over time and can differ among
corridors. Migration of workers from Asian countries, for example, shifted from a
predominantly Middle East bound flow to an intra-Asian flow in the 1990s. Labour
migration in Asia is mostly on fixed-term contracts representing temporary migration,
although permanent or settled migration still takes place on a limited scale to Australia
and New Zealand. Most Asian migrant workers are unskilled or semi-skilled, such as
construction workers and female domestic workers.
There are two broad theories of migration illustrated in Figure 4.12 (Hart, 1975a; b).25
We assume two regions, A and B. A has high income (Y+) and low unemployment (U–)
whilst B is the mirror image of this. The classical model assumes that with zero costs of
migration, labour will move from B to A seeking work and higher pay, and that capital will
move from A to B, where it can be combined with abundant, cheap labour to maximise
returns. The process continues until labour costs and employment levels are equalised.26
Figure 4.12. Alternative views of the implications of migration
Region A
U- / Y+
Region A
U- / Y+
Region B
U+ / Y-
Region B
U+ / Y-
CAPITAL
CAPITAL
LABOUR
LABOUR
GLOBALISATION, TRANSPORT AND THE ENVIRONMENT © OECD 2010 105

4. INTERNATIONAL AIR TRANSPORT: THE IMPACT OF GLOBALISATION ON ACTIVITY LEVELS
The alternative approach is essentially Keynesian in its orientation, and in its modern
form is linked to the New Growth Theory. Taking the initial starting positions for our two
regions, this approach argues that not only will equalisation of real wages and employment
levels not be attained, but that there may be cases where they diverge further. Labour
mobility may be impeded by the various costs of migration – embracing social and search
costs, as well as simple financial costs – and heterogeneity in the labour market – the jobs
available in region A not being compatible with the skills of labour in region B. Equally,
capital does not move from region A to B because of the higher returns that are to be found
in regions that already have a high level of prosperity. The original formulation of this type
of model in the 1960s put emphasis on the scale economies enjoyed by prosperous regions
with a larger capital base, but, as the nature of industry has evolved, it switched the ability
of advanced, knowledge-based economies to continually push forward the technology
envelope and forge ahead of other regions (Button, 2009b).
The role of transport in these models is different. In the classic framework it is
considered, as in classic trade theory, to be ubiquitous and free. In the Keynesian style
model, it is seen as a major transactions cost that affects clearing in the labour markets;
transport costs are considered important in the labour mobility decision, but the labour
market per se is largely seen as clearing in most other respects. There is an underlying
assumption that in the short term, there are potential mismatches between available pools
of labour skills and the demand for different types of labour, but in the long term, this is
resolved both through migration and natural adjustments to the endogenous labour bases
of each labour market.
Traditionally, migrants may do one of three things: stay in the same host country
forever (permanent settlers), go somewhere else (remigration) or go back to their country of
origin after a period.27 But these definitions raise some problems in a more globalised
world and one where mobility is easier. In the past, migrants to countries had little choice
but to become permanent settlers, as transport was extremely expensive. More recently
many migrants have been seen as guest workers and, for example in Germany in the 1970s,
were often not highly skilled workers on short-term contracts. This has now changed in
many places.28 Globally, there has also been some attempt to liberalise the temporary
movement of service workers under the General Agreement on Trade and Services, but
implementation has been piecemeal. It has focused largely on high-level personnel who
are more likely to use air transport if they become temporary migrants.
Until the mid-1900s, the traditional flow of migrants passed through some form of
geographical “gateway” or institution such as Ellis Island in the United States (Button,
2007). These gateways have gradually moved farther apart, as it has become easier for
migrants to pass through them and, as transport systems have evolved, to cover the
distance between them. Figure 4.13 represents the traditional view of gateways (Burghardt,
1971). In the US context, for example, the two traditional gateway cities of the mid-1880s
may be seen as New York on one coast and San Francisco on the other. Once into the
country, migrants would move into the hinterland, often through a hub such as Chicago.
Railroads largely facilitated this movement. The nature of maritime transport at the time,
as well as institutional controls, led to this pattern of behaviour. The gateways proved
challenging barriers to cross and, while migration was extensive, it was not easy and
reverse migration, or visits to family left behind, proved almost impossible for the vast
majority of individuals even if they did succeed in their new land.
GLOBALISATION, TRANSPORT AND THE ENVIRONMENT © OECD 2010106
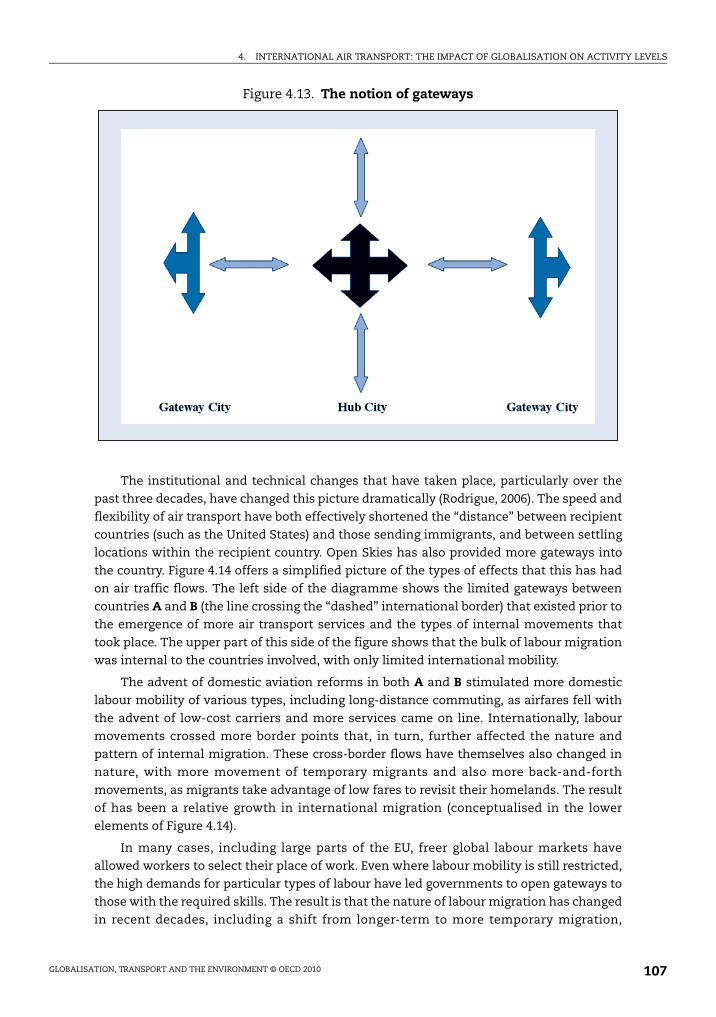
4. INTERNATIONAL AIR TRANSPORT: THE IMPACT OF GLOBALISATION ON ACTIVITY LEVELS
The institutional and technical changes that have taken place, particularly over the
past three decades, have changed this picture dramatically (Rodrigue, 2006). The speed and
flexibility of air transport have both effectively shortened the “distance” between recipient
countries (such as the United States) and those sending immigrants, and between settling
locations within the recipient country. Open Skies has also provided more gateways into
the country. Figure 4.14 offers a simplified picture of the types of effects that this has had
on air traffic flows. The left side of the diagramme shows the limited gateways between
countries A and B (the line crossing the “dashed” international border) that existed prior to
the emergence of more air transport services and the types of internal movements that
took place. The upper part of this side of the figure shows that the bulk of labour migration
was internal to the countries involved, with only limited international mobility.
The advent of domestic aviation reforms in both A and B stimulated more domestic
labour mobility of various types, including long-distance commuting, as airfares fell with
the advent of low-cost carriers and more services came on line. Internationally, labour
movements crossed more border points that, in turn, further affected the nature and
pattern of internal migration. These cross-border flows have themselves also changed in
nature, with more movement of temporary migrants and also more back-and-forth
movements, as migrants take advantage of low fares to revisit their homelands. The result
of has been a relative growth in international migration (conceptualised in the lower
elements of Figure 4.14).
In many cases, including large parts of the EU, freer global labour markets have
allowed workers to select their place of work. Even where labour mobility is still restricted,
the high demands for particular types of labour have led governments to open gateways to
those with the required skills. The result is that the nature of labour migration has changed
in recent decades, including a shift from longer-term to more temporary migration,
Figure 4.13. The notion of gateways
GLOBALISATION, TRANSPORT AND THE ENVIRONMENT © OECD 2010 107

4. INTERNATIONAL AIR TRANSPORT: THE IMPACT OF GLOBALISATION ON ACTIVITY LEVELS
sequential migration and cycles of migration. There has also been an increase in
long-distance commuting, involving regular return trips home, whether weekly or at some
longer interval. Air transport seems to be in many cases a facilitator of these changes.
Labour migration, both in its volume of flows and its changing composition (including
greater emphasis on circulation and temporary migration), has in many cases been shaped
by changes in the availability, frequency and costs of air travel. It makes the initial
migration itself more viable and, by facilitating cheap return trips, reduces the longer-term
social costs of being away from family.29
The reforms in air transport regulation have overcome many of the previous limitations
of air transport as a significant form of mass mobility; costs were a significant barrier to air
travel, as were the frequency and convenience attributes. Low-cost airlines, and their
knock-on effects on the legacy carriers, have changed this. As a result, they have impacted
labour markets in several ways, but mainly through reducing travel costs and increasing
accessibility. Effectively, they reduce the transaction costs of international labour migration;
by shifting the balance between the costs and returns of migration, they have contributed to
the increase in factor mobility. For individuals, the cost of being away from home is high
(mental and physical stress, the cost of separation, etc.), for others, the cost of travelling may
be more important. For all, air transport lowers migration costs. Some can visit relatives
Figure 4.14. Impacts of gateways on air transport networks and flows
GLOBALISATION, TRANSPORT AND THE ENVIRONMENT © OECD 2010108
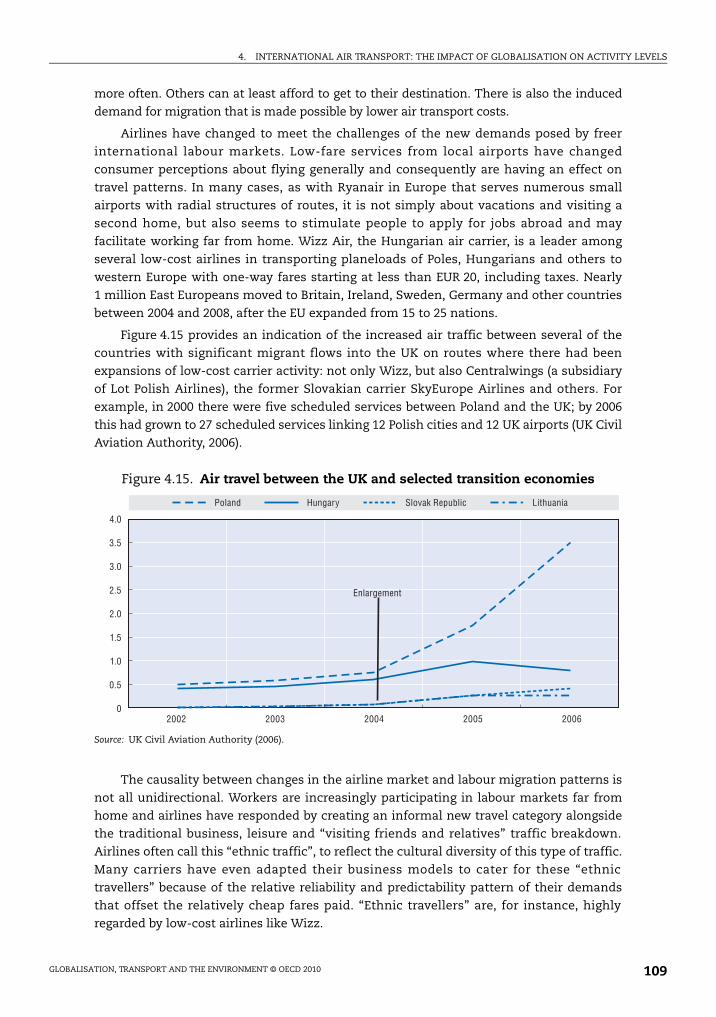
4. INTERNATIONAL AIR TRANSPORT: THE IMPACT OF GLOBALISATION ON ACTIVITY LEVELS
more often. Others can at least afford to get to their destination. There is also the induced
demand for migration that is made possible by lower air transport costs.
Airlines have changed to meet the challenges of the new demands posed by freer
international labour markets. Low-fare services from local airports have changed
consumer perceptions about flying generally and consequently are having an effect on
travel patterns. In many cases, as with Ryanair in Europe that serves numerous small
airports with radial structures of routes, it is not simply about vacations and visiting a
second home, but also seems to stimulate people to apply for jobs abroad and may
facilitate working far from home. Wizz Air, the Hungarian air carrier, is a leader among
several low-cost airlines in transporting planeloads of Poles, Hungarians and others to
western Europe with one-way fares starting at less than EUR 20, including taxes. Nearly
1 million East Europeans moved to Britain, Ireland, Sweden, Germany and other countries
between 2004 and 2008, after the EU expanded from 15 to 25 nations.
Figure 4.15 provides an indication of the increased air traffic between several of the
countries with significant migrant flows into the UK on routes where there had been
expansions of low-cost carrier activity: not only Wizz, but also Centralwings (a subsidiary
of Lot Polish Airlines), the former Slovakian carrier SkyEurope Airlines and others. For
example, in 2000 there were five scheduled services between Poland and the UK; by 2006
this had grown to 27 scheduled services linking 12 Polish cities and 12 UK airports (UK Civil
Aviation Authority, 2006).
The causality between changes in the airline market and labour migration patterns is
not all unidirectional. Workers are increasingly participating in labour markets far from
home and airlines have responded by creating an informal new travel category alongside
the traditional business, leisure and “visiting friends and relatives” traffic breakdown.
Airlines often call this “ethnic traffic”, to reflect the cultural diversity of this type of traffic.
Many carriers have even adapted their business models to cater for these “ethnic
travellers” because of the relative reliability and predictability pattern of their demands
that offset the relatively cheap fares paid. “Ethnic travellers” are, for instance, highly
regarded by low-cost airlines like Wizz.
Figure 4.15. Air travel between the UK and selected transition economies
Source: UK Civil Aviation Authority (2006).
2002 2003 2004 2005 2006
4.0
3.5
3.0
2.5
2.0
1.5
1.0
0.5
0
Poland Hungary Slovak Republic Lithuania
Enlargement
GLOBALISATION, TRANSPORT AND THE ENVIRONMENT © OECD 2010 109
4. INTERNATIONAL AIR TRANSPORT: THE IMPACT OF GLOBALISATION ON ACTIVITY LEVELS
While official statistics do not capture this particular sub-class of traveller, one can
glean some indication of the growth in this “ethnic” traffic, at least in Europe, by looking at
the conventional “visiting friends and relatives” (VFR) category, most of the growth being
migrants making visits to their homeland. Comparing the number of inbound passengers
for 2000 and 2005 at the two primarily low-cost UK airports, Stansted and Luton, VFR traffic
grew by 198% over the period to become the largest single component of inbound traffic. At
the national level, a similar picture emerges with VFR traffic growing from less than 2.5%
of EU passengers in 1997 (when there were 15 member countries) to about 15% by 2005
(albeit with 25 members).
Business models of airlines
There are considerable economies of scale density and scope on the cost side, and of
market presence on the demand side, in the provision of airlines services. These features
have led many of the major airlines to adopt hub-and-spoke styles of operations, and
particularly when there is a focus on long-haul operations. In the short-haul market, the
growth of low-cost, or “no-frills” carriers, such as Southwest Airlines in the United States
and Ryanair in Europe, operating either point-to-point services akin to a bus service (with
scope and scale economies coming from generating high load factors, by combining a
series of short segments) or radial services (with the airline operating a set of routes from
an airport but not providing online connections) has impacted adversely the viability of
hub-and-spoke operators.
While the airline industry has, as a whole, proved itself remarkably robust and flexible
over previous decades, there would seem to be a need to redefine the existing models
further as globalisation progresses. There is already some indication that airlines are
looking to deploy different business models. What the exact outcome will be over the next
decades is difficult to say, but some indications may be found in current trends.
There has been a demonstrable switch by the traditional network carriers away from
short-haul markets to long-haul international routes, and as the forecasts of Boeing,
Airbus and others suggest, this is likely to be ongoing in the future. For US airlines, for
example, even in the short term, international passenger traffic grew by 5.7% between
January-May 2007 and January-May 2008, compared to a decline of 1.9% in domestic
passengers30 (see Figure 4.14). One possibility is that as traffic grows, the patterns of routes
will remain unaltered (as in the top left quadrant), with increasing volumes of traffic being
pushed through the existing major hubs. Congestion being handled through the use of very
much larger aircraft, improved operations and ground investments at these hubs, with
short-haul feeder services providing egress and access for domestic traffic. The alternative
view, essentially that of Boeing, is that there will be more long-haul routes developed to
carry traffic between A and B, with ground capacity coming from the utilisation of smaller
airports and air service being provided by large, but not super-jumbo, fuel-efficient planes.
Which will prove the correct prediction has yet to emerge.
A second modification of the business model is a further, and clearer, demarcation of
service quality. The initiation of low-cost services effectively moved away from passengers
seeking on-board service attributes to a separation of those seeking low fares. More recent
premium services, initiated by Lufthansa on the North Atlantic, have been introduced to
separate passengers where the on-plane environment is important. The aim is to segregate
the business market niche where long-distance travellers want to arrive to work and where
in many cases, there is a principle-agent distinction (the employer pays the fare and the
GLOBALISATION, TRANSPORT AND THE ENVIRONMENT © OECD 2010110
4. INTERNATIONAL AIR TRANSPORT: THE IMPACT OF GLOBALISATION ON ACTIVITY LEVELS
employee selects the flight). To date, this has not proved a successful model and some of
the early actors such as MAXjet, Silverjet, and EOS have left the market. The traditional
carriers competed heavily by reducing the business-class fares on their multi-class planes,
and the all-business airlines could not provide the level of frequency that business
travellers seek. Whether large carriers moving into this market will be more successful
remains to be seen, but they do have the advantages of substantial financial reserves, good
airport access, capacity to offer a high service frequency and control over the fares they
offer on their own competing multi-configuration services.
At the other extreme, long-haul, low-cost services are only just beginning to be
developed. The availability of longer-range, smaller aircraft is one technical factor for this,
but also the increased movement of labour and growing levels of long-distance tourism
provided an impetus on the demand side. Progress has been slow, but the economics of the
industry may change with the arrival of the Airbus A-380 superjumbo.
Historically, Freddie Laker’s Laker Airways, that operated its “Skytrain” service
between London and New York City during the late 1970s was a pioneer in this type of
travel, but failed financially. In 2004, Aer Lingus started offering no-frills transatlantic
flights for just over EUR 100, and the Canadian airline Zoom Airlines started selling
transatlantic flights between Glasgow UK or Manchester UK and Canada for GBP 89.31 On
26 October 2006, Oasis Hong Kong Airlines started flying from Hong Kong, China to London
Gatwick Airport (delayed by one day because the Russian Federation suspended fly-over
rights for that flight an hour before the flight’s scheduled departure). Economy tickets for
flights between Hong Kong, China and London could be as low at GBP 75 per leg excluding
taxes and other charges, and business class GBP 470 per leg. The company stopped its
flights in 2008, after running up HKD 1 billion of losses. In 2007, AirAsia X, a subsidiary of
AirAsia and Virgin Group, initiated services from Kuala Lumpur to the Gold Coast,
Australia, claiming it was the first true, low-cost, long-haul carrier of the modern era.
Developing a viable low-cost business model is difficult because of the need to have
sufficient feeder traffic. While connecting flights can generate this, this adds significantly
to operating costs and means that a mixed fleet of aircraft is needed. Additionally, low
costs on short-haul routes come, in part, from rapid turnaround time for hardware and
crew, but this is not relevant for long-distance flights that also often encounter problems of
co-ordination across time zones and in meeting the scheduling limitations imposed by
airport curfews. Additionally, very long flights are fuel intensive, as the plane has to carry
additional fuel to carry the extra fuel needed. This makes saving costs difficult.
Changing industrial needs
The demand for air cargo movement has historically been correlated with economic
growth, but is also influenced by the types of consignment to be moved and the logistic needs
of the associated supply chain. The move to higher-value manufacturers, demands for exotics
and the need to replace damaged or worn-out industrial components has been instrumental
in increasing the demands for international freight transport.32 In addition, with the growth of
such activities as “teleshopping”, with its associated physical supply chain, there have been
additional demands for fast and reliable movement of goods across borders where there are
free trade agreements, such as within the EU. Air cargo also has an advantage of needing less
fixed infrastructure than surface transport, making it a viable mode in many locations where
GLOBALISATION, TRANSPORT AND THE ENVIRONMENT © OECD 2010 111

4. INTERNATIONAL AIR TRANSPORT: THE IMPACT OF GLOBALISATION ON ACTIVITY LEVELS
there are major physical constraints to trucking or sea transport; thus it has found an
increasing role in developing countries with poor infrastructure and difficult terrain for the
export and import of capital equipment (Vega, 2009).
According to the ICAO, aircraft, while only carrying around 2% of international trade by
volume, carry about 40% by value. Air cargo, because road and rail offer alternatives over
short distances, is also predominantly an international activity; about 85% of freight tonne-
kilometres (FTK) done are intercontinental. A large part of the global market for airfreight
services is provided by a limited number of large carriers (Table 4.5) that often, and
particularly for wealthier countries with large land masses, provide seamless domestic and
international collection and delivery; about 59% of the worlds FTKs involve the United
States. Further, much of the longer-distance air freight is carried in the belly-holds of
scheduled passenger aircraft because of the costs savings from economies of scale that this
can create.33 Short-distance movements, because there are fewer synergies between
passenger and freight traffic, are usually done on dedicated aircraft. Not only does the
carriage of freight slow the turnaround times of passenger planes, the peak times for its
movement often do not coincide with passenger schedules, and freight hubs, such as
Memphis for FedEx, are not large passenger airports.
Air freight transport has also become an integrated part of the modern supply chain.
In some sectors, such as the movement of exotics (largely flowers and fruits with a short
market life) this is essential because of a lack of durability in the product, while in others it
is because of the need for reliable and rapid delivery (industrial components and legal
documents). Unlike passenger transport, where the passengers deliver themselves to
airports and then disperse themselves to final destinations, a single commercial carrier
often handles air cargo from origin to destination. The integrated carriers that provide
these services, such as FedEx Express, DHL, UPS, etc., are multimodal companies that, for
example, also have extensive fleets of trucks for pick-up and delivery, and flow a large part
of their business through one or more major hubs. In addition, packages and cargo are
insensitive to the quality of the on-board service that they receive, other than temperature
control in some cases, and routing is unimportant to them. This offers more opportunity
for flexibility in the supply chain and for the air transport component to avoid some of the
constraints on passenger movements. It is, therefore, easier to develop mega-hubs away
from environmentally sensitive locations.
Table 4.5. Scheduled freight tonne-kilometres flown
Airline 2007 (millions) 2006 (millions) 2005 (millions)
FedEx Express 15 710 15 145 14 408
UPS Airlines 10 968 9 341 9 075
Korean Air Cargo 9 568 8 764 8 072
Lufthansa Cargo 8 348 8 091 7 680
Cathay Pacific 8 225 6 914 6 458
Singapore Airlines Cargo 7 945 7 991 7 603
China Airlines 6 301 6 099 6 037
Air France 6 126 5 868 5 532
Source: International Air Transport Association, www.iata.org/ps/publications/wats-freight-km.htm.
GLOBALISATION, TRANSPORT AND THE ENVIRONMENT © OECD 2010112
4. INTERNATIONAL AIR TRANSPORT: THE IMPACT OF GLOBALISATION ON ACTIVITY LEVELS
In the past, the growth in international air cargo has been heavily influenced by the
availability of suitable planes. The advent of the wide-bodied jet in the late 1960s offered
belly-hold capacity and the lift required to take significant amounts of freight. Later these
planes were converted into dedicated freighters. These freighters have both a significant
carrying capacity and range: e.g. a Boeing 747-400ERF freighter aircraft has a payload of
112 760 kg and a range of some 18 000 km. Technology does allow for larger planes,
although Airbus is not immediately planning to produce a freighter version of its
A380 plane,34 and limits on wing technology, airport capacity issues and other factors may
result in short-term constraints.
Developments in emerging markets
There are a number of markets that seem likely candidates to replace the lead of more
traditional ones of North America and western Europe as these reach full maturity. Some
regions, such as Africa, seem unlikely to develop significant air traffic flows over the next
20 years, in part because the base incomes levels are low, but also because their economic
growth rate seems uncertain. Some South American international air transport markets
have been growing, and if political stability is maintained, these may grow at an
accelerated rate; the uncertainty, however, is high. The focus here is, therefore, on two
types of emerging markets, those associated with the European transition countries and
those with the mega-developing economies.
Transition economies
The collapse of the Soviet bloc from the late 1980s resulted in large increases of trade
between the transition economies35 and the more traditional market economies to the
extent that some have joined the European Union. Figure 4.15 provides some indication of
the growth of air transport in one segment of the European air transport market as
transition economies became integrated within the EU.
The former communist states had relatively undeveloped international air transport
networks prior to 1989, often served by poor quality hardware and not managed to
maximise either social or commercial efficiency. Since that time, many of the countries
have upgraded their fleets and restructured their route networks to integrate into the
western European short-haul markets. A number of successful low-cost carriers did
emerge to carry migrant workers and to offer leisure services as incomes rose. There was
until recently a clear shortage of capacity due to limited investment availability which has
been a constraint on expansion. In the longer term, with the liberalised EU market, the
industry will confront competition from low-cost and traditional carriers from western
European states. How many of the carriers from the transition economies will survive in
this type environment, despite higher traffic levels, is uncertain.
Emerging mega-economies: China and India
China and India are large exporters and importers. They both have large and growing
domestic airline markets to facilitate their production of goods to sell in the international
market, and also have rapidly growing flows of international air traffic. Certainly, from the
projections of the main airframe manufacturers, there is a sense that they will provide
continuing and expanding markets for their products.
GLOBALISATION, TRANSPORT AND THE ENVIRONMENT © OECD 2010 113

4. INTERNATIONAL AIR TRANSPORT: THE IMPACT OF GLOBALISATION ON ACTIVITY LEVELS
China has the second largest economy in the world and grew at an average rate of
10% per year during the period 1990 to 2004. Its international trade in 2006 surpassed
USD 1.76 trillion, making it the world’s third-largest trading nation. Accessibility to air
transport improved significantly over the past 20 years as China expanded its air transport
system and, in particular, its airport capacity (Table 4.6) to meet growing economic
demands. The dominance of major airports has declined as the system has expanded to
medium and small cities. The heart of passenger traffic migrated southeast, consistent
with the expansion of economic growth in that region’s coastal areas. Distance decay in air
traffic became more pronounced in China after 1998, as the country’s air transport system
became more commercially driven. The east region has a high proportion of air passengers
given its population and GDP, followed by the west and the central regions. By 1998, a
hub-and-spoke air transport system was clearly in place in China.
China’s rapid industrialisation, and in particular the development of its manufacturing
industries, has also led to a massive growth in its use of air cargo to export commodities and
to bring into the country components, etc., that are needed to keep its factories working (see
Table 4.6).36 Much of this traffic has come in through three major gateways: Shanghai, Beijing
and Guangzhou (Figure 4.16). The airports at these cities have become focal points in the
country’s domestic and international freight network. Beijing, for example, offered 57 freight
Table 4.6. Selected indices of China’s civil air transport system1980-2005
1980 1985 1990 1995 2000 2005
Number of airports 77 80 92 116 139 142
Passenger traffic (million persons) 3.4 7.5 16.6 51.2 67.2 138.3
Passenger traffic turnover (million person-km) 39.6 116.7 230.5 681.3 970.5 2 044.9
Freight traffic (thousand tons) 90 200 370 1 010 1 970 3 070
Freight traffic turnover (million tonne-km) 140.6 415.1 818.2 2 229.8 5 026.8 7 889.5
Source: Wang and Jin (2007).
Figure 4.16. Throughput of freight at major Chinese cargo hub airports
Source: Statistical Data on Civil Aviation of China, various years.
2 500 000
2 000 000
1 500 000
1 000 000
500 000
01990 1992 1994 1996 1998 2000 2002 2004
Tonnes Beijing Shanghai Guangzhou
GLOBALISATION, TRANSPORT AND THE ENVIRONMENT © OECD 2010114
4. INTERNATIONAL AIR TRANSPORT: THE IMPACT OF GLOBALISATION ON ACTIVITY LEVELS
connection cities in 1990, of which 13 were international; by 2003 this had grown to
126 connections with 65 destinations. The comparable figures for international connections
for Shanghai were 13 in 1990, rising to 65 in 2003.
China’s international air transport has, until recently, been heavily protected, and
many hard (largely infrastructure) and soft (institutional protection) barriers remain. This
protection has been exercised through a number of channels, including protecting
uncompetitive carriers, restrictions on its citizens’ travelling abroad, limited infrastructure
(particularly airport capacity) and a lack of skilled labour and management (Zhang and
Chen, 2003). In the context of cargo traffic, these have not only limited market access, but
also made the development of fully integrated logistics system difficult (Fung et al., 2005).
These constraints have begun to be less binding and many bilateral ASAs have been signed,
although Open Skies in major markets remains distant. It seems inevitable that China’s
international air markets will be further liberalised, stimulating traffic.
The geography and size of the domestic market in China suggests that its air transport
sector will gradually move to a structure akin to that in the United States. Its domestic airline
industry, while initially very fragmented after deregulations of the late 1980s, is now
consolidating and alliances are being formed to provide seamless international services; for
example, China Southern Airlines became a member of SkyTeam in 2007. The perceived
strategic nature of the air cargo market, however, suggests that government involvement will
remain a feature. Given the institutional structures within China, which is largely modal based
with no single agency covering freight transport, this government involvement is likely to
impair the growth of multi-modal logistics. This is despite the fact that China’s accession to
the World Trade Organization allows part or full ownership of air-cargo related companies.
Although its economic growth has not been so pronounced as China’s, the Indian
economy has expanded considerably – its growth rate in 2007 was 9%, compared to
China’s 13%37 – and with this has come an expansion of its domestic and international air
transport networks. The Indian air transport market was traditionally highly regulated with
the flag carrier, Air India, enjoying considerable monopoly rights. In 1994, however, the Air
Corporation Act of 1953 was repealed with a view to removing monopoly of air corporations
on scheduled services, enabling private airlines to operate scheduled service, converting
Indian Airlines and Air India to limited company status, and enabling private participation in
the national carriers. However, beginning 1990, private airline companies were allowed to
operate air taxi services, resulting in the establishment of Jet Airways and Air Sahara. These
changes in the Indian aviation policies resulted in an increase in the share of private airline
operators in domestic passenger carriage to 68.5% in 2005 from 0.4% in 1991. More recently,
numerous low-cost carriers have entered the Indian domestic market, including Air Deccan,
Kingfisher Airlines, SpiceJet, GoAir, Paramount Airways and IndiGo Airlines since 2004
(O’Connell and Williams, 2006). Externally, India has liberalised many of its bilateral
agreements, including signing an Open Skies agreement with the United States in 2005
which has stimulated traffic – a trend that will probably continue as India’s GDP increases.
4.8. ConclusionsThe beginning of the 21st century saw a continued internationalisation and globalisation
of the world’s economy. There is also evidence of deeper globalisation of cultures and politics.
Air transport played a part in fostering these developments, but airlines, and to a greater
degree, air transport infrastructure, have had to respond to changing demands for their
GLOBALISATION, TRANSPORT AND THE ENVIRONMENT © OECD 2010 115
4. INTERNATIONAL AIR TRANSPORT: THE IMPACT OF GLOBALISATION ON ACTIVITY LEVELS
services. Air transport is a facilitator and, as such, the demands for its services are derived
from the requirements for high-quality, speedy and reliable international transport.
Globalisation, almost by definition, means demands for greater mobility and access, but these
demands are for different types of passengers and cargoes, to different places and over
different distances than was the previous norm.
International air transport is less than a century old, but is now a major contributor to
globalisation and is continually reshaping to meet the demands of the economic and social
integration that globalisation engenders. Economically, in static terms, globalisation
occurs to facilitate the greater division of labour and allows countries to exploit their
comparative advantage more completely. Perhaps more importantly in the longer term,
globalisation stimulates technology and labour transfers, and allows the dynamism that
accompanies entrepreneurial activities to stimulate the development of new technologies
and processes that enhance global welfare. To allow the flows of ideas, goods and persons
that facilitate both static and dynamic efficiency on a global scale, air transport has played
a role in the past, and it seems inevitable that this role will continue in the future.
Notes
1. This chapter is an edited version of two papers: The Impact of Globalisation on International AirTransport Activity: Past Trends and Future Perspectives, written by Ken Button, George Mason School ofPublic Policy, United States, for the OECD/ITF Global Forum on Transport and Environment in aGlobalising World, held in Guadalajara, Mexico, 10-12 November 2008 (www.oecd.org/dataoecd/51/53/41373470.pdf) and The Environmental Impacts of Increased International Air Transport: Past Trends andFuture Perspectives, written by Eric Pels, VU University, the Netherlands, for the same event(www.oecd.org/dataoecd/44/18/41508474.pdf).
2. The air transport industry itself has established international bodies to interact with nationalgovernments and institutions such as the ICAO. The International Air Transport Association (IATA)was established to assist airline companies to achieve lawful competition and uniformity in prices.
3. Norway and Switzerland are also included in most of these agreements.
4. In October 2001, the European Commission also adopted proposals for a Single European Sky, tocreate a community regulator for air traffic management within the EU, Norway and Switzerland.
5. One US survey has shown that high technology personnel fly about 60% more than theircounterparts in traditional industries. A broader econometric analysis indicates that the locationof a city with a hub airport in the US in the 1990s enjoyed some 12 000 more high technology jobsthan a comparable city without a hub (Button et al., 1999). Analysis of transatlantic routes showsthat enhanced numbers of links and service frequencies lead, albeit at a declining rate, to morehigh technology employment (Button and Taylor, 2002).
6. In terms of total passengers, because length of trips not included in the ranking of airlines issomewhat different; e.g. according to IATA, Ryanair carried 40 532 000 passengers in 2006;Lufthansa, 38 236 000; Air France, 30 417 000; British Airways, 29 498 000; and KLM, 22 322 000.
7. For example, Airports Council International data shows Memphis International Airport handled3 840 491 metric tons of cargo in 2007; Hong Kong International Airport New Territories,3 773 964 tons; Shanghai Pudong International Airport, 2 559 310 tons; Incheon InternationalAirport, 2 555 580 tons.
8. The current economic recession has halted the previous growth. According to Airports CouncilInternational (2009), airport passenger traffic in January-September 2009 was 4% lower than inJanuary-September 2008. Total air freight traffic had declined 14% over the same period, withinternational freight declining 17%.
9. The treatments of elements in the figure are static in the sense that technology is held constant.Modern economic theory holds that at least part of technical change is endogenous and thus afunction of market and institutional structures.
GLOBALISATION, TRANSPORT AND THE ENVIRONMENT © OECD 2010116
4. INTERNATIONAL AIR TRANSPORT: THE IMPACT OF GLOBALISATION ON ACTIVITY LEVELS
10. This particular approach to examining the implications of international deregulation of airtransport markets was developed in the specific context of transatlantic routes, but the argumentsare general (Button, 2009a). That paper also assesses the quantitative analysis that has been doneon the implications of a US-EU Open Skies agreement.
11. In practice, fares tended to reflect the bargaining power of the parties and the objectives of thecountries’ overall approaches to the airlines market. Continental European countries have had along tradition of supporting their flag carriers for a variety of reasons that are linked to theirperceptions of their national interest. In some cases, the fares may have been below the levelrequired for cost recovery, whilst in others they may have been higher if, for example, one partnersought to cross-subsidise domestic services.
12. If there are economies of scope or density from offering air services in this market, as is often thecase, the cost curve would be downward sloping and in this case the outward shift in demandreinforces the cost curve more and fares will always fall.
13. If there are declining costs, however, this monopoly power may be needed to allow for the recoveryof the fixed costs of providing a scheduled service.
14. In some cases, these feeder flights may actually be by another mode. For example, Lufthansa hasrail feeder services and most feeder movements for cargo to Heathrow in London are, despitehaving a flight number associated with them, carried out by truck.
15. Source: www.klm.com.
16. While airlines have, as a whole, found it difficult to recover their full economic costs, other actorsin the air transport value chain have generally earned a reasonable return. International airlinescan be seen as “till” at the end of this chain and as collectors of the revenues that finance the chain(Button, 2004).
17. There was unprecedented rapid rises in costs of aviation fuel (kerosene) between 2001 and 2008.Jet fuel rose from USD 30.5 a barrel in 2001 to USD 81.9 in 2006, to USD 113.4 in December 2007 andto over USD 140 in July, 2008. The result was that for international airlines, fuel costs thatconstituted 13% of operating costs in the US in 2001 rose to 26% by 2006 and to between 30% and50% in 2008. The cost of kerosene has, however, decreased significantly from 2008 to 2009.
18. Even where there is not actual competition, potential market entry for at least a period prior totake-off is possible. This is weak competition due to contestability (Button, 2006).
19. For a largely accessible general survey of the theory, see Telser (1987). The academic literatureapplying the theory to airlines is thin, but includes Button et al. (2007) and Button (1996).
20. In the EU, efforts by Ryanair to pursue similar strategies for inter-European international servicesfell foul of legislation covering the use of any public funds to support services.
21. Levine (2002) argues that you can have price discrimination without market power and that this isa natural way to recover costs. However, while price discrimination, as practiced by airlines in theform of yield management, may be needed for cost recovery, it seems difficult to see how its use ispossible without an airline having some market power. The issue is more the extent to whichmarket power is necessary for optimal price discrimination for cost recovery and when thischanges to become a tool of rent seeking.
22. From the mid-1990s, there was some effort to adopt scenario-driven analysis for forecasting,although simple extrapolations still dominate – e.g. see British Airways (1995). One attempt to lookat the future of international air travel using a softer approach is to be found in OECD (1997).
23. The differing futures seen by Boeing and Airbus are in part due to the fact that Boeing believes thatgrowth in long-haul traffic will be catered for by point-to-point services, whereas Airbus believesthere will be a significant demand for its A380 super-jumbo plane to link up large hub airports.
24. This is often called “South-South migration” as opposed to “South-North migration” thattraditionally describes movements from developing to developed countries. Of the South-Southmigration, 80% is between countries with contiguous borders and 65% of the remainder is betweencountries with the 40th percentile of countries ranked by distance.
25. These theories only relate to the narrow economic motivations for migration and do not includesocio-political theories, covering such things as military disruptions and forced migration.
26. Strictly with full market clearing, there is no unemployment in this type of model, labourmovements being determined by real relative wages. The unemployment effect is added toindicate possible imperfections in the short-term labour markets in the two regions.
GLOBALISATION, TRANSPORT AND THE ENVIRONMENT © OECD 2010 117

4. INTERNATIONAL AIR TRANSPORT: THE IMPACT OF GLOBALISATION ON ACTIVITY LEVELS
27. These are often “target workers”, who return home once a certain amount of money has beensaved or skills attained.
28. There are still significant flows of unskilled temporary migrants that have become institutionalisedin some cases. Canada, for example has the Seasonal Agricultural Worker Program that in 2006allowed 13 000 workers to come from Mexico. These workers all had to travel by air transportation.
29. Improvements in telecommunications have added to the ability to retain close ties with thehomeland and are closely linked to the effects of air transportation.
30. For a more detailed assessment of this type of strategy in the context of TAP, the Portuguese airline,see Button et al. (2005).
31. Zoom filed for bankruptcy protection in August 2008, due to its deteriorating financial position, seehttp://en.wikipedia.org/wiki/Zoom_Airlines.
32. About 19% of FTKs involve capital equipment, 13.5% computers, 12.4% intermediate materials and7.4% perishables.
33. In terms of purely international freight tonne-kilometres done, Korean Air Cargo did 8 680 in 2006;Lufthansa Cargo, 8 077; Singapore Airlines Cargo, 7 991; Cathay Pacific, 6 914; and FedEx Express, 6 136.
34. Originally a freighter version was planned, but was abandoned after only one order was received.
35. “Transition economies” is now a somewhat dated term, but it is useful shorthand for this group ofcountries. It should, nevertheless, be taken into account that a number of these countries havebeen hit particularly hard by the current economic crisis.
36. In terms of tonnage, this has risen from some 157 000 in 1980 to 4.5 million in 2003.
37. See OECD (2009). In 2008, the growth rates were 6% and 9%, and the OECD estimates GDP to grow4.3% and 6.3% in 2009 in India and China, respectively.
References
Airbus (2007), Fly by Nature, Global Market Forecast 2007-2026, Airbus, Toulouse.
Airports Council International (2009), Monthly Traffic Data, Airports Council International, available atwww.airports.org.
Boeing Commercial Airplane (2007), Current Market Outlook, 2008-2027, Boeing, Seattle.
Brattle Group (2002), The Economic Impact of an EU-US Open Aviation Area, a Study for the EuropeanCommission, Brattle Group, Washington DC.
British Airways (1995), Global Scenarios, British Airways, London.
Brueckner, J.K. and Y. Zhang (2001), “A Model of Scheduling in Airline Networks: How a Hub-and-SpokeSystem Affects Flight Frequency, Fares and Welfare”, Journal of Transport Economics and Policy, 35,pp. 195-222.
Burghardt, A.F. (1971), “A Hypothesis about Gateway Cities”, Annals of the Association of AmericanGeographers, 61(2), pp. 269-285.
Button, K.J. (1996), “Liberalising European Aviation: Is there an Empty Core Problem?”, Journal ofTransport Economics and Policy, 30(3), pp. 275-292.
Button, K.J. (2004), Wings Across Europe: Towards an Efficient European Air Transport System, Ashgate,Aldershot.
Button, K.J. (2006), “Is the Debate over the Contestability of Airline Markets Really Dead?”, in B. Jourquin,P. Rietveld and K. Westin, Towards Better Performing Transportation Systems, Routledge, London.
Button, K.J. (2007), “Distance and Competitiveness – The Role of Gateways, Corridors, and Competition”,in North American Networks: Gaps and Opportunities, University of Saskatchewan, Saskatoon.
Button, K.J. (2008), “Air Transportation Infrastructure in Developing Countries: Privatization andDeregulation”, in C. Winston and G. de Rus (eds.), Aviation Infrastructure Performance: A Study inComparative Political Economy, Brookings Institution, Washington DC.
Button, K.J. (2009a), “The Impact of EU-US ‘Open Skies’ Agreement on Airline Market Structures andAirline Networks”, Journal of Air Traffic Management, Vol. 15, pp. 59-71.
GLOBALISATION, TRANSPORT AND THE ENVIRONMENT © OECD 2010118

4. INTERNATIONAL AIR TRANSPORT: THE IMPACT OF GLOBALISATION ON ACTIVITY LEVELS
Button, K.J. (2009b), “The Economist’s Perspective on Regional Endogenous Development”, in R. Stimsonand R. Stough (eds.), Regional Endogenous Development, Edward Elgar, Cheltenham.
Button, K.J. and G. McDougal (2006), “Institutional and Structural Changes in Air Navigation ServiceProviding Organisations”, Journal of Air Traffic Management, 12(5), pp. 236-252.
Button, K.J. and S.Y. Taylor (2000), “International Air Transport and Economic Development”, Journal ofAir Transport Management, 6(4), pp. 209-222.
Button, K.J. and H. Vega (2007), “The Uses of the ‘Temporal-Fares-Offered Curve’, in AirTransportation”, Journal of the Transportation Research Forum, 46(2), pp. 83-100.
Button, K.J. and H. Vega (2008), “The Effects of Air Transport on the Movement of Labour”, GeoJournal,71(1), pp. 67-81.
Button, K.J., C. Costa and V. Reis (2005), “How to Control Airline Routes from the Supply Side – The Caseof TAP”, Journal of Air Transportation, 10(3), pp. 50-72.
Button, K.J., C. Costa and C. Cruz (2007), “Ability to Recover Full Costs through Price Discrimination inDeregulated Scheduled Air Transport Markets”, Transport Reviews, 27(2), pp. 213-230.
Button, K.J., S. Lall, R. Stough and M. Trice (1999), “High-Technology Employment and Hub Airports”,Journal of Air Transport Management, 5(1), pp. 3-59.
Cairncross, F. (1997), The Death of Distance, Harvard Business School Press, Cambridge, Mass.
Connekt (2001), Ontwikkeling van het hub-concept, Connekt, Delft.
Dana, J.J. Jr. (1998), “Advance-Purchase Discounts and Price Discrimination in Competitive Markets”,Journal of Political Economy, 106(2), pp. 395-422.
Dennis, N.P.S. (1998), Competition between Hub Airports in Europe and a Methodology for ForecastingConnecting Traffic, Paper presented at the World Conference for Transportation Research, Antwerp.
Edgeworth, F.Y. (1881), Mathematical Physics, Kegan Paul, London.
Fung, M.K., A. Zhang, L. Leung and J.S. Law (1995), “The Air Cargo Industry in China: Implications ofGlobalization and WTO Accession”, Transportation Journal, 44(4), pp. 44-62.
Friedman, T.L. (2005), The World Is Flat: A Brief History of the Twenty-first Century, Farrar, Straus andGiroux, New York.
Goetz, A. and C. Sutton (1997), “The Geography of Deregulation in the US Airline Industry”, Annals ofthe Association of American Geographers, 87(2), pp. 238-263.
Hart, R.A. (1975a), “Interregional Economic Migration: Some Theoretical Considerations (Part I)”, Journalof Regional Science, 15(2), pp. 127-138.
Hart, R.A. (1975b), “Interregional Economic Migration: Some Theoretical Considerations (Part II)”, Journalof Regional Science, 15(3), pp. 289-305.
Jin, F., F. Wang and Y. Liu (2004), “Geographic Patterns of Air Passenger Transport in China 1980-1998:Imprints of Economic Growth, Regional Inequality, and Network Development”, The ProfessionalGeographer, 56(4), pp. 471-487.
Kahn, A.E. (1988), “Surprises of Airline Deregulation”, American Economic Review. Papers and Proceedings,78(2), pp. 316-322.
Levine, M.E. (2002), “Price Discrimination without Market Power”, Yale Journal on Regulation, 19(1), pp. 1-36.
Morrison, S.A. (2001), “Actual, Adjacent and Potential Competition: Estimating the Full Effect ofSouthwest Airlines”, Journal of Transport Economics and Policy, 35(2), pp. 239-257.
Morrison, S. and C. Winston (1995), The Evolution of the Airline Industry, Brookings Institution,Washington DC.
National Commission to Ensure Consumer Information and Choice in the Airline Industry (2002),Travel Information Systems in the 21st Century, available at www.ncecic.dot.gov/ncecic/hearings.
Nolan, J., P. Ritchie and J. Rowcroft (2005), “Small Market Air Service and Regional Policy”, Journal ofTransport Economics and Policy, 3(3), pp. 363-78.
O’Connell, J.F. and G. Williams (2006), “Transformation of India’s Domestic Airlines: A Case Study ofIndian Airlines, Jet Airways, Air Sahara and Air Deccan”, Journal of Air Transport Management, 12(6),pp. 358-374.
OECD (1997), The Future of International Air Transport Policy, OECD, Paris.
GLOBALISATION, TRANSPORT AND THE ENVIRONMENT © OECD 2010 119
4. INTERNATIONAL AIR TRANSPORT: THE IMPACT OF GLOBALISATION ON ACTIVITY LEVELS
OECD (2009), OECD Economic Outlook, Interim Report, March 2009, OECD, Paris, available at www.oecd.org/dataoecd/18/1/42443150.pdf.
Peeters, P.M., J. Middel and A. Hoolhorst (2005), Fuel Efficiency of Commercial Aircraft, an Overview ofHistorical and Future Trends, Peeters Advies and National Aerospace Laboratory, available atwww.transportenvironment.org/Publications/prep_hand_out/lid:398.
Penner, J.E. et al. (1999), Aviation and the Global Atmosphere: A Special Report of IPCC Working Groups I and III,Cambridge University Press, Cambridge, available at www.ipcc.ch/ipccreports/sres/aviation/125.htm.
Rodrigue, J.P. (2006), “Challenging the Derived Transport Demand Thesis: Issues in Freight Distribution”,Environment and Planning A, 38(8), pp. 1449-1462.
Telser, L.G. (1987), “The Usefulness of Core Theory in Economics”, Journal of Economic Perspectives. 8(2),pp. 151-164.
UK Civil Aviation Authority (2006), No-frills Carriers: Revolution or Evolution?, A Study by the CivilAviation Authority, Civil Aviation Authority, London.
US Department of Transportation (2001), “Dominated Hub Fares”, Domestic Aviation Competition Series,Office of the Assistant Secretary for Aviation and International Affairs, Washington DC.
Vega, H. (2008), “Air Cargo, Trade and Transportation Costs of Perishables and Exotics from SouthAmerica”, Journal of Air Transport Management Vol. 14, pp. 324-328.
Wang, J. and F. Jin (2007), “China’s Air Passenger Transport: An Analysis of Recent Trends”, EurasianGeography and Economics, 48(4), pp. 469-480.
Zhang, A. (1996), “An Analysis of Fortress Hubs in Airline Networks”, Journal of Transport Economics andPolicy, 30, 3, pp. 293-307.
Zhang, A. and H. Chen (2003), “Evolution of China’s Air Transport Development and Policy towardsInternational Liberalization”, Transportation Journal, 42(3), pp. 31-49.
GLOBALISATION, TRANSPORT AND THE ENVIRONMENT © OECD 2010120

Globalisation, Transport and the Environment
© OECD 2010
Chapter 5
International Road and Rail Freight Transport: The Impact of Globalisation
on Activity Levels
byAllan Woodburn, Julian Allen, Michael Browne, Jacques Leonardi and Huib van Essen1
This chapter establishes the recent trends in international trade volumes. It thenaims to identify the main ways in which this trade growth has affected road and railfreight transport activity at the international level, and finally considers the likelyfuture direction of international land-based transport movement. Road and rail arecurrently carrying relatively small quantities of products traded internationallycompared with maritime shipping. However, likely increases in the total quantity ofinternational trade (as a result of manufacture continuing to grow in distantlocations, facilitated by more reliable, and faster transport services, supported byimprovements in technology) will increase the amount of goods that need to betransported internationally.
The chapter looks at recent trends in international trade activity. It discussesinternational trade and transport from a policy and economic perspective, beforedescribing the importance of customs clearance and border crossings together withthe increased concerns about security in international transport. The chapter providesa more detailed discussion of road and then rail within which aspects such asinfrastructure issues, policy and regulation, operations and technology are reviewed.The chapter closes with a look at future perspectives. New developments to removebottlenecks, combined with operational improvements, provide scope for considerableincreases in the efficiency of international road and rail freight in many regions.
121

5. INTERNATIONAL ROAD AND RAIL FREIGHT TRANSPORT: THE IMPACT OF GLOBALISATION ON ACTIVITY LEVELS
5.1. IntroductionIn this chapter, the international focus is on cross-border road and rail transport, rather
than on comparisons of trends and prospects across a range of different countries. However,
there is huge variation in the types of trips that make up international freight in terms of their
frequency, complexity, distance travelled and vehicle types used. For instance, international
road freight trips between the Netherlands and Belgium take place on a very regular basis, are
relatively simple (due to the lack of border controls in the EU), are very short distance
(sometimes shorter than the average domestic trip) and do not necessarily use maximum
weight articulated vehicles. However, by comparison, trips from Asia to Europe can be
occasional, extremely long distance (thousands of kilometres), very complex (due to numerous
border crossings), and typically use maximum weight fully laden articulated vehicles in order
to minimise unit costs of transport. Therefore, in talking about international freight transport
it is important to be aware of the diversity of trip types included, and the impact that the
attributes of the trips described above can have on its organisation and cost.
As far as possible, experiences from around the world are identified and discussed,
although the main focus is on cross-border flows between countries in Europe, Asia and
North America since these three regions are where the majority of land-based international
transport takes place, and for which there is considerable published information. While the
assessment is evidence-led where possible, there are limitations relating to differing
definitions and measurement units, both spatially and temporally, and inadequate data
relating specifically to cross-border freight transport activity.
5.2. Recent trends in international trade activityThe World Trade Organization (WTO) provides the most comprehensive data on trade
volumes and trends. This section highlights some of the main aspects of world trade that
affect freight transport activity and mode choice. Figure 5.1 reveals the long-term growth in
international trade volumes in all product categories, but most notably in manufactures.
In general, trade growth has exceeded the increase in GDP over this time period:
between 2000 and 2006, trade growth was approximately twice the GDP increase (WTO,
2007). Table 5.1 shows the key international trade flows between world regions, and within
these main regions, in 2006, in terms of the value of products. The top six flows involve just
three regions, Europe, Asia and North America, with trade within and between these
regions accounting for three-quarters of world trade value. Internal European flows alone
make up almost one-third of all international trade. Six of the top 10 countries involved in
international trade are European, with two each from North America and Asia.
Table 5.2 shows the average annual growth in trade to and from each of the world
regions for the 2000-06 period. Globally, the value of goods traded increased by an average
of 11% per annum. North America recorded lower than average growth, and those regions
less involved in international trade experienced higher than average growth rates, but
remain relatively insignificant in comparison to Europe, Asia and North America.
GLOBALISATION, TRANSPORT AND THE ENVIRONMENT © OECD 2010122
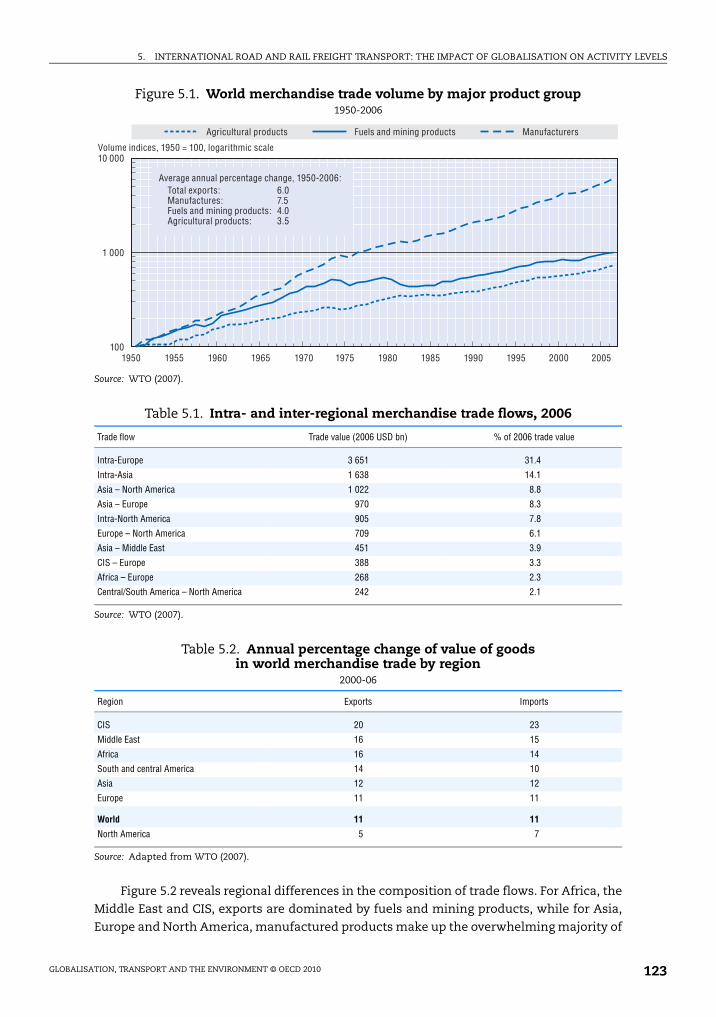
5. INTERNATIONAL ROAD AND RAIL FREIGHT TRANSPORT: THE IMPACT OF GLOBALISATION ON ACTIVITY LEVELS
Figure 5.2 reveals regional differences in the composition of trade flows. For Africa, the
Middle East and CIS, exports are dominated by fuels and mining products, while for Asia,
Europe and North America, manufactured products make up the overwhelming majority of
Figure 5.1. World merchandise trade volume by major product group1950-2006
Source: WTO (2007).
Table 5.1. Intra- and inter-regional merchandise trade flows, 2006
Trade flow Trade value (2006 USD bn) % of 2006 trade value
Intra-Europe 3 651 31.4
Intra-Asia 1 638 14.1
Asia – North America 1 022 8.8
Asia – Europe 970 8.3
Intra-North America 905 7.8
Europe – North America 709 6.1
Asia – Middle East 451 3.9
CIS – Europe 388 3.3
Africa – Europe 268 2.3
Central/South America – North America 242 2.1
Source: WTO (2007).
Table 5.2. Annual percentage change of value of goods in world merchandise trade by region
2000-06
Region Exports Imports
CIS 20 23
Middle East 16 15
Africa 16 14
South and central America 14 10
Asia 12 12
Europe 11 11
World 11 11
North America 5 7
Source: Adapted from WTO (2007).
10 000
1 000
1001950 1955 1960 1965 1970 1975 1980 1985 1990 1995 2000 2005
Volume indices, 1950 = 100, logarithmic scale
Agricultural products Fuels and mining products Manufacturers
Average annual percentage change, 1950-2006:Total exports: Manufactures: Fuels and mining products:Agricultural products:
6.0 7.5 4.03.5
GLOBALISATION, TRANSPORT AND THE ENVIRONMENT © OECD 2010 123

5. INTERNATIONAL ROAD AND RAIL FREIGHT TRANSPORT: THE IMPACT OF GLOBALISATION ON ACTIVITY LEVELS
exports. In central and South America, there is a broadly equal distribution among the
three product categories, giving this region by far the highest share of exports for
agriculture products. Manufactures have been increasing their share of total trade value
and now account for approximately 70% of the total, reflecting the dominance of the three
main regions where manufactured goods represent the majority of trade value.
The introduction, and subsequent increased scope and/or geographical coverage, of
regional trading blocs have been an important factor influencing international road and rail
transport movements. Table 5.3 shows the major trading blocs involved in merchandise trade,
with the two most significant by far being the European Union (EU) and the North American
Free Trade Agreement (NAFTA). The EU has expanded geographically over time, taking in
27 countries by 2007, and has removed internal trade barriers while developing unified trade
agreements for extra-EU trade. EU countries were involved in 38% of global merchandise trade
by value in 2006. Of this, two-thirds was traded internally between EU countries (WTO, 2007).
By contrast, trade among the three NAFTA countries (Canada, Mexico and the United States)
comprised just over 40% of the total merchandise trade involving those countries, and in many
of the other trading blocs, the internal trade was a smaller proportion of the total involving
member countries. In addition to Europe’s role in global trade (shown in Table 5.1), the
Figure 5.2. Sectoral structure of merchandise exports by region, 2006
Source: Adapted from WTO (2007).
Table 5.3. Involvement of major trading blocs in world merchandise trade% of total world merchandise trade value, 2006
Trading bloc Exports Imports
European Union (EU) 37.5 38.3
North American Free Trade Agreement (NAFTA) 13.9 20.5
Association of Southeast Asian Nations (ASEAN) 6.4 5.5
Gulf Cooperation Council (GCC) 3.9 1.7
European Free Trade Association (EFTA) 2.3 1.7
Southern Common Market (Mercosur) 1.6 1.1
South Asian Preferential Trade Arrangement (SAPTA) 1.3 1.9
Southern African Development Community (SADC) 1.0 1.0
Common Market for Eastern and Southern Africa (COMESA) 1.0 1.0
Source: Adapted from WTO (2007).
0 20 40 60 80 100%
Africa
Middle East
CIS
Cent. and South America
North America
Europe
Asia
Manufactures Fuels and mining products Agriculture
GLOBALISATION, TRANSPORT AND THE ENVIRONMENT © OECD 2010124

5. INTERNATIONAL ROAD AND RAIL FREIGHT TRANSPORT: THE IMPACT OF GLOBALISATION ON ACTIVITY LEVELS
significance of the EU to trade within Europe is clearly very great, reflecting the large number
of small countries that are now able to trade freely with each other.
Road and rail modes are mainly dealing with intra-regional flows, given that two of
the three main inter-regional flows (Asia-North America and Europe-North America) are
not possible by land-based routes, so maritime transport dominates. For the third
(Asia-Europe), land transport is possible, though currently very limited, with the majority
of goods again being moved by sea. Considerable use is made of road and rail as feeder
modes for these inter-regional maritime services, connecting with inland flow origins and
destinations and, in some cases, acting as land-bridges.
At the intra-regional level, road and rail are more often used as the main transport
modes in their own right, although shipping is also significant in some locations. As a
consequence of the geographical distribution of this trade, much of the discussion in this
paper relates to the three regions with significant intra-regional trade, these being Europe,
Asia and North America.
5.3. International trade and transport: Policy and economicsAs noted by Kopp (2006), “there is widespread agreement that the reduction in long-
distance transport and communications costs has been an important determinant of today’s
globalisation”. For a long time it was believed that trade costs were of little importance for
the structure and quantity of global trade; however it is now acknowledged that these costs
are significant (Kopp, 2006).
Trade costs can be influenced by time and duration, or not (Deardorff, 2005). These are
mainly:
● Non-time related costs:
❖ resource cost of transport (the cost of transporting goods from one international
location to another);
❖ insurance;
❖ financial costs of exchange;
❖ other (legal costs, charges for transit procedures, legal or illegal facilitation payments,
etc.).
● Time-related costs:
❖ interest;
❖ storage;
❖ depreciation.
Trade costs (especially transport costs) can reduce the amount of international trade
by making it unprofitable. In such a situation, countries rely more on their own resources
and this deprives them of the gains that flow from international trade.
This is a problem that is often faced by landlocked, developing countries, which as a
result of their geographical disadvantage face “specific challenges in their attempts to
integrate into the global trading system, mainly because goods coming from or going to a
landlocked country are subject to additional trade barriers such as lengthy border-crossing
procedures. In addition, many landlocked developing countries suffer from weak legal and
institutional arrangements, poor infrastructure, a lack of information technology, an
underdeveloped logistics sector and a lack of cooperation with neighbouring transit
GLOBALISATION, TRANSPORT AND THE ENVIRONMENT © OECD 2010 125

5. INTERNATIONAL ROAD AND RAIL FREIGHT TRANSPORT: THE IMPACT OF GLOBALISATION ON ACTIVITY LEVELS
countries. Finally, the distance to markets, as compared to countries with direct access to
seaports, can also be a disadvantage in some cases” (UNCTAD, 2007). The economic growth
of landlocked countries in the period 1992-2002 was 25% lower than that of their transit
neighbouring countries (UNCTAD, 2007).
The costs of transporting goods from one international location to another (the
resource cost of transport) is probably the most important cost of trade for most products.
This cost varies with distance, weight and bulk density of the product, and its handling
requirements in transit. Other costs of international trade include insurance (which is
related to size and value), financing (which varies depending on the elapsed time between
production and receipt of payment), and financial fees (resulting from trading across
national borders and often using more than one currency) (Deardorff, 2005).
Time is a crucial factor in the cost of international trade (Deardorff, 2005). Time is
required to transport the good from its origin to its destination, as well as to load and
unload it, and to process the goods and the vehicle through customs clearance and border
crossings. Given that it takes time to carry out international transport of goods, it is
necessary for companies to hold stock. This stockholding incurs several costs in terms of
warehousing costs, interest payments and depreciation costs associated with physical
deterioration or change in consumer tastes. These time-related costs will vary depending
on the product in question, but make it important to minimise the time-to-market if one
wants to minimise these costs. Therefore, in trying to minimise these time-related costs, it
is important to choose the fastest possible means of transport (obviously taking into
account the resource cost of each mode).
It has been noted that time delays and the variability of transit times are of greater
concern to shippers than direct transport costs, as they affect companies’ ability to meet
agreed delivery schedules and therefore necessitate large stockholding. Hummels (2001)
has used the costs of different modes of transport to infer the costs of time from the
amount that firms are prepared to pay to reduce it. His results suggest that a one-day delay
in shipping leads to an average cost equivalent to a 0.8% tariff.
Trade costs are high. Broadly defined trade costs include all costs incurred in getting a
good to a final user, other than the marginal cost of producing the good itself. A rough
estimate of the representative tax equivalent of trade costs for industrialised countries is
170% of the original value. This estimate includes 74% international trade and transport
costs (which include 21% transport costs, and 44% border-related trade barriers) and 55%
local distribution costs. The international transport costs comprise direct freight transport
costs as well as a 9% tax equivalent of the time value of goods (Anderson and Wincoop, 2004).
International manufacture is becoming increasingly common over time as companies
seek out low wages and land costs to achieve low production costs (Rodrigue and Hesse,
2007). However, this results in the need for long-distance international transport. At the
same time, consumer tastes are changing ever more rapidly, especially in relation to high
value and technology products. In such products it is therefore becoming increasingly
important for producers and retailers to get products to market as quickly as possible.
Technological innovations in transport and ICT are reducing the time-to-market for
products. This is making it possible to manufacture products in distant locations from
market and is also making trade in products possible where it had not been previously
(e.g. air-freighted cut flowers). High-quality, fast and reliable international freight transport
systems, that have resource costs that are sufficiently low to ensure profitability, are
essential in achieving this.
GLOBALISATION, TRANSPORT AND THE ENVIRONMENT © OECD 2010126
5. INTERNATIONAL ROAD AND RAIL FREIGHT TRANSPORT: THE IMPACT OF GLOBALISATION ON ACTIVITY LEVELS
This is opening up new opportunities for international land (road and rail) transport.
Traditionally for international goods movement, air transport has been used for products that
are time sensitive and valuable, and sea has been used for lower-value products that are less
time sensitive. However, ever-longer international road and rail transport options are
becoming viable as a result of infrastructure improvements and international agreements,
resulting in expanding land-based international transport volumes. These land-based modes
are likely to increase their modal share of international goods movements as they offer
services that are cheaper (but slower) than air freight and faster (but more expensive) than sea.
However, the quantity of goods transported internationally by land modes is still very
small in comparison with domestic road and rail freight movements.
5.4. Other considerations in international trade of physical goods
Customs clearance and border crossings
Time-consuming and complex customs-clearance and border-crossing procedures can
cause significant journey time delays and poor journey time reliability on international road
movements. They can also impose additional costs, both in terms of actual fees and charges
for services provided, unofficial payments (i.e. bribes), and as a result of time delays and
unreliability in delivery. At worst, several days can be lost at these border points. As
discussed in Section 5.3, these costs increase the total costs of traded goods and can have a
negative impact on competitiveness. One study mentions that the direct and indirect costs
associated with border crossings can be as much as one quarter of total transport costs
(Chamber of Commerce of the United States, 2006). These problems are particularly acute in
some central Asian countries, with suggestions that road freight trips to these countries can
be up to three times as expensive, and take up to twice as long, as in an ideal situation
(i.e. with straightforward border crossings, low fees for border services, no visa difficulties
and no unofficial payments) (Chamber of Commerce of the United States, 2006).
Landlocked countries face particular difficulties in relation to border-crossing delays
and costs. The ESCAP region (Asia and the Pacific) contains 12 of the world’s 30 landlocked
developing countries. For most countries in this region, transit transport is
“most heavily constrained by excessive delays and costs incurred at border crossings.
Time-consuming border crossing and customs procedures, complicated non-standard
documentation, poor organisation and a lack of skills in the transport sector are some of
the major contributory factors. Overlapping obligations brought about by several
bilateral, trilateral and subregional agreements, the need for multiple bilateral
agreements and the lack of a harmonised legal regime for transit transport, including
arrangements for transit fees, further compound the complexity of the transit transport
process” (UNESCAP, 2003).
UNESCAP carried out a series of case studies in 2003 “to identify the common issues and
concerns related to physical and non-physical barriers that characterise the transit transport
systems of landlocked and transit developing countries in the ESCAP region” (UNESCAP,
2003).
The case study countries represented least developed countries and economies in
transition. Figure 5.3 shows a comparison of border crossing times and Figure 5.4 a
comparison of border crossing costs in these case studies. The results showed that time and
costs associated with border crossings ranged between 3 hours and 120 hours, and between
USD 100 to around USD 650.2
GLOBALISATION, TRANSPORT AND THE ENVIRONMENT © OECD 2010 127
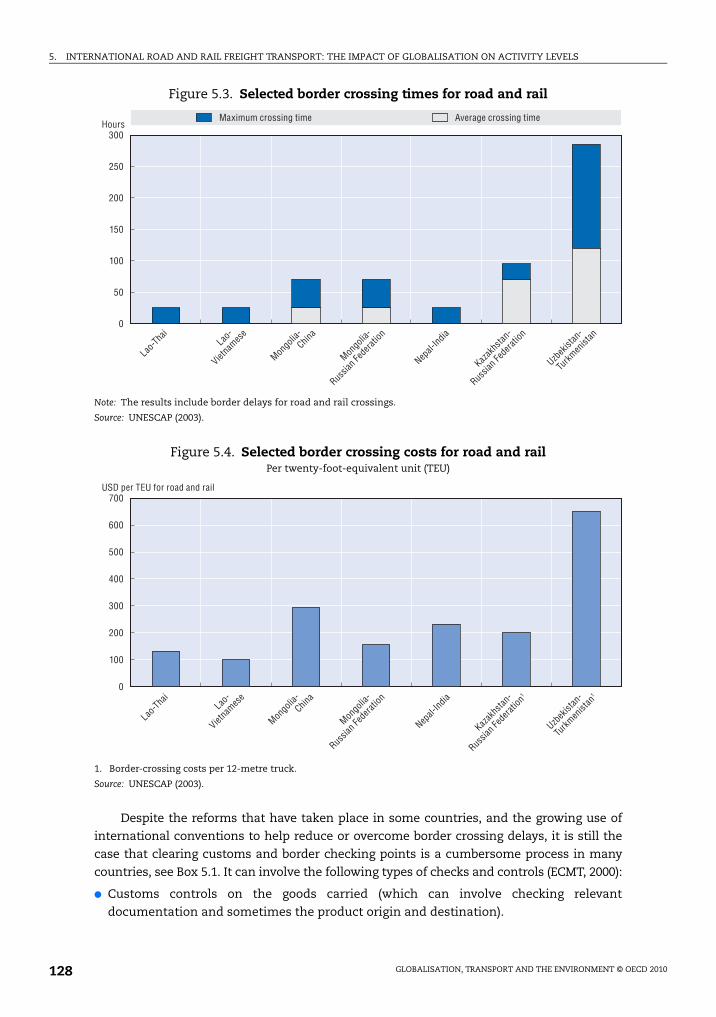
5. INTERNATIONAL ROAD AND RAIL FREIGHT TRANSPORT: THE IMPACT OF GLOBALISATION ON ACTIVITY LEVELS
Despite the reforms that have taken place in some countries, and the growing use of
international conventions to help reduce or overcome border crossing delays, it is still the
case that clearing customs and border checking points is a cumbersome process in many
countries, see Box 5.1. It can involve the following types of checks and controls (ECMT, 2000):
● Customs controls on the goods carried (which can involve checking relevant
documentation and sometimes the product origin and destination).
Figure 5.3. Selected border crossing times for road and rail
Note: The results include border delays for road and rail crossings.
Source: UNESCAP (2003).
Figure 5.4. Selected border crossing costs for road and railPer twenty-foot-equivalent unit (TEU)
1. Border-crossing costs per 12-metre truck.
Source: UNESCAP (2003).
300
250
200
150
100
50
0
Lao
-Thai
Lao
-
Viet
names
e
Mon
golia
-
Chin
a
Mon
golia
-
Rus
sian F
edera
tion
Kaz
akhs
tan-
Rus
sian F
edera
tion
Uzb
ekist
an-
Turkm
enist
an
Nep
al-Ind
ia
Hours Maximum crossing time Average crossing time
700
600
500
400
300
200
100
0
Lao
-Thai
Lao
-
Viet
names
e
Mon
golia
-
Chin
a
Mon
golia
-
Rus
sian F
edera
tion
Kaz
akhs
tan-
Rus
sian F
edera
tion1
Uzb
ekist
an-
Turkm
enist
an1
Nep
al-Ind
ia
USD per TEU for road and rail
GLOBALISATION, TRANSPORT AND THE ENVIRONMENT © OECD 2010128
5. INTERNATIONAL ROAD AND RAIL FREIGHT TRANSPORT: THE IMPACT OF GLOBALISATION ON ACTIVITY LEVELS
● Inspections of goods (this can include sampling and testing).
● Vehicle checks (which can involve safety and environmental standards, and licensing).
● Immigration controls (including passport and visa checks, and possible vehicle searches
for illegal immigrants).
● The collection of taxes, fees and duties associated with the above checks and controls.
Security considerations
As UNECE (2008) noted, transport systems are vulnerable to being used for, or being the
target of, terrorism because they have not been designed to cope with security threats, and
traditionally the focus has been on smooth, fast and reliable flows, while achieving certain
safety rather than security standards. In addition, road transport infrastructure is easily
accessible and often lacking surveillance (such as major roads, bridges and tunnels), and
road goods vehicles are readily available and can be used as either a means of conveying
weapons or as weapons themselves. Also, complexity presents major problems. Supply
Box 5.1. Border problems
The lack of a unified procedure in customs procedures and of a single documentexplaining all the necessary steps and payments required can worsen the problemsexperienced and increase the potential for the extortion of unofficial payments. Limiteduse of ICT in customs clearance can also cause delays at borders, as can visa policies.Recent examples include:
● The Former Yugoslav Republic of Macedonia imposes a EUR 100 payment for each tariffline inserted in the certificate of import for all imports of agricultural goods that benefitfrom tariff preferences.
● Local authorities in Romania have discretion to impose additional taxes, e.g. forenvironmental reasons. Such taxes are highly variable and non-transparent.
● In Uzbekistan, ten different documents, issued by various departments and ministries,are required for customs clearance, prolonging custom procedures for up to two to threemonths.
● In the Republic of Moldova, several government agencies are present at the border, eachof them representing a different ministry and collecting fees.
● Truck drivers cannot obtain a visa for Bulgaria at the border.
● Strict visa requirements for business visitors including transport operators can causesignificant delays for exports to Serbia.
● Insufficient information technology equipment combined with inadequate training ofcustom staff delays customs clearance and traffic, throughout the region but especiallyin the Republic of Montenegro, Albania, Bosnia and Herzegovina.
The Logistics Performance Index (LPI) Survey has highlighted that “the rating fortransparency of border processes consistently declines along with LPI scores: … poorperformers in the LPI were also poor performers on transparency of border processes”.Only 10% of responses stated that solicitation of informal payments was common in high-income countries, whereas more than 50% of responses indicated that such informalpayments were common in low-income countries.
Sources: UNECE (2006); Arvis et al. (2007).
GLOBALISATION, TRANSPORT AND THE ENVIRONMENT © OECD 2010 129
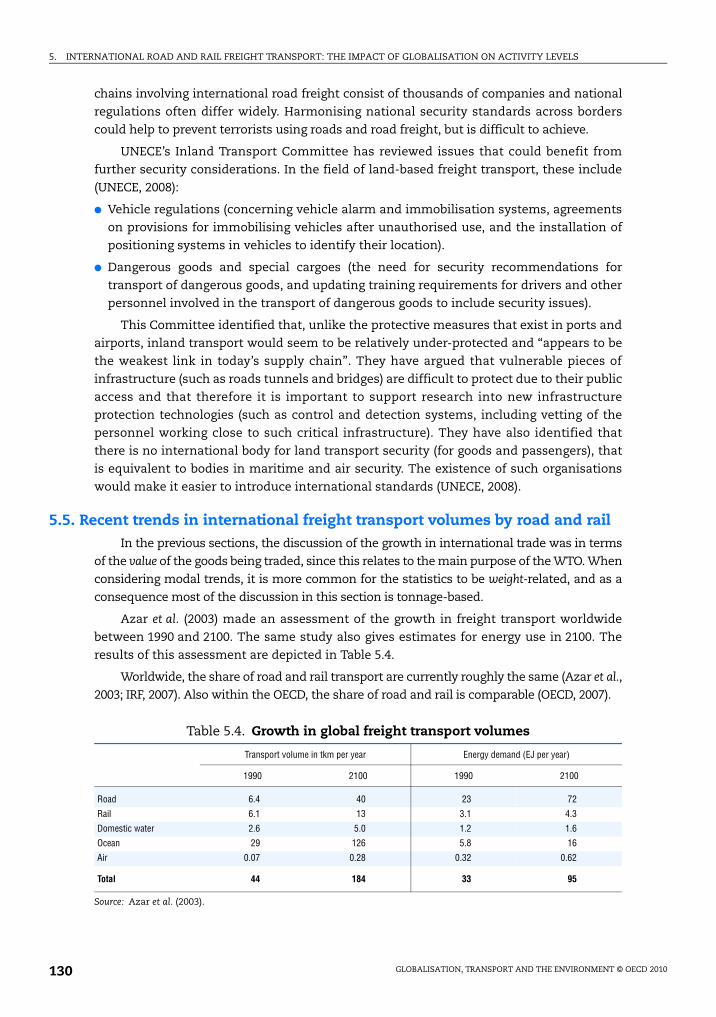
5. INTERNATIONAL ROAD AND RAIL FREIGHT TRANSPORT: THE IMPACT OF GLOBALISATION ON ACTIVITY LEVELS
chains involving international road freight consist of thousands of companies and national
regulations often differ widely. Harmonising national security standards across borders
could help to prevent terrorists using roads and road freight, but is difficult to achieve.
UNECE’s Inland Transport Committee has reviewed issues that could benefit from
further security considerations. In the field of land-based freight transport, these include
(UNECE, 2008):
● Vehicle regulations (concerning vehicle alarm and immobilisation systems, agreements
on provisions for immobilising vehicles after unauthorised use, and the installation of
positioning systems in vehicles to identify their location).
● Dangerous goods and special cargoes (the need for security recommendations for
transport of dangerous goods, and updating training requirements for drivers and other
personnel involved in the transport of dangerous goods to include security issues).
This Committee identified that, unlike the protective measures that exist in ports and
airports, inland transport would seem to be relatively under-protected and “appears to be
the weakest link in today’s supply chain”. They have argued that vulnerable pieces of
infrastructure (such as roads tunnels and bridges) are difficult to protect due to their public
access and that therefore it is important to support research into new infrastructure
protection technologies (such as control and detection systems, including vetting of the
personnel working close to such critical infrastructure). They have also identified that
there is no international body for land transport security (for goods and passengers), that
is equivalent to bodies in maritime and air security. The existence of such organisations
would make it easier to introduce international standards (UNECE, 2008).
5.5. Recent trends in international freight transport volumes by road and railIn the previous sections, the discussion of the growth in international trade was in terms
of the value of the goods being traded, since this relates to the main purpose of the WTO. When
considering modal trends, it is more common for the statistics to be weight-related, and as a
consequence most of the discussion in this section is tonnage-based.
Azar et al. (2003) made an assessment of the growth in freight transport worldwide
between 1990 and 2100. The same study also gives estimates for energy use in 2100. The
results of this assessment are depicted in Table 5.4.
Worldwide, the share of road and rail transport are currently roughly the same (Azar et al.,
2003; IRF, 2007). Also within the OECD, the share of road and rail is comparable (OECD, 2007).
Table 5.4. Growth in global freight transport volumes
Transport volume in tkm per year Energy demand (EJ per year)
1990 2100 1990 2100
Road 6.4 40 23 72
Rail 6.1 13 3.1 4.3
Domestic water 2.6 5.0 1.2 1.6
Ocean 29 126 5.8 16
Air 0.07 0.28 0.32 0.62
Total 44 184 33 95
Source: Azar et al. (2003).
GLOBALISATION, TRANSPORT AND THE ENVIRONMENT © OECD 2010130

5. INTERNATIONAL ROAD AND RAIL FREIGHT TRANSPORT: THE IMPACT OF GLOBALISATION ON ACTIVITY LEVELS
Table 5.4 shows that whereas the growth in freight transport volume is expected to be
strongest in road transport, the growth in rail transport is expected to be much lower than
the average. Despite an expected improvement in fuel efficiency, the global energy use of
freight transport is expected to triple.
European Union (EU)
Assessments of the EEA indicate that freight transport volumes in Europe are growing
strongly, outpacing economic growth (EEA, 2008a). This growth in transport volume,
mainly in road freight, is the main driver behind the increasing energy demand of freight
transport. Road freight transport volume in the European Union is expected to grow
78% between 2000 and 2030. This means an even stronger growth than in the past 20 years
(Smokers et al., 2007).
For the 11 EU member states with consistent data, the proportion of tonne kilometres for
international road haulage increased slightly from 22% in 1995 to 26% in 2005 (Eurostat, 2004,
2007a). This represented an increase of 52% in absolute terms, given the overall growth in road
activity during this period. Of the cross-border volume for this group of member countries, 90%
in 2005 was between adjacent countries, so the incidence of cross-trade (i.e. transiting one or
more intermediate countries) was low. For the EU25 countries (excluding Greece and Malta),
30% of road freight volumes in 2005 were cross-border in nature, with 15% of the cross-border
volume being cross-trade, representing the greater incidence of transit traffic in certain eastern
European countries (Eurostat, 2007a). Of the cross-border flows, 94% of the volume in 2005 was
between EU members and, of the remaining amount, most was to/from Switzerland, Norway
and the Russian Federation. International road freight transport in the European Union grows
twice as fast as national transport volumes: 25% against 12% growth between 2000 and 2005
(European Commission, 2007b).
By contrast, international flows are more significant in the rail market. Some 51% of
rail freight volumes in the 25 EU countries in 2005 were cross-border in nature (Eurostat,
2007b). As with road, the vast majority of this volume was between adjacent countries,
with just 20% of the total international volume transiting intermediate countries. While no
consistent statistics over time exist at the European level, analysis of trends in individual
countries reveals the growing share of international flows for national rail systems. For
example, international rail freight increased from 37% of all rail freight in Germany in 1995
to 47% in 2005; in the Netherlands, the increase was from 76% to 79%; and in France, the
share went up from 30% to 33% (Eurostat, 2003, 2007b).
North America
Given its central position between Canada and Mexico, the United States is involved in
all intra-North American trade flows. The North American Transport Statistics Database
(NATSD) does not contain detailed and consistent time series data relating to intra-North
American trade by transport mode; these data have been published only since 2004
(NATSD, 2007). Table 5.5 summarises the road and rail freight flows between the United
States and Canada and Mexico in 2006. These two modes are more dominant for exports
from the US, where 60% to 65% of tonnage is by road or rail, whereas water transport and,
in the case of Canada, pipeline, are important modes for imports to the US.
In North America, the share of international transport in total road freight transport is
much smaller: about 8% (US Department of Transportation, 2006; IRF, 2007). The share of
international rail transport in total freight rail transport in North America is only 5%. These
GLOBALISATION, TRANSPORT AND THE ENVIRONMENT © OECD 2010 131

5. INTERNATIONAL ROAD AND RAIL FREIGHT TRANSPORT: THE IMPACT OF GLOBALISATION ON ACTIVITY LEVELS
small shares can be explained by the small number of (very large) countries involved:
international surface transport in North America is limited to transport between Canada,
the United States and Mexico.
In 2002, international road freight accounted for just 2% of total road freight lifted to,
from and within the United States. The corresponding figure for international rail was 6%
(measured in tons lifted). In combination, road and rail represented 32% of international
tons lifted to and from the United States (imports and exports combined) (Office of Freight
Management and Operations, 2007).3
Europe to and from Asia
The modal split differs a lot among countries. In the Russian Federation, the rail
freight transport volume is several times larger than the road freight transport volume, and
also in China, the share of rail is much higher than that of road.4
Travel distances between Europe and Asia are generally far shorter by land than they
are by sea. This is especially true if the origin and/or destination are inland. Rail services
from China to Europe via central Asia that take approximately 20 days could be provided,
whereas this takes approximately 6 weeks by sea. It has been estimated that travelling
from Europe to Asia by road would take approximately two weeks (ECMT, 2006).
At present, the major trans-Asia land routes are rail routes, including the Trans-Siberian,
the TRACECA corridor, and the southern route via Turkey and Iran. Road routes can be
preferable to rail routes in Asia in terms of the denser coverage they provide to larger towns. In
addition, the physical terrain in the south of the continent is often better suited to road than
rail.
China is currently developing a countrywide network of road and rail infrastructure,
that will link up with connections to Kazakhstan, Mongolia and the Russian Federation.
Land transport between Europe and Asia is one of the oldest trade routes in the world (the
Silk Route). However, over time long distance freight flows on this route were largely replaced
by maritime transport. The re-opening of the border between China and Kazakhstan for
commercial trade has resulted in the recommencing of long distance freight flows by (road and
rail) land between the two continents. However, volumes of intercontinental freight flows
remain relatively small at present. These land routes are mostly used at present for the
transport of commodities such as coal, agricultural products, iron and oil, and bulk goods. Only
very limited quantities of containerised cargo is transported on these land routes. Table 5.6
shows the estimated modal split for containers between Europe and China. This reflects that
maritime transport still dominates these container flows at present. Rail transport (especially
Table 5.5. US trade with Canada and Mexico by road and rail, 2006
Exports from US Imports to US
Mode share (%) tons (m) tons (m) Mode share (%)
Canada
Road 42 59 62 21
Rail 21 30 76 26
Mexico
Road 38 31 28 20
Rail 26 21 11 8
Source: Adapted from NATSD (2007).
GLOBALISATION, TRANSPORT AND THE ENVIRONMENT © OECD 2010132

5. INTERNATIONAL ROAD AND RAIL FREIGHT TRANSPORT: THE IMPACT OF GLOBALISATION ON ACTIVITY LEVELS
the Trans-Siberian Railway) was estimated to account for approximately 3% to 4% of these
containerised freight flows in 2005, and road freight was estimated to represent less than 1% of
these containerised flows (Chamber of Commerce of the United States, 2006).
It has been estimated by industry sources that in 2005, approximately 0.2 million tons of
cargo (12 000 trips) crossed the China-Kazakhstan border on trucks. Freight volumes
transported by road between China and the Russian Federation were estimated at 1.8 million
tons (0.2 million truck trips) in 2005 (which represents an 80% increase over five years)
(Chamber of Commerce of the United States, 2006). These freight flows by road are likely to
increase in the coming years as a result of infrastructure improvements, including
improvements to roads, freight terminals and customs facilities.
5.6. Factors influencing recent trends in international road freight transport
Infrastructure
The basic infrastructure for international road transport is available, but “missing links”
constrain route choice. In addition, insufficient capacity on some international transport
corridors and the poor quality of infrastructure add to the cost and time of international road
transport. There is a general lack of infrastructure facilities, such as inland container depots,
particularly at border crossings, to support the consolidation and distribution of goods and
trans-shipment between road and rail services (UNESCAP, 2003). Examples of international
road infrastructure issues are highlighted below.
Figure 5.5 shows the latest version of the International E-road Network in Europe (a
European road numbering system). It provides a map of the road routes followed by the
traffic arteries defined in Annex I to the European Agreement on Main International Traffic
Arteries (AGR) signed at Geneva in November 1975 (UNECE, 2007). The AGR was extended
in 2000 to include the E-road Network for the new UNECE member countries in the
Caucasus and central Asia. This resulted in the international road network in these
countries, which extend right up to the borders with China, also being ascribed “E”
numbers. As well as establishing a coherent road network, the AGR sets in place minimum
technical requirements to which E-roads should be constructed.
Asia also has a dense road network which links major cities, especially in the southern
part of the continent (including India, Pakistan and the South-East Asian peninsula). Some
of these road routes run parallel to East-West rail lines in the north of the continent. The
Asian Highway (see Figure 5.6) provides road transport infrastructure linkages to and
through the region. It is a network of 141 000 km of standardised roadways joining 32 Asian
countries with linkages to Europe.
Whilst the construction and improvement of road infrastructure is important in the
development of international road freight, there are additional factors necessary in order
to create a successful and efficient road network. This includes standardisation and
Table 5.6. Estimated transport of full-load containers between Europe and China2005, million full-load TEUs
Westbound Eastbound Total
Sea transport 4.5 2.5 7.0
Rail < 0.2 < 0.1 < 0.3
Road (truck) < 0.03 < 0.03 < 0.06
Source: Chamber of Commerce of the United States (2006).
GLOBALISATION, TRANSPORT AND THE ENVIRONMENT © OECD 2010 133
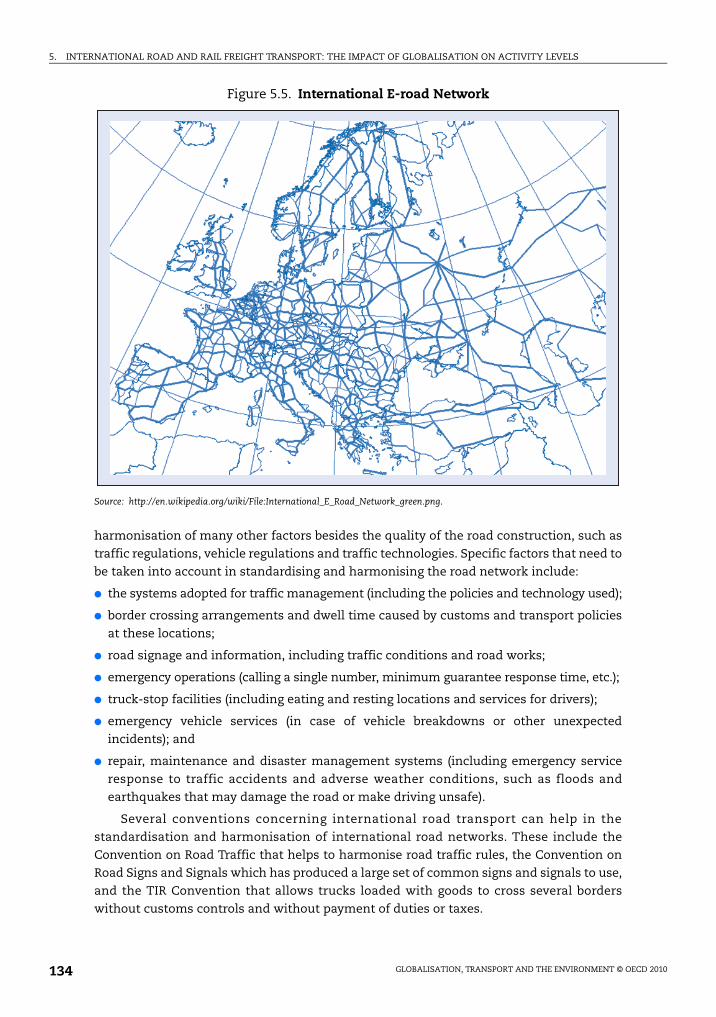
5. INTERNATIONAL ROAD AND RAIL FREIGHT TRANSPORT: THE IMPACT OF GLOBALISATION ON ACTIVITY LEVELS
harmonisation of many other factors besides the quality of the road construction, such as
traffic regulations, vehicle regulations and traffic technologies. Specific factors that need to
be taken into account in standardising and harmonising the road network include:
● the systems adopted for traffic management (including the policies and technology used);
● border crossing arrangements and dwell time caused by customs and transport policies
at these locations;
● road signage and information, including traffic conditions and road works;
● emergency operations (calling a single number, minimum guarantee response time, etc.);
● truck-stop facilities (including eating and resting locations and services for drivers);
● emergency vehicle services (in case of vehicle breakdowns or other unexpected
incidents); and
● repair, maintenance and disaster management systems (including emergency service
response to traffic accidents and adverse weather conditions, such as floods and
earthquakes that may damage the road or make driving unsafe).
Several conventions concerning international road transport can help in the
standardisation and harmonisation of international road networks. These include the
Convention on Road Traffic that helps to harmonise road traffic rules, the Convention on
Road Signs and Signals which has produced a large set of common signs and signals to use,
and the TIR Convention that allows trucks loaded with goods to cross several borders
without customs controls and without payment of duties or taxes.
Figure 5.5. International E-road Network
Source: http://en.wikipedia.org/wiki/File:International_E_Road_Network_green.png.
GLOBALISATION, TRANSPORT AND THE ENVIRONMENT © OECD 2010134
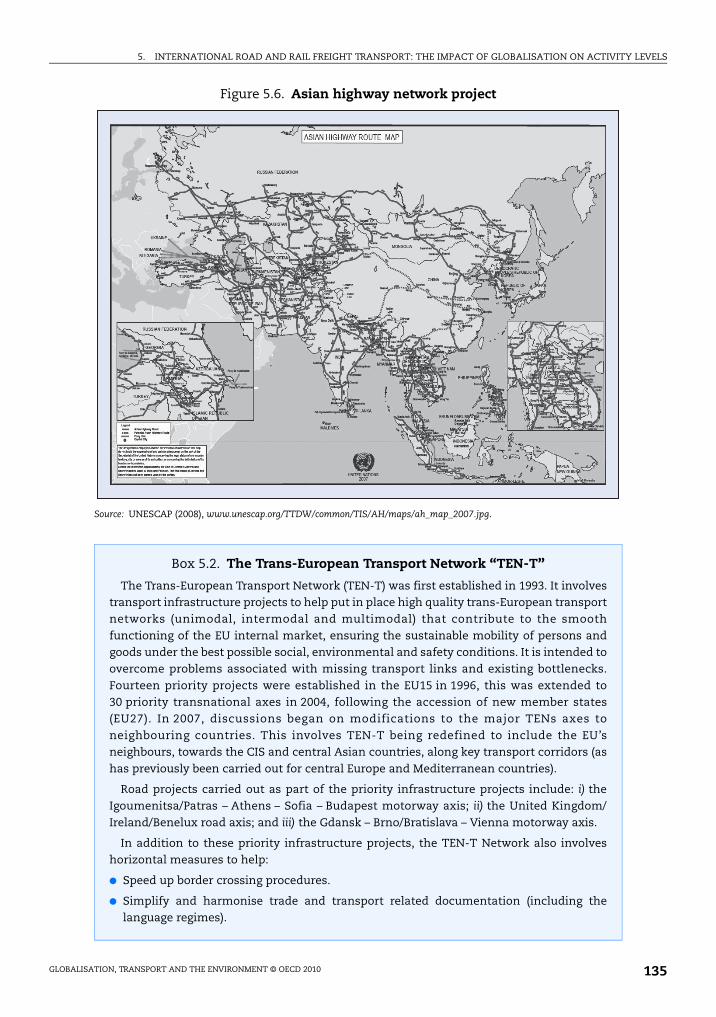
5. INTERNATIONAL ROAD AND RAIL FREIGHT TRANSPORT: THE IMPACT OF GLOBALISATION ON ACTIVITY LEVELS
Figure 5.6. Asian highway network project
Source: UNESCAP (2008), www.unescap.org/TTDW/common/TIS/AH/maps/ah_map_2007.jpg.
Box 5.2. The Trans-European Transport Network “TEN-T”
The Trans-European Transport Network (TEN-T) was first established in 1993. It involvestransport infrastructure projects to help put in place high quality trans-European transportnetworks (unimodal, intermodal and multimodal) that contribute to the smoothfunctioning of the EU internal market, ensuring the sustainable mobility of persons andgoods under the best possible social, environmental and safety conditions. It is intended toovercome problems associated with missing transport links and existing bottlenecks.Fourteen priority projects were established in the EU15 in 1996, this was extended to30 priority transnational axes in 2004, following the accession of new member states(EU27). In 2007, discussions began on modifications to the major TENs axes toneighbouring countries. This involves TEN-T being redefined to include the EU’sneighbours, towards the CIS and central Asian countries, along key transport corridors (ashas previously been carried out for central Europe and Mediterranean countries).
Road projects carried out as part of the priority infrastructure projects include: i) theIgoumenitsa/Patras – Athens – Sofia – Budapest motorway axis; ii) the United Kingdom/Ireland/Benelux road axis; and iii) the Gdansk – Brno/Bratislava – Vienna motorway axis.
In addition to these priority infrastructure projects, the TEN-T Network also involveshorizontal measures to help:
● Speed up border crossing procedures.
● Simplify and harmonise trade and transport related documentation (including thelanguage regimes).
GLOBALISATION, TRANSPORT AND THE ENVIRONMENT © OECD 2010 135
5. INTERNATIONAL ROAD AND RAIL FREIGHT TRANSPORT: THE IMPACT OF GLOBALISATION ON ACTIVITY LEVELS
Policy/regulation
Agreements between countries
International road freight operations by definition involve goods vehicles moving
between two or more countries as part of a delivery or collection. Some international trips
can involve the goods passing through (i.e. transiting) many different countries in order to
get from the point of collection to the point of delivery. Different countries tend to have
developed varying national rules governing goods vehicles, goods movement and driver
regulations, and have typically had differing views and approaches to international road
freight. Over time, this has resulted in the establishment of conventions that govern
international road freight operations, thereby allowing vehicles to pass between and
through countries in carrying out their work.
The international community has, over the years, adopted several international legal
instruments that contain provisions intended to assist international road freight operations,
including gaining access to seaports via transit traffic through neighbouring countries. The
four main legal instruments addressing transit traffic and customs transit are (UNCTAD, 2007):
● Convention and Statute on Freedom of Transit, 1921 (entry into force 31 October 1922;
50 parties).
● General Agreement on Tariffs and Trade (GATT), 1947, now part of GATT 1994 (provisional
entry into force 1 January 1948; 150 members of the World Trade Organization [WTO]).
● Convention on Transit Trade of Land-Locked States, 1965 (entry into force 9 June 1967;
38 states parties).
● United Nations Convention on the Law of the Sea, 1982 (entry into force 16 November 1994;
155 states parties).
In addition, the General Agreement on Trade in Services (GATS) extends the GATT’s
principles of freer and fairer trade in goods to services as well, which includes freight
companies looking to do business abroad (Latrille, 2007).
Each of the above instruments is intended to address different issues concerning
transit traffic and customs transit. Thus there are different definitions of transit used in
each. GATT, in its Article V, and the Convention on Transit Trade of Land-Locked States only
include goods (including baggage) in the definitions of transit. However, the Convention
and Statute on Freedom of Transit and the United Nations Convention on the Law of the
Sea also include passengers. These latter two agreements also include the concept of
trans-shipment as a type of transit.
Box 5.2. The Trans-European Transport Network “TEN-T” (cont.)
● Implement compatible new technologies.
● Put in place measures to improve safety and security in all transport modes.
● Enhance technical and administrative interoperability.
Specific horizontal measures for roads include: designing and implementing measuresto improve road safety by addressing driver behaviour, vehicle safety and roadinfrastructure safety; and gradually upgrading the road network along the major axes totake goods vehicles of up to 11.5 tonne axle-weight and up to four metres high.
Sources: ECMT (2006), Fontaine (2007), European Commission (2005).
GLOBALISATION, TRANSPORT AND THE ENVIRONMENT © OECD 2010136

5. INTERNATIONAL ROAD AND RAIL FREIGHT TRANSPORT: THE IMPACT OF GLOBALISATION ON ACTIVITY LEVELS
In addition, there are many other international legal conventions and agreements that
have been established by various intergovernmental bodies which aim to facilitate
international road transport and transit traffic. Each of these conventions cover different
themes in international transport operations, such as the transport of dangerous goods,
the facilitation of crossing of borders, or the contract of carriage for road or rail transport.
There are also other legal conventions that are mode-specific, addressing issues such as
the harmonisation of road signs and signals, or the transport of goods by rail.
International legal instruments are complementary to regional, corridor and bilateral
transport and transit agreements, and are often referred to in such agreements on
transport as well as in those on infrastructure, storage and general trade terms (UNCTAD,
2007). Several regional co-operation organisations have established transit and/or
transport agreements. Many countries have traditionally entered into bilateral agreements
on particular aspects of co-operation. In road transport, such agreements have often been
needed to allow a transport-operator in one country to carry out bilateral transport
operations, third-country transport operations or transit transport operations through
another country. A transit corridor agreement is an agreement concerning a designated
route between two or more countries along which the corridor countries have agreed to
apply specified procedures. These agreements tend to be very focused on the corridor and
transit issues, such as infrastructure, customs, border crossings and vehicles. An example
of this type of arrangement is the Walvis Bay Corridor Group which was established
in 2000. It brings together public and private stakeholders along four transport corridors in
southern Africa, all connecting with the port of Walvis Bay in Namibia.
One of the main issues for land-based transport systems that need to cross borders is
clearly the complexity of international agreements and the time taken to achieve these
agreements. This has the effect of inhibiting some of the potential initiatives that could be
taken from a commercial and operational perspective. As the following section notes,
when transport regimes are liberalised, there are many more opportunities to provide
services and the operations themselves can become more efficient.
Liberalisation of international road freight transport
The European Union provides an example of the total liberalisation of international road
freight transport movements between member states. The origin of the liberalisation of
trade and freight transport movements in the European Union was in the Treaty of Rome and
the formation of the European Economic Community. This treaty provided for the
establishment of a common transport policy, based on principles of free market economics,
which was intended to remove obstacles to free competition between transport operators
from different countries. Multilateral Community authorisations were introduced in 1969,
which gradually replaced bilateral agreements between countries. The establishment of the
Single European Market was the catalyst for full liberalisation in international road freight,
with the removal of these multilateral authorisations and the introduction of European
Community licences. Full liberalisation of international road freight was completed by 1998.
Operators based in a member state only need to comply with two requirements to be able to
carry goods between any EU countries: i) to be recognised as a professional road transport
operator; and ii) to hold a European Community licence. To be recognised as a professional
operator it is necessary to meet three criteria: good repute, financial standing and
professional competence. Any operator who meets these requirements, and who meets any
GLOBALISATION, TRANSPORT AND THE ENVIRONMENT © OECD 2010 137
5. INTERNATIONAL ROAD AND RAIL FREIGHT TRANSPORT: THE IMPACT OF GLOBALISATION ON ACTIVITY LEVELS
other national market access regulations, obtains a Community licence. This then allows the
operator to carry out international transport operations in the entire geographical area of the
EU (ECMT, 2005).
The European Commission has put in place harmonised social regulations to ensure
that full liberalisation does not lead to competition distortions brought about by national
differences in factors such as labour rates. These regulations cover issues such as working
hours, driving time and rest periods for drivers, periodic technical inspection of motor
vehicles and their trailers.
Operations
Growth in world trade together with road and rail infrastructure improvements have
made the possibility of land-based international freight solutions better over time. In the
case of the EU, deregulation, the abolition of internal frontiers and harmonisation of fiscal
and technical standards, together with the introduction of the euro, have also helped to
boost internal international trade. In other countries and regions, better organised and
faster border controls, together with trade and transport agreements, have facilitated
growth in land-based international freight movements, albeit to a lesser extent. These
changes have made it simpler for logistics service providers to participate in international
road and rail solutions.
Logistics service providers can enter into foreign markets by establishing operating
centres in other countries and gradually increasing their networks. However, rather than
follow this evolutionary and somewhat slow route to growth in foreign markets, some
firms prefer the prospect of mergers, takeovers or strategic trading alliances with operators
based in other European countries.
The growing internationalisation of business has forced companies providing logistics
services to consider their own strategies to meet these new needs. Service providers need
to determine the extent to which they can meet all the service requirements of a European
business or whether they can realistically only meet part of those needs. In many cases,
there remains at present a potential mismatch between the logistics demands of European
companies and the ability of any single service provider to meet these demands. This often
results in disappointment when a manufacturer decides to rationalise its logistics network
and reduce the number of service providers it deals with at a European level. In many
cases, the manufacturer finds that there are few logistics service providers that wish to
take on the commitment of handling all their European activities.
Providers of logistics services need to be concerned with two dimensions to their activities
in the first instance: geographical scope and range of services. These two dimensions highlight
how challenging it really is for the logistics service company to be able to provide one-stop
shopping for a customer. Some companies already provide what can be described as European
services, providing the long-distance links in a network used by manufacturing companies.
This provision of services is evident in the case of airlines, shipping lines, freight forwarders
and integrators. It is clearly at the level of local and national distribution that
internationalisation of service provision has been slowest to develop.
A broad range of logistics activities can be provided by logistics service providers. Freight
transport and warehousing services have been widely available for many decades, together
with documentation services to support the flow of these products (e.g. delivery and customs
documentation). However, in recent years, logistics service providers have begun to offer an
GLOBALISATION, TRANSPORT AND THE ENVIRONMENT © OECD 2010138
5. INTERNATIONAL ROAD AND RAIL FREIGHT TRANSPORT: THE IMPACT OF GLOBALISATION ON ACTIVITY LEVELS
ever-expanding range of services, such as final assembly of products, inventory
management, product and package labelling, product tracking and tracing along the supply
chain, order planning and processing, and reverse logistics systems (which tackle the
collection and recovery of end-of-life products and used packaging in the supply chain).
Despite a period of uncertainty about the benefits of scale for logistics service
providers, there have been some important developments in the last few years. Larger
logistics service providers have grown mainly through merger and acquisition, and appear
to be committed to developing more global capabilities.
The very different nature of global markets means that logistics providers wishing to
meet growing demand for international services adopt suitable and appropriate
approaches for different markets. International transport companies engaged in cross-
border work already understand that strategies may need to be tailored to the particular
country of operation.
In deciding how to take advantage of the new global opportunities, logistics service
providers need to be clear about which of the following strategies they wish to adopt:
● Strategy A (Global) – providing a worldwide service, offering distribution both within and
between a number of countries.
● Strategy B (Multi-domestics) – providing national services in several countries.
● Strategy C (Global-linkers) – providing a network (or part of a network) of mainly
international services between major global markets.
Clearly the most ambitious strategy is the first – to provide a truly global service. Several
major logistics service providers are working towards this, but it is a challenge. The
foundations for the multi-domestic strategy appear to lie in the successful duplication of
domestic services in other countries. The original services are, of course, adapted as required.
Crimes against road freight
International road freight drivers are prone to criminal attacks on their vehicles, the
goods they carry and themselves. The fact that such operations are taking place in foreign
countries, and sometimes in isolated locations, makes drivers more prone to such attacks
than in domestic operations.
The IRU and ITF (formerly ECMT) carried out a study into attacks on international road
freight drivers in 2005/6 (IRU, 2008). This research, involving a survey of drivers, transport
companies and transport authorities in 35 European and central-Asian countries,
documented the type and scale of attacks on international good vehicle drivers operating
across Europe and how governments are addressing this problem. The work included
1 300 face-to-face interviews and 700 replies to a web questionnaire. Respondents were
asked about their experiences over the period 2000 to 2005. The main findings included
(IRU, 2008; Crass, 2007):
● 17% of all drivers interviewed have suffered an attack during the five-year period;
● 30% of attacked drivers have been attacked more than once;
● 21% of drivers were physically assaulted;
● 60% of the attacks targeted the vehicle and its load, whilst the remaining 40% were
related to the theft of the driver’s personal belongings.
GLOBALISATION, TRANSPORT AND THE ENVIRONMENT © OECD 2010 139
5. INTERNATIONAL ROAD AND RAIL FREIGHT TRANSPORT: THE IMPACT OF GLOBALISATION ON ACTIVITY LEVELS
Technology
This section discusses two aspects of technology that influence international road
transport. It explores issues relating to vehicle technologies and the rapid developments in
information and communication technologies. Clearly these latter developments have
major implications for the efficiency and commercial possibilities of longer-distance
international road freight operations.
Vehicle technology
The UNECE has developed two key agreements that relate to vehicle technology for
international road freight trips; these are open to all UN member countries (Ferrer, 2005):
● The “Agreement Concerning the Adoption of Uniform Technical Prescriptions for
Wheeled Vehicles, Equipment, and Parts which can be Fitted and/or be used on Wheeled
Vehicles and Conditions for Reciprocal Recognition of Approvals Granted on the Basis of
these Prescriptions” (referred to as the “1958 Agreement”).
Box 5.3. The Beijing-Brussels international truck caravan
A 12 000 km caravan by goods vehicles took place in 2005. It started at the InternationalRoad Transport Union (IRU) Euro-Asian Road Transport Conference on 27 September andarrived in Brussels on 17 October. Road transport carriers from several countriesparticipated in the project.
The project set out to demonstrate that road transport is an effective means of shippingcargo by land between Europe and the countries of the Asia-Pacific region. It was initiatedby KAZATO, IRU’s member association in Kazakhstan, and supported by governments,international institutions as well as road transport associations.
The caravan started from Horgos in China (with loaded containers delivered by Chinesecarriers). The containers (under TIR carnets) then commenced their journeys on Kazakh,Latvian, Lithuanian, Polish and Russian trucks.
IRU President Paul Laeremans said that the caravan had “proven that freight can beefficiently transported from China to CIS countries and further to the EU within just one-third of the time it would take by sea. This caravan demonstrates that road transport, in anincreasingly competitive globalised world economy, is no longer just a means of carriage,but rather an irreplaceable production tool for all companies and economies”.
Peter-Hans Keilbach, Senior Representative of the US Chamber of Commerce said that“trade between the Asia-Pacific region and Europe exceeds USD 300 billion per year.American companies invested over USD 4 billion in China in 2004 and this number growsevery year. Total US assets in Europe are worth nearly USD 3.3 trillion. Currently, tradebetween Asia and Europe primarily involves sea transport as well as expensive freighthandling ports. Road transport will significantly reduce transit time to less than 3 weeks,reduce costs, and allow for door-to-door delivery”.
At the roundtable discussion on using Russian transit potential in road freight transport byroad, held on the same day the truck caravan arrived in Moscow, Mr. Rounov, IRU GeneralDelegate to the CIS, emphasised the competitive advantages of road transport in terms ofdelivery speed and possibility of door-to-door delivery. Mr. Sukhin, President of the RussianAssociation of International Carriers, stated that the average speed of freight delivery byroad (16 km per hour) outperformed that of sea (4 km per hour) and rail (8 km per hour).
Source: IRU (2005).
GLOBALISATION, TRANSPORT AND THE ENVIRONMENT © OECD 2010140
5. INTERNATIONAL ROAD AND RAIL FREIGHT TRANSPORT: THE IMPACT OF GLOBALISATION ON ACTIVITY LEVELS
● The “Agreement Concerning the Establishment of Global Technical Regulations for
Wheeled Vehicles, Equipment, and Parts which can be Fitted and/or be used on Wheeled
Vehicles” (referred to as the “1998 Agreement”). This provides the legal framework for
the establishment of global technical regulations for road vehicles. This Agreement was
introduced largely to meet US concerns about the type-certification system included in
the 1958 Agreement and a perceived loss of sovereignty.
These UNECE agreements provide the legal framework for the development of
technical regulations to improve the safety and environmental performance of road
vehicles, including goods vehicles. They help to remove non-tariff barriers caused by
incompatible vehicle standards, and provide an easier process than countries attempting
to harmonise their different domestic standards.
Within the EU, rules exist governing engine emission standards (Euro standards) for
new goods vehicles, aiming at limiting the amount of pollutants in the road freight sector.
The introduction of this standard was leading to substantial improvement in air quality
over Europe, mainly reducing air pollutants and particulates. In addition, member states
have to accept goods vehicles within agreed maximum weight (gross weight and axle
weight) and vehicle dimensions (length and height) limits from other member states. The
maximum weight for road-trains and for articulated vehicles with 2-3 axle trailers is
40 tons, and 44 tons for three-axle motor vehicles with 2- or 3-axle semi-trailer carrying a
40 foot ISO container. Member states may allow heavier and larger goods vehicles on their
national roads if they wish.
Information and communications technology (ICT)
A wide range of ICT solutions are now commonly used in logistics and freight
transport operations, and which have made international road freight operations more
efficient, more secure and safer. These include:
● vehicle and trailer tracking systems;
● on-board communication systems;
● computerised vehicle routing and scheduling (CVRS);
● satellite navigation systems;
● track and trace systems;
● paperless documentation and customs clearance.
Vehicle and trailer tracking systems. Systems that can track a goods vehicle’s movements
have been available for many years. They can be used for tracking loads as well as vehicles and
trailers. The hardware usually involves an on-board computer, a satellite signal (GPS) receiver
and a communications module. These systems can help to deter and detect vehicle and load
theft, and thereby improve driver safety. Typical security applications can include: i) panic
buttons that allow the driver to raise a security alert so that the company can alert the police
and the vehicle can be tracked; ii) remote vehicle immobilisation that can be accompanied by
door locking, flashing lights and horn sounding; iii) several vehicle-tracking system providers
offer vehicle-tracking bureaux that can detect when a vehicle or trailer has moved outside a
specified location or is operating outside its normal operating period.
GLOBALISATION, TRANSPORT AND THE ENVIRONMENT © OECD 2010 141
5. INTERNATIONAL ROAD AND RAIL FREIGHT TRANSPORT: THE IMPACT OF GLOBALISATION ON ACTIVITY LEVELS
On-board communication systems. Such systems can range from mobile and satellite
telephones, to on-board text messaging and computing systems. These allow drivers to
keep in touch with their company and other companies they are collecting from and
delivering to in the course of their operations. Drivers can be alerted of changes in their
schedules and warned of problems in advance. In addition, drivers can contact supply
chain partners, vehicle recovery services and the police in case of emergency.
Computerised vehicle routing and scheduling (CVRS). CVRS can be used to plan suitable
vehicle routes and schedules to fulfil orders using digital maps and user-set parameters.
The use of CVRS can help to improve customer service, planning time, reduce journey
times and distances, and thereby reduce fuel costs.
Satellite navigation systems. Satellite navigation systems (SatNav) is used to provide
drivers with instructions and mapping to reach their intended destination. This can be
especially useful when the driver is making international deliveries in unfamiliar countries
and cities, saving time spent deciding on a route and in selecting the wrong road. However,
there can also be problems associated with using such technology. Such systems are capable
of misrouting, resulting in a driver being directed a longer way when a shorter suitable route
was available. In addition, drivers of heavy goods vehicles have frequently reported routing
problems caused by unsuitable routings when the computerised mapping software did not
contain constraints such as bridge heights, road widths and weights restrictions (Freight Best
Practice, 2006). There are frequently news reports in Europe of foreign goods vehicle drivers
using satellite navigation systems that direct them onto inappropriate roads where they are
stuck for several days, and block the road in the process.
Track and trace systems. Track and trace systems can be used to track products
throughout the supply chain. Such systems can provide visibility of the product at all
stages and at all times. They are widely used in the parcels sector for worldwide
operations. They help companies to ensure safe, reliable and on-time delivery, and allow
for improved planning. Such systems are also of great importance in locating products that
have gone missing en route. Electronic seals and RFID5 technologies are being increasingly
used to track containers and other loads moved by road internationally.
Paperless documentation and customs clearance. Paperless documentation systems can
be used to load manifest information electronically into a driver terminal at the beginning of
the working day or throughout the day for greater working flexibility. Electronic proof of
delivery can reduce delivery time and provide immediate proof of safe delivery and receipt of
goods. Benefits of paperless systems can include reduced paperwork and administration costs,
reduced delivery and invoicing errors, improved order status information and consignment
tracking. This can result in lower operating costs and improved customer service.
Many customs authorities now use ICT applications in their work to help speed up
processes and make them increasingly reliable, secure and resistant to fraud and corruption.
ICT can also help to process customs revenue collection. It can also significantly reduce the
number of physical inspections of goods required, and allow for pre-arrival clearance and
risk analysis. It can be used to better plan the timing and location of physical inspections,
thereby reducing the waiting times for trucks and containers. An example of such a system
GLOBALISATION, TRANSPORT AND THE ENVIRONMENT © OECD 2010142

5. INTERNATIONAL ROAD AND RAIL FREIGHT TRANSPORT: THE IMPACT OF GLOBALISATION ON ACTIVITY LEVELS
is the UNCTAD Automated System for Customs Data (ASYCUDA) used to manage customs
transit systems (UNCTAD, 2006). There are also plans to make some international road
transport documentation electronic in future, such as TIR Carnets.
5.7. Factors influencing recent trends in international rail freight transportRail systems tend to be more heavily regulated than road operations and, in many
cases, governments are directly involved in service provision, in addition to their
infrastructure-related responsibilities. The discussion that follows has been divided in four
sections (infrastructure, policy/regulation, operations and technology), but there are many
inter-relationships between the issues raised.
Infrastructure
The most critical physical requirement to allow cross-border rail freight traffic is an
active network connection. In some countries, rail networks are domestic in nature, and
cross-border links have either never been constructed or have ceased operation. For
example, in Latin America, links that previously existed between Colombia and Venezuela,
and between Guatemala and El Salvador, are no longer present (ECLAC, 2003). In Europe,
the various national railway networks are relatively well interconnected, although the
quality of the international links can often be sub-standard compared to domestic
corridors. Where a physical cross-border connection does exist, one of the biggest
infrastructure constraints for international rail flows is the historical decision made by
different countries to adopt a different track gauge (i.e. the distance between the two rails)
when constructing their rail system. This is a problem that persists within some countries,
but is more particularly an issue at international borders. Two main gauges exist, metric
(1 000 mm) and standard (1 435 mm), but there are others in certain parts of the world.
Where different gauges are found, time and cost are added to the rail cross-border transfer
since the goods themselves need to be transferred between rail wagons, or the wagons
need to have their axles changed for onward transport on the other gauge.
Examples where gauge differences exist at international borders include:
● Southern Brazil is metric gauge whereas Uruguay and Argentina have standard gauge
networks; only the link to Bolivia is compatible with Brazil (ECLAC, 2003).
● France has standard gauge track, but traditional routes in Spain and Portugal have
different gauges, 1.672 mm in Spain and 1.664 mm in Portugal; new high-speed lines on
the Iberian peninsula are being constructed to the standard gauge (European
Commission, 2005), but freight will have to continue using the traditional routes where
the difference in gauge will persist for the foreseeable future.
● In Asia, at least 5 different track gauges exist, ranging from metric in much of South-East
Asia up to 1.676 mm in the Indian sub-continent; China has generally adopted standard
gauge track, while the Russian Federation has a broader 1.520 mm gauge (see Figure 5.7).
Another infrastructure-related issue is that of differing voltages on electrified lines,
which has traditionally required a change of locomotive at border crossings where electric
locomotives are used. This tends not to be as significant an obstacle as track gauge
differences, though, since a locomotive change can be completed in a shorter period of
time than regauging the wagons on an entire train. In many cases, diesel locomotives are
used for cross-border services (even where systems are electrified) and, as identified below,
multi-voltage electric locomotives have been introduced to operate internationally.
GLOBALISATION, TRANSPORT AND THE ENVIRONMENT © OECD 2010 143
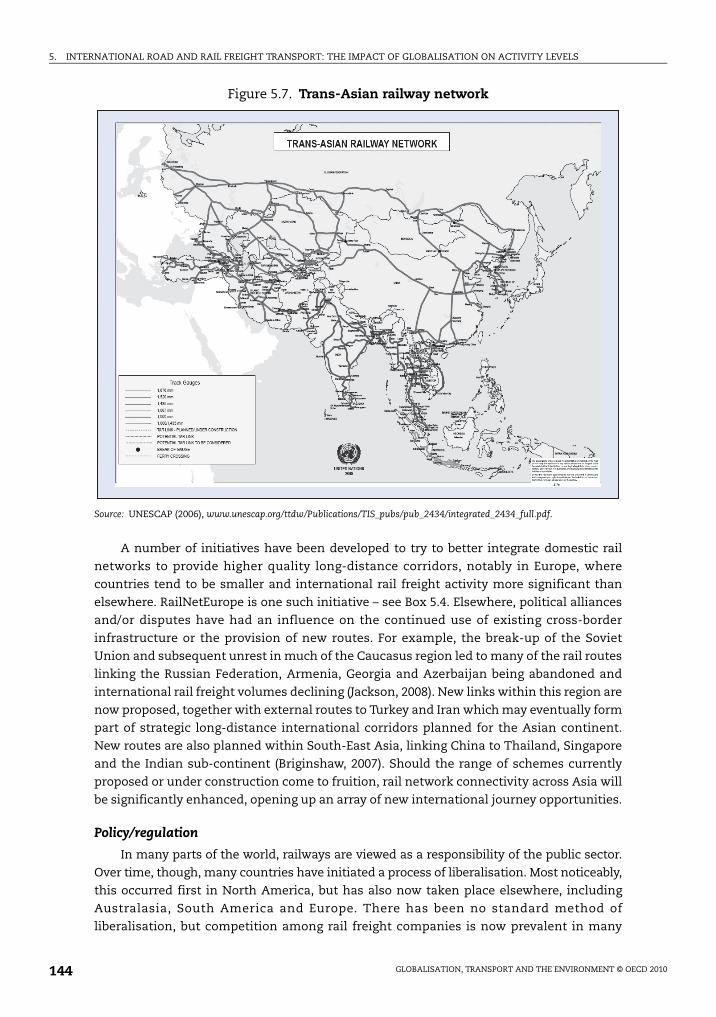
5. INTERNATIONAL ROAD AND RAIL FREIGHT TRANSPORT: THE IMPACT OF GLOBALISATION ON ACTIVITY LEVELS
A number of initiatives have been developed to try to better integrate domestic rail
networks to provide higher quality long-distance corridors, notably in Europe, where
countries tend to be smaller and international rail freight activity more significant than
elsewhere. RailNetEurope is one such initiative – see Box 5.4. Elsewhere, political alliances
and/or disputes have had an influence on the continued use of existing cross-border
infrastructure or the provision of new routes. For example, the break-up of the Soviet
Union and subsequent unrest in much of the Caucasus region led to many of the rail routes
linking the Russian Federation, Armenia, Georgia and Azerbaijan being abandoned and
international rail freight volumes declining (Jackson, 2008). New links within this region are
now proposed, together with external routes to Turkey and Iran which may eventually form
part of strategic long-distance international corridors planned for the Asian continent.
New routes are also planned within South-East Asia, linking China to Thailand, Singapore
and the Indian sub-continent (Briginshaw, 2007). Should the range of schemes currently
proposed or under construction come to fruition, rail network connectivity across Asia will
be significantly enhanced, opening up an array of new international journey opportunities.
Policy/regulation
In many parts of the world, railways are viewed as a responsibility of the public sector.
Over time, though, many countries have initiated a process of liberalisation. Most noticeably,
this occurred first in North America, but has also now taken place elsewhere, including
Australasia, South America and Europe. There has been no standard method of
liberalisation, but competition among rail freight companies is now prevalent in many
Figure 5.7. Trans-Asian railway network
Source: UNESCAP (2006), www.unescap.org/ttdw/Publications/TIS_pubs/pub_2434/integrated_2434_full.pdf.
GLOBALISATION, TRANSPORT AND THE ENVIRONMENT © OECD 2010144
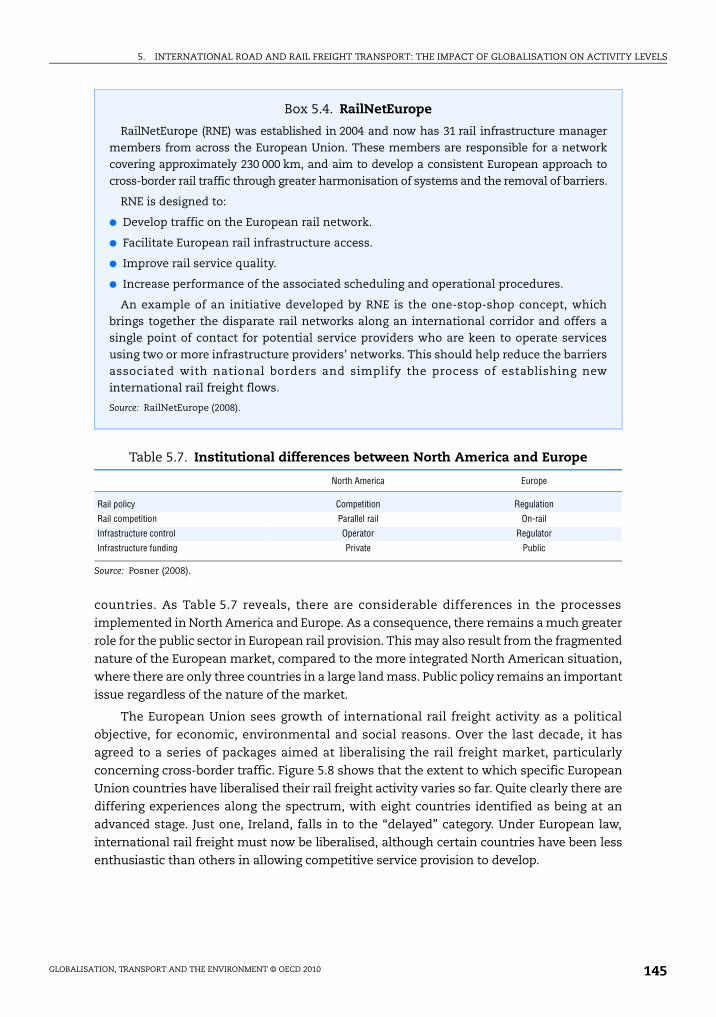
5. INTERNATIONAL ROAD AND RAIL FREIGHT TRANSPORT: THE IMPACT OF GLOBALISATION ON ACTIVITY LEVELS
countries. As Table 5.7 reveals, there are considerable differences in the processes
implemented in North America and Europe. As a consequence, there remains a much greater
role for the public sector in European rail provision. This may also result from the fragmented
nature of the European market, compared to the more integrated North American situation,
where there are only three countries in a large land mass. Public policy remains an important
issue regardless of the nature of the market.
The European Union sees growth of international rail freight activity as a political
objective, for economic, environmental and social reasons. Over the last decade, it has
agreed to a series of packages aimed at liberalising the rail freight market, particularly
concerning cross-border traffic. Figure 5.8 shows that the extent to which specific European
Union countries have liberalised their rail freight activity varies so far. Quite clearly there are
differing experiences along the spectrum, with eight countries identified as being at an
advanced stage. Just one, Ireland, falls in to the “delayed” category. Under European law,
international rail freight must now be liberalised, although certain countries have been less
enthusiastic than others in allowing competitive service provision to develop.
Box 5.4. RailNetEurope
RailNetEurope (RNE) was established in 2004 and now has 31 rail infrastructure managermembers from across the European Union. These members are responsible for a networkcovering approximately 230 000 km, and aim to develop a consistent European approach tocross-border rail traffic through greater harmonisation of systems and the removal of barriers.
RNE is designed to:
● Develop traffic on the European rail network.
● Facilitate European rail infrastructure access.
● Improve rail service quality.
● Increase performance of the associated scheduling and operational procedures.
An example of an initiative developed by RNE is the one-stop-shop concept, whichbrings together the disparate rail networks along an international corridor and offers asingle point of contact for potential service providers who are keen to operate servicesusing two or more infrastructure providers’ networks. This should help reduce the barriersassociated with national borders and simplify the process of establishing newinternational rail freight flows.
Source: RailNetEurope (2008).
Table 5.7. Institutional differences between North America and Europe
North America Europe
Rail policy Competition Regulation
Rail competition Parallel rail On-rail
Infrastructure control Operator Regulator
Infrastructure funding Private Public
Source: Posner (2008).
GLOBALISATION, TRANSPORT AND THE ENVIRONMENT © OECD 2010 145

5. INTERNATIONAL ROAD AND RAIL FREIGHT TRANSPORT: THE IMPACT OF GLOBALISATION ON ACTIVITY LEVELS
Operations
There are various ways in which rail freight operations are being influenced by theinternationalisation of transport activity. This section will highlight three of these to showthe range of effects:
● Geographical expansion of operators.
● New international services provided by co-operation between operators.
● Land-bridge corridors.
With the liberalisation of access to provide services over rail networks in differentparts of the world, formerly domestic rail freight operators have started to become moreinternational in nature. An early example in the 1990s was the expansion of WisconsinCentral, a US railroad company that is now part of Canadian National, in to New Zealand,Canada, United Kingdom and Australia, often through the purchase of rail freightoperations being privatised by governments (Canadian National, 2008). America LatinaLogistica (ALL), a private Brazilian operator, has expanded its operations across the borderinto northern Argentina (Kolodziejski, 2005). More recently, Railion Logistics has begunexpanding rapidly across Europe – see Box 5.5 for details.
In addition to rail operators expanding their own territorial coverage, there have been
developments in international services provided through co-operation between infrastructure
and/or service operators, where two or more rail freight companies are responsible for the
transit from origin to destination. For example, RZD, the Russian public rail company has
developed partnerships with a number of neighbouring countries, and has set up the Eurasia
Figure 5.8. Liberalisation of rail freight transport in Europe
Key: 1 000-800 – Advanced; 799-600 – On schedule; 599-300 – Delayed.
Source: IBM Global Business Services (2007).
0 200 400 600 800 1 000
458688690
727727732733734740743744
756761
780785786797797798
811836844848848852
887908Sweden
NetherlandsAustria
SwitzerlandGreat Britain
GermanyNorway
DenmarkCzech Republic
PortugalRomania
PolandSpain
BelgiumBulgaria
Slovak RepublicLithaniaSloveniaHungary
ItalyLatvia
FinlandEstoniaFranceGreece
LuxembourgIreland
GLOBALISATION, TRANSPORT AND THE ENVIRONMENT © OECD 2010146

5. INTERNATIONAL ROAD AND RAIL FREIGHT TRANSPORT: THE IMPACT OF GLOBALISATION ON ACTIVITY LEVELS
Rail Logistics joint venture, which also includes Germany, Poland and Belarus (Lukov, 2008). A
number of partnerships have developed in the European Union since the liberalisation process
began, and service quality initiatives have subsequently been developed, building on the CER-
UIC-CIT6 Freight Quality Charter that was implemented in 2003 (CER, 2005). The charter
focuses mainly on train punctuality and the implementation of quality-contracts between
railways and customers. CER claims considerable success in improving service punctuality on
international corridors, with steady improvement from 50% of trains arriving within one hour
of schedule in 2001 to 72% in 2004. The impact of the charter, which is being rapidly adopted to
cover more and more services, is expected to lead to further improvement.
The third example can develop either as a result of one operator’s expansion or the
co-operation among a number of operators, demonstrating rail’s abilities in providing a
land-based link in international supply chains dominated by shipping, primarily for
containers. The US land-bridge, where containers shipped across the Pacific from Asia
are moved across to the East Coast is well established, with international containers
accounting for the majority of some 15 million intermodal units moved by rail from the west
to east of the US (Briginshaw, 2007). The growth in traffic between Asia and North America has
led to rapid land-bridge growth for North American operators, such as Union Pacific, BNSF
Railway, Canadian Pacific and Canadian National (Lustig, 2006). In South-East Asia, there has
been growth on the land-bridge route between Malaysia and Thailand, in competition with
feeder ships (Abdullah, 2006). A similar land-bridge proposal is now being developed in Saudi
Arabia, linking the Red Sea and the Gulf, which will allow traffic from the key Jeddah Islamic
Port on the Red Sea to move more directly to the Gulf region (Jackson, 2005).
More innovatively, plans are emerging for new long-distance services taking advantage
of the network improvements and regulatory freedoms outlined earlier. For example, Box 5.6
describes a trial container train service from China to Europe in early 2008, possibly marking
the start of a concerted effort by rail companies to gain a share of the rapidly expanding
market for freight transport between the Far East and the European Union.
Box 5.5. European expansion of Railion Logistics
Railion is a division of Deutsche Bahn AG, the German national rail organisation whichholds the majority of shares, with small percentages owned by the Dutch and Danish staterailway organisations. In addition to its core German operations, Railion Deutschland, thecompany has direct rail operations in its established subsidiaries in the Netherlands,Denmark, Italy and Switzerland. Expansion is occurring through acquisitions andpartnerships. As examples, during 2007:
● Joint venture established between Railion and Green Cargo, a Swedish operator, toimprove service provision between Scandinavia and central Europe.
● Acquisition of EWS, Britain’s largest rail freight operator, that has also developed openaccess operations in France.
● Purchase of the majority of shares in Transfesa, a Spanish logistics company withsignificant rail interests.
As a consequence of this geographical expansion, which occurred soon after theliberalisation of the European rail freight market, Railion is rapidly becoming a Europe-wide rail freight operator
Source: Railion (2007, 2008).
GLOBALISATION, TRANSPORT AND THE ENVIRONMENT © OECD 2010 147

5. INTERNATIONAL ROAD AND RAIL FREIGHT TRANSPORT: THE IMPACT OF GLOBALISATION ON ACTIVITY LEVELS
owat
ewil’srn
pidme
us
SI) in
ndull
Technology
Despite the greater potential benefits from adopting new technologies in a more
fragmented continental market, European countries have tended to lag behind North
America in their adoption of new technologies that assist in making rail freight more
competitive. In general, the rail freight sector has typically not been very quick to develop
and adopt new technologies. The combination of generally low-technology operations and,
where technological solutions have been adopted, incompatibility among different
national systems, poses considerable challenges for cross-border rail movements.
The United States has progressively modernised its systems, for example with the
introduction of higher axle-loads, automatic wagon tracking and wagon auto-couplers, while
European systems have tended to be slow to introduce new methods (Anon, 2008). This may
reflect the commercial imperative of North American operators, who have seen the benefits
Box 5.6. China-Germany container train trial
Responding to the increasing trade volumes between China and the European Union, a trialcontainer train operated in January 2008 between Beijing and Hamburg conveying a range ofconsumer goods. The 10 000 kilometre journey through six countries (China, MongolianRepublic, the Russian Federation, Belarus, Poland and Germany) took 15 days, which isapproximately half the duration by sea between the two cities. As a consequence of thesuccessful trial, plans are being developed to commence regular operations on this corridor.
Source: Deutsche Bahn AG (2008).
Box 5.7. Technologies to enhance interoperability in the European Union
Examples of technologies being implemented include:
● Multi-voltage electric locomotives: a number of new locomotive designs are being introduced that alllocomotives to work across international borders; for example, the Traxx locomotive has modules thallow it to operate on most of the electrified networks across Europe.
● Signalling systems: a key component of European Rail Traffic Management System (ERTMS) is a ninteroperable signalling system that is intended to reduce operating costs and enhance racompetitiveness through the implementation of continent-wide standards that incorporate modetechnology.
● Gauge transfer: pending the full standardisation of track gauge across the European Union, new ragauge-changing technologies have been developed to regauge wagons, reducing the length of tirequired at borders where track gauges differ on either side.
● Train payloads: technological solutions to allow freight trains to be longer, larger and/or heavier, thbenefiting from economies-of-scale and reducing the unit cost of rail transport.
● Information technology (e.g. consignment tracking): a technical specification for interoperability (Thas been developed relating to the adoption of standardised telematics applications, which will feedto ERTMS.
While some of these initiatives are starting to have an impact on reducing delays at border crossings aimproving the performance of international freight services, overall progress is relatively slow and fimplementation of some measures (e.g. ERTMS) is likely to take many more years.
Sources: CER (2007a), CER (2007b) and Vitins (2008).
GLOBALISATION, TRANSPORT AND THE ENVIRONMENT © OECD 2010148
5. INTERNATIONAL ROAD AND RAIL FREIGHT TRANSPORT: THE IMPACT OF GLOBALISATION ON ACTIVITY LEVELS
of investment to improve rail’s market position, compared to the state-controlled or state-
influenced operations in Europe, where innovation has been much slower. The European
Railway Agency sees as one of its main objectives the development and introduction of new,
standardised technologies and working practices to make rail freight more competitive with
road, particularly for cross-border flows where interoperability is currently a significant
obstacle (ERA, 2007). Box 5.7 identifies a number of technologies that are being adopted, or
are under development, in the European Union to help to overcome infrastructure
differences and enhance the quality of cross-border rail freight services.
5.8. Future perspectivesProjections of total road and rail freight activity (i.e. domestic and international) were
produced as part of the Sustainable Mobility Project in 2004 (WBCSD, 2004). These
projections indicated that road and rail freight transport activity will grow significantly
over the period to 2050. Figure 5.9 shows the projections by region and Figure 5.10 shows
the projections by mode (road – divided into medium and heavy trucks – and rail). In the
United States, international freight was forecast to grow by 111% between 2002 and 2035,
while domestic freight was expected to grow by 91%. International road and rail freight
were expected to grow by 188% and 112% respectively over the same time period (Office of
Freight Management and Operations, 2007).
Growth in international movements are not shown separately – but if the broad trends
above also occur in international road and rail transport, then there would be some
dramatic consequences in terms of the need for improved infrastructure and the removal
of bottlenecks.
However, it is not simply a question of infrastructure. Recent work to develop a
logistics performance index (LPI) suggests “that policymakers should look beyond the
traditional ‘trade facilitation’ agenda that focuses on road infrastructure and information
technology in customs to also reform logistics services markets and reduce coordination
failures, especially those of public agencies active in border control” (Arvis et al., 2007). The
LPI is a benchmarking tool developed by the World Bank that measures performance along
the logistics supply chain within a country. It is based on a worldwide survey of global
freight forwarders and express carriers, and allows comparisons across 150 countries. The
index is intended to help countries identify challenges and opportunities and improve
their logistics performance, in moving goods internationally rapidly, reliably and cheaply
(Arvis et al., 2007).
It is evident that many multinationals are rationalising the number of logistics service
providers they deal with – in much the same way as they have rationalised their production
and warehousing operations (there is, of course, a link between these developments). This,
together with the growth in intra-regional trade, is leading to greater demand for transport
and logistics services. Political changes have opened up new geographical markets, both
for production and consumption. Devising and implementing the right logistics strategies
lies at the heart of successfully capitalising on these commercial opportunities. Many of
these changes are of significance to logistics service providers, especially those concerned
with international markets.
GLOBALISATION, TRANSPORT AND THE ENVIRONMENT © OECD 2010 149
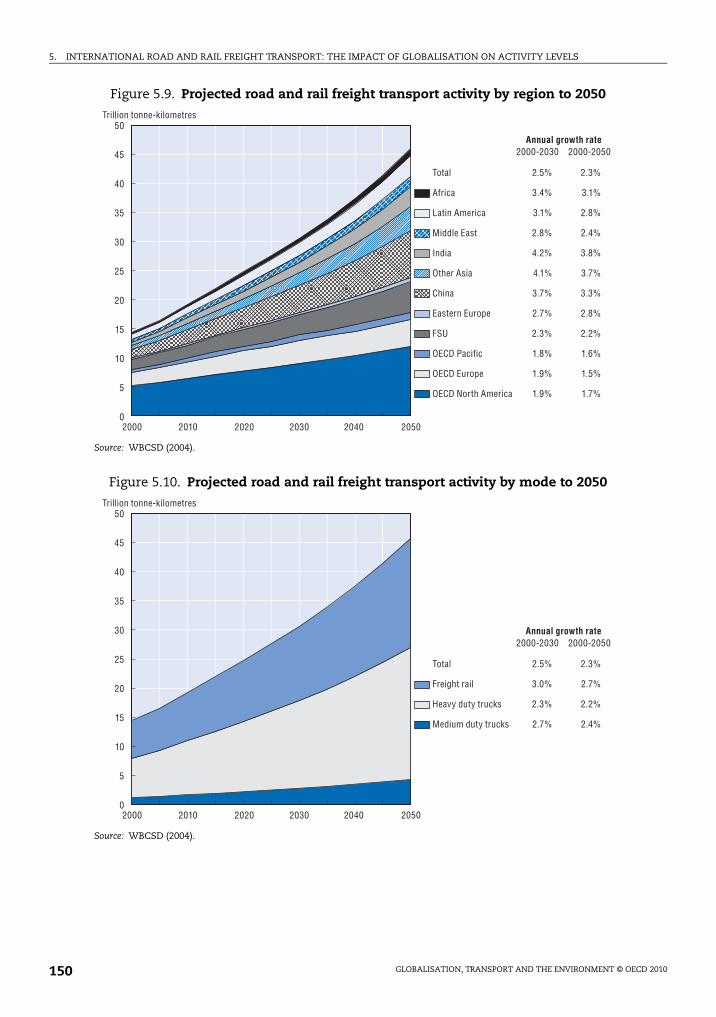
5. INTERNATIONAL ROAD AND RAIL FREIGHT TRANSPORT: THE IMPACT OF GLOBALISATION ON ACTIVITY LEVELS
Figure 5.9. Projected road and rail freight transport activity by region to 2050
Source: WBCSD (2004).
Figure 5.10. Projected road and rail freight transport activity by mode to 2050
Source: WBCSD (2004).
50
45
40
35
30
25
20
15
0
5
10
2000 2010 2020 2030 2040 2050
Annual growth rate2000-2030 2000-2050
Trillion tonne-kilometres
Africa
Latin America
Middle East
India
Other Asia
China
Eastern Europe
FSU
OECD Pacific
OECD Europe
OECD North America
Total 2.5% 2.3%
3.4% 3.1%
3.1% 2.8%
2.8% 2.4%
4.2% 3.8%
4.1% 3.7%
3.7% 3.3%
2.7% 2.8%
2.3% 2.2%
1.8% 1.6%
1.9% 1.5%
1.9% 1.7%
50
45
40
35
30
25
20
15
0
5
10
2000 2010 2020 2030 2040 2050
Annual growth rate2000-2030 2000-2050
Trillion tonne-kilometres
Freight rail
Heavy duty trucks
Medium duty trucks
Total 2.5% 2.3%
3.0% 2.7%
2.3% 2.2%
2.7% 2.4%
GLOBALISATION, TRANSPORT AND THE ENVIRONMENT © OECD 2010150
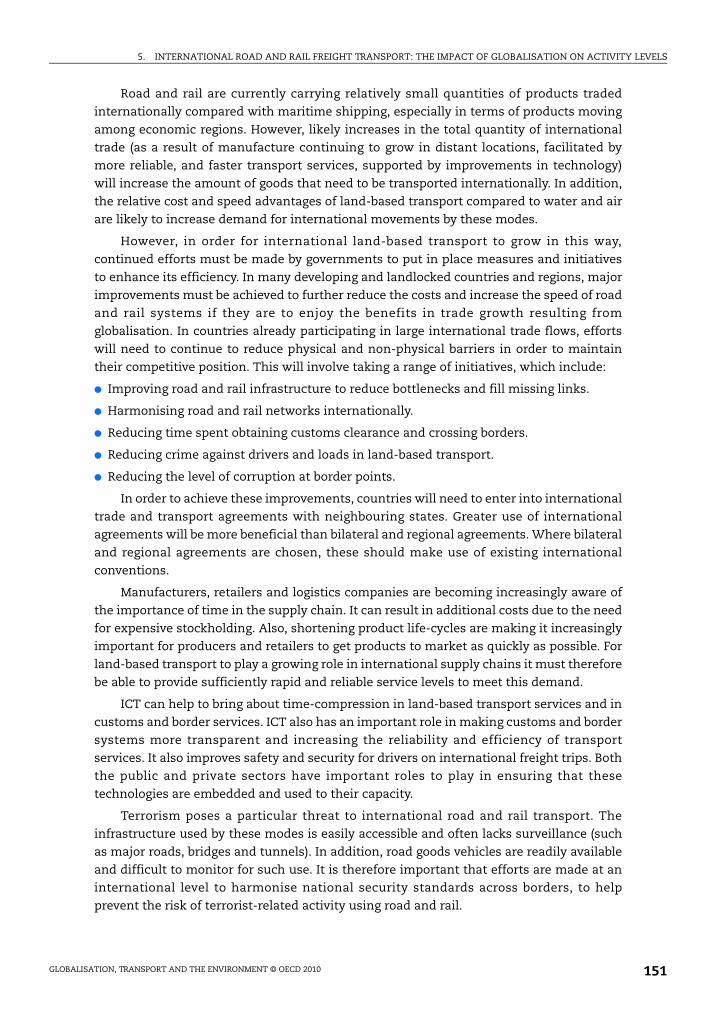
5. INTERNATIONAL ROAD AND RAIL FREIGHT TRANSPORT: THE IMPACT OF GLOBALISATION ON ACTIVITY LEVELS
Road and rail are currently carrying relatively small quantities of products traded
internationally compared with maritime shipping, especially in terms of products moving
among economic regions. However, likely increases in the total quantity of international
trade (as a result of manufacture continuing to grow in distant locations, facilitated by
more reliable, and faster transport services, supported by improvements in technology)
will increase the amount of goods that need to be transported internationally. In addition,
the relative cost and speed advantages of land-based transport compared to water and air
are likely to increase demand for international movements by these modes.
However, in order for international land-based transport to grow in this way,
continued efforts must be made by governments to put in place measures and initiatives
to enhance its efficiency. In many developing and landlocked countries and regions, major
improvements must be achieved to further reduce the costs and increase the speed of road
and rail systems if they are to enjoy the benefits in trade growth resulting from
globalisation. In countries already participating in large international trade flows, efforts
will need to continue to reduce physical and non-physical barriers in order to maintain
their competitive position. This will involve taking a range of initiatives, which include:
● Improving road and rail infrastructure to reduce bottlenecks and fill missing links.
● Harmonising road and rail networks internationally.
● Reducing time spent obtaining customs clearance and crossing borders.
● Reducing crime against drivers and loads in land-based transport.
● Reducing the level of corruption at border points.
In order to achieve these improvements, countries will need to enter into international
trade and transport agreements with neighbouring states. Greater use of international
agreements will be more beneficial than bilateral and regional agreements. Where bilateral
and regional agreements are chosen, these should make use of existing international
conventions.
Manufacturers, retailers and logistics companies are becoming increasingly aware of
the importance of time in the supply chain. It can result in additional costs due to the need
for expensive stockholding. Also, shortening product life-cycles are making it increasingly
important for producers and retailers to get products to market as quickly as possible. For
land-based transport to play a growing role in international supply chains it must therefore
be able to provide sufficiently rapid and reliable service levels to meet this demand.
ICT can help to bring about time-compression in land-based transport services and in
customs and border services. ICT also has an important role in making customs and border
systems more transparent and increasing the reliability and efficiency of transport
services. It also improves safety and security for drivers on international freight trips. Both
the public and private sectors have important roles to play in ensuring that these
technologies are embedded and used to their capacity.
Terrorism poses a particular threat to international road and rail transport. The
infrastructure used by these modes is easily accessible and often lacks surveillance (such
as major roads, bridges and tunnels). In addition, road goods vehicles are readily available
and difficult to monitor for such use. It is therefore important that efforts are made at an
international level to harmonise national security standards across borders, to help
prevent the risk of terrorist-related activity using road and rail.
GLOBALISATION, TRANSPORT AND THE ENVIRONMENT © OECD 2010 151
5. INTERNATIONAL ROAD AND RAIL FREIGHT TRANSPORT: THE IMPACT OF GLOBALISATION ON ACTIVITY LEVELS
The logistics performance index (Arvis et al., 2007) suggests major differences in
logistics performance across countries and regions, including differences among developing
countries at similar levels of development. Those developing countries with relatively poor
indices, and especially those that are landlocked, need to focus on the service level (in terms
of cost, speed and reliability) provided by the road and rail services if they are to enjoy the
benefits of trade-related globalisation in coming years. Their focus should not necessarily be
on building road and rail infrastructure. Key factors are likely to include reducing land-based
transport costs (domestically and in transit countries), and negotiations with transit
countries to put in place suitable transport agreements and to work jointly to speed up
customs and border processing. As Grigoriou (2007) noted, “transit corridors are regional
public goods and should be managed as such through international cooperation.
International financial institutions can, and do, play a key role in this regard by providing
assistance and coordination, as well as participating in policy dialogue”.
If land-based transport services can achieve these efficiencies, it is likely that they will
increase their share of international freight traffic over time.
Projects to improve international freight transport
This section contains some examples of projects that are aiming to improve trade and
international freight transport operations in specific regions. Box 5.8 presents some
examples from Southeast Europe.
Box 5.8. Trade and Transport Facilitation in Southeast Europe Program
The World Bank, with the bilateral aid agencies of countries including the United States,the Netherlands, France and Austria, has supported a regional Programme on Trade andTransport Facilitation in Southeast Europe (TTFSE). The programme, which started in 2001,includes Albania, Bosnia and Herzegovina, Bulgaria, Croatia, FYR Macedonia, Moldova,Romania, Serbia and Montenegro.
The programme was designed to encourage trade in the region by promoting moreefficient and less costly trade flows across these countries, and improve customsoperations to European Union standards. The programme has sought to reduce non-tariffcosts to trade and transport, to reduce smuggling and corruption at border crossings, andto strengthen and modernise the customs administrations and other border controlagencies. The primary emphasis in the early years of the programme was on roadtransport, but the focus has now been broadened to include other modes, primarily rail.
An important element in the programme has been the use of benchmarks andmonitoring systems to track improved performance over the life of the programme.Specific performance indicators were established on the basis of consultation with bordercrossing agencies, and local project teams were established at border crossing points toanalyse the results and solve problems through inter-agency interaction at the local level.Validation of the progress, as well as the status of corruption, was also obtained throughsurveys of users.
The programme has achieved some notable success, with significant reductions of up to87% in clearance times reported for a number of the most important border-crossingpoints, and at inland terminals. In addition, there has been an increase in trade volumesand in the revenue collected by customs from duty and VAT.
GLOBALISATION, TRANSPORT AND THE ENVIRONMENT © OECD 2010152
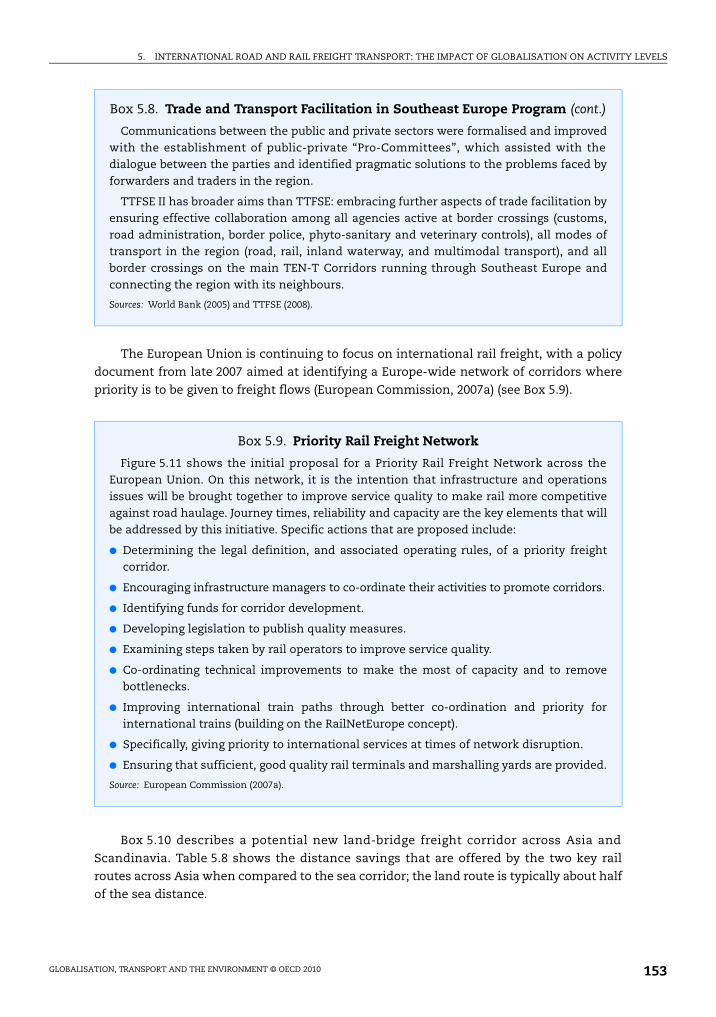
5. INTERNATIONAL ROAD AND RAIL FREIGHT TRANSPORT: THE IMPACT OF GLOBALISATION ON ACTIVITY LEVELS
The European Union is continuing to focus on international rail freight, with a policy
document from late 2007 aimed at identifying a Europe-wide network of corridors where
priority is to be given to freight flows (European Commission, 2007a) (see Box 5.9).
Box 5.10 describes a potential new land-bridge freight corridor across Asia and
Scandinavia. Table 5.8 shows the distance savings that are offered by the two key rail
routes across Asia when compared to the sea corridor; the land route is typically about half
of the sea distance.
Box 5.8. Trade and Transport Facilitation in Southeast Europe Program (cont.)
Communications between the public and private sectors were formalised and improvedwith the establishment of public-private “Pro-Committees”, which assisted with thedialogue between the parties and identified pragmatic solutions to the problems faced byforwarders and traders in the region.
TTFSE II has broader aims than TTFSE: embracing further aspects of trade facilitation byensuring effective collaboration among all agencies active at border crossings (customs,road administration, border police, phyto-sanitary and veterinary controls), all modes oftransport in the region (road, rail, inland waterway, and multimodal transport), and allborder crossings on the main TEN-T Corridors running through Southeast Europe andconnecting the region with its neighbours.
Sources: World Bank (2005) and TTFSE (2008).
Box 5.9. Priority Rail Freight Network
Figure 5.11 shows the initial proposal for a Priority Rail Freight Network across theEuropean Union. On this network, it is the intention that infrastructure and operationsissues will be brought together to improve service quality to make rail more competitiveagainst road haulage. Journey times, reliability and capacity are the key elements that willbe addressed by this initiative. Specific actions that are proposed include:
● Determining the legal definition, and associated operating rules, of a priority freightcorridor.
● Encouraging infrastructure managers to co-ordinate their activities to promote corridors.
● Identifying funds for corridor development.
● Developing legislation to publish quality measures.
● Examining steps taken by rail operators to improve service quality.
● Co-ordinating technical improvements to make the most of capacity and to removebottlenecks.
● Improving international train paths through better co-ordination and priority forinternational trains (building on the RailNetEurope concept).
● Specifically, giving priority to international services at times of network disruption.
● Ensuring that sufficient, good quality rail terminals and marshalling yards are provided.
Source: European Commission (2007a).
GLOBALISATION, TRANSPORT AND THE ENVIRONMENT © OECD 2010 153
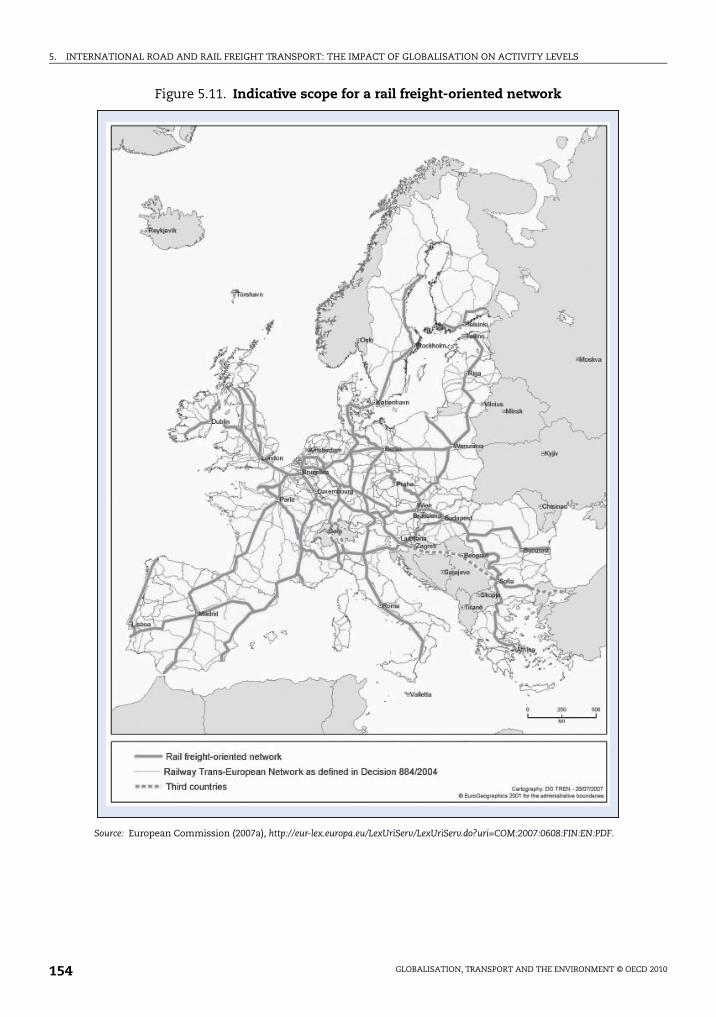
5. INTERNATIONAL ROAD AND RAIL FREIGHT TRANSPORT: THE IMPACT OF GLOBALISATION ON ACTIVITY LEVELS
Figure 5.11. Indicative scope for a rail freight-oriented network
Source: European Commission (2007a), http://eur-lex.europa.eu/LexUriServ/LexUriServ.do?uri=COM:2007:0608:FIN:EN:PDF.
GLOBALISATION, TRANSPORT AND THE ENVIRONMENT © OECD 2010154

5. INTERNATIONAL ROAD AND RAIL FREIGHT TRANSPORT: THE IMPACT OF GLOBALISATION ON ACTIVITY LEVELS
5.9. ConclusionsThe above sections clearly show that with developments to remove bottlenecks,
combined with operational improvements, there is scope for considerable increases in the
efficiency of international road and rail freight in many regions. Of course, it is not simply
a question of transit time and reliability (although both these are highly important), it is
also a question of cost. Figure 5.12 illustrates total door-to-door transport costs and journey
times for a range of available transport solutions carrying containerised cargo from Asia to
Europe. In the study, quotes were obtained from freight forwarders and transport operators
for a specified list of transport services and destinations, in order to produce these results.
The results indicate that air transport has the highest cost, but a very short transit
time. Sea transport provides the lowest cost, but has a long transit time. Road freight
results fall between air and sea both in terms of cost and transit time. The rail transport
results had a very wide range of costs (USD 4 000-USD 10 000) and transit times (14 to
45 days). The rail data showed major differences between the officially scheduled transit
times and the transit times quoted by freight forwarders for complete door-to-door
solutions (as did the rail freight rates quoted, which were 30%-60% higher than the listed
rates). Transit times for rail transport between western China and western Europe are
quoted as 15-20 days in other studies, so the rail results should be treated with caution.
Box 5.10. The proposed Northern East West Sea-Rail Freight Corridor
UIC (International Union of Railways) has proposed the development of a sea-rail corridorbetween China, the Russian Federation, the Nordic countries and North America. Therail-leg would run from China to Norway, with a sea-leg from there to North America. One ofthe key objectives of the proposed corridor is the provision of an alternative east-west routethat would avoid major existing bottlenecks on the traditional more southerly routes. Therail link between China and Norway already exists, passing through Kazakhstan, theRussian Federation, Finland and Sweden, although it has a mix of broad and standard gaugetracks. Despite the technical and political obstacles associated with gauge changes andborder crossings, UIR estimates that the journey time from Urumchi (west China) to Halifax(Canada) by rail and sea could be as little as 15-16 days, representing a considerable timesaving over current routings. However, major improvements would be required in theorganisation of the railway operations, with far greater international co-operation and astreamlining of procedures.
Source: UIC (2004).
Table 5.8. Sea and rail distances between China and Rostock, Germany (km)
From To
Rostock
By seaBy rail
Trans-Siberian Euro-Asian
China port: Tianjin 22 500 9 900 10 400
Lianyungang 21 800 10 700 10 200
Shanghai 21 200 11 100 10 600
Japan 22 800 13 300 12 700
Hong Kong, China 19 700 – 11 200
Source: UNESCAP (1995).
GLOBALISATION, TRANSPORT AND THE ENVIRONMENT © OECD 2010 155

5. INTERNATIONAL ROAD AND RAIL FREIGHT TRANSPORT: THE IMPACT OF GLOBALISATION ON ACTIVITY LEVELS
Clearly, there are many developments that are difficult to predict with accuracy and
certainty. Many past forecasts of improvements in transport technology and operations have
been overtaken by events and in some cases, rather than transport becoming easier and faster,
it has become more complex and occasionally slower. Further consideration of Figure 5.12
highlights the way in which developments in the performance of one mode can have major
implications for the use of the mode. Within the next 15 years, there seems to be limited
opportunity to dramatically increase the speed of either ships or aircraft. Indeed, increased
concern about CO2 emissions could lead to changes in the view of the role of air freight within
the supply chain. During the same period, there may be calls for sea freight transport to
operate at slower speeds (thereby lengthening transit times) in order to save fuel. Given these
uncertainties, it is interesting to note the potential for rail movement, in particular to offer
opportunities for shorter transit times and possibly reduced costs. Road freight times may not
have the scope to be reduced to the same extent as rail freight, but there are still many
opportunities to improve road operations and thereby improve both the economic and
environmental performance of road freight transport over long distances.
As noted in the introduction, international road and rail freight transport is extremely
diverse. Thus, the developments that have implications for short-distance road freight are
very different from those that affect long-distance rail. It is evident from this review
that there remain many opportunities to improve the efficiency and to reduce the
environmental impact of both international road and rail freight transport. Many of these
developments require government intervention in the form of changes in policy and
regulation or improvements to infrastructure. This is a complex area when considered
within one country – when it concerns international developments it is, of course, even
more complicated. However, it is important when considering the developments that will
happen in the next 15 years to note the growing role played in international transport of
the major logistics companies. The consolidation that is evident means that single
companies are now able to provide truly integrated services in a way that was not possible
Figure 5.12. Freight costs and transit times for containerised freight between Asia and Europe
Note: The freight rate quotations on which these results are based were for a single 40’ container loaded with 20 tonsof cargo. The quotations include 100 km of trucking at both origin and destination. Insurance cost and otherpayments related to liabilities were not included. Transit times were provided by the freight forwarders/operators.The study was based on a relatively small sample size for each of the analysed transport legs.
Source: Chamber of Commerce of the United States (2006).
30 000
25 000
20 000
15 000
10 000
5 000
00 5 10 15 20 25 30 35 40
Air
Road
Sea
Rail
Cost, in USD
Transit time, in days
GLOBALISATION, TRANSPORT AND THE ENVIRONMENT © OECD 2010156
5. INTERNATIONAL ROAD AND RAIL FREIGHT TRANSPORT: THE IMPACT OF GLOBALISATION ON ACTIVITY LEVELS
a few years ago. At the same time, an increased business focus on applying a supply-chain
approach is also evident – it is vital for policy makers and regulators to take note of these
developments, in order to maximise the opportunities for more efficient international road
and rail freight transport, and in order to ensure that developments meet the much more
demanding environmental constraints that the transport sector faces.
Notes
1. This chapter is an edited version of the paper The Impact of Globalisation on International Road and RailFreight Transport Activity: Past Trends and Future Perspectives, written by Allan Woodburn, Julian Allen,Michael Browne and Jacques Leonardi, Transport Studies Department, University of Westminster,London, UK, for the OECD/ITF Global Forum on Transport and Environment in a Globalising World,held in Guadalajara, Mexico, 10-12 November 2008 (www.oecd.org/dataoecd/52/29/41373591.pdf). Someparagraphs are also taken from the paper The Environmental Impacts of Increased International Road andRail Freight Transport: Past Trends and Future Perspectives, written by Huib van Essen, CE Delft, theNetherlands, for the same event (www.oecd.org/dataoecd/10/62/41380980.pdf).
2. Some regional trade agreements have had additional environmental effects, such as the buildingof new infrastructure for customs facilities, sometimes at huge scale, devouring hectares of landaround major crossing points and increasing air pollution.
3. These figures should be interpreted with caution, as rail or road transport of imported goodsarriving to the country by boat is registered as domestic, rather than international, freight transport.There are, for example, more than 15 000 truck trips departing every day from the Los Angeles andLong Beach harbours in California, all counted as domestic transport.
4. Nikomborirak and Sumano (2008) found a rapidly increasing share of road transport in internationaltransport in Thailand between 2000 and 2007, due to increased regional trade, facilitated by a rapidlydeveloping road network. The increase in road transport, however, took place from a very low base.Sea transport was boosted by containerisation, but rail transport remained negligible.
5. Radio-frequency identification.
6. Community of European Railway and Infrastructure Companies (CER), Union Internationale desChemins de Fer – International Union of Railways (UIC), Comité International du TransportFerroviaire – International Railway Transport Committee (CIT).
References
Abdullah, D. (2006), “Malaysia Plans Five Years of Rail Growth”, Railway Gazette, 1 October.
Anderson, J. and E. van Wincoop (2004), “Trade Costs”, Journal of Economic Literature, Vol. 42, pp. 691-751.
Anon (2008), “Freight Standards Need Updating”, Railway Gazette, 9 January.
Arvis, J.F. et al. (2007), Connecting to Compete – Trade Logistics in the Global Economy: The Logistics PerformanceIndex and its Indicators, The World Bank, Washington DC, available at http://siteresources.worldbank.org/INTTLF/Resources/lpireport.pdf.
Azar, C., K. Lindgren and B.A. Andersson (2003), “Global Energy Scenarios Meeting Stringent CO2Constraints – Cost-effective Fuel Choices in the Transportation Sector”, Energy Policy, 31(10),pp. 961-976.
Briginshaw, D. (2007), “Asian Railways Rise to Meet the Growth Challenge”, International Railway Journal,1 January.
Canadian National (2008), The Wisconsin Central Story, available on line at www.cn.ca/about/company_information/history/en_AboutWisconsinCentral.shtml (date accessed 20 February 2008).
Community of European Railway (CER) (2005), Rail Freight Quality: Progress in a Competitive Market – UpdateReport on the CER-UIC-CIT Charter, Community of European Railway and Infrastructure Companies(CER).
CER (2007a), A New Signalling System for Europe’s Trains, Community of European Railway andInfrastructure Companies (CER).
CER (2007b), Information Interchange on Rail Freight: Improving Customer Service by Innovative Use of theTelematic Applications for Freight Regulation, Community of European Railway and InfrastructureCompanies (CER).
GLOBALISATION, TRANSPORT AND THE ENVIRONMENT © OECD 2010 157

5. INTERNATIONAL ROAD AND RAIL FREIGHT TRANSPORT: THE IMPACT OF GLOBALISATION ON ACTIVITY LEVELS
Chamber of Commerce of the United States (2006), Land Transport Options between Europe and Asia:Commercial Feasibility Study, The Chamber of Commerce of the United States.
Crass, Mary (2007), Speech by Principal Administrator of the ECMT/International Transport Forum atthe 4th IRU Euro-Asia Road Transport Conference, 14-15 June 2007, Warsaw.
Deardorff, A. (2005), “The Importance of the Cost and Time of Transport for International Trade”, paperin ECMT (2005), Time and Transport, Round Table 127, ECMT.
Deutsche Bahn AG (2008), Beijing-Hamburg Container Express Manages 10 000 Kilometres in Only 15 Days,press release, 24 January.
ECLAC (2003), “The Potential for More Trade by Rail between Brazil and its Neighbours in the SouthernCone”, Facilitation of Trade and Transport in Latin America and the Caribbean Bulletin, Issue 2005,September, ECLAC, United Nations.
ECMT (2000), Integration of European Inland Transport Markets, ECMT/OECD, Paris.
ECMT (2005), International Road Freight Transport in Europe – Market Access and the Future of the LicenceSystem, Report of the Special Advisory Group, ECMT/OECD, Paris.
ECMT (2006), Transport Links Between Europe and Asia, ECMT/OECD, Paris.
ERA (2007), Annual Report 2006, European Railway Agency (ERA).
European Commission (EC) (2005), Trans-European Transport Network: TEN-T Priority Axes and Projects 2005,European Commission, Brussels.
EC (2007a), Towards a Rail Network Giving Priority to Rail Freight, COM(2007)608, European Commission,Brussels.
EC (2007b), EU Energy and Transport Figures – Statistical Pocketbook 2006, European Commission, Brussels,2007.
Eurostat (2003), Trends in Rail Goods Transport 1990-2001, Statistics in Focus Theme 7 – 9/2003.
Eurostat (2004), Trends in Road Freight Transport 1990-2002, Statistics in Focus – 7/2004.
Eurostat (2007a), Trends in Road Freight Transport 1999-2005, Statistics in Focus – 27/2007.
Eurostat (2007b), Railway Transport – Goods Transported, by Type of Transport.
Ferrer, José Capel (2005), Speech by the Director of the UNECE Transport Division at 3rd IRU Euro-AsianRoad Transport Conference, 26-27 September 2005, Beijing.
Fontaine, P. (2007), Speech by Representative of the Directorate General for Energy and Transport,European Commission, at 4th IRU Euro-Asia Road Transport Conference, 14-15 June 2007, Warsaw.
Freight Best Practice (2006), Wayfinding Research: Using Satellite Navigation to Improve Efficiency in the RoadFreight Industry, Research Report, Freight Best Practice Programme, UK.
Grigoriou, C. (2007), Landlockedness, Infrastructure and Trade: New Estimates for Central Asian Countries,Policy Research Working Paper 4335, The World Bank, Washington DC.
Hummels, D. (2001), Time as a Trade Barrier, GTAP Working Paper No. 18, Global Trade Analysis Project,Purdue University, available at www.gtap.agecon.purdue.edu/resources/download/2877.pdf.
IBM Global Business Services (2007), Rail Liberalisation Index 2007.
International Road Federation (IRF) (2007), World Road Statistics 2007 – Data 2000 to 2005, InternationalRoad Federation (IRF), Geneva, Switzerland.
IRU (2005), IRU Praises Reopening of Silk Road, Press release No. 807, 2 November 2005, IRU.
IRU (2006), “The Importance of the Euro-Asian Road Transport Connection Contribution from the EU”,Annex 2, in ECMT (2006), Transport Links between Europe and Asia, ECMT.
IRU (2008), 1 in 6 Drivers Attacked, Press release, 18 February 2008, IRU.
Jackson, C. (2005), “Saudi Landbridge Ready to Launch”, Railway Gazette, 1 March.
Jackson, C. (2008), “Railways Realign in Troubled Region”, Railway Gazette, 16 January.
Kolodziejski, J. (2005), “Grain Giant Targets Cross-border Logistics”, Railway Gazette, 1 June.
Kopp, A. (2006), “Summary of Discussions”, in ECMT (2006), Transport and International Trade, RoundTable 130, ECMT.
GLOBALISATION, TRANSPORT AND THE ENVIRONMENT © OECD 2010158

5. INTERNATIONAL ROAD AND RAIL FREIGHT TRANSPORT: THE IMPACT OF GLOBALISATION ON ACTIVITY LEVELS
Latrille, P. (2007), “The Role of Market Structure in the Transport Sector on the Effects of Liberalization:The Case of the World Trade Organization”, report in ECMT (ed.) (2007), Market Access, Trade inTransport Services and Trade Facilitation, ECMT.
Lukov, B. (2008), “RZD Adopts Long-range Development Strategy”, Railway Gazette, 22 January.
Lustig, D. (2006), “Railroads Invest in Extra Capacity to Move Asian Import Windfall”, Railway Gazette,1 August.
North American Transport Statistics Database (NATSD) (2007), available at http://nats.sct.gob.mx/.
Nikomborirak, Deunden and Boonwara Sumano (2008), Globalization-Related Changes in TransportActivity in Thailand, presentation made at the OECD/ITF Global Forum on Transport andEnvironment in a Globalising World, Guadalajara, Mexico, 10-12 November 2008, available atwww.oecd.org/dataoecd/33/8/41750006.pdf.
OECD (2007), OECD in Figures, 2007 edition, OECD, Paris.
Office of Freight Management and Operations (2007), Freight Facts and Figures 2006, Federal HighwayAdministration, US Department of Transportation.
Posner, H. (2008), “Rail Freight in the USA: Lessons for Continental Europe”, CER Essay Series,Community of European Railway and Infrastructure Companies (CER).
Railion (2007), Railion – The European Rail Freight Company.
Railion (2008), www.railion.com (date accessed 21 February 2008).
RailNetEurope (2008), www.railneteurope.com (date accessed 8 February 2008).
Rodrigue, J.P. and M. Hesse (2007), “Globalized Trade and Logistics: North American Perspectives”,chapter in T. Leinbach and C. Capineri (eds.), Globalized Freight Transport: Intermodality, E-Commerce,Logistics and Sustainability, Edward Elgar, Cheltenham, UK.
Smokers, R. et al. (2007), State-of-the-Art CO2 en Mobiliteit, CE Delft, Delft.
Trade and Transport Facilitation in Southeast Europe Program (TTFSE) (2008), TTFSE website, availableat www.seerecon.org/ttfse/.
International Union of Railways (UIC) (2004), The Northern East West (NEW) Freight Corridor, UIC.
United Nations Conference on Trade and Development (UNCTAD) (2006), Report of the Expert Meeting onICT Solutions to Facilitate Trade at Border Crossings and Ports, TD/B/COM.3/EM.27/3, UNCTAD.
UNCTAD (2007), Note by the UNCTAD Secretariat, for the Expert Meeting on Regional Cooperation inTransit Transport, Solutions for Landlocked and Transit Developing Countries, 27-28 September 2007,Geneva, UNCTAD.
United Nations Economic Commission for Europe (UNECE) (2006), Extract from the UNECE Contributionto the UN Annual Report on Regional Integration, ECE/TRADE/C/NONE/2006/2, 29 May 2006, UNECE.
UNECE (2007), International E-Road Network, UNECE.
UNECE (2008), Multidisciplinary Group of Experts on Inland Transport Security, Final report to be submittedto the Bureau of the Inland Transport Committee on 18 February 2008, Informal documentAC.11 No. 1/Rev. 1 (2008), UNECE.
United Nations Economic and Social Commission for Asia and the Pacific (UNESCAP) (1995), LandTransport Linkages from Central Asia to Sea Ports in the South and the East, UNESCAP.
UNESCAP (2003), Transit Transport Issues in Landlocked and Transit Developing Countries, Note by theSecretariat, E/ESCAP/1282, UNESCAP.
UNESCAP (2006), Integrated International Transport and Logistics System for North-East Asia, UNESCAP.
UNESCAP (2008), Asian Highway Route Map, available at www.unescap.org/TTDW/common/TIS/AH/maps/ah_map_2007.jpg.
Vitins, J. (2008), “Traxx Loco Family Meets European Needs”, Railway Gazette, 7 January.
WBCSD World Business Council for Sustainable Development (2004), Mobility 2030: Meeting theChallenges to Sustainability, The Sustainable Mobility Project, Full Report, WBCSD.
World Bank (2005), Trade and Transport Facilitation in Central Asia: Reducing the Economic Distance toMarkets, Final Draft, World Bank, Washington DC.
World Trade Organization (WTO) (2007), International Trade Statistics 2007.
GLOBALISATION, TRANSPORT AND THE ENVIRONMENT © OECD 2010 159

Globalisation, Transport and the Environment
© OECD 2010
Chapter 6
International Maritime Shipping: Environmental Impacts
of Increased Activity Levels
byØyvind Endresen, Magnus Eide, Stig Dalsøren, Ivar S. Isaksen Eirik Sørgård,
James J. Corbett and James Winebrake1
It is estimated that 80% of the maritime traffic is in the northern hemisphere, with32% in the Atlantic, 29% in the Pacific, 14% in the Indian and 5% in theMediterranean Oceans. The remaining 20% of the traffic in the southern hemisphereis approximately equally distributed among the Atlantic, the Pacific and the IndianOceans. This chapter addresses the environmental impacts of the shipping activity.It explores the ongoing scientific debate regarding both the historic and the currentfuel use in the sector, which has a direct relevance for the environmental impacts ofthe sector.
The chapter describes modelling of air emissions from shipping and thegeographically resolved emission inventory. It examines atmospheric impacts.Emission of pollutants to the air from a ship is often chemically transformed tosecondary species and mixes with ambient air. The chapter explores the impact onpollution levels and climate; for example, the effect on surface ozone shows aprofound seasonality at northern latitudes. In closing, it looks at future impacts.Most scenarios for the near future, the next 10-20 years, indicate that regulationsand measures to abate emissions will be outweighed by an increase in traffic,resulting in a global increase in emissions.
161
6. INTERNATIONAL MARITIME SHIPPING: ENVIRONMENTAL IMPACTS OF INCREASED ACTIVITY LEVELS
6.1. IntroductionBuilding on the discussion of the activity level in international maritime shipping in
Chapter 3, this chapter addresses the environmental impacts of the shipping activity. As
highlighted in Chapter 3, there is an ongoing scientific debate regarding both the historic
and the current fuel use in the sector, which has a direct relevance for the environmental
impacts of the sector.
Global warming, acidification and degradation of air quality are environmental
impacts high on the international agenda. Consequently, several studies have focused on
anthropogenic emissions of compounds leading to such environmental impacts: carbon
dioxide (CO2), nitrogen oxides (NOx) and sulphur dioxide (SO2) emissions. Recent studies
indicate that the emission of CO2, NOx and SO2 by ships corresponds to about 2% to 3%
(perhaps even 4%), 10% to 15%, and 4% to 9% of the global anthropogenic emissions,
respectively (Buhaug et al., 2008; Corbett and Köhler, 2003; Dalsøren et al., 2009; Endresen
et al., 2003; 2007; Eyring et al., 2005a).
Regulations and incentives to control pollution sources are often directly aimed at
reducing total emissions, typically on a source-by-source basis. Focus is either on sources
causing the greatest impact or on the most cost-efficient sources to control (Corbett and
Koehler, 2003). Ship emissions have not previously been regulated, but the International
Maritime Organization (IMO) and EU have recently implemented some requirements for
ships. A new set of regulations is in process by IMO, EU and US EPA (Dalsøren et al., 2007;
Eyring et al., 2005b). The focus so far is mainly on NOx and SO2 emissions, but strategies for
CO2 reductions are also being considered (IMO, 2005).
Exhaust emissions from a marine diesel engine, the predominant form of power unit
in the world fleet, largely comprise excess carbon dioxide and water vapour with smaller
quantities of carbon monoxide, oxides of sulphur and nitrogen, partially reacted and non-
combusted hydrocarbons and particulate material (Lloyd’s Register of Shipping [LR], 1995).
The exhaust gases are emitted into the atmosphere from the ship stacks and diluted
through interaction with ambient air. During the dilution process in the ship plume, the
active chemical compounds are partly transformed and deposited on ground and water
surfaces. Furthermore, during oil transport and cargo handling, evaporation leads to VOC
(volatile organic compounds) emissions (Endresen et al., 2003). Shipping also emits other
compounds (e.g. refrigerants and fire fighting agents), contributes to the spread of invasive
species and has other negative impacts on biodiversity (e.g. collision with whales).
In order to reduce exhaust emissions, measures can be taken either before the
combustion process (fuel oil treatment and fuel oil modifications), during the combustion
process (reduce formation of air pollutants in the combustion process) or through after-
treatment of exhaust gases. Fuel consumption and emissions may also be reduced by
improved technical conditions (e.g. antifouling systems, engine efficiency), operational
means (e.g. reduced speed, weather routing), alternative fuels (e.g. LNG) and alternative
propulsion systems (e.g. fuel cells, sails) (Eyring et al., 2005b; Tronstad and Endresen, 2006).
GLOBALISATION, TRANSPORT AND THE ENVIRONMENT © OECD 2010162
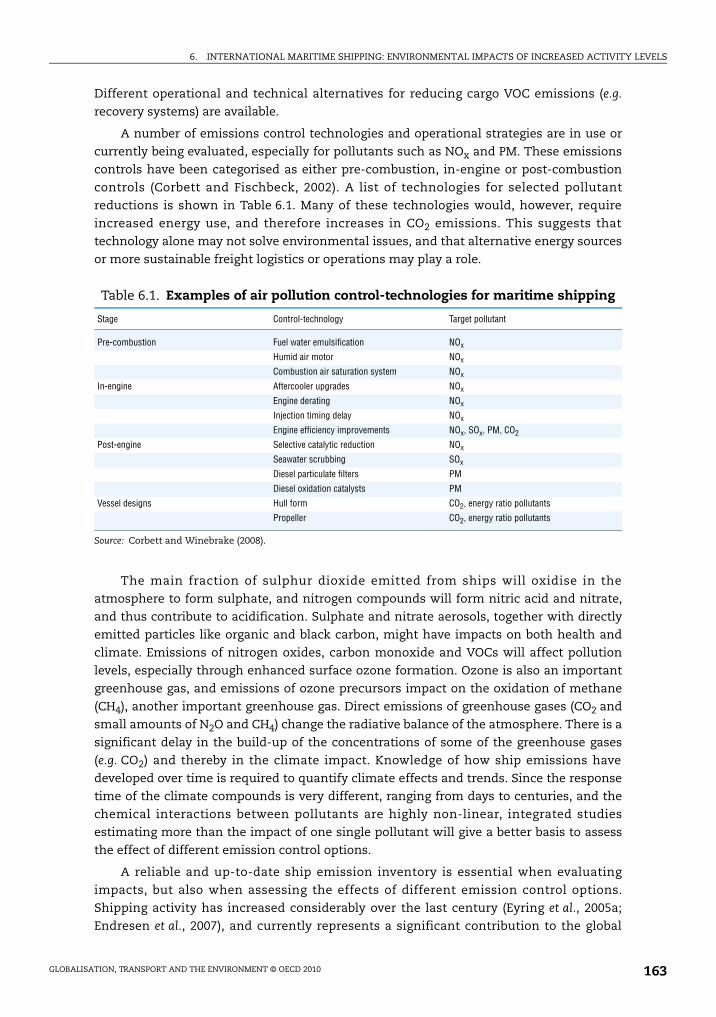
6. INTERNATIONAL MARITIME SHIPPING: ENVIRONMENTAL IMPACTS OF INCREASED ACTIVITY LEVELS
Different operational and technical alternatives for reducing cargo VOC emissions (e.g.
recovery systems) are available.
A number of emissions control technologies and operational strategies are in use or
currently being evaluated, especially for pollutants such as NOx and PM. These emissions
controls have been categorised as either pre-combustion, in-engine or post-combustion
controls (Corbett and Fischbeck, 2002). A list of technologies for selected pollutant
reductions is shown in Table 6.1. Many of these technologies would, however, require
increased energy use, and therefore increases in CO2 emissions. This suggests that
technology alone may not solve environmental issues, and that alternative energy sources
or more sustainable freight logistics or operations may play a role.
The main fraction of sulphur dioxide emitted from ships will oxidise in the
atmosphere to form sulphate, and nitrogen compounds will form nitric acid and nitrate,
and thus contribute to acidification. Sulphate and nitrate aerosols, together with directly
emitted particles like organic and black carbon, might have impacts on both health and
climate. Emissions of nitrogen oxides, carbon monoxide and VOCs will affect pollution
levels, especially through enhanced surface ozone formation. Ozone is also an important
greenhouse gas, and emissions of ozone precursors impact on the oxidation of methane
(CH4), another important greenhouse gas. Direct emissions of greenhouse gases (CO2 and
small amounts of N2O and CH4) change the radiative balance of the atmosphere. There is a
significant delay in the build-up of the concentrations of some of the greenhouse gases
(e.g. CO2) and thereby in the climate impact. Knowledge of how ship emissions have
developed over time is required to quantify climate effects and trends. Since the response
time of the climate compounds is very different, ranging from days to centuries, and the
chemical interactions between pollutants are highly non-linear, integrated studies
estimating more than the impact of one single pollutant will give a better basis to assess
the effect of different emission control options.
A reliable and up-to-date ship emission inventory is essential when evaluating
impacts, but also when assessing the effects of different emission control options.
Shipping activity has increased considerably over the last century (Eyring et al., 2005a;
Endresen et al., 2007), and currently represents a significant contribution to the global
Table 6.1. Examples of air pollution control-technologies for maritime shipping
Stage Control-technology Target pollutant
Pre-combustion Fuel water emulsification NOx
Humid air motor NOx
Combustion air saturation system NOx
In-engine Aftercooler upgrades NOx
Engine derating NOx
Injection timing delay NOx
Engine efficiency improvements NOx, SOx, PM, CO2
Post-engine Selective catalytic reduction NOx
Seawater scrubbing SOx
Diesel particulate filters PM
Diesel oxidation catalysts PM
Vessel designs Hull form CO2, energy ratio pollutants
Propeller CO2, energy ratio pollutants
Source: Corbett and Winebrake (2008).
GLOBALISATION, TRANSPORT AND THE ENVIRONMENT © OECD 2010 163
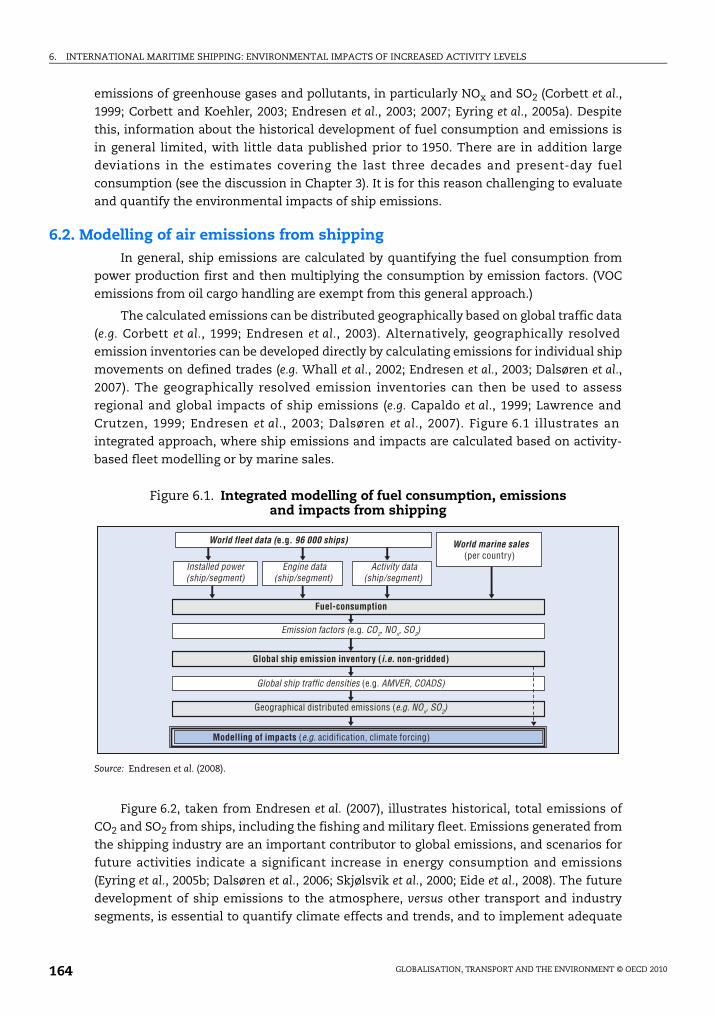
6. INTERNATIONAL MARITIME SHIPPING: ENVIRONMENTAL IMPACTS OF INCREASED ACTIVITY LEVELS
emissions of greenhouse gases and pollutants, in particularly NOx and SO2 (Corbett et al.,
1999; Corbett and Koehler, 2003; Endresen et al., 2003; 2007; Eyring et al., 2005a). Despite
this, information about the historical development of fuel consumption and emissions is
in general limited, with little data published prior to 1950. There are in addition large
deviations in the estimates covering the last three decades and present-day fuel
consumption (see the discussion in Chapter 3). It is for this reason challenging to evaluate
and quantify the environmental impacts of ship emissions.
6.2. Modelling of air emissions from shippingIn general, ship emissions are calculated by quantifying the fuel consumption from
power production first and then multiplying the consumption by emission factors. (VOC
emissions from oil cargo handling are exempt from this general approach.)
The calculated emissions can be distributed geographically based on global traffic data
(e.g. Corbett et al., 1999; Endresen et al., 2003). Alternatively, geographically resolved
emission inventories can be developed directly by calculating emissions for individual ship
movements on defined trades (e.g. Whall et al., 2002; Endresen et al., 2003; Dalsøren et al.,
2007). The geographically resolved emission inventories can then be used to assess
regional and global impacts of ship emissions (e.g. Capaldo et al., 1999; Lawrence and
Crutzen, 1999; Endresen et al., 2003; Dalsøren et al., 2007). Figure 6.1 illustrates an
integrated approach, where ship emissions and impacts are calculated based on activity-
based fleet modelling or by marine sales.
Figure 6.2, taken from Endresen et al. (2007), illustrates historical, total emissions of
CO2 and SO2 from ships, including the fishing and military fleet. Emissions generated from
the shipping industry are an important contributor to global emissions, and scenarios for
future activities indicate a significant increase in energy consumption and emissions
(Eyring et al., 2005b; Dalsøren et al., 2006; Skjølsvik et al., 2000; Eide et al., 2008). The future
development of ship emissions to the atmosphere, versus other transport and industry
segments, is essential to quantify climate effects and trends, and to implement adequate
Figure 6.1. Integrated modelling of fuel consumption, emissions and impacts from shipping
Source: Endresen et al. (2008).
World fleet data (e.g. 96 000 ships) World marine sales(per country)
Fuel-consumption
Emission factors (e.g. CO2, NOx, SO2)
Global ship emission inventory (i.e. non-gridded)
Global ship traffic densities (e.g. AMVER, COADS)
Geographical distributed emissions (e.g. NOx, SO2)
Activity data(ship/segment)
Engine data(ship/segment)
Installed power (ship/segment)
Modelling of impacts (e.g. acidification, climate forcing)
GLOBALISATION, TRANSPORT AND THE ENVIRONMENT © OECD 2010164
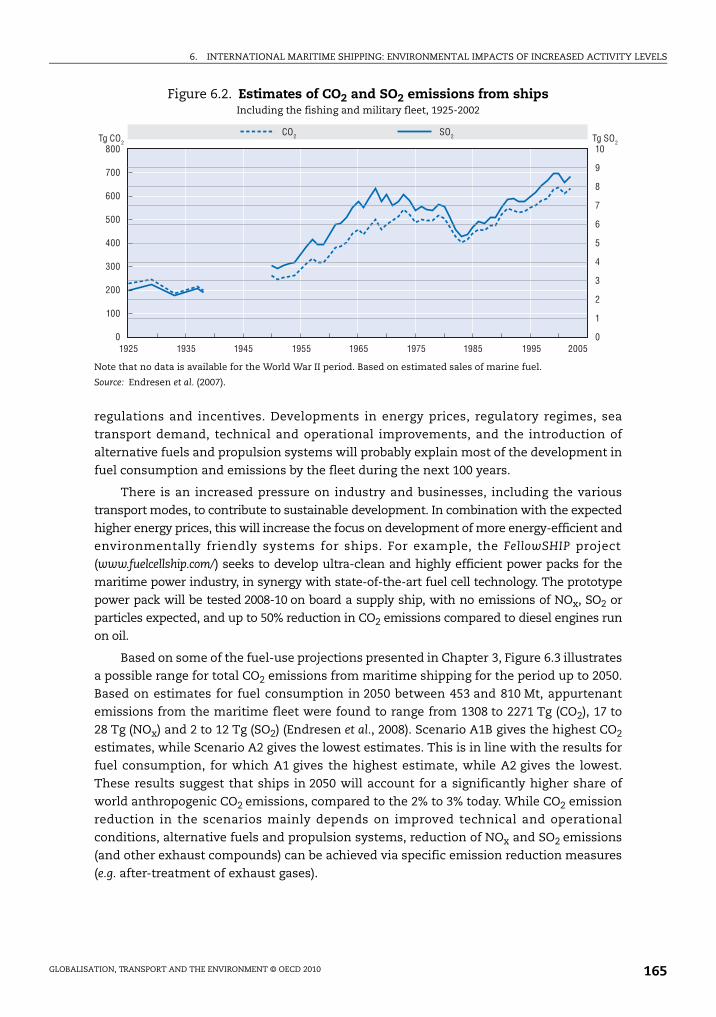
6. INTERNATIONAL MARITIME SHIPPING: ENVIRONMENTAL IMPACTS OF INCREASED ACTIVITY LEVELS
regulations and incentives. Developments in energy prices, regulatory regimes, sea
transport demand, technical and operational improvements, and the introduction of
alternative fuels and propulsion systems will probably explain most of the development in
fuel consumption and emissions by the fleet during the next 100 years.
There is an increased pressure on industry and businesses, including the various
transport modes, to contribute to sustainable development. In combination with the expected
higher energy prices, this will increase the focus on development of more energy-efficient and
environmentally friendly systems for ships. For example, the FellowSHIP project
(www.fuelcellship.com/) seeks to develop ultra-clean and highly efficient power packs for the
maritime power industry, in synergy with state-of-the-art fuel cell technology. The prototype
power pack will be tested 2008-10 on board a supply ship, with no emissions of NOx, SO2 or
particles expected, and up to 50% reduction in CO2 emissions compared to diesel engines run
on oil.
Based on some of the fuel-use projections presented in Chapter 3, Figure 6.3 illustrates
a possible range for total CO2 emissions from maritime shipping for the period up to 2050.
Based on estimates for fuel consumption in 2050 between 453 and 810 Mt, appurtenant
emissions from the maritime fleet were found to range from 1308 to 2271 Tg (CO2), 17 to
28 Tg (NOx) and 2 to 12 Tg (SO2) (Endresen et al., 2008). Scenario A1B gives the highest CO2
estimates, while Scenario A2 gives the lowest estimates. This is in line with the results for
fuel consumption, for which A1 gives the highest estimate, while A2 gives the lowest.
These results suggest that ships in 2050 will account for a significantly higher share of
world anthropogenic CO2 emissions, compared to the 2% to 3% today. While CO2 emission
reduction in the scenarios mainly depends on improved technical and operational
conditions, alternative fuels and propulsion systems, reduction of NOx and SO2 emissions
(and other exhaust compounds) can be achieved via specific emission reduction measures
(e.g. after-treatment of exhaust gases).
Figure 6.2. Estimates of CO2 and SO2 emissions from shipsIncluding the fishing and military fleet, 1925-2002
Note that no data is available for the World War II period. Based on estimated sales of marine fuel.
Source: Endresen et al. (2007).
800 10
9
8
7
6
5
4
3
2
1
0
700
600
500
400
300
200
100
01925 1935 1945 1955 1965 1975 1985 1995 2005
Tg CO2 Tg SO2
CO2 SO2
GLOBALISATION, TRANSPORT AND THE ENVIRONMENT © OECD 2010 165
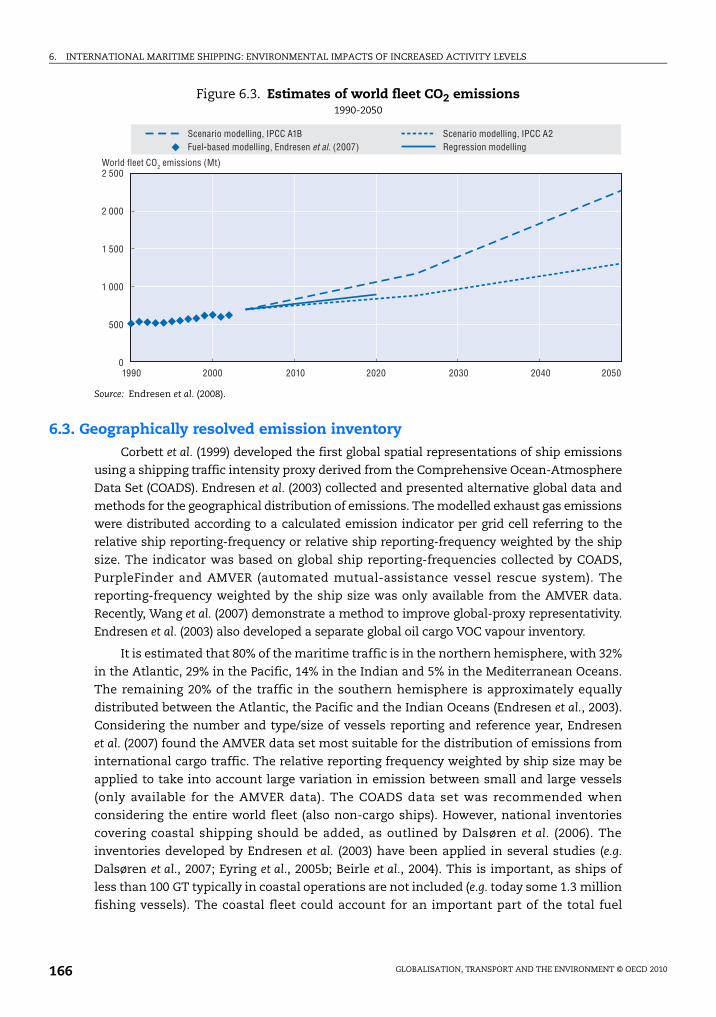
6. INTERNATIONAL MARITIME SHIPPING: ENVIRONMENTAL IMPACTS OF INCREASED ACTIVITY LEVELS
6.3. Geographically resolved emission inventoryCorbett et al. (1999) developed the first global spatial representations of ship emissions
using a shipping traffic intensity proxy derived from the Comprehensive Ocean-Atmosphere
Data Set (COADS). Endresen et al. (2003) collected and presented alternative global data and
methods for the geographical distribution of emissions. The modelled exhaust gas emissions
were distributed according to a calculated emission indicator per grid cell referring to the
relative ship reporting-frequency or relative ship reporting-frequency weighted by the ship
size. The indicator was based on global ship reporting-frequencies collected by COADS,
PurpleFinder and AMVER (automated mutual-assistance vessel rescue system). The
reporting-frequency weighted by the ship size was only available from the AMVER data.
Recently, Wang et al. (2007) demonstrate a method to improve global-proxy representativity.
Endresen et al. (2003) also developed a separate global oil cargo VOC vapour inventory.
It is estimated that 80% of the maritime traffic is in the northern hemisphere, with 32%
in the Atlantic, 29% in the Pacific, 14% in the Indian and 5% in the Mediterranean Oceans.
The remaining 20% of the traffic in the southern hemisphere is approximately equally
distributed between the Atlantic, the Pacific and the Indian Oceans (Endresen et al., 2003).
Considering the number and type/size of vessels reporting and reference year, Endresen
et al. (2007) found the AMVER data set most suitable for the distribution of emissions from
international cargo traffic. The relative reporting frequency weighted by ship size may be
applied to take into account large variation in emission between small and large vessels
(only available for the AMVER data). The COADS data set was recommended when
considering the entire world fleet (also non-cargo ships). However, national inventories
covering coastal shipping should be added, as outlined by Dalsøren et al. (2006). The
inventories developed by Endresen et al. (2003) have been applied in several studies (e.g.
Dalsøren et al., 2007; Eyring et al., 2005b; Beirle et al., 2004). This is important, as ships of
less than 100 GT typically in coastal operations are not included (e.g. today some 1.3 million
fishing vessels). The coastal fleet could account for an important part of the total fuel
Figure 6.3. Estimates of world fleet CO2 emissions1990-2050
Source: Endresen et al. (2008).
2 500
2 000
1 500
1 000
500
01990 2000 2010 2020 2030 2040 2050
World fleet CO2 emissions (Mt)
Fuel-based modelling, Endresen et al. (2007)Scenario modelling, IPCC A1B
Regression modellingScenario modelling, IPCC A2
GLOBALISATION, TRANSPORT AND THE ENVIRONMENT © OECD 2010166
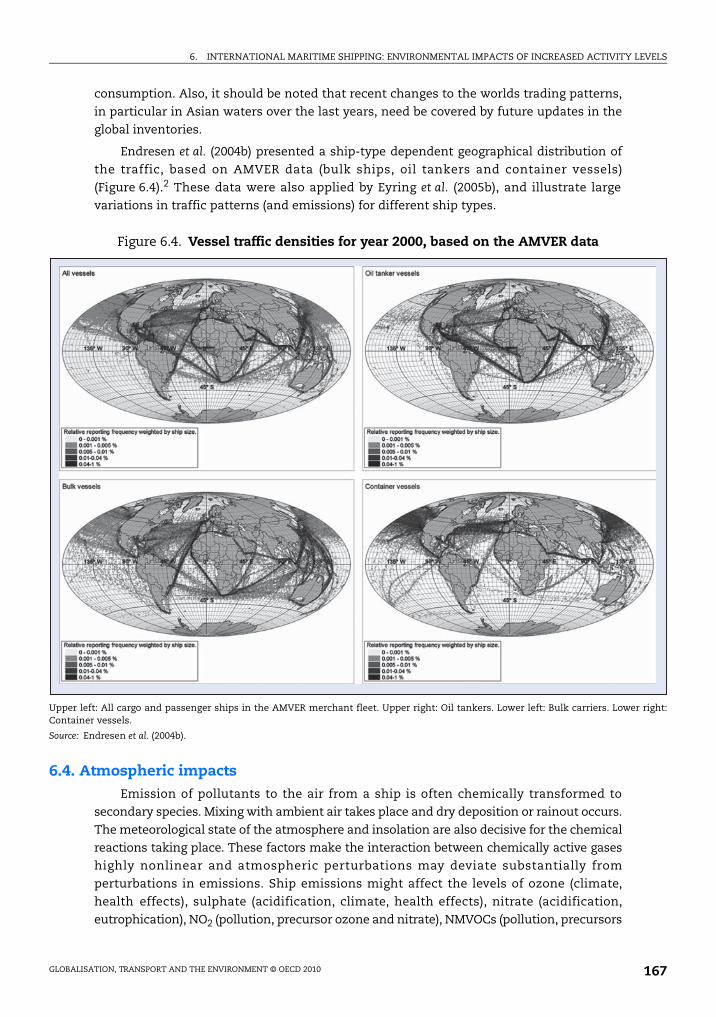
6. INTERNATIONAL MARITIME SHIPPING: ENVIRONMENTAL IMPACTS OF INCREASED ACTIVITY LEVELS
r right:
consumption. Also, it should be noted that recent changes to the worlds trading patterns,
in particular in Asian waters over the last years, need be covered by future updates in the
global inventories.
Endresen et al. (2004b) presented a ship-type dependent geographical distribution of
the traffic, based on AMVER data (bulk ships, oil tankers and container vessels)
(Figure 6.4).2 These data were also applied by Eyring et al. (2005b), and illustrate large
variations in traffic patterns (and emissions) for different ship types.
6.4. Atmospheric impactsEmission of pollutants to the air from a ship is often chemically transformed to
secondary species. Mixing with ambient air takes place and dry deposition or rainout occurs.
The meteorological state of the atmosphere and insolation are also decisive for the chemical
reactions taking place. These factors make the interaction between chemically active gases
highly nonlinear and atmospheric perturbations may deviate substantially from
perturbations in emissions. Ship emissions might affect the levels of ozone (climate,
health effects), sulphate (acidification, climate, health effects), nitrate (acidification,
eutrophication), NO2 (pollution, precursor ozone and nitrate), NMVOCs (pollution, precursors
Figure 6.4. Vessel traffic densities for year 2000, based on the AMVER data
Upper left: All cargo and passenger ships in the AMVER merchant fleet. Upper right: Oil tankers. Lower left: Bulk carriers. LoweContainer vessels.
Source: Endresen et al. (2004b).
GLOBALISATION, TRANSPORT AND THE ENVIRONMENT © OECD 2010 167
6. INTERNATIONAL MARITIME SHIPPING: ENVIRONMENTAL IMPACTS OF INCREASED ACTIVITY LEVELS
ozone), SO2 (pollution, precursor sulphate), OH and its effect on methane (climate), and
aerosols (pollution, climate). Computer models are often used to quantify the impacts.
Global and regional chemical transport models (CTMs) contain comprehensive chemical
packages, including the calculation of some or all the above-mentioned compounds.
Meteorological data (winds, temperature, precipitation, clouds, etc.) used as input for the
CTM calculations are provided by weather prediction models or climate models.
Satellite observations indicate high NOx concentrations along major shipping lanes
(Beirle et al., 2004; Richter et al., 2004). Regional emission estimates based on these
observed concentrations are in good agreement with global emission inventories. Ship
plume processes are generally not resolved by global models with a resolution (grid-box
sizes) from hundred to several hundreds of kilometres. These models therefore distribute
emissions over larger areas. Detailed chemical box-model studies and measurements
increase our understanding of subgrid-scale processes taking place within fresh,
undiluted, plumes and during the first stages of dilution. Studies and measurements
indicate that plume chemistry have to be better taken into account in the impact modelling
(Kasibhatla et al., 2000; Chen et al., 2005; Song et al., 2003; von Glasow et al., 2003). These
studies suggest enhanced NOx destruction within the ship plumes. It is possible that some
models might overestimate the effect of ship emissions on the NOx, OH and ozone budget,
and one way to overcome this is to multiply with a reduction factor (effective emission) or
introduce plume chemistry in the global models. However, the amount of observations
from ship plumes is limited and more data and studies are needed. This was also the
conclusion in comparisons between global models and observations over oceanic and
coastal areas (Dalsøren et al., 2007; Eyring et al., 2007).
Impacts on pollution levels and climate
Primary components, like particles NO2, CO, NMVOCs and SO2, may cause problems in
coastal areas and harbours with heavy traffic because of their impact on human health at
high concentrations (Saxe et al., 2004; EPA, 2003). Secondary species formed from the
effluents in the ship emissions have longer chemical lifetimes and are transported in the
atmosphere over several hundreds of kilometres. Thereby they can contribute to air quality
problems on land. This is relevant for ozone and the deposition of sulphur and nitrogen
compounds, which cause acidification of natural ecosystems and freshwater bodies and
threaten biodiversity through excessive nitrogen input (eutrophication) (Vitousek et al.,
1997; Galloway et al., 2004; Bouwman et al., 2002).
The highest surface increases in short-lived pollutants like NO2 are found close to the
regions with heavy traffic around the North Sea and the English Channel. Model studies in
general find NO2 to be more than doubled along the major world shipping lanes (Endresen
et al., 2003; Lawrence and Crutzen, 1999; Dalsøren et al., 2007; Eyring et al., 2007).
The ozone levels in the lower atmosphere are dependent on competitive reactions
between formation and sink cycles. The abundance of NOx (NO + NO2) is crucial for ozone
formation, but the number of ozone molecules formed is also dependent on the presence of
CO and NMVOCs. In general, an emission perturbation is most effective in increasing ozone
in regions with low background pollution. Ozone is also a major greenhouse gas. Ozone is
estimated to be the third most important of the greenhouse gases contributing to warming
since the pre-industrial era (Ramaswamy et al., 2001). Exposure to high ozone levels is linked
to aggravation of existing respiratory problems like asthma, increased susceptibility
(infections, allergens and pollutants), inflammation, chest pain and coughing (Mauzerall and
GLOBALISATION, TRANSPORT AND THE ENVIRONMENT © OECD 2010168
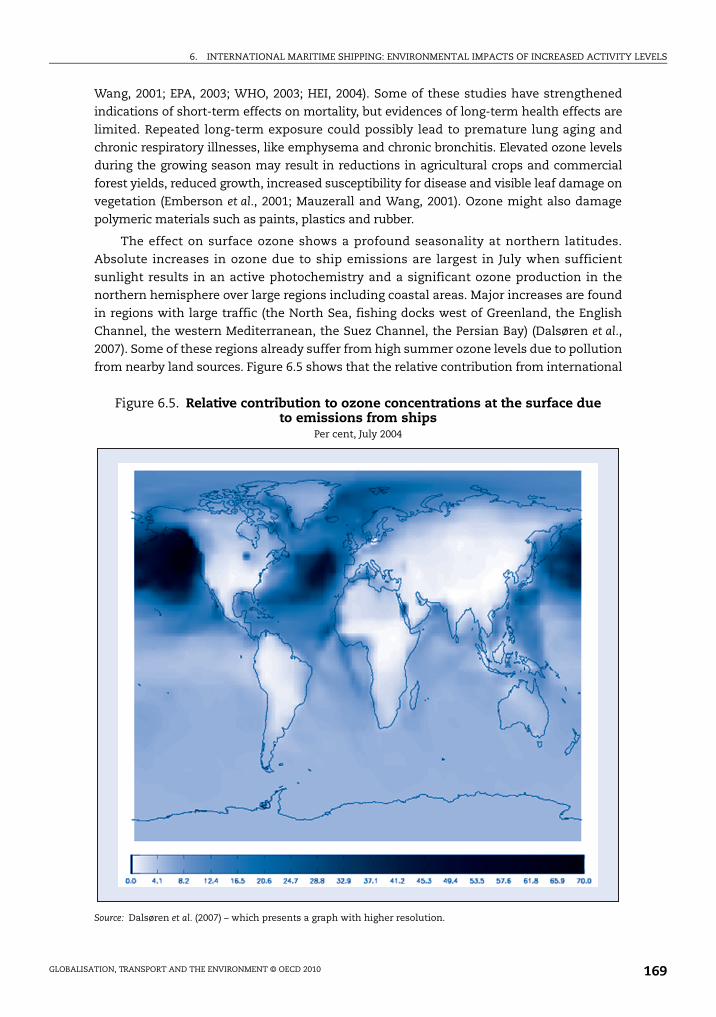
6. INTERNATIONAL MARITIME SHIPPING: ENVIRONMENTAL IMPACTS OF INCREASED ACTIVITY LEVELS
Wang, 2001; EPA, 2003; WHO, 2003; HEI, 2004). Some of these studies have strengthened
indications of short-term effects on mortality, but evidences of long-term health effects are
limited. Repeated long-term exposure could possibly lead to premature lung aging and
chronic respiratory illnesses, like emphysema and chronic bronchitis. Elevated ozone levels
during the growing season may result in reductions in agricultural crops and commercial
forest yields, reduced growth, increased susceptibility for disease and visible leaf damage on
vegetation (Emberson et al., 2001; Mauzerall and Wang, 2001). Ozone might also damage
polymeric materials such as paints, plastics and rubber.
The effect on surface ozone shows a profound seasonality at northern latitudes.
Absolute increases in ozone due to ship emissions are largest in July when sufficient
sunlight results in an active photochemistry and a significant ozone production in the
northern hemisphere over large regions including coastal areas. Major increases are found
in regions with large traffic (the North Sea, fishing docks west of Greenland, the English
Channel, the western Mediterranean, the Suez Channel, the Persian Bay) (Dalsøren et al.,
2007). Some of these regions already suffer from high summer ozone levels due to pollution
from nearby land sources. Figure 6.5 shows that the relative contribution from international
Figure 6.5. Relative contribution to ozone concentrations at the surface due to emissions from ships
Per cent, July 2004
Source: Dalsøren et al. (2007) – which presents a graph with higher resolution.
GLOBALISATION, TRANSPORT AND THE ENVIRONMENT © OECD 2010 169

6. INTERNATIONAL MARITIME SHIPPING: ENVIRONMENTAL IMPACTS OF INCREASED ACTIVITY LEVELS
shipping to surface ozone is even larger over mid-oceans where, as earlier mentioned,
ozone production is relatively more efficient due to low background pollution levels. The
relative contribution is also significant over coastal areas on the west coast of North
America and western Europe. Similar contributions to ozone are found by Cofala et al.
(2007), Derwent et al. (2005), Collins et al. (2007), and Eyring et al. (2007) and Cofala et al.
(2007) discuss the European health impacts related to ground level ozone and the
contribution from shipping both for current (year 2000) and future scenarios (year 2020).
With regard to climate effects, the ozone perturbations at high altitudes are important.
Ozone produced near the emission sources or produced during the transport process is
lifted by convection and frontal systems to higher altitudes where the lifetime is longer
and transport faster. Typical relative tropospheric column increases due to ship traffic (not
shown) are 7% to 14% in the northern hemisphere, and 2% to 7% in the southern
hemisphere (Dalsøren et al., 2007).
Hydroxyl (OH) is the main oxidant in the troposphere (Levy, 1971). This radical reacts
with and removes several pollutants and greenhouse gases; one of them is methane (CH4).
The OH abundance itself is in turn highly dependent on some of these pollutants, in
particular CH4, NOx, O3 and CO (Dalsøren and Isaksen, 2006; Wang and Jacob, 1998;
Lelieveld et al., 2002). Whereas CO and CH4 emissions tend to reduce current global
averaged OH levels, the overall effect of NOx emissions is to increase OH (Dalsøren and
Isaksen, 2006). Due to the large NOx emissions from shipping, shipping leads to quite large
increases in OH concentrations. Since reaction with OH is the major loss of methane from
the atmosphere, ship emissions (for current atmospheric conditions) decrease the
concentration of the greenhouse gas methane. Reductions in methane lifetime due to
shipping NOx vary between 1.5% and 5% in different calculations (Lawrence and Crutzen,
1999; Endresen et al., 2003; Dalsøren et al., 2007 and 2009; Eyring et al., 2007).
NOx oxidation by OH leads to formation of nitric acid and nitrate. When nitric acid and
nitrate undergo dry deposition or rainout it may contribute to eutrophication or
acidification in vulnerable ecosystems (Vitousek et al., 1997; Galloway et al., 2004). Sulphur
emissions might reduce air quality over land e.g. by contributing to sulphate particles and
sulphate deposition. SO2 emissions from shipping are oxidised to sulphate primarily in the
aqueous phase (in cloud droplets and sea salt particles) and also in the gas phase by the OH
radical. The largest impact of shipping on sulphate chemistry is through the direct
emissions of SO2. However, increases in the OH radical due to NOx emissions will enhance
the gaseous oxidation pathway. This pathway is also important since it leads to new
particle generation whereas aqueous oxidation adds mass to existing particles. Currently
shipping increases the global sulphate loading with about 3% (Endresen et al., 2003; Eyring
et al., 2007). But the relative load in some coastal areas is much higher. Figure 6.6, taken
from Dalsøren et al. (2008), shows the impact of ship emissions on wet deposition of nitrate
and sulphur. These are major components of acid rain. The largest contributions can be
seen in seasons with much rainfall on the west coast of the continents where westerly
winds often prevail. Parts of Scandinavia are particularly vulnerable to acid precipitation
due to slowly weathering bedrock. The impact of shipping emissions on this region is large,
with a contribution above 30% in nitrate wet deposition and 10% to 25% in sulphate wet
deposition. Coastal countries in western Europe, North-western America and partly
eastern America are also substantially impacted, with relative contributions between 5%
and 20%. Similar numbers were found by Endresen et al. (2003), Collins et al. (2007),
GLOBALISATION, TRANSPORT AND THE ENVIRONMENT © OECD 2010170
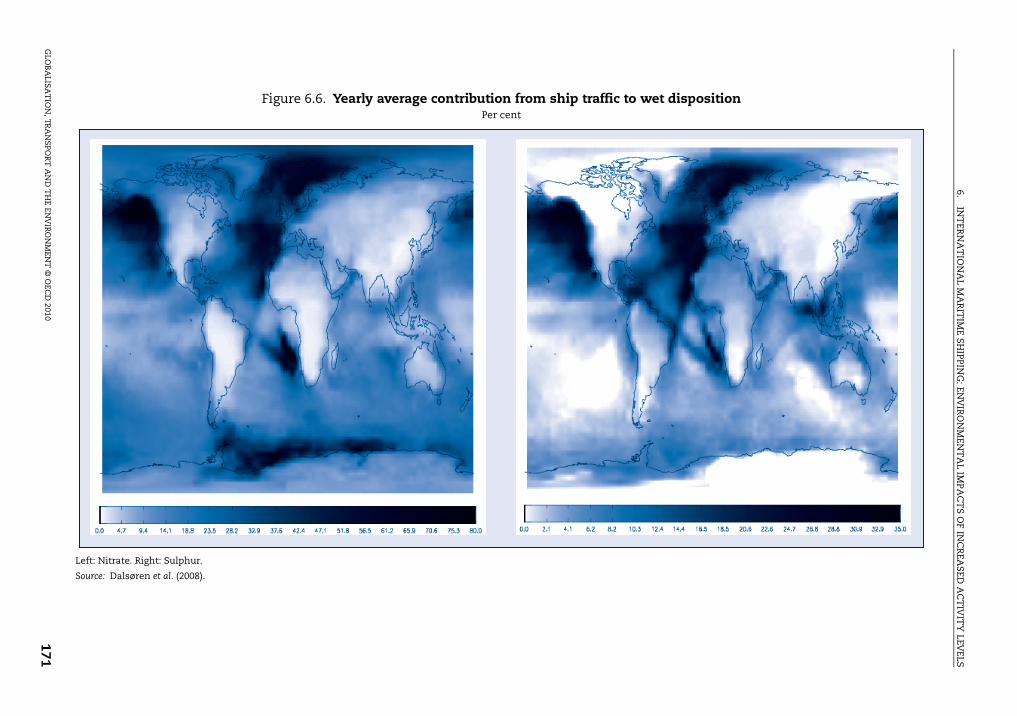
6.IN
TER
NA
TIO
NA
L MA
RIT
IME SH
IPPING
: ENV
IRO
NM
ENT
AL IM
PAC
TS O
FIN
CR
EASED
AC
TIV
ITY
LEVELS
GLO
BA
LISAT
ION
, TRA
NS
POR
T A
ND
TH
E ENV
IRO
NM
ENT
© O
ECD
2010171
wet disposition
Le
So
Figure 6.6. Yearly average contribution from ship traffic toPer cent
ft: Nitrate. Right: Sulphur.
urce: Dalsøren et al. (2008).
6. INTERNATIONAL MARITIME SHIPPING: ENVIRONMENTAL IMPACTS OF INCREASED ACTIVITY LEVELS
Dalsøren et al. (2007) and Lauer et al. (2007). Marmer and Langmann (2005) found large
increases in sulphate in the Mediterranean Sea due to shipping.
For other particles than sulphate (Black carbon [soot], organic carbon, etc.), the
contribution from shipping seems to be moderate, a few per cent in the most impacted
areas (Lauer et al., 2007; Dalsøren et al., 2007; Dalsøren et al., 2008). But it should be noted
that the uncertainty regarding the amounts emitted of these components is large. There is
much concern about a number of health impacts of the fine and ultra-fine aerosols in
polluted areas (Martuzzi et al., 2003; Nel, 2005). Severe short- and long-term influences on
illness and mortality due to effects on the cardiovascular system and lungs (for example
lung cancer) occur with current pollution episodes and average levels in large cities (HEI,
2004; WHO, 2003). A non-threshold linear relationship with mortality and hospital
admissions has been observed in several settings. Particles like soot may also lead to
soiling of materials. Corbett et al. (2007) estimates 20 000 to 104 000 premature deaths each
year globally related to particles caused by shipping.
Aerosols also have a direct effect on climate and visibility by scattering and/or absorbing
solar radiation, thereby influencing the radiative balance (Penner et al., 2001; Ramanathan
et al., 2001). Whether this leads to an overall cooling or heating of the surface depends on
several factors, like the ratio of scattering and absorption (aerosols composition/properties),
cloud fraction and surface albedo (Ramanathan et al., 2001). Aerosols can act as condensation
nuclei, modify cloud properties and precipitation rates, and through that have indirect climate
effects. Aerosols may increase the number of cloud drops, and thereby increase reflected solar
radiation to space which lead to a cooling (called 1st indirect effect [Twomey, 1974]). When the
number of cloud droplets increases, this may decrease precipitation efficiency. This could also
result in an increase in cloud lifetime and amount (Kaufman and Koren, 2006), which increases
the reflection of solar radiation (2nd indirect effect [Rosenfeld et al., 2000]). Reactions on aerosol
surfaces may also modify the chemical composition of both the aerosol and gas phases (Tie
et al., 2005). The effects of aerosols emissions from ships on clouds are visible as so called
ship-tracks in satellite images. Narrow stripes shows up downwind of the ships as bright
features in the images (Schreier et al., 2007). Airborne measurements in a cloud-free
environment above a cargo ship showed that approximately 12% of exhaust particles act as
nuclei where clouds could form (Hobbs et al., 2000). Several studies show that the droplet
concentration in the ship-tracks was enhanced significantly compared to ambient clouds and
that the effective radius was reduced (Durkee et al., 2000; Ferek et al., 2000; Schreier et al., 2006).
The smaller water droplets are then less likely to grow into larger drops of precipitation size,
extending the lifetime of the cloud and increasing reflectivity. A satellite study of clouds
forming in the region of the English Channel showed a trend of increasing cloud reflectivity
and decreasing cloud top temperature (Devasthale et al., 2006), which may be related to
increased ship emissions. Nearby polluted land regions showed opposite trends, probably due
to reductions in particle emissions from land sources.
Radiative forcing (RF) calculations quantify the radiation balance at the top of the
atmosphere due to components affecting the radiation budget. RF is a metric to quantify
climate impacts from different sources in units of W per m2, since there is an approximately
linear relationship between global mean radiative forcing and change in global mean surface
temperature (Forster et al., 2007). Ship emissions impact the concentrations of greenhouse
gases (mainly CO2, CH4 and O3) and aerosols, causing both positive and negative contributions
to direct RF. In addition, ship-derived aerosols cause a significant indirect RF, through changes
in cloud microphysics (see previous paragraph). Table 6.2 summarises estimates of the
GLOBALISATION, TRANSPORT AND THE ENVIRONMENT © OECD 2010172
6. INTERNATIONAL MARITIME SHIPPING: ENVIRONMENTAL IMPACTS OF INCREASED ACTIVITY LEVELS
present-day contribution of ship emissions to RF from several studies (Capaldo et al., 1999;
Endresen et al., 2003; Eyring et al., 2007; Lee et al., 2007; Lauer et al., 2007; Dalsøren et al., 2007;
Fuglestvedt et al., 2008). The range of values are wide, some of the uncertainties are related to
use of different emission distributions and totals. Much of the rest is connected to uncertain
historical evolution of long-lived components like CO2 and CH4, uncertainties in chemical
calculations for reactive components (nonlinear chemistry), and the complexity and limited
understanding of indirect effects. In summary, the studies indicate that ship emissions lead to
a net global cooling.3 This is different from other transport sectors (Fuglestvedt et al., 2008).
However, it should be stressed that the uncertainties are large, in particular for
indirect effects, and RF is only a first measure of climate changes. It is also important to
have in mind that the forcing from different components act on different temporal and
spatial scales. A long-lived, well-mixed component like CO2 has global effects that last for
centuries. Shorter-lived species, like ozone and aerosols, might have effects that are
strongly regionally confined, lasting over a few weeks. The regional aspects are important
as weather systems tend to be driven by regional gradients in temperature.
It should also be kept in mind that the net cooling effect that so far has been found
primarily affects ocean areas, and thus does not help alleviate negative impacts of global
warming for human habitats.
Future impacts
Model studies of future impacts from ship emissions are dependent on the projections
used as baseline for the emission calculations. Most scenarios for the near future, the next
10-20 years, indicate that regulations and measures to abate emissions will be outweighed
by an increase in traffic, resulting in a global increase in emissions. Assuming no changes
in non-shipping emissions, Dalsøren et al. (2007) found that the scenarios for shipping
activities lead to more than 20% increase in NO2 emissions from 2000 to 2015 in some
coastal areas. Ozone increases are in general small. Wet deposition of acidic species was
found to increase up to 10% in areas where current critical loads are exceeded. Regulations
limiting the sulphur-content in fuels in the North Sea and English Channel will reduce
sulphate deposition in nearby coastal regions. Expected increased oil and gas transport by
ships from Norway and Northwest Russian Federation, sea transport along the northern
Sea Route will have a significant regional effect by increases of acid deposition in the North
Scandinavia and the Kola Peninsula. Augmented levels of particles in the Arctic were
found, and thus the contribution from ship traffic to phenomena like Arctic haze could be
increasing. With sea ice expected to recede in the Arctic during the 21st century as a result
of projected climate warming, global shipping patterns could change considerably in the
decades ahead. Granier et al. (2006) uses one of the upper-end emission estimates for 2050
from Eyring et al. (2005b) and introduce some of the traffic into Arctic waters. During the
summer months, surface ozone concentrations in the Arctic could be enhanced by a factor
Table 6.2. Radiative forcing for year 2000 of different componentsmW per m2
Components CO2 SO4 CH4 O3 BC OC Indirect
Range + 26-43 ÷12-47 ÷11-56 +8-41 +1.1-2.9 ÷0.1-0.5 ÷38-600
Text in italics denotes positive forcing (warming) and the bold denotes negative forcing (cooling).Sources: Capaldo et al. (1999); Endresen et al. (2003); Eyring et al. (2007); Lee et al. (2007); Lauer et al. (2007); Dalsørenet al. (2007) and Fuglestvedt et al. (2008).
GLOBALISATION, TRANSPORT AND THE ENVIRONMENT © OECD 2010 173
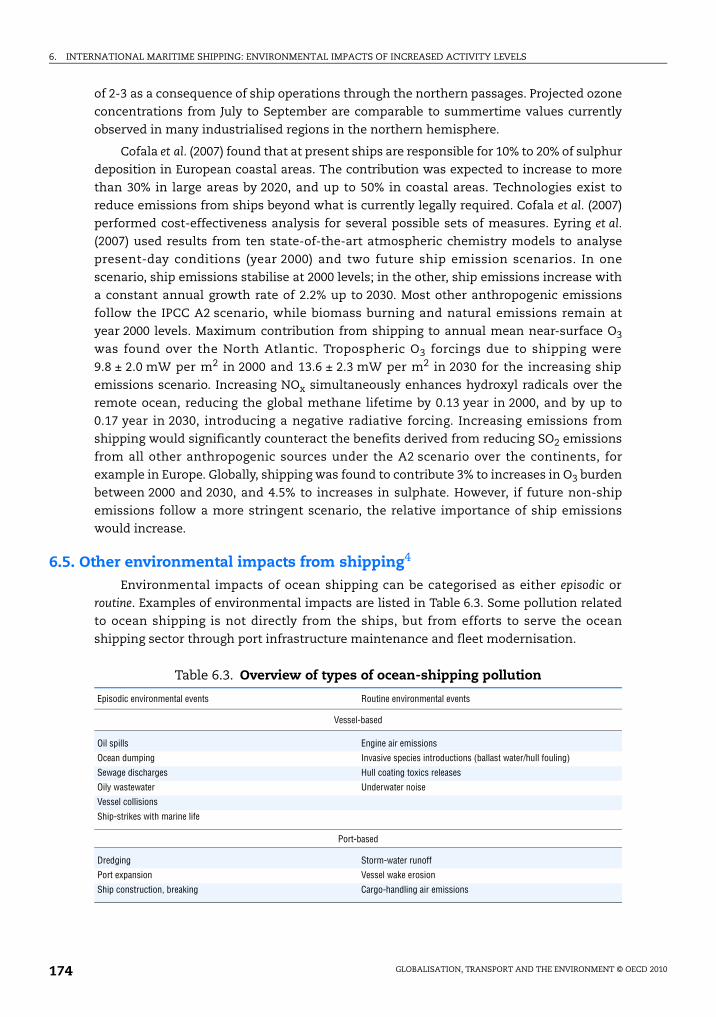
6. INTERNATIONAL MARITIME SHIPPING: ENVIRONMENTAL IMPACTS OF INCREASED ACTIVITY LEVELS
of 2-3 as a consequence of ship operations through the northern passages. Projected ozone
concentrations from July to September are comparable to summertime values currently
observed in many industrialised regions in the northern hemisphere.
Cofala et al. (2007) found that at present ships are responsible for 10% to 20% of sulphur
deposition in European coastal areas. The contribution was expected to increase to more
than 30% in large areas by 2020, and up to 50% in coastal areas. Technologies exist to
reduce emissions from ships beyond what is currently legally required. Cofala et al. (2007)
performed cost-effectiveness analysis for several possible sets of measures. Eyring et al.
(2007) used results from ten state-of-the-art atmospheric chemistry models to analyse
present-day conditions (year 2000) and two future ship emission scenarios. In one
scenario, ship emissions stabilise at 2000 levels; in the other, ship emissions increase with
a constant annual growth rate of 2.2% up to 2030. Most other anthropogenic emissions
follow the IPCC A2 scenario, while biomass burning and natural emissions remain at
year 2000 levels. Maximum contribution from shipping to annual mean near-surface O3
was found over the North Atlantic. Tropospheric O3 forcings due to shipping were
9.8 ± 2.0 mW per m2 in 2000 and 13.6 ± 2.3 mW per m2 in 2030 for the increasing ship
emissions scenario. Increasing NOx simultaneously enhances hydroxyl radicals over the
remote ocean, reducing the global methane lifetime by 0.13 year in 2000, and by up to
0.17 year in 2030, introducing a negative radiative forcing. Increasing emissions from
shipping would significantly counteract the benefits derived from reducing SO2 emissions
from all other anthropogenic sources under the A2 scenario over the continents, for
example in Europe. Globally, shipping was found to contribute 3% to increases in O3 burden
between 2000 and 2030, and 4.5% to increases in sulphate. However, if future non-ship
emissions follow a more stringent scenario, the relative importance of ship emissions
would increase.
6.5. Other environmental impacts from shipping4
Environmental impacts of ocean shipping can be categorised as either episodic or
routine. Examples of environmental impacts are listed in Table 6.3. Some pollution related
to ocean shipping is not directly from the ships, but from efforts to serve the ocean
shipping sector through port infrastructure maintenance and fleet modernisation.
Table 6.3. Overview of types of ocean-shipping pollution
Episodic environmental events Routine environmental events
Vessel-based
Oil spills Engine air emissions
Ocean dumping Invasive species introductions (ballast water/hull fouling)
Sewage discharges Hull coating toxics releases
Oily wastewater Underwater noise
Vessel collisions
Ship-strikes with marine life
Port-based
Dredging Storm-water runoff
Port expansion Vessel wake erosion
Ship construction, breaking Cargo-handling air emissions
GLOBALISATION, TRANSPORT AND THE ENVIRONMENT © OECD 2010174

6. INTERNATIONAL MARITIME SHIPPING: ENVIRONMENTAL IMPACTS OF INCREASED ACTIVITY LEVELS
Episodic pollution discharges are among those best understood by the commercial
industry and policy makers, as evidenced by the international conventions and national
regulations addressing them. The dominant mitigation approach is to prohibit pollution
episodes from occurring (such as ocean dumping), to design systems that are safer (as in
double-hulls to prevent oil spills or traffic separation schemes to avoid collisions), to confine
activities that produce untreated discharges to safer times or locations (e.g. environmental
windows for dredging), to require onboard treatment before discharge (e.g. oily water
separators), and/or to provide segregated holding and transfer to reception facilities at port
(as in sewage handling).
Routine pollution releases are different than episodic discharges because they
represent activities necessary for the safe operation of the vessel, whether at sea or in port.
Regulation of routine releases has lagged in policy action to address episodic discharges,
partly because these impacts were not as well understood in the past, and partly because
operational behaviour must change and/or new technology is required.
Shipping’s shift to larger and faster ships is also associated with increased lethality to
marine mammals and other animals that may be struck by vessels (Vanderlaan and
Taggart, 2007). The reported number of vessels striking large whales worldwide has
increased three-fold since the 1970s, as has the number, sizes, and speeds of vessels in the
world fleet (Corbett et al., under review). Figure 6.7 shows the relationship between annual
reported North Atlantic right whale strikes and average global ship momentum. North
Atlantic right whales (Eubalaena glacialis) are critically endangered throughout their range
along the eastern coast of North America (NOAA, 2003). The primary risk right whales face
within this area, along with several other species of large whales, is being struck by large
vessels transiting between ports along the eastern seaboard of the United States (Laist
et al., 2001). Approximately 35% of all right whale deaths documented between 1970
and 1989 have been attributed to ship strikes; while data from the period 1991-98 attribute
47% of right whale deaths to ship strikes (Knowlton and Kraus, 2001; Laist et al., 2001). The
Figure 6.7. Relationship between right whale strikes and global average ship momentum
Source: Whale data from Kenedy, R.D. (2001), “the North Atlantic Right Whale Consortium Databases”, Maritimes43:3-5; Ship data derived from Lloyd’s Register of Shipping (2006). Extracts from the World merchant fleet databasefor 2001 to 2006, Lloyd’s Register of Shipping, London.
0 0.50 1.00 1.50 2.00
25
20
15
10
5
0
Index of ship momentum (product of speed and tonnage, 1999 = 1)
Annual reported right whale strikes
y = 11.343x + 1.3014R2 = 0.6166
GLOBALISATION, TRANSPORT AND THE ENVIRONMENT © OECD 2010 175
6. INTERNATIONAL MARITIME SHIPPING: ENVIRONMENTAL IMPACTS OF INCREASED ACTIVITY LEVELS
relationship illustrated in Figure 6.8 implies that if ships become larger and increase their
speeds (in order to meet the demands of a globalised economy), an increase in mammal
strikes will likely occur.
Another important environmental problem due to globalisation is the introduction of
invasive species (Bright, 1999). Some species are introduced intentionally and
subsequently escape, while others are introduced accidentally. Invasive species are
implicated in 458 of the 900 species currently listed as either threatened or endangered in
the United States. Research consistently identifies shipping (hull fouling, solid and water
ballast) as a major invasion pathway since the 1500s when global maritime trade
established routine intercontinental waterborne routes (Ricciardi, 2006; Ruiz et al., 2000a;
Ruiz et al., 2000b; Wonham and Carlton, 2005). Native species can be transported by ships
many thousands of kilometres and then released into non-native waters. These non-native
species sometimes have the capacity to become “invasive”, i.e. they can reproduce rapidly
and tip the sensitive species balance that often exists in a given ecosystem.
Trends in non-native species invasions have tended to be correlated with increased
seaborne trade and ship tonnage. However, recent research has also suggested that species
invasions may be more related to increased diversity of global transport routes and cargoes
traded than to the volume of shipping or trade activity. One recent study suggests that
exponential trends in cumulative species invasions from ship ballast could result from
constant introduction rates and species survivability (Endresen et al., 2004b; Wonham and
Pachepsky, 2006). The significant costs associated with aquatic invasive species (Lovell et al.,
2006; Pimentel et al., 2005)5 have motivated efforts to establish a global, integrated technology
policy framework to prevent non-native species introductions by ships (Firestone and Corbett,
2005; IMO, 2004; Theis et al., 2004). New technologies and operational approaches are now
being developed to remove and destroy non-native species in ship ballast waters.
Levine and D’Antonio (2003) show that, although the number of non-native species is
positively correlated with trade, because the number of potential invaders is finite,
invasions will attenuate with time, rendering the relationship between invasions and trade
concave. Moreover, Costello and Solow (2003) pointed out that there is a lag in the discovery
process, so that the number of exotic species observed at any point in time underestimates
the number actually present. Costello et al. (2007) estimated the rate at which new
introductions arise as a result of trade. They used data on invasions in San Francisco Bay to
calculate the marginal invasion risk (MIR) from imports from different regions. They find
that imports from historic trade partners – specifically those in the Atlantic and
Mediterranean (ATM) and West Pacific (WPC) regions – have been responsible for the lion’s
share of exotic species in San Francisco Bay, with invasions from ATM nearly double those
from the WPC (74 and 43 respectively). However, the MIR from future WPC imports
(0.38 additional introductions per additional million short tons imported) are triple that
from future ATM imports (0.11). They projected that business-as-usual imports from ATM
and WPC will lead to 1.4 and 52.4 introductions of new exotic species into San Francisco
Bay by 2020; they offer no forecasts of introductions into other ports.
In a related vein, Kasperski (2008) used cross-sectional data and instruments for trade
intensity and income levels to test whether the generally beneficial effect of openness on
environmental indicators extends to biotic resources. While he found no statistically
significant impact of trade intensity on the number of endemic species, he found a positive
and statistically significant effect on the number of non-endemic species; he calculates
GLOBALISATION, TRANSPORT AND THE ENVIRONMENT © OECD 2010176
6. INTERNATIONAL MARITIME SHIPPING: ENVIRONMENTAL IMPACTS OF INCREASED ACTIVITY LEVELS
elasticities of non-endemic species counts with respect to trade intensity of –1.045, –0.830,
–1.080 and –1.071 for birds, mammals, plants and total biodiversity respectively. Although
some might view this result as positive, given that exotic species are included in counts of
non-endemic species, this result is consistent with the presumption that trade facilitates
introduction of invasive species.
6.6. ConclusionsShipping activity has increased significantly over the last century, and currently
represents a notable contribution to the global emissions of pollutants and greenhouse
gases. Despite this, information about the historical development of energy consumption
and emissions is limited, with little data published before 1950 and large deviations in
estimates covering the last three decades. Endresen et al. (2008) indicated global ship CO2
emissions in 1870 to be 30 Tg (CO2), growing to be about 206 Tg (CO2) in 1913. The main
development during this period was the transition from sail to steam-powered ships. Based
on sales of bunker, global ship CO2 emissions were estimated to be 229 Tg (CO2) in 1925,
growing to about 634 Tg (CO2) in 2002. The corresponding SO2 emissions were estimated to
be approximately 2.5 Tg (as SO2) in 1925 and 8.5 Tg (as SO2) in 2002. The main developments
during this period were that oil replaced coal, and the transition to a diesel-powered fleet.
The majority of today’s ship emissions occur in the northern hemisphere within a
well-defined system of international sea routes. The most accurate geographical
representations of the emissions are obtained using a method based on the relative
reporting frequency weighted by the ship size. When global identification and tracking of
ships is implemented, using LRIT technology, the potential for effective monitoring and
reliable emission modelling will increase significantly.
Activity-based modelling for the period 1970-2000 indicates that the size and the
degree of utilisation of the fleet, combined with the shift to diesel engines, have been the
major factors determining yearly energy consumption. Interestingly, modelling suggests
that from around 1973 – when bunker prices started to rise rapidly – growth in the fleet is
not necessarily followed by increased energy consumption.
The main reason for the large deviations among different activity-based estimates of
fuel use and emissions is the assumed number of days at sea. Vessel type and size
dependency should be further analysed and described, to improve the accuracy of detailed
activity-based estimates. Available operational data indicate that the number of days at sea
depend strongly on ship type and size.
Recent studies indicate that the emissions of CO2, NOx and SO2 by ship corresponds to
about 2% to 3% (perhaps even 4%), 10% to 15%, and 4% to 9% of the global anthropogenic
emissions, respectively. Ship emissions of NO2, CO, NMVOCs and SO2 and primary particles
cause problems in coastal areas and harbours with heavy traffic and high pollution levels
because of their impacts on human health and materials. Particularly high surface
increases of short-lived pollutants like NO2 are found close to the regions with heavy traffic
around the North Sea and the English Channel. Absolute increases in surface ozone (O3)
due to ship emissions are pronounced during summer months, with large increases found
in regions with heavy traffic. Some of these regions already suffer from high ozone levels
due to pollution from nearby land sources.
Formation of sulphate and nitrate resulting from nitrogen and sulphur emissions
causes acidification that can be harmful to ecosystems in regions with low buffering
GLOBALISATION, TRANSPORT AND THE ENVIRONMENT © OECD 2010 177
6. INTERNATIONAL MARITIME SHIPPING: ENVIRONMENTAL IMPACTS OF INCREASED ACTIVITY LEVELS
capacity, and have harmful health effects. Relative ship-induced increases are estimated to
be in the range 5%-35% in wet deposition of sulphate and nitrate. Nitrate and sulphate
aerosols and directly emitted organic and black carbon (soot) affect the climate due to
scattering/absorption of radiation (direct effect) and impact on clouds (indirect effect). NOx
emissions from ship traffic lead to significant increases in OH. Since reaction with OH is
the major loss of methane from the atmosphere, ship emissions decrease methane
concentrations. Reductions in methane lifetime due to shipping NOx vary between 1.5%
and 5% in different calculations. The effect on concentrations of greenhouse gases (CO2,
CH4 and O3) and aerosols have different impacts on the radiation balance of the earth-
atmosphere system. In summary, most studies so far indicate that ship emissions lead to
a net global cooling. This is different from other transport sectors.
However, it should be stressed that the uncertainties are large, in particular for
indirect effects, and global temperature is only a first measure of climate changes. It is also
important to have in mind that the forcing from different components act on different
temporal and spatial scales.
Projections up to year 2020 indicate a growth in emissions in the range of 30%. For
year 2050, one study has estimated emissions ranging from 1308 to 2271 Tg CO2, 17 to
28 Tg NOx, and 2 to 12 Tg SO2.
Model studies of future impacts from ship emissions are dependent on the projections
used as baseline for the emission calculations. Most scenarios for the next 10-20 years
indicate that an increase in traffic will lead to a significant global increase in emissions
from shipping. The relative contribution to pollutants (ozone, NO2, particles) from shipping
could increase, especially in regions like the Arctic and South-East Asia.
Notes
1. This chapter is an edited version of two papers The Environmental Impacts of Increased InternationalMaritime Shipping – Past Trends and Future Perspectives, written by Øyvind Endresen and Magnus Eide, DetNorske Veritas, Høvik; Stig Dalsøren and Ivar S. Isaksen, University of Oslo; and Eirik Sørgård, PronordAS, Bodø, Norway, for the OECD/ITF Global Forum on Transport and Environment in a GlobalisingWorld, held in Guadalajara, Mexico, 10-12 November 2008 (www.oecd.org/dataoecd/52/30/41373767.pdf),and The Impact of Globalisation on International Maritime Transport Activity: Past Trends and FuturePerspectives, written by James J. Corbett and James Winebrake, Energy and Environmental ResearchAssociates, United States, for the same event (www.oecd.org/dataoecd/10/61/41380820.pdf).
2. Dalsøren et al. (2009) presents vessel traffic densities for year 2001/02 for the same vessel categories.
3. This is also the finding of Hoor et al. (2009).
4. Part of this discussion is taken from Corbett and Winebrake (2008), adapted or excerpted fromHoughton et al. (1997), ICF Consulting (2005) and Thomas et al. (2002), part is taken from McAusland(2008).
5. Pimentel et al. (2005) estimated that the annual cost of dealing with invasive species present in theUnited States was USD 120 billion per year. Of course some of the 50 000 alien species present inthe United States are beneficial, including corn, wheat, rice, cattle and poultry (Pimentel et al.,2005; USBC, 2001).
References
Arctic Climate Assessment (ACIA) (2004), Impacts of a Warming Arctic, ACIA Overview Report (Part B),Cambridge University Press, available at http://amap.no/acia/index.html.
AMVER (2001), Daily Vessel Observations for 2000/2001 of the AMVER Fleet, provided by E. Carroll, US CoastGuard.
GLOBALISATION, TRANSPORT AND THE ENVIRONMENT © OECD 2010178

6. INTERNATIONAL MARITIME SHIPPING: ENVIRONMENTAL IMPACTS OF INCREASED ACTIVITY LEVELS
Annin, R.E. (1920), Ocean Shipping, Elements of Practical Steamship Operation, Century Co., New York.
Beirle, S. et al. (2004), “Estimate of Nitrogen Oxide Emissions from Shipping by Satellite RemoteSensing”, Geophysical Research Letters, 31, L18102, doi: http://dx.doi.org/10.1029/2004GL020312.
Berntsen, T. and I.S.A. Isaksen (1997), “A Global Three-Dimensional Chemical Transport Model for theTroposphere. 1. Model Description and CO and Ozone Results”, Journal of Geophysical Research, 102,pp. 21239-21280.
Bouwman, A.F. et al. (2002), “A Global Analysis of Acidification and Eutrophication of TerrestrialEcosystems”, Water, Air, and Soil Pollution, 141, pp. 349-382.
Bright, C. (1999), “Invasive Species: Pathogens of Globalization”, Foreign Policy, Fall 1999 (116), pp. 50-64.
Buhaug, Ø. et al. (2008), Updated Study on Greenhouse Gas Emissions from Ships, Prepared for theInternational Maritime Organization (IMO), coordinated by MARINTEK, Norway, Phase 1 Report,September 2008.
Capaldo, K., et al. (1999), “Effects of Ship Emissions on Sulphur Cycling and Radiative Climate Forcingover the Ocean”, Nature, 400, pp. 743-746.
Ceuster, G.D., B. v. Herbruggen and S. Logghe (2006), “TREMOVE: Description of Model and BaselineVersion 2.41”, Transport and Mobility, Leuven, European Commission, Brussels, Belgium.
Chen, G. et al. (2005), “An Investigation of the Chemistry of Ship Emission Plumes during ITCT 2002”,Journal of Geophysical Research, 110, D10S90, doi: http://dx.doi.org/10.1029/2004JD005236.
Cofala, J. et al. (2007), Final Report: Analysis of Policy Measures to Reduce Ship Emissions in the Context of theRevision of the National Emissions Ceilings Directive, International Institute for Applied SystemsAnalysis: Laxenburg, Austria.
Collins, W.J., M.G. Sanderson and C.E. Johnson (2007), “Impact of Increasing Ship Emissions on AirQuality and Deposition over Europe by 2030”, Meteorologische Zeitschrift, accepted.
Corbett, J.J., P.S. Fischbeck and S.N. Pandis (1999), “Global Nitrogen and Sulphur Emissions Inventoriesfor Oceangoing Ships”, Journal of Geophysical Research, 104(D3), pp. 3457-3470.
Corbett, J.J. and H.W. Koehler (2003), “Updated Emissions from Ocean Shipping”, Journal of GeophysicalResearch, Atmospheres, 108, doi: http://dx.doi.org/10.1029/2003JD003751.
Corbett, J.J. and H.W. Koehler (2004), “Considering Alternative Input Parameters in an Activity-BasedShip Fuel Consumption and Emissions Model”, Reply to comment by Øyvind Endresen et al. on“Updated Emissions from Ocean Shipping”, Journal of Geophysical Research, 109, D23303, doi: http://dx.doi.org/10.1029/2004JD005030.
Corbett, J.J. et al. (2007), “Mortality from Ship Emissions: A Global Assessment”, Environmental Scienceand Technology, 41(24), pp. 8512-8518, doi: http://dx.doi.org/10.1021/es071686z.
Costello, C. and A. Solow (2003), “On the Pattern of Discovery of Introduced Species”, Proceedings of theNational Academy of Science, 100(6), pp. 3321-3323.
Dalsøren, S. B. and I.S.A. Isaksen (2006), “CTM Study of Changes in Tropospheric HydroxylDistribution 1990-2001 and its Impact on Methane”, Geophysical Research Letters, 33, L23811, doi:http://dx.doi.org/10.1029/2006GL027295.
Dalsøren, S.B. (2007), CTM Studies on Effects of Various Anthropogenic Emissions on Tropospheric Chemistry,Ph.D. Thesis, ISSN 1501-7710, No. 584, Faculty of Mathematics and Natural Sciences, University ofOslo, Norway.
Dalsøren, S.B. et al. (2007), “Environmental Impacts of the Expected Increase in Sea Transportation,with a Particular Focus on Oil and Gas Scenarios for Norway and Northwest Russia”, Journal ofGeophysical Research, 112, D02310, doi: http://dx.doi.org/10.1029/2005JD006927.
Dalsøren, S.B. et al. (2008), “Update of Ship Emissions and Environmental Impact of Different ShipTypes and Harbour Emissions”, paper in progress.
Derwent, R.G. (2005), “The Contribution from Ship Emissions to Air Quality and Acid Deposition inEurope”, Ambio, 34(1), pp. 54-59.
Det Norske Veritas (1984), Veritas Forum (internal publication).
Devasthale, A., O. Krüger and H. Graßl (2006), “Impact of Ship Emissions on Cloud Properties overCoastal Areas”, Geophysical Research Letters, 33, L02811, doi: http://dx.doi.org/10.1029/2005GL024470.
GLOBALISATION, TRANSPORT AND THE ENVIRONMENT © OECD 2010 179
6. INTERNATIONAL MARITIME SHIPPING: ENVIRONMENTAL IMPACTS OF INCREASED ACTIVITY LEVELS
Durkee, P.A., K.J. Noone and R.T. Bluth (2000b), “The Monterey Ship Track Experiment”, Journal ofAtmospheric Science, 57, pp. 2523-2541.
EIA (2007), World Apparent Consumption of Refined Petroleum Products, 2004, available at www.eia.doe.gov/pub/international/iea2005/table35.xls; World Petroleum Supply and Disposition 2000, available atwww.eia.doe.gov/emeu/iea/table31.html.
Eide et al. (2008), EU project QUANTIFY Delivery: Ship Emissions of the Future, Report No. 2007-1325, DetNorske Veritas AS, Høvik, Norway.
Emberson, L.D. et al. (2001), “Impacts of Air Pollutants on Vegetation in Developing Countries”, Water,Air and Soil Pollution, 130, pp. 107-118.
EMEP/CORINAIR (2002), Emission Inventory Guidebook – 3rd Edition October 2002 UPDATE, Technical reportNo. 30, Shipping Activities – Sub-sector 0804, European Environment Agency, Copenhagen,Denmark.
Endresen, Ø. (2008), Quantifying Fuel Consumption and Air Emissions from Shipping, Ph.D. Theses,ISBN 1501-7710, Faculty of Mathematics and Natural Sciences, University of Oslo, Norway.
Endresen, Ø. et al. (2003), “Emission from International Sea Transportation and EnvironmentalImpact”, Journal of Geophysical Research, 108(D17), 4560, doi: http://dx.doi.org/10.1029/2002JD002898.
Endresen, Ø. et al. (2004a), “Substantiation of a Lower Estimate for the Bunker Inventory: Comment on‘Updated Emissions from Ocean Shipping’”, by James J. Corbett and Horst W. Koehler, Journal ofGeophysical Research, 109, D23302, doi: http://dx.doi.org/10.1029/2004JD004853.
Endresen, Ø. et al. (2004b), “Challenges in Global Ballast Water Management”, Marine Pollution Bulletin,Vol. 48, Issues 7-8, pp. 615-623.
Endresen, Ø. et al. (2005), “Improved Modelling of Ship SO2 Emissions – A Fuel Based Approach”,Atmospheric Environment, 39, pp. 3621-3628.
Endresen, Ø. et al. (2007), “A Historical Reconstruction of Ships Fuel Consumption and Emissions”,Journal of Geophysical Research, 112, D12301, doi: http://dx.doi.org/10.1029/2006JD007630.
Endresen, Ø. et al. (2008), The Environmental Impacts of Increased International Maritime Shipping – PastTrends and Future Perspectives, Paper prepared for the OECD/ITF Global Forum on Transport andEnvironment in a Globalising World, Guadalajara, Mexico, 10-12 November 2008, available atwww.oecd.org/dataoecd/52/30/41373767.pdf.
Environmental Protection Agency (EPA) (2003), National Air Quality and Emissions Trends Report,2003 Special Studies Edition, available at www.epa.gov/air/airtrends/aqtrnd03.
Evans, S.M. (2000), “Marine Antifoulants”, in Seas at the Millennium, An Environmental Evaluation, Vol. III,edited by C. Sheppard, Chapter 124, pp. 247-256, Pergamon, New York.
Eyring, V. et al. (2005a), “Emissions from International Shipping, Part 1: The last 50 years”, Journal ofGeophysical Research, Vol. 110, D17306, doi: http://dx.doi.org/10.1029/2004JD005620.
Eyring, V. et al. (2005b), “Emissions from International Shipping, Part 2: Impact of Future Technologies onScenarios Until 2050”, Journal of Geophysical Research, 110, D17306, doi: http://dx.doi.org/10.1029/2004JD005620.
Eyring, V. et al. (2007), “Multi-Model Simulations of the Impact of International Shipping on AtmosphericChemistry and Climate in 2000 and 2030”, Atmospheric Chemistry and Physics, pp. 757-780.
Fearnleys (2002), Review 2001, Fearnresearch, Oslo, Norway.
Fearnleys (2006), Review 2005, Fearnresearch, Oslo, Norway.
Ferek, R.J. et al. (2000), “Drizzle Suppression in Ship Tracks”, Journal of Atmospheric Science, 57, pp. 2707-2728.
Fletcher, M. (1997), “From Coal to Oil in British Shipping”, in The World of Shipping, edited byD.M. Williams, Section 10, pp. 153-171, Ashgate, Brookfield, Vt.
Food and Agriculture Organization of the United Nations (2006), Global Fishing Fleet Database(1996 to 1998), FAO Fish, Global Inf. Syst., Rome.
Forster, P. et al. (2007), “Changes in Atmospheric Constituents and in Radiative Forcing”, in ClimateChange, Fourth Assessment Report of Working Group I of the Intergovernmental Panel on ClimateChange, Cambridge University Press, UK.
Fritjof Nansen Institute (FNI) (2000), Northern Sea Route Cargo Flows and Infrastructure-Present State andFuture Potential, FNI REPORT 13/2000, ISBN 82-7613-400-9, Fritjof Nansen Institute, Norway.
GLOBALISATION, TRANSPORT AND THE ENVIRONMENT © OECD 2010180
6. INTERNATIONAL MARITIME SHIPPING: ENVIRONMENTAL IMPACTS OF INCREASED ACTIVITY LEVELS
Fuglestvedt, J.S. et al. (2008), “Climate Forcing from the Transport Sectors”, Proceedings of the NationalAcademy of Sciences (PNAS), Vol. 105, No. 2, pp. 454-458.
Galloway, J.N. et al. (2004), “Nitrogen Cycles: Past, Present and Future”, Biogeochemistry, 70(2), pp. 153-226.
Granier, C. et al. (2006), “Ozone Pollution from Future Ship Traffic in the Arctic Northern Passages”,Geophysical Research Letters, 33, L13807, doi: http://dx.doi.org/10.1029/2006GL026180.
Health Effects Institute (HEI) (2004), HEI International Scientific Oversight Committee, Health Effects ofOutdoor Air Pollution in Developing Countries of Asia: A Literature Review, Special Report 15, HealthEffects Institute, Boston MA.
Hobbs, P.V. et al. (2000), “Emissions from Ships with their Respect to Clouds”, Journal of AtmosphericScience, 57, pp. 2570-2590.
Hoor, P. et al. (2009), “The Impact of Traffic Emissions on Atmospheric Ozone and OH: Results fromQuantify”, Atmospheric Chemistry and Physics, 9, pp. 3113-3136, available at www.atmos-chem-phys.net/9/3113/2009/.
Intergovernmental Panel on Climate Change (IPCC) (2000), Special Report on Emissions Scenarios,available at www.grida.no/climate/ipcc/emission/, including Summary for Policymakers,www.grida.no/climate/ipcc/spmpdf/sres-e.pdf.
International Energy Agency (2007), Sale of Marine Fuel, Period 2001 to 2005, OECD/IEA, Paris.
International Maritime Organization (IMO) (2005), Interim Guidelines for Voluntary Ship CO2 EmissionIndexing for Use in Trials, MEPC/Circ. 471, 29 July.
IMO (2006), Measures to Enhance Maritime Security, Long Range Identification and Tracking of Ships,MSC81/WP.5/Add.1, 18 May.
IMO (2007), Report on the Outcome of the Comprehensive Study Undertaken by the Informal Cross Government/Industry Scientific Group of Experts Established to Evaluate the Effects of the Different Fuel Options Proposedunder the Revision of MARPOL Annex VI, BLG 12/6/1, 20 December.
Kasperski, Stephen (2008), The Impact of Trade on Biodiversity, University of Maryland Working Paper.
Kasibhatla, P. et al. (2000), “Do Emissions from Ships Have a Significant Impact on Concentrations ofNitrogen Oxides in the Marine Boundary Layer”, Geophysical Research Letters, 27, pp. 2229-2232.
Kaufman, Y.J. and I. Koren (2006), “Smoke and Pollution Aerosol Effect on Cloud Cover”, Science, 313,pp. 655-658, doi: http://dx.doi.org/10.1126/science.1126232.
Knowlton, A.R. and S.D. Kraus (2001), “Mortality and Serious Injury on Northern Right Whales(Eubalaena galcialis) in the Western North Atlantic Ocean”, Journal of Cetacean Research andManagement, 2 (Special Issue), pp. 193-208.
Kofoed, C. (1926), Kullforbruk og forbrænding (in Norwegian), O.N. Authens forlag, Tønsberg, Norway.
Kågeson, P. (2007), Linking CO2 Emissions from International Shipping to the EU-ETS, Nature Associates,Rep. No. UBA-FB, Stockholm, Sweden.
Laist, D.W. et al. (2001), “Collisions between Ships and Whales”, Marine Mammal Science, 17(1), pp. 35-75.
Lauer, A. et al. (2007), “Global Model Simulations of the Impact of Ocean-Going Ships on Aerosols,Clouds, and the Radiation Budget”, Atmospheric Chemistry and Physics, 7, pp. 5061-5079.
Lawrence, M.G. and P.J. Crutzen (1999), “Influence of NOx Emissions from Ships on TroposphericPhotochemistry and Climate”, Nature, 402(6758), pp. 167-170.
Lee, D.S. et al. (2007), “Radiative Forcing and Temperature Response from Shipping”, in Proceedings of theInternational Conference on Transport, Atmosphere and Climate (TAC), Oxford, UK, pp. 208-213.
Lelieveld, J. et al. (2002), “Stability of Tropospheric Hydroxyl Chemistry”, Journal of Geophysical Research,107, 4715, doi: http://dx.doi.org/4710.1029/2002JD002272.
Levine, J.M. and C.M. D’Antonio (2003), “Forecasting Biological Invasions with Increasing InternationalTrade”, Conservation Biology, 17, pp. 322-326.
Levy, H. (1971), “Normal Atmosphere: Large Radical and FormAldehyde Concentrations Predicted”,Science, 173, pp. 141-143.
Lloyd’s Register of Shipping (LR) (1961), Statistical Tables, 1961, United Kingdom.
Lloyd’s Register of Shipping (LR) (1984), Statistical Table, 1984, United Kingdom.
GLOBALISATION, TRANSPORT AND THE ENVIRONMENT © OECD 2010 181

6. INTERNATIONAL MARITIME SHIPPING: ENVIRONMENTAL IMPACTS OF INCREASED ACTIVITY LEVELS
Lloyd’s Register of Shipping (LR) (1995), Marine Exhaust Emissions Research Programme, Lloyd’s RegisterEngineering Services, United Kingdom, London.
Lloyd’s Register of Shipping (LR) (2000), World Fleet Statistics and Statistical Tables, UK.
Lloyd’s Register Fairplay (LRF) (2007), Extracts from the World Merchant Fleet Database (all civil ocean-going cargo and passenger ships above or equal to 100 GT), Redhill, UK.
Longva, T., M. Eide and E. Nyhus (2008), Achieving Emission Reductions: Analysing Cost andConsequences towards 2020, Accepted, “Ship Operations, Management and Economics”, Symposium,17-18 September 2008, Greece, available at www.sname.org/sections/greece/symposium.htm.
Lovell, S.J. et al. (2006), “The Economic Impacts of Aquatic Invasive Species: A Review of the Literature”,Agricultural and Resource Economics Review, 35(1), pp. 195-208.
Marmer, E. and B. Langmann (2005), “Impact of Ship Emissions on the Mediterranean SummertimePollution and Climate: A Regional Model Study”, Atmospheric Environment, 39, pp. 4659-4669.
Martuzzi, M., Krzyzanowski and R. Bertollini (2003), “Health Impact Assessment of Air Pollution:Providing further Evidence for Public Health Action”, European Respiratory Journal, 21, pp. 86S-91S.
Mauzerall, D.L. and X. Wang (2001), “Protecting Agricultural Crops from the Effects of TroposphericOzone Exposure: Reconciling Science and Standard Setting in the United States, Europe and Asia”,Annual Review of Energy and Environment.
Ministry of Finance Norway (2007), Norges strategi for bærekraftig utvikling (in Norwegian), available atwww.regjeringen.no/nb/dep/fin/tema/Barekraftig_utvikling/strategi-for-barekraftigutvikling.html?id=469846.
Nel, A. (2005), “Air Polution-Related Illness: Biomolecular Effects of Particles”, Science, 208, p. 804.
NERA Economic Consulting (2005), Economic Instruments for Reducing Ship Emissions in the European Union,European Commission, Directorate-General Environment, available at http://ec.europa.eu/environment/air/pdf/task3_final.pdf.
OECD (1997), “Special Issues in Carbon/Energy Taxation: Marine Bunker Fuel Charges”, OCDE/GD (97)/77.
Penner, J.E. et al. (2001), “Chapter 5. Aerosols, their Direct and Indirect Effects”, in Climate Change 2001:The Scientific Basis, J.T. Houghton et al. (eds.), Cambridge U. Press, pp. 289-347, 2001.
Pil, F.K. and S. Rothenberg (2003), “Environmental Performance as a Driver of Superior Quality”,Production and Operations Management, 12(3), pp. 404-415.
Pimentel, D., R. Zuniga and D. Morrison (2005), “Update on the Environmental and Economic CostsAssociated with Alien-Invasive Species in the United States”, Ecological Economics, 52(3), pp. 273-288.
Ramanathan, V. et al. (2001a), “Aerosols, Climate, and the Hydrological Cycle”, Science, 294, pp. 2119-2124.
Ramaswamy, V. et al. (2001b), “Chapter 6, Radiative Forcing of Climate Change”, in Climate Change 2001:The Scientific Basis, pp. 349-416, J.T. Houghton et al. (eds.), Cambridge U. Press, Cambridge, 2001.
Ricciardi, A. (2006), “Patterns of Invasion in the Laurentian Great Lakes in Relation to Changes in VectorActivity”, Diversity and Distributions, 12(4), pp. 425-433.
Richter, A. et al. (2004), “Satellite Measurements of NO2 from International Shipping Emissions”,Geophysical Research Letters, 31, L23110, doi: http://dx.doi.org/10.1029/2004GL020822.
Rosenfeld, D. (2000), “Suppression of Rain and Snow by Urban and Industrial Air Pollution”, Science, 287,pp. 1793-1796.
Ruiz, G.M. et al. (2000a), “Invasion of Coastal Marine Communities in North America: ApparentPatterns, Processes, and Biases”, Annual Review of Ecological Systems, 31, pp. 481-531.
Ruiz, G.M. et al. (2000b), “Global Spread of Microorganisms by Ships”, Nature, 408, pp. 49-50.
Saxe, H. and T. Larsen (2004), “Air Pollution from Ships in Three Danish Ports”, Atmospheric Environment,38, pp. 4057-4067.
Schreier, M. et al. (2006), “Impact of Ship Emissions on the Microphysical, Optical and RadiativeProperties of Marine Stratus: A Case Study”, Atmospheric Chemistry and Physics, 6, pp. 4925-4942.
Schreier, M. et al. (2007), “Global Ship Track Distribution and Radiative Forcing from 1-Year of AATSR-Data”,Geophysical Research Letters, 34, L17814, doi: http://dx.doi.org/10.1029/2007GL030664.
Skjølsvik, K.O. et al. (2000), Study on Greenhouse Gas Emissions from Ships, Report to the InternationalMaritime Organization, produced by Marintek, Det Norske Veritas (DNV), Centre for EconomicAnalysis (ECON) and Carnegie Mellon. MT report Mtoo A23-038, Trondheim, Norway.
GLOBALISATION, TRANSPORT AND THE ENVIRONMENT © OECD 2010182

6. INTERNATIONAL MARITIME SHIPPING: ENVIRONMENTAL IMPACTS OF INCREASED ACTIVITY LEVELS
Society of Naval Architects and Marine Engineers (SNAME) (1983), A Guide for a Coal Fired Boiler System,Tech. Res. Bull., pp. 3-34, New York.
Society of Naval Architects and Marine Engineers (SNAME) (1988), The Principles of Naval Architecture,2nd Rev., Vol. II, Resistance, Propulsion and Vibration, edited by E.V. Lewis, Jersey City, N.J.
Song, C.H. et al. (2003), “Dispersion and Chemical Evolution of Ship Plumes in the Marine BoundaryLayer: Investigation of O3/NOy/HOx Chemistry”, Journal of Geophysical Research, 108(D4), 4143, doi:http://dx.doi.org/10.1029/2002JD002216.
Statistics Norway (2000), Maritime Statistics 1999, Oslo, Norway, ISBN 82-537-4876-0.
Stopford, M. (1997), Maritime Economics, 2nd ed., Routledge, London.
Sundet, J.K (1997), Model Studies with a 3-d Global CTM Using ECMWF Data, University of Oslo.
Theis, M. et al. (2004), “The Role of Technology in Achieving Environmental Policy Goals in the MTS”,Transportation Research Record, 1871, pp. 42-49.
Tie, X. et al. (2005), “Assessment of the Global Impact of Aerosols on Tropospheric Oxidants”, Journal ofGeophysical Research, 110, D03204, doi: http://dx.doi.org/10.1029/2004JD005359.
Tronstad, T. and Ø. Endresen (2005), FellowSHIP – Fuel Cells for Low Emission Ships, RISØ InternationalEnergy Conference, Technologies for Sustainable Energy Development in the Long Term, RisøNational Laboratory, Denmark, 23-25 May 2005, available at www.risoe.dk/rispubl/SYS/syspdf/energconf05/session5_tronstad.pdf.
Twomey, S.A. (1974), “Pollution and the Planetary Albedo”, Atmospheric Environment, 8, pp. 1251-1256.
United Nations Conference on Trade and Development (UNCTAD) (2007), Review of MaritimeTransport 2007, ISBN 978-92-1-112725-6, New York, available at www.unctad.org/Templates/WebFlyer.asp?intItemID=4398&lang=1.
United States Coast Guard (USCG) (2002), Universal Shipborne Automatic Identification System (AIS)Transponder, available at www.navcen.uscg.gov/marcomms/ais.htm.
Vanderlaan, A.S.M. and C.T. Taggart (2007), “Vessel Collisions with Whales: The Probability of LethalInjury Based on Vessel Speed”, Marine Mammal Science, 23(1), pp. 144-156.
Vitousek, P.M. et al. (1997), “Human Alteration of the Global Nitrogen Cycle: Causes andConsequences”, Issues in Ecology, 1, pp. 1-17.
von Glasow, R. et al. (2003), “Modelling the Chemical Effects of Ship Exhaust in the Cloud-Free MarineBoundary Layer”, Atmospheric Chemistry and Physics, 3, pp. 233-250.
Wang, C., J.J. Corbett and J. Firestone (2007), “Improving Spatial Representation of Global Ship EmissionsInventories”, Environmental Science and Technology, doi: http://dx.doi.org/10.1021/es0700799.
Wang, Y.H. and D.J. Jacob (1998), “Anthropogenic Forcing on Tropospheric Ozone and OH sincePreindustrial Times”, Journal of Geophysical Research, 103, pp. 123-131.
Weber, C.L. et al. (2007), Carbon Emissions Embodied in Importation, Transport and Retail of Electronics in theUS: A Growing Global Issue, paper presented at 2007 IEEE International Symposium on Electronicsand the Environment and the Electronics Recycling Summit, IEEE Computer Society TechnicalCommittee On Electronics and The Environment And The International Association Of ElectronicsRecyclers, Orlando, FL, 7-10 May 2007.
Whall, C. et al. (2002), Quantification of Emissions from Ships Associated with Ship Movements between Portsin the European Community, Report to the European Commission, Entec, Northwich, UK.
WHO (2003), Health Aspects of Air Pollution with Particulate Matter, Ozone and nitrogen dioxide. Report on aWHO Working Group, EUR/03/5042688, 98 p.
Winebrake, J.J. et al. (2006), Total Fuel-Cycle Emissions for Marine Vessels: A Well-to-Hull Analysis with CaseStudy, paper presented at 13th CIRP International Conference on Life Cycle Engineering, LCE2006,Leuven, Belgium, May-June 2006.
Winebrake, J.J. et al. (2007a), A Total Fuel Life-Cycle Analysis of Energy and Emissions from Marine Vessels,Paper No. 07-0817, paper presented at Transportation Research Board 86th Annual Meeting,Transportation Research Board, Washington DC.
Winebrake, J. J., et al. (2007b), “Energy Use and Emissions from Marine Vessels: A Total Fuel CycleApproach”, Journal of the Air and Waste Management Association, 57 (January), pp. 102-110.
GLOBALISATION, TRANSPORT AND THE ENVIRONMENT © OECD 2010 183

6. INTERNATIONAL MARITIME SHIPPING: ENVIRONMENTAL IMPACTS OF INCREASED ACTIVITY LEVELS
Winebrake, J.J. et al. (2008), “Assessing Energy, Environmental, and Economic Tradeoffs in IntermodalFreight Transportation”, Journal of the Air and Waste Management Association, 1 August.
Wonham, M.J. and J.T. Carlton (2005), “Trends in Marine Biological Invasions at Local and RegionalScales: The Northeast Pacific Ocean as a Model System”, Biological Invasions, 7(3), pp. 369-392.
Wonham, M.J. and E. Pachepsky (2006), “A Null Model of Temporal Trends in Biological InvasionRecords”, Ecology Letters, 9(6), pp. 663-672.
Wijnolst, N. and T. Wergeland (1997), Shipping, Delft Univ. Press, Delft, Netherlands.
World Trade Organization (WTO) (2007), Statistics Database (online), available at http://stat.wto.org.
Zeebroeck, B.V., G.D. Ceuster and B.V. Herbruggen (2006), TREMOVE 2: Maritime Model and Runs,Transport and Mobility Leuven, Editor, European Commission, Brussels, Belgium.
GLOBALISATION, TRANSPORT AND THE ENVIRONMENT © OECD 2010184

Globalisation, Transport and the Environment
© OECD 2010
Chapter 7
International Air Transport: Environmental Impacts of Increased
Activity Levels
byEric Pels1
This chapter reviews the literature on the environmental impacts of aviation,discusses trends in emission patterns and comments upon how the external cost ofaviation is estimated in various studies. The purpose of the chapter is to assess howdevelopments in the aviation sector in the last few decades have impacted on theenvironment, and what this means for transport and environmental policy.
The chapter explores how hub-and-spoke networks can lead to environmentalbenefits because of economies-of-scale in environmental terms. Passengers areconcentrated on a few routes, so that larger aircraft may be used. But transferpassengers fly longer distances, and take off and land twice, so that they have arelatively large environmental impact. The chapter explores policy instruments,such as compensation regulation. A number of factors are examined: noise (peopleare asked what they are willing to pay to experience less aviation noise); emissions(damage to human health, damage to buildings, reduced visibility, damage toforests, crops and fisheries); and accidents.
185
7. INTERNATIONAL AIR TRANSPORT: ENVIRONMENTAL IMPACTS OF INCREASED ACTIVITY LEVELS
7.1. IntroductionThe environmental impact of air travel attracts much attention, both in the media in the
policy debates. Air travel contributes to climate change, and causes environmental and
economic damage by its CO2, NOx, noise and other emissions. In economic terms, air travel
causes external effects, which somehow need to be accounted for in the price of air travel. A
number of countries (e.g. the United Kingdom, France and the Netherlands) have therefore
implemented departure or ticket taxes. But whether such taxes cover the environmental cost
of air travel, not included in the ticket price, is a difficult question. This leads to heated debates
about, for instance, ticket taxes. Opponents of such taxes argue that they are harmful for the
economy, while the effect on the CO2 emissions is questionable, if passengers can easily switch
to an airport in a nearby country which does not levy such taxes.
7.2. Aviation growth and the environmentIt is expected that demand for aviation services will continue to grow faster than GDP.
De Haan (2007) looked at GDP growth, speed of maturation of aviation markets and network
development to predict that in the most pessimistic economic scenario, air travel in 2050 will
have increased by a factor of 2.5 in 2050, compared to 2004. In the most optimistic economic
scenario, air travel in 2050 had increased 9 times compared to 2004. De Haan (2008)
discussed potential reductions in CO2 emissions per km travelled due to technological
developments. However, reductions of 15% to 25% per, or even 50% for radically new designs,
would not be enough to compensate for the increased demand.
Table 7.1 shows past and expected trends in emissions of CO2 and NOx, as reported by
Penner et al. (1999). According to NASA’s calculations, NOx emissions from aviation grew by
46% between 1976 and 1984, and 41% between 1984 and 1992. NOx emissions were
expected to grow by 174% between 1992 and 2015. ANCAT and DLR presented somewhat
more moderate expectations, with NOx emissions growing by 111% and 113% between 1992
and 2015. The expected growth in CO2 emissions reported by NASA is similar to the growth
reported by ANCAT and DLR: 121%, 118% and 120% respectively. These numbers show that
the growth in international aviation lead to increased environmental damage.
Table 7.2 shows the expected growth in CO2 emissions between 2002 and 2030 in
various scenarios (Horton, 2006). Horton (2006) assessed the growth of CO2 emissions from
civil aircraft to 2030. An important aspect in this analysis is the effect of a carbon tax. The
same growth in traffic was applied to all cases, implying that the only effect of a carbon tax
is an efficiency improvement. The study therefore, importantly, does not include the airlines’
option of passing a carbon tax on to the passengers, so that demand is influenced (reduced).
Total distance covered by civil aviation aircraft is predicted to increase by 149% from 2002
to 2030, while the number of available seat-kilometres is predicted to increase by 229% over the
same period. These numbers imply that aircraft size is expected to increase. In the scenario
which is best for the environment (Case 5), CO2 emissions in 2030 are 22% less than in the
scenario which does not have incentives for technological development (Case 3). But even in
GLOBALISATION, TRANSPORT AND THE ENVIRONMENT © OECD 2010186
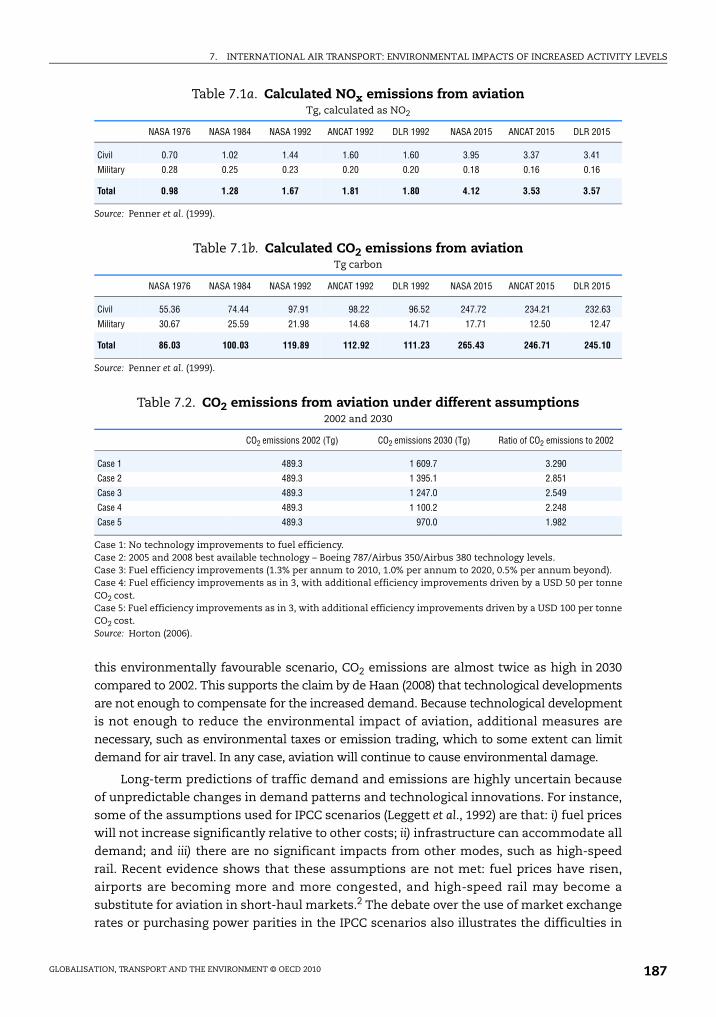
7. INTERNATIONAL AIR TRANSPORT: ENVIRONMENTAL IMPACTS OF INCREASED ACTIVITY LEVELS
this environmentally favourable scenario, CO2 emissions are almost twice as high in 2030
compared to 2002. This supports the claim by de Haan (2008) that technological developments
are not enough to compensate for the increased demand. Because technological development
is not enough to reduce the environmental impact of aviation, additional measures are
necessary, such as environmental taxes or emission trading, which to some extent can limit
demand for air travel. In any case, aviation will continue to cause environmental damage.
Long-term predictions of traffic demand and emissions are highly uncertain because
of unpredictable changes in demand patterns and technological innovations. For instance,
some of the assumptions used for IPCC scenarios (Leggett et al., 1992) are that: i) fuel prices
will not increase significantly relative to other costs; ii) infrastructure can accommodate all
demand; and iii) there are no significant impacts from other modes, such as high-speed
rail. Recent evidence shows that these assumptions are not met: fuel prices have risen,
airports are becoming more and more congested, and high-speed rail may become a
substitute for aviation in short-haul markets.2 The debate over the use of market exchange
rates or purchasing power parities in the IPCC scenarios also illustrates the difficulties in
Table 7.1a. Calculated NOx emissions from aviationTg, calculated as NO2
NASA 1976 NASA 1984 NASA 1992 ANCAT 1992 DLR 1992 NASA 2015 ANCAT 2015 DLR 2015
Civil 0.70 1.02 1.44 1.60 1.60 3.95 3.37 3.41
Military 0.28 0.25 0.23 0.20 0.20 0.18 0.16 0.16
Total 0.98 1.28 1.67 1.81 1.80 4.12 3.53 3.57
Source: Penner et al. (1999).
Table 7.1b. Calculated CO2 emissions from aviationTg carbon
NASA 1976 NASA 1984 NASA 1992 ANCAT 1992 DLR 1992 NASA 2015 ANCAT 2015 DLR 2015
Civil 55.36 74.44 97.91 98.22 96.52 247.72 234.21 232.63
Military 30.67 25.59 21.98 14.68 14.71 17.71 12.50 12.47
Total 86.03 100.03 119.89 112.92 111.23 265.43 246.71 245.10
Source: Penner et al. (1999).
Table 7.2. CO2 emissions from aviation under different assumptions2002 and 2030
CO2 emissions 2002 (Tg) CO2 emissions 2030 (Tg) Ratio of CO2 emissions to 2002
Case 1 489.3 1 609.7 3.290
Case 2 489.3 1 395.1 2.851
Case 3 489.3 1 247.0 2.549
Case 4 489.3 1 100.2 2.248
Case 5 489.3 970.0 1.982
Case 1: No technology improvements to fuel efficiency.Case 2: 2005 and 2008 best available technology – Boeing 787/Airbus 350/Airbus 380 technology levels.Case 3: Fuel efficiency improvements (1.3% per annum to 2010, 1.0% per annum to 2020, 0.5% per annum beyond).Case 4: Fuel efficiency improvements as in 3, with additional efficiency improvements driven by a USD 50 per tonneCO2 cost.Case 5: Fuel efficiency improvements as in 3, with additional efficiency improvements driven by a USD 100 per tonneCO2 cost.Source: Horton (2006).
GLOBALISATION, TRANSPORT AND THE ENVIRONMENT © OECD 2010 187

7. INTERNATIONAL AIR TRANSPORT: ENVIRONMENTAL IMPACTS OF INCREASED ACTIVITY LEVELS
forming scenarios. However, to formulate long-term policy goals, it is necessary to use all
currently available information to predict future demand and emissions. Long-term
studies which are often cited are from ICAO’s Forecasting and Economic Support Group
(FESG), the UK Department of Trade and Industry (DTI) and the Environmental Defense
Fund (EDF). The results are summarised in Table 7.3.
FESG used high (FE) and low (FC) economic scenarios, combined with two different
technology scenarios. The FE and FC scenarios were based on the IPCC scenarios IS92e and
IS92c used by EDF (Penner et al., 1992). The technology scenarios assumed: that NOx
reductions in aircraft emissions result from current design philosophies (Scenario 1); or
that a more aggressive approach to NOx reductions result in smaller fuel efficiency gains
(Scenario 2). DTI used its own forecast models for traffic predictions, and extrapolated
Greene (1992) to obtain forecasts for fuel efficiency. The results reflected the strong
assumptions on reductions in NOx-emissions (assumed to be the result of technological
developments induced by regulations). EDF specifically accounted for demand growth in
developing countries, and used IPCC scenarios for developments in economic indicators
and emissions. Base level and high demand scenarios were used. Fuel efficiency was
extrapolated from Greene (1992), while NOx-emissions were extrapolated from NASA
numbers. Penner et al. (1999) reported that the emission index for NOx indicates that
emissions reflect an ultra-low technology regime. Roughly speaking, DTI and EDF seem to
have comparable expectations on trends in NOx emissions. The differences in emission
levels are then mainly caused by differences in assumed fuel use levels.
Table 7.4 shows the average external costs of transport in the EU17 countries, as
reported by INFRAS (Schreyer et al., 2004). Scheyer et al. (2004) provided an extensive report
about external costs (total, average and marginal) of transport: road (passenger and
freight), rail (passenger and freight), air (passenger and freight), and waterborne (freight)
transport. In this report, almost all cost categories were discussed: accidents, noise, air
pollution, climate change, costs for nature and landscape, additional costs in urban areas,
upstream and downstream processes, and congestion costs. For the accident costs, a value
(EUR 1.5 million) of a statistical life approach was used, using ICAO Database to determine
fatalities per passenger-kilometre. For noise costs, a willingness-to-pay procedure (for
those disturbed by the noise only) was used, using a database from OECD (OECD, 1993).
These costs also include the valuation of health risks and medical costs. For road and rail,
advanced models exist to accurately predict noise emissions. For aviation, such models do
not exist, so Scheyer et al. (2004) used insights from road and rail models to determine the
marginal cost of aviation.
Table 7.3. Estimates of emissions from aviation over the long termTg, excluding military
FESG FC1 2050 FESG FE2 2050 DTI 2050 EDF IS92c 1990 EDF IS92c 2050 EDF IS92e 1990 EDF IS92e 2050
Fuel use 253.8 757.7 633.2 179 837 179 2 297
CO2 218.2 651.6 154 720 154 1 975
NOx 3.9 8.7 4.45 1.96 5.77 1.96 15.84
Source: Penner et al. (1999).
GLOBALISATION, TRANSPORT AND THE ENVIRONMENT © OECD 2010188
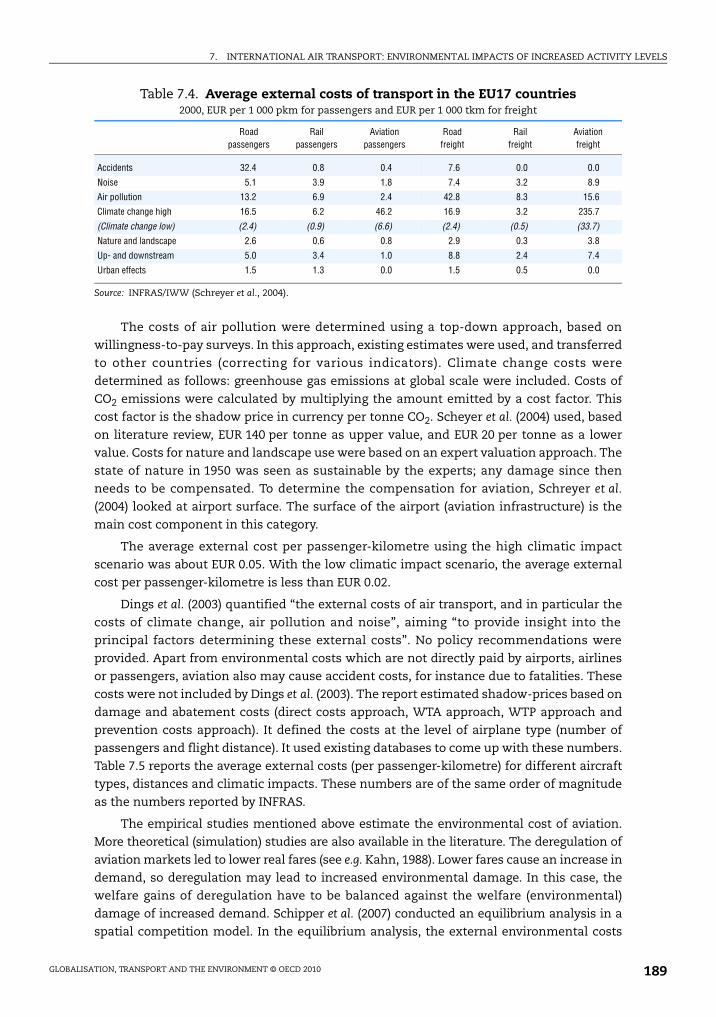
7. INTERNATIONAL AIR TRANSPORT: ENVIRONMENTAL IMPACTS OF INCREASED ACTIVITY LEVELS
The costs of air pollution were determined using a top-down approach, based on
willingness-to-pay surveys. In this approach, existing estimates were used, and transferred
to other countries (correcting for various indicators). Climate change costs were
determined as follows: greenhouse gas emissions at global scale were included. Costs of
CO2 emissions were calculated by multiplying the amount emitted by a cost factor. This
cost factor is the shadow price in currency per tonne CO2. Scheyer et al. (2004) used, based
on literature review, EUR 140 per tonne as upper value, and EUR 20 per tonne as a lower
value. Costs for nature and landscape use were based on an expert valuation approach. The
state of nature in 1950 was seen as sustainable by the experts; any damage since then
needs to be compensated. To determine the compensation for aviation, Schreyer et al.
(2004) looked at airport surface. The surface of the airport (aviation infrastructure) is the
main cost component in this category.
The average external cost per passenger-kilometre using the high climatic impact
scenario was about EUR 0.05. With the low climatic impact scenario, the average external
cost per passenger-kilometre is less than EUR 0.02.
Dings et al. (2003) quantified “the external costs of air transport, and in particular the
costs of climate change, air pollution and noise”, aiming “to provide insight into the
principal factors determining these external costs”. No policy recommendations were
provided. Apart from environmental costs which are not directly paid by airports, airlines
or passengers, aviation also may cause accident costs, for instance due to fatalities. These
costs were not included by Dings et al. (2003). The report estimated shadow-prices based on
damage and abatement costs (direct costs approach, WTA approach, WTP approach and
prevention costs approach). It defined the costs at the level of airplane type (number of
passengers and flight distance). It used existing databases to come up with these numbers.
Table 7.5 reports the average external costs (per passenger-kilometre) for different aircraft
types, distances and climatic impacts. These numbers are of the same order of magnitude
as the numbers reported by INFRAS.
The empirical studies mentioned above estimate the environmental cost of aviation.
More theoretical (simulation) studies are also available in the literature. The deregulation of
aviation markets led to lower real fares (see e.g. Kahn, 1988). Lower fares cause an increase in
demand, so deregulation may lead to increased environmental damage. In this case, the
welfare gains of deregulation have to be balanced against the welfare (environmental)
damage of increased demand. Schipper et al. (2007) conducted an equilibrium analysis in a
spatial competition model. In the equilibrium analysis, the external environmental costs
Table 7.4. Average external costs of transport in the EU17 countries2000, EUR per 1 000 pkm for passengers and EUR per 1 000 tkm for freight
Roadpassengers
Railpassengers
Aviation passengers
Roadfreight
Railfreight
Aviationfreight
Accidents 32.4 0.8 0.4 7.6 0.0 0.0
Noise 5.1 3.9 1.8 7.4 3.2 8.9
Air pollution 13.2 6.9 2.4 42.8 8.3 15.6
Climate change high 16.5 6.2 46.2 16.9 3.2 235.7
(Climate change low) (2.4) (0.9) (6.6) (2.4) (0.5) (33.7)
Nature and landscape 2.6 0.6 0.8 2.9 0.3 3.8
Up- and downstream 5.0 3.4 1.0 8.8 2.4 7.4
Urban effects 1.5 1.3 0.0 1.5 0.5 0.0
Source: INFRAS/IWW (Schreyer et al., 2004).
GLOBALISATION, TRANSPORT AND THE ENVIRONMENT © OECD 2010 189
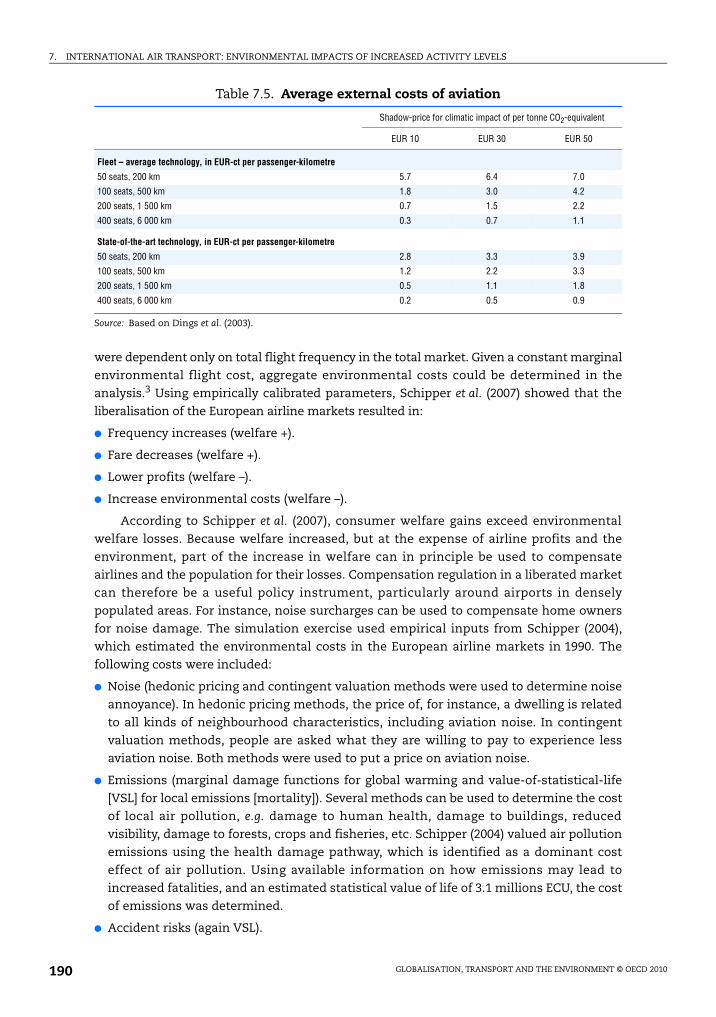
7. INTERNATIONAL AIR TRANSPORT: ENVIRONMENTAL IMPACTS OF INCREASED ACTIVITY LEVELS
were dependent only on total flight frequency in the total market. Given a constant marginal
environmental flight cost, aggregate environmental costs could be determined in the
analysis.3 Using empirically calibrated parameters, Schipper et al. (2007) showed that the
liberalisation of the European airline markets resulted in:
● Frequency increases (welfare +).
● Fare decreases (welfare +).
● Lower profits (welfare –).
● Increase environmental costs (welfare –).
According to Schipper et al. (2007), consumer welfare gains exceed environmental
welfare losses. Because welfare increased, but at the expense of airline profits and the
environment, part of the increase in welfare can in principle be used to compensate
airlines and the population for their losses. Compensation regulation in a liberated market
can therefore be a useful policy instrument, particularly around airports in densely
populated areas. For instance, noise surcharges can be used to compensate home owners
for noise damage. The simulation exercise used empirical inputs from Schipper (2004),
which estimated the environmental costs in the European airline markets in 1990. The
following costs were included:
● Noise (hedonic pricing and contingent valuation methods were used to determine noise
annoyance). In hedonic pricing methods, the price of, for instance, a dwelling is related
to all kinds of neighbourhood characteristics, including aviation noise. In contingent
valuation methods, people are asked what they are willing to pay to experience less
aviation noise. Both methods were used to put a price on aviation noise.
● Emissions (marginal damage functions for global warming and value-of-statistical-life
[VSL] for local emissions [mortality]). Several methods can be used to determine the cost
of local air pollution, e.g. damage to human health, damage to buildings, reduced
visibility, damage to forests, crops and fisheries, etc. Schipper (2004) valued air pollution
emissions using the health damage pathway, which is identified as a dominant cost
effect of air pollution. Using available information on how emissions may lead to
increased fatalities, and an estimated statistical value of life of 3.1 millions ECU, the cost
of emissions was determined.
● Accident risks (again VSL).
Table 7.5. Average external costs of aviation
Shadow-price for climatic impact of per tonne CO2-equivalent
EUR 10 EUR 30 EUR 50
Fleet – average technology, in EUR-ct per passenger-kilometre
50 seats, 200 km 5.7 6.4 7.0
100 seats, 500 km 1.8 3.0 4.2
200 seats, 1 500 km 0.7 1.5 2.2
400 seats, 6 000 km 0.3 0.7 1.1
State-of-the-art technology, in EUR-ct per passenger-kilometre
50 seats, 200 km 2.8 3.3 3.9
100 seats, 500 km 1.2 2.2 3.3
200 seats, 1 500 km 0.5 1.1 1.8
400 seats, 6 000 km 0.2 0.5 0.9
Source: Based on Dings et al. (2003).
GLOBALISATION, TRANSPORT AND THE ENVIRONMENT © OECD 2010190
7. INTERNATIONAL AIR TRANSPORT: ENVIRONMENTAL IMPACTS OF INCREASED ACTIVITY LEVELS
It appears from this study that environmental costs are only a small fraction of total
internal costs as measured by the ticket price (2.5%). Because prices have decreased
since 1990, this may currently be an underestimate. Noise was found to be the dominant
external effect (75% of the total external cost). This is probably due to the fact that noise
damage is experienced directly by the surrounding population, while the cost of emissions,
calculated using the marginal damage functions for global warming and value of statistical
life, is only experienced indirectly. This shows the difficulty of combining different effects.
The value of statistical life should reflect all costs that are incurred to avoid a fatality. But
difficulties in estimating this value can make the comparison difficult. There are
environmental economies of scale at the route level; environmental costs are decreasing in
aircraft size, and size is related to distances: large aircraft may be used on short distances,
but it is not always possible to use smaller aircraft on longer distances.
Scheelhaase and Grimme (2007) analysed the predicted growth of international air
transport in relation to internationally coordinated instruments for the reduction of
greenhouse gas emissions. Global (Kyoto) and European emission trading schemes were
mentioned. Scheelhaase and Grimme (2007) calculated the economic impacts for low-cost
carriers (Ryanair), full service (Lufthansa), holiday (Condor) and regional airlines (Air
Dolomiti), using the EU-ETS emissions trading scheme. Different scenarios were analysed,
in which airlines needed to hold allowances to emit CO2. Scenarios were favourable for
airlines (EUR 15 per allowance, allowances only needed for intra-EU flights), or less
favourable (EUR 30 per allowance, allowances needed for all flights departing from or
arriving at EU airports). Following an initial allocation based on grandfathering, airlines
needed to purchase allowances. It was concluded that the introduction of such a scheme
would generate competitive effects: the financial impact for low-cost carriers and regional
carriers (without hub-and-spoke networks) was larger than for network carriers, because
airlines with hub-and-spoke networks have better opportunities to pass the cost on to the
passengers. The cost per passenger of an allowance was a relatively small proportion of the
ticket price on a long-haul flight, so that given the price-elasticity of demand, which is
relatively low in absolute value on long-haul flights, airlines with large networks suffered
less. The impact on intercontinental traffic was therefore found to be relatively low. The
financial impacts for airlines would be marginal: costs would increase approximately 1% to
3%. Depending on the level of the tax rate applied, the impacts of a tax on aviation fuels
could have been higher.
7.3. Hub-and-spoke networksThe concentration in aviation markets means that airline networks are centred on
major hubs, which handle a relatively large share of all flights. Hub-and-spoke networks
can lead to environmental benefits because of economies-of-scale in environmental terms.
Passengers are concentrated on a few routes, so that larger aircraft may be used. But
transfer passengers fly longer distances, and take off and land twice, so that they have a
relatively large environmental impact. Intercontinental passengers can fly relatively
cheaply using indirect tickets, so that this may stimulate demand, while these passengers
often have a short-haul flight, with relatively high environmental costs, included in their
long-haul route. Moreover, the environmental damage of aviation at the ground level is
concentrated on a few airports and the surrounding areas.
Peeters et al. (2001) found that point-to-point networks have the lowest environmental
impacts, even though larger aircraft may be used in hub-and-spoke networks. Furthermore,
GLOBALISATION, TRANSPORT AND THE ENVIRONMENT © OECD 2010 191
7. INTERNATIONAL AIR TRANSPORT: ENVIRONMENTAL IMPACTS OF INCREASED ACTIVITY LEVELS
hubs have larger environmental impacts than non-hub airports, and the number of hubs (in
Europe) and their geographical distribution has a strong influence on the environmental
impacts of the total network. It should be pointed out that hubs are important for
international traffic. Passengers from different origins in Europe are collected at hubs, and
then transported to their final international or intercontinental destination (and vice versa).
Collecting passengers from different origins on a single intercontinental flight may be
beneficial for the environment compared to different intercontinental flights, but the
short-haul flights are relatively damaging. Interestingly, Peeters et al. (2001) found no
environmental economies-of-scale (contrary to Schipper, 2004). They pointed out that
technological developments in the last decades were mostly made for small- and medium-
sized aircraft. Combining passenger flows from different origins may lead to financial
benefits for airlines, but if the fuel efficiency of such aircraft per passenger-kilometre does
not really improve compared to smaller or medium sized aircraft, there may be little gain for
the environment. Peeters et al. (2001) mentioned that the results may change if technological
progress is made with large aircraft. Recently, new large aircraft have emerged (such as the
Airbus A380), which will probably offer environmental economies-of-scale. But such aircraft
can only be used between very large airports (intercontinental hubs), so demand will be
relatively low compared to smaller aircraft. Interestingly, Boeing chose not to develop such a
large aircraft, focusing instead on a smaller aircraft, to be used primarily in point-to-point
flights, rather than in a hub-and-spoke structure.
Morell and Lu (2007) examined noise disturbance and engine emissions in two
network structures: hub-and-spoke networks and hub-bypass structures (i.e. networks in
which passengers do not transfer at a hub). The noise social cost model was based on
hedonic pricing methods; total aggregate noise disturbance was allocated to individual
flights based on real impact of noise nuisance (aircraft type, etc.). The input for the engine
emissions social cost model was based on a literature review. Given the analysed
networks – using the airports London Heathrow, Glasgow, Frankfurt, Hamburg, Chicago
O’Hara, San Diego, Dallas and Tokyo – it was concluded that the hub-bypass routes
generate considerable savings in both noise and engine emissions costs. This confirmed
the result of Peeters et al. (2001) that hub-and-spoke networks have a relatively high
environmental impact, compared to point-to-point networks. This means that also in
long-haul, international markets, it may be better for the environment if direct flights are
used, rather than the indirect flights used by many passengers. Indirect flights may be
cheap, because airlines use them to exploit density economies, but they are, relatively
speaking, harmful for the environment.
Nero and Black (1998) also found that hubbing increases external costs (congestion,
aircraft noise and emissions). The paper analysed the effects of introducing environmental
costs on airport charges to hubbing airlines by formulating a model based on
Schmalensee’s model, but adapted to allow for monopolistic firms. After formulating that
model, they performed a simulation exercise to show the optimal level of environmental
taxes from a welfare perspective. From this exercise, the authors concluded that the
hub-and-spoke network could be abandoned in favour of a fully connected network if the
environmental tax were relatively high. No real empirical evidence was present, but the
“polluter pays” principle suggests that taxes for indirect flights or for international
passengers transferring at hubs should be relatively high, given the observations made
above. The results of Nero and Black (1998) suggested that airlines then will no longer use
such a network. Interestingly, the ticket taxes implemented by a few European countries
GLOBALISATION, TRANSPORT AND THE ENVIRONMENT © OECD 2010192
7. INTERNATIONAL AIR TRANSPORT: ENVIRONMENTAL IMPACTS OF INCREASED ACTIVITY LEVELS
are only for origin-destination passengers. Transfer passengers pay nothing, to safeguard
the competitive position of the hub airports as a transfer airport in international or
intercontinental markets. But this is bad for the environment. Carlsson (2002) extended the
analysis by Nero and Black (1998) by relaxing symmetry restrictions. An optimal charge was
defined for two types of networks (fully connected and hub-and-spoke) and for both a
monopolistic and a duopolistic market situation. In this model, the environmental effects
were solely dependent on the number of flights offered in the equilibrium outcome of each
market. Again, no empirical estimations were present.
7.4. Effect of aviation on house pricesIt was already mentioned above that hub-and-spoke networks lead to relatively large
noise (and other) emissions around hub airports. Various authors have tried to determine
the impact of airports on the surrounding region by looking at property prices. Such studies
do usually not consider CO2 and other emissions, but only focus on the relation between
property prices and noise levels.
Schipper et al. (1998) considered noise nuisance around airports. A comparison of
hedonic pricing (HP) and contingent valuation methods (CVM) to determine the cost of
aviation noise showed that CVM noise cost estimates were significantly higher than HP noise
cost estimates. An explanation might be that HP methods report only “use values”, while
CVM methods also uncover other value categories. Moreover, HP methods do not use
information on consumers not willing to consider properties because of noise nuisance.
Nineteen HP studies (related to property values), resulting in 30 noise depreciation indices
(NDI), were analysed using meta-analytical techniques. The NDI gives the percentage change
in property value due to a decibel change in noise exposure. Wealth and other
neighbourhood characteristics, such as accessibility, had a positive impact on the NDI.
Morell and Lu (2000) provided an empirical case study about the implicit social costs of
aircraft noise (via decline in property values) in the Amsterdam Schiphol area. Using a
social cost of noise function, based on hedonic pricing methods and the property values,
and the related parameters for the Amsterdam area (number of houses in noise contours,
etc.), the average social noise cost in 1999 was calculated as EUR 326.8 per landing. From
this estimate, the marginal social cost function was obtained. The authors claimed that the
figures are in line with previous related studies. It was concluded that the current noise
charges (EUR 157.3 per landing) were too low to “internalise” the social noise costs.
Morrison et al. (1999) provided an economic assessment of the benefits (higher
property values for homeowners) and costs (airplane’s reduced economical life) of the 1990
ANCA (Airport Noise and Capacity Act). Under noise regulation, the fleet of an airline
operator has to be renewed faster than without such regulation. According to the authors,
this accelerated (non-optimal) deprecation of the fleet was the source of the costs of
regulation. Benefits of the regulation were taken as the increase in housing values (based
on WTP). At the end, they came up with these figures: USD 5 billion benefits and
USD 10 billion costs (1995 dollars); therefore they were wondering if airplane noise
regulation was justified from an efficiency perspective.
7.5. ConclusionsAviation demand grew rapidly in the past decades, and it is expected that this growth
will continue (Boeing, 2007; de Haan, 2008; Horton, 2006). Technological innovations are not
GLOBALISATION, TRANSPORT AND THE ENVIRONMENT © OECD 2010 193
7. INTERNATIONAL AIR TRANSPORT: ENVIRONMENTAL IMPACTS OF INCREASED ACTIVITY LEVELS
expected to prevent an increase in CO2 emissions from aviation due to this increase in
demand (de Haan, 2007) – but the rate of technological progress will likely depend on the
extent to which the sector faces a price on the CO2 it emits. Depending on the technology
and scenario used, the average external cost of air travel is about EUR 0.01 to EUR 0.05 per
passenger-kilometre.
The deregulation of the aviation markets had profound effects on network developments.
Major airlines now use hub-and-spoke networks, which means that selected airports receive a
relatively large share of all take-offs and landings in the network. As a result, noise pollution in
the surrounding areas is relatively high, and passengers travelling indirectly have to make a
detour. But hub-and-spoke networks might also have environmental benefits because of
environmental economies-of-scale: larger aircraft, with lower emissions per seat, can be used
because passenger flows are concentrated on a few links. The literature indicates that negative
environmental effects of hub-and-spoke networks exceed the positive effects. Concentration
therefore tends to be bad for the environment. It is expected that the trend of concentration
will continue. For instance, when Ryanair celebrated the fact that it had flown 1 million
passengers to Bratislava (early November 2007), its CEO, Michael O’Leary claimed that within
five years there will be four major airlines left in Europe: British Airways, Air France, Lufthansa
and Ryanair. If British Airways, Air France and Lufthansa and their alliance partners will focus
their networks on a few intercontinental hubs, traffic levels will increase at these hubs due to
the expected general increase in demand, but also because more people need to make
transfers.
The increasing consolidation of aviation markets, together with growth in aviation
activity, means that the environmental damage caused by aviation will continue to grow.
As mentioned above, technological developments are not expected to prevent this.
Therefore, new alternative policy measures are necessary. A number of countries in Europe
have introduced ticket taxes. If such a ticket tax would approximate the marginal external
cost, this would be a sensible strategy. In this case, one tries to influence the individual
passenger’s travel behaviour. As long as passengers do not face the full cost of travel (i.e.
including external cost), demand will be too high. If the tax rate is too low or too high,
improper incentives are given. For instance, if transfer passengers do not pay the tax, the
ticket price is relatively low, and demand relatively high. As a result, the environmental
damage can also be relatively high. Moreover, other countries have not introduced such a
tax, and in most cases, passengers travelling indirectly (and thus causing relatively high
external cost) are exempt from the tax.
A disadvantage with a ticket tax is that it does not give airline companies any
incentive to reduce CO2 emissions per ticket sold. A tax on aviation fuels, or inclusion of
aviation in emission trading systems, would do that.
The EU will include aviation in their CO2 emissions trading scheme. Scheelhaase and
Grimme (2007) found that this will have only marginal effects on airline cost. The effect of
a kerosene tax could be higher, depending on the tax rate applied.
Air travel connects regions to the world economy, and gives individual travellers the
opportunity to explore the world. But as long as the full external cost is not covered by the
ticket price, environmental damage caused by aviation will continue to grow.
GLOBALISATION, TRANSPORT AND THE ENVIRONMENT © OECD 2010194
7. INTERNATIONAL AIR TRANSPORT: ENVIRONMENTAL IMPACTS OF INCREASED ACTIVITY LEVELS
Notes
1. This chapter is an edited version of the paper The Environmental Impacts of Increased International AirTransport: Past Trends and Future Perspectives, written by Eric Pels, VU University, the Netherlands, forthe OECD/ITF Global Forum on Transport and Environment in a Globalising World, held inGuadalajara, Mexico, 10-12 November 2008 (www.oecd.org/dataoecd/44/18/41508474.pdf).
2. High-speed rail captured a significant proportion of the London-Paris market, while airlines mayalso substitute high-speed rail for flights in short-haul markets to avoid the relatively high cost ofsuch short flights.
3. One may expect the external cost per flight to increase with the number of flights; e.g. a largenumber of flights with small aircraft may result in higher environmental costs than a relativelysmall number of flights with large aircraft. This makes the effects discussed below only stronger.
References
Boeing Aircraft Company (2007), Current Market Outlook, Boeing Aircraft Company, Seattle.
Button, K. and S. Taylor (2000), “International Air Transportation and Economic Development”, Journalof Air Transport Management, 6, pp. 209-222.
Carlsson, Frederik (1999), “Incentive-Based Environmental Regulation of Domestic Civil Aviation inSweden”, Transport Policy, 6, pp. 75-82.
Carlsson, Frederik (2002), “Environmental Charges in Airline Markets”, Transportation Research, Part D,pp. 137-153.
Dings, J.M.W. et al. (2003), External Costs of Aviation, Environmental Research of the Federal Ministry of theEnvironment, Nature Conservation and Nuclear Safety, Research Report 299 96 106, UBA-FB 000411.
Greene, D.L. (1992), “Energy Efficiency Improvement Potential of Commercial Aircraft”, in Annual Reviewof Energy and the Environment, J. Hollander, J. Harte and R.H. Soccolow (eds.), Annual Reviews Inc.,Palo Alto, CA, USA, pp. 537-574.
de Haan, A.R.C. (2008), “Limited Possibilities to Reduce CO2 Emissions from Aviation Due to the Growthin Aviation Demand”, Aerlines, 40, pp. 1-3.
de Haan, A.R.C. (2007), Aircraft Technology’s Contribution to Sustainable Development, Faculty ofTechnology, Policy and Management, Delft University of Technology, Delft.
Horton, G. (2006), Forecasts of CO2 Emissions from Civil Aircraft for IPCC, QinetiQ, London.
Kahn, A.E. (1988), “Surprises of Airline Deregulation”, American Economic Review. Papers and Proceedings,78 2, pp. 316-322.
Lee, D.S. (2004), “The Impacts of Aviation on Climate”, Issues in Environmental Science and Technology, 20,pp. 1-23.
Morell, Peter and Cherie H.Y. Lu (2000), “Aircraft Noise Social Cost and Charge Mechanisms – A CaseStudy of Amsterdam Airport Schiphol”, Transportation Research, Part D, 5, pp. 305-320.
Morell, Peter and Cherie H.Y. Lu (2007), “The Environmental Cost Implication of Hub-Hub versus Hubby-Pass Flight Networks”, Transportation Research, Part D, 12, pp. 143-157.
Morrison, Steven A., Clifford Winston and Tara Watson (1999), “Fundamental Flaws of SocialRegulation: The Case of Airplane Noise”, Journal of Law and Economics, Vol. XLII, pp. 723-743.
Nero, Giovanni and John A. Black (1998), “Hub-and-Spoke Networks and the Inclusion of EnvironmentalCosts on Airport Pricing”, Transportation Research, Part D, 3, pp. 275-296.
OECD (1993), Environmental Data Compendium 1993, OECD, Paris.
Penner, J.E., D.H. Lister, D.J. Griggs, D.J. Dokker and M. MacFarland (1999), Aviation and the GlobalAtmosphere: A Special Report of IPCC Working Groups I and III, Cambridge University Press, Cambridge,available at www.grida.no/climate/ipcc/aviation/index.htm.
Peeters, P.M., P. Rietveld and Y. Schipper (2001), Environmental Impacts of Hub-and-spoke Networks inEurope, Peeters Advies, Ede.
Royal Commission on Environmental Pollution (2007), The Environmental Effects of Civil Aircraft in Flight.
GLOBALISATION, TRANSPORT AND THE ENVIRONMENT © OECD 2010 195
7. INTERNATIONAL AIR TRANSPORT: ENVIRONMENTAL IMPACTS OF INCREASED ACTIVITY LEVELS
Scheelhaase, Janina D. and Wolfgang G. Grimme (2007), “Emissions Trading for International Aviation – AnEstimation of the Economic Impact on Selected European Airlines”, Journal of Air Transport Management,13, pp. 253-263.
Schreyer, C. et al. (2004), External Costs of Transport: Update Study, IWW, Universitaet Karlsruhe/INFRAS,Karlsruhe/Zurich, available at www.uic.org/html/environnement/cd_external/docs/externalcosts_en.pdf.
Schipper, Youdi (2004), “Environmental Costs in European Aviation”, Transport Policy, 11, pp. 141-154.
Schipper, Youdi, Peter Nijkamp and Piet Rietveld (1998), “Why do Aircraft Noise Value Estimates ValueDiffer? A Meta-Analysis”, Journal of Air Transport Management, 4, pp. 117-124.
Schipper, Youdi, Piet Rietveld and Peter Nijkamp (2007), “Frequency Competition and EnvironmentalCosts: An Application to European Air Transport Liberalization”, Socio-Economic Planning Sciences, 41,pp. 208-223.
GLOBALISATION, TRANSPORT AND THE ENVIRONMENT © OECD 2010196
Globalisation, Transport and the Environment
© OECD 2010
Chapter 8
International Road and Rail Freight Transport: Environmental Impacts
of Increased Activity Levels
byHuib van Essen1
This chapter assesses the environmental impacts of increased international roadand rail freight transport – focussing on air emissions and noise. It gives anoverview of major trends and of the main drivers behind them. In addition, thischapter briefly discusses the main technical and non-technical measures for tacklingthe increasing environmental impacts.
The chapter explores the developments in emission factors of road and rail vehicles,particularly the standards for reducing pollutant emissions and the differencesamong the emissions of the various modes. In the last decades, there has beenincreasing evidence that emissions of greenhouse gas contributes to the effect ofglobal warming; the emissions of carbon dioxide (CO2) from the burning of fossilfuels is a major contributor. For the transport sector, greenhouse gas emissions aredominated by the CO2 emissions from burning fossil fuels. The CO2 emissions ofinternational road freight transport are increasing all over the world, and there isnot yet a sign that this trend is to be curbed soon. The chapter looks at impacts frompollutant emissions on various problems related to air quality (health, building andmaterial damages, crops and ecosystems), and at health and nuisance impacts fromnoise. A mix of measures, like increased motor fuel taxes, stricter fuel efficiencystandards for vehicles, promotion of alternative fuels and logistical improvements,is needed.
197

8. INTERNATIONAL ROAD AND RAIL FREIGHT TRANSPORT: ENVIRONMENTAL IMPACTS OF INCREASED ACTIVITY LEVELS
8.1. Introduction
Background
Road transport has several impacts on the environment. Emissions contribute to air
pollution and climate change, noise causes nuisance and health risks and infrastructure
have serious impacts on landscape and ecosystems. In addition to these impacts on the
environment, transport has also other severe impacts on society. Every year hundreds of
thousands of people are killed and injured in accidents, and in many densely populated
areas, high congestion levels result in time losses.
The impacts of the transport sector as a whole are the sum of the impacts of the
various transport modes, both freight and passenger transport. The freight transport
market consists of various submarkets that interact, but often do not really compete with
each other. At a regional level, distribution of goods takes place, mainly by small and
medium-sized trucks. At the other end of the spectrum, there are the long-distance global
flows between the various continents, in which maritime shipping is the main mode of
transport (in particular, as regards volume). Somewhere in between is the international
haulage market, which can be characterised as the transport chain between shipping of
goods between the continents and the regional distribution networks. In this intra-
continental international freight transport market, road and rail transport are the most
important modes, but inland shipping and short-sea shipping also play an important role
in some parts of the world.
Environmental impacts from transport
Box 8.1. Trends in transport accidents
The WHO estimated the number of road fatalities at 1.2 million in 1999. Further researchshowed that this is probably an overestimation (Jacobs and Aeron-Thomas, 2000). Theyestimated the number of fatalities worldwide at 750 000 to 880 000 in 1999, and thenumber of people injured by road accidents at 23 to 34 million per year.
It is very difficult to make forecasts for these global figures. In Europe, the number offatalities is rapidly decreasing (from about 71 000 in 1990 to 41 000 in 2005). However, inother parts of the world, transport growth may well exceed the effect of vehicle and trafficsafety improvements.
The number of victims from rail transport accidents is much smaller than for road. In theEuropean Union, 105 people were killed in rail accidents in 2004, which was about 0.2% ofthe number of fatalities in road accidents.
GLOBALISATION, TRANSPORT AND THE ENVIRONMENT © OECD 2010198
8. INTERNATIONAL ROAD AND RAIL FREIGHT TRANSPORT: ENVIRONMENTAL IMPACTS OF INCREASED ACTIVITY LEVELS
Climate change
Climate change is one of the great challenges of current society. In the last decades,
there has been increasing evidence that emissions of greenhouse gas contributes to the
effect of global warming. The emission of carbon dioxide (CO2) from the burning of fossil
fuels is a major contributor. For the transport sector, greenhouse gas emissions are
dominated by the CO2 emissions from burning fossil fuels. These are strongly related to
transport energy use.
The Intergovernmental Panel on Climate Change (IPCC) has examined a range of
future climate change scenarios and found that the globally average surface air temperature
is projected by models to warm 1.1 oC to 6.4 oC by 2100 relative to 2000, and global average sea
level is projected by models to rise 18 cm to 59 cm by 2100. The warming is expected to vary
by region, and to be accompanied by changes in precipitation, in the variability of climate,
and in the frequency and intensity of some extreme climate phenomena (drought,
flooding) as well as impacts on ecosystems, and diseases (IPCC, 2007a).
Air pollution
Transport-related air pollution causes damages to humans, biosphere, soil, water,
buildings and materials. The most important pollutants are the following:
● Particulate matter (PM10, PM2.5).
● Nitrogen oxides (NOx).
● Sulphur oxide (SO2).
● Ozone (O3).
● Volatile organic compounds (VOC).
The emissions of pollutants give rise to negative health impacts, building and material
damages, crop losses and damages to the ecosystem (biosphere, soil, water). Each impact
is related to one or more type of pollutants (Maibach et al., 2008):
● Health impacts – Impacts on human health due to the aspiration of fine particles (PM2.5/
PM10, other air pollutants). Exhaust emission particles are here considered as the most
important pollutant. In addition, ozone (O3) has impacts on human health. The main
health impacts are increased problems for people who suffer respiratory diseases and a
higher risk of these diseases.
● Building and material damages – Mainly two effects are of importance: First, soiling of
building surfaces/facades primarily through particles and dust. The second, more
important, impact is the degradation through corrosive processes, due to acid air
pollutants like NOx and SO2.
● Crop losses in agriculture and impacts on the biosphere – Crops as well as forests and other
ecosystems are damaged by acid deposition, ozone exposition and SO2.
● Impacts on biodiversity and ecosystems (soil and water/groundwater) – The impacts on soil
and groundwater are mainly caused by eutrophication and acidification, due to the
deposition of nitrogen oxides, as well as contamination with heavy metals (from tire
wear and tear).
The main impacts are the health impacts mainly caused by particulate matter (PM)
from exhaust emissions or transformation of other pollutants. There is increasing
evidence that ultrafine particular particles pose severe health risks.
GLOBALISATION, TRANSPORT AND THE ENVIRONMENT © OECD 2010 199
8. INTERNATIONAL ROAD AND RAIL FREIGHT TRANSPORT: ENVIRONMENTAL IMPACTS OF INCREASED ACTIVITY LEVELS
The World Health Organization (WHO) estimated the number of people who die from
outdoor air pollution at 865 000 per year worldwide (WHO, 2007), less than 10% of these in
the European Union. Other estimates are even much higher. The European Commission
estimated the number of premature deaths in Europe alone at 370 000 per year (EC, 2005).
This is in line with an estimate from Pimental, who estimated the number of deaths
globally from outdoor air pollution at about 3 million per year (Cornell Chronicle, 2007).
Unlike the climate impacts of CO2, the impacts from air pollutant emissions depend
on location. Air pollutants that are emitted in densely populated areas cause considerably
more harm than pollutants emitted in remote areas.
Noise impacts
Traffic noise has a variety of adverse impacts on human health. WHO has recognised
community noise, including traffic noise, as a serious public health problem.
Traffic noise has various adverse effects. The most widespread effect is simply
annoyance. In addition, there is substantial evidence of serious health problems caused by
traffic noise. The main problem is that sleep patterns are disturbed, which affects cognitive
functioning (especially in children) and contributes to certain cardiovascular diseases.
There is also increasing evidence of an impact of noise raising blood pressure (Den Boer
and Schroten, 2007).
The number of people in the European Union who are affected by cardiovascular
diseases that can be traced to traffic noise has been estimated at over 245 000 people per
year (Den Boer and Schroten, 2007). About 20% of these people (almost 50 000) suffer a
lethal heart attack, thereby dying prematurely. There are no such estimates known for
other parts of the world, but there is no reason not to assume that also elsewhere a
considerable share of the population is seriously affected by traffic noise.
8.2. Trends in environmental impacts from transportThis section gives an overview of the main trends in the environmental impacts of the
transport sector as a whole, and road and rail freight transport in particular.
Energy use in the transport sector
The trends in energy use from transport over the last decades are depicted in
Figure 8.1. Energy consumption in transport almost doubled over this period. The growth
in non-OECD countries was even higher: energy use almost tripled over this period. Both
for OECD and non-OECD countries, road transport had by far the largest share: about three
quarters, and this share is steadily increasing.
Projections for energy use until 2050 are shown in Figure 8.2. This graph shows that
the energy use of transport is expected to keep on growing at a similar rate as in the last
decades, doubling between 2000 and 2040. The growth rates in road freight transport and
rail transport are roughly the same as these general growth rates.
Just as happened in the past decades, the energy use of the transport sector is expected
to grow much faster in non-OECD countries than in OECD countries. Where non-OECD
countries currently account for about 36% of the worldwide transport-related CO2 emissions,
their share is expected to equal that of the OECD countries somewhere around 2040.
Particularly in Asia and Latin America, energy use of transport is expected to grow strongly.
GLOBALISATION, TRANSPORT AND THE ENVIRONMENT © OECD 2010200
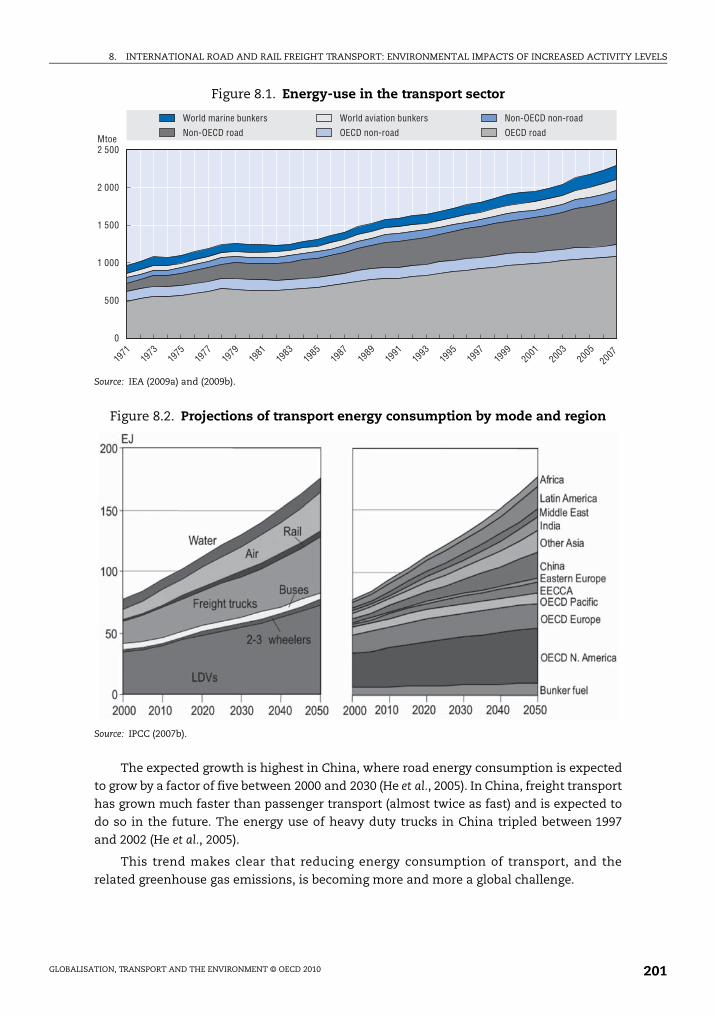
8. INTERNATIONAL ROAD AND RAIL FREIGHT TRANSPORT: ENVIRONMENTAL IMPACTS OF INCREASED ACTIVITY LEVELS
The expected growth is highest in China, where road energy consumption is expected
to grow by a factor of five between 2000 and 2030 (He et al., 2005). In China, freight transport
has grown much faster than passenger transport (almost twice as fast) and is expected to
do so in the future. The energy use of heavy duty trucks in China tripled between 1997
and 2002 (He et al., 2005).
This trend makes clear that reducing energy consumption of transport, and the
related greenhouse gas emissions, is becoming more and more a global challenge.
Figure 8.1. Energy-use in the transport sector
Source: IEA (2009a) and (2009b).
Figure 8.2. Projections of transport energy consumption by mode and region
Source: IPCC (2007b).
2 500
2 000
1 500
1 000
500
0
1971
1973
1975
1977
1979
1981
1983
1985
1987
1989
1991
1993
1995
1997
1999
2001
2003
2005
2007
Mtoe Non-OECD road
World marine bunkers
OECD non-road
World aviation bunkers
OECD road
Non-OECD non-road
GLOBALISATION, TRANSPORT AND THE ENVIRONMENT © OECD 2010 201

8. INTERNATIONAL ROAD AND RAIL FREIGHT TRANSPORT: ENVIRONMENTAL IMPACTS OF INCREASED ACTIVITY LEVELS
The main energy source for transport is fossil fuels. Road transport, shipping and
aviation almost entirely rely on oil. The only exception to this is electric rail transport,
which uses for a considerable share other energy sources, like hydro or nuclear power,
depending on the energy mix in electricity generation.
The share of the transport sector in world oil consumption is much higher than the
share in the world energy consumption. As can be seen in Figure 8.3, also this share is
steadily increasing. Currently, more than half of the world oil production is consumed in
the transport sector.
Data from IPCC (2007b) show that currently, road freight transport accounts for about
25% of the total energy use of transport, 16 % by heavy trucks and 9% by medium trucks.
From the perspective of international road transport, particularly the heavy trucks
(including truck-trailer combinations) are important, since these are the vehicles mostly
used within the international haulage market.
Rail transport accounts for only 1.5% of global transport energy use. Light duty
vehicles (including passenger cars) have the highest share with 44%. The other main
energy users within the transport sector are: aviation (12%), maritime shipping (10%) and
buses (6%).
There are no worldwide statistics on the share of international road and rail freight
transport in the energy use of total freight transport. However, data on the share of
international freight transport in transport volume can give a good indication. As
elaborated in Chapter 5, international transport generally constitutes a minor share in road
transport. In rail transport, the share of international transport varies greatly.
Greenhouse gas emissions in transport
The worldwide greenhouse emissions of all sectors together show a steady growth.
Despite policy interventions like the Kyoto Protocol, this growth is continuing. However,
there are major differences among sectors. While greenhouse gas emissions of many other
Figure 8.3. Evolution of oil consumption per sector in Mtoe
1. Includes agriculture, commercial and public services, residential and non-specified other sectors.
Source: IEA (2009c).
1971
1973
1975
1977
1979
1981
1983
1985
1987
1989
1991
1993
1995
1997
1999
2001
2003
2005
2007
4 000
3 500
3 000
2 500
2 000
1 500
1 000
500
0
Mtoe
Non-energy use Other sectors1 Industry Transport
GLOBALISATION, TRANSPORT AND THE ENVIRONMENT © OECD 2010202

8. INTERNATIONAL ROAD AND RAIL FREIGHT TRANSPORT: ENVIRONMENTAL IMPACTS OF INCREASED ACTIVITY LEVELS
sectors stabilised, or even decreased, over the last decades, the CO2 emissions of the
transport sector keep on growing. Together with the energy sector, transport is the only
sector with still strongly increasing CO2 emissions. Figure 8.4 shows the trend in worldwide
CO2 emissions and the share of the various sectors. The share of transport increases from
about one sixth in the early 1980s to now almost one quarter (23%). In OECD countries, this
share is even higher (about 29%, ECMT, 2007).
Within the transport sector, the shares and trends in CO2 emissions of the various
transport modes are comparable to the shares and trends in energy use (see Figure 8.1). As
depicted in Figure 8.5, road transport has the highest share in transport CO2 emissions. As
for energy use, growth in non-OECD countries is higher than in OECD countries,
particularly for road transport.
Figure 8.4. Energy-related CO2 emissions of various sectors worldwide
Source: Based on IEA (2006).
Figure 8.5. CO2 emissions of the transport sector worldwide
Source: IEA (2009a) and (2009b).
1980 1985 1990 1995 2000
30 000
25 000
20 000
15 000
10 000
5 000
0
Million tonnes
Other sectors International shipping International aviation Industry Energy sector Transport
1971
1973
1975
1977
1979
1981
1983
1985
1987
1989
1991
1993
1995
1997
1999
2001
2003
2005
2007
7
6
5
4
3
2
1
0
Gt CO2
World marine bunkers World aviation bunkers Non-OECD non-road
Non-OECD road OECD non-road OECD road
GLOBALISATION, TRANSPORT AND THE ENVIRONMENT © OECD 2010 203

8. INTERNATIONAL ROAD AND RAIL FREIGHT TRANSPORT: ENVIRONMENTAL IMPACTS OF INCREASED ACTIVITY LEVELS
In Europe, aviation shows the highest increase in CO2 emissions. In the European
Union, CO2 emissions of land transport increased by 26% between 1990 and 2005, while
CO2 emissions of international aviation and maritime shipping rose by as much as 66%
(EEA, 2008b).
Without policy intervention, the current growth in transport CO2 emissions is
expected to continue. Figure 8.6 shows projections for the global transport emissions by
mode from 1970 to 2050. Between 2000 and 2050, transport CO2 emissions are expected to
double, with most growth in road transport and aviation. Freight transport has been
growing even more rapidly than passenger transport and is expected to continue to do so
in the future (IPCC, 2007b).
Trends in pollutant emissions
Pollutant emissions from transport have considerable effect on human health. While
energy use and climate change emissions show a steady growth, the emission of pollutants
have been curbed to a decreasing trend, thanks to emissions regulations in most countries
(see also Section 8.4).
Figure 8.7 shows trends in air pollutant emissions from transport in Europe. Despite
growing energy use in the transport sector, pollutant emissions are dropping steadily. This is
the case for particulates, acidifying substances (NOx and SOx) and ozone precursors (NOx and
VOC). However, despite the decrease in air pollutant emissions, many European cities still
Figure 8.6. Historical and projected CO2 emissions from transport by mode worldwide
Source: IPCC (2007b).
GLOBALISATION, TRANSPORT AND THE ENVIRONMENT © OECD 2010204

8. INTERNATIONAL ROAD AND RAIL FREIGHT TRANSPORT: ENVIRONMENTAL IMPACTS OF INCREASED ACTIVITY LEVELS
have problems meeting the current air quality standards, which might be further tightened
from 2010. On the other hand, given the further tightening of emissions standards and
natural renewal of the fleet, emission levels are expected to continue decreasing.
Also in most other parts of the world, stricter vehicle emission standards are resulting in
an overall reduction of pollutant emissions. Only in regions with an extremely strong growth
of transport volumes, particularly road (e.g. China), emission reduction per vehicle-kilometre
may not be strong enough to result in an overall decrease in pollutant transport emissions.
A further breakdown of the NOx emissions to the various transport modes makes clear
that the decrease in pollutant emissions can in large part be explained by a reduction in
road transport pollutants (see Figure 8.8). The decrease in pollutant emissions from road
Figure 8.7. Transport emissions of air pollutants in EEA countries1990-2004
Source: EEA (2006a).
Figure 8.8. Transport emissions of air pollutants in EEA countries1990-2004
Source: EEA (2006a).
120
100
80
60
40
20
01990 1991 1992 1993 1994 1995 1996 1997 1998 1999 2000 2001 2002 2003 2004
Index, 1990 = 100
Acidifying substances Ozone precursors Particulates (PM10)
Navigation (national) Railways Road transportCivil aviation (int. bunkers) Civil aviation (domestic) Navigation (int. bunkers)
12 000
10 000
8 000
6 000
4 000
2 000
01990 1991 1992 1993 1994 1995 1996 1997 1998 1999 2000 2001 2002 2003 2004
Kilotonnes
GLOBALISATION, TRANSPORT AND THE ENVIRONMENT © OECD 2010 205
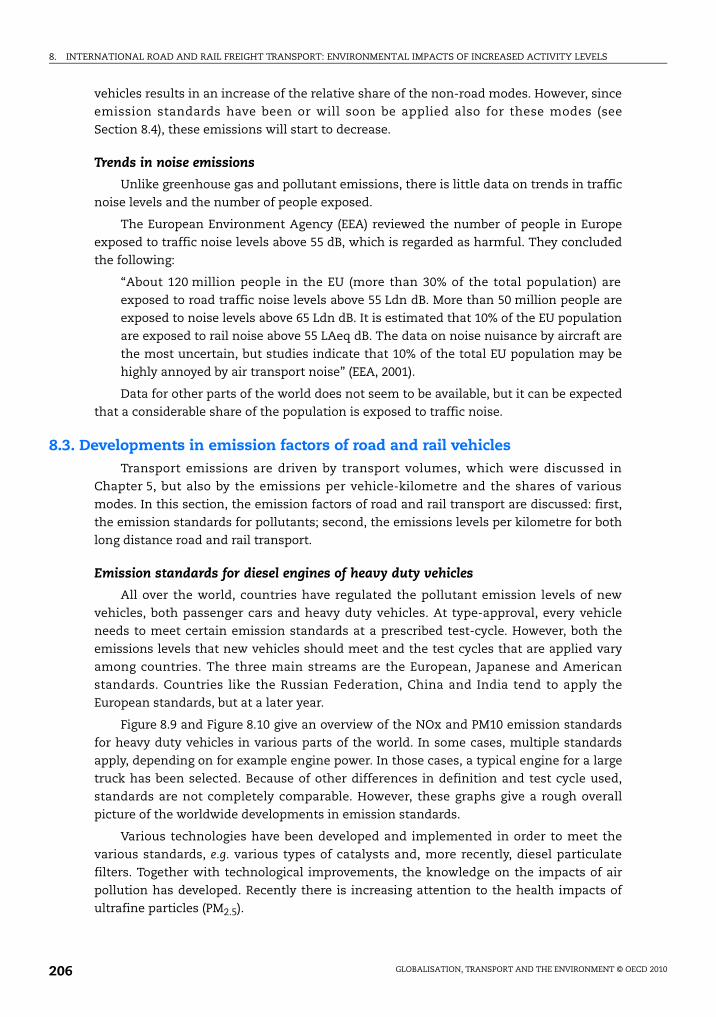
8. INTERNATIONAL ROAD AND RAIL FREIGHT TRANSPORT: ENVIRONMENTAL IMPACTS OF INCREASED ACTIVITY LEVELS
vehicles results in an increase of the relative share of the non-road modes. However, since
emission standards have been or will soon be applied also for these modes (see
Section 8.4), these emissions will start to decrease.
Trends in noise emissions
Unlike greenhouse gas and pollutant emissions, there is little data on trends in traffic
noise levels and the number of people exposed.
The European Environment Agency (EEA) reviewed the number of people in Europe
exposed to traffic noise levels above 55 dB, which is regarded as harmful. They concluded
the following:
“About 120 million people in the EU (more than 30% of the total population) are
exposed to road traffic noise levels above 55 Ldn dB. More than 50 million people are
exposed to noise levels above 65 Ldn dB. It is estimated that 10% of the EU population
are exposed to rail noise above 55 LAeq dB. The data on noise nuisance by aircraft are
the most uncertain, but studies indicate that 10% of the total EU population may be
highly annoyed by air transport noise” (EEA, 2001).
Data for other parts of the world does not seem to be available, but it can be expected
that a considerable share of the population is exposed to traffic noise.
8.3. Developments in emission factors of road and rail vehiclesTransport emissions are driven by transport volumes, which were discussed in
Chapter 5, but also by the emissions per vehicle-kilometre and the shares of various
modes. In this section, the emission factors of road and rail transport are discussed: first,
the emission standards for pollutants; second, the emissions levels per kilometre for both
long distance road and rail transport.
Emission standards for diesel engines of heavy duty vehicles
All over the world, countries have regulated the pollutant emission levels of new
vehicles, both passenger cars and heavy duty vehicles. At type-approval, every vehicle
needs to meet certain emission standards at a prescribed test-cycle. However, both the
emissions levels that new vehicles should meet and the test cycles that are applied vary
among countries. The three main streams are the European, Japanese and American
standards. Countries like the Russian Federation, China and India tend to apply the
European standards, but at a later year.
Figure 8.9 and Figure 8.10 give an overview of the NOx and PM10 emission standards
for heavy duty vehicles in various parts of the world. In some cases, multiple standards
apply, depending on for example engine power. In those cases, a typical engine for a large
truck has been selected. Because of other differences in definition and test cycle used,
standards are not completely comparable. However, these graphs give a rough overall
picture of the worldwide developments in emission standards.
Various technologies have been developed and implemented in order to meet the
various standards, e.g. various types of catalysts and, more recently, diesel particulate
filters. Together with technological improvements, the knowledge on the impacts of air
pollution has developed. Recently there is increasing attention to the health impacts of
ultrafine particles (PM2.5).
GLOBALISATION, TRANSPORT AND THE ENVIRONMENT © OECD 2010206
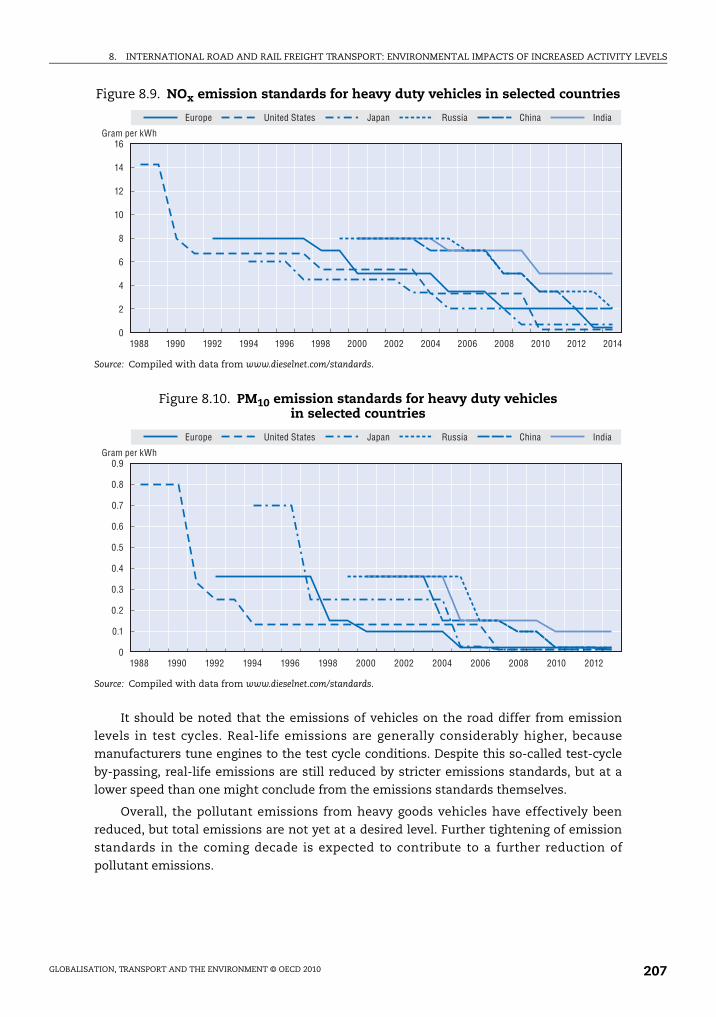
8. INTERNATIONAL ROAD AND RAIL FREIGHT TRANSPORT: ENVIRONMENTAL IMPACTS OF INCREASED ACTIVITY LEVELS
It should be noted that the emissions of vehicles on the road differ from emission
levels in test cycles. Real-life emissions are generally considerably higher, because
manufacturers tune engines to the test cycle conditions. Despite this so-called test-cycle
by-passing, real-life emissions are still reduced by stricter emissions standards, but at a
lower speed than one might conclude from the emissions standards themselves.
Overall, the pollutant emissions from heavy goods vehicles have effectively been
reduced, but total emissions are not yet at a desired level. Further tightening of emission
standards in the coming decade is expected to contribute to a further reduction of
pollutant emissions.
Figure 8.9. NOx emission standards for heavy duty vehicles in selected countries
Source: Compiled with data from www.dieselnet.com/standards.
Figure 8.10. PM10 emission standards for heavy duty vehicles in selected countries
Source: Compiled with data from www.dieselnet.com/standards.
16
14
12
10
8
6
4
2
01988 1990 1992 1994 1996 1998 2000 2002 2004 2006 2008 2010 2012 2014
Gram per kWh
Europe United States Japan Russia China India
0.9
0.8
0.7
0.6
0.5
0.4
0.3
0.1
0.2
01988 1990 1992 1994 1996 1998 2000 2002 2004 2006 2008 2010 2012
Gram per kWh
Europe United States Japan Russia China India
GLOBALISATION, TRANSPORT AND THE ENVIRONMENT © OECD 2010 207
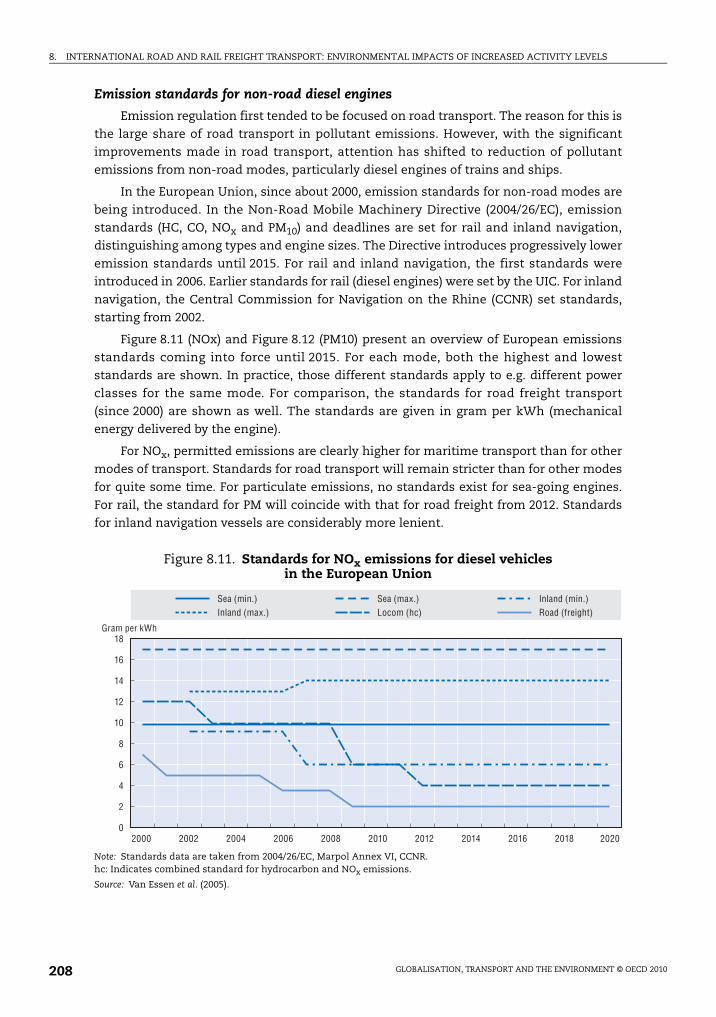
8. INTERNATIONAL ROAD AND RAIL FREIGHT TRANSPORT: ENVIRONMENTAL IMPACTS OF INCREASED ACTIVITY LEVELS
Emission standards for non-road diesel engines
Emission regulation first tended to be focused on road transport. The reason for this is
the large share of road transport in pollutant emissions. However, with the significant
improvements made in road transport, attention has shifted to reduction of pollutant
emissions from non-road modes, particularly diesel engines of trains and ships.
In the European Union, since about 2000, emission standards for non-road modes are
being introduced. In the Non-Road Mobile Machinery Directive (2004/26/EC), emission
standards (HC, CO, NOx and PM10) and deadlines are set for rail and inland navigation,
distinguishing among types and engine sizes. The Directive introduces progressively lower
emission standards until 2015. For rail and inland navigation, the first standards were
introduced in 2006. Earlier standards for rail (diesel engines) were set by the UIC. For inland
navigation, the Central Commission for Navigation on the Rhine (CCNR) set standards,
starting from 2002.
Figure 8.11 (NOx) and Figure 8.12 (PM10) present an overview of European emissions
standards coming into force until 2015. For each mode, both the highest and lowest
standards are shown. In practice, those different standards apply to e.g. different power
classes for the same mode. For comparison, the standards for road freight transport
(since 2000) are shown as well. The standards are given in gram per kWh (mechanical
energy delivered by the engine).
For NOx, permitted emissions are clearly higher for maritime transport than for other
modes of transport. Standards for road transport will remain stricter than for other modes
for quite some time. For particulate emissions, no standards exist for sea-going engines.
For rail, the standard for PM will coincide with that for road freight from 2012. Standards
for inland navigation vessels are considerably more lenient.
Figure 8.11. Standards for NOx emissions for diesel vehicles in the European Union
Note: Standards data are taken from 2004/26/EC, Marpol Annex VI, CCNR.hc: Indicates combined standard for hydrocarbon and NOx emissions.
Source: Van Essen et al. (2005).
18
16
14
12
10
8
6
2
4
02000 2002 2004 2006 2008 2010 2012 2014 2016 2018 2020
Gram per kWh
Sea (min.) Sea (max.) Inland (min.)Inland (max.) Locom (hc) Road (freight)
GLOBALISATION, TRANSPORT AND THE ENVIRONMENT © OECD 2010208
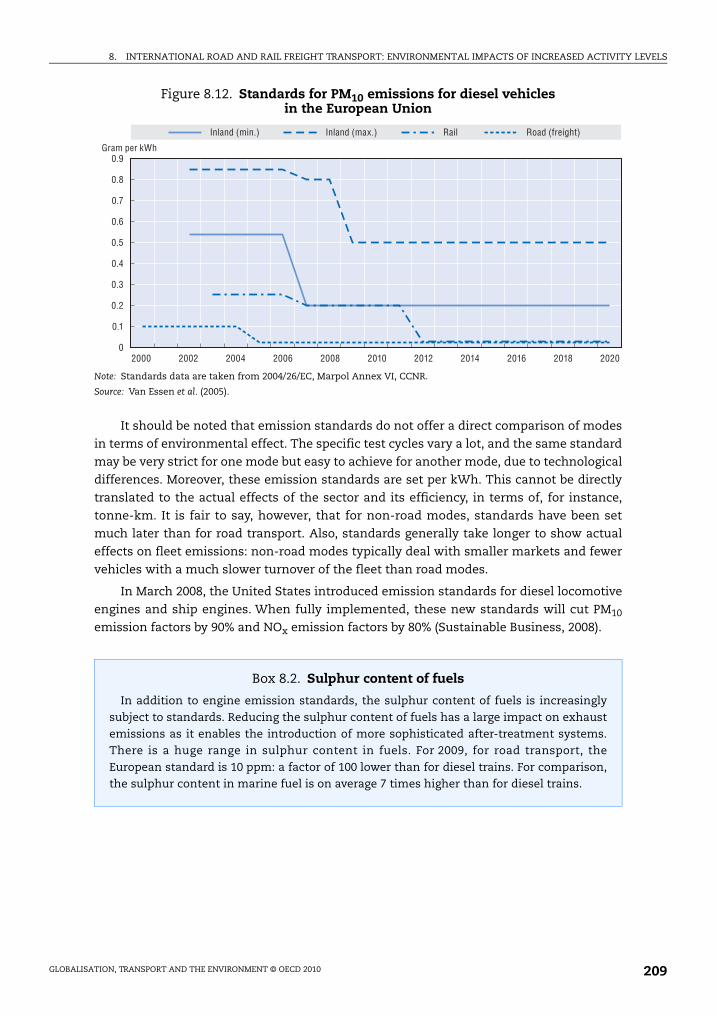
8. INTERNATIONAL ROAD AND RAIL FREIGHT TRANSPORT: ENVIRONMENTAL IMPACTS OF INCREASED ACTIVITY LEVELS
It should be noted that emission standards do not offer a direct comparison of modes
in terms of environmental effect. The specific test cycles vary a lot, and the same standard
may be very strict for one mode but easy to achieve for another mode, due to technological
differences. Moreover, these emission standards are set per kWh. This cannot be directly
translated to the actual effects of the sector and its efficiency, in terms of, for instance,
tonne-km. It is fair to say, however, that for non-road modes, standards have been set
much later than for road transport. Also, standards generally take longer to show actual
effects on fleet emissions: non-road modes typically deal with smaller markets and fewer
vehicles with a much slower turnover of the fleet than road modes.
In March 2008, the United States introduced emission standards for diesel locomotive
engines and ship engines. When fully implemented, these new standards will cut PM10
emission factors by 90% and NOx emission factors by 80% (Sustainable Business, 2008).
Figure 8.12. Standards for PM10 emissions for diesel vehicles in the European Union
Note: Standards data are taken from 2004/26/EC, Marpol Annex VI, CCNR.
Source: Van Essen et al. (2005).
Box 8.2. Sulphur content of fuels
In addition to engine emission standards, the sulphur content of fuels is increasinglysubject to standards. Reducing the sulphur content of fuels has a large impact on exhaustemissions as it enables the introduction of more sophisticated after-treatment systems.There is a huge range in sulphur content in fuels. For 2009, for road transport, theEuropean standard is 10 ppm: a factor of 100 lower than for diesel trains. For comparison,the sulphur content in marine fuel is on average 7 times higher than for diesel trains.
0.9
0.8
0.7
0.6
0.5
0.4
0.3
0.1
0.2
02000 2002 2004 2006 2008 2010 2012 2014 2016 2018 2020
Gram per kWh
Inland (min.) Inland (max.) Rail Road (freight)
GLOBALISATION, TRANSPORT AND THE ENVIRONMENT © OECD 2010 209

8. INTERNATIONAL ROAD AND RAIL FREIGHT TRANSPORT: ENVIRONMENTAL IMPACTS OF INCREASED ACTIVITY LEVELS
Emissions levels per kilometre for long-distance road and rail transport
Transport causes emissions in various ways:
● Vehicle usage: burning of fuels.
● Fuel production.
● Vehicle production, maintenance and disposal.
● Infrastructure building, maintenance and adjustments.
The first type of emission is generally regarded as the most important source of
transport-related emissions. In order to be able to compare various modes, emissions
along the whole energy chain (both the production and burning of fuel) are usually taken
into account. In the case of electric trains, this includes the electricity production. This
approach is called “well-to-wheel”. The well-to-wheel emissions of various freight
transport modes can be compared by expressing them in gram per tonne-kilometre.
The emissions from the production, maintenance and disposal of vehicles can be
analysed by life-cycle analysis (LCA). Both the well-to-wheel and LCA approaches are
depicted in Figure 8.13.
For passenger cars, the emissions of vehicle use are about 80% of the total emissions;
the other 20% are emissions related to infrastructure provisioning and the production,
maintenance and disposal of vehicles (CE Delft, 2008). For passenger transport by rail, the
estimates of these shares vary a lot, probably because of differences in the energy mix.
There are no estimates available for road or rail freight transport.
Figure 8.13. “Well-to-wheel” analysis of energy chains and “life-cycle analysis” of products
Source: van Essen (2008).
“Well”
“Grave”
“Cradle”
“Wheel”
Indirect or well-to-tank (WTT) emissions
Mining of primaryenergy carrier
Transport
Well-to-wheel analysis (WTW)
Life cycle analysis (LCA)
Fuelproduction
Fueldistribution
Miningof materials
Productionof materials
Manufacturingof vehicle
Use of vehicle
Disposalof vehicle
Recycling
Direct ortank-to-wheel(TTW) emissions
GLOBALISATION, TRANSPORT AND THE ENVIRONMENT © OECD 2010210
8. INTERNATIONAL ROAD AND RAIL FREIGHT TRANSPORT: ENVIRONMENTAL IMPACTS OF INCREASED ACTIVITY LEVELS
For a sound comparison of the well-to-wheel emissions, competing modes should be
compared within market segments. Differences in logistical parameters, like load-factors,
empty rides and detours should be taken into account. In addition, it is important to
compare whole transport chains. Transport by non-road modes usually needs some road
transport to and from loading points.
Rail transport relies both on diesel and on electricity. The environmental performance
of electric trains is generally better than that of diesel trains. The actual difference depends
on the electricity mix and the applied diesel technology. An important difference is that
electric transport offers the possibility to use sustainably generated electricity. In that case,
the environmental performance of electric trains is much better than that of diesel trains.
However, in an integrated electricity market, the marginal environmental impact from
electric energy will be determined by the marginal supplier of electricity. It is difficult to
determine from which source any particular electricity stems.
Emissions per tonne-kilometre depend on the emission factors (in g per kWh), the
energy use and the vehicle utilisation. These factors vary a lot among countries and
specific situations as:
● There is a wide bandwidth in emission factors, particularly for pollutant emissions.
● There is huge variation in logistical parameters, particularly load-factors.
● Differences exist in the energy mix of electricity used for electric trains.
In specific markets, the differences among transport modes are generally small.
Differences depend more on logistical characteristics and technology (e.g. emission
standards) than on mode per se (Van Essen et al., 2003). In a recent study, emissions factors
for the Netherlands were compared. The results for pollutant emissions of long-distance
container transport are shown in Figure 8.14. The NOx and PM10 emissions per tonne-
kilometre are highest for sea shipping. In this case, emissions of rail transport are lower
than those of road transport. The differences among the modes depend on the emission
factors and the energy efficiency of each mode. The average emission factor for heavy duty
vehicles in this case is about the level of Euro-3.
At least as important are the differences in the average vehicle utilisation. In the
specific case of the non-bulk market in the Netherlands, the average utilisation of freight
trains (86%) is considerably higher than the average utilisation of trucks (26%), articulated
truck-trailer combinations (33%) or inland vessels (64%), which is directly reflected in the
emission levels per tonne-kilometre.
For comparison, the CO2 emissions per tonne-kilometre for the same case: long-
distance non-bulk container transport are also presented. In both cases, the CO2 emissions
of road transport are again higher than those of rail transport are also presented. Just as for
the pollutant emissions, the differences in CO2 emissions per tonne-kilometre are strongly
dependent on vehicle utilisation. The emissions of a fully loaded truck are comparable to
those of competing modes, when the whole transport chain is considered.
GLOBALISATION, TRANSPORT AND THE ENVIRONMENT © OECD 2010 211
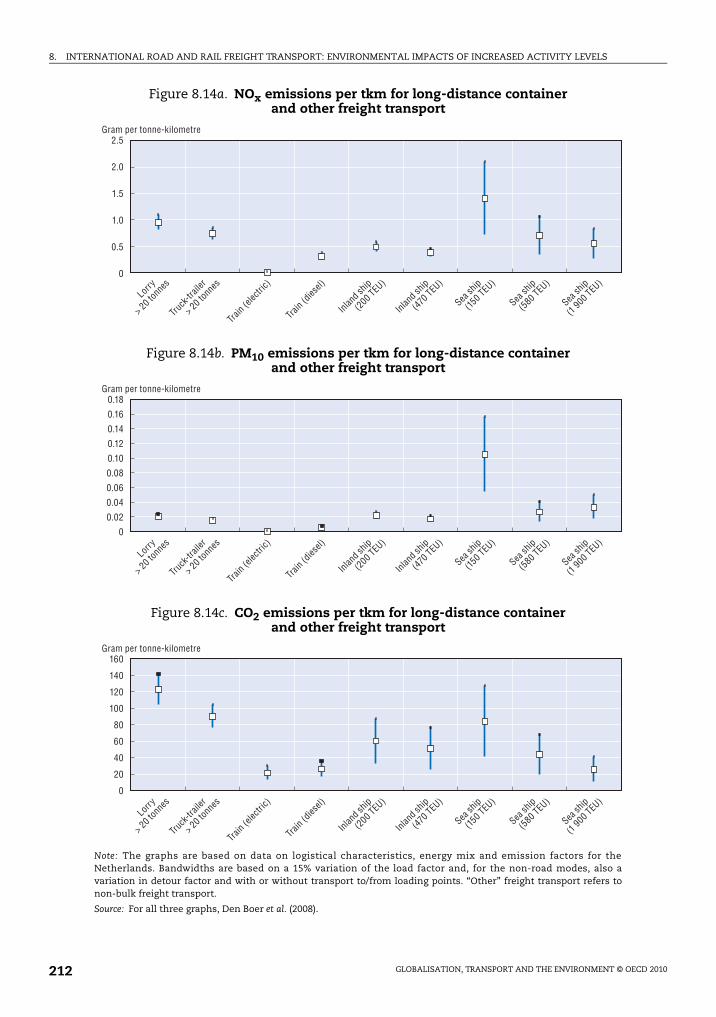
8. INTERNATIONAL ROAD AND RAIL FREIGHT TRANSPORT: ENVIRONMENTAL IMPACTS OF INCREASED ACTIVITY LEVELS
Figure 8.14a. NOx emissions per tkm for long-distance container and other freight transport
Figure 8.14b. PM10 emissions per tkm for long-distance container and other freight transport
Figure 8.14c. CO2 emissions per tkm for long-distance container and other freight transport
Note: The graphs are based on data on logistical characteristics, energy mix and emission factors for theNetherlands. Bandwidths are based on a 15% variation of the load factor and, for the non-road modes, also avariation in detour factor and with or without transport to/from loading points. “Other” freight transport refers tonon-bulk freight transport.
Source: For all three graphs, Den Boer et al. (2008).
2.5
2.0
1.5
1.0
0.5
0
Truck
-trail
er
> 20 t
onne
s
Inlan
d ship
(200 T
EU)
Inlan
d ship
(470 T
EU)
Sea sh
ip
(150 T
EU)
Sea sh
ip
(580 T
EU)
Sea sh
ip
(1 900 T
EU)
Train
(elec
tric)
Train
(dies
el)Lo
rry
> 20 t
onne
s
Gram per tonne-kilometre
0.18
0.16
0.14
0.12
0.10
0.08
0.06
0.04
0.02
0
Truck
-trail
er
> 20
tonn
es
Inlan
d ship
(200 T
EU)
Inlan
d ship
(470
TEU)
Sea sh
ip
(150 T
EU)
Sea sh
ip
(580 T
EU)
Sea sh
ip
(1 900 T
EU)
Train
(elec
tric)
Train
(dies
el)Lo
rry
> 20 t
onne
s
Gram per tonne-kilometre
160
140
120
100
80
60
40
20
0
Truck
-trail
er
> 20 t
onne
s
Inlan
d ship
(200 T
EU)
Inlan
d ship
(470 T
EU)
Sea sh
ip
(150 T
EU)
Sea sh
ip
(580 T
EU)
Sea sh
ip
(1 900 T
EU)
Train
(elec
tric)
Train
(dies
el)Lo
rry
> 20 t
onne
s
Gram per tonne-kilometre
GLOBALISATION, TRANSPORT AND THE ENVIRONMENT © OECD 2010212
8. INTERNATIONAL ROAD AND RAIL FREIGHT TRANSPORT: ENVIRONMENTAL IMPACTS OF INCREASED ACTIVITY LEVELS
8.4. Perspectives for improving environmental performance of freight transportAs presented in Section 8.2, the CO2 emissions of transport show an increasing trend.
This is in contrast to the ambitious CO2 reduction targets discussed within the post-Kyoto
climate policy and which have already been adopted by some regions and countries
(e.g. the European Union). In the short term, many developed countries will be able to meet
their CO2 reduction goals under the Kyoto Protocol without drastic measures in the
transport sector. For the long term, however, CO2 emission reductions of 40% to 80%
compared to 1990 are expected to be necessary, in order to limit the effects of global
warming to acceptable levels. Given the expected growth of the transport sector in the next
decades, and its strong reliance on fossil fuels, such long-term reduction goals cannot be
met without significant contributions from the transport sector.
In this section, the main options for CO2 reduction in international road and rail
freight transport will be discussed:2
● International road freight transport:
1. Technical measures.
2. Non-technical measures.
● Measures for CO2 reduction in international rail freight transport.
● General measures for CO2 reduction in international surface freight transport:
3. Biofuels and other alternative fuels.
4. Measures aimed at volume reduction and modal shift.
Pollutant emissions of long-distance freight transport can most effectively be reduced
by further tightening of vehicle emission standards.3 Also the measures aimed at volume
reduction and modal shift may contribute to a reduction of pollutant emissions, e.g. a shift
towards electric rail transport in combination with a shift to greening electricity
production. The options for reducing noise emission from international transport are
briefly discussed at the end of Section 8.4.
Technical measures to improve energy efficiency in road freight transport
Fuel costs are a significant part of the operating costs of heavy duty vehicles. Hence,
efficiency improvement has traditionally been an important driver in vehicle and engine
developments for freight transport. Furthermore, the engine in a heavy duty application is
generally used in a more energy-efficient way, because of a smaller power-to-weight ratio
than passenger cars and the use of an optimised gearbox (Smokers and Kampman, 2006).
As a consequence, the potential for further efficiency improvement in road vehicles
for freight transport seems rather limited, especially in the sector of long-distance
transport. For urban distribution, trucks and city buses, the driving pattern is generally
more dynamic, so engine improvements and application of a hybrid power-train may offer
significant fuel economy benefits.
The main technical options for improving energy efficiency in heavy duty vehicles are
(Smokers and Kampman, 2006):
● Low rolling-resistance tyres ( 6%).
● Engine improvements ( 5%).
● Reduction of air resistance ( 6%).
● Increased weight limit to 44 or 60 tonne ( 9-20%).
GLOBALISATION, TRANSPORT AND THE ENVIRONMENT © OECD 2010 213

8. INTERNATIONAL ROAD AND RAIL FREIGHT TRANSPORT: ENVIRONMENTAL IMPACTS OF INCREASED ACTIVITY LEVELS
● Lightweight construction ( 7%).
● Hybrid propulsion for city buses and distribution trucks ( 15%).
The percentages between brackets are fuel-consumption reduction values for new
vehicles. For the current heavy duty vehicles that are used for international road freight
transport, the overall reduction potential is about 20% per vehicle-kilometre. The potential
reduction of an increased weight limit has not been counted yet. This could result in an
additional reduction of up to 20%.
While pollutant emissions from heavy duty vehicles are regulated, CO2 emissions are
not. For passenger cars, fuel efficiency standards have been developed in various parts of the
world. The tightest ones are currently developed in Europe. For heavy duty vehicles, only
Japan has introduced CO2 emission standards, aiming at a reduction of 12% of the average
CO2 emissions per vehicle-kilometre of heavy duty vehicles, between 2002 and 2015 (ECMT,
2007). The European Commission is investigating the costs of various technical options for
improving the fuel efficiency of heavy duty vehicles, which might be followed by the
development of some kind of fuel efficiency standards for these vehicles as well. An
important precondition for such a standard would be the development of a reliable test-cycle
for heavy duty vehicles or engines. This is probably more complicated than for passenger
cars because of the larger variety in applications of heavy-duty vehicles and a related larger
bandwidth of vehicle weight, which is a key driver for fuel consumption.
Non-technical measures to improve energy efficiency in road freight transport
Besides technical measures, a number of non-technical measures can also be
implemented to reduce fuel consumption in passenger cars, vans and heavy-duty vehicles.
In the following subsection, the main options, according to Smokers and Kampman (2006),
are listed.
Eco-driving
The main elements of a fuel-efficient driving style (eco-driving) are:
● Maintaining a low engine rotations-per-minute by early shifting to higher gear during
acceleration and driving in the highest possible gear at more constant speeds. At a given
power-demand, the engine load (torque) is higher when the engine is operated at low
rpm. At higher loads, the engine’s efficiency is better than under part-load conditions.
● Anticipative and smooth driving in order to avoid unnecessary (strong) accelerations and
to reduce the unnecessary waste of kinetic energy by strong braking.
Depending on their initial driving style, drivers of passenger cars may save between 5%
and 25% fuel directly after an eco-driving course. Smokers et al. (2006) estimated, however,
that the long-term average improvement for passenger cars is of the order of 3%. The
potential may be improved by the use of a gear-shift indicator or a fuel-economy meter.
Although the maximum reduction potential for trucks is smaller than for passenger
cars, for this application the fuel-consumption reduction potential of eco-driving is
estimated to be 5%. The reason for this higher potential lies in the fact that professional
drivers may be expected to better maintain an efficient driving style and that they may be
expected to receive more intensive or more frequent training. The CO2-abatement costs
associated with eco-driving depend on the costs of lessons, the assumed effectiveness and
the fuel price. Both for passenger cars and for trucks, the abatement costs are expected to
be negative for most combinations of fuel price and costs of lessons (Smokers et al., 2006).
GLOBALISATION, TRANSPORT AND THE ENVIRONMENT © OECD 2010214
8. INTERNATIONAL ROAD AND RAIL FREIGHT TRANSPORT: ENVIRONMENTAL IMPACTS OF INCREASED ACTIVITY LEVELS
In the long term, the effectiveness of eco-driving is expected to decrease as many
technical measures implemented to improve energy-efficiency of vehicles do this by
improving the part-load efficiency of the engine.
Traffic measures
Various traffic measures can be implemented to smooth the traffic flow and reduce
driving dynamics. Examples are synchronisation of traffic lights and lower speed limits on
congested highways. These undoubtedly reduce fuel consumption and CO2 emissions per
vehicle-kilometre. On the other hand, such measures also tend to improve the flow of
traffic and to reduce congestion, which may result in increased traffic. This may counteract
possible benefits per vehicle. Moreover, for international road transport, this type of
measure is not expected to have large reduction potential, since international road
transport mainly uses motorways.
Improved logistics
According to Pischinger et al. (1998), Pischinger and Hausbergerm (1998), and Bates et al.
(2001), improved logistics could lead to a reduction in road freight kilometres, resulting in
10% to 20% fuel consumption reduction based on the following measures:
● Improved logistic organisation.
● Better co-ordination among all transport operators (also intermodal).
● Improved route planning.
CO2-avoidance costs are estimated to be negative, meaning that the cost of
implementation of these measures is lower than the cost savings. To get these types of
measures implemented, it is important to learn about the reasons why these measures are
currently not applied. This generally has to do with organisational reasons. It should also be
noted that the resulting reduction of the overall cost of transport may in turn increase
transport demand, which may partly counteract the absolute reduction in fuel consumption
and CO2 emissions.
The current vehicle utilisation of long-distance road freight transport (like in the
Netherlands, see Section 8.3) leaves room for improvement. The current vehicle utilisation
is a trade-off between the direct costs in vehicle-kilometres and the various costs of
optimising logistical chains. The latter include costs related to time losses, lower flexibility
and storage, which might increase when vehicles are used in a more efficient way.
Therefore, optimising logistics is not just a task for the transport sector, but it is also
strongly related to governmental measures, in particular transport pricing.
Measures to improve energy efficiency in rail freight transport
Diesel trains are responsible for only 0.5% of the EU25 CO2 emissions. Efficiency
improvement for these vehicles therefore does not have a high policy priority. The efficiency
of modern electric trains has improved greatly, due to the use of power electronics and
regenerative braking. The effects of this, however, are partly compensated by the increase in
energy consumption because of increased speed. For electric trains further well-to-wheel
efficiency improvements, or CO2-emission reductions, are stimulated by the fact that
electricity generation is part of the EU-ETS Emission Trading System (Klooster and
Kampman, 2006).4
GLOBALISATION, TRANSPORT AND THE ENVIRONMENT © OECD 2010 215
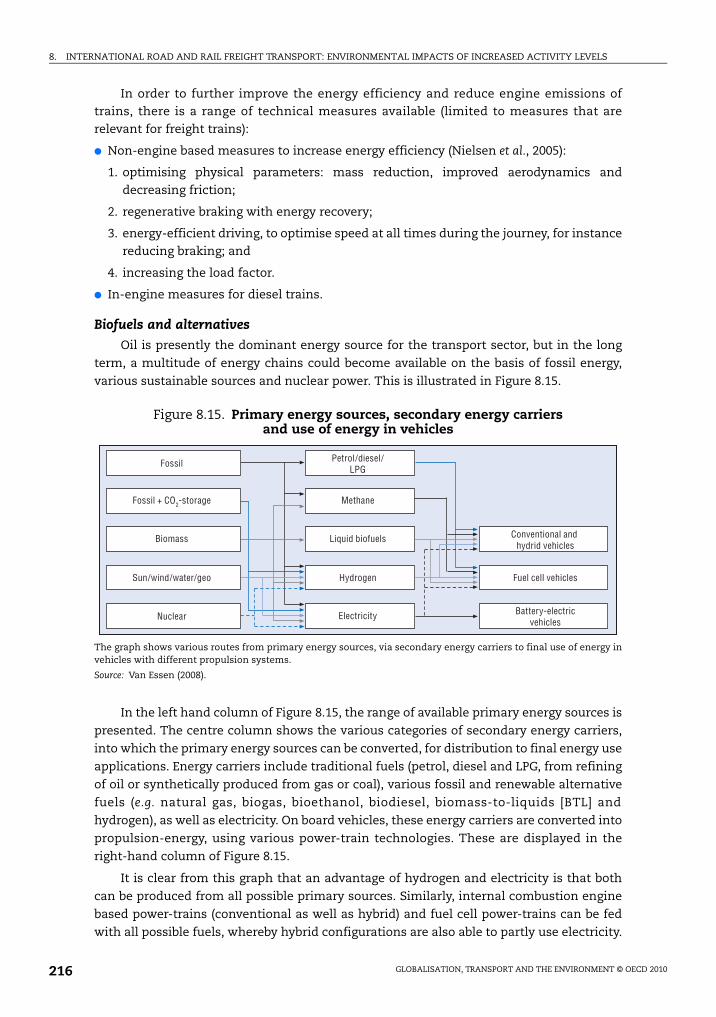
8. INTERNATIONAL ROAD AND RAIL FREIGHT TRANSPORT: ENVIRONMENTAL IMPACTS OF INCREASED ACTIVITY LEVELS
In order to further improve the energy efficiency and reduce engine emissions oftrains, there is a range of technical measures available (limited to measures that arerelevant for freight trains):
● Non-engine based measures to increase energy efficiency (Nielsen et al., 2005):
1. optimising physical parameters: mass reduction, improved aerodynamics anddecreasing friction;
2. regenerative braking with energy recovery;
3. energy-efficient driving, to optimise speed at all times during the journey, for instancereducing braking; and
4. increasing the load factor.
● In-engine measures for diesel trains.
Biofuels and alternativesOil is presently the dominant energy source for the transport sector, but in the long
term, a multitude of energy chains could become available on the basis of fossil energy,
various sustainable sources and nuclear power. This is illustrated in Figure 8.15.
In the left hand column of Figure 8.15, the range of available primary energy sources is
presented. The centre column shows the various categories of secondary energy carriers,
into which the primary energy sources can be converted, for distribution to final energy use
applications. Energy carriers include traditional fuels (petrol, diesel and LPG, from refining
of oil or synthetically produced from gas or coal), various fossil and renewable alternative
fuels (e.g. natural gas, biogas, bioethanol, biodiesel, biomass-to-liquids [BTL] and
hydrogen), as well as electricity. On board vehicles, these energy carriers are converted into
propulsion-energy, using various power-train technologies. These are displayed in the
right-hand column of Figure 8.15.
It is clear from this graph that an advantage of hydrogen and electricity is that both
can be produced from all possible primary sources. Similarly, internal combustion engine
based power-trains (conventional as well as hybrid) and fuel cell power-trains can be fed
with all possible fuels, whereby hybrid configurations are also able to partly use electricity.
Figure 8.15. Primary energy sources, secondary energy carriers and use of energy in vehicles
The graph shows various routes from primary energy sources, via secondary energy carriers to final use of energy invehicles with different propulsion systems.
Source: Van Essen (2008).
Fossil
Fossil + CO2-storage
Biomass
Sun/wind/water/geo
Nuclear
Petrol/diesel/LPG
Methane
Liquid biofuels
Hydrogen
Electricity
Conventional and hydrid vehicles
Fuel cell vehicles
Battery-electricvehicles
GLOBALISATION, TRANSPORT AND THE ENVIRONMENT © OECD 2010216
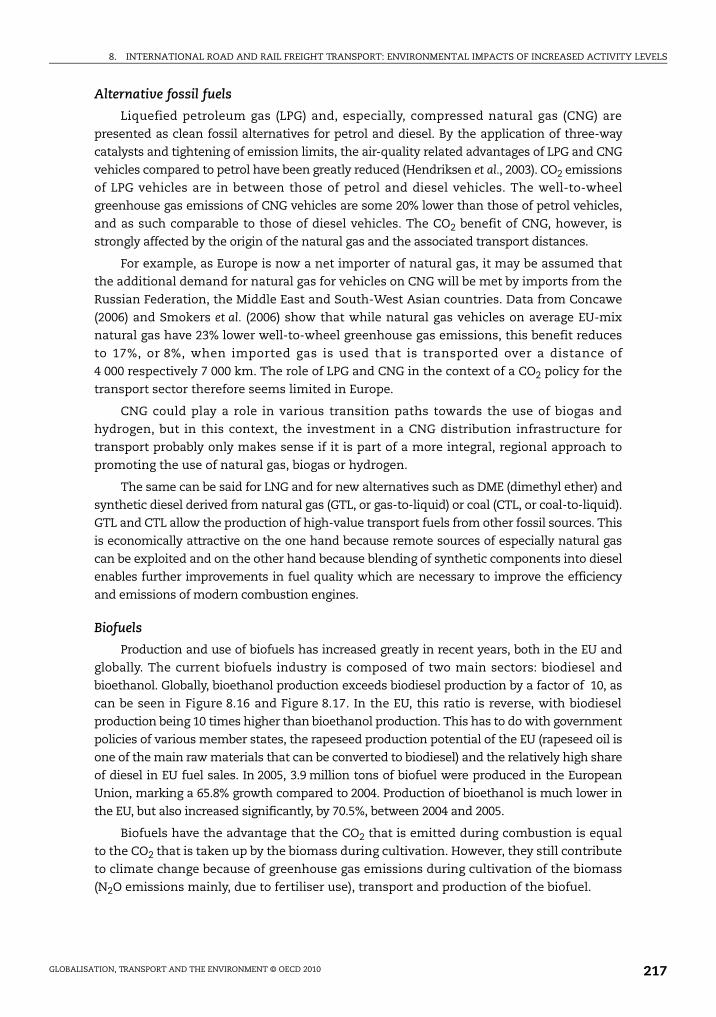
8. INTERNATIONAL ROAD AND RAIL FREIGHT TRANSPORT: ENVIRONMENTAL IMPACTS OF INCREASED ACTIVITY LEVELS
Alternative fossil fuels
Liquefied petroleum gas (LPG) and, especially, compressed natural gas (CNG) are
presented as clean fossil alternatives for petrol and diesel. By the application of three-way
catalysts and tightening of emission limits, the air-quality related advantages of LPG and CNG
vehicles compared to petrol have been greatly reduced (Hendriksen et al., 2003). CO2 emissions
of LPG vehicles are in between those of petrol and diesel vehicles. The well-to-wheel
greenhouse gas emissions of CNG vehicles are some 20% lower than those of petrol vehicles,
and as such comparable to those of diesel vehicles. The CO2 benefit of CNG, however, is
strongly affected by the origin of the natural gas and the associated transport distances.
For example, as Europe is now a net importer of natural gas, it may be assumed that
the additional demand for natural gas for vehicles on CNG will be met by imports from the
Russian Federation, the Middle East and South-West Asian countries. Data from Concawe
(2006) and Smokers et al. (2006) show that while natural gas vehicles on average EU-mix
natural gas have 23% lower well-to-wheel greenhouse gas emissions, this benefit reduces
to 17%, or 8%, when imported gas is used that is transported over a distance of
4 000 respectively 7 000 km. The role of LPG and CNG in the context of a CO2 policy for the
transport sector therefore seems limited in Europe.
CNG could play a role in various transition paths towards the use of biogas and
hydrogen, but in this context, the investment in a CNG distribution infrastructure for
transport probably only makes sense if it is part of a more integral, regional approach to
promoting the use of natural gas, biogas or hydrogen.
The same can be said for LNG and for new alternatives such as DME (dimethyl ether) and
synthetic diesel derived from natural gas (GTL, or gas-to-liquid) or coal (CTL, or coal-to-liquid).
GTL and CTL allow the production of high-value transport fuels from other fossil sources. This
is economically attractive on the one hand because remote sources of especially natural gas
can be exploited and on the other hand because blending of synthetic components into diesel
enables further improvements in fuel quality which are necessary to improve the efficiency
and emissions of modern combustion engines.
Biofuels
Production and use of biofuels has increased greatly in recent years, both in the EU and
globally. The current biofuels industry is composed of two main sectors: biodiesel and
bioethanol. Globally, bioethanol production exceeds biodiesel production by a factor of 10, as
can be seen in Figure 8.16 and Figure 8.17. In the EU, this ratio is reverse, with biodiesel
production being 10 times higher than bioethanol production. This has to do with government
policies of various member states, the rapeseed production potential of the EU (rapeseed oil is
one of the main raw materials that can be converted to biodiesel) and the relatively high share
of diesel in EU fuel sales. In 2005, 3.9 million tons of biofuel were produced in the European
Union, marking a 65.8% growth compared to 2004. Production of bioethanol is much lower in
the EU, but also increased significantly, by 70.5%, between 2004 and 2005.
Biofuels have the advantage that the CO2 that is emitted during combustion is equal
to the CO2 that is taken up by the biomass during cultivation. However, they still contribute
to climate change because of greenhouse gas emissions during cultivation of the biomass
(N2O emissions mainly, due to fertiliser use), transport and production of the biofuel.
GLOBALISATION, TRANSPORT AND THE ENVIRONMENT © OECD 2010 217
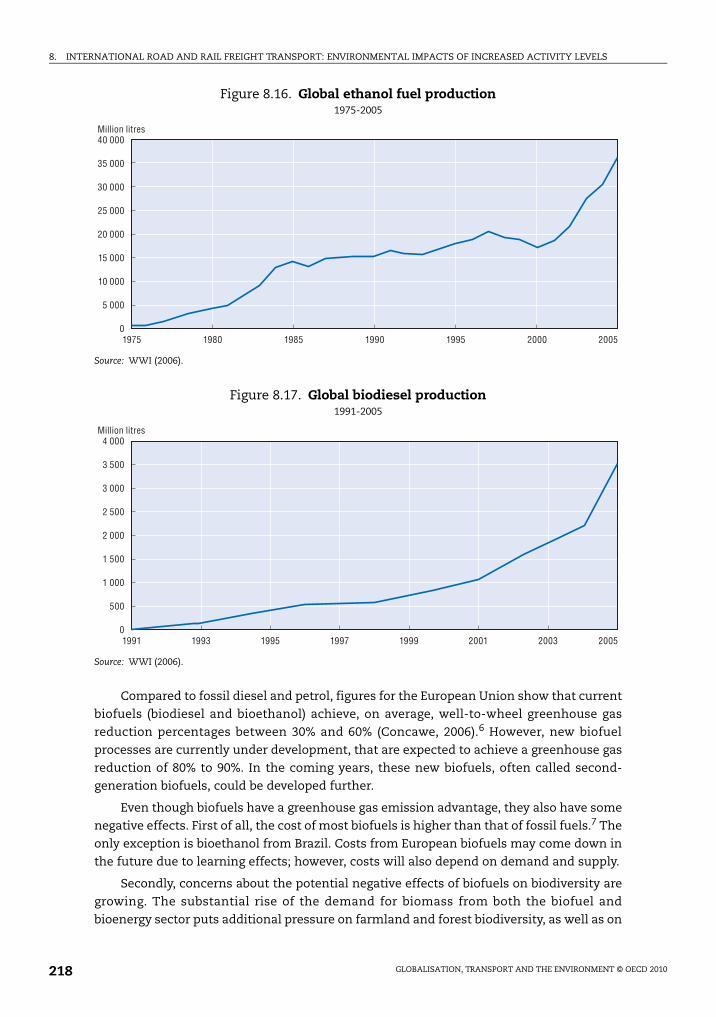
8. INTERNATIONAL ROAD AND RAIL FREIGHT TRANSPORT: ENVIRONMENTAL IMPACTS OF INCREASED ACTIVITY LEVELS
Compared to fossil diesel and petrol, figures for the European Union show that current
biofuels (biodiesel and bioethanol) achieve, on average, well-to-wheel greenhouse gas
reduction percentages between 30% and 60% (Concawe, 2006).6 However, new biofuel
processes are currently under development, that are expected to achieve a greenhouse gas
reduction of 80% to 90%. In the coming years, these new biofuels, often called second-
generation biofuels, could be developed further.
Even though biofuels have a greenhouse gas emission advantage, they also have some
negative effects. First of all, the cost of most biofuels is higher than that of fossil fuels.7 The
only exception is bioethanol from Brazil. Costs from European biofuels may come down in
the future due to learning effects; however, costs will also depend on demand and supply.
Secondly, concerns about the potential negative effects of biofuels on biodiversity are
growing. The substantial rise of the demand for biomass from both the biofuel and
bioenergy sector puts additional pressure on farmland and forest biodiversity, as well as on
Figure 8.16. Global ethanol fuel production1975-2005
Source: WWI (2006).
Figure 8.17. Global biodiesel production1991-2005
Source: WWI (2006).
40 000
35 000
30 000
25 000
20 000
15 000
10 000
5 000
01975 1980 1985 1990 1995 2000 2005
Million litres
4 000
3 500
3 000
2 500
2 000
1 500
1 000
500
01991 1993 1995 1997 1999 20032001 2005
Million litres
GLOBALISATION, TRANSPORT AND THE ENVIRONMENT © OECD 2010218
8. INTERNATIONAL ROAD AND RAIL FREIGHT TRANSPORT: ENVIRONMENTAL IMPACTS OF INCREASED ACTIVITY LEVELS
soil and water resources. It may also counteract other current and potential environmental
policies and objectives, such as waste minimisation or environmentally oriented farming
(EEA, 2006b). EEA (2006b) concludes that significant amounts of biomass can technically be
available to support ambitious renewable energy targets, even if strict environmental
constraints are applied. However, it also concludes that environmental guidelines need to
become an integral part of planning processes at the local, national and EU levels. Other
studies confirm that the biofuel potential is certainly not unlimited, due to constraints
regarding biodiversity, food production, water availability, etc. (see e.g. WWI, 2006).
Long-term options: Hydrogen and electricity
In the long term, also hydrogen and electricity can be envisaged to play a role in the energy
supply of the transport sector. It should be noted here that both are energy carriers and not
energy sources. As such, the well-to-wheel efficiency and CO2 emissions depend on the primary
source and conversion processes that are used to produce hydrogen and electricity. Given that
the “cap” on CO2 emissions in the EU-ETS includes electricity generation, application of
electricity in transport does already have well-to-wheel efficiency benefits in EU countries. For
hydrogen, this would only be the case if it was produced from renewable.
Many authors present visions of a “hydrogen economy” that will solve all our future
energy problems. It is, however, highly questionable whether distribution of energy in the
form of hydrogen is the most optimal solution from a system point of view. Possibly, a more
limited role for the production of hydrogen as a buffer to match demand patterns with the
supply patterns of renewable energy in the context of an “all-electric society” would be
more appropriate.
Volume reduction and modal shift
The trends in the environmental performance of transport, including those for
international road and rail freight transport, are strongly driven by the growth of transport
volume. Limiting the expected growth of transport volume can reduce the environmental
impacts of transport. For limiting the growth of CO2 emissions from freight transport, the
Box 8.3. A system-efficiency perspective
The example of hydrogen shows that in some cases, measures to improve the energyefficiency of the transport sector should not just be reviewed at the level of a vehicle-to-vehicle comparison, or a well-to-wheel comparison, but that a system-wide approach isnecessary, in which the relation of a given energy source with other applications outsidethe transport sector is taken into account, and in which the overall target is optimisationof system efficiency, rather than optimisation of the efficiency of transport. Already now,the efficiency of e.g. refineries is closely linked to processes in other sectors, through theuse of process-energies and the generation of by-products. This will probably be even morethe case for future fuel production systems. An interesting example already is theFischer-Tropsch process for production of synthetic fuels, of which the overall systemefficiency and well-to-wheel CO2 emissions are strongly dependent on the weather andwhere electricity, that can be generated as a by-product, is used.
GLOBALISATION, TRANSPORT AND THE ENVIRONMENT © OECD 2010 219
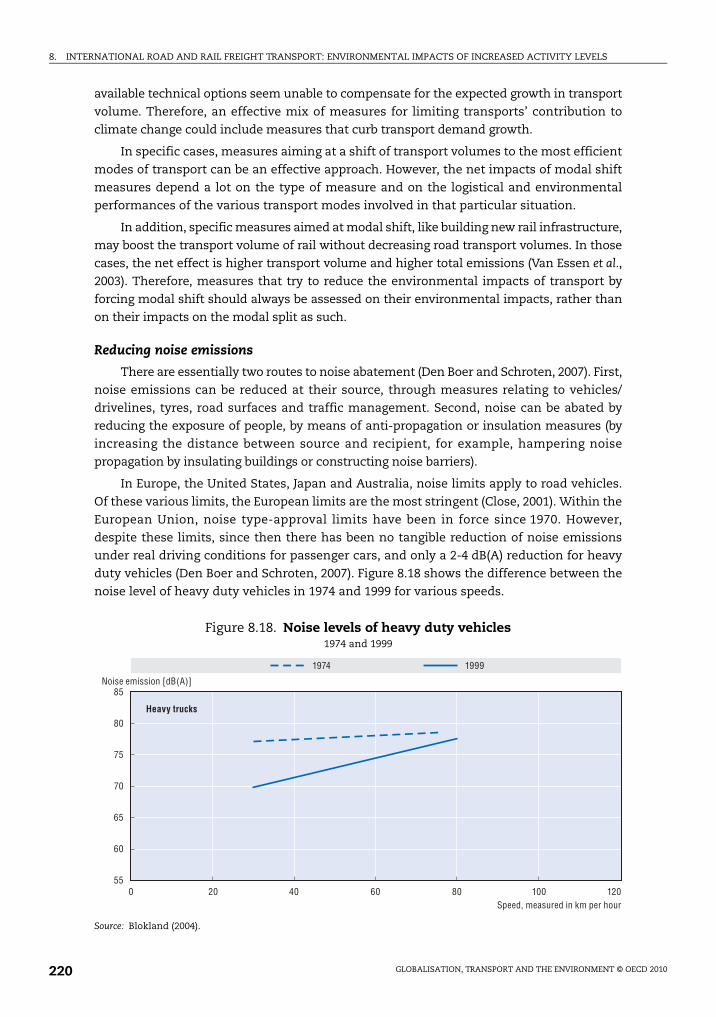
8. INTERNATIONAL ROAD AND RAIL FREIGHT TRANSPORT: ENVIRONMENTAL IMPACTS OF INCREASED ACTIVITY LEVELS
available technical options seem unable to compensate for the expected growth in transport
volume. Therefore, an effective mix of measures for limiting transports’ contribution to
climate change could include measures that curb transport demand growth.
In specific cases, measures aiming at a shift of transport volumes to the most efficient
modes of transport can be an effective approach. However, the net impacts of modal shift
measures depend a lot on the type of measure and on the logistical and environmental
performances of the various transport modes involved in that particular situation.
In addition, specific measures aimed at modal shift, like building new rail infrastructure,
may boost the transport volume of rail without decreasing road transport volumes. In those
cases, the net effect is higher transport volume and higher total emissions (Van Essen et al.,
2003). Therefore, measures that try to reduce the environmental impacts of transport by
forcing modal shift should always be assessed on their environmental impacts, rather than
on their impacts on the modal split as such.
Reducing noise emissions
There are essentially two routes to noise abatement (Den Boer and Schroten, 2007). First,
noise emissions can be reduced at their source, through measures relating to vehicles/
drivelines, tyres, road surfaces and traffic management. Second, noise can be abated by
reducing the exposure of people, by means of anti-propagation or insulation measures (by
increasing the distance between source and recipient, for example, hampering noise
propagation by insulating buildings or constructing noise barriers).
In Europe, the United States, Japan and Australia, noise limits apply to road vehicles.
Of these various limits, the European limits are the most stringent (Close, 2001). Within the
European Union, noise type-approval limits have been in force since 1970. However,
despite these limits, since then there has been no tangible reduction of noise emissions
under real driving conditions for passenger cars, and only a 2-4 dB(A) reduction for heavy
duty vehicles (Den Boer and Schroten, 2007). Figure 8.18 shows the difference between the
noise level of heavy duty vehicles in 1974 and 1999 for various speeds.
Figure 8.18. Noise levels of heavy duty vehicles1974 and 1999
Source: Blokland (2004).
0 20 40 60 80 100 120
85
80
75
70
65
60
55
1974 1999
Heavy trucks
Speed, measured in km per hour
Noise emission [dB(A)]
GLOBALISATION, TRANSPORT AND THE ENVIRONMENT © OECD 2010220
8. INTERNATIONAL ROAD AND RAIL FREIGHT TRANSPORT: ENVIRONMENTAL IMPACTS OF INCREASED ACTIVITY LEVELS
There is plenty of scope for reducing ambient noise levels by at least 3-4 dB(A) in the
short term, using currently available technology. The most cost-effective measures are those
addressing the noise at source (Den Boer and Schroten, 2007). This includes noise from the
engine, exhaust, mechanical systems and contact between tyres and road, or wheels and
track. The associated costs are generally limited, for vehicles and tyres at least. There are
signs that use of composite brake blocks on rail wagons also comes at a modest cost.
8.5. ConclusionsThe most important environmental impacts from the transport sector are caused by
emissions of air pollutants, CO2 and noise. International road and rail freight transport are
responsible for a minor, but increasing, share of these transport emissions.
The CO2 emissions of international road freight transport are increasing all over the
world, and there is not yet a sign that this trend is to be curbed soon. For this challenging
problem, there is no single cure available. A mix of measures, like increased motor fuel
taxes, stricter fuel efficiency standards for vehicles, promotion of alternative fuels and
logistical improvements, is needed.
The contribution of road and rail freight transport to air pollution is decreasing in most
parts of the world, mainly due to various vehicle emission standards that have been
implemented around the world and are periodically tightened. Only in those parts of the
world that have an extremely high growth in transport volumes, the overall emissions of
air pollutants may not yet decrease.
Noise is an important environmental problem which, just like air pollution, has severe
health impacts, causing high numbers of deaths each year. There are various measures
that could be taken to reduce the contribution of freight traffic to ambient noise levels. The
most cost-effective measures are those addressing the noise at source.
An effective policy for reducing the environmental impact of international road and rail
transport should aim at improving the environmental performance of all modes of transport,
as well as ensuring a level playing field for the various modes. Regulation, infrastructure
measures and pricing measures that take fully into account the environmental costs can
contribute to this.
Notes
1. This chapter is an edited version of the paper The Environmental Impacts of Increased International Roadand Rail Freight Transport – Past Trends and Future Perspectives, written by Huib van Essen, CE Delft, theNetherlands, for the OECD/ITF Global Forum on Transport and Environment in a Globalising World,held in Guadalajara, Mexico, 10-12 November 2008 (www.oecd.org/dataoecd/10/62/41380980.pdf).
2. Much of Section 8.4 is based on the assessment made by Smokers and Kampman, 2006.
3. One should keep in mind that a tightening of standards for pollutant emissions can lead to higherCO2 emissions.
4. It should in this context be kept in mind that an improvement in the efficiency of electric trainswill not reduce CO2 emissions in the EU overall – as long as the total “cap” of the EU-ETS remainsunchanged. Reduced electricity use by the trains would lead to lower permit prices and higheremissions in other sectors covered by the EU-ETS.
5. Conversely, increased electricity use stemming from a more widespread use of electric trains – orelectric road vehicles – will not increase EU-wide CO2 emissions (even if the electricity at themargin is generated by coal-fired power plants), as long as the “cap” remains unchanged.
GLOBALISATION, TRANSPORT AND THE ENVIRONMENT © OECD 2010 221

8. INTERNATIONAL ROAD AND RAIL FREIGHT TRANSPORT: ENVIRONMENTAL IMPACTS OF INCREASED ACTIVITY LEVELS
6. Data presented in Creutzen et al. (2008) indicate that the climate benefits of biofuels aresignificantly smaller, and could even be negative.
7. OECD (2009) addresses briefly the costs of current subsidies to biofuels production. Measuringthese subsidies in terms of how much is paid per tonne of CO2 emissions avoided gives estimatedimplicit prices in excess of USD 1 000. Given that the price of CO2 in the mitigation scenariodescribed in OECD (2009) does not rise above USD 50 (2005-dollars) until sometime after 2025,these subsidies seem a rather costly way of achieving emissions reductions.
References
Bates, J. et al. (2001), Economic Evaluation of Emission Reductions in the Transport Sector in the EU, AEATechnology, United Kingdom.
Blokland, Gijsjan van (2004), Type-approval as Instrument for Controlling Road Traffic Noise, M+P/Müller-BBM,Aalsmeer/Vugt, the Netherlands.
Close, Harry W. (2001), A Review of the Noise Related Australian Design Rules and Engine Brake Noise,Discussion paper for comment, National Transport Commission, Melbourne, Australia.
Cornell Chronicle (2007), “Water, Air and Soil Pollution Causes 40 Per Cent of Deaths Worldwide”,Cornell research survey finds, site visit: 25 March 2008, Cornell Chronical Online, Ithaca, USA,www.news.cornell.edu/stories/Aug07/moreDiseases.sl.html.
Concawe (2006), Well-to-wheels Analysis of Future Automotive Fuels and Powertrains in the European Context,CONCAWE/EUCAR/JRC, draft version.
Creutzen, P.J. et al. (2008), “N2O Release from Agro-Biofuel Production Negates Global Warming Reductionby Replacing Fossil Fuels”, Atmospheric Chemistry and Physics, 8, pp. 389-395, available at www.atmos-chem-phys.net/8/389/2008/acp-8-389-2008.pdf.
Den Boer, L.C. and A. Schroten (2007), Traffic Noise Reduction in Europe – Health Effects, Social Costs andTechnical and Policy Options to Reduce Road and Rail Traffic Noise, CE Delft, Delft, the Netherlands.
Den Boer, L.C. et al. (2008), STREAM – Studie naar TRansport Emissies van Alle Modaliteiten, CE Delft, Delft,the Netherlands.
European Commission (EC) (2005), Communication from the Commission to the Council and theEuropean Parliament, Thematic Strategy on Air Pollution, COM(2005)446 final, European Commission,Brussels, Belgium.
EC (2007), EU Energy and Transport Figures – Statistical Pocketbook 2006, European Commission, Brussels.
ECMT (2007), Cutting Transport CO2 Emissions – What Progress?, Summary report, ECMT, Paris, France.
European Environmental Agency (EEA) (2001), Traffic Noise Exposure and Annoyance, site visit:26 March 2008, EEA, Copenhagen, Denmark, http://ims.eionet.europa.eu/Sectors_and_activities/transport/indicators/consequences/noise_exposure/Noise_TERM_2001.doc.pdf.
EEA (2006a), TERM 2005 03 EEA32 – Transport Emissions of Air Pollutants (CO, NH3, NOx, NMVOCs, PM10,SOx) by Mode, EEA, Copenhagen, Denmark.
EEA (2006b), Transport and Environment: Facing a Dilemma, TERM 2005: Indicators Tracking Transport andEnvironment in the European Union, EEA report No. 3/2006, European Environmental Agency,Copenhagen, Denmark.
EEA (2008a), Climate for a Transport Change, TERM 2007: Indicators Tracking Transport and Environmentin the European Union, EEA, Copenhagen, Denmark.
EEA (2008b), Greenhouse Gas Emission Trends (CSI 010), Assessment published February 2008, site visit:21 March 2008, EEA, Copenhagen, Denmark, http://themes.eea.europa.eu/IMS/ISpecs/ISpecification20040909113419/IAssessment1195226181050/view_content.
Van Essen, H.P. et al. (2003), To Shift or not Shift, That’s the Question – The Environmental Performance of thePrincipal Modes of Freight and Passenger Transport in the Policy-making Context, CE Delft, Delft.
Van Essen, H.P. et al. (2005), Environmental Data and Policy on Non-road Transport Modes, Working Paper forthe European Environment Agency, CE Delft, Delft, 2003.
Van Essen, Huib (2008), The Environmental Impacts of Increase International Road and Rail Freigh Transport –Pats Trends and Future Perspectives. Paper prepared for the OECD/ITF Global Forum on Transport andEnvironment in a Globalising World, Guadalajara, Mexico, 10-12 November 2008.
GLOBALISATION, TRANSPORT AND THE ENVIRONMENT © OECD 2010222
8. INTERNATIONAL ROAD AND RAIL FREIGHT TRANSPORT: ENVIRONMENTAL IMPACTS OF INCREASED ACTIVITY LEVELS
Eurostat (2006), Statistics in Focus – Road Freight Transport 1999-2004: Cabotage and Transport with Non-EUCountries, Eurostat.
Eurostat (2007), Railway Transport – Goods Transported, by Type of Transport, Eurostat.
He, Kebin et al. (2005), “Oil Consumption and CO2 Emissions in China’s Road Transport: Current Status,Future Trends, and Policy Implication”, Energy Policy, 22(2005), pp. 1499-1507.
Hendriksen, P. et al. (2003), Evaluation of the Environmental Performance of Modern Passenger Cars Runningon Petrol, Diesel, Automotive LPG and CNG, TNO-report 03.OR.VM.055.1/PHE, TNO Automotive, Delft,the Netherlands.
IEA (2006), Key World Energy Statistics, site visit: 25 March 2008, OECD/IEA, Paris, downloaded fromwww.iea.org/Textbase/nppdf/free/2006/Key2006.pdf.
IEA (2009a), Energy Balances of Non-OECD Countries, 2009 edition, OECD/IEA, Paris.
IEA (2009b), CO2 Emissions from Fuel Combustion, 2009 edition, OECD/IEA, Paris.
IEA (2009c), Key World Energy Statistics 2009, OECD/IEA, Paris.
IPCC (2007a), IPCC Forth Assessment Report, Cambridge University Press, Cambridge, United Kingdom.
IPCC (2007b), IPCC Forth Assessment Report, Working Group III Report “Mitigation of Climate Change”,Cambridge University Press, Cambridge, United Kingdom.
Jacobs, G.D. and Amy Aeron-Thomas (2000), A Review of Global Road Accident Fatalities, site visit:27 March 2008, www.transport-links.org/transport_links/filearea/publications/1_771_Pa3568.pdf.
Klooster, Jeroen and Bettina Kampman (2006), Dealing with Transport Emissions, an Emission TradingSystem for the Transport Sector, A Viable Solution?, CE Delft, Delft, the Netherlands.
Maibach, M. et al. (2008), Handbook on Estimation of External Costs in the Transport Sector, produced withinthe study Internalisation Measures and Policies for All External Cost of Transport (IMPACT), CE Delft,Delft, the Netherlands.
Nielsen, Jens Buurgaard et al. (2005), Tracks for Saving Energy – Energy Saving Options, for NS Reizigers,CE Delft, Delft, the Netherlands.
OECD (2009), Climate Change Mitigation: What Do we Do?, OECD, Paris, available at www.oecd.org/dataoecd/31/55/41751042.pdf.
Pischinger, R. et al. (1997), Volkswirtschaftliche Kosten-Wirksamkeisanalyse von Maßnahmen zur Reduktionder CO2-Emissionen des Verkehrs in Österreich, a study for Bundesministeriums für Umwelt, Graz,Wien, Linz, Austria.
Pischinger, R. and S. Hausbergerm (1998), Cost Effectiveness Study on Measures to Reduce CO2-Emissions inthe Transport Sector in Austria, FISITA Congress Manuscript, Paris, September.
Smokers, Richard et al. (2006), Review and Analysis of the Reduction Potential and Costs of Technological andother Measures to Reduce CO2-Emissions from Passenger Cars, TNO report 06.OR.PT.040.2/RSM, Delft,the Netherlands.
Smokers, R. and B. Kampman (2006), Energy Efficiency in the Transport Sector, Discussion paper preparedfor the PEEREA Working Group on Energy Efficiency and Related Environmental Aspects, CE Delft,Delft, the Netherlands.
Smokers, R. et al. (2007), State-of-the-Art CO2 en Mobiliteit, CE Delft, Delft.
Sustainable Business (2008), New Emissions Standards for Diesel Trains and Ships, Article atSustainableBusiness.com, site visit: 27 March 2008, website www.sustainablebusiness.com/index.cfm/go/news.display/id/15589.
US Department of Transportation (2006), North American Freight Transportation – US Trade with Canadaand Mexico, US Department of Transportation, Washington DC.
World Health Organization (WHO) (2007), Estimated Deaths and DALYs Attributable to Selected EnvironmentalRisk Factors, by WHO member state, 2002, site visit: 25 March 2008, World Health Organization,Department of Public Health and Environment, January, www.who.int/quantifying_ehimpacts/countryprofilesebd.xls.
Worldwatch Institute (WWI) (2006), Biofuels for Transportation: Global Potential and Implications forSustainable Agriculture and Energy in the 21st Century, Worldwatch Institute.
GLOBALISATION, TRANSPORT AND THE ENVIRONMENT © OECD 2010 223

Globalisation, Transport and the Environment
© OECD 2010
Chapter 9
Policy Instruments to Limit Negative Environmental Impacts: An Economic Perspective
byKurt van Dender, Philippe Crist, James J. Corbett and James Winebrake1
This chapter provides an overview of current responses to climate change. It looksat how CO2 emissions from transport may evolve, assuming current energy pricesdo not change strongly. It discusses road transport, shipping and aviation in relationto CO2 emissions.
Transport activities have adverse environmental and health impacts, of which localand regional air pollution, climate change and noise impacts are the mostimportant. This chapter is a non-comprehensive overview of existing and potentialpolicies to deal with these negative impacts, with a focus on international transport.“International transport” is here defined as those transport activities that aremainly derived from the globalisation of economic activity, not as cross-bordertransport flows in a more narrow sense. Surface transport, aviation and maritimetransport are discussed. The focus is on climate change, treating other adverseimpacts (including aviation noise and local and regional pollution from shipping)more succinctly. Policies to reduce transport’s greenhouse gas emissions areassessed against the background of a broader discussion of how to deal with thefree-rider problem. CO2 abatement in road transport is discussed in some detail,while just a few issues related to maritime transport and aviation are mentioned.
225
9. POLICY INSTRUMENTS TO LIMIT NEGATIVE ENVIRONMENTAL IMPACTS: AN ECONOMIC PERSPECTIVE
9.1. IntroductionRoad, maritime and air transport contribute to global emissions of greenhouse gases,
and all these modes of transport are generally expected to grow quickly. The transport
sector is at the same time widely expected to contribute to the abatement of greenhouse
gas emissions. Climate change is a global public bad; abatement of greenhouse gases is a
global public good. The absence of a central authority that can decide on, impose and
enforce climate change policies clearly shows in actual policy. The Kyoto Protocol is an
attempt to advance policy in the face of national sovereignty constraints. The approach has
met with criticism because of its limited coverage of global emissions, its focus on
cap-and-trade systems rather than carbon taxes, its lack of true enforcement mechanisms,
and its focus on CO2 abatement rather than stimulating the development and adoption of
non-carbon-intensive technologies. Alternative approaches seek broader country
participation, and sometimes propose enforcement through the World Trade Organization.
Stimulating the use of alternative technologies requires complementary measures to
overcome failures in markets for technological development and diffusion.
Road transport is a major source of greenhouse gas emission, and road transport
volumes are likely to continue growing. The desirability and the design of abatement
policies in road transport pose some difficulties. In the EU and the US, policies are in place
that limit energy consumption in transport, even if these policies were introduced for
reasons other than climate change. How much further abatement should be demanded
from road transport? And which policy instruments ought to be used? These questions are
discussed, focussing in particular on possible justifications for fuel economy standards. In
particular, the reasons for the limited power of the market for fuel economy to diffuse more
energy-efficient technologies are investigated.
Maritime and air transport represent smaller shares of total emissions, but growth has
been, and may continue to be, rapid. Both sectors have been less targeted by policies to
reduce energy consumption and greenhouse gas emissions than road transport. This
suggests that relatively cheap abatement options may be available in those modes,
compared to road transport, but fleet turnover in shipping and aviation is slow, and this
limits the diffusion of available technological improvements. Maritime transport and
aviation could be integrated into carbon trading schemes. Some of the research on the
effects of including aviation in trading schemes is discussed. In general, it is found that
incentive-based policies are flexible in allowing low-cost abatement options to be taken up.
This is important, as technology continues to evolve. Moreover, incentive-based policies
stimulate efforts to look for such low-cost options. Standards, however, can be useful
complements to incentive-based policies in a number of circumstances.
9.2. The problem of climate change and current responsesClimate change is potentially very costly. The consequences of climate change are
uncertain (e.g. Stern, 2006) and geographically diverse (e.g. Aldy, 2006). It is very likely that some
GLOBALISATION, TRANSPORT AND THE ENVIRONMENT © OECD 2010226
9. POLICY INSTRUMENTS TO LIMIT NEGATIVE ENVIRONMENTAL IMPACTS: AN ECONOMIC PERSPECTIVE
regions will incur damages, while other regions may experience some benefits. Catastrophic
damages are possible as well; and according to some (e.g. Weitzman, 2009), their importance
has been understated in much of the economic analysis of climate change up to now.
Climate change is driven by the stock of greenhouse gases, and to a lesser extent by the
speed at which the stock grows. Greenhouse gas emissions largely determine the change
of the stock, as dissipation is slow. Since the location of most greenhouse gas emissions is
irrelevant, climate change is a global public bad and emission abatement a global public
good. As there is no global authority to implement and enforce policy measures, any
attempt to design an efficient abatement policy must confront the free-rider problem.
Free-riding means that individual nations, or groups of nations, benefit from other nations’
abatement efforts, and this reduces all nations’ incentives to abate.
The challenge of climate change has triggered a wide range of responses. Some countries,
e.g. in Scandinavia and France, have introduced so-called carbon taxes, and several other
countries consider doing so.2 In many countries, states, cities, companies, and universities
have taken a variety of initiatives to reduce emissions. The main multilateral response to
climate change is the Kyoto Protocol. This Protocol came into effect in 2005, and requires
adhering countries to reduce emissions to a level defined in terms of the reference year (5.2%
reduction compared to 1990 for industrialised countries as a whole; 8% for the European
Union). In the context of the Protocol, the European Union has introduced the EU Emission
Trading Scheme (EU-ETS) as a mechanism to reduce the costs of attaining targets by allowing
trade in emission permits. The ETS covers about half of total EU emissions, or roughly 8% of
global emissions in 2007. The United States opted out of the Kyoto Protocol, and developing
countries are not part of it. The non-participation of the US and the fast growth in some of the
non-covered countries have substantially reduced the coverage of the Kyoto Protocol: in its
original form, about 65% of global emissions in 1990 were covered, whereas actual coverage is
now about 32%. If the EU attains its Kyoto target, global emissions in 2010 are expected to be
26% higher than in 1990, compared to a business-as-usual growth of 27.5%.
The Kyoto Framework provides only a limited contribution to the reduction of greenhouse
gas emissions, compared to the business-as-usual scenario. The overall approach behind the
Framework has also been criticised on various grounds. These criticisms imply that the Kyoto
approach is not the ideal blueprint for future, more comprehensive climate change
management institutions. Three points of critique are briefly mentioned here.
First, the Kyoto approach has been described as “narrow and deep”. The share of global
emissions covered is fairly small, and the covered sources will have to make quite deep and
costly cuts to meet targets, while no effort is required from non-covered sources. Several
observers, including e.g. Ellerman (2008), favour “broad and shallow” approaches. Broad
coverage means that, at the very least, the US needs to be part of an agreement, because of
its large share of global emissions and because of the weak incentives for developing
nations to join if the US does not participate (e.g. Aldy et al., 2008).3 In order to increase the
chances of co-operation, an enforcement and sanctioning mechanism is required. Stiglitz
(2006) argued that a country’s failure to charge somehow for greenhouse gases in fact
constitutes a subsidy to carbon-intensive production, and as such could be sanctioned
under the provisions of the World Trade Organization (WTO), although it is not obvious that
the WTO is ready to take on this task. The developing countries need to be included in an
agreement as well, although the efforts required from them may initially be modest. The
idea is that a broad but shallow system can gradually evolve into a deeper system.
GLOBALISATION, TRANSPORT AND THE ENVIRONMENT © OECD 2010 227
9. POLICY INSTRUMENTS TO LIMIT NEGATIVE ENVIRONMENTAL IMPACTS: AN ECONOMIC PERSPECTIVE
Second, the cap-and-trade approach as adopted in the EU and which will possibly be
adopted in the US, could be inferior to a system of carbon taxation. Nordhaus (2007) argued
a global harmonised carbon tax outperforms a cap-and-trade system, as a tax would avoid
the difficult problem of deciding on baseline levels of emissions and would create no rents,
and consequently no costly rent-seeking (see also Stiglitz, 2006). A tax would also be better
suited to deal with uncertainty over abatement costs, given that marginal benefits of
abatement are highly elastic (as abatement is defined over emissions while impacts
depend on the stock of greenhouse gases). Furthermore, taxes generate valuable public
revenue, which grandfathered permits do not. Aldy et al. (2008) pointed out that cap-and-
trade systems can be modified to improve their performance relative to taxes (by
auctioning permits, by introducing safety-valves and allowing inter-temporal reallocation
of permits, etc.), so that the practical difference between “good” cap-and-trade systems
and taxation approaches is ultimately small.4
The level of the tax or the price of a permit can be determined by referring to marginal
damage estimates or by referring to a target for atmospheric concentrations of CO2.
According to Aldy et al., 2008, with marginal damages of USD 10 per tonne of CO2
(USD 36.7 per tonne of carbon), the price of gasoline in the US would increase by
USD 0.09 per gallon (USD 0.023 per litre). The marginal damage cost estimate in the Stern
report is about USD 85 per tonne of CO2, so the price changes need to be factored up by 8.5
if these higher estimates are taken into account. An atmospheric concentration target of
450 parts per million is thought to correspond to a global temperature increase of about
2 oC, and requires carbon prices similar to those of the Stern report. A price of USD 10 per
tonne of CO2 could lead to concentrations of 550-650 parts per million (3-3.6 oC
temperature increase).5
If the price of carbon is to be determined in a top-down approach, a global administering
and sanctioning mechanism is called for. Aldy et al. (2008) suggested the WTO as the most
straightforward choice for housing such an organisation, although it is not obvious that the
WTO is ready to take up such a role. One of the main tasks of the administration would be to
monitor “fiscal cushioning”, i.e. countries’ efforts to reduce the effective carbon tax by
tweaking other attributes of national taxation schemes. The problem of calculating “effective
carbon taxes” would be highly relevant for the transport sector (see below). It is far from
obvious, however, that progress with multilateral co-ordination of greenhouse gas abatement
efforts will be made through a multilateral top-down approach. A different scenario is that the
US will introduce its own cap-and-trade system (see Meckling, 2008, for an assessment of the
changing position of corporate lobbies), while the EU continues with the ETS and develops it to
more stringent system where caps are stricter and permits are auctioned. Separate trading
schemes may later be connected to exploit further gains from trade.
International aviation and maritime transport are not covered by the Kyoto Protocol.
Instead, the Protocol recommends that ICAO and IMO develop policies for these sectors.
However, while the Kyoto approach is one of common but differentiated responsibilities
(implying relatively strong efforts from richer countries), ICAO and IMO have no such
tradition of differentiation. This slows down progress on policy development within these
organisations, leading other bodies (notably the EU) to implement (in the case of aviation)
or threaten to implement (in the case of shipping) measures for international aviation and
shipping. A gradual approach, with relatively limited efforts from non-Annex 1 countries
in early stages, may be the most productive way forward here as well. Kågeson (2009)
discussed what such a gradual approach could look like.
GLOBALISATION, TRANSPORT AND THE ENVIRONMENT © OECD 2010228
9. POLICY INSTRUMENTS TO LIMIT NEGATIVE ENVIRONMENTAL IMPACTS: AN ECONOMIC PERSPECTIVE
Ellerman (2008) emphasised the importance of “club benefits” for a cap-and-trade
system to be feasible: the European Commission managed to get new member states to
sign on to the ETS because the cost of doing so was diluted in the larger package of costs
and mainly benefits of joining the European Union. Conceivably, the US – with a stronger
federal structure than the EU – could make continued access to club benefits for US states
conditional on joining a US carbon trading scheme. On a global scale, the club benefits
relate mainly to those offered by the WTO (Stiglitz, 2006).
With a bottom-up approach, there are likely to be differences between the emerging
trading schemes. For example, the EU-ETS does not include transport and is not likely to
include road transport any time soon. A US system, however, may include transport from
the start (Ellerman et al., 2006). At any rate, the relation between prevailing transport
policies and carbon pricing schemes needs careful consideration; this is discussed further
in Section 9.4.
A third criticism of the Kyoto-type approach is that its focus on abatement of
greenhouse gases, in particular CO2, is too narrow. For example, Barrett (2007) argued for a
broader approach that includes adaptation, incentives for technological development, and
the development and sharing of knowledge. Aldy et al. (2008) and Newell (2008) concurred
that the social returns on technological innovation and diffusion are larger than the private
returns, so there is a case for policy intervention. One policy approach would be to increase
carbon prices over marginal damages, but this instrument may be poorly targeted. The
economic understanding of which policies work best is limited, especially where
transformative technological change is concerned. It is sometimes argued that financial
incentives are insufficiently powerful to ensure the adoption of alternative technologies, so
that standards may become desirable. This may be the case, for example, when end-users
valuation of improved energy efficiency is low (too low?), as is often argued to be the case
in private vehicle markets. This issue is discussed further in the next section.
Summing up, it seems likely that progress with broad climate change management
systems will take place through a bottom-up process, with the gradual emergence of
regional systems adapted to regional circumstances. Different conditions may lead to
different treatment of transport sectors in the regional systems. A potential problem with
this process is the limited incentives for nations with low willingness-to-pay for
abatement, to join. Technological change is key for handling climate change. This holds for
transport at least as much as for other sectors, and policy approaches that focus on
reducing transport’s carbon intensity deserve close attention. The challenge for the sector
is immense, as will be clear from the next section.
9.3. Transport and CO2 emissions: Where demand would like to goThe ITF produced a first transport outlook in 2008. It used the IEA/ETP’s MoMo model
to construct projections of CO2 emissions, focussing on road transport under alternative
assumptions on the evolution of demand. The ITF business-as-usual (BAU) scenario is the
same as the IEA/ETP 2008 reference scenario. Figure 9.1 displays a key model output:
tank-to-wheel CO2 emissions from vehicles, in million tons of CO2 equivalent, from 2000
through 2050.6 The emission paths for the transport modes contained in the MoMo model
are shown. Section 9.4 emphasises emissions from light duty vehicle emissions. This is
justified given the large share of these emissions in the total, but it is clear that emissions
from air transport are expected to grow more rapidly than those from light duty vehicles;
GLOBALISATION, TRANSPORT AND THE ENVIRONMENT © OECD 2010 229

9. POLICY INSTRUMENTS TO LIMIT NEGATIVE ENVIRONMENTAL IMPACTS: AN ECONOMIC PERSPECTIVE
aviation emissions policy is briefly discussed in Section 9.6. Emissions from other modes,
including shipping, are expected to grow as well. In addition, it is likely that the BAU
underestimates emissions from shipping (see Section 9.5). Table 9.1 provides details on the
model composition of global vehicle emissions.
Emissions from light duty vehicles grow strongly over the model horizon: emissions
in 2050 are nearly 91% higher than in 2000. Growth is moderate between 2010 and 2030, but
accelerates after 2030. The drivers of light duty vehicle emissions are the following: the size
of the car stock, the intensity with which vehicles are used and the carbon intensity of the
energy sources used. The growth of the total vehicule stock is the key driver of increased
emission levels, with global ownership levels expected to rise threefold, from 669.3 million
vehicles in 2000 to 2 029.9 million vehicles in 2050.7 This expansion in turn is the
consequence of increased ownership rates that occur mainly in emerging economies. The
technological composition of the stock changes, as the share of conventional gasoline
vehicles is assumed to decline from 87% to 68%, while that of diesel vehicles increases from
12% to 26% and that of hybrid gasoline vehicles rises from 0.1% to 4%. Hence, there is a shift
to less carbon-intensive technologies, but not a major switch to truly low-carbon
technologies.
Figure 9.1. World tank-to-wheel CO2 emissionsBusiness-as-usual scenario, 2000-50, million tons of CO2-equivalent
Source: ITF calculations using the IEA MoMo Model, Version 2008.
Table 9.1. Modal shares in world vehicle CO2 emissionsBAU, 2000-50, %
2000 2005 2010 2015 2020 2025 2030 2035 2040 2045 2050
Freight + passenger rail 2.1 2.2 2.3 2.5 2.7 2.8 2.9 2.9 2.9 2.9 3.0
Buses 6.8 6.3 5.7 5.4 5.2 4.9 4.6 4.3 4.1 3.8 3.6
Air 12.9 13.5 14.8 16.8 18.1 19.5 21.1 21.5 21.8 22.3 23.0
Freight trucks 22.4 22.2 22.8 23.4 23.9 24.0 23.7 24.1 24.1 23.8 23.4
Light duty vehicles 43.8 43.3 41.9 39.5 37.6 36.4 35.6 35.6 35.9 36.4 36.5
2-3 wheelers 1.6 1.8 2.0 2.2 2.5 2.6 2.6 2.6 2.6 2.5 2.4
Water-borne 10.4 10.8 10.3 10.2 10.0 9.8 9.5 9.0 8.6 8.3 8.0
Total 100.0 100.0 100.0 100.0 100.0 100.0 100.0 100.0 100.0 100.0 100.0
Source: ITF calculations, using the IEA MoMo Model, Version 2008.
Total LDV AirFreight trucks Water-borne Other
14 000
12 000
10 000
8 000
6 000
4 000
2 000
02000 2005 2010 2015 2020 2025 2030 2035 2040 2045 2050 2055
GLOBALISATION, TRANSPORT AND THE ENVIRONMENT © OECD 2010230
9. POLICY INSTRUMENTS TO LIMIT NEGATIVE ENVIRONMENTAL IMPACTS: AN ECONOMIC PERSPECTIVE
The emission profiles in Figure 9.1 directly depend on assumptions concerning the size
of the vehicle stock, vehicle use and vehicle technology. It is useful to note that the BAU
scenario presented here is an outline of “where demand would like to go”. By this it is meant
that the supply of energy is assumed to be fairly elastic, so that strong growth in demand
does not lead to strong increases in the price of transport energy. This is not a
straightforward assumption, given for example the growing concern about supply side
constraints and consequent high prices in oil markets, which recently were shown to affect
demand. In addition, the development of GDP drives demand, and the current crisis may
lead one to think the BAU assumptions are optimistic (see endnote 6).
9.4. Road transport8
Abatement costs
In deciding how to achieve an abatement target for greenhouse gas emissions, it
makes sense to start with the cheapest abatement opportunities and select increasingly
expensive options until the target is reached. Applied general equilibrium models of
various degree of detail that have been used to obtain economy-wide views of greenhouse
gas abatement opportunities, their costs and their effects on emissions (e.g. Proost,
2008 and Abrell, 2007) have often found that the “optimal” effort in the transport sector is
small compared to its share in total emissions.
The rationale for the limited effort in transport is that abating in transport is
expensive, with high costs for technology as well as for behavioural change. There are
several reasons why abatement technology is relatively expensive in transport. First, there
are few cheap low-carbon substitutes for conventional engine technology. Second,
transport fuels have been relatively expensive (compared to other sectors) in many parts of
the world, mainly because of relatively high taxes. These high prices have induced the
market to take up cheap abatement options already, making further reductions expensive.
Third, transport fuels are less carbon-intensive than some other fuels, so that carbon taxes
would have smaller effects on energy prices in transport than in other sectors. For
example, introducing a tax of USD 50 per tonne of carbon in the US would increase the
price of coal by about 140%, while the price of gasoline would rise by 6% (Parry, 2007),
implying more limited incentives for abatement in transport.
While the arguments explaining relatively high abatement costs in transport are sound,
they are challenged on various grounds. One objection is that the assumptions on costs of
alternative technology embedded in the general equilibrium models can be too high, as no
account is taken of declining costs when production levels rise. Experience suggests that
costs indeed do generally decline. Whether this will also hold for technologies such as
batteries, etc., is plausible but uncertain. Another objection is that the arguments explaining
higher costs in transport are partly empirical, but also are partly based on economic
inference: further abatement in transport “must” be relatively costly because energy was
relatively expensive in the past and alternatives have not yet been adopted. This inference
relies on the assumption that transport markets work very well, in the sense that all surplus-
improving technological potential is realised. Abandoning this assumption modifies results,
as is discussed next for the market for vehicle fuel economy.
GLOBALISATION, TRANSPORT AND THE ENVIRONMENT © OECD 2010 231
9. POLICY INSTRUMENTS TO LIMIT NEGATIVE ENVIRONMENTAL IMPACTS: AN ECONOMIC PERSPECTIVE
A case for fuel economy standards?
It is sometimes argued that improving vehicle fuel economy for passenger vehicles is
a no-regret abatement option, because the discounted savings on fuel expenditures
outweigh the costs when using standard private discount rates. However, there is evidence
that consumers use very high discount rates when deciding on fuel economy, resulting in
limited investment in it. For example, Turrentine and Kurani (2007) found that consumers
implicitly require payback periods of three years or so for investments in better fuel
economy, indicating that implicit discount rates are high. Work done for the impact
assessment of the EC’s proposed fuel economy regulation (EU, 2007) found that the
discount rate that equalises increased vehicle costs and reduced fuel expenditures is
around 20%, much higher than standard values for private discount rates.9 While not
definitive evidence, this might be interpreted as an indication that there are market
imperfections beyond consumer short-sightedness that justify a policy intervention.10
Why would high discount rates be used when deciding on fuel economy? One
argument is that consumers pay little attention to fuel economy, because they care more
about other attributes, and the share of fuel costs (and therefore a fortiori the size of savings
from better fuel economy) in total purchase and usage costs is small. Given that processing
information on how fuel economy translates into probable savings on fuel expenditures
takes costly effort, consumers may decide a detailed calculation is not worthwhile. From a
policy perspective, this problem may be overcome by providing better information on
potential savings from purchasing better fuel economy. From an analytical perspective, the
argument says that consumers make inaccurate decisions on fuel economy, but not that
they systematically invest too little.
Recently, Greene et al. (2008) suggested a framework that implies a systematic
undervaluation of fuel economy compared to the textbook model of an expected utility
maximising consumer. They showed that when consumers are loss-averse11 and uncertain
about factors that determine optimal fuel economy, they will invest less in fuel economy
than consumers who maximise expected utility.12 The uncertain factors that affect fuel
economy choices are the gap between real and labelled fuel economy, the lifetime of the
car, the amount of driving and fuel prices, among others. Among those factors, uncertainty
on realised fuel economy is the main driver of low investment, according to a calibrated
numerical exercise. The numerical example also suggested the impact of loss-aversion is
large, as the expected saving from a fuel-economy improvement of USD 405 for an
expected utility maximiser is equivalent to a loss of USD 32 in the case of loss aversion.
According to Greene et al. (2008), low willingness-to-pay for fuel economy by
consumers translates into strategies on manufacturers’ part that steer vehicle design
towards more marketable attributes, like power and comfort. With such a supply response,
available fuel economy turns out lower than in a world where consumers are averse to loss.
A manufacturer will be disinclined to use technology to provide better fuel economy if
there is large uncertainty about whether consumers will want to buy it and about how
competitors will respond to the same problem. A fuel economy standard can correct this
problem, as it clarifies what performance level needs to be reached by a manufacturer and
by its competitors.
The loss-aversion argument can seem compelling. It provides a theoretical argument
for consumers’ low willingness-to-pay for fuel economy improvements, argues
convincingly that this demand curve is what producers take into account when deciding
GLOBALISATION, TRANSPORT AND THE ENVIRONMENT © OECD 2010232
9. POLICY INSTRUMENTS TO LIMIT NEGATIVE ENVIRONMENTAL IMPACTS: AN ECONOMIC PERSPECTIVE
what fuel economy levels to provide, and that a standard is a good way of making sure
manufacturers deviate from this demand curve and provide better fuel economy. The case
for a standard would be particularly strong when fuel taxes are low and incomes high, as
both factors exacerbate the gap between consumers’ aspirations (which drive supply
decisions) and policy targets for fuel economy. This gap is wide in the US, but it also
prevails in Europe. For example, it is reasonable to think that the failure of the voluntary
agreement in the EU to reduce CO2 emissions from passenger cars was partly caused by the
lack of policy initiative to support the agreement during a period of strong economic
growth and declining real fuel prices, at least in the early years.
However, it is not clear that loss-aversion provides a basis for policy intervention,
unless one explicitly takes the hypothetical market outcome that would be obtained in the
absence of loss-aversion as the norm, instead of letting consumers optimise according to
their loss-averse preferences. Doing so might open up discussions on a wide array of
interventions, as loss-aversion is not unique to this particular market.
While it is not clear that loss-aversion justifies a correction of a failure in the market for
fuel economy, a different approach is to focus on cost effectiveness and ask whether loss-
aversion and uncertainty could affect the choice between quantity-based regulation and
prices to attain an abatement target, however defined. Loss-aversion and uncertainty on the
part of consumers lead to uncertainty for producers on how much to invest in fuel economy,
and this results in fuel economy levels that reflect high implicit discount rates. Higher fuel
prices increase what consumers want to pay for fuel economy but do not affect their
treatment of uncertainty, so do not alleviate producer uncertainty either. Consequently,
governments cannot be sure how effective a tax-based approach will be in triggering
investments. If governments cares about such investments, for example because they
believe this makes policy less prone to reversibility by future policy makers (Glazer and Lave,
1996; Barrett, 2005) or because they wish to stimulate the diffusion of new technologies (Aldy
et al., 2008), then they may favour a quantity-based approach over a price-based one,
precisely because the quantity-based approach reduces flexibility. In this approach, where
the government has a preference for how fuel consumption in transport is reduced, the
choice for a standard for fuel economy may be justified.13
Given these arguments for fuel economy standards, it appears that existing and
proposed standards require bigger improvements in fuel economy than can be justified by
market imperfections. Indeed, the stringency of standards seems consistent with a policy
approach that starts from the assumption that technology to improve fuel economy is very
cheap, or that implicitly attaches a very high value to reducing greenhouse gas emissions
and improving energy security, but which lacks a clear view on what costs are imposed on
consumers. Possible motivations for ambitious abatement targets were mentioned above,
and Barrett (2005) noted that policies to stimulate technology take-up may be required.
Nevertheless, with the current evidence, the basic message from the analyses of the general
equilibrium type remains valid: abatement costs in transport appear to be relatively high.
Despite their weak connection to market failures, prevailing and proposed fuel
economy regulations would not attain a stabilisation of global CO2 emission from road
transport. According to JTRC (2008b), stabilisation through 2050 at 2010 levels requires
attainment of a fleet-average fuel economy of 3.5 litres per 100 km (approximately 67 miles
per gallon) in 2050. Figure 9.2 shows different fuel economy standards converted to the
New European Driving Cycle (NEDC) test cycle, and expressed as gram CO2 per km.14
GLOBALISATION, TRANSPORT AND THE ENVIRONMENT © OECD 2010 233

9. POLICY INSTRUMENTS TO LIMIT NEGATIVE ENVIRONMENTAL IMPACTS: AN ECONOMIC PERSPECTIVE
Climate change and other costs of transport
This section briefly discusses the relative importance of the main external costs of
transport by comparing estimates of their current order of magnitude, looking at averages
over a large class of users. When considering energy and transport policies, this
comparison provides some indication on how policy priorities could be defined. Table 9.2,
taken from Small and Van Dender (2007), presents estimates of the main marginal external
costs of road passenger transport, and classifies them according to whether they depend
mainly on fuel consumption (climate change and oil dependency) or on vehicle-miles
travelled. For comparison, the fuel-related external costs are converted to a marginal
cost per vehicle-mile, using the fleet average fuel efficiency for passenger vehicles
(i.e. 22.9 miles per gallon for the US in 2005).
The three studies listed in Table 9.2 (excluding the last column) are unanimous in
finding that congestion involves larger external costs than fuel-related externalities, and
except for the “low” Harrington-McConnell values, the same is true of air pollution and
accidents. In nearly all cases, congestion alone is found to outweigh the fuel-related
externalities by a large margin. If the higher fuel-related figures in the last column of the
table are used, the picture changes somewhat, although even then fuel-related externalities
do not dominate other externalities. However, the validity of the averages in the table as
guides for policy can be questioned. In the case of climate change, the main problem is the
Figure 9.2. Comparison of fuel economy and GHG standardsHarmonised to the New European Driving Cycle, gram CO2 per km
Sources: Data from International Council on Clean Transportation, Feng An – Innovation Center for Energy andTransportation and International Transport Forum.
300
250
200
150
100
50
02002 2004 2006 2008 2010 2012 2014 2016 2018 2020
Gram CO2 per km
California
China
United States
Europe (new)
Korea
Canada
China (phase III)
United States (new)
Europe
Korea (new)
United States (old)
Australia Japan
GLOBALISATION, TRANSPORT AND THE ENVIRONMENT © OECD 2010234
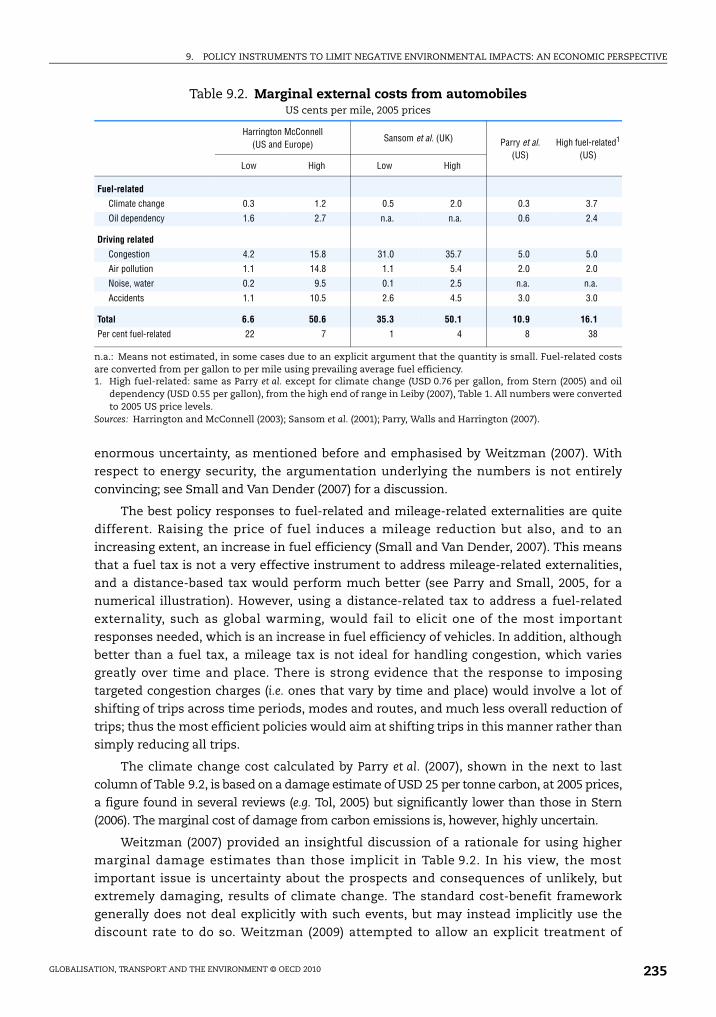
9. POLICY INSTRUMENTS TO LIMIT NEGATIVE ENVIRONMENTAL IMPACTS: AN ECONOMIC PERSPECTIVE
enormous uncertainty, as mentioned before and emphasised by Weitzman (2007). With
respect to energy security, the argumentation underlying the numbers is not entirely
convincing; see Small and Van Dender (2007) for a discussion.
The best policy responses to fuel-related and mileage-related externalities are quite
different. Raising the price of fuel induces a mileage reduction but also, and to an
increasing extent, an increase in fuel efficiency (Small and Van Dender, 2007). This means
that a fuel tax is not a very effective instrument to address mileage-related externalities,
and a distance-based tax would perform much better (see Parry and Small, 2005, for a
numerical illustration). However, using a distance-related tax to address a fuel-related
externality, such as global warming, would fail to elicit one of the most important
responses needed, which is an increase in fuel efficiency of vehicles. In addition, although
better than a fuel tax, a mileage tax is not ideal for handling congestion, which varies
greatly over time and place. There is strong evidence that the response to imposing
targeted congestion charges (i.e. ones that vary by time and place) would involve a lot of
shifting of trips across time periods, modes and routes, and much less overall reduction of
trips; thus the most efficient policies would aim at shifting trips in this manner rather than
simply reducing all trips.
The climate change cost calculated by Parry et al. (2007), shown in the next to last
column of Table 9.2, is based on a damage estimate of USD 25 per tonne carbon, at 2005 prices,
a figure found in several reviews (e.g. Tol, 2005) but significantly lower than those in Stern
(2006). The marginal cost of damage from carbon emissions is, however, highly uncertain.
Weitzman (2007) provided an insightful discussion of a rationale for using higher
marginal damage estimates than those implicit in Table 9.2. In his view, the most
important issue is uncertainty about the prospects and consequences of unlikely, but
extremely damaging, results of climate change. The standard cost-benefit framework
generally does not deal explicitly with such events, but may instead implicitly use the
discount rate to do so. Weitzman (2009) attempted to allow an explicit treatment of
Table 9.2. Marginal external costs from automobilesUS cents per mile, 2005 prices
Harrington McConnell(US and Europe)
Sansom et al. (UK) Parry et al.(US)
High fuel-related1 (US)
Low High Low High
Fuel-related
Climate change 0.3 1.2 0.5 2.0 0.3 3.7
Oil dependency 1.6 2.7 n.a. n.a. 0.6 2.4
Driving related
Congestion 4.2 15.8 31.0 35.7 5.0 5.0
Air pollution 1.1 14.8 1.1 5.4 2.0 2.0
Noise, water 0.2 9.5 0.1 2.5 n.a. n.a.
Accidents 1.1 10.5 2.6 4.5 3.0 3.0
Total 6.6 50.6 35.3 50.1 10.9 16.1
Per cent fuel-related 22 7 1 4 8 38
n.a.: Means not estimated, in some cases due to an explicit argument that the quantity is small. Fuel-related costsare converted from per gallon to per mile using prevailing average fuel efficiency.1. High fuel-related: same as Parry et al. except for climate change (USD 0.76 per gallon, from Stern (2005) and oil
dependency (USD 0.55 per gallon), from the high end of range in Leiby (2007), Table 1. All numbers were convertedto 2005 US price levels.
Sources: Harrington and McConnell (2003); Sansom et al. (2001); Parry, Walls and Harrington (2007).
GLOBALISATION, TRANSPORT AND THE ENVIRONMENT © OECD 2010 235

9. POLICY INSTRUMENTS TO LIMIT NEGATIVE ENVIRONMENTAL IMPACTS: AN ECONOMIC PERSPECTIVE
extreme events (extreme in their probability and in their consequences). His proposed
framework to deal with structural uncertainty found much stronger support for policies to
mitigate quickly than in the traditional model.
For the transport sector, this means that policy design is more conveniently thought of
in terms of cost effectiveness than in terms of market imperfections within the transport
sector. With ambitious abatement targets, decarbonisation through alternative
technologies should be part of a long-run strategy. Research and development will only be
realised if there is a strong policy commitment to climate change targets. Public funding for
research is justified to the extent that the expected social returns exceed the expected
private returns, and to the extent that policy commitment remains uncertain (Newell, 2008).
Damage estimates of the orders of magnitude shown in Table 9.2 provide guidance to
a transport policy that deals with driving-related externalities. For an energy policy to deal
with climate change, the large uncertainty on impacts justifies measures to reduce carbon
emissions, arguably also in transport. A fuel economy standard can be seen as one element
of such a strategy, as it helps control the expected growth of emissions. More ambitious
abatement targets require large-scale deployment of alternative technology. Measures to
stimulate the development and use of alternative technology may be justified, but it could
be difficult to see a strong case for major policy-directed changes in transport activity on
climate change grounds. An “ideal” approach to controlling energy use is not likely to
reduce motor vehicle travel very much, but will instead accomplish most of its results
through technological changes specifically targeted to energy savings, mostly through the
use of more fuel-efficient vehicles and alternative fuels. By choosing technological
solutions when permitted, consumers will avoid major behavioural changes, such as
changes in travel mode, trip patterns, and home and work location, which evidently are
more costly for them. Measures to address congestion may induce changes in patterns of
travel demand that imply reductions of greenhouse gas emissions, but probably not
enough to meet ambitious abatement targets.
Road transport and cap-and-trade systems
Road transport in many countries is subject to policies that reduce fuel consumption
and greenhouse gas emissions below no-intervention levels. The EU, for example, has high
fuel taxes and has recently introduced a fuel-economy standard. The US has lower fuel
taxes but the CAFE standard has been binding for decades.15 How should such pre-existing
policies be accounted for in the design of a broader cap-and-trade system?
As a starting point, one can calculate the price of carbon that is implied by current
policies in road transport. For example, Ellerman et al. (2006) found that the CAFE standard in
the US corresponds to a price of USD 90 to USD 110 per tonne of carbon. Fuel taxes in the EU
imply considerably higher carbon prices. These carbon prices are higher than what is
expected in cap-and-trade regimes, and consequently there are efficiency gains from
including road transport in a cap-and-trade scheme (which aims to minimise abatement
costs by equalising marginal costs across sectors). The EU has chosen not to include road
transport in the EU-ETS, however. Ellerman et al. (2006) proposed inclusion of road transport
in any future carbon trading scheme, because of the potential efficiency gains of doing so.
A potential problem with this calculation is that prevailing policies do not address
climate change externalities alone. The CAFE programme was introduced to deal with
energy security, and climate change justifications emerged only later. The level of fuel
GLOBALISATION, TRANSPORT AND THE ENVIRONMENT © OECD 2010236

9. POLICY INSTRUMENTS TO LIMIT NEGATIVE ENVIRONMENTAL IMPACTS: AN ECONOMIC PERSPECTIVE
taxes in the EU is determined by many factors, first and foremost as a relatively efficient
way of raising revenues for general public expenditure. Fuel taxes in the US (and e.g. Japan)
are lower, and the revenues are largely earmarked for road infrastructure expenditures.
Nevertheless, a comparison of energy security costs and climate change costs might
suggest that current US fuel taxes are sufficiently high to cover these externalities, if
moderate values are used for carbon damage. In order to decide how a tax or a standard
ought to be changed if it is to address climate change (where it did not before), it needs to
be made clear which external costs a fuel tax (or a standard) is supposed to address, and to
what extent it is a revenue-raising instrument. Parry and Small (2005) assumed that fuel
taxes are a second-best instrument to address local and global pollution as well as average
marginal external costs of congestion, and found that current US taxes should be roughly
doubled while UK taxes should be halved, if they were to be set at the second-best level.
The congestion costs were the main component of the tax. If congestion were to be
addressed by a separate instrument (where and when necessary), second-best fuel taxes
both in the US and the UK would be lower than they currently are. Sansom et al. (2001)
found that UK charges per vehicle-kilometre are below marginal social costs. While this
result differs from the Parry and Small (2005) study, both studies found that the congestion
component dominates the marginal cost. Excluding congestion would bring UK charges
roughly in line with marginal costs (Sansom et al., 2001, Table B). Climate change is much
less important, given the assumptions on marginal damages used in this study.
9.5. Maritime transport
CO2 emissions
According to Buhaug et al.’s (2008) central estimates in a study prepared for the IMO,
overall tonne-miles will grow by 30% to 46% by 2020, and by 150% to 300% by 2050.
Container activity is projected to grow by much more: 65% to 95% by 2020, and 425% to
800% by 2050. This growth, if realised, will have important implications for fuel use and
CO2 emissions, since container vessels have more powerful engines and operate at higher
speeds than most other vessels.
The IMO projections assume increases in fuel efficiency stemming from changes in
average ship size (where this makes commercial sense, larger ships being more fuel-efficient
at constant load factors than smaller vessels), changes in speed (estimated vessel fuel
consumption has been modelled based on a third power relationship between speed and
engine power output) and technical improvements to new vessels. The IMO baseline
projections assume no changes in the regulation of CO2 emissions or fuel consumption and
so changes in efficiency (due to vessel design or operation) are assumed to track those
improvements that are cost effective under prevailing oil prices and commercial imperatives.
The IMO study also assesses the potential emission reductions from technological
improvements. The bottom line is that, despite significant energy efficiency improvements
(albeit slowly diffused through the fleet), CO2 emissions from international shipping would
grow by 10% to 26% by 2020, and 126% to 218% by 2050 under baseline assumptions. Realising
maximum potential efficiency improvements, coupled with significant speed reductions and
more intensive use of low-carbon fuels, can lead to stabilised or slightly decreasing CO2
emissions from international shipping (low estimates), but these developments are unlikely
to occur without significant policy changes and interventions.
GLOBALISATION, TRANSPORT AND THE ENVIRONMENT © OECD 2010 237

9. POLICY INSTRUMENTS TO LIMIT NEGATIVE ENVIRONMENTAL IMPACTS: AN ECONOMIC PERSPECTIVE
The economic analysis of abatement strategies in shipping is hampered by the paucity
of information on abatement costs, but some observations can be made:
● First, if abatement costs for CO2 follow patterns similar to those for NOx and SOx, then
abatement costs in shipping are lower than in other transport modes.
● Second, changes in operational strategies – mainly reducing speed – provide the easiest
short-run options for abatement. Reducing speed is costly, as it slows down the supply
chain, but such costs may be limited, as reliability may be just as important as speed.
Furthermore, the opportunity costs of holding inventories, which are inversely related to
speed, decline as overall economic conditions are less favourable (slow steaming is one
response to overcapacity). In the longer run, dispersion of technological innovation
through fleet turnover can reduce emissions. However, turnover in the sector is slow and
there is a large potential for leakage (moving less efficient vessels to regions where
regulation is weaker or absent) as long as regulation is geographically restricted. Similar
problems characterise abatement options in aviation.
● Third, while one might expect fuel economy choices in shipping to be optimal from at
least a profit-maximising point of view, the fact that the incidence of the fuel cost
depends strongly on the particulars of shipping contracts16 creates principal-agent
problems that distort fuel economy choices. This problem is less prevalent in container
shipping markets, however.
The outlook for multilateral action on handling shipping emissions is not simple
(Kågeson, 2009). The IMO faces difficulties in moving forward, as countries not bound by
Annex 1 of the Kyoto Protocol favour action from those countries that are, while the latter
favour broader multilateral initiatives. If progress from the IMO side is unsatisfactory, the
European Union may choose to move unilaterally, possibly with a regional trading scheme
or inclusion of shipping into the EU-ETS, in addition to emission-dependent harbour dues
and binding CO2-index limits. However, such trading schemes are prone to evasion by
rerouting cargo through trans-shipment hubs.
Other emissions
Apart from generating greenhouse gases, emissions from maritime transport contribute
to local air pollution in port communities as well as to regional air pollution. Marine bunker
fuel is a residual fuel, rich in contaminants, and no post-combustion treatment is required.
One consequence is that the sulphur emissions per tonne-mile are higher for ships than for
other modes (Wang and Corbett, 2007). Requiring the use of higher quality fuels will reduce
emissions per unit of fuel burned, and the International Maritime Organization has placed
some – not yet very stringent – limitations the sulphur content of fuels. It sets global caps for
SOx that become more stringent over time, and defines sulphur emission control areas
(SECAs) where stricter standards apply (including the Baltic Sea and the North Sea, and likely
other areas in high-income regions in the future17). Since 2005, the global limit is 4.5%
sulphur content, whereas in SECAs, the maximum is 1.5%. The world average sulphur
content of fuel was 2.7% in 2004. Wang and Corbett (2007) suggested that the benefits of
turning the US West Coast into a SECA exceeded the costs by a factor of about 2, and that
reducing sulphur content further to 0.5% increases the factor to about 3 (the exact result
depending on the size of the SECA).
NOx is regulated in IMO through the NOx Technical Code with certification requirements
for existing engines and standard test cycles to be applied to engines installed after 2011.
GLOBALISATION, TRANSPORT AND THE ENVIRONMENT © OECD 2010238
9. POLICY INSTRUMENTS TO LIMIT NEGATIVE ENVIRONMENTAL IMPACTS: AN ECONOMIC PERSPECTIVE
Particulate matter, particularly black carbon, is recognised to be an important pollutant and
GHG compound, but it is not regulated separately at this point – though fuel-switching and
improved engine performance of low-NOx engines should reduce particulate emissions.
The contribution of shipping to local air pollution is large in some areas. International
trade routes are generally not far from land and pollutants travel over large distances. The
costs of reducing emissions from shipping may be relatively low, given a longer history of
regulation for other sources. For example, for the proposed US-Canada SECA, compliance
costs are expected to be no larger than those of further abatement from land sources.
Abatement costs in shipping are estimated at USD 2 600 per tonne of NOx, USD 1 200 per
tonne of SOx, and USD 11 000 per tonne of PM. For comparison, the abatement costs for
highway diesel trucks are USD 2 700 per tonne of NOx and USD 17 000 per tonne of PM. The
cost estimates include the increased refinery costs, as well as the costs of engine control,
catalysts, reductants for NOx and additional fuel costs. Compliance costs are not expected to
affect demand in an appreciable manner, as there are few substitutes for maritime transport
and the costs will increase the price of a new vessel by no more than 2% and operating costs
no more than 3%. The price of shipping a container could rise by about 3% (USD 18).18
A sustainable intermodal freight system
It seems likely that maritime transport will increasingly improve its environmental
performance as it responds to two motivating forces. First, regulatory and advocacy
attention will impose pressure external to the maritime transport market, through both
international and territorial policy action. Second, the continued development of
environmental performance metrics in global, multi-firm supply-chain networks will
create market-based incentives for less-polluting maritime transport.
Angel et al. (2007) identified three dimensions of globalisation and the structure of the
global economy: foreign direct investment; international trade; and global networks of firms
as vehicles for production, trade and investment. The first is a hallmark of maritime
transport, as discussed in Chapter 3 with regard to fleet registry, ownership and crewing
trends. The second is the defining business of global shipping. And global shipping firms are
at least described within the third dimension; in fact, one can observe that containerisation
especially is promoting the vertical integration of firms in international logistics.
There is also a shift from national-level regulation and negotiated trans-boundary
territorial agreements (which are de facto global standards applicable to a region), to global
frameworks of environmental standards that address region-specific requirements and
network requirements for international supply chain processes. The clearest recent example
is the proposed revisions to the International Maritime Organization MARPOL Annex VI.
Moreover, global environmental concerns (e.g. biodiversity and climate change) are driving
growing interest and importance of industrial practices, whether directly controlled or
outsourced among international firms. The assumption that industry sectors will meet
expectations driven by market attention has diffused new standards and practices along the
international supply chain (Corbett and Kirsch, 2001; Corbett, 2005) as part of global integration
of environmental dimensions of product and service quality (Pil and Rothenberg, 2003).
Maritime transport is being required, like other global industries, to better protect the
resources and services the environment provides for future generations, and to mitigate the
impacts on ecosystems, global climate and ocean processes, as well as human health. These
demands oblige the maritime sector to consider the policy instruments for setting standards,
GLOBALISATION, TRANSPORT AND THE ENVIRONMENT © OECD 2010 239
9. POLICY INSTRUMENTS TO LIMIT NEGATIVE ENVIRONMENTAL IMPACTS: AN ECONOMIC PERSPECTIVE
including international treaty, national regulation, industry-based standards, requirements
negotiated through third-party agreements (non-governmental organisations) and industry
associations (Angel et al., 2007). Firm-based and third-party standards exist for other
industry sectors, with examples including the US Energy Star ratings, the ISO 9000 and ISO
14000 standards, etc. For shipping, the classification societies have provided third-party
standards for environmental management that some maritime firms are adopting
(American Bureau of Shipping, 2005).
A sustainable intermodal freight system is one that enhances goods movement
around the globe in a way that is environmentally responsible, equitable and efficient.
Such a system involves all current primary modes of freight transport – road, rail, water, air
and pipeline – working in harmony. But a sustainable intermodal freight system also has
trade-offs. The demands placed on the freight system are currently driven by consumer
value for commodities and finished products. The level of this value will often dictate the
method and mode of transport. In practice, meeting consumer demands will be
demonstrated through cost, time-of-delivery and reliability. Shippers make their decisions
on transport-mode based on a complicated calculus of how badly a consumer needs a good
(and thus, how much they are willing to pay to have it shipped). Some consumers and
businesses are willing to pay more to receive an item almost immediately and with high
reliability – often equating to air or truck service; while others are comfortable waiting for
a good and paying less – implying a rail or water mode of transport.
Regulation raises some fears in the maritime industry with regard to the changing
nature of shipping competiveness, as illustrated by debates about phase-in periods for
double hulls, cleaner fuels and less-toxic hull coatings. However, as firms shift to network-
based standards in response to environmental concerns, maritime transport may recognise
that competitiveness will be enhanced by adopting operations and technology that meet
increased demands by shippers for transparency and improvement with regard to
environmental benchmarks – especially for energy, CO2 and emissions. More importantly,
the attributes of maritime transport that compare best with other modes may create
conditions where modal competitiveness favours this sector.
Interestingly, however, the modes of transport that are emphasised in the marketplace
(namely, those that deliver goods quickly), are also the most polluting. Air and truck freight
emit more than 10 times more CO2 than rail and ship; alternatively, the emissions controls
for trucking result in more similar PM emissions among the on-road, rail and water modes
per cargo movement. Until the environmental and human health impacts of these
emissions are incorporated into the price of the transport, the true social costs of freight
transport decisions are not addressed. This may imply strong consideration of policies that
attempt to internalise such external costs – e.g. through technological mandates,
emissions standards, fees or taxes.
A sustainable intermodal freight transport solution will require co-ordinated efforts
among industry, government and academia, along with improved understanding by the
general public about how their food, clothing, housing and other material needs are
delivered. As these efforts proceed, the maritime transport industry will continue to
involve technologies (including environmental control technologies for air emissions,
ballast water, hull coatings, etc.), energy systems (including alternative fuels, increased
power plant efficiencies, improved hull and propeller designs, and even novel concepts like
GLOBALISATION, TRANSPORT AND THE ENVIRONMENT © OECD 2010240
9. POLICY INSTRUMENTS TO LIMIT NEGATIVE ENVIRONMENTAL IMPACTS: AN ECONOMIC PERSPECTIVE
wind-assist kites) and operational changes (such as speed reduction, mode rebalancing,
and changing route patterns).
9.6. Aviation
Climate change
Similar to maritime transport, the share of aviation emissions in global carbon
emissions is small, but it is generally expected to grow fast. According to the business-as-
usual scenario in Figure 9.1, emissions from aviation are set to grow faster than those of
any other mode. While shares in emissions say nothing about abatement costs, it is often
taken for granted that aviation should contribute to abatement.
A wide range of abatement measures can be thought of: charges (such as the UK air
passenger duty or the Dutch ticket tax19), travel restrictions, emission standards, air traffic
control reform, airport regulations or charges, limits on airport expansion, use of alternative
fuels,20 fuel or carbon taxes, and inclusion of aviation in emission trading schemes. The
usual pros and cons can be listed for these various measures. Some measures, e.g. a large-
scale adoption of biofuels, can be seen as voluntary industry measures or as responses to the
introduction of carbon charges. Charges and standards may more usefully be regarded as
complements than as substitutes. The inclusion of aviation in trading schemes is proposed
or decided on in several regions: the European Union has decided to include domestic flights
and all aviation to or from the EU in the ETS, and Australia and New Zealand are expected to
include domestic aviation in their carbon trading schemes.
While trading schemes help equalise marginal abatement costs across the included
sectors, and hence work towards reducing overall abatement costs, the trading schemes
are not comprehensive and this leads to some shortcomings. For example, partial trading
schemes involve a problem of leakage: passengers may choose to travel to destinations
where carbon is cheaper, and airlines have incentives to use less energy-efficient aircraft
outside of the trading zones. As long as charges are on a segment basis instead of an origin-
destination basis, airlines may also change their network structure, e.g. by making more
intensive use of hubs near to trading zones so as to make flight segments within trading
zones shorter. Airlines that dominate such hubs are in a better position to make such
changes, so they may see their competitive position improve under a trading scheme. It
is worth noting that policies to internalise external costs can be expected to affect
competitive interactions in general, to the extent that different firms have different
options in responding to changes in costs and regulations. The question, hence, is whether
imperfect policies have excessively strong effects, that could be avoided by better policy.
According to Forsyth (2008), the scope for emission abatement in aviation through better
fuel efficiency is limited, at least at the level of the industry. Fleet renewal tends to reduce
emissions per passenger-kilometre by about 1% per year, but the possibilities of speeding up
this process seem limited. Putting a price on carbon, hence, will primarily affect airlines’
variable costs. To the extent higher costs lead to higher fares, flight volumes will be affected.
However, by many accounts, these effects are not negligible, but not very large either. Forsyth
(2008) estimated that, with a carbon price of EUR 20 per tonne CO2, fares will increase by 2%
to 6% if carbon costs are fully passed through to passengers. Schröder (2008) estimated a cost
increase for airlines of 2.5% to 5%, and a demand reduction of 2.1% to 4.6%, for an ETS where
15% of permits are auctioned and the cap equals 95% to 97% of the average emissions
of 1995-97. In a report for the UK Commission for Integrated Transport, Wit et al. (2003)
GLOBALISATION, TRANSPORT AND THE ENVIRONMENT © OECD 2010 241
9. POLICY INSTRUMENTS TO LIMIT NEGATIVE ENVIRONMENTAL IMPACTS: AN ECONOMIC PERSPECTIVE
estimated the increase in short-haul fares to around 3.5% and long-haul fares by about 6%.
By taking an overall fare elasticity of demand of –0.8, the DETR arrived at a reduction of
demand for short-haul and long-haul travel by around 3% and 5% respectively. CE Delft (2002)
calculated the impact of the introduction of an emissions charge to be levied in European
airspace and found that a charge of EUR 50 per tonne CO2 might decrease air transport
volume by roughly 2% for EU carriers. Anger et al. (2008) used a macroeconomic model to
estimate the impact of including aviation in the EU-ETS, and found limited effects. Aviation
would be a net buyer of permits, requiring about 2.5% of the total supply of permits; at a
permit price of EUR 40, demand for airline services was estimated to be 1% lower than the
baseline in 2020, while emissions drop by 7.5%. The authors pointed out that if permits were
auctioned, the revenues should not be recycled to non-ETS sectors, as this potentially undoes
carbon savings.
Many studies assume that increased carbon costs will be entirely reflected in higher
fares, i.e. pass-through is complete. However, the extent of pass-through of cost increases
to fares depends on the structure of the market. Under a Cournot competition structure
– which is assumed to be appropriate for some air travel markets – pass-through is limited
as long as no firms exit the industry, but fares can rise by more than carbon costs if there
is exit.21 When permits are distributed for free, exit is discouraged, and this limits the
impact of the carbon pricing scheme on abatement (Forsyth, 2008). The impact of carbon
prices also depends on the (real or artificial) scarcity of airport capacity. When capacity is
scarce, the introduction of carbon permits may do little more than reduce the opportunity
cost of capacity (i.e. it may reduce the value of slots), while fares are hardly affected.
Irrespective of the social value of such a transfer, the impact of the carbon price on
greenhouse gas emissions would be limited.
Aviation noise
The damage caused by aviation noise is considerable. Noise damage is concentrated
around airports, and it varies strongly among airports, depending on the size of the
population exposed, and among aircraft types. Lu and Morrell (2006) found that average
noise costs per landing ranged from EUR 16 at Stansted to EUR 774 at Heathrow, with
Schiphol holding the middle with EUR 377. For comparison, according to the same source,
the costs of emissions per landing (including many local pollutants and CO2) are estimated
at EUR 626, EUR 1 004 and EUR 842 for the same three airports.
Noise pollution has been on the agenda for much longer than climate change, and a
wide variety of measures is in place. Noise reduction at the source, as reflected in
certification noise levels, has reduced perceived noise levels by about one-third over
30 years (Girvin, 2009). Aircraft manufacturers design new aircraft taking noise-related
policies into account. The fact that new aircraft do better than FAA and ICAO limits
suggests that manufacturers design to the strictest standards in the market (often
European airports). Airport noise levels can be reduced through land-use measures,
defensive expenditures, rules for operational procedures and restrictions on operations.
Some of these measures directly, and considerably, affect an airport’s capacity. All these
measures are used to varying degrees. Girvin (2009) observed that EU airports are more
autonomous in this respect than those in the US, as in the latter, airports are limited to
restrictions on operations and operational procedures.
Policies have been effective. For example, while US air traffic increased by a factor of
3.5 between 1975 and 2000, exposure to significant noise declined by a factor of 16. But
GLOBALISATION, TRANSPORT AND THE ENVIRONMENT © OECD 2010242

9. POLICY INSTRUMENTS TO LIMIT NEGATIVE ENVIRONMENTAL IMPACTS: AN ECONOMIC PERSPECTIVE
expectations of continued traffic growth and increased resistance to noise (from a higher-
income population and well-organised interest groups) call for further action, while
abatement costs increase. As in other areas of environmental policy, it then becomes
increasingly important to try to keep the costs of further abatement down, and this
increases the attractiveness of incentive-based measures, such as noise charges. Noise
charges are in place in some airports, and are calculated on the basis of a variety of
formulas and aircraft categories.22 However, many airports rely on command-and-control
measures, which are unlikely to minimise costs. In this context, Niemeier (2008) showed
evidence that noise constraints determine (peak) capacity at several large airports.
“Government failure” of using inadequate noise reduction policies hence not only inflates
the costs of attaining some target level of aviation noise, it also exacerbates the costs of
inefficient use of scarce capacity. More widespread adoption of noise charges could reduce
the costs of noise abatement. Given the strong dependence of impacts on local conditions,
charges should not be harmonised among airports, but harmonisation of the mechanisms
to calculate them may be desirable.
9.7. ConclusionsThe picture on climate change management in transport that emerges from the
preceding sections is two-fold. Modes for which pre-existing policies are weak, such as
shipping and aviation, seem to be candidates for integration into broader efforts to
introduce climate change policy frameworks. Surface transport is characterised by stronger
existing policies, and its integration in such broader frameworks is less straightforward.
The shape of the broader climate change policy frameworks is uncertain. Much of the
economic analysis is on top-down approaches, and studies how multilateral efforts can
handle the sovereignty constraint as well as possible. Actual policy developments,
however, look more like a bottom-up approach, where different jurisdictions introduce
more or less broad policies. This tendency should not be too surprising, given the
importance of “club benefits” in making effective climate change policy possible. While the
bottom-up approach conceivably leads to gradual expansion of geographical coverage
(e.g. by linking up US and EU carbon trading systems), the inclusion of developing
economies like China and India remains problematic.
Inclusion of aviation and maritime transport in cap-and-trade systems that cover
other sectors is desirable from a cost-effectiveness point of view. Both for aviation and
maritime transport, technological abatement options are limited in the short run because
of slow fleet turnover. In maritime transport, the impression is that operational measures
can reduce CO2 emissions to some extent in the short run, at relatively low cost. In
aviation, there is some scope for abatement through better air traffic control and airport
congestion management (as well as technology in the longer run), but the main intra-
sector abatement is likely to come from lower demand. Available estimates put an upper
bound of about 5% on demand reductions, at prices of around EUR 20 per tonne CO2.
Imperfect competition and airport congestion limit the extent of pass-through of cost
increases to ticket prices, and hence limit the demand responses. The aviation sector is
thus likely to be a net buyer of permits. Both in aviation and shipping, there is considerable
scope for leakage, as long as trading schemes are not very comprehensive. Nevertheless,
inclusion of these modes in trading schemes is desirable if overall abatement is to be cost-
effective. Other incentive-based measures can yield similar benefits, but seem less
acceptable. Broadening the geographical scope of trading systems for maritime transport
GLOBALISATION, TRANSPORT AND THE ENVIRONMENT © OECD 2010 243

9. POLICY INSTRUMENTS TO LIMIT NEGATIVE ENVIRONMENTAL IMPACTS: AN ECONOMIC PERSPECTIVE
and aviation is likely to be a gradual process, perhaps along the lines discussed in Kågeson
(2009).
Road transport is characterised by relatively stringent pre-existing policies. The EU has
high fuel taxes and has recently introduced fuel-economy standards. The US has low fuel
taxes, and fuel economy is determined by the fuel economy standard, that is now set to be
tightened. In the EU, road transport is not included in the ETS. In various US proposals, the
idea is to include the sector, possibly through upstream trading between refiners. Since the
pre-existing policies are relatively stringent, abatement costs for CO2 in road transport are
relatively high, and exceed current and expected prices for carbon permits. This seems
undesirable from a narrow cost-effectiveness point of view, but since the prevailing policies
serve other purposes than just greenhouse gas reductions, it is not immediately clear if the
welfare cost of further tightening of these policies is very high. For example, higher fuel
taxes in the US seem justified if the goal is to handle congestion (in a blunt way) and
increase infrastructure cost coverage, and this policy would reduce greenhouse gas
emissions. It deserves emphasis, however, that the policy justification is congestion
management and infrastructure provision, not reducing greenhouse gas emissions.
Within the static welfare economic framework used above, the case for tighter fuel
economy standards or higher fuel taxes in road transport to reduce greenhouse gas
emissions is weak. It is often argued, however, that policies are needed to increase the
deployment of more fuel-efficient vehicles through the fleet. The reason is that the market
for fuel economy provides only weak incentives to improve fuel economy, given
consumers’ rational response to various uncertainties surrounding the investment in fuel
economy. Given the additional market failures in research, development and diffusion of
new technologies, a fuel economy standard could increase fleet fuel economy and the
adoption of alternative technologies. And since using less carbon to produce prevailing
mobility patterns is likely to be a cheaper way to reduce the risks of climate change than
drastically changing the structure of transport activity, such standards could complement
market-based instruments in surface transport, aviation and shipping.
Notes
1. This chapter is an edited, updated version of the paper Policy Instruments to Limit NegativeEnvironmental Impacts from Increased International Transport – An Economic Perspective, written byKurt van Dender and Philippe Crist, Joint Transport Research Centre of the OECD and theInternational Transport Forum, for the OECD/ITF Global Forum on Transport and Environment ina Globalising World, held in Guadalajara, Mexico, 10-12 November 2008 (www.oecd.org/dataoecd/12/53/41612575.pdf and www.internat ional transport forum.org/2009/workshops/pdf/Environmental.pdf). Some paragraphs are also taken from the paper The Impact of Globalisation onInternational Maritime Transport Activity: Past Trends and Future Perspectives, written by James J.Corbett and James Winebrake, Energy and Environmental Research Associates, United States, forthe same event (www.oecd.org/dataoecd/10/61/41380820.pdf).
2. There are, however, a wide range of exemptions, refund mechanisms and/or upper limits on thetax payments in these taxes, so the link between CO2 emissions and the effective tax rate facing agiven source is in many cases rather weak.
3. The US is taking active part in discussions about a post-Kyoto agreement to combat climatechange. On 26 June 2009, the US House of Representatives embraced President Obama’s climatechange initiative that aims to cut US greenhouse gases by 17% below 2005 levels by the year 2020,and 83% by 2050, i.e. through the implementation of a cap-and-trade system with some auctioningof permits included.
4. See OECD (2008) for a further discussion of environmentally related taxes and emission tradingsystems in practice.
GLOBALISATION, TRANSPORT AND THE ENVIRONMENT © OECD 2010244

9. POLICY INSTRUMENTS TO LIMIT NEGATIVE ENVIRONMENTAL IMPACTS: AN ECONOMIC PERSPECTIVE
5. OECD (2009) provides further discussion of carbon prices needed to achieve different concentrationtargets. In an “optimal” policy, carbon prices would increase over time.
6. The projections do not account for the current economic and financial crisis. If the current shockis transient and the world economy returns to the same growth mechanisms as before, theattainment of the transport demand and emission levels as sketched will be delayed by five yearsor so (well within the margin of error of the model). But if there are profound changes to thefunctioning of the economy, either because of policy or because of adaptation to economicrealities, more modest growth paths can be expected. In either case, the climate change problemstill looms large.
7. The BAU assumes a decline of the intensity of vehicle use in developed economies. The averagelight duty vehicle is driven about 18 000 km per year in OECD North America in 2000, assumed todecline to about 16 000 km per year in 2050. In OECD Europe, average use declines from 13 000 kmto 11 000 km per year over the same period. The underlying assumption is that an expansion of thevehicle stock in these economies reduces usage of each individual vehicle. In non-OECDeconomies, the average distance driven is assumed to remain more or less constant throughoutthe period.
8. A more extensive version of the arguments developed in this section can be found in Van Dender(2009).
9. Number taken from a 12 March 2008 e-mail exchange with Richard Smokers, with permission.
10. If policy steers the use of technology towards fuel economy, the cost needs to be calculated as thedifference in surplus produced by the use of technology best liked by consumers, and the surplusfrom using technology to improve fuel economy.
11. Loss-aversion means that consumers evaluate outcomes in terms of changes from a referencestate of wealth, and that losses are valued more than equivalent gains (to a larger extent than canbe explained by declining marginal utility).
12. It was noted in JTRC (2008a) that, contrary to expectations, fuel economy decisions for companycar fleets and for freight trucks are prone to similar imperfections as those for privately ownedlight duty vehicles. Loss-aversion may help explain this phenomenon as well.
13. The government may also prefer using a standard because it cares strongly about reaching theabatement target, perhaps out of a sense of urgency, and less about how much it will cost to getthere. This argument has no direct relation with the issue of loss-aversion.
14. One litre of petrol causes emissions of 2.3434 kg CO2 when being used, while a litre of diesel causesemissions of 2.6823 kg CO2.
15. On 19 May 2009, President Obama proposed a tightening of the CAFE fuel efficiency standards.Beginning in 2012, an average 5% annual increase in fuel efficiency will be required until 2016,when automakers’ combined car fleets should average an efficiency of 35.5 miles per gallon.
16. In different contexts, vessel owners, cargo owners or shippers may foot the fuel bill.
17. In March 2009, the Maritime Environment Protection Committee of the US and Canada proposedthe introduction of an Emission Control Area for NOx, SOx, and particulate matter (MEPC 59/5/X,27 March 2009), see www.epa.gov/oms/regs/nonroad/marine/ci/420f09015.htm. This Area wouldcomprise the main coastal zones of the US and Canada.
18. See www.epa.gov/oms/regs/nonroad/marine/ci/420f09015.htm.
19. Although it is not clear that these measures were primarily intended to curb greenhouse gasemissions. While the UK air passenger duty is being increased, the Dutch ticket tax has beendiscontinued.
20. See www.icao.int/WAAF2009/Documentation.htm for background on the potential of alternative fuels.
21. When there is Cournot competition, companies compete on the amount of output they willproduce, which they decide on independently of each other, and at the same time.
22. Examples include Prague (www.prg.aero/en/site/o_letisti/zivotni_prostredi/pristup_k_hluku.htm) andZurich (www.unique.ch/dokumente/umw_Environmental_Report_2007.pdf).
GLOBALISATION, TRANSPORT AND THE ENVIRONMENT © OECD 2010 245
9. POLICY INSTRUMENTS TO LIMIT NEGATIVE ENVIRONMENTAL IMPACTS: AN ECONOMIC PERSPECTIVE
References
Abrell Jan (2007), Transportation and Emission Trading – A CGE Analysis for the EU15, Economics of GlobalWarming Working Paper WP-EGW-01, Dresden University of Technology, available at www.tu-dresden.de/wwbwleeg/publications/wp_egw_01_Abrell_Transportation_Emission_Trading.pdf.
Aldy, Joseph E. (2006), Evaluating the Costs and Benefits of Energy and Climate Change Policies: An Overview,presentation at a Symposium on Global Energy and Climate Change, UCLA Extension Public PolicyProgram, Lake Arrowhead, California.
Aldy, Joseph E., Eduardo Ley and Ian W.H. Parry (2008), A Tax-Based Approach to Slowing Global ClimateChange, Resources for the Future Discussion Paper 08-26, available at www.rff.org/RFF/Documents/RFF-DP-08-26.pdf.
An, Feng and Amanda Sauer (2004), Comparison of Passenger Vehicle Fuel Economy and Greenhouse GasEmission Standards around the World, Pew Center on Global Climate Change, available atwww.pewclimate.org/global-warming-in-depth/all_reports/fuel_economy/index.cfm.
Anger, Annela et al. (2008), Air Transport in the European Union Emissions Trading Scheme, Final report forOmega, available at www.omega.mmu.ac.uk/Events/OmegaStudy_17_finalreport_AAPMA_2-1 _240209.pdf.
Barrett, Scott (2005), Environment and Statecraft – The Strategy of Environmental Treaty-making, OxfordUniversity Press, Oxford.
Barrett, Scott (2007), “Proposal for a New Climate Change Treaty System”, Economists’ Voice, October,available at www.bepress.com/ev.
Buhaug, Ø. et al. (2008), Updated Study on Greenhouse Gas Emissions from Ships: Phase I Report, InternationalMaritime Organization (IMO), London, UK, 1 September, available at www.imo.org/includes/blastDataOnly.asp/data_id%3D23703/INF-6.pdf.
CE Delft (2002), Economic Incentives to Mitigate Greenhouse Gas Emissions from Air Transport in Europe,Report to DG TREN of the European Commission.
Corbett, C.J. (2005), “Global Diffusion of ISO 9000 Certification through Supply Chains”, Manufacturingand Service Operations Management, 8(4), pp. 330-350, available at www.anderson.ucla.edu/documents/areas/fac/dotm/bio/pdf_CC27.pdf.
Corbett, C.J. and D.A. Kirsch (2001), “International Diffusion of ISO 14000 Certification”, Production andOperations Management, 10(3), pp. 327-342.
Ellerman, Denny A., Henry D. Jacoby and Martin B. Zimmerman (2006), Bringing Transportation into aCap-and-trade Regime, MIT Joint Program on the Science and Policy of Global Change, Report No. 136,available at http://dspace.mit.edu/bitstream/handle/1721.1/33953/MITJPSPGC_Rpt136.pdf?sequence=1.
Ellerman, Denny A. (2008), The EU Emission Trading Scheme: A Prototype Global System?, Harvard KennedySchool, Harvard Project on International Climate Agreements, Discussion Paper 08-02, available athttp://belfercenter.ksg.harvard.edu/files/Ellerman11.pdf.
European Union (EU) (2007), Commission Staff Working Document – Accompanying Document to the Proposalfrom the Commission to the European Parliament and Council for a Regulation to Reduce CO2 Emissions fromPassenger Cars – Impact Assessment, SEC(2007)1724, available at www.europarl.europa.eu/registre/docs_autres_institutions/commission_europeenne/sec/2007/1724/COM_SEC(2007)1724_EN.pdf.
Eyring, V. et al. (2005), “Emissions from International Shipping – 2: Impact of Future Technologies onScenarios until 2050”, Journal of Geophysical Research, 110.
Forsyth, Peter (2008), The Impact of Climate Change Policy on Competition in the Air Transportation Industry,JTRC Discussion Paper 2008-18, ITF/OECD, Paris, available at www.internationaltransportforum.org/jtrc/DiscussionPapers/DP200818.pdf.
Girvin, Raquel (2008), “Aircraft Noise Abatement and Mitigation Strategies”, Journal of Air TransportManagement, 15, pp. 14-22.
Glazer, Amihai and Charles Lave (1996), “Regulation by Prices and by Command”, Journal of RegulatoryEconomics, 9, pp. 191-197.
Greene, David L., John German and Mark A. Delucchi (2008), “Fuel Economy: The Case for MarketFailure”, Chapter 11 in Dan Sperling and James Cannon (eds.) (2008), Reducing Climate Impacts in theTransportation Sector, Springer, Netherlands.
Harrington, Winston and Virginia McConnell (2003), Motor Vehicles and the Environment, Resources forthe Future Report, April, www.rff.org/rff/Documents/RFF-RPT-carsenviron.pdf.
GLOBALISATION, TRANSPORT AND THE ENVIRONMENT © OECD 2010246
9. POLICY INSTRUMENTS TO LIMIT NEGATIVE ENVIRONMENTAL IMPACTS: AN ECONOMIC PERSPECTIVE
JTRC (2008a), The Cost and Effectiveness of Policies to Reduce Vehicle Emissions, JTRC Discussion Paper 2008-9,ITF/OECD, Paris, available at www.internationaltransportforum.org/jtrc/DiscussionPapers/DP200809.pdf.
JTRC (2008b), Transport Outlook 2008: Focusing on CO2 Emissions from Road Vehicles, JTRC DiscussionPaper 2008-13, ITF/OECD, Paris, available at www.internationaltransportforum.org/jtrc/DiscussionPapers/DP200813.pdf.
Kågeson, Per (2009), Making International Transport Pay its Climate Bill, Paper prepared for the Workshopon Environmental Impacts of International Transport, International Transport Forum, Leipzig, May,available at www.internationaltransportforum.org/2009/workshops/pdf/ws5-Kageson.pdf.
Leiby, Paul N. (2007), Estimating the Energy Security Benefits of Reduced US Oil Imports, Report No. ORNL/TM-2007/028, Oak Ridge National Laboratory, Oak Ridge, Tennessee, February, available atwww.epa.gov/OMS/renewablefuels/ornl-tm-2007-028.pdf.
Lu, Cherie and Peter Morrell (2006), “Determination and Applications of Environmental Costs atDifferent Sized Airports – Aircraft Noise and Engine Emissions”, Transportation, 33, pp. 45-61.
Maritime Environment Protection Committee (2009), Consideration and Adoption of Amendments toMandatory Instruments – Proposal to Designate and Emission Control Area for Nitrogen Oxides, SulfurOxides and Particulate Matter submitted by the United States and Canada, MEPC 59-5/x, 27 March.
Meckling, Jonas (2008), “Corporate Policy Preferences in the EU and the US – Emissions Trading as theClimate Compromise?”, Carbon and Climate Law Review, 2, pp. 171-180.
Newell, Richard (2008), Inducing Innovation for Climate Change Mitigation, Resources for the Future WeeklyPolicy Commentary, 11 February, available at www.rff.org/Publications/WPC/Pages/02_11_08_Innovation_CCMitigation_Newell.aspx.
Niemeier, Hans-Martin (2008), Airports and the Environment. How to Balance Economic and EnvironmentalConcerns, presentation at the “Aviation and the Environment” GARS Workshop at the InternationalUniversity of Applied Sciences, Bad Honnef, 26-27 November, www.garsonline.de/.
Nordhaus, William D. (2007), “To Tax or Not to Tax: Alternative Approaches to Slowing GlobalWarming”, Review of Environmental Economics and Policy, 1, 1, pp. 26-44.
OECD (2008), Environmentally Related Taxes and Tradable Permit Systems in Practice, OECD, Paris, availableat www.olis.oecd.org/olis/2007doc.nsf/linkto/com-env-epoc-ctpa-cfa(2007)31-final.
OECD (2009), Climate Change Mitigation: What do we do?, OECD, Paris, available at www.oecd.org/dataoecd/31/55/41751042.pdf.
Parry, Ian W.H. (2007), “Are the Costs of Reducing Greenhouse Gases from Passenger VehiclesNegative?”, Journal of Urban Economics, 62, 2, pp. 273-293.
Parry, Ian W.H. and Kenneth A. Small (2005), “Does Britain or the United States have the Right GasolineTax?”, American Economic Review, 95, 1276-1289.
Pil, F.K. and S. Rothenberg (2003), “Environmental Performance as a Driver of Superior Quality”, Productionand Operations Management, 12(3), pp. 404-415.
Proost, S. (2008), Full Account of the Costs and Benefits of Reducing CO2 Emissions in Transport, JTRCDiscussion Paper No. 2008-3, ITF/OECD, Paris, available at www.internationaltransportforum.org/jtrc/DiscussionPapers/DP200803.pdf.
Sansom, Tom et al. (2001), Surface Transport Costs and Charges – Great Britain 1998, ITS Leeds in associationwith AEA Technology Environment.
Schröder, Andreas (2008), Incorporating Aviation into the EU Emissions Trading System, presentation at theGARS Conference on Aviation and Climate Change, Amsterdam, July.
Small, K. and K. Van Dender (2007), Long Run Trends in Transport Demand, Fuel Price Elasticities andImplications of the Oil Outlook for Transport Policy, JTRC Working Paper 07-16, ITF/OECD, Paris, availableat www.internationaltransportforum.org/jtrc/DiscussionPapers/DiscussionPaper16.pdf.
Stern, Nicholas (2006), The Economics of Climate Change: The Stern Review, HM Treasury, London, www.hm-treasury.gov.uk/independent_reviews/stern_review_economics_climate_change/stern_review_report.cfm.
Stiglitz, Joseph E. (2006), “A New Agenda for Global Warming”, Economists’ Voice, July, www.bepress.com/ev.
Tol, Richard S.J. (2005), “The Marginal Damage Costs of Carbon Dioxide Emissions: An Assessment ofthe Uncertainties”, Energy Policy, 33, pp. 2064-2074.
Turrentine, Thomas and Kenneth Kurani (2007), “Car Buyers and Fuel Economy?”, Energy Policy, 35,pp. 1213-1223.
GLOBALISATION, TRANSPORT AND THE ENVIRONMENT © OECD 2010 247

9. POLICY INSTRUMENTS TO LIMIT NEGATIVE ENVIRONMENTAL IMPACTS: AN ECONOMIC PERSPECTIVE
Van Dender, Kurt (2009), “Energy Policy in Transport and Transport Policy”, Energy Policy, Vol. 37,issue 10, pp. 3 854-3 862.
Wang, C. and James Corbett (2007), “The Costs and Benefits of Reducing SO2 Emissions from Ships inthe US West Coastal Waters”, Transportation Research D, 12, pp. 577-588.
Weitzman, Martin L. (2007), “A Review of the Stern Review on the Economics of Climate Change”,Journal of Economic Literature, 45, pp. 703-724.
Weitzman, Martin L. (2009), “On Modelling and Interpreting the Economics of Catastrophic ClimateChange”, The Review of Economics and Statistics, February, 91(1), pp. 1-19.
Wit, Ron, Marc Davidson and Jos Dings (2003), Meeting External Costs in the Aviation Industry, CE Delft, Delft.
GLOBALISATION, TRANSPORT AND THE ENVIRONMENT © OECD 2010248
Globalisation, Transport and the Environment
© OECD 2010
Chapter 10
Policy Instruments to Limit Negative Environmental Impacts:
International Law
byMarkus W. Gehring1, 2
This chapter provides an overview of international law’s limits and opportunities incombating the adverse effects of transport on the environment. It examines theselimits and opportunities in turn for international air transport, international shipping,road transport and other regimes which regulate, for instance, the transport ofhazardous waste. This chapter thus examines the opportunities and limits of policyinstruments in addressing negative environmental impacts arising from transport. Itbreaks down responses by multilateral, regional and unilateral approaches.
Although international law in general does not exclude the possibility of unilateralaction, it strongly encourages multilateral approaches. States have considerablefreedom to regulate their own vessels and set the rules applicable in their ownterritory, particularly if they adopt non-discriminatory legislation. Regionalinitiatives offer several successful models to debate, design and adopt innovativerules which later can find their way into global regimes. Although internationalregimes on occasion act as constraints on governments’ abilities to regulate activitythat is harmful to the environment, the international law provides manyopportunities to adopt new instruments to regulate environmental impacts fromincreased international transport.
249
10. POLICY INSTRUMENTS TO LIMIT NEGATIVE ENVIRONMENTAL IMPACTS: INTERNATIONAL LAW
10.1. IntroductionIn recent decades, international trade in goods and services has grown at average
rates of 6% or more per year and, according WTO (2008), international transport and travel
has grown at an average 14% to the value of USD 3 260 billion in 2007 (WTO, 2008).
Since 1950, trade in agricultural products has increased five-fold and trade in
manufactured goods has increased by a factor of more than 500 (Kraemer, Hinterberger and
Tarasofsky, 2007). These upward international economic trends have naturally led to
corresponding increases in transport of goods, largely by sea, and of people, largely by air.
However, transport can adversely affect the environment in a number of ways, including
through the emission of greenhouse gases (carbon dioxide and others), nitrogen oxide
(NOx) and sulphur oxide (SOx), as well as particular matter and noise. Efforts to combat
these adverse effects are often stymied by concerns over cost, as well as international
commitments that may prevent states from regulating most effectively to achieve
particular environmental goals.
International legal instruments address potential environmental impacts in terms of all
forms of pollution, including SOx and NOx, noise, particulate matter and greenhouse gas
emissions (GHGs), especially CO2. GHG emissions are particularly relevant for their negative
contribution to climate change. As resource-intensive production and resource extraction
has tended to shift from developed countries to developing countries, the pattern of global
CO2 emissions has changed, since the emissions arising from these activities will be
assessed as part of the developing countries’ total where they occur, rather than as part of
the developed countries’ total, where the relevant goods are eventually consumed. While
developed country emissions might fall as a result, overall emissions might increase
following this cross-border shift due to the use of less efficient production techniques in
developing countries. Policy makers seeking to impose costs on CO2 abatement should
therefore be careful to ensure that their policies do not backfire and result in increasing CO2
emissions (Kraemer, Hinterberger and Tarasofsky, 2007).
10.2. International air transportAt present, many industrial sectors are being scrutinised for their “carbon footprint” and
impact upon the environment. However, the aviation industry has come under particular
inspection. Although figures vary, the International Civil Aviation Organization (ICAO) cites a
report from the Intergovernmental Panel on Climate Change that estimates aircraft do,
currently, “contribute about 3.5 per cent of the total radiative forcing (a measure of change in
climate) by all human activities”.3 It is widely accepted that this figure will rise (Wit et al.,
2005), and carbon dioxide emissions from aviation are expected to grow by about 175%
between 1990 and 2050 (Centre for Clean Air Policy, 2004). In addition, especially during their
take-off and landing cycle, aircraft emit nitrogen oxide (NOx). This gas contributes indirectly
to radiative forcing, though its effect is mixed – it contributes both to warming by assisting
the production of ozone, and to cooling, by removing methane from the atmosphere.4
GLOBALISATION, TRANSPORT AND THE ENVIRONMENT © OECD 2010250

10. POLICY INSTRUMENTS TO LIMIT NEGATIVE ENVIRONMENTAL IMPACTS: INTERNATIONAL LAW
International progress has been sought on this matter, with a 2005 agreement seeking
reductions by the end of 2008.5 Nevertheless, it is anticipated that 2025 NOx levels will be
2.75 times higher than the 2005 levels (Fleming, 2007). Similarly, SOx, emitted from aircraft
predominantly as SO2 but often oxidised in the process, contributes to the wider impact of
aviation transport on the environment. Both NOx and SOx are likely to lead to radiative
forcing which is regionally located near the flight routes and can cause greater concern for
cities with airport hubs. Moreover, local noise pollution can generate disquiet for residents
living near airports and airfields. International progress has been made on these issues,
though there remain concerns for many countries and their populations
Certain legal boundaries also affect initiatives aimed at addressing these environmental
concerns, as is briefly outlined in the following section of this paper.
Limits in international law
Multilateral initiatives
The principal legal instrument regulating international air transport is the Chicago
Convention of 1944, which established the International Civil Aviation Organization (ICAO)
with its headquarters in Montreal. The Convention and organisation both have virtually
global membership. As such, their principles and policies are fundamental in the shaping
of initiatives designed to confront the environmental impact of international air transport.
The principle of respect for national sovereignty is extremely important in international
law. Rules of international air transport are no different. The concept of a state’s sovereign
jurisdiction over its territory extends to the airspace above its land.6 Article 1 of the 1944
Chicago Convention, entitled “Sovereignty”, “recognize[s] that every State has complete and
exclusive sovereignty over the airspace above its territory”. Article 6 expands upon this
notion, stating that “[n]o scheduled international air service may be operated over or into the
territory of a contracting State, except with the special permission or other authorisation of
that State, and in accordance with the terms of such permission or authorisation”.
It is immediately noteworthy that Article 1 refers to “every State”, rather than, as it does
in other articles, “contracting States”. Furthermore, the article does not claim to create or
establish the rule regarding airspace sovereignty, but rather “recognizes” the principle. The
Figure 10.1. Take-off and landing cycle
Source: Fleuti and Polymris (2004).
3 000 ft
Climb-out
Taxi-inTake-off Final
approach
Taxi-out
GLOBALISATION, TRANSPORT AND THE ENVIRONMENT © OECD 2010 251
10. POLICY INSTRUMENTS TO LIMIT NEGATIVE ENVIRONMENTAL IMPACTS: INTERNATIONAL LAW
use of this language, in applying to all states irrespective of their voluntary adhesion to the
treaty and in codifying an already existing rule, has important implications:
● First, it indicates that the rule is one of customary international law. It is both respected
by states in practice and constitutes the opinio juris of the international community
(Mendes de Leon, 2002, p. 484).
● Second, and consequently, it indicates that the principle is, to all intents and purposes,
inviolable. This creates a very powerful tool for states to utilise in seeking to regulate their
own airspace in terms of environmental impact. Of course, it also poses a significant
obstacle to a state wishing to take action to regulate the environmental impact of
international air transport more widely.
It is also important to be aware of the annexes that ICAO promulgates from time to
time. These annexes establish standards regarding international air transport, including
environmental standards. ICAO set up the Committee on Aviation Environmental
Protection (CAEP) in 1983 to deal precisely with the environmental impacts from
international air transport, including both noise pollution and engine emissions.
The ICAO Assembly adopted Resolution A36-22 on the recommendation of work
undertaken within the CAEP in early February 2007. Appendix L addressed “market based
measures, including emissions trading”. The Preamble to this Appendix recognised that
“[c]ontracting States are responsible for making decisions regarding the goals and must use
appropriate measures to address aviation’s greenhouse gas emissions taking into account
ICAO’s guidance”. However, it also recognised that “the majority of the Contracting States
endorse the application of emissions trading for international aviation only on the basis of
mutual agreement between States”, which resulted in the “need to engage constructively
to achieve a large degree of harmony on the measures which are being taken and which are
planned [to be taken]”. Indeed, the interaction among states in air transport is at the heart
of understanding the limits and opportunities. Therefore, state-level action aimed at
addressing international transport seems to be limited by the need to engage with other
states, on the basis of mutual agreement, to ensure harmony on any particular initiative.
And as the matter currently stands, states appear somewhat restricted to multilateral
negotiation forums within the ICAO. This does not prevent any state from adopting a
leadership role to push forward with discussions or tabling motions aimed at addressing
more determinedly the issue of air transport’s environmental impact. But the lack of
progress to date raises broader questions concerning the most appropriate and efficient
body in which to vest regulatory authority over environmental matters related to aviation,
and the role of ICAO in a post-Kyoto world.
The ICAO annexes contain what are known as Standards and Recommended Practices
(SARPs), which place further limits on the unilateral undertaking of environmental
measures. The SARPs, though without the force of an international treaty, entail legal
obligations for the contracting states to the Chicago Convention. Such states have
“accepted an explicit legal undertaking to collaborate in securing the highest practicable
degree of uniformity in regulations, standards, procedures and organisation in relation to
(air navigation)” (Milde, 1998, p. 254).
The ICAO SARPs are the current multilateral mechanism used to govern or guide, at an
international level, the consequential national regulations concerning air transport.
Compliance with these standards is the central cause for concern for most states. Without that
compliance, the inherent need for co-operation on uniform rules in international air transport
GLOBALISATION, TRANSPORT AND THE ENVIRONMENT © OECD 2010252

10. POLICY INSTRUMENTS TO LIMIT NEGATIVE ENVIRONMENTAL IMPACTS: INTERNATIONAL LAW
is jeopardised. Article 33 of the Chicago Convention seeks to ensure that compliance by
ensuring that these SARPs are recognised, on a reciprocal basis, by every contracting state.7
This means that certificates of airworthiness and certificates of competency and licences
“issued or rendered valid by the contracting State in which the aircraft is registered, shall be
recognised as valid by the other contracting States, provided that the requirements under
which such certificates or licences were issued or rendered valid are equal to or above the
minimum standards which may be established from time to time…”. This article therefore
dictates that one state may not reject or discriminate against the aircraft of another state,
where that aircraft is complying with the standards annexed to the Chicago Convention.
Article 33 therefore represents a further constraint on states seeking to take unilateral action
to curb international air transport’s contribution to global warming and CO2 emissions. Using
a method of reciprocity in international air transport can have the unfortunate side effect of
hindering positive unilateral progress in a given area, such as the environment. States must
therefore ensure that any initiatives put in place do not have the effect of invalidating another
state’s annex compliant air transport framework.
Bilateral initiatives
International air transport, since the late 1940s, has been conducted on a bilateral
basis. Departing from the multilateral treaty approach at Chicago, states sought to
establish more detailed agreements which would determine the capacity, frequency and
cost of air traffic flowing between two territories. That model largely remains the
predominant model today and there exist tens of thousands of international bilateral
treaties between nations. These treaties include legal conditions for their members. There
is an increasing tendency to include environmental clauses within such agreements. The
US and EU Agreement of March 2007 provides an example of such an accord. Article 15(2)
of the Agreement states:
When a party is considering proposed environmental measures, it should evaluate
possible adverse effects on the exercise of rights contained in this Agreement, and, if
such measures are adopted, it should take appropriate steps to mitigate any such
adverse effects.8
Ultimately, therefore, both parties to this agreement are obligated to first evaluate the
possible adverse effects that any state-level action might have and, second, take
appropriate steps to mitigate those adverse effects. Failure to do so would result in the
violation of this article of the Agreement. Regarding international law, the breach of a
signed and ratified international convention is a serious matter. As such, a material breach
of this Agreement could lead to the other Party invoking that breach “as a ground for
terminating the treaty or suspending its operation in whole or in part”.9 As such, another
important limit within the environmental field of international aviation is the possible
existence of an international treaty between two parties which places stipulations upon
the commencement of any given initiative to address environmental impacts, including
emissions. These agreements affect the economic investment and growth of the air
transport industry between the two states, and are generally respected in international
aviation matters.
Unilateral initiatives
A recent dispute between the US and the EU concerning the noise pollution generated
by certain aircraft provides a useful case analysis of how regulation at the European level
GLOBALISATION, TRANSPORT AND THE ENVIRONMENT © OECD 2010 253
10. POLICY INSTRUMENTS TO LIMIT NEGATIVE ENVIRONMENTAL IMPACTS: INTERNATIONAL LAW
fares on the international stage. At the heart of the matter was an EU regulation addressing
environmental concerns of international air transport which was adopted outside, and in
opposition to, the co-operative framework of ICAO. This regulation sought to address the
growing disquiet surrounding the noise pollution created by civil aircraft around the
airports of the EU member states. In the period between the proposal and its adoption,
several rounds of negotiations between the US and the EU took place in an attempt to
placate the US’s reservations concerning what it regarded as a “purely protectionist”
(Knoor and Arndt, 2002, p. 4) measure which had a “disparate impact on US interests”
(United States Department of State, 2000, p. 17).
The EU stated that it was adopting this measure because the US had deviated “from the
internationally agreed upon ICAO Chapter 2 phase-out schedule” (EU Commission, 1999, p. 12).
Each chapter indicated an ever-decreasing limit on the noise that registered aircraft were
permitted to make. The US had progressed on this phase-out faster than agreed upon and
there were worries from both the EU aviation market and the noise-abatement lobbyists that
this would be an incentive to the US owners and operators to move their Chapter 2 aircraft into
the territory of the Community. The method of hushkitting such Chapter 2 aircraft to comply
with the standards under Chapter 3 of Annex 16, thereby facilitating their operational use
within the EU, was therefore countered by the EU with the promulgation of this regulation.
Although “hushkitted aircraft meet Chapter 3 standards, … their performance is near the
bottom of the acceptable noise range allowed by [that] chapter…” (Fischer, 2000). Therefore,
according to the EU, while these aircraft technically complied with the Chapter 3
requirements, this did not mean that they were required “to accept them as Chapter 3 aircraft”
(Fischer, 2000).
A number of policy and economic arguments to this EU regulation were fielded by the
US. More important for this chapter, however, were the purely legal objections. What limit
did the US allege the EU had transgressed in adopting this regulation? Principally, their
concern was that both the design and effect of the measure was discriminatory. For
instance, the measure appeared to advantage European states over non-European ones
regarding the use of the aircraft in question. Importantly, the measure was also alleged to
be discriminatory in that it distinguished between Chapter 3 compliant aircraft which had
been recertified and Chapter 3 compliant aircraft which had always been so certified. As
such, the regulation also violated Article 33 of the Chicago Convention, requiring all states
to recognise the validity of airworthiness certificates issued by any other contracting state.
As the US had technically complied with those standards, the EU’s decision not to
recognise those certificates violated Article 33.
However, before the matter reached a formal court, the ICAO Council, in June 2001,
adopted Chapter 4 noise standards within Annex 16. These standards offered “member-states
a great deal more flexibility in the definition and enforcement of their national and local noise
abatement policies” than did the previous set of standards (EU, 1999, p. 7). As a consequence,
the EU Council, in mid-October 2001, officially recognised the “prospect of replacing the
‘hushkits’ Regulation in the near future” (EC, 2001). It finally took those steps in late
March 2002, adopting Directive 30/2002 “on the establishment of rules and procedures with
regard to the introduction of noise-related operating restrictions at Community airports”.
Article 15 of that Directive explicitly repealed the “hushkit” Regulation. The Directive avoided
stipulating design methods to carriers seeking to comply with the Directive and effectively
defused the dispute between the two Parties.
GLOBALISATION, TRANSPORT AND THE ENVIRONMENT © OECD 2010254
10. POLICY INSTRUMENTS TO LIMIT NEGATIVE ENVIRONMENTAL IMPACTS: INTERNATIONAL LAW
This brief case analysis provides useful lessons for states seeking to understand the
limits and opportunities within international aviation law for taking initiatives within the
environmental sphere. First, it indicates, as noted above, that Article 33 of the Chicago
Convention presents a sticking point for states seeking to take unilateral action. Second, it
is clear that any measures must not be seen by another state as discriminating against
them, either legally or as regards their air transport economy. However, these aspects of the
case do not ultimately rule out unilateral action aimed at international air transport.
Indeed, an equally important lesson to be taken from this case is that the EU ultimately
achieved its desired goal of quieter planes by establishing Chapter 4 noise standards within
the ICAO framework. A state must be aware, therefore, of the restrictions in place while
recognising that global standards can be achieved from initially unilateral beginnings.
Indeed, the EU itself has not been deterred by the above dispute. It is currently
preparing to bring all flights that land or take off from a European airport within its
emissions trading scheme from 2012.10 Again, this will originally be a Europe-wide scheme
that could ultimately lead to a more global system of carbon trading. It has been argued
that the scheme is compatible with the Chicago Convention and general rules of
international air law, given that the intended EU scheme is a market-based initiative,
expressly recognised as a legitimate progression of air transport within the preamble to the
Chicago Convention (Delft et al., 2005, p. 17). Whether this initial scheme will in fact survive
legal challenges from other ICAO members will be seen in the coming years.
Opportunities in international law
Article 38 of the Chicago Convention provides, in part, that “Any State which… deems
it necessary to adopt regulations or practices differing in any particular respect from those
established by an international standard, shall give immediate notification to the
International Civil Aviation Organization of the differences between its own practice and
that established by the international standard”.11
The principal goal of this article is to ensure that states are fully aware of the practices
and regulations in operation in any given state. Therefore, where a state considers it
“impracticable to comply in all respects with any international standard, it has an
unconditional legal duty, under Article 38 of the [Chicago] Convention, to give immediate
notification to… ICAO” (Milde, 1998, pp. 254-255). Through this mechanism, it was
anticipated that contracting states within ICAO could assess, with full information, the air
navigation standards of every other contracting state. Although safety and efficiency was
the principal goal behind this article, the passage of the Convention article reproduced
above does not distinguish between differing standards below or above that of the
international standard. Therefore, the article permits states to deviate from the
international standard, such as an aircraft’s carbon dioxide emissions, provided immediate
notification is given to the ICAO. Use of this article is therefore possible by states seeking to
implement unilateral measures regarding the environmental impact of air transport.
States may also seek recourse to what has become known as the “effects” doctrine in
seeking to regulate international air transport. This essentially allows a state to “assume
jurisdiction on the grounds that the behaviour of a party is producing ‘effects’ within its
territory” (Shaw, 2003, p. 612). For instance, placed in an aviation context, Abeyratne (1996)
is of the opinion that “if… engine emissions of aircraft adversely affect the territories of
[other] states… the state in which such aircraft are registered or leased or chartered would
incur legal liability at international law” (Abeyratne, 1996, p. 291). As such, the injured state
GLOBALISATION, TRANSPORT AND THE ENVIRONMENT © OECD 2010 255

10. POLICY INSTRUMENTS TO LIMIT NEGATIVE ENVIRONMENTAL IMPACTS: INTERNATIONAL LAW
might legitimately exercise prescriptive jurisdiction over the activity. Such a principle is
fully embraced by a number of states, the United States and the United Kingdom being
robust in their use of the doctrine within the area of competition law. Classically
expounded in US v. Aluminium Co. of America, “any State may impose liabilities, even
upon persons not within its allegiance, for conduct outside its borders that has
consequences within its borders which the State reprehends”.12
As a consequence, where a state is seeking to regulate activity outside its borders, such
as aircraft emissions which adversely affect that state, it might employ this doctrine in
executing state-level regulations. Clearly, the political and economic ramifications of
unilaterally restricting the freedom of another state’s air transport are a separate
consideration and the “effects” doctrine has yet to be confirmed directly for areas beyond
competition law.
Environmental air taxes which do not specifically address fuels themselves could
probably be justified under international law related to air quality or long-range transport
of pollutants. These would need to be strictly non-discriminatory regulations, affecting the
goods and services from different states equally, as otherwise they could face challenges in
ICAO and the WTO.
International trade law, under the disciplines of the WTO Agreements, is often seen as
limiting states’ regulatory autonomy, particularly in social and environmental fields.
However, both the General Agreement on Tariffs and Trade (GATT) and the General
Agreement on Trade in Services (GATS) include specific exceptions designed to allow
member states to pass measures that are aimed at environmental protection. Thus,
Article XX of GATT reads: “[N]othing in this Agreement shall be construed to prevent the
adoption or enforcement by any contracting party of measures… b) necessary to protect
human, animal or plant life or health; … g) relating to the conservation of exhaustible
natural resources if such measures are made effective in conjunction with restrictions on
domestic production or consumption.” Any measures taken must, nevertheless, not be
applied in such a manner that would constitute a disguised restriction on international
trade, or a means of arbitrary or unjustifiable discrimination between countries where the
same conditions prevail. Article XIV of GATS contains environmental and health
exceptions in similar terms to the GATT.
Countries are thus permitted under WTO law to take environmental protection
measures, as long as the same standards are imposed on both domestic and foreign
producers and providers, and there is no disguised protectionism. The essential
compatibility of the WTO regime with domestic environmental and health measures has
been confirmed by the WTO Appellate Body in cases such as Gasoline13 and Asbestos.14 In
the context of international air transport services, however, the relevance of trade law may
be limited by most states’ reluctance to commit to full liberalisation of the sector under
GATS’ positive list approach.
WTO law on subsidies, labelling and procurement provide other potential
opportunities to combat the negative environmental effects of transport (Kraemer,
Hinterberger and Tarasofsky, 2007, p. 2). First, the WTO subsidies regime under the
Agreement on Subsidies and Countervailing Measures does not prohibit outright all
payments made by a government to its industries. Under the “traffic-light” approach,
subsidies in the “green light” category are likely to be permitted; these include subsidies
that are not tied to export performance, do not require domestic content and do not target
GLOBALISATION, TRANSPORT AND THE ENVIRONMENT © OECD 2010256

10. POLICY INSTRUMENTS TO LIMIT NEGATIVE ENVIRONMENTAL IMPACTS: INTERNATIONAL LAW
specific industries.15 As long as the subsidy is carefully implemented, then, domestic
governments may be able to encourage more energy-efficient air transport through
payments to good performers or to advance technological developments.
Second, a domestic government may wish to encourage the use of “eco-labels”, or the
provision of information to the consumer on the environmental impacts of the goods or
services being consumed. In the context of air transport, for instance, airlines could begin
voluntarily reporting on the efficiency of their aircraft, allowing consumers to choose the most
energy-efficient and least polluting airline to travel with. As long as the labelling scheme (or
other schemes for informing consumers) remained voluntary, it would most likely not breach
any relevant WTO agreements. If the scheme became mandatory, implemented through
domestic laws, there is more risk that it would violate the non-discrimination provisions of
GATT16 or GATS,17 or that it would constitute an unnecessary obstacle to international trade
under the Agreement on Technical Barriers to Trade.18 However, for the non-discrimination
provisions to become relevant, environmentally damaging goods and services must be
considered “like” (that is, equivalent to) cleaner goods and services, since the provisions only
apply to like products. The “process and production method” debate then becomes relevant
here to a discussion of whether air transport services that are delivered using highly
environmentally damaging aircraft are “like” competitors’ services that are delivered using
more efficient planes. There is no clear answer as yet from the Appellate Body on this issue, so
the use of mandatory labels, certification requirements or information-provision requirements
remains only a potential opportunity for environmental regulation (WTO, 2000).
Third, public procurement provides another potential opportunity for governments to
encourage environmentally friendly air transport. Governments might, for instance,
express a preference for less polluting airlines (those using newer planes, or those who
actively engage in carbon offsetting programmes) when purchasing transport services for
their staff. Although procurement is partly covered by the plurilateral WTO Agreement on
Government Procurement (GPA), where it applies, the GPA does permit the consideration of
non-economic factors, including the GATT/GATS-style exceptions for human, animal or
plant life or health (McCrudden, 2008). Nevertheless, the extent of this possibility under the
GPA is uncertain, and, as for eco-labels, governments’ ability to incorporate environmental
criteria into their purchasing decisions while still remaining GPA-compliant is thus
somewhat unknown.
Attempts to address the climate change impacts of aviation must contend with a
substantial number of other issues. A major one is the issue of accounting – exactly how to
account for GHG emissions coming from the aviation industry. Under Kyoto, for instance,
countries’ emissions are assessed against a baseline, but while domestic aviation and
marine emissions are included in each country’s total, emissions from international
shipping and aviation are currently separately reported.19 In 1996, the Subsidiary Body for
Scientific and Technological Advice (SBSTA) of UNFCCC identified eight options for
emissions accounting:
● No allocation (that is, emissions from international aviation would remain in the
international sphere rather than be allocated to any particular country).
● Allocation of global bunker fuel sales and associated emissions to Kyoto parties in
proportion to their national emissions.
● Allocation to parties according to the country where the bunker fuel is sold.
● Allocation to parties according to the nationality of the transport operator.
GLOBALISATION, TRANSPORT AND THE ENVIRONMENT © OECD 2010 257
10. POLICY INSTRUMENTS TO LIMIT NEGATIVE ENVIRONMENTAL IMPACTS: INTERNATIONAL LAW
● Allocation to parties according to the country of destination or departure of the aircraft
or vessel.
● Allocation to parties according to the country of destination or departure of passengers
or cargo.
● Allocation to parties according to the country of origin of passengers or owner of cargo.
● Allocation to the party of all emissions generated in its national space (van Velzen and
Wit, 2000).
A study carried out for the Dutch Civil Aviation Authority in 2000 examined the
quantitative effect of each of these eight scenarios on the national emissions of 23 major
aviation nations (EU15, Switzerland, Norway, US, Canada, Russian Federation, Brazil, Japan
and Australia) (van Velzen and Wit, 2000). The considerable differences in results, as shown
by the study, highlight the effect that the various accounting policies can have on a state’s
ability to meet its Kyoto targets. Consensus on the most appropriate means of accounting
will thus be required before market-based mechanisms for addressing the GHG impact of
international air transport are likely to be successful.
One final note is important. In aviation, GHGs and carbon dioxide in particular are not
the only contributors to climate change; they may in fact represent only 25% to 33% of
the total contribution (Centre for Clean Air Policy, 2004). One study concludes that
condensation trails (contrails) from aircraft may have contributed to a 0.2 oC to 0.3 oC per
decade temperature increase between 1973 and 1994 (Minnis et al., 2004). However,
contrails are probably best addressed through technical and optimisation tools, such as
altering flight paths to reduce their formation, rather than policy instruments backed by
international law (Centre for Clean Air Policy, 2004).
While unilateral action or regional action is not encouraged under international law, flag
state jurisdiction over carriers can be used to increase environmental standards, as can
certain provisions of international trade law. In conclusion, it can be noted that multilateral
action in many fields (including new international environmental instruments) presents a
broad array of options to regulate environmental consequences from international air
transport, while avoiding discrimination against one particular air-faring state.
10.3. International space transportAs commercial space travel becomes an increasing likelihood over the coming decades,
states are becoming aware of potential legal implications. The opportunities and limits in
place for state-level action to sustainably manage the environmental impact of this new
means of transport are, currently, uncertain. For instance, the point at which air transport
becomes space transport has no accepted international definition. This is obviously
important, as a state maintains sovereignty over its airspace and would usually be keen to
enlarge its territorial jurisdiction. Indeed, at state level, this delimitation has been defined,
though in dissimilar ways. Australia, for instance, regards space activities as those occurring
or intending to occur 100 km in altitude.20 The UK, on the other hand, has stated that “for
practical purposes the limit is considered to be as high as any aircraft can fly” (Shaw, 2003,
p. 464). Therefore, neither the limit itself, nor its method of calculation is stipulated by
international law. This currently leaves a state free to determine “outer space” above its own
airspace. However, the ability for a state to potentially extend this limit indefinitely, far into
the reaches of outer space, and thereby to extend the sovereignty it possesses over its own
airspace, seems doubtful. A geostationary orbit around the earth, on which many satellites
GLOBALISATION, TRANSPORT AND THE ENVIRONMENT © OECD 2010258
10. POLICY INSTRUMENTS TO LIMIT NEGATIVE ENVIRONMENTAL IMPACTS: INTERNATIONAL LAW
are placed due to its advantageous geosynchronous properties, lies 36 000 km from the
earth’s equatorial surface. Although the Bogota Declaration, signed in 1976 by a number of
equatorial states, claimed that “the segments of geostationary synchronous orbit are part of
the territory over which equatorial States exercise their sovereignty”,21 many states and
legal authors have rejected this (Jakhu, 2007). It seems, therefore, that the international
community rejects claims of sovereignty at 36 000 km (over a limited resource, it must be
added), but have reached no agreement below that limit.
States must also begin to be aware of the environmental impact of transport vehicles
such as Virgin Galactic’s aeroplane/space ship hybrid that will soon undertake space
tourism and, in the not too distant future, space transport between countries. As Virgin
itself admits, “the technology that still delivers payloads and people to space has a high
negative environmental impact and has remained essentially unchanged for half a
century”.22 An average rocket23 will use 3.5 million pounds of fuel in each launch. For
comparison, 2.5 thousand million pounds of gasoline is used in the entire US in one day.
The contribution is therefore not negligible, and its use can be expected to increase
strongly over the coming years. How states wish to proceed in ensuring the sustainable
development of this means of transport remains largely undefined.
The opportunities available to states to ensure that CO2, SOx, NOx and other harmful
emissions do not outweigh the benefits offered by this mode of transport are currently only
starting to be discussed in international legal circles. For instance, one of the
environmental problems of this mode of transport appears to have been addressed in the
UN Convention on International Liability for Damage Caused by Space Objects, which
establishes absolute liability for damage due to space debris.24
10.4. International maritime transportShips are major sources of greenhouse gas emissions and other environmental pollution.
While the aviation and road transport sectors have come under heavy pressure to limit their
emissions, the shipping industry has thus far been spared; greenhouse gas emissions from
international shipping are not presently regulated by national, regional or international
regimes. The need to regulate bunker fuel emissions was recognised during early UNFCCC
negotiations, but no decision was made to allocate ship emissions to national totals.25
However, efforts to regulate maritime carbon emissions on a global scale are taking place at the
IMO, as provided for under Article 2.2 of the Kyoto Protocol.26 Sea transport is also responsible
for other environmental impacts such as sewage, invasive species, SOx/NOx pollution and
particulate matter.
The Convention on the Inter-Governmental Maritime Consultative Organization was
adopted by the United Nations Maritime Conference in Geneva, 6 March 1948. Although the
organisation changed its name to the International Maritime Organization (IMO) in 1982, it
retained the broad mandate to “provide machinery for co-operation among Governments in
the field of governmental regulation and practices relating to technical matters of all kinds
affecting shipping engaged in international trade”27 and “provide for the consideration by
the Organization of any matters concerning shipping and the effect of shipping on the
maritime environment that may be referred to it by any organ or specialised agency of the
United Nations.”28 Furthermore, the organisation serves as the specialised agency of the UN
in the field of shipping and the effect of shipping on the marine environment.29 This
mandate justifies the role assigned to the IMO under Article 2.2 of the Kyoto Protocol. To fulfil
GLOBALISATION, TRANSPORT AND THE ENVIRONMENT © OECD 2010 259
10. POLICY INSTRUMENTS TO LIMIT NEGATIVE ENVIRONMENTAL IMPACTS: INTERNATIONAL LAW
its mandate, the organisation can consider and make recommendations on matters remitted
to it, draft conventions, agreements or other instruments for consideration, and provide
machinery for consultation and the exchange of information.30 Membership in the
organisation is open to all states – it currently has 168 members and three associate
members (Hong Kong, China; Macau; Faroe Islands) – making it one of the most inclusive
routes to a global emissions scheme. In the UN Convention on the Law of the Sea, Article 192
(Part XII – Protection and Preservation of the Marine Environment), states agreed on general
obligations to protect and preserve the marine environment. These obligations mandate
states to jointly or individually take necessary measures to prevent, reduce and control
pollution of the marine environment from any source.31
Limits in international law
Multilateral initiatives
Developments in regulating maritime carbon emissions started at the IMO in 1997,
when it adopted a resolution requesting that the Marine Environment Protection
Committee (MEPC) consider the feasibility of CO2 reduction strategies for ships.32 The
language was strengthened and clarified in 2003 when the IMO passed Assembly
Resolution 963(23), which dictated that the Marine Environment Protection Committee
identify and develop the mechanism or mechanisms needed to achieve the limitation or
reduction of GHG emissions from international shipping. In doing so, MEPC must give
priority to the establishment of a CO2 baseline, develop a ship profile index and guidelines
for a CO2 emission indexing scheme, and evaluate technical, operational and market-based
solutions.33 Two years later, the MEPC approved a set of interim guidelines for voluntary
ship CO2 emission indexing on a trial basis that would allow ship owners to evaluate vessel
and fleet performance in regards to fuel efficiency and CO2 emissions.34 The following year,
MEPC 55 (October 2006) set out a work plan to have the CO2 baseline, CO2 emission
indexing scheme and technical, operational and market based solutions complete by MEPC
59 in July 2009.35
MEPC 57 (April 2008) considered follow-up actions to resolution A.963(23), including
progress made in line with the work plan adopted by MEPC 55 in 2006. One of the meeting’s
major contributions was the development of fundamental principles as a basis for future
regulation of shipping GHG emissions. In the MEPC’s view, a coherent and comprehensive
framework should be:
1. effective in contributing to the reduction of total global greenhouse gas emissions;
2. binding and equally applicable to all flag states in order to avoid evasion;36
3. cost effective;
4. able to limit, or at least, effectively minimise competitive distortion;
5. based on sustainable environmental development without penalising global trade and
growth;
6. based on a goal-based approach and not prescribe specific methods;
7. supportive of promoting and facilitating technical innovation and R&D in the entire
shipping sector;
8. accommodating to leading technologies in the field of energy efficiency; and
9. practical, transparent, fraud free and easy to administer.37
GLOBALISATION, TRANSPORT AND THE ENVIRONMENT © OECD 2010260
10. POLICY INSTRUMENTS TO LIMIT NEGATIVE ENVIRONMENTAL IMPACTS: INTERNATIONAL LAW
Given these considerations, the MEPC 57 Working Group on GHG Emissions from Ships
moved to consider short-term and longer-term measures for such a framework during an
inter-sessional meeting of the Working Group on GHG Emissions from Ships, held in Oslo,
23-27 June 2008. The Working Group was instructed to consider short- and long-term
measures brought up at MEPC 57,38 and:
1. Develop a mandatory CO2 design index for new ships and submit it to MEPC 58 for approval.
2. Review the existing CO2 operational index guidelines (MEPC/Circ.471) with a view to
finalisation at MEPC 58 and, in particular:
a) develop a methodology for a CO2 baseline in terms of efficiency; and
b) consider the purpose of the CO2 operational indexing scheme.
3. Further develop mechanisms with GHG reduction potential for international shipping with
a view to selecting the most promising measures for consideration at MEPC 58, inter alia:
a) global levy/cap and trade hybrid mechanism;
b) Emissions Trading Schemes (ETS) and/or Clean Development Mechanism(CDM); and
c) best practices on the range of measures as identified by MEPC 57 and how they can be
implemented by ship builders, operators, charterers, ports and other relevant partners
to make all possible efforts to reduce GHG emissions, with the aim of developing a
resolution as appropriate.
4. Consider the level of reductions that can be achieved, address the design, implementation,
cost benefit, capacity building and regulatory/legal aspects as well as the impacts for the
shipping industry, the flag and port states and other stakeholders as appropriate,
associated with each of these options.39
The Oslo inter-sessional meeting was meant to develop and finalise certain aspects of
a GHG emissions framework, but the process stalled because of the contentious issues at
hand. A draft CO2 Design Index was developed for submission to MEPC 58, but mandatory
application was questioned by “non-Annex I” nations, and those same nations did not
support the development or implementation of reduction mechanisms proposed by
Denmark (a global fuel levy) and the EU (an emissions trading scheme) (Lloyd’s Register,
2008, pp. 3-5). The issues were addressed again at MEPC 59 in July 2009. The outcome of
MEPC 59 (see www.imo.org) will be presented to the United Nations Conference on Climate
Change in Copenhagen in December 2009. Ultimately, a decision will have to be made as to
whether an emissions scheme will be pursued under the auspices of the IMO, or under the
UNFCCC.
Unilateral initiatives
Due to the failure to reach a consensus within the IMO, the European Commission is
likely to launch consultations on potential legislative proposals to amend the ETS to
include the maritime industry.40 The United States may also be forced by the courts into
adopting a unilateral solution – several US states and non-governmental organisations
have filed formal letters of intent to sue the EPA over its failure to regulate CO2 emissions
from ships and aircraft.41 These unilateral efforts may make international solutions to
shipping emissions more difficult to achieve, though the nature of the shipping industry
necessitates global action.
GLOBALISATION, TRANSPORT AND THE ENVIRONMENT © OECD 2010 261
10. POLICY INSTRUMENTS TO LIMIT NEGATIVE ENVIRONMENTAL IMPACTS: INTERNATIONAL LAW
Opportunities in international law
The regulation of shipping emissions represents a significant legal challenge as ships
operate largely outside of national boundaries. States have limited jurisdiction over
maritime emissions that occur outside their borders, especially when those emissions
happen on the high seas.42 But UNCLOS itself contains provisions on the protection and
preservation of the marine environment (Part XII). This mandates states to take jointly or
individually as appropriate, necessary measures to prevent, reduce and control pollution of
the marine environment from any source (Article 194 UNCLOS). Part XII provides states
with an opportunity to regulate the environmental impacts and while Article 211 UNCLOS
largely refers to IMO or other global initiatives, it also mandates flag states to adopt laws
and regulations for the prevention, reduction and control of pollution.
The international process for establishing new regulatory requirements is further
complicated by the complex relationships that exist between the flags of convenience and
the large shipping interests (ICCT, 2007). Specifically, 75% of the world’s merchant vessel
fleet is registered in non-Annex I Kyoto parties, yet is mostly owned by shipping interests
in Annex I countries.43 Political willpower is hard to come by due to the key role that
maritime transport plays in the global economy. Estimates suggest that 90% of the world’s
goods (by volume) are transported by sea. However, shipping is also the most efficient form
of transport and could play a key role in reducing worldwide GHG emissions if the right
actions are taken.
Port states generally have considerable freedom to impose requirements on ships
passing into their internal waters for docking, or to refuse permission to enter to ships not
meeting the requirements. Thus, although regulation on the high seas is legally
complicated, regulation could effectively be imposed at points of departure or arrival with
sufficient co-ordination of port state laws.44 Regulation from flag states also serves as an
opportunity to take responsibility for pollution caused by vessels, though as indicated, this
may depend on the political will of the flags of convenience, which may be concerned
about losing their comparative regulatory advantage over other potential flag states.
IMO’s Study of Greenhouse Gas Emissions from Ships (IMO, 2000) provided a comprehensive
evaluation of potential avenues for the reduction of shipping related GHG emissions. First, it
assessed international regulative measures related to maritime safety (SOLAS) and marine
environmental protection (MARPOL 73/78) to identify restraints to the potential for emissions
reduction from international shipping.45 Safety and environmental regulations that may
conflict with the objective of greenhouse gas emissions reduction include measures limiting
cargo carrying capacity (e.g. double-hulling), measures introducing additional energy
consumers (e.g. increase in onboard equipment), measures affecting general efficiency
(e.g. traffic routing) and miscellaneous measures (e.g. mandatory retention of slops,
reduction of NOx and SOx emissions, ballast water management, prohibiting Tributyltin in
antifouling paints).46
IMO (2000) also considered market-based approaches to emissions reductions, but
cautioned that a number of facts must be understood before attempting to seek an
effective solution:
● It is difficult to define the nation or territory where “generation” of sea transport services
takes place.
● It is also difficult to determine the country of ownership of a vessel, or who is the real
owner or responsible for its operation.
GLOBALISATION, TRANSPORT AND THE ENVIRONMENT © OECD 2010262
10. POLICY INSTRUMENTS TO LIMIT NEGATIVE ENVIRONMENTAL IMPACTS: INTERNATIONAL LAW
● The majority of the world’s bulk shipments either start or finish their journey in an
Annex I country.
● Bunker fuel is commonly sold to ship operators by dealers independent of the major oil
companies, making tax collection administratively difficult.
● Measures to reduce industry-wide emissions must be global in scope if they are to be
equitable and avoid “free-riders”, but some actions taken by Annex I countries may have
a significant impact on global emissions.
● The international shipping industry has a history of adopting solutions to common
safety and pollution problems through the adoption of global uniform standards.47
Market-based measures addressed by the study include environmental indexing, a
voluntary agreements programme, a carbon charge on bunker fuel, common emissions
standards and emissions trading.48 Its conclusions included:
● Carbon charges on bunker fuels are not a viable option, due to huge evasion possibilities.
● A voluntary agreements programme does not seem to be a very efficient policy tool for
international shipping. However, some reductions may be achieved by local agreements,
etc., or agreements between Annex I countries/IMO and ship owners, where Annex I
countries co-ordinate their efforts.
● Environmental indexing does not seem to be a very efficient tool to reduce emissions,
even if some reductions may be achieved on voluntary basis.
● Emission allowance trading, either along with other sectors in Annex I countries or as a
separate system outside the Annex I countries seems to be a non-viable option, due to
severe problems capturing emissions from the shipping industry.49
● Energy or emission efficiency standards seems to be a promising option, especially for
new vessels.
● Emissions credits sales, resulting from abatement measures on new ships and possibly also
existing ships, is also a very promising option, and could in the long run provide very strong
economic incentives for ship owners to reduce emissions through technical measures.50
In December 2007, the Centre for International Climate and Environmental Research
(CICERO) released a report building on the IMO’s study and examining five different schemes
for the regulation of carbon dioxide emissions from ships: a cap-and-trade scheme, a design
emission standard, an operational emission standard with fee, a charge (tax) on emissions
from ships, and a combined cap and charge scheme (CICERO, 2007). The schemes studied
were assessed for three kinds of efficiency: environmental efficiency, actually achieving
reductions in GHGs; cost efficiency, aiming to minimise the cost to society of the regulation;
and administrative efficiency, seeking as little use of resources to implement the regulation as
possible.51 The schemes included some market-based instruments, such as emissions taxes
and emissions trading, as well as some “command-and-control” instruments, such as
mandating emissions standards that ships must meet. Hybrid schemes were also
considered; for instance, a standard combined with a tax for not meeting the standard, or a
credit for operating at a higher level than the standard requires.
The report concluded that standards-based mechanisms are likely to be more
acceptable than a tax or a cap-and-trade system, but provide less incentive to reduce
emissions than market-based mechanisms. The combined cap-and-charge scheme was
GLOBALISATION, TRANSPORT AND THE ENVIRONMENT © OECD 2010 263
10. POLICY INSTRUMENTS TO LIMIT NEGATIVE ENVIRONMENTAL IMPACTS: INTERNATIONAL LAW
found to be a compromise position with medium performance both on acceptability and
incentive. The report noted a gap, though, between what is currently feasible and what is
ultimately desirable in regulating maritime GHG emissions.
SOx/NOx and sewage
Of course, greenhouse gases are not the only environmental concern posed by
international shipping. The major international legal instrument in the area, the International
Convention on the Prevention of Pollution from Ships (known as MARPOL 73/78),52 contains
rules on the emission of various polluting substances, including NOx and SOx. Annex VI of
MARPOL 73/78 sets up SOx emission control areas, which impose stricter limits on SOx
emissions in a geographical area. While the global limit for the sulphur content of fuel oil was
set after 20 years of debate at a relatively ineffectual 4.5%, within SECAs the limit is reduced to
1.5% (DieselNet, 2008). Following agreements at MEPC 57 and 58, these limits are both set to
progressively reduce over time.53 Ships can also use certain emission reduction techniques
(such as an exhaust gas cleaning system) instead of meeting the 1.5% sulphur content, as long
as SOx emissions are kept below 6 g SOx per kWh (DieselNet, 2008). There are currently two
SECAs in operation: one in the Baltic Sea and another in the North Sea/English Channel. Any
MARPOL Annex VI party can propose a new SECA, and the EU has indicated54 that it may seek
to have the Mediterranean Sea designated as a SECA. The US and Canada has also proposed a
SECA extending for 200 nautical miles from the entire North American coast, with an even
lower sulphur content requirement of 0.1% to be imposed.55 Compliance with and
enforcement of SECA limits may be a problem, though, under UNCLOS rules which give states
little jurisdiction over vessels outside their territorial waters. Although nations could report
foreign flag vessels that breach SECA limits to the flag state authority, there is no guarantee
that any action will be taken against the ship owner (Bunkerworld, 2008).
NOx is regulated in a similar fashion to SOx, with certain global limits in place and
stricter limits applying in NOx emission control areas. The global limits are set to decrease
over time to 2016, down to around 3 g NOx per kWh. These standards are expected to be
met through technological advancements and combustion process optimisation
(DieselNet, 2008).
Annex VI of MARPOL 73/78 also addresses ozone-depleting substances, including
halons and CFCs. Ozone-depleting substances are now banned on all ships, except for new
installations of hydro-CFCs which are permitted until 1 January 2020 (IMO, 2008).
Other environmental problems such as sewage have also been subject to regulation
under MARPOL 73/78.56 Annex IV (as reformed in 2004) prohibits old ships from discharging
sewage close to land and mandates port facilities for sewage treatment. It also requires new
ships to be equipped with sewage treatment facilities aboard or a special tank system. In
September 2008, these rules became binding. The IMO has also become a forum for debates
on the problem of invasive species carried mainly through ballast water. The International
Convention for the Control and Management of Ships’ Ballast Water and Sediments has been
negotiated under the auspices of the organisation. In November 2009, this Convention
required 12 more ratifications to enter into force.57 It contains the general obligation in
Article 2 to “undertake to give full and complete effect to the provisions of this Convention
and the annex thereto in order to prevent, minimize and ultimately eliminate the transfer of Harmful
Aquatic Organisms and Pathogens through the control and management of ships’ Ballast Water
and Sediments” (emphasis added).58
GLOBALISATION, TRANSPORT AND THE ENVIRONMENT © OECD 2010264

10. POLICY INSTRUMENTS TO LIMIT NEGATIVE ENVIRONMENTAL IMPACTS: INTERNATIONAL LAW
Regional seas agreements
Various regions of the world have adopted agreements designed to protect the regional
marine environment, and these agreements provide a further opportunity to regulate
maritime transport in those areas. The OSPAR Convention, signed in 1992 and entering into
force in 1998, sets out a strategy on (i.a.) the discharge and emission of hazardous substances
in the North-East Atlantic Ocean.59 The Convention strategy aims to achieve a near-zero
concentration of synthetic substances in the marine environment, and close to background
values for naturally occurring substances, by 2020. To that end, the OSPAR Commission
maintains a List of Chemicals for Priority Action, as well as a List of Substances of Possible Concern.
OSPAR’s “sister agreement”, the 1969 Bonn Agreement, establishes rules on surveillance of
the North Sea for pollution from shipping, and requires information-sharing, joint clean-up
operations, and research and development.60 Under the work of the Bonn Agreement, oil
slick pollution from marine transport has reduced by around 50% since 1990.61
The 1976 Convention for the Protection of the Marine Environment and the Coastal
Region of the Mediterranean contains a “Dumping Protocol”62 aimed at combating pollution
by dumping from ships and aircraft. Dumping of listed material is either outright prohibited,
or permitted with certain authorisations. The Protocol applies to all ships and aircraft
registered in a party’s territory or flying its flag. The 1981 Lima Convention for the Protection
of the Marine Environment and Coastal Area of the South-East Pacific commits its parties to
take all necessary measures to prevent, reduce and control pollution, particularly from
vessels.63 The 1983 Cartagena Convention includes similar obligations covering the wider
Caribbean region,64 while the 1985 Nairobi Convention covers the Indian Ocean adjacent to
the East African states,65 and the 2002 Antigua Convention (not yet in force) covers the
North-East Pacific.66 Such regional conventions provide important opportunities within
international law to regulate the pollution caused by international shipping.
Trade law
As mentioned above in the context of international air transport, trade law provides the
possibility of regulation for environmental purposes, under Article XX of GATT and Article XIV
of GATS. Since much international trade in goods, and some movement of people, occurs by
sea, the GATT/GATS exceptions present an opportunity for regulation under international law.
Domestic governments could, for instance, take measures restricting the delivery of goods
from ships that do not meet environmental standards on GHG, SOx or NOx emissions. Under
the terms of GATT/GATS, the governments would need to ensure that the measures taken do
not constitute arbitrary or unjustifiable discrimination between countries, nor a disguised
restriction on international trade. International trade law also does not override other
disciplines, so measures taken under GATT or GATS affecting maritime trade in goods must be
compliant with any other relevant laws (such as UNCLOS, MARPOL 73/78 or other IMO
conventions). Nevertheless, trade law does not necessarily represent as important a limit on
environmental regulation as it is occasionally made out to be, and indeed it could provide an
initial opportunity to frame protective measures.
WTO rules on subsidies, labelling and procurement all apply similarly in the present
context of marine transport as for air transport, discussed earlier. Thus, there may be scope
for domestic governments to encourage more environmentally friendly sea transport via
the use of carefully implemented subsidies, labelling of goods delivered by standards-
compliant vessels, or procurement preferences for cleaner shipping providers. However, as
noted, the exact scope of this opportunity to regulate remains uncertain within WTO law.
GLOBALISATION, TRANSPORT AND THE ENVIRONMENT © OECD 2010 265
10. POLICY INSTRUMENTS TO LIMIT NEGATIVE ENVIRONMENTAL IMPACTS: INTERNATIONAL LAW
Port states
Port state authority
UNCLOS affirms that “matters not regulated by this Convention continue to be governed
by the rules and principles of general international law”. As a result, new or separate
conventions may give states the authority to apply new international environmental policies
to vessels. Port states have a high degree of jurisdiction over visiting vessels, second only to
the flag state. This is because ports/internal waters are considered to be integral parts of a
nation’s territory. One way that port states have used this jurisdiction to overcome the pre-
eminence of the flag state is through regional memorandums of understanding (MOU). The
prime example is the Paris MOU on Port State Control. These MOUs derive their authority
from Articles 216, 218, 219, 220 and 226 of UNCLOS and require the parties to investigate a
certain percentage of ships a year for compliance with UNCLOS and applicable rules and
standards established through competent international organisations or general diplomatic
conference. If the release of a vessel following such an investigation would present an
unreasonable threat of damage to the marine environment, the ship can be detained for
repairs or required to proceed to the nearest appropriate repair yard (usually in a state with
lower costs).67
Ships in territorial waters
Sovereignty over the territorial sea is exercised subject to UNCLOS and to other rules
of international law.68 The primary constraint on state action is the right of innocent
passage.69 However, the right of innocent passage is limited in several ways. First, any act
of wilful and serious pollution contrary to UNCLOS rebuts the presumption of innocent
passage.70 Second, the coastal state can prescribe laws (in conformity with UNCLOS and
other rules of international law) regarding the preservation of the environment of the
coastal state and the prevention, reduction and control of pollution thereof.71 Where there
are clear grounds that the vessel has violated these laws, the coastal state may undertake
physical investigation of the vessel and may institute proceedings.72
The end port state may also undertake an investigation of the suspected vessel upon
request.73
The UNCLOS definition of pollution may limit or enhance the ability of states to
prescribe and enforce national laws under the Convention, as it only regulates pollution of
the marine environment. Specifically: “the introduction by man, directly or indirectly, of
substances or energy into the marine environment, including estuaries, which results or is
likely to result in… deleterious effects…”74 Although it was initially seen by the maritime
states as impeding coastal/port state excesses relating to enforcement, the Convention
subjects much of Part XII (Marine Pollution) to a binding dispute-settlement mechanism
under Part XV (ITLOS). This may present opportunities for vigorous enforcement if a state
is clearly within its rights. In conclusion, one can summarise: “The LOSC avoided
enumerating new standards for particular forms of pollution. Instead, it proclaims a
general regime of powers and duties which builds upon the codification and development
of existing and future pollution control conventions. Thus, the LOSC incorporates by
reference those existing as well as future instruments to be adopted under IMO auspices.
In this regard, the convention is riddled with terms of reference such as ‘applicable
international rules and standards’, ‘internationally-agreed rules’, ‘international rules’, and
‘generally accepted international rules and standards’. These rules of reference have the
GLOBALISATION, TRANSPORT AND THE ENVIRONMENT © OECD 2010266

10. POLICY INSTRUMENTS TO LIMIT NEGATIVE ENVIRONMENTAL IMPACTS: INTERNATIONAL LAW
advantage of automatically incorporating the technical standards set by IMO as these are
continuously adopted and amended to keep up with changing circumstances” (Khee-Jin
Tan, 2006, p. 195).
10.5. International land transport
Road transport
While international agreements such as the Kyoto Protocol clearly affect road transport
pollution via GHG emissions from vehicles, international law does not contain any specific
agreements or conventions relating to road transport pollution. Rather, it is generally
regulated at lower levels of government, such as the City of London’s Low Emission Zone.75
The main legal instruments to regulate road transport are the Convention on Road Traffic of
19 September 1949 and the Convention on Road Traffic of 8 November 1968. Both were
adopted within the UNECE, though as of May 2008, ratification had broadened considerably,
to 93 and 68 states respectively.76 These international road transport instruments contain
mainly security-related provisions (although recent amendments, introducing bike lanes,
could be seen as a way of regulating environmental questions). The UNECE lists as future
challenges for the transport sector, noting that in the foreseeable future, the transport sector
will continue to face the following main challenges: “a continuous increase in the
consumption of fossil fuels and related CO2 emissions, which will result in an increased
contribution to climate change; […] and old, unsafe and highly polluting road vehicle fleets,
particularly in eastern and South-eastern Europe, as well as in the Caucasus and central
Asia, which result in higher accident rates and environmental impacts.”77 However, besides
vehicle standards, no international agreements to address these challenges have yet been
adopted.
Recognising that 44% of its goods are moved by road, and that 84% of CO2 emissions
attributable to transport are due to road transport (European Commission, 2001), the EU has
made various proposals including harmonising driving times and fuel taxes, producing
uniform road transport legislation, and implementing “Euro” standards on NOx emissions
and particulate matter. The Euro VI standards would reduce NOx emissions by 80% (down to
0.4 g NOx per kWh) compared with Euro V standards, bringing the EU into closer alignment
with US vehicle standards by 2013 (European Commission, 2007). In addition, the “Greening
Transport Package” adopted in July 2008 provides a range of measures aimed at better road
transport efficiency, further internalisation of the costs of congestion and pollution, and
measures to address noise pollution (European Commission, 2008).
There is thus much opportunity for international law to address issues related to
international road transport pollution. Harmonisation of emissions-standards for new
vehicles is one area of potential that could support international trade in vehicles
themselves by removing the technical barrier of a multiplicity of standards, while also
serving to impose limits on NOx pollution and GHG emissions.
Rail transport
International rail transport has thus far only received international legislative attention
as to its feasibility, mostly on a regional basis. The Convention relative aux transports
internationaux ferroviaires78 concerns international carriage by rail. Its main aim is to
facilitate rail transport by train of passengers and goods. Some 42 states from Europe, North
Africa and the Middle East have ratified the Convention. It has adopted the Protocol of
GLOBALISATION, TRANSPORT AND THE ENVIRONMENT © OECD 2010 267
10. POLICY INSTRUMENTS TO LIMIT NEGATIVE ENVIRONMENTAL IMPACTS: INTERNATIONAL LAW
Vilnius in 1999, which entered into force in 2006, and which contained Regulation Concerning
the International Carriage of Dangerous Goods by Rail (RID – Appendix C to the Convention)
concerning dangerous goods transport.
The relevant industry organisation, the International Union of Railways (UIC), is also
studying the impact of rail transport on the environment with studies on for example
noise, diesel emission, energy efficiency, climate change and eco-procurement.79
10.6. Other international legal regimesThe negative environmental impacts of transport can arise not only from the emissions
by the transporting vehicle of harmful substances, such as GHGs, NOx or SOx, but also from
risks posed by the goods themselves being transported. International law thus provides
mechanisms to regulate the transport of hazardous goods in an effort to avoid negative
environmental impacts that might occur if the goods are inadequately prepared for
transport, or if an accident occurs as the goods are released. One major instrument in this
regard is the Rotterdam Convention, adopted in 1998 and entering into force in 2004.80 The
Convention, with 128 parties as of May 2009, establishes a prior informed consent (PIC)
procedure for the import of a wide range of hazardous chemicals. The procedure requires
parties to determine, for each chemical listed in Annex III of the Convention, whether they
will permit the transport of the chemical into or out of their territory. Information provision
is a key element of the Convention, and a Decision Guidance Document, with information on
the Annex III chemical and its effects, is distributed to all parties to assist their decision.
Where a decision is made to allow export or import of chemicals, all other parties must be
informed, and certain labelling requirements must be met. Exporting countries must ensure
that an export does not contravene the importing country’s decision under the PIC
procedure. New chemicals can be submitted for inclusion in Annex III by two parties from
two of the seven different geographical regions established by the Convention.
The Rotterdam Convention thus provides an opportunity to regulate the potentially
detrimental environmental impacts of both the transport and use of hazardous chemicals.
The UNFCCC also aims to regulate all GHG emissions and thus is in general also
applicable to emissions from global transport. However, the Kyoto Protocol only mentions
the transport sector as a general obligation of Annex I parties to adopt: “vii) Measures to
limit and/or reduce emissions of greenhouse gases not controlled by the Montreal Protocol
in the transport sector” [Article 2.1.a)vii)], and then mandates the IMO and the ICAO with
combating GHG emissions in their fields: “The Parties included in Annex I shall pursue
limitation or reduction of emissions of greenhouse gases not controlled by the Montreal
Protocol from aviation and marine bunker fuels, working through the International Civil
Aviation Organization and the International Maritime Organization, respectively”
(Article 2.2). It is not certain that a post-Kyoto agreement will task these organisations
again with GHG reduction efforts, since the success has been fairly limited.
10.7. ConclusionsPossibilities exist in both the IMO and the ICAO to find new ways of regulating and
reducing GHG emission. This could follow the (only partly successful) model of regulating
NOx and SOx and noise emissions from air and sea transport, while land transport remains
by comparison under-regulated in international law. Although international law in general
does not exclude the possibility of unilateral action, it strongly encourages multilateral
GLOBALISATION, TRANSPORT AND THE ENVIRONMENT © OECD 2010268
10. POLICY INSTRUMENTS TO LIMIT NEGATIVE ENVIRONMENTAL IMPACTS: INTERNATIONAL LAW
approaches. As detailed above, states have considerable freedom to regulate their own
vessels and set the rules applicable in their own territory, particularly if they adopt non-
discriminatory legislation.
Regional initiatives offer several successful models to debate, design and adopt
innovative rules which later can find their way into global regimes. As shown in the instance
of noise regulation for air transport, unilateral and/or regional approaches can serve as
triggers for international or global discussions and regulations. Particularly with regards to
climate change, this example could play an important role in the near future, when the EU
will apply its ETS unilaterally to international air and potentially even sea transport.
While the focus in the past has often been on security of international transport in
multilateral fora and instruments, a growing shift can be identified. States are moving
towards addressing the environmental challenges posed by increased international
transport. Two international organisations – the ICAO and the IMO – have been tasked with a
strong role to address climate change and other environmental challenges arising from
international transport. Further more detailed legal research is needed to identify existing
rules that might require changes, and to analyse the potential for new rules and
environmental instruments that could be likely to be adopted in these international regimes.
This chapter mentions only a few opportunities below the level of international laws.
However, on a practical level, it should be noted that many further innovative instruments
have potential as well. For instance, industry self-regulation and business associations
have a large potential to encourage and test new ways to address environmental impacts
from increased international transport.
Although international regimes on occasion act as constraints on governments’ abilities
to regulate activity that is harmful to the environment, the international law does provide
many opportunities to adopt new instruments to regulate environmental impacts from
increased international transport. Indeed, the global environment is waiting for
international law to fill the gap that will be left by the Kyoto Protocol’s effective end in 2012.
Notes
1. This chapter is an edited version of the paper Policy Instruments to Limit Negative Environmental Impactsfrom Increased International Transport: Constraints and Opportunities in International Law, written byMarkus W. Gehring of the Centre for International Sustainable Development Law, Montreal, Canada,for the OECD/ITF Global Forum on Transport and Environment in a Globalising World, held inGuadalajara, Mexico, 10-12 November 2008 (www.oecd.org/dataoecd/16/9/41579487.pdf).
2. Markus W. Gehring thanks and acknowledges Gareth Price, CISDL, and Jarrod Hepburn, CISDL, fortheir many contributions to the research, writing and editing, and also thanks Prof. Richard Janda,McGill Law Faculty and Prof. Marie-Claire Cordonier Segger, CISDL for their insights. He also thanksFrederic Perron-Welch for his excellent research assistance.
3. See www.icao.int/icao/en/env/aee.htm; Full report online, www.grida.no/climate/ipcc/aviation/index.htm.
4. Miake-Lye et al., 2000; CICERO, 2007, p. 21.
5. ICAO Council, 3 March 2005, Committee on Aviation Environmental Protection.
6. ICJ, Nicaragua Case (1986), p. 128. “The principle of respect for territorial sovereignty is also directlyinfringed by the unauthorised overflight of a state’s territory…”
7. Chicago Convention (1944), Article 33.
8. US/EU Air Transport Agreement (2007) at Article 15(2).
9. Shaw (2003), p. 854. See Vienna Convention on the Law of Treaties (1969), Article 60(1).
10. See http://eur-lex.europa.eu/LexUriServ/LexUriServ.do?uri=OJ:L:2009:008:0003:0021:EN:PDF.
GLOBALISATION, TRANSPORT AND THE ENVIRONMENT © OECD 2010 269
10. POLICY INSTRUMENTS TO LIMIT NEGATIVE ENVIRONMENTAL IMPACTS: INTERNATIONAL LAW
11. Convention on International Civil Aviation, 1944, 15 U.N.T.S 29, Article 38.
12. US v. Aluminium Co. of America (1945).
13. WTO, US – Gasoline (1996).
14. WTO, EC – Asbestos (2001).
15. SCM Agreement (1995), Parts II and III.
16. Articles I:1 and III:4.
17. Articles II:1 and XVII:1.
18. Article 2.2.
19. Decision 2/CP.3 of the Conference of the Parties under the UNFCCC.
20. Australia Space Activity Act (2002). Australia, however, in a note to the Secretariat of the UN GeneralAssembly Committee on the Peaceful Uses of Outer Space, stated that, despite the Act’s amendments,there remained no definition of “outer space” in Australian domestic law.
21. ITU, Bogota Declaration (1977).
22. www.virgingalactic.com.
23. Virgin Galactic’s space access system claims to be “radically different” and will use much less thanthis figure.
24. See UN Office for Outer Space Affairs, www.unoosa.org/pdf/publications/STSPACE11E.pdf
25. Refer to UNFCCC INC 2 Decision 9/2, COP Decision 4/CP.1, COP Decision 2/CP.3, referenced in IISDreport of Norwegian non-UNFCCC Technical Workshop on Emissions from Aviation and MaritimeTransport at www.iisd.ca/YMB/SDOSL/.
26. Article 2.2: “The Parties included in Annex I shall pursue limitation or reduction of emissions ofgreenhouse gases not controlled by the Montreal Protocol from aviation and marine bunker fuels,working through the International Civil Aviation Organization and the International MaritimeOrganization, respectively.”
27. Convention on the International Maritime Organization, Article 1(a).
28. Ibid., Article 1(d).
29. Ibid., Article 59.
30. Ibid., Article 2.
31. United Nations Convention on the Law of the Seas (UNCLOS), available at www.un.org/Depts/los/convention_agreements/texts/unclos/closindx.htm.
32. COP (1997) MARPOL 73/78, Resolution 8.
33. IMO Resolution A.963(23), IMO Policies and Practices Related to the Reduction of Greenhouse GasEmissions from Ships (2003), s. 1.
34. IMO, MEPC/Circ. 471, 29 July 2005.
35. IMO, MEPC 55/23, Annex 9.
36. This point was highly contested by developing nations (Brazil, China, India, Saudi Arabia, SouthAfrica and Venezuela) based on common but differentiated responsibilities. See MEPC 57/WP.8, 2.2.
37. See MEPC 57/WP.8, Report of the Working Group on GHG Emissions from Ships, 2.1.
38. See MEPC 57/WP.8, Annex 1 for a list of short- and long-term measures proposed.
39. Draft TOR for the meeting, MEPC 57/WP.8, Annex 3.
40. www.reuters.com/article/environmentNews/idUSL1639411220070416.
41. www.earthjustice.org/news/press/2008/earthjustice-will-sue-epa-to-reduce-global-warming-pollution-from-ships-and-aircraft.html.
42. Consider the following UNCLOS provisions: Article 45 – Innocent Passage, Article 87 – Freedom ofthe High Seas, Article 91 – Nationality of Ships, Article 92 – Status of Ships, Article 94 – Duties ofthe Flag State.
43. Eivind Vagslid, IMO, in IISD (2007).
GLOBALISATION, TRANSPORT AND THE ENVIRONMENT © OECD 2010270

10. POLICY INSTRUMENTS TO LIMIT NEGATIVE ENVIRONMENTAL IMPACTS: INTERNATIONAL LAW
44. CICERO (2007), p. 12, and CE Delft et al. (2006), p. 246.
45. IMO (2000), p. 136.
46. IMO (2000), pp. 141-147.
47. IMO (2000), p. 149.
48. See IMO (2000), pp. 150-162 for an in-depth discussion of each possibility.
49. Kågeson (2009) presents an opposing view.
50. IMO (2000), p. 168.
51. CICERO (2007), p. 1.
52. See www.imo.org/Conventions/contents.asp?doc_id=678&topic_id=258.
53. See www.imo.org/Newsroom/mainframe.asp?topic_id=1709&doc_id=10262.
54. See http://safemedproject.org/filebank/documents/task37O/Consolidated_Final_Report_(E).pdf.
55. See www.epa.gov/oms/regs/nonroad/marine/ci/420f09015.htm. The proposal was approved at MEPC 59,13-17 July 2009.
56. MARPOL 73/78, Annex IV: Prevention of pollution by sewage from ships.
57. IMO, Status of Ratification of IMO Conventions: www.imo.org/Conventions/mainframe.asp?topic_id=247.
58. See TEMATEA for more information on invasive species and related conventions: www.tematea.org.
59. www.ospar.org.
60. www.bonnagreement.org.
61. www.bonnagreement.org/eng/html/Briefing_document/Briefing%20document.htm.
62. The Protocol for the Prevention and Elimination of Pollution of the Mediterranean Sea by Dumpingfrom Ships and Aircraft.
63. Articles 3 and 4.
64. Convention for the Protection and Development of the Marine Environment of the WiderCaribbean Region, Articles 4, 5 and 6.
65. Convention for the Protection, Management and Development of the Marine and CoastalEnvironment of the Eastern African Region, Articles 4, 5 and 6.
66. Convention for Cooperation in the Protection and Sustainable Development of the Marine andCoastal Environment of the North-East Pacific, Articles 5 and 6.
67. UNCLOS, Article 226.1(c).
68. UNCLOS, Article 2.3.
69. UNCLOS, Article 17. Remember that a distinction exists between coastal states and port states.
70. UNCLOS, Article 19.2(h).
71. UNCLOS, Article 21.1(f).
72. UNCLOS, Article 220.2.
73. UNCLOS, Article 218.3.
74. UNCLOS, Article 1.1(4).
75. www.london.gov.uk/mayor/environment/air_quality/lez.jsp.
76. See UNECE Transport Division, www.unece.org/trans/conventn/legalinst.html.
77. UNECE Transport Division, www.unece.org/trans/presentTransDiv.html.
78. See Intergovernmental Organisation for International Carriage by Rail, www.otif.org.
79. See www.uic.asso.fr/environnement/spip.php?page=sommaire.
80. Rotterdam Convention Secretariat, www.pic.int.
GLOBALISATION, TRANSPORT AND THE ENVIRONMENT © OECD 2010 271

10. POLICY INSTRUMENTS TO LIMIT NEGATIVE ENVIRONMENTAL IMPACTS: INTERNATIONAL LAW
References
Treaty Law
Convention on International Civil Aviation, 1944, 15 UNTS 29 (Chicago Convention).
General Agreement on Tariffs and Trade 30 October 1947, 55 UNTS 194, CTS, No. 31 (1948) (provisionallyentered into force 1 January 1948) (GATT).
Convention on the Prevention of Marine Pollution by Dumping of Wastes and Other Matter,13 November 1972, 1046 UNTS 120, 11 ILM 1294.
International Convention for the Prevention of Pollution from Ships (MARPOL), 2 November 1973, IMODoc. MP/CONF/WP.35, 12 ILM 1319.
United Nations Convention on the Law of the Sea, 10 December 1982, 1833 UNTS 3, 21 ILM 1245(entered into force 16 November 1994) (UNCLOS).
US/EU Air Transport Agreement (2007), OJ L 134/13.
Vienna Convention on the Law of Treaties (1969), 1155 UNTS 331, 8 ILM 679.
WTO Agreement on Subsidies and Countervailing Measures (SCM Agreement) (1995).
Cases
ICJ (1986), Case Concerning Military and Paramilitary Activities in and Against Nicaragua, Nicaragua v.,United States, ICJ Rep 14 at 128.
US Court of Appeals (2nd Cir) (1945), US v. Aluminium Co. of America (1945).148 F.2d 443.
WTO (2001), European Communities – Measures Affecting Asbestos and Asbestos-ContainingProducts, WT/DS135/AB/R.
WTO (1996), United States – Standards for Reformulated and Conventional Gasoline, WT/DS2/AB/R.
Literature
Abeyratne, R. (1996), Legal and Regulatory Issues in International Aviation, Transnational Publishers, New York.
Bunkerworld (2008), “Where is Emission Legislation Going?”, Bunkerworld, January/February, availableat www.bunkerworld.com/news/magazine_features/2008/01/2008-01-C.pdf.
Centre for Clean Air Policy (2004), “Bunker Fuels: Summary and Options”, Dialogue on Future InternationalActions to Address Global Climate Change, 16-19 May, www.ccap.org/docs/resources/201/Bunker_Fuels-Summary_and_Options_Schmidt.pdf.
CICERO (2007), Climate Regulation of Ships, Center for International Climate and EnvironmentalResearch, Oslo, available at www.cicero.uio.no/media/5852.pdf.
CE Delft et al. (2006), Greenhouse Gas Emissions for Shipping and Implementation Guidance for the Marine Fuelsulphur Directive, Study commissioned by the European Commission, available at http://ec.europa.eu/environment/air/pdf/transport/final_report.pdf.
Delft, O. et al. (2005), Giving Wings to Emissions Trading, Report for the European Commission, availableat www.eel.nl/documents/aviation_et_study.pdf.
DieselNet (2008), Emissions Standards: International: IMO Marine Engine Regulations, available atwww.dieselnet.com/standards/inter/imo.php.
European Commission (EC) (2001), EU Council 2 374th Meeting, 15-16 October minutes, EuropeanCouncil, Brussels, available at www.consilium.europa.eu/cms3_fo/showPage.asp?id=339&lang=en.
EC (1999), Communication from the Commission on progress made in the negotiations with theUnited States on a new generation noise standard for subsonic civil jet aeroplanes, available athttp://aei.pitt.edu/3552/01/000701_1.pdf.
EC (2001), White Paper: European Transport Policy for 2010, European Commission, Brussels, available athttp://europa.eu/scadplus/leg/en/lvb/l24007.htm.
EC (2004), Current International Shipping Market Trends – Community Maritime Policy Priorities and LegislativeInitiatives, OECD Workshop on Maritime Transport, Paris, 4-5 November.
GLOBALISATION, TRANSPORT AND THE ENVIRONMENT © OECD 2010272
10. POLICY INSTRUMENTS TO LIMIT NEGATIVE ENVIRONMENTAL IMPACTS: INTERNATIONAL LAW
EC (2007), Cleaner Trucks and Buses: Tighter Limits for Nitrogen Oxides and Particulate Matter (Euro VI),Press release from the European Commission, available at http://europa.eu/rapid/pressReleasesAction.do?reference=IP/07/1989&format=HTML&aged=0&language=EN&guiLanguage=en.
EC (2008), Greening Transport: New Commission Package to Drive the Market Towards Sustainability,Press release from the European Commission, available at http://europa.eu/rapid/pressReleasesAction.do?reference=IP/08/1119&format=HTML&aged=0&language=EN&guiLanguage=en.
Eyring, V. et al. (2005), “Emissions from International Shipping: 2. Impact of Future Technologies onScenarios until 2050”, Journal of Geophysical Research, Vol. 110, D17306, doi: http://dx.doi.org/10.1029/2004JD005620.
Fischer, J. (2000), Aircraft Hushkits: Noise and International Trade, National Library for the Environment,Library of Congress, http://digital.library.unt.edu/govdocs/crs/permalink/meta-crs-1341:1.
Fleming, G. (2007), Modelling Aviation Emissions on a Local and Global Scale, ICAO Colloquium on AviationEmissions, 15 May, www.icao.int/EnvClq/CLQ07/Presentations/fleming.pdf.
Fleuti, E. and J. Polymris (2004), Aircratf NOx within the operational LTO cycle, UNIQUE (Flughafen ZurichAG) and Swiss Flight Data Services, www.aero-net.org.
ICCT (2007), Air Pollution and Greenhouse Gas Emissions from Ocean-going Ships: Impacts, Mitigation Optionsand Opportunities for Managing Growth, The International Council on Clean Transportation, availableat www.theicct.org/documents/MarineES_Final_Web.pdf.
IISD (2007), Technical Workshop on Bunker Fuel Emissions Bulletin, Vol. 146, No. 1, Monday 8 October,International Institute for Sustainable Development, available at www.iisd.ca/download/pdf/sd/ymbvol146num1e.pdf.
IMO (2000), Study of Greenhouse Gas Emissions from Ships, Issue No. 2. International MaritimeOrganization, available at http://unfccc.int/files/methods_and_science/emissions_from_intl_transport/application/pdf/imoghgmain.pdf
IMO (2008), Prevention of Air Pollution from Ships, website of the International Maritime Organization,www.imo.org/Environment/mainframe.asp?topic_id=233.
ITU (1976), Bogota Declaration, ITU Doc. WARC-155 (1977) 91-E.
Jakhu, R. (2007), “Legal Issues of Satellite Telecommunications, the Geostationary Orbit and SpaceDebris”, Astropolitics, Vol. 5, Issue 2, pp. 173-208.
Kågeson, Per (2009), Making International Transport Pay its Climate Bill, Paper prepared for the Workshopon Environmental Impacts of International Transport, International Transport Forum, Leipzig, May,available at www.internationaltransportforum.org/2009/workshops/pdf/ws5-Kageson.pdf.
Khee-Jin Tan, Alan (2006), Vessel-Source Marine Pollution: The Law and Politics of International Regulation,Cambridge University Press.
Knoor, A. and A. Arndt (2002), Noise Wars: The EU’s Hushkit Regulation, Environmental Protection or “Eco’-Protectionism”?, University of Bremen, available at www.iwim.uni-bremen.de/publikationen/pdf/w023.pdf.
Kraemer, R.A., F. Hinterberger and R. Tarasofsky (2007), What Contribution Can Trade Policy Make TowardsCombating Climate Change?, Study requested by the European Parliament’s Committee on InternationalTrade, available at www.ecologic.de/download/projekte/250-299/270-03/270-03_final_report.pdf.
Lloyd’s Register (2008), Report of the First Intersessional Meeting of the Working Group on GHGEmissions from Ships, Lloyd’s Register, available at www.lr.org/NR/rdonlyres/4F86EC70-FAC1-41D5-89AF-8E20AB3D0C3D/81717/LRIMO1stGHGIntersessionalWorkingGroupReport1.pdf.
Mendes de Leon, P. (2002), “The Dynamics of Sovereignty and Jurisdiction in International Aviation Law”,in G. Kreijen (ed.), State, Sovereignty and International Governance, Oxford University Press, Oxford.
McCrudden, C. (2008), Buying Social Justice, Oxford University Press, Oxford.
Miake-Lye, R. et al. (2000), Aviation and the Changing Climate, Aerospace America, September, SpecialReport of the Intergovernmental Panel on Climate Change, www.aiaa.org/aerospace/Article.cfm?issuetocid=14&ArchiveIssueID=5>.
Milde, M. (1998), “Problems of Safety Oversight: Enforcement of ICAO Standards”, in Chia-Jui Cheng(ed.) (1998), The Use of Air and Outer Space: Cooperation and Competition, Kluwer Law International,Boston.
GLOBALISATION, TRANSPORT AND THE ENVIRONMENT © OECD 2010 273
10. POLICY INSTRUMENTS TO LIMIT NEGATIVE ENVIRONMENTAL IMPACTS: INTERNATIONAL LAW
Minnis et al. (2004), “Contrails, Cirrus Trends, and Climate”, Journal of Climate, Vol. 17, p. 1671,www.pm.larc.nasa.gov/sass/pub/journals/Minnis.etal.JClim.04.pdf.
Morell, P. (2007), “An Evaluation of Possible EU Air Transport Emissions Trading Scheme AllocationMethods”, Energy Policy, Vol. 35, Issue 11.
R.C.N. Wit et al. (2005), Giving Wings to Emissions Trading: Inclusion of Aviation under the European EmissionsTrading System (ETS): Design and Impacts, Report for the European Commission, Delft, Director Generalof the Environment, available at http://ec.europa.eu/environment/climat/pdf/aviation_et_study.pdf.
Shaw, M. (2003), International Law, 5th edition, Cambridge University Press, Cambridge.
United States Department of State (2000), Memorial of the United States of America: Disagreement Arisingunder the Convention on International Civil Aviation Done at Chicago on December 7, 1944, before theCouncil of the International Civil Aviation Organization (ICAO) under the ICAO Rules for theSettlement of Differences (DOC. 778/2), Washington DC.
van Velzen, A. and R.C.N. Wit (2000), National Allocation of International Aviation and Marine CO2 Emissions,Study commissioned by the Dutch Civil Aviation Authority, available at www.ce.nl/pdf/00_7568_35.pdf.
WTO (2000), Information Relevant to the Consideration of the Market Access Effects of Eco-Labelling Schemes,WTO Committee on Trade and Environment, WT/CTE/W/150, WTO, Geneva.
WTO (2008), World Trade Report 2008 – Trade in a Globalising World, WTO, Geneva.
GLOBALISATION, TRANSPORT AND THE ENVIRONMENT © OECD 2010274

OECD PUBLISHING, 2, rue André-Pascal, 75775 PARIS CEDEX 16
PRINTED IN FRANCE
(97 2010 02 1 P) ISBN 978-92-64-07919-9 – No. 56939 2010

www.oecd.org/publishing
ISBN 978-92-64-07919-9 97 2010 02 1 P -:HSTCQE=U\^V^^:
Globalisation, Transport and the EnvironmentWhat impact has globalisation had on transport? And what have been the consequences for the environment? This book aims to answer these questions and more. It looks in detail at how globalisation has affected activity levels in maritime shipping, aviation, and road and rail freight, and assesses the impact that changes in activity levels have had on the environment. The book also discusses policy instruments that can be used to address negative environmental impacts, both from an economic perspective and from the point of view of international law.
Related reading
Environmental Outlook to 2030 (2008)
The Economics of Climate Change Mitigation: Policies and Options for Global Action beyond 2012 (2009)
The full text of this book is available on line via these links: www.sourceoecd.org/environment/9789264079199 www.sourceoecd.org/transport/9789264079199
Those with access to all OECD books on line should use this link: www.sourceoecd.org/9789264079199
SourceOECD is the OECD online library of books, periodicals and statistical databases. For more information about this award-winning service and free trials, ask your librarian, or write to us at [email protected].
GLOBALISATION
environment transport
TRANSPORT ENVIRONMENT
transport globalisation environment
ENVIRONMENT GLOBALISATION TRANSPORT
globalisation environment transport globalisation environment transport
GLOBALISATION TRANSPORT ENVIRONMENT GLOBALISATION TRANSPORT ENV
environment transport globalisation environment transport globalisation environment transport globalisation
TRANSPORT ENVIRONMENT GLOBALISATION TRANSPORT ENVIRONMENT GLOBALISATION TRANSPORT ENVIRONMENT GLOB
transport globalisation environment transport globalisation environment transport globalisation environment transport globalisation enviro
ENVIRONMENT GLOBALISATION TRANSPORT ENVIRONMENT GLOBALISATION TRANSPORT ENVIRONMENT GLOBALISATION TRA
globalisation environment transport globalisation environment transport globalisation environment transport globalisation environment trans
GLOBALISATION TRANSPORT ENVIRONMENT GLOBALISATION TRANSPORT ENVIRONMENT GLOBALISATION TRANSPORT ENVI
environment transport globalisation environment transport transport globalisation environment transport globalisation environment transpo
TRANSPORT ENVIRONMENT GLOBALISATION TRANSPORT ENVIRONMENT GLOBALISATION TRANSPORT ENVIRONMENT GLOBA
globalisation environment transport globalisation environment transport globalisation environment transport globalisation environment trans
ENVIRONMENT GLOBALISATION TRANSPORT ENVIRONMENT GLOBALISATION TRANSPORT ENVIRONMENT GLOBALISATION TRA
environment transport globalisation environment transport globalisation environment transport globalisation environment transport globalisa
GLOBALISATION TRANSPORT ENVIRONMENT GLOBALISATION TRANSPORT ENVIRONMENT GLOBALISATION TRANSPORT ENVIR
transport globalisation environment transport globalisation environment transport globalisation environment transport globalisation environm
TRANSPORT ENVIRONMENT GLOBALISATION TRANSPORT ENVIRONMENT GLOBALISATION TRANSPORT ENVIRONMENT GLOBA
globalisation environment transport globalisation environment transport globalisation environment transport globalisation environment trans
ENVIRONMENT GLOBALISATION TRANSPORT ENVIRONMENT GLOBALISATION TRANSPORT ENVIRONMENT GL
environment transport globalisation environment transport globalisation environment transport globalis
GLOBALISATION TRANSPORT ENVIRONMENT GLOBALISATION TRANSPORT E
transport globalisation environment transport globalisation enviroi
TRANSPORT ENVIRONMENT GLOBALISATIO
globalisation environment tran
Globalisation, Transport and the Environment
Glo
balisatio
n, Transpo
rt and the E
nvironm
ent