globalisation and indian agriculture: performance...
TRANSCRIPT
28
GLOBALISATION AND INDIAN AGRICULTURE: PERFORMANCE UNDER A NEW PARADIGM
R.S.Deshpande1 and M. Indira2
1. INTRODUCTION Indian agriculture has undergone various phases of growth and development during
the last five decades. The experience so far indicates a few bright spots as well as
phases of stagnation marked by breaks in the process of development. Major
impediments faced by Indian agriculture at the time of independence included food
insecurity, constraints on resource availability, ill distribution of resources, primitive
technology and regional imbalances (Dantwala, 1996). We have been partially
successful in overcoming a few of these impediments and today India can pose as
one of the food secure nations albeit in arithmetic sense (Acharya, 2002). And
during the five decades we have also followed a riverine process of development and
altered the model of development several times in response to the worldwide trends.
The phase of globalisation is one such step that has been ushered in as a new mode
of development. Therefore, we have more questions to be answered and issues to
be discusses than before.
The travelogue of any development process begins with resource augmentation,
productivity enhancement, employment generation, distribution and finally value
addition. We have been able to work partially on the impediments faced by the
Indian agriculture and now we are at the cross-road of getting into global market as a
predominant player (Bhalla,1995, Ahluwalia,1996). India has achieved an important
position among the producers of many commodities as well as it provides a large
market for the purpose of other international players to participate in. There are a
few questions that crop up at this juncture and these relate to the structure of internal
and external markets with India’s response to it (WTO, 1998). The domestic market
governance naturally comes as the first issue to be debated and to understand
India’s preparedness for facing the challenge of globalization in this context.
Hitherto, we have always been making our presence in international markets in
response to the residual surplus. It is time now to cultivate a culture of producing for
the sake of the international market and marking the presence in the process. It is
easily said than done. Our markets as well as farmers will have to be equipped with
1 Professor, ISEC, Bangalore
2Reader in Economics, University of Mysore, Mysore

29
infrastructure, information along with a full reform package. This paper discusses
three important issues viz., (i) the pre-setting of globalization and issues pertaining to
governance in agricultural sector during nineties; (ii) the process of globalization and
the impediments in the domestic as well as world market; and (iii) steps needed in
order to participate in the process of globalization through development governance
and reforms in allied sectors.
2. PRE-SETTING
Macro-economic crisis of early nineties was the beginning of the process of
calibrating trade globalisation in the economy and agriculture was no exception. Even
though, the basic current emerged actually during mid eighties, it could acquire a
visible drive only by early nineties (Sen, 2000, Rao, 2001). As is well known, the
crisis began when the foreign exchange reserves touched a critical bottom level,
adverse balance of payment condition was evident and a near debt trap situation
became imminent. (Joshi and Little, 1996). An alternate view is about the very
necessity of getting into the structural adjustments itself (Ghosh, 1997). If one looks
carefully at the data on National Accounts Statistics, it is quite visible that the trigger
of the situation leading to the crisis was located in the expansion of non-agricultural
sectors during mid-eighties beginning with the historical budget presented by the
then Finance Minister. The performance of the agricultural sector during that period
was certainly impressive and contributed significantly to the national growth,
agricultural exports were also increasing. However, balance of payment was
absolutely in precarious condition and it was felt that the situation was beyond the
capacity of the economy to rescue, leading to the launch of structural adjustment
programme and globalisation was an unavoidable outcome of the process.
Globalisation means integration of the economy with the rest of the world. The
process of integration is facilitated by flow of information, technologies, goods and
services, finance, capital and people. Report of the World Commission on social
dimension of globalisation observed that the key characteristics of globalisation
include: Liberalisation of trade; Cross-border financial flows and Increased
competition in global markets. According to the report, it has come about due to
deliberate policy decisions for free trade and the emergence of information and
communication technology. The essential feature of globalisation is connectivity that
is facilitated by information technology revolution. This reduced the cost of
communication drastically. Globalisation has several dimensions like social, cultural
and economic and these impinge on welfare across sectors (Parikh et al, 1996).

30
The new paradigm of global economy is based on the theory that free trade among
countries leads to efficient allocation of resources enhances productivity and social
welfare. Under this paradigm, a country’s development need not be constrained by
insufficient capital resource, if it has potential. Inflow of foreign capital helps
development. For example, inflow of foreign capital to Malaysia was 17.4per cent of
its GDP during 1993 and 12.7per cent in Thailand during 1995. Rapid development
of capital market is an essential feature of globalisation, which facilitates easy flow of
movement of funds. However, too much dependence on foreign capital that is volatile
under free global markets carries the risk of withdrawal at any moment.
Following the crisis the state of affairs was handled carefully with a battery of macro-
economic tools that included liberalisation of foreign trade, devaluation of the
currency and other steps in domestic macro-economic policy management (Singh,
1995). This period incidentally coincided with a few major changes in the arena of
international trade, heralding the establishment of World Trade Organisation (WTO)
and removal of non-tariff trade barriers. India being one among the founder members
of GATT, agreed to abide by the set of regulations given under the various
agreements of WTO. The macro-economic situation in the country was also
undergoing a rapid transition along with significant changes in trade scenario, in this
process the agricultural sector, sheer by its significance in the economy, became an
important player. Naturally growth trends in agricultural sector and the domestic
market conditions emerged as the initial issues to signify the frontal impact of
globalisation (Rao, 2001).
India’s agricultural sector cannot be compared with that of many countries
significantly participating in the international trade. Among the major constraints
faced by the sector prominent is the lowest average size of holdings as a base for
production. About 80 million small and marginal farmers inhabit the sector with only a
small proportion of farmers generating sizeable marketable surplus. Market
conditions in factor as well as product markets are far from satisfactory; and finally
India never had a sustained presence in the international trade to participate pro-
actively in the process of globalisation. These overt constraints provoked the use of
terminology like ‘level playing field’ while analysing comparative performance of India
vis a vis its trading partners. It is quite clear that the production as well as domestic
and international trade environment in India is not comparable to many of its
competitors but finally that needs to be achieved in the process. Therefore, the

31
significant question crops up whether agriculture will stand at the receiving end? How
this should be avoided, is a major policy issue to wrestle with.
3. AGRICULTURE AND GLOBALISATION
Over the last five decades, Indian agricultural sector performed under various
constraints. The exemplary performance during late sixties, mid seventies and early
eighties helped to overcome the problem of aggregate food insecurity. The
performance of the last two years of eighties was a landmark and that was not
exceeded in the following decade (See Figure 1). It is argued that the annual growth
of agriculture GDPs shows a declining trend in the post-reform period. While it has
grown at an annual rate of 3.4 percent during 1980s, it registered only 1.8 percent
growth between 1997-98 and 2000-02. Growth rate was 4.7 percent between 1992-
93 and 1997-98. Similarly, it is also argued that there is a decline in area, production
and productivity of all crops. While area under all crops has shown a marginal
increase in growth rate during 1990s, production and yield have shown a decreasing
trend. But as can be seen from figure 1, that the decade of nineties has recorded
positive growth in GDP in most of the years except for a few years, but while
comparing the aggregate growth analysts tend to conclude with a bad performance
during nineties. Probably the peak achieved at the end point in the decade of eighties
leads to such a conclusion. One point however is quite clear that the performance
during eighties of the agriculture sector was quite supportive.
The growth rates seen from the table 1 indicate that the long-term performance of the
sector is quite satisfactory, though not exemplary. But the growth rates mask a lot
than they reveal. What is important to note here is that the growth during recent past
as well as during the last three decades has come from the technological inputs.
Globalisation may further usher in new technological opportunities. A comparison of
the growth rates in the two decades of eighties and nineties can be quite deceptive
and therefore we have resorted to view the trends over the entire period. Figures 2
and 3 present this picture.

32
Figure 3.1: Growth in GDP originating from Agriculture
Table 3.1: Growth Performance Over Five Decades: 1949-50 to 2001-02
Crops 1949-50 to 1964-65 1967-68 to 2001-02
Area Prod Yield Area Prod Yield
Rice 1.21 3.50 2.25 0.62 2.78 2.20
Wheat 2.69 3.98 1.27 1.38 4.34 2.92
Coarse Cereals
0.90 2.25 1.23 -1.44 0.54 1.90
Cereals 1.25 3.21 1.77 -0.02 2.77 2.32
Pulses 1.72 1.41 -0.18 0.30 0.81 0.74
Food Grains 1.35 2.82 1.36 0.01 2.51 2.12
Oilseeds 2.07 3.20 0.30 1.31 3.32 1.60
Non Food grains
2.44 3.74 0.89 1.36 3.20 1.68
All Crops 1.58 3.15 1.21 0.34 2.78 1.90
Source: GoI (2003). Agricultural Statistics at a Glance, 2003.
Figure 3.2: Growth in the Index Numbers of All Crop Productivity
Annual Growth Rate of GDP at Factor Cost in Agriculture
-15
-10
-5
0
5
10
15
20
1951
-52
1953
-54
1955
-56
1957
-58
1959
-60
1961
-62
1963
-64
1965
-66
1967
-68
1969
-70
1971
-72
1973
-74
1975
-76
1977
-78
1979
-80
1981
-82
1983
-84
1985
-86
1987
-88
1989
-90
1991
-92
1993
-94
1995
-96
1997
-98
1999
-00
2001
-02
Per
Cen
t
33
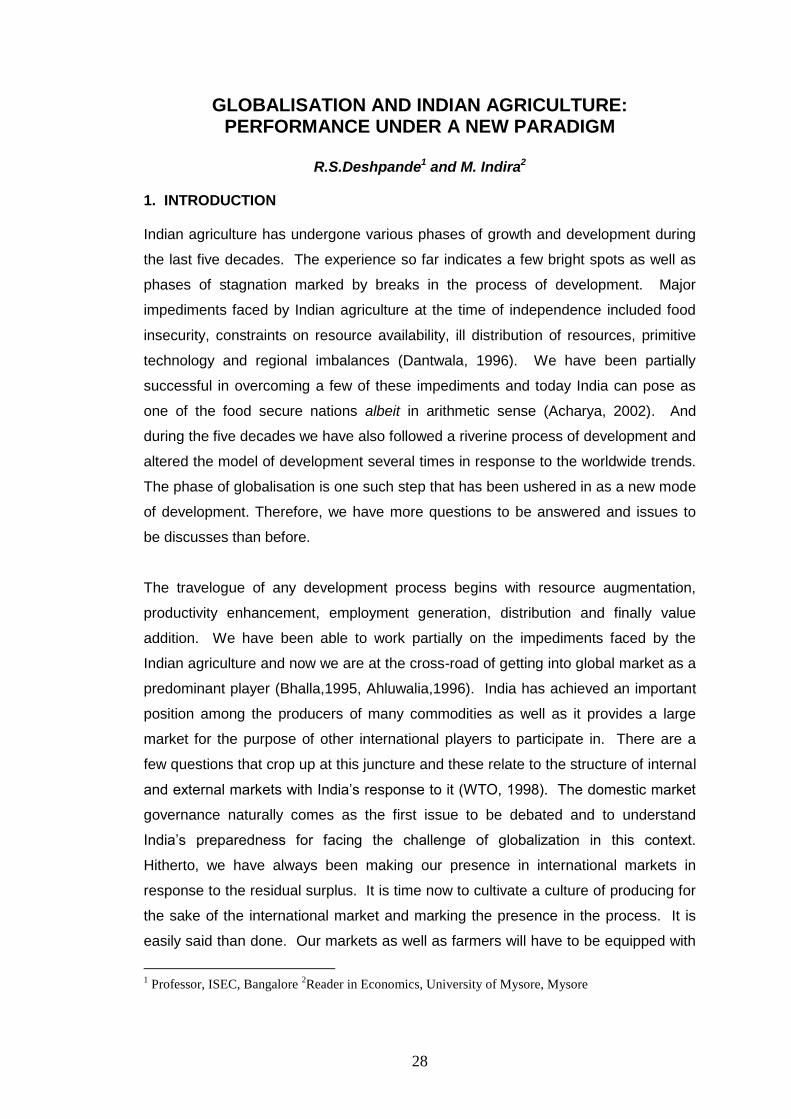
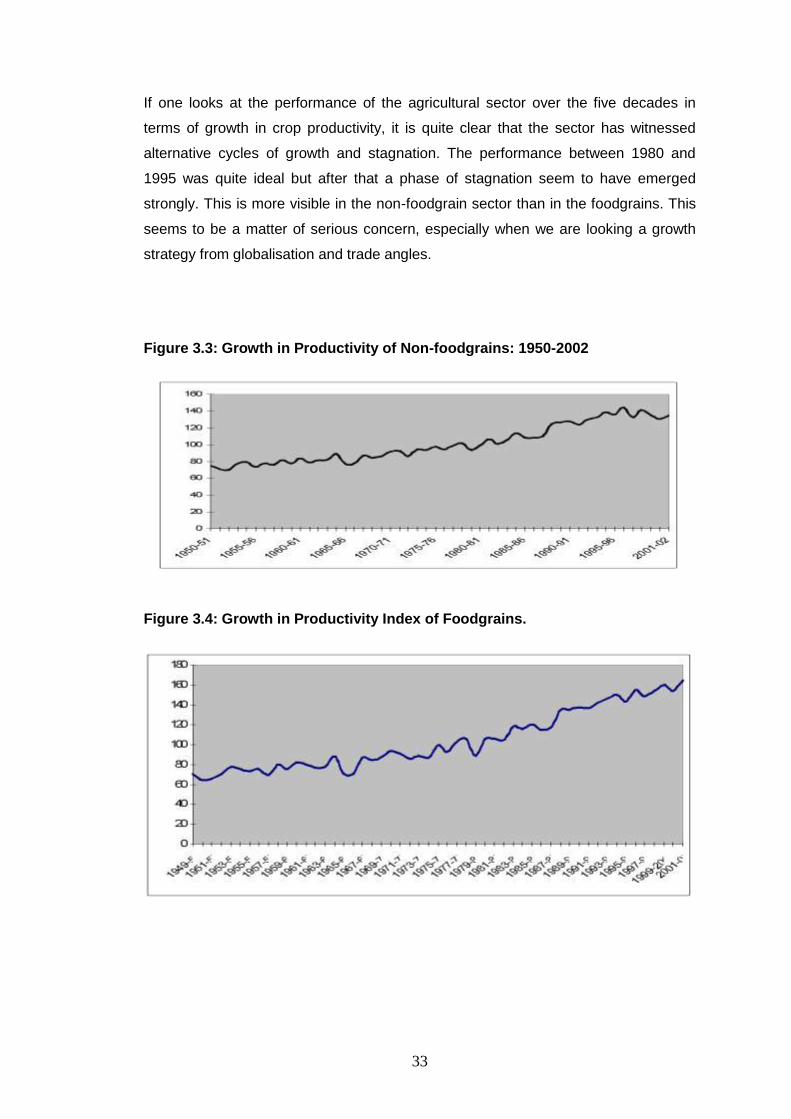
If one looks at the performance of the agricultural sector over the five decades in
terms of growth in crop productivity, it is quite clear that the sector has witnessed
alternative cycles of growth and stagnation. The performance between 1980 and
1995 was quite ideal but after that a phase of stagnation seem to have emerged
strongly. This is more visible in the non-foodgrain sector than in the foodgrains. This
seems to be a matter of serious concern, especially when we are looking a growth
strategy from globalisation and trade angles.
Figure 3.3: Growth in Productivity of Non-foodgrains: 1950-2002
Figure 3.4: Growth in Productivity Index of Foodgrains.

34
4. TRADE SECTOR PERFORMANCE Among the major changes that took place in the trade policy during nineties, five
were of greater significance for agricultural sector. First, the EXIM policy of March
1990, introduced liberalisation of imports of certain commodities including capital
goods and raw materials. Relaxation of licensing policy, foreign exchange availability
and reduction in cash margins of imports were introduced to facilitate trade. Second,
alongwith introduction of the Special Import License Scheme, relaxation in export
control were launched as important steps to ease the existing controls on trade. All
this indicated export encouragement on one side and import relaxation on the other.
Further, the trade policy that was earlier characterised only by short-term changes,
essentially protective to combat exigencies, was tuned to a long-term consistent
policy with an outward look (Sen and Das, 1992; Sen and Mukhopadhyay, 1994).
Third important set of modifications included the extension of the Exim Scrip facilities
to a number of agricultural commodities, decanalisation, and significant shifting of
commodities from restricted and prohibited lists to free list took place during 1994
(Sen, 2000). Thus the percentage of free trade items increased from 22per cent in
1995 -96 to 58per cent by 2000. Fourth, the EXIM policy of 2001, gave special
importance to the agricultural sector through the creation of the Special Economic
Zones and Agricultural Export Zones wherein the state governments were required to
identify product specific Agricultural Export Zones and encourage trade. Quantitative
Restrictions (QRs) were initially removed on 111 items. Finally, the changes
announced by Government of India on 1st April 1999, 2000 and 2001 became
historical in the process of liberalisation of agricultural trade. India’s proposal of a six-
year phase out (by 2004) of the Quantitative Restrictions was agreed by the
European Union and Australia but not by United States. Later as per the agreed
programme with WTO, the Government of India brought out a new OGL list
containing 894 items and partially liberalised imports of 414 items bringing them
under the Special Import License (SIL). Close on the heel of this step, QRs on 715
items were removed on 1st April 2001 of which nearly 170 items belonged to
agriculture. Through this process the trade restrictions on most of the items
originating from agricultural sector were put on OGL list. This was also recently
followed by a long-term policy document on foreign trade. These policies in the
process of Globalisation brought forth issues dealing with the impact of international
markets on agricultural sector.

35
Globalisation of trade has opened up quite a few concerns for the agricultural sector.
On the positive side it is argued that Globalisation has unwrapped the prospects for
Indian agriculture to make its presence felt in the international market. India has
demonstrated comparative advantage in quite a few commodities therefore, it was
rightfully expected that India would emerge as a significant player in trade of these
commodities. It is expected that Globalisation will help to boost up exports and meet
the import bills apart from enhancing foreign exchange reserves. But at the same
time that will increase import-intensity of exportable commodities. Opening of trade
will also help to augment export competitiveness and improve the quality of
production. In these circumstances a clear long-term export oriented production
strategy can be chalked out. The demand for processed agricultural products will
increase and that will have a substantial value addition to the farmers’ produce.
Table 3.2: Growth Rates in Agricultural Exports
Region
Average annual growth rates (%)
1955-60 1960-70 1970-80 1980-90 1990-95 1955-95
World 3.5 5.2 16.6 3.6 6.9 6.7
Developed country 2.7 5.4 14.9 4.3 6.2 6.4
Developing countries
4.7 4.7 24.0 2.7 8.8 8.2
(a)Developing Asia 6.4 4.4 23.5 3.9 11.1 8.7
(b) India 1.5 1.7 13.4 3.5 12.5 5.5
Source : Bhalla (2004); Originally from: 1.UN, Yearbook of International Trade Statistics,
various issues. 2. UNCTAD Handbook International Trade Statistics, various issues. The export performance of the agricultural sector during the decade of nineties has
been quite satisfactory (Table 3.2). There are some commodities that have recorded
positive growth performance, and at the same time we have witnessed declining
exports of a few important commodities (Table 3.3). Marine products, cashew, tea,
basmati rice and spices have shown significant increase in exports. But at the same
time oil meals, non-basmati rice, coffee, meat preparations, fresh vegetables and
fruits have shown decline in exports. On the negative side, it is feared that sudden
shortages and hoardings of certain important commodities may be deleterious impact
on economy. This however, could be managed provided through long-term market
intelligence strategies and development of appropriate institutions to meet such
contingency.

36
Table 3.3: Export performance of Agricultural Products: 1995-2000 (Exports in US$ millions)
1995 - 96 1996 - 97 1997 - 98 1998 - 99 1999 - 00
Marine products 1012.31 1129.86 1208.72 1038.15 1181.55
Cashew 369.97 362.41 377.13 386.76 566.42
Tea 350.63 292.38 505.47 538.23 407.99
Basmati Rice 254.69 351.74 454.10 446.03 401.10
Spices 237.58 338.92 379.76 387.96 393.23
Castor oil 222.31 176.84 155.21 159.72 245.37
Guargum meal 68.02 100.40 146.82 172.93 189.15
Tobacco Unmanufactured 113.38 186.21 247.17 136.00 184.87
Processed fruits and juices 61.25 59.05 73.51 69.12 113.29
Pulses 39.47 37.10 97.22 53.00 93.56
Seasame and Dairy products
77.02 77.61 81.51 79.07 85.88
Tobacco manufactured 20.40 27.15 41.51 45.03 44.55
Poultry and Dairy products 17.59 34.90 31.80 23.04 22.76
Floriculture products 18.01 17.87 23.37 25.18 20.94
Shellac 18.78 14.75 15.65 15.52 18.85
Fruits/Vegetables seeds 12.32 11.86 14.41 15.32 15.55
Share of these commodities in total Agriculture exports per cent
47.29 46.88 58.11 59.52 72.40
Source : Bhalla (2004).
5. IMPORT PERFORMANCE Increase in imports of the agricultural commodities is one of the possibilities of
globalisation. It makes available goods and services on competitive prices to the
consumers, but at the same time unabated imports may cause severe disincentives
to the domestic producers. On the negative side it is feared that sudden import
surges may occur in the market. Increased intensity of exports may facilitate entry of
new-private traders and the market margins as well as undue profiteering will
increase. These can act as strong disincentives to the producers. Such a situation

37
will be common in the case of the commodities, which have higher income elasticity
of demand. The process of increased trade will not only generate export-import price
parity but also integrate the World market prices with domestic prices. Therefore, the
prices in the domestic market of these commodities are likely to increase to keep
pace with international prices. In other words the international prices may normatively
guide domestic price movements. This in turn may lead to price instability and
increased price fluctuations. The worst consequence of such situation is the likely
disincentive it will create among the domestic producers.
Table 3.4: Agricultural products showing decline in Export growth during 1995-
96 to 1999-2000 Exports in US$ million(1999-2000 prices)
Items 1995 - 96 1996 - 97 1997 - 98 1998 - 99 1999 - 00
Oil Meals 703.18 985.44 925.44 461.43 370.43
Non-Basmati Rice 1113.00 542.20 454.03 1046.54 316.41
Coffee 449.98 402.20 456.93 410.63 315.17
Meat and preparations 187.73 199.86 217.77 217.77 180.44
Fresh vegetables 89.04 94.27 84.31 84.31 81.63
Fresh fruits 68.92 68.90 74.58 74.58 66.59
Misc.processed items 161.81 215.41 68.85 60.62 62.39
Groundnuts 68.62 91.86 152.56 33.19 42.34
Processed vegetables 42.74 32.93 31.39 39.75 38.17
Cotton raw including wastes 60.94 443.90 221.41 49.17 18.64
Spirit and beverages 13.37 56.75 19.83 16.80 16.21
Suger and Molasses 151.62 303.89 68.68 5.81 8.74
Other cereals 5.08 13.71 3.39 2.06 1.88
Wheat 109.81 196.91 0.11 0.32 0.00
Share of these commodities in total Agriculture exports per cent
52.71 53.12 41.89 40.48 27.6
Source : Bhalla (2004)

38
Table 3.5: India's Import of selected agricultural commodities 1990-91 to 2001-02 (In US Million $)
Commodities 1990-90 1991-92 1993-94 1994-95 1998-99 1999-00 2000-01 2001-02
Rice 4 18 3 0 6 3 2
Wheat 0 40 0 266 179 1.8 1.4
Cereals & prep 102 66 35 26 25 222 19.4 18.2
Pulses 268.2 121 186 199 322 82 109.2 662.6
Sugar 5.2 0 0 727 127 256 7 7
Fruit & nut* 41 41 69 11 155 136 176 158
Milk/Cream* 3 3 5 2 1 25 2 2
Cashew nuts 75 108 154 220 207 276 211 90
Crude Rubber 126 74 109 118 160 143 152 174
Wool raw 102 80 119 112 161 114 100 131
Cotton raw 0 2 6 161 22 289 259 430
Jute raw 11 2 11 20 14 32 18 20
Vegetable Oils 181.6 101 53 199 745 1857 1334 1356
Pulp & W paper 255 121 151 202 284 256 282 295
Agri Imports 915 598 805 1884 3292 3432 2388 3045
Agri Exports 3354 3203 4028 4226 6626 5773 6256 6154
Total Imports 24075 19411 23306 28654 41484 49671 50536 51413
Source: Bhalla G S (2004) 6. OVERALL TRADE PERFORMANCE According to the average shares in total import bill Pulses, Soyabean oil, Silk, Rice,
Natural rubber, Rapeseed mustard oil, Cotton lint, milk and Cream and Cereals are
at the top of our import list. Among the imports of processed products Sugar, Resins,
Milk and Cream, Cheese, Curds, Jute and Fibers and Vegetable oils top the share of
total imports. The commodity composition of imports and exports along with the
earlier growth rates indicate the likely trends in import demand across products. In
order to assess the possible trends in import demand, we have grouped the
commodities by cross classification based on the share of imports and exports. The
groups are indicated below.

39
Table 3.6: Share in Import-Export
Share of Import/Export
Imports Exports
Below 0.10 per cent Groundnut oil, Cheese and Curd, Soyabean Cake, Sunflower Seeds, Cereals, NES, Coffee Green, Canned Meats, Onions
Lemons, Limes, Tomatoes, Pineapple, Copra, Citrus Fruits, Bananas, Cotton Seed, Soyabean, Milk & Cream, Canned Meat, Soyabean Oil, Potatoes
0.10 to 0.50 per cent Coconut Oil, Pepper (Black, White, Long), Milk and Cream, Evaporated and Condensed Tobacco unmanufactured, Tea, Linseed Oil, Grapes, Copra, Oilseed Cake.
Grapes, Sugar, Cereals, Wheat, Silk, Linseed Cake and Meal, Jute and Fibres, Cotton seed Cake, Apples, Eggs in Shells, Sugar Raw, Centrifugal, Oranges, Tangerines.
0.50 to 2.00 per cent Wheat, Jute and Blast Fibres, Wheat and Meslin, Sugar Sugar total raw
Soyabean Cake and Meal, Sesame Seed, Coffee Green, Pulses, Sunflower Seed Cake
Above 2.00 per cent Pulses, Soyabean Oil, Silk, Rice, Natural Rubber and Gum, Rapeseed Mustard Oil, Cotton lint, Milk and Cream dry, Cereals
Tea, Rice, Cotton lint, Tobacco, Unmanufactured, Castor Oil, Pepper, Rapeseed and Cake, Onions, Cereals, Oilseed Cake and Meal, Groundnuts.
These four groups indicate different categories under import and export scenario.
Commodities having higher share in the import bill indicate constraints on domestic
availability and hence are likely to continue in future provided these do not feature
under higher export share group. From table 3.6 we can get four groups based on
the past import and export performance and their characteristics.

40
Table 3.7: Import-Export Category, Commodity Characteristics and prices
Share of Exports or Imports
Group Characteristic
i. High exports – Low Imports
ii. Low Exports – High Imports
iii. High Exports – High Imports
iv. Low Exports – Low Imports
- Domestic production satisfies domestic demand
- Exportable surplus exists
- External demand pull
- World price higher than domestic price
- High domestic demand – Low export demand
- Domestic production not sufficient to meet
demand
- Negligible exportable surplus
- Domestic price higher than world price
- High domestic demand – High export demand
- Exportable surplus exists
- Import intensive exports
- Fluctuating world and domestic prices
- Low domestic demand – Low export demand
- Exportable surplus does not exist
- Inconsistency in relative price advantages between world prices and domestic prices
If we categorise the commodities in the above groups, it becomes possible to
indicate the commodities which have high potential in changing the import shares.
The last group with low share of exports and low share of imports indicates
possibilities of increased imports. In this group we have Grapes, Copra, Oilseed
cake, Groundnut Oil and milk and Condensed cream. Presently we have low shares
of imports of these commodities probably due to low domestic demand or the
domestic production just adequately meeting the domestic demand. It is expected
that the demand for these products may increase due to increase in incomes and as
the production does not yield any exportable surplus the import demand will increase.
The second group of commodities, where the import demand is likely to increase,
comprise of the commodities with higher share of exports coupled with higher share
of imports. Here even though the domestic production meets the domestic demand

41
and generates exportable surplus there are four reasons for increasing import
demand. (1) There is a possibility of qualitative differences in the commodity that is
exported as well as imported (forming substantial share in both). (2) The time lag
between and emergence of domestic demand for consumption and production may
also create such a situation. In such cases imports are resorted to satisfy the
domestic demand initially and as the domestic production generates exportable
surplus, the commodity is exported. (3) High share in exports and high share in
imports occur when there are high fluctuations in the relative prices (price ratios
between world and domestic prices). Imports are resorted to when the world prices
are below the domestic prices and exports in the opposite situation. (4) The import
demand increases if the import contents in the factors of production of an exported
commodity increases. In such case the situation of high import and high exports can
prevail.
7. TRADE BALANCE
Trade balance reflects a one-stroke performance of the trade scenario. We tried here
to look into the performance of the sector in terms of trade balance. On the count of
trade performance the agricultural sector did not under perform during eighties. The
macro-economic crisis that emerged at the beginning of nineties was largely the
creation of the non-agricultural sector. The trade performance of agricultural sector
picked up in 1988 significantly. What is striking in the decade of nineties is the
increased trade balance in agricultural sector in the later period and that has a
positive sign. If this is read along with the overall trade balance of the economy, the
role of agricultural sector becomes clear. Figure 3.5 makes shows the satisfactory
position of the
Figure 3.5: Trade performance of agricultural sector during Nineties.
Imports(Rs Cr)
Exports(Rs Cr)
0
10000
20000
30000
40000
50000
60000
1990
-91
1991
-92
1992
-93
1993
-94
1994
-95
1995
-96
1996
-97
1997
-98
1998
-99
1999
-00
2000
-01
2001
-02
2002
-03

42
8. IMPACT CONCERNS The process of globalisation has spurred strong debates about its feasible impacts
on the agricultural sector. Several views are expressed beginning from a possibility of
significant destruction to our philosophy of rural development to the emergence of
market as the sole correcting mechanism. It is argued that the flow of capital to the
rural sector will reduce, preference will be more towards the market oriented crops
impinging the food security, poor farmers may face hard situation to sustain in
farming, corporatisation of agriculture may take place. According to many, agriculture
sector is the last sector to witness any changes induced by globalization. This is
partially due to delay in making appropriate policy changes and due to the forward
and backward linkages of agriculture sector with other sectors. There is a time lag in
‘trickle down’. On the other hand the proponents of the globalisation vouch that most
of the maladies will be rectified through market process and that is under the
assumptions that markets have the capability of correcting the imperfections in the
Indian context. Reality however, lies somewhere in between.
9. CHANGES IN CROPPING PATTERN
Diversification of agriculture in order to meet the changing demand is adopted as one
of the important strategies by several countries to cope up with the volatile prices
through deliberate policy changes and encouragement of private participation.
Diversification is in favour of high value export-oriented crops under contract or
buyback system. According to a recent study (Joshi et al, 2004), agricultural
diversification increased in all south Asian countries. Fruits and vegetables have
shown good performance during 80s and 90s. The study revealed the shift from
crops to livestock sub-sector during 80s and 90s in all regions of India except
Eastern and North-eastern states. Within the crop sub-sector, non-food grain crops
have gradually replaced food grain crops. The shift is more towards non-food grain
crops like oilseeds, fruits, vegetables, spices and sugarcane. Regional pattern of
diversification showed that southern region is highly diversified followed by western
region (Gulati and Kelly, 1996). It was observed that crop diversification results in
increased employment opportunities. For example, it was estimated that one hectare
shift in area from wheat to potato would generate 145 additional man-days. Similarly,
one hectare from coarse cereals to onions would generate 70 man-days of
employment. According to the authors, diversification has not affected the food

43
security adversely because there is a change in the consumption basket and the shift
is more towards non-cereal food in both rural and urban areas. Crop diversification
has a positive impact on non-traditional items.
Changes on Area Allocated for Major Crops
0
5
10
15
20
25
30
35
40
45
50
Wheat Rice Jowar Ragi Tur Gram
Millio
n H
a.
1980-81 1981-82 1982-83 1983-84 1984-85 1985-86 1986-87 1987-88 1988-89 1989-90 1990-911991-92 1992-93 1993-94 1994-95 1995-96 1996-97 1997-98 1998-99 1999-00 2000-01
Change in Area Allocated to Commercial Crops
0
5
10
15
20
25
30
Oilseeds Sugarcane Cotton Other Fibres
Millio
n H
a.
1980-81 1981-82 1982-83 1983-84 1984-85 1985-86 1986-87 1987-88 1988-89 1989-90 1990-91
1991-92 1992-93 1993-94 1994-95 1995-96 1996-97 1997-98 1998-99 1999-00 2000-01
44
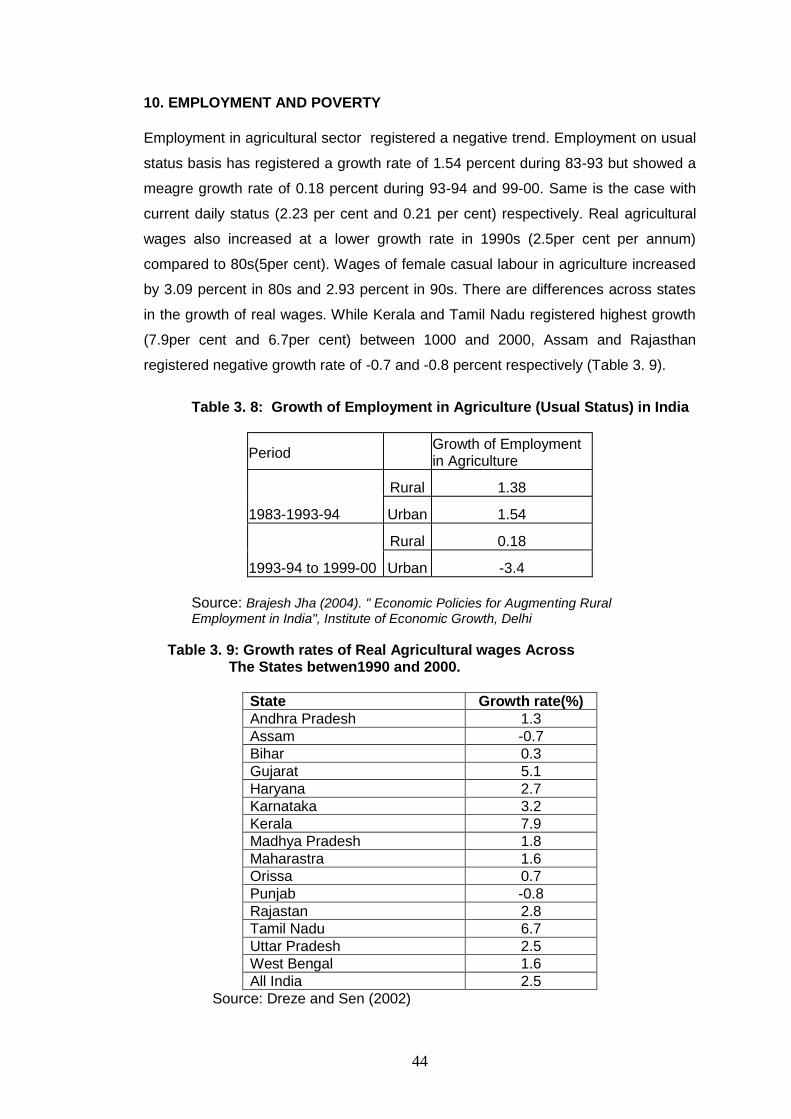
10. EMPLOYMENT AND POVERTY
Employment in agricultural sector registered a negative trend. Employment on usual
status basis has registered a growth rate of 1.54 percent during 83-93 but showed a
meagre growth rate of 0.18 percent during 93-94 and 99-00. Same is the case with
current daily status (2.23 per cent and 0.21 per cent) respectively. Real agricultural
wages also increased at a lower growth rate in 1990s (2.5per cent per annum)
compared to 80s(5per cent). Wages of female casual labour in agriculture increased
by 3.09 percent in 80s and 2.93 percent in 90s. There are differences across states
in the growth of real wages. While Kerala and Tamil Nadu registered highest growth
(7.9per cent and 6.7per cent) between 1000 and 2000, Assam and Rajasthan
registered negative growth rate of -0.7 and -0.8 percent respectively (Table 3. 9).
Table 3. 8: Growth of Employment in Agriculture (Usual Status) in India
Period Growth of Employment in Agriculture
1983-1993-94
Rural 1.38
Urban 1.54
1993-94 to 1999-00
Rural 0.18
Urban -3.4
Source: Brajesh Jha (2004). " Economic Policies for Augmenting Rural
Employment in India", Institute of Economic Growth, Delhi
Table 3. 9: Growth rates of Real Agricultural wages Across The States betwen1990 and 2000.
State Growth rate(%)
Andhra Pradesh 1.3
Assam -0.7
Bihar 0.3
Gujarat 5.1
Haryana 2.7
Karnataka 3.2
Kerala 7.9
Madhya Pradesh 1.8
Maharastra 1.6
Orissa 0.7
Punjab -0.8
Rajastan 2.8
Tamil Nadu 6.7
Uttar Pradesh 2.5
West Bengal 1.6
All India 2.5
Source: Dreze and Sen (2002)

45
It is clearly borne out by the data that employment has not been increasing despite
growth in agricultural sector. That provokes investigation into the search for a
connection between the process of globalisation and typologies of employment. The
experience of the last decade brings out that the growth in the agricultural sector has
been generating more forces for casualisation of employment and the trends in
casualisaiton are quite bold across the country. These trends are sharper in the
agriculturally lagging regions. That leads us to the question of the quality of growth in
the agricultural sector in the wake of globalisation in addition to the location of growth
across regions. At the same time one cannot deny the influence of the quality of
growth in the non-agricultural sector also. The trends in capital formation suggest
that the employment scenario is a direct derivate of capital formation in the sector.
In that context, a pragmatic policy is needed which is pointedly focused on efforts to
correct the trends in capital formation and especially inducing the private capital
formation at a higher rate of growth. Directing the growth inducing factors towards
important components in agricultural sector is an undisputable pre-requisite of such
a policy.
11. EMERGING SCENARIO
The impact of globalisation on agricultural economy involves both governance as well
as analytical issues. The first set of issues address to the basic analytical concern
namely :Can one take the decade of nineties as the period representing globalisation
in the agricultural sector? Have all the significant changes in the governance of
market took place during 1990-91 to facilitate globalisation? And such other queries
derive no satisfactory answers. This is pertinent on the face of the fact that a large
number of steps in governance were taken at distinct points of time during the
decade of nineties and all of it did not happen at any one point of time. The
globalisation of trade in agricultural sector was significant probably only in the post
1995. Moreover, one has to assume some gestation period for settling down the
impact parameters. Second question points towards the data on trade of agricultural
commodities at sub-national level. This is a major issue in governance while
analysing the impact of globalisation. We have not yet developed a foolproof method
to record commodity wise data on trade originating from individual states.
Commodities move towards ports of destination mostly by road or rail. These are
unrecorded in the statistical system by their place of origin and purpose of

46
movement. Therefore, the reliability of data at sub-national level is quite
questionable. Third issue relates to the question about testing the hypothesis related
to changes due to globalisation by adopting the usual ‘before and after’ approach. A
good number of changes take place independent of the trade related factors. Lastly,
one must be wary about the level of aggregation across commodities and regions
while computing various trade related parameters like trade sensitivity, market
access, aggregate measures of support etc (Datta and Deodhar, 2000). It is
necessary to discuss how one goes about these in terms of methodology.
The second set of issues relate to the study of growth behaviour across crops and
regions in the face of the changes in the trade policies. It is essential to identify the
crops and regions that have lagged or performed well in this period, and the reasons
for such differential growth behaviour. The location of the trade sensitive
commodities in the Indian context will help to monitor the changes that occur in their
trade pattern (Following WTO, 2003). Discussions may address to this concern.
There are a few methodological problems in the computation of commodity- region
specific trade sensitivity indices. It is necessary to map these and discuss about the
variables that will enter into such computations. Discussion on this will be quite
useful. Lastly, where and how do we set the trigger for activating the ameliorating
measures, in the case of an alarming situation caused by import surges? Such
situation can be confronted in these trade sensitive commodities.
The third set of issues deals with the impact of globalisation on the domestic prices.
The methodological questions about the measurement of market and price
integration between the world and domestic market needs to be discussed carefully
(Nayyar and Sen, 1994 and Deshpande and Naika, 2004). It is also necessary to
decide the appropriate price data from among the available price series (FHP, WSP,
MSP, Averages of selected markets etc) to be used for arriving at the measures of
integration. This is more pertinent in view of the lack of domestic market integration.
The character of the world market, the mechanism of price formation and the likely
changes in price policy are a few important concerns for discussion (Chand, 2001).
Even when we have problems about the intra-regional, inter-market integration, the
global integration of the domestic markets needs to be understood carefully. In the
face of this, how one should look at global integration, is an intriguing question.
Similarly, the choice of the border prices across trading partners vis a vis that of the
countries is also a ticklish issue. The concern about the food security in the context of
globalisation has been voiced vociferously (Sharma, 1994,2000, Shiva, 1999). While

47
one cannot sideline the importance of food security in the context of India and the
probable vulnerability, it will be imprudent to keep away from the forces of change in
the present context. It is quite possible that any attempt to shy away from ‘pro-active
trade led growth’ policy may land us in to another worst situation.

48
References Acharya, S S (2002). Food Security and New International Trade Agreement:
Perspectives from India, in G S Bhalla, J L Racine and F Landy (Eds.) Agriculture and The World Trade Organisation: Indian and French Perspectives, Èditions de la Maison des sciences de l’homme, Paris.
Ahluwalia, Montek S (1996). “New Economic Policy and Agriculture: Some
Reflections” Indian Journal of Agricultural Economics, Vol 51 No 3, July September.
Bhalla, G S (1995).”Globalisation and Agricultural Policy in India”, Indian Journal of
Agricultural Economics, Vol 50, No 1, Jan-March. Bhalla, G S (2004). Globalisation and Indian Agriculture, State of the Indian Farmer:
A Millennium Study, New Delhi, Academic Foundation and Ministry of Agriculture, Government of India.
Chand, Ramesh and Dayanath Jha (2001). “Trade Liberalisation, Agricultural Prices
and Net Social Welfare”, in S S Acharya and D P Chaudhry(Eds.). Indian Agricultural Policy at the Crossroads, Rawat, Jaipur.
Dantwala, M L (1996). Dilemmas of Growth – Indian Experience, Sage, New Delhi. Datta, Samar K and Satish Y Deodhar (Eds) (2000). Impact of WTO Agreements on
Indian Agriculture, Oxford and IBH, New Delhi. Deshpande R S (2002). “Agriculture, Natural Resource Management and Rural
Development”, Proceeding of a Seminar on, Developmental Reforms for Resurgent India: A Nodal Strategy, Ministry of Culture and Tourism, Government of India (Eds), New Delhi.
Deshpande, R S and T Raveendra Naika (2004). Moon in the Mirror: Farmer and the
Minimum Support Prices in Karnataka, Monograph No 7, Institute for Social and Economic Change, Bangalore.
Ghosh, Jayati (1997). “India’s Structural Adjustment: An Assessment in Comparative
Asian Context”, Economic and Political Weekly, Vol.32 No 20 &21, May 17-30th.
Gulati, Ashok and Tim Kelly (1999). Trade Liberalisation and Indian
Agriculture:Cropping Pattern Changes and Efficiency Gains in Semi Arid Tropics, Oxford University Press, New Delhi.
Joshi, Vijay and IMD Little (1996). India’s Economic Reforms-1991-2001, New Delhi,
Oxford University Press. Joshi P. K, Ashok Gulati, Pratap s Birthal, Laxmi Tewari.(2004). Agriculture
Diversification in South Asia. Patters, Determinants and Policy Implications, Economic and Political Weekly, Vol XXX1X, No 24. pp 2457-2467.
Nayyar, Deepak and Abhijit Sen (1994). “International Trade and the Agricultural
Sector in India”, Economic and Political Weekly, Vol. 29, No. 19, 14th May.

49
Pangariya, Arvind (1999). “The Millennium Round and Developing Countries: Negotiating Strategies and Areas of Benefits”, Paper Presented at the Conference on Developing Countries and the New Multi-lateral Round of Trade Negotiations, Harvard University, Harvard, November 5-6.
Parikh, Kirit S., N.S.S. Narayana, Manoj Panda and Ganesh Kumar (1997).
“Agricultural Trade Liberalisation: Growth, Welfare and Large Country Effect”, Agricultural Economics, Vol. 17, pp. 1-20.
Rao, C H Hanumantha (2001). “WTO and Viability of Indian Agriculture”, Economic
and Political Weekly, Vol 36, No. Sept 8th. Sen Sunanda (2000). Trade and Dependence: Essays on the Indian Economy,
Sage, New Delhi. Sharma, Devinder (1994). GATT to WTO – Seeds of Despair, Konark Publications,
New Delhi. Sharma, Devinder (2000). “WTO and Agriculture: The End Result is Zero”, Hindu
Business Line, New Delhi. September 30th. Shiva, Vandana (1999). Stolen Harvest: Hijacking of the World Food Supply, South
End Press, New Delhi. Singh, Manmohan (1995). Inaugural Address, Indian Society of Agricultural
Economics, 54th Annual Conference, Indian Journal of Agricultural Economics, Vol. 50 No 1, Jan-March.
World Trade Organisation (1998). India Should Keep up with Its Trade Reforms to
Ensure Strong Economic Growth, Press Release, April. World Trade Organisation (2003). Negotiations On Agriculture Report By The
Chairman, Mr. Stuart Harbinson, 7th July.