globaleconomic outlook synchinglower - calpers › docs › board-agendas › 201901 › full ›...
TRANSCRIPT
Global conomic Outlook
Synchin Lower
CalPER Offsite, January 22, 2019
Joachim Fels
For in titutional inve tor u e only

PIMCO_Phil_05
PIMCO’s investment process Forums: Themes that anchor portfolio construction
Annual secular forum
(3–5 year outlook)
Assess long-term trends demographics, political factors, globalisation of trade and capital, productivity / technology
OUTLOOK
ecular Trend
Quarterly cyclical forum
Cyclical
Trend
(6–12 month outlook)
Major economy / emerging market inflation and GDP forecasts and fine tune the secular outlook
SOURCE PIMCO Refer to Appendix for additional investment strategy, outlook and risk information.
1
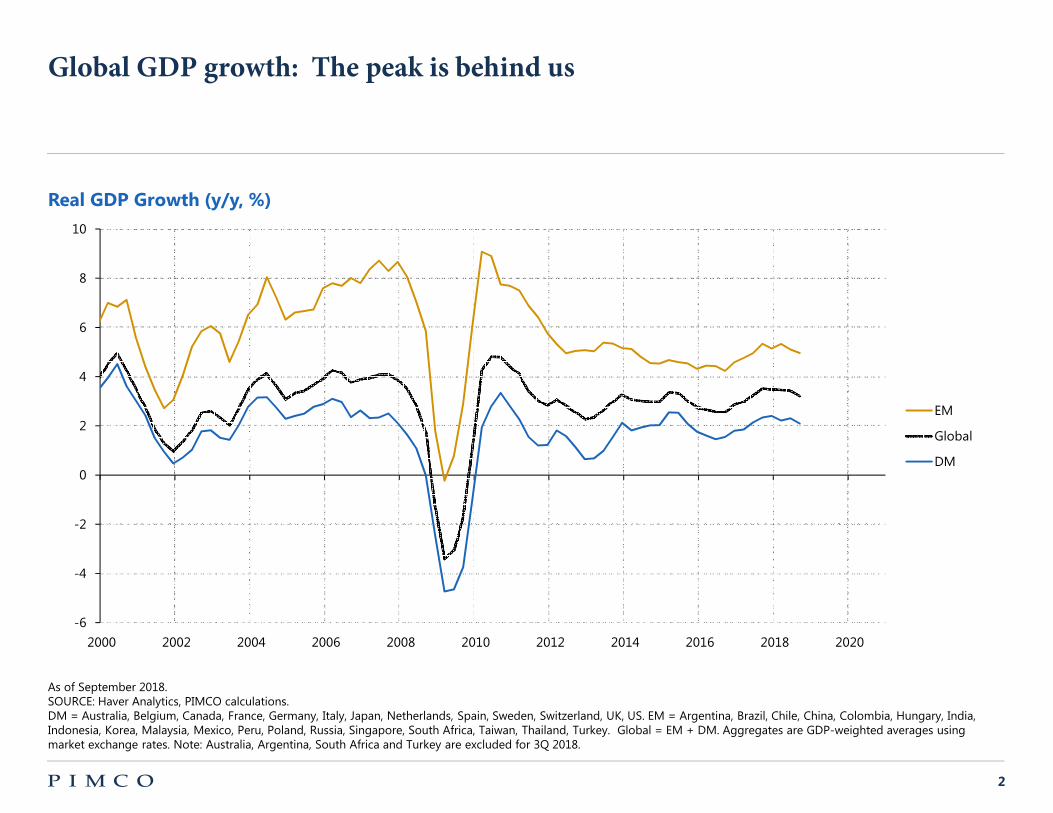
Global GDP growth: The peak is behind us
Real GDP Growth (y/y, %)
10
8
6
4
EM 2
Global
DM 0
-2
-4
-6
2000 2002 2004 2006 2008 2010 2012 2014 2016 2018 2020
As of September 2018. SOURCE Haver Analytics, PIMCO calculations. DM = Australia, Belgium, Canada, France, Germany, Italy, Japan, Netherlands, Spain, Sweden, Switzerland, UK, US. EM = Argentina, Brazil, Chile, China, Colombia, Hungary, India, Indonesia, Korea, Malaysia, Mexico, Peru, Poland, Russia, Singapore, South Africa, Taiwan, Thailand, Turkey. Global = EM + DM. Aggregates are GDP-weighted averages using market exchange rates. Note Australia, Argentina, South Africa and Turkey are excluded for 3Q 2018.
2
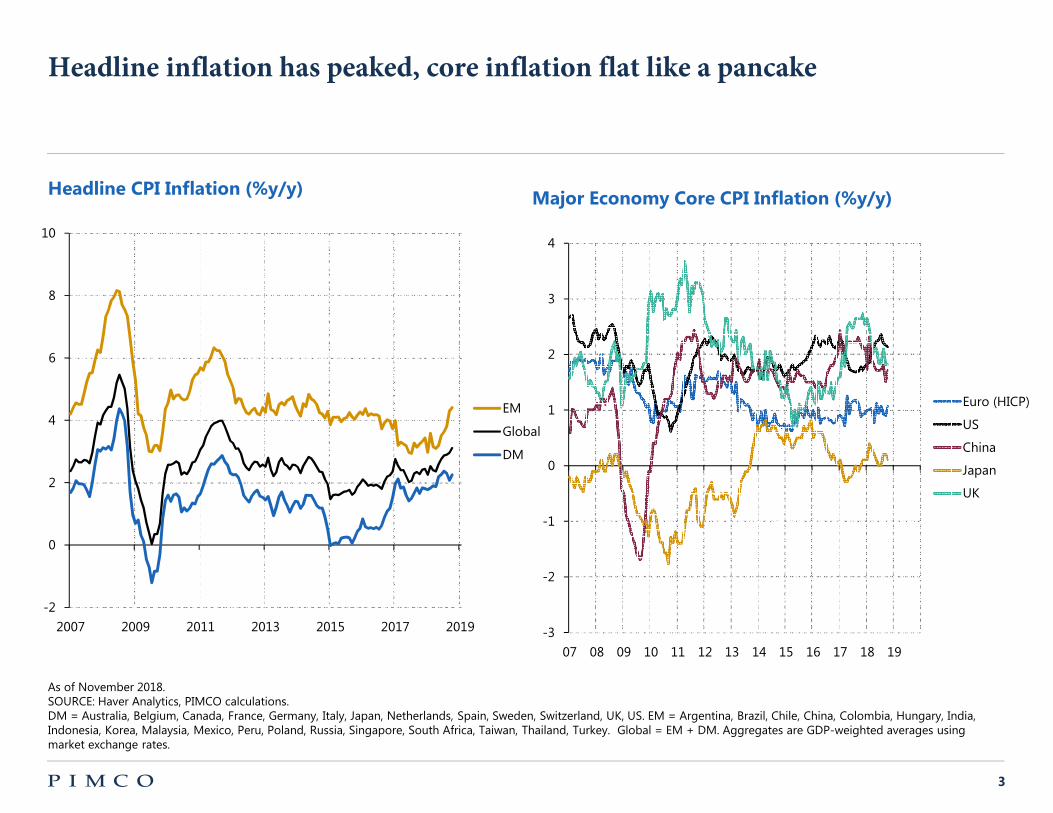
Headline inflation has peaked, core inflation flat like a pancake
Headline CPI Inflation (%y/y) Major Economy Core CPI Inflation (%y/y)
10 4
8 3
26
EM 1 Euro (HICP)
4 Global US
DM China
2 0 Japan
UK
-1
0
-2
-2
2007 2009 2011 2013 2015 2017 2019 -3
07 08 09 10 11 12 13 14 15 16 17 18 19
As of November 2018. SOURCE Haver Analytics, PIMCO calculations. DM = Australia, Belgium, Canada, France, Germany, Italy, Japan, Netherlands, Spain, Sweden, Switzerland, UK, US. EM = Argentina, Brazil, Chile, China, Colombia, Hungary, India, Indonesia, Korea, Malaysia, Mexico, Peru, Poland, Russia, Singapore, South Africa, Taiwan, Thailand, Turkey. Global = EM + DM. Aggregates are GDP-weighted averages using market exchange rates.
3
10
2
0
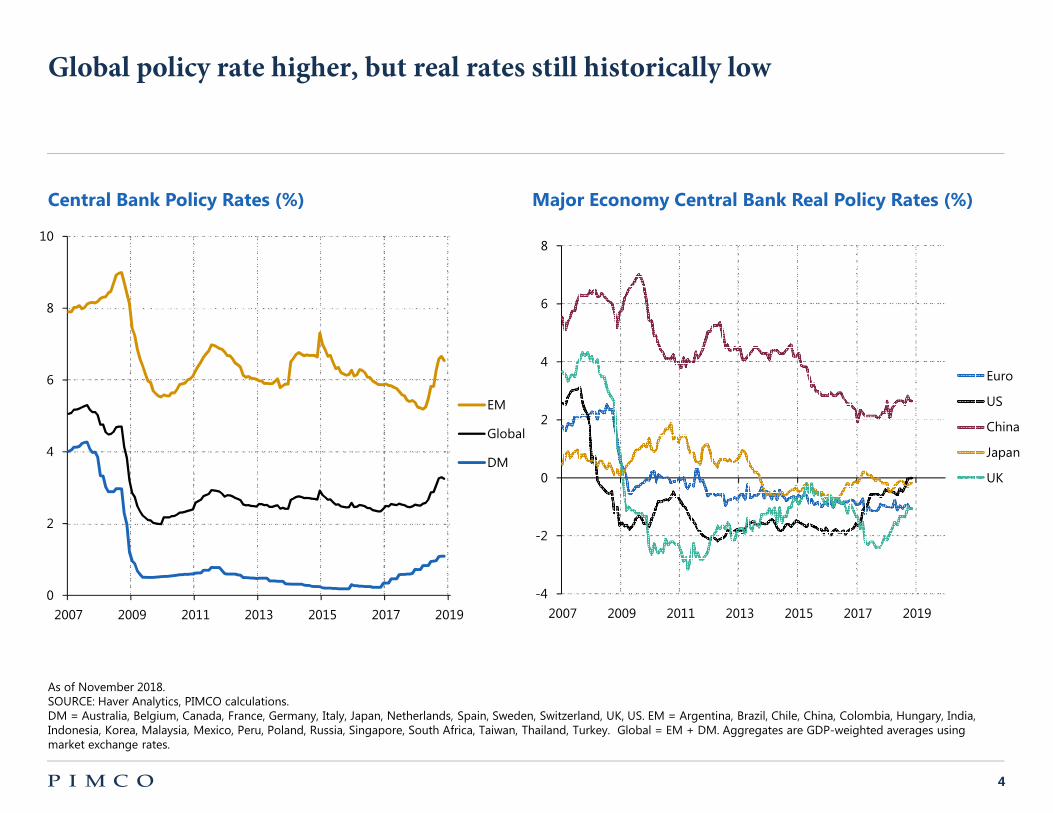
Global policy rate higher, but real rates still historically low
Central Bank Policy Rate (%) Major Economy Central Bank Real Policy Rate (%)
8
8 6
6
4
EM
Global
DM
4
2
0
Euro
US
China
Japan
UK
-2
-4
2007 2009 2011 2013 2015 2017 2019 2007 2009 2011 2013 2015 2017 2019
As of November 2018. SOURCE Haver Analytics, PIMCO calculations. DM = Australia, Belgium, Canada, France, Germany, Italy, Japan, Netherlands, Spain, Sweden, Switzerland, UK, US. EM = Argentina, Brazil, Chile, China, Colombia, Hungary, India, Indonesia, Korea, Malaysia, Mexico, Peru, Poland, Russia, Singapore, South Africa, Taiwan, Thailand, Turkey. Global = EM + DM. Aggregates are GDP-weighted averages using market exchange rates.
4
95
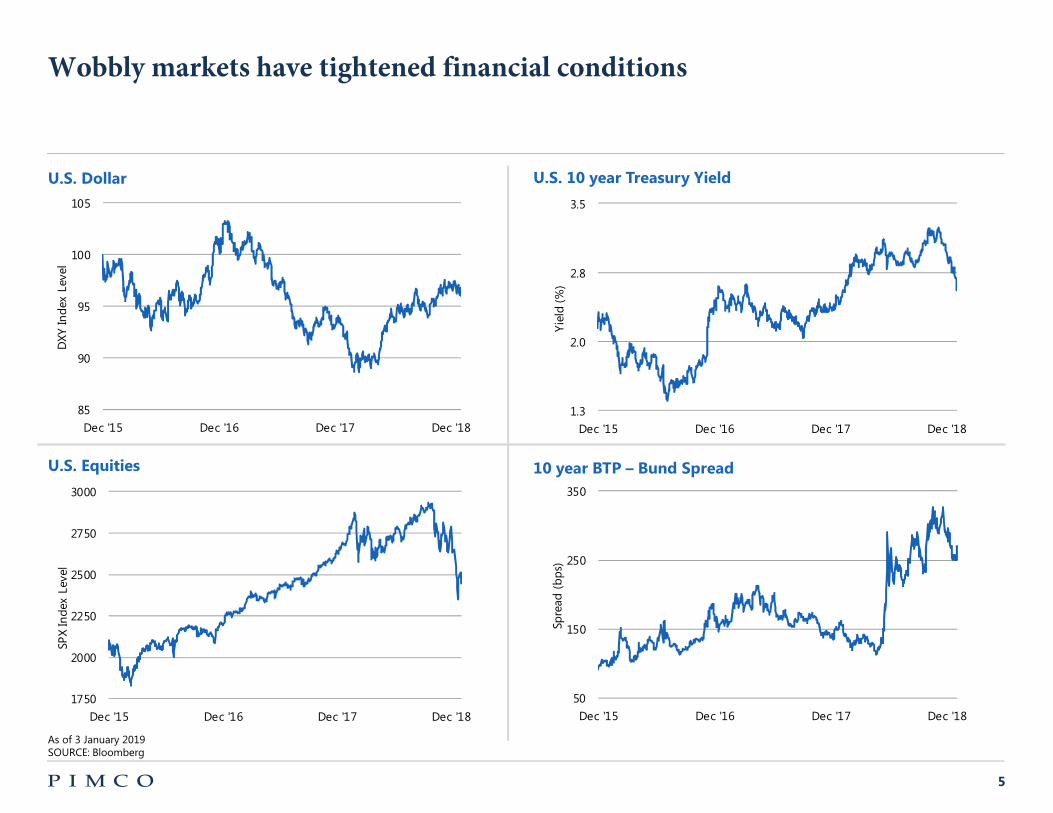
Wobbly markets have tightened financial conditions
U.S. 10 year Trea ury Yield U.S. Dollar
105 3.5
100
2.0 90
85 1.3 Dec '15 Dec '16 Dec '17 Dec '18 Dec '15 Dec '16 Dec '17 Dec '18
Yie
ld(%
)
DXY
Ind
ex L
evel
2.8
U.S. Equitie 10 year BTP – Bund Spread
350 3000
2750
2000
1750 50
Dec '15 Dec '16 Dec '17 Dec '18 Dec '15 Dec '16 Dec '17 Dec '18
As of 3 January 2019 SOURCE Bloomberg
250
SPX
Inde
x Le
vel
Spre
ad (
bp
s)
2500
2250 150
5

62
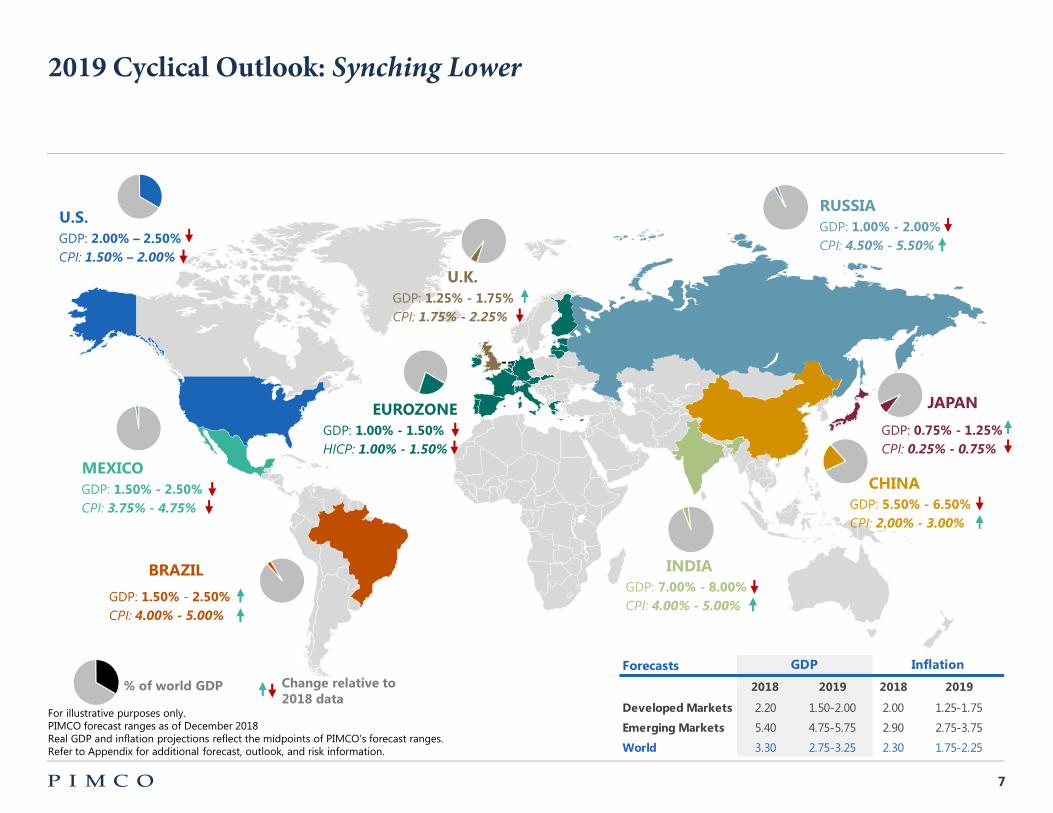
2019 Cyclical Outlook: ynching Lower
Composite PMIs U.S. Eurozone EM
Debates shaping the outlook for 2019:
exp
ansi
ona
ry
PMI
60
1. How ate is it in the cyc e? 58
56 2. The end of U.S. economic exceptiona ism?
54
3. Wi inf ation ever return? 52
4. The Fed pauses, then what? 50
48 5. U.S. versus China: truce or peace?
46
2012 2013 2014 2015 2016 2017 2018
As of December 2018 SOURCE Haver Analytics
44
6
--
2019 Cyclical Outlook: ynching Lower
U.S.
GDP 2.00% – 2.50%
CPI: 1.50% – 2.00%
U.K.
GDP 1.25% - 1.75%
CPI: 1.75% - 2.25%
EUROZONE
GDP 1.00% - 1.50%
HICP: 1.00% - 1.50%
MEXICO
GDP 1.50% - 2.50%
CPI: 3.75% - 4.75%
BRAZIL
GDP 1.50% - 2.50%
CPI: 4.00% - 5.00%
% of world GDP Change relative to 2018 data
For illustrative purposes only. PIMCO forecast ranges as of December 2018 Real GDP and inflation projections reflect the midpoints of PIMCO’s forecast ranges. Refer to Appendix for additional forecast, outlook, and risk information.
RUSSIA
GDP 1.00% - 2.00%
CPI: 4.50% - 5.50%
JAPAN
GDP 0.75% - 1.25%
CPI: 0.25% - 0.75%
CHINA
GDP 5.50% - 6.50%
CPI: 2.00% - 3.00%
INDIA
GDP 7.00% - 8.00%
CPI: 4.00% - 5.00%
Foreca t GDP Inflation
Developed Market
Emerging Market
World
2018
2.20
5.40
3.30
2019
1.50-2.00
4.75-5.75
2.75-3.25
2018
2.00
2.90
2.30
2019
1.25-1.75
2.75-3.75
1.75-2.25
Mk_3cs_intl_outlook_01 7
0.0
0.1
0.2
0.3
0.4
0.5
0.6
0.7
0.8
0.9
1.0
0.0
0.1
0.2
0.3
0.4
0.5
0.6
0.7
0.8
0.9
1.0
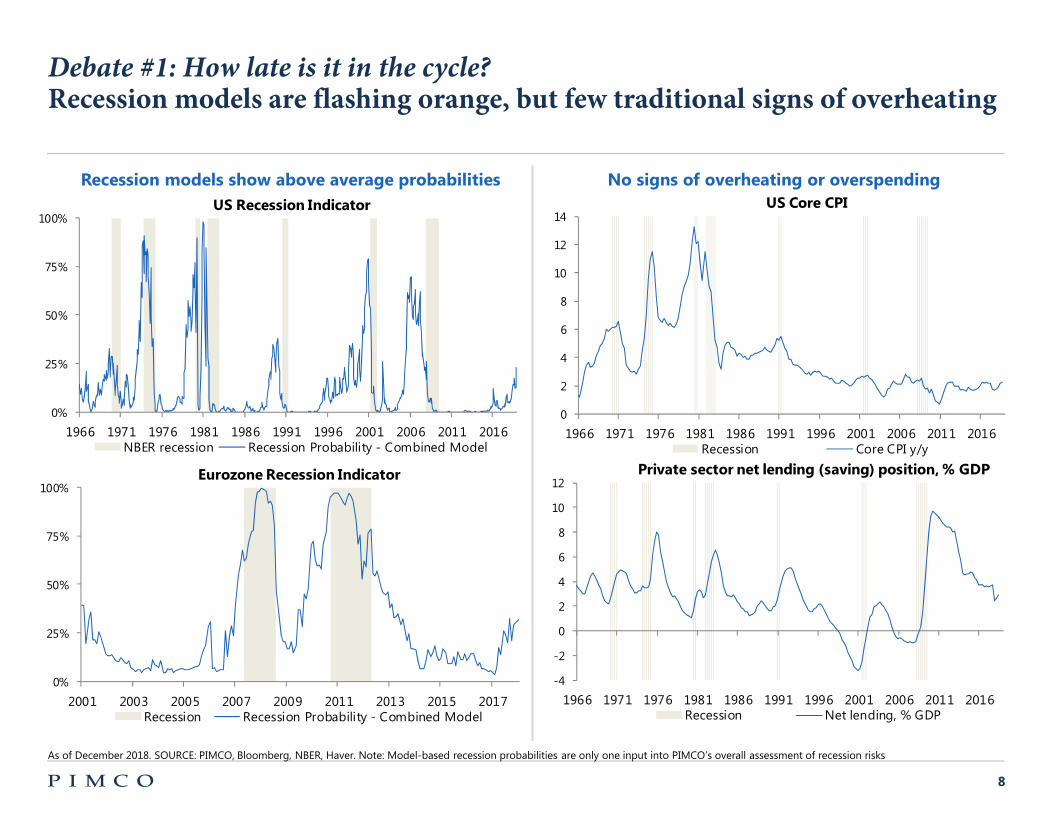
Debate #1: How late is it in the cycle? Recession models are flashing orange, but few traditional signs of overheating
Rece ion model how above average probabilitie
US Rece ion Indicator
No ign of overheating or over pending
US Core CPI
1971 1976 1981 1986 1991 1996 2001 2006 2011 2016 Recession Core CPI y/y
Private ector net lending ( aving) po ition,% GDP
100%
75%
50%
25%
0%
14
12
10
8
6
4
2
0
1966 1971 1976 1981 1986 1991 1996 2001 2006 2011 2016 1966 NBER recession Recession Probability - Combined Model
Eurozone Rece ion Indicator 12 100%
10
875%
6
450%
2
25% 0
-2
0% -4
1966 1971 1976 1981 1986 1991 1996 2001 2006 2011 2016 2001 2003 2005 2007 2009 2011 2013 2015 2017 Recession Net lending, % GDP Recession Recession Probability - Combined Model
As of December 2018. SOURCE PIMCO, Bloomberg, NBER, Haver. Note Model-based recession probabilities are only one input into PIMCO’s overall assessment of recession risks
8
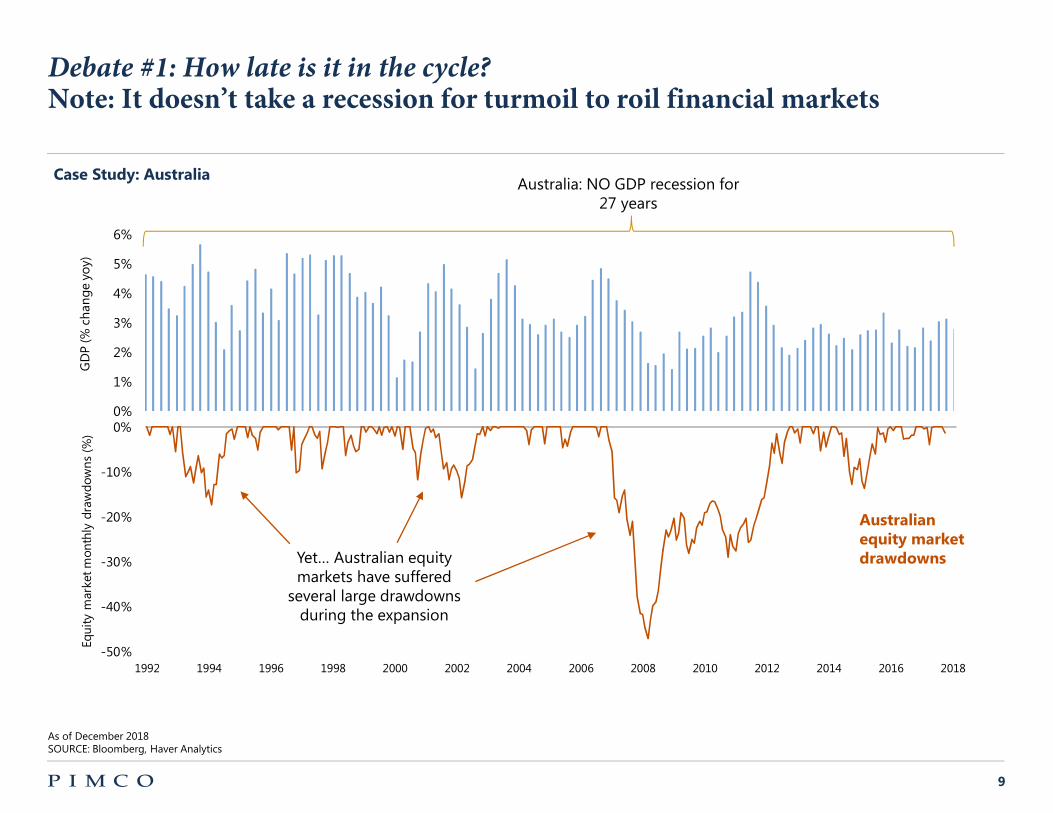
Debate #1: How late is it in the cycle? Note: It doesn’t take a recession for turmoil to roil financial markets
-40%
-30%
-20%
-10%
0%
Equi
ty m
arke
tmon
thly
dra
wdo
wns
(%)
0%
1%
2%
3%
4%
5%
6%
GD
P (%
cha
nge
yoy)
Yet… Australian equity markets have suffered
several large drawdowns during the expansion
Australia NO GDP recession for 27 years
Au tralian equity market drawdown
Ca e Study: Au tralia
-50% 1992 1994 1996 1998 2000 2002 2004 2006 2008 2010 2012 2014 2016 2018
As of December 2018 SOURCE Bloomberg, Haver Analytics
9
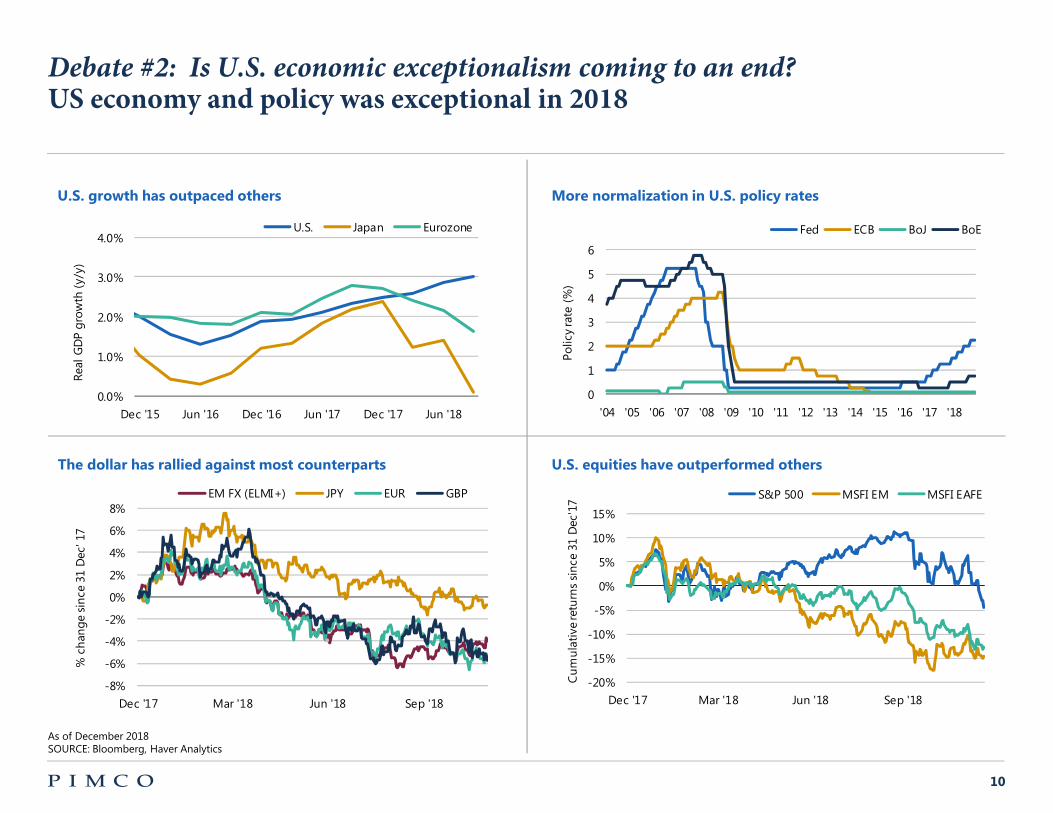
Debate #2: Is U. . economic exceptionalism coming to an end? US economy and policy was exceptional in 2018
U.S. growth ha outpaced other More normalization in U.S. policy rate
U.S. Japan Eurozone Fed ECB BoJ BoE
6
1.0%
2.0%
3.0%
4.0%
0.0% '04 '05 '06 '07 '08 '09 '10 '11 '12 '13 '14 '15 '16 '17 '18
Rea
l G
DP
gro
wth
(y/
y)
5
Polic
yra
te (
%)
4
3
2
1
0
Dec '15 Jun '16 Dec '16 Jun '17 Dec '17 Jun '18
The dollar ha rallied again t mo t counterpart U.S. equitie have outperformed other
EM FX (ELMI+) JPY EUR GBP S&P 500 MSFI EM MSFI EAFE
Cu
mu
lati
vere
turn
ssi
nce
31 D
ec'1
7 8% 15% 6%
4%
2%
0%
-2%
-4%
% c
han
ge
sin
ce31
Dec
' 17
10%
5%
0%
-5%
-10%
-15% -6%
-8% -20%
Dec '17 Mar '18 Jun '18 Sep '18 Dec '17 Mar '18 Jun '18 Sep '18
As of December 2018 SOURCE Bloomberg, Haver Analytics
10
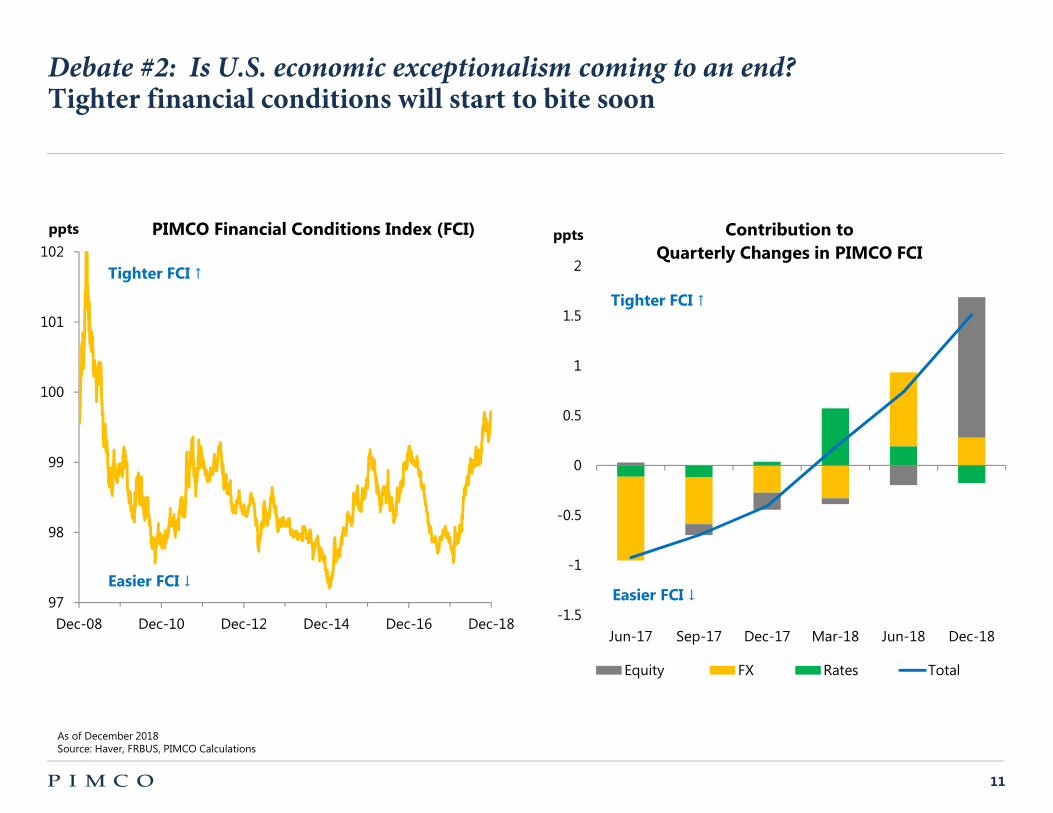
Debate #2: Is U. . economic exceptionalism coming to an end? Tighter financial conditions will start to bite soon
ppt
102
101
100
99
98
97
PIMCO Financial Condition Index (FCI) ppt Contribution to
Quarterly Change in PIMCO FCI 2Tighter FCI ↑
1.5
1
0.5
0
-0.5
-1
Tighter FCI ↑
Ea ier FCI ↓ Ea ier FCI ↓
-1.5 Dec-08 Dec-10 Dec-12 Dec-14 Dec-16 Dec-18
Jun-17 Sep-17 Dec-17 Mar-18 Jun-18 Dec-18
Equity FX Rates Total
As of December 2018 Source Haver, FRBUS, PIMCO Calculations
11
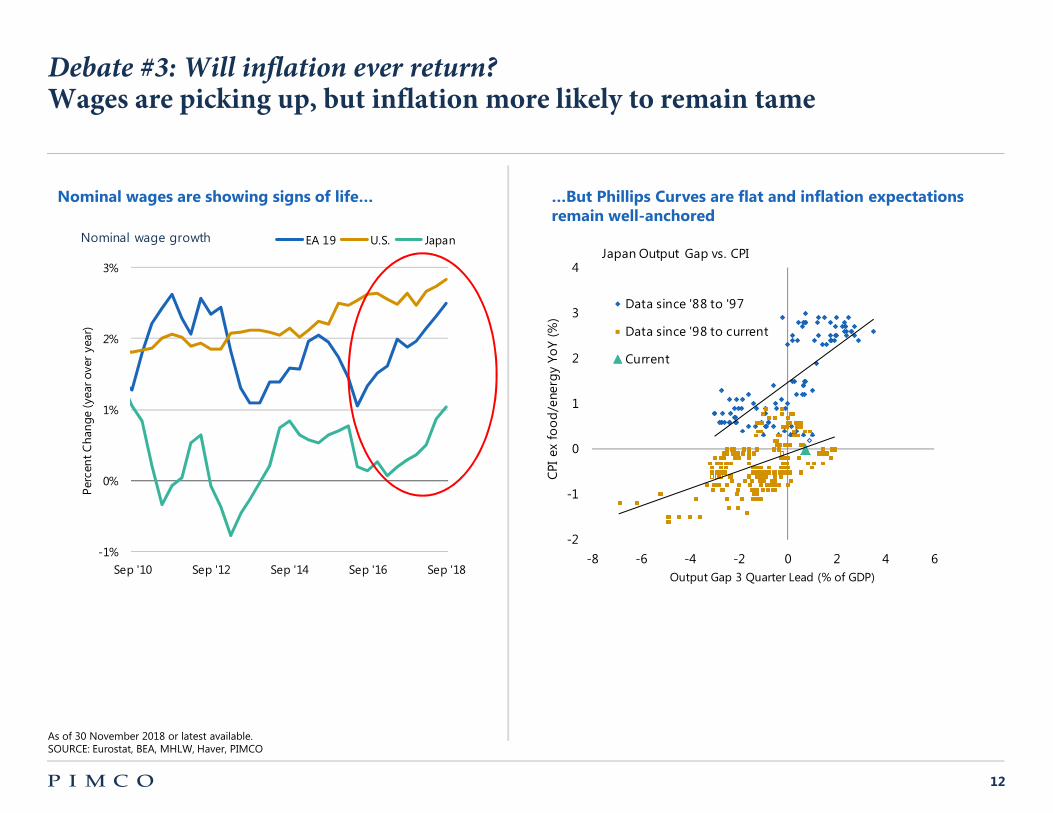
Debate #3: Will inflation ever return? Wages are picking up, but inflation more likely to remain tame
Nominal wage are howing ign of life… …But Phillip Curve are flat and inflation expectation remain well-anchored
Nominal wage growth EA 19 U.S. Japan Japan Output Gap vs. CPI
4
0%
1%
2%
3%
-1%
Data since '88 to '97
Data since '98 to current
Current
-8 -6 -4 -2 0 2 4 6
Per
cen
t C
han
ge(y
ear
over
yea
r)
CPI
ex
foo
d/e
nerg
y Yo
Y (%
) 3
2
1
0
-1
-2
Sep '10 Sep '12 Sep '14 Sep '16 Sep '18 Output Gap 3 Quarter Lead (% of GDP)
As of 30 November 2018 or latest available. SOURCE Eurostat, BEA, MHLW, Haver, PIMCO
12
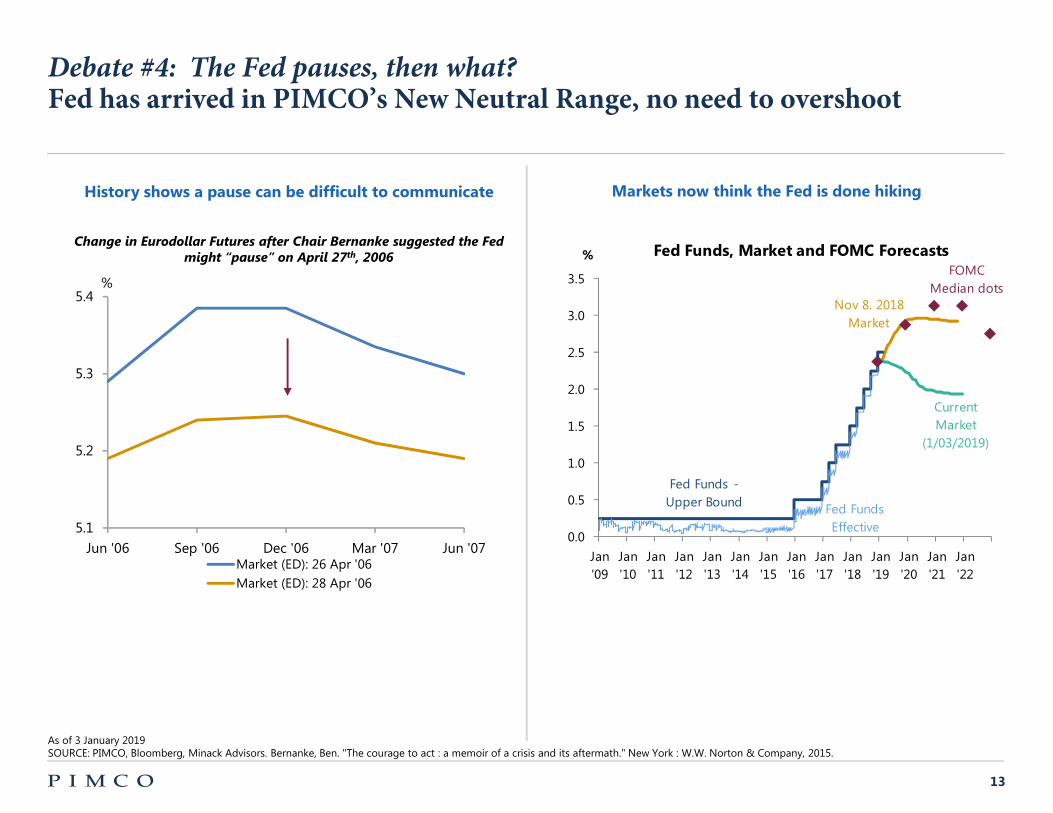
Debate #4: The Fed pauses, then what? Fed has arrived in PIMCO’s New Neutral Range, no need to overshoot
Market now think the Fed i done hiking Hi tory how a pau e can be difficult to communicate
Change in Eurodollar Futures after Chair Bernanke suggested the Fed Fed Fund , Market and FOMC Foreca t %might “pause” on April 27th, 2006
FOMC 3.5 % Median dots
Nov 8. 2018 3.0 Market
2.5
2.0 Current Market
(1/03/2019) 1.5
1.0
0.5
Effective 0.0
Fed Funds -Upper Bound Fed Funds
5.4
5.3
5.2
5.1
Jun '06 Sep '06 Dec '06 Mar '07 Jun '07 Jan Jan Jan Jan Jan Jan Jan Jan Jan Jan Jan Jan Jan Jan
Market (ED) 26 Apr '06 '09 '10 '11 '12 '13 '14 '15 '16 '17 '18 '19 '20 '21 '22
Market (ED) 28 Apr '06
As of 3 January 2019 SOURCE PIMCO, Bloomberg, Minack Advisors. Bernanke, Ben. "The courage to act a memoir of a crisis and its aftermath." New York W.W. Norton & Company, 2015.
13
-
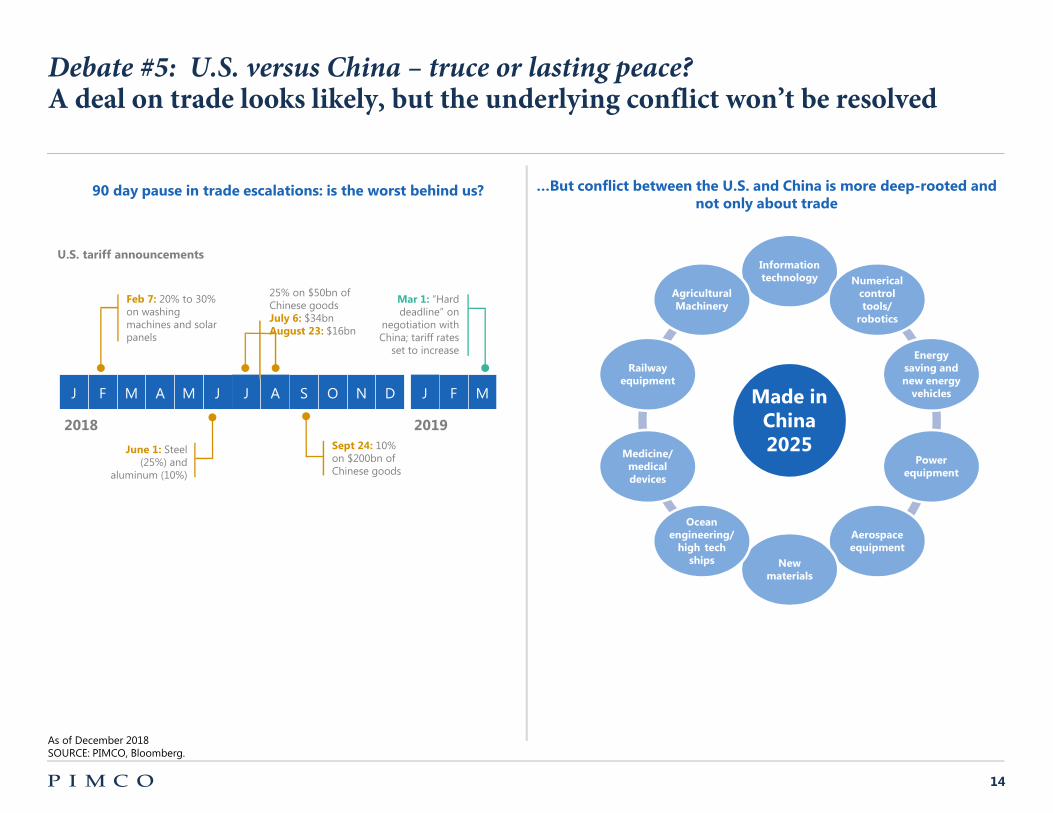
Debate #5: U. . versus China – truce or lasting peace? A deal on trade looks likely, but the underlying conflict won’t be resolved
…But conflict between the U.S. and China i more deep-rooted and 90 day pau e in trade e calation : i the wor t behind u ? not only about trade
Made in China 2025
Information technology Numerical
control tool /
robotic
Energy aving and new energy
vehicle
Power equipment
Aero pace equipment
New material
Ocean engineering/ high tech
hip
Medicine/ medical device
Railway equipment
Agricultural Machinery
U.S. tariff announcement
Feb 7: 20% to 30% on washing machines and solar panels
J F M A M J J A S O N D J F M
2018
June 1: Steel (25%) and
aluminum (10%)
25% on $50bn of Mar 1: “Hard
Chinese goods deadline” on
July 6: $34bn negotiation with
Augu t 23: $16bn China; tariff rates
set to increase
2019
Sept 24: 10% on $200bn of Chinese goods
As of December 2018 SOURCE PIMCO, Bloomberg.
14
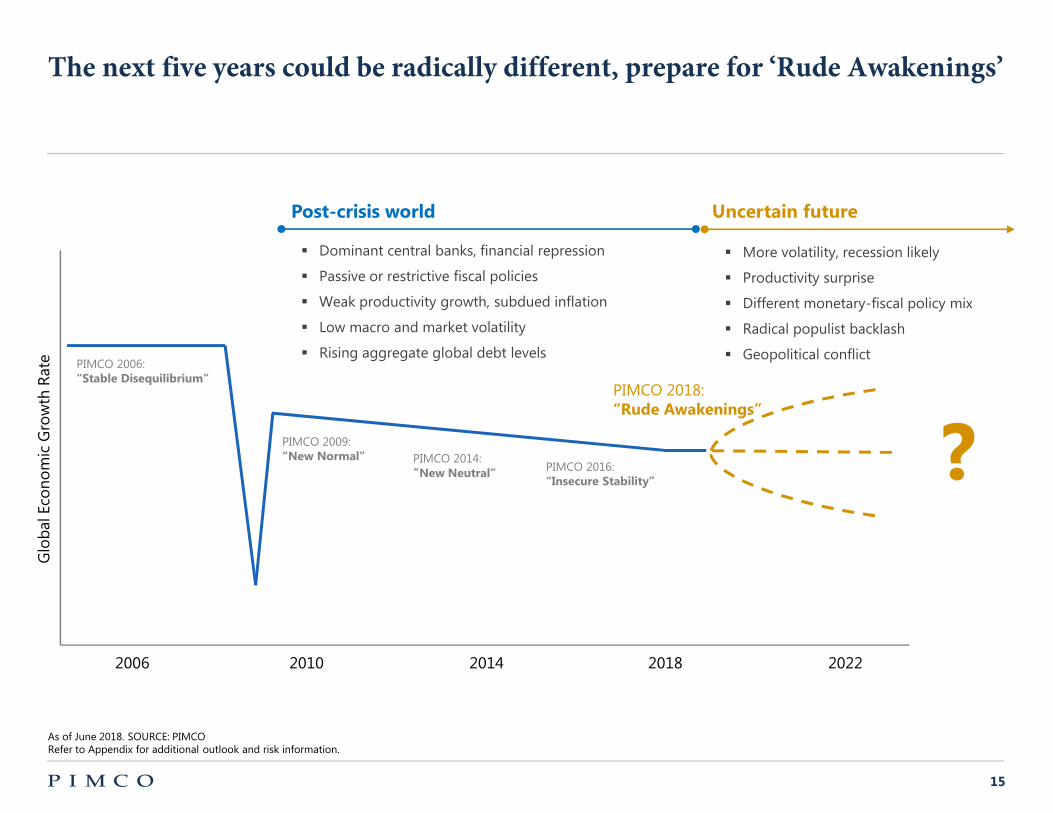
The next five years could be radically different, prepare for ‘Rude Awakenings’
Uncertain future
• More volatility, recession likely
• Productivity surprise
• Different monetary-fiscal policy mix
• Radical populist backlash
• Geopolitical conflict
PIMCO 2018 “Rude Awakening ”
?
Po t-cri i world
• Dominant central banks, financial repression
• Passive or restrictive fiscal policies
• Weak productivity growth, subdued inflation
• Low macro and market volatility
• Rising aggregate global debt levels
PIMCO 2009 “New Normal” PIMCO 2014
Glo
bal
Eco
nom
ic G
row
th R
ate PIMCO 2006
“Stable Di equilibrium”
PIMCO 2016 “New Neutral”
“In ecure Stability”
2006 2010 2014 2018 2022
As of June 2018. SOURCE PIMCO Refer to Appendix for additional outlook and risk information.
15
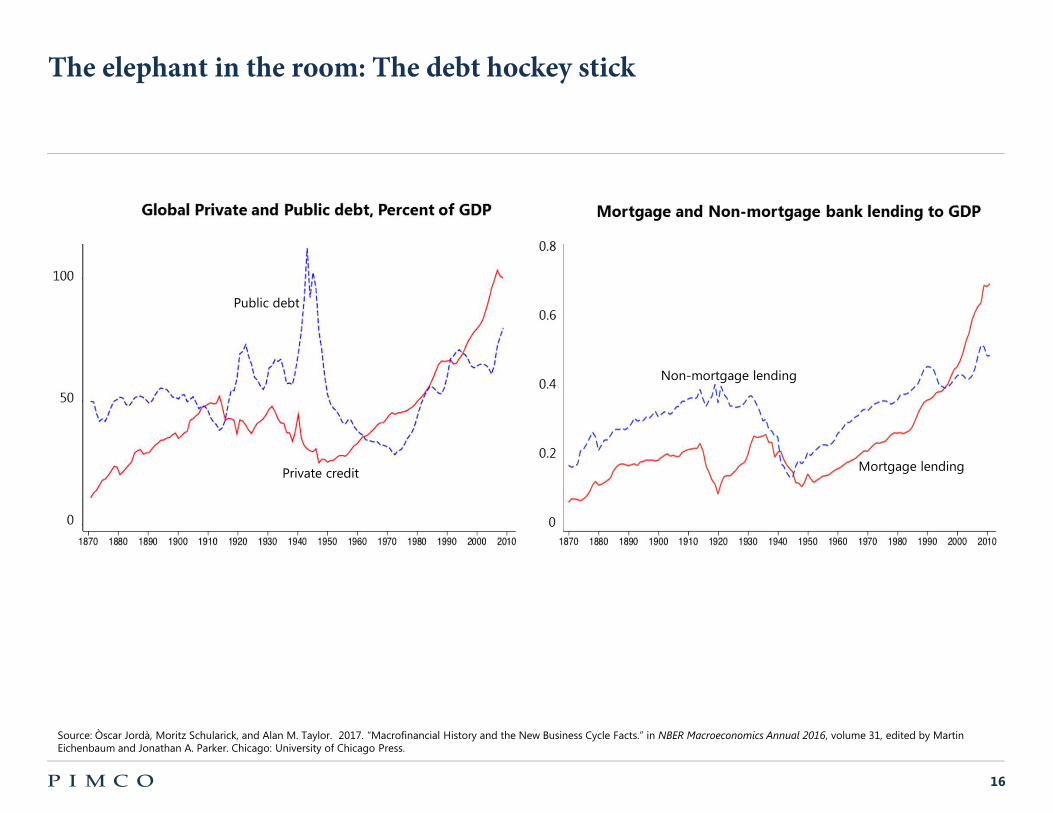
The elephant in the room: The debt hockey stick
Public debt
Private credit
Non-mortgage lending
Mortgage lending
Source Òscar Jordà, Moritz Schularick, and Alan M. Taylor. 2017. “Macrofinancial History and the New Business Cycle Facts.” in NBER Macroeconomics Annua 2016, volume 31, edited by Martin Eichenbaum and Jonathan A. Parker. Chicago University of Chicago Press.
16
Appendix
FORECAST Forecasts, estimates and certain information contained herein are based upon proprietary research and should not be interpreted as investment advice, as an offer or solicitation, nor as the purchase or sale of any financial instrument. Forecasts and estimates have certain inherent limitations, and unlike an actual performance record, do not reflect actual trading, liquidity constraints, fees, and/or other costs. In addition, references to future results should not be construed as an estimate or promise of results that a client portfolio may achieve. INVESTMENT STRATEGY There is no guarantee that these investment strategies will work under all market conditions or are suitable for all investors and each investor should evaluate their ability to invest long-term, especially during periods of downturn in the market. OUTLOOK Statements concerning financial market trends or portfolio strategies are based on current market conditions, which will fluctuate. There is no guarantee that these investment strategies will work under all market conditions or are suitable for all investors and each investor should evaluate their ability to invest for the long term, especially during periods of downturn in the market. Outlook and strategies are subject to change without notice. RISK Investing in the bond market is subject to risks, including market, interest rate, issuer, credit, inflation risk, and liquidity risk. The value of most bonds and bond strategies are impacted by changes in interest rates. Bonds and bond strategies with longer durations tend to be more sensitive and volatile than those with shorter durations; bond prices generally fall as interest rates rise, and the current low interest rate environment increases this risk. Current reductions in bond counterparty capacity may contribute to decreased market liquidity and increased price volatility. Bond investments may be worth more or less than the original cost when redeemed. Investing in foreign denominated and/or domiciled ecuritie may involve heightened risk due to currency fluctuations, and economic and political risks, which may be enhanced in emerging markets. Equitie may decline in value due to both real and perceived general market, economic, and industry conditions. This material contains the current opinions of the manager and such opinions are subject to change without notice. This material has been distributed for informational purposes only and should not be considered as investment advice or a recommendation of any particular security, strategy or investment product. Information contained herein has been obtained from sources believed to be reliable, but not guaranteed.
PIMCO provides services only to qualified institutions and investors. This is not an offer to any person in any jurisdiction where unlawful or unauthorized. | Pacific Inve tment Management Company LLC, 650 Newport Center Drive, Newport Beach, CA 92660 is regulated by the United States Securities and Exchange Commission.
These materials are being provided on the express basis that they and any related communications (whether written or oral) will not cause Pacific Investment Management Company LLC (or any affiliate) (collectively, “PIMCO”) to become an investment advice fiduciary under ERISA or the Internal Revenue Code, as the recipients are fully aware that PIMCO (i) is not undertaking to provide impartial investment advice, make a recommendation regarding the acquisition, holding or disposal of an investment, act as an impartial adviser, or give advice in a fiduciary capacity, and (ii) has a financial interest in the offering and sale of one or more products and services, which may depend on a number of factors relating to PIMCO (and its affiliates’) internal business objectives, and which has been disclosed to the recipient. These materials are also being provided on PIMCO’s understanding that the recipients they are directed to are all financially sophisticated, capable of evaluating investment risks independently, both in general and with regard to particular transactions and investment strategies. If this is not the case, we ask that you inform us immediately. You should consult your own separate advisors before making any investment decisions. These materials are also being provided on the express basis that they and any related communications will not cause PIMCO (or any affiliate) to become an investment advice fiduciary under ERISA or the Internal Revenue Code with respect to any recipient or any employee benefit plan or IRA because (i) the recipients are all independent of PIMCO and its affiliates, and (ii) upon review of all relevant facts and circumstances, the recipients have concluded that they have no financial interest, ownership interest, or other relationship, agreement or understanding with PIMCO or any affiliate that would limit any fiduciary responsibility that any recipient may have with respect to any Plan on behalf of which this information may be utilized. If this is not the case, or if there is any relationship with any recipient of which you are aware that would call into question the recipient’s ability to independently fulfill its responsibilities to any such Plan, we ask that you let us know immediately.
The information provided herein is intended to be used solely by the recipient in considering the products or services described herein and may not be used for any other reason, personal or otherwise.
CMR2019-0107-375046
17