global warming - lakehead university · ¨ global mean surface temperature increase of 2-4.5°c. ¨...
TRANSCRIPT

GLOBAL WARMING GEOG/ENST 3331 – Lecture 21 Ahrens: Chapter 16; Turco: Chapter 12

Previous lecture
¨ Radiation budget review ¨ Driving factors
¤ Albedo ¤ Solar forcing ¤ Greenhouse gases
¨ Feedbacks ¨ The “climate machine”

Last glacial maximum
¨ Ice sheets 3 500 – 4 000 m thick ¨ Sea level 120 m lower than today ¨ Globally averaged temperature was probably
5-8° C colder than today ¤ Regional temperature differences varied by distance to
ice sheets

Recent interglacial
Ahrens: Fig. 16.5

Last 1300 years
Zerolineis1961-1990averageglobaltemperatureAhrens:Figure16.6

Instrumental temperature record 1950-2015
Zero line is 1951-1980 average global temperature


Radiative Forcing
¨ A change in the driving factors that forces a change in the radiative balance ¤ Solar strength ¤ Albedo ¤ Greenhouse gases

IPCC
¨ Intergovernmental Panel on Climate Change ¨ Founded by United Nations in 1988 ¨ Purpose: to provide periodic assessments of the
current status of knowledge about climate change
¨ Does not conduct research ¨ Operates by consensus
¤ More likely to understate risks
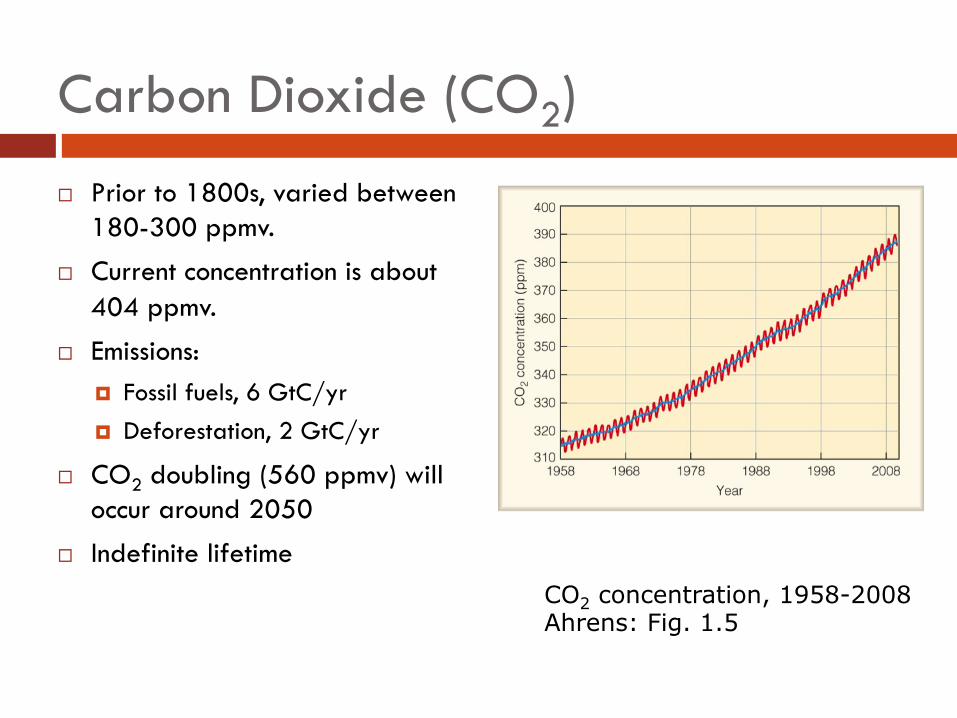
Carbon Dioxide (CO2)
¨ Prior to 1800s, varied between 180-300 ppmv.
¨ Current concentration is about 404 ppmv.
¨ Emissions: ¤ Fossil fuels, 6 GtC/yr ¤ Deforestation, 2 GtC/yr
¨ CO2 doubling (560 ppmv) will occur around 2050
¨ Indefinite lifetime CO2 concentration, 1958-2008 Ahrens: Fig. 1.5

Historical CO2
10000 years before 2005 Ahrens: Fig. 16.17

Carbon sinks
¨ Ocean ¤ Dissolution increases as atmospheric concentration
increases
¨ Terrestrial biosphere ¤ Photosynthesis on land is limited by CO2 availability ¤ Increased CO2 fertilizes growth
¨ Net effect ¤ Roughly 50% of new carbon persists in the atmosphere ¤ Reservoir is increasing by roughly 4 GtC per year

Methane (CH4)
1.78 ppmv
Strength:
26 times CO2 per molecule
Lifetime:
8-12 years
10000 years Ahrens: Fig. 16.17

Methane sources and sink
¨ Natural ¤ Wetlands, termites, oceans, chemical reactions
¨ Anthropogenic ¤ Ruminant livestock, gas/oil production, coal mining,
landfills and sewage, biomass burning ¨ Wetlands are single biggest source, but
anthropogenic sources are 60% of total
¨ Sink: ¤ Converted by atmospheric OH into CO2 and H2O

Nitrous Oxide (N2O)
319 ppbv
Strength:
206 times CO2 per molecule
Lifetime:
120 years
Ahrens: Fig. 16.17
Nitrous Oxide sources and sink
¨ Natural ¤ Lightning, fires, decomposition, oceans
¨ Anthropogenic ¤ Nitrogen fertilizers, fossil fuel and biomass combustion
¨ Sink: ¤ Converted by UV radiation in stratosphere to N2 and
NOx

Halocarbons (CFCs, HCFCs, HFCs)
¨ Used in refrigeration and air conditioning ¨ Atmospheric lifespan generally under 100 years
¤ some in the thousands of years
¨ Per molecule, several thousand times as strong as CO2
¨ Rapid increase since 1960s ¨ CFCs deplete stratospheric ozone; replaced by
HCFCs and HFCs

Other anthropogenic gases
¨ Sulphur Hexafluoride (SF6) ¤ Electrical insulator for power distribution ¤ Lifetime: 3 200 years ¤ Strength: 36 000 times as strong as CO2
¨ Perfluorocarbons (PFCs) ¤ Solvents, refrigerants ¤ Lifetime: thousands of years ¤ Strength: thousands of times as strong as CO2

Tropospheric ozone (O3)
¨ Doubled in the NH; in many cities it is up by 5-10 times preindustrial levels.
¨ Very short lifespan (hours) ¨ Ozone precursors:
¤ NO and NO2 ¤ VOCs
¨ Main sources: ¤ Burning biomass and fossil fuels

Stratospheric ozone (also O3)
¨ Decreasing trend due to CFCs and HCFCs ¨ Contributes to observed cooling in the stratosphere

Radiative Forcing
Source: IPCC AR4

Modelling climatic change
¨ Climate model simulations driven by: ¤ Solar forcing ¤ Volcanic forcing ¤ With (top) and without
(bottom) anthropogenic forcing
Ahrens: Fig. 16.19

Ahrens: Ch. 16 Fig. 4

Equilibrium response
¨ Decades after a change in forcing, climate will approach a new equilibrium
¨ Equivalent 2×CO2 ¤ Combination of all GHGs ¤ Will be reached by 2050 ¤ Global mean surface temperature increase of 2-4.5°C

Equilibrium response: High confidence
¨ Global mean surface temperature increase of 2-4.5°C.
¨ Greater warming at high latitudes ¨ Greater warming at high latitudes in winter ¨ Greater warming of continents than oceans ¨ More intense hydrological cycle ¨ Cooler stratosphere

Greater warming at high latitudes ¨ Reduced ice and snow cover
¤ Feedback is much stronger locally than globally
¨ Greater warming in winter: ¤ In the winter, sea ice insulates
air from warmer water ¤ Thinner ice means less
insulation ¤ Therefore the surface air
temperatures become higher
Source: NASA
Greater warming of continents
¨ Higher temperatures mean increased evapotranspiration ¤ Surface cooling through absorption of latent heat
¨ Over land, evapotranspiration is limited ¤ Actual evapotranspiration less than potential because
of limited water supply
¨ Over sea, evaporation occurs at the potential rate ¤ Water supply is unlimited

More intense hydrologic cycle
¨ Higher temperatures mean increased evapotranspiration
¨ Increased evapotranspiration means increased precipitation
¨ More rain (but not everywhere), and more frequent heavy rains
A&B: Figure 5-1
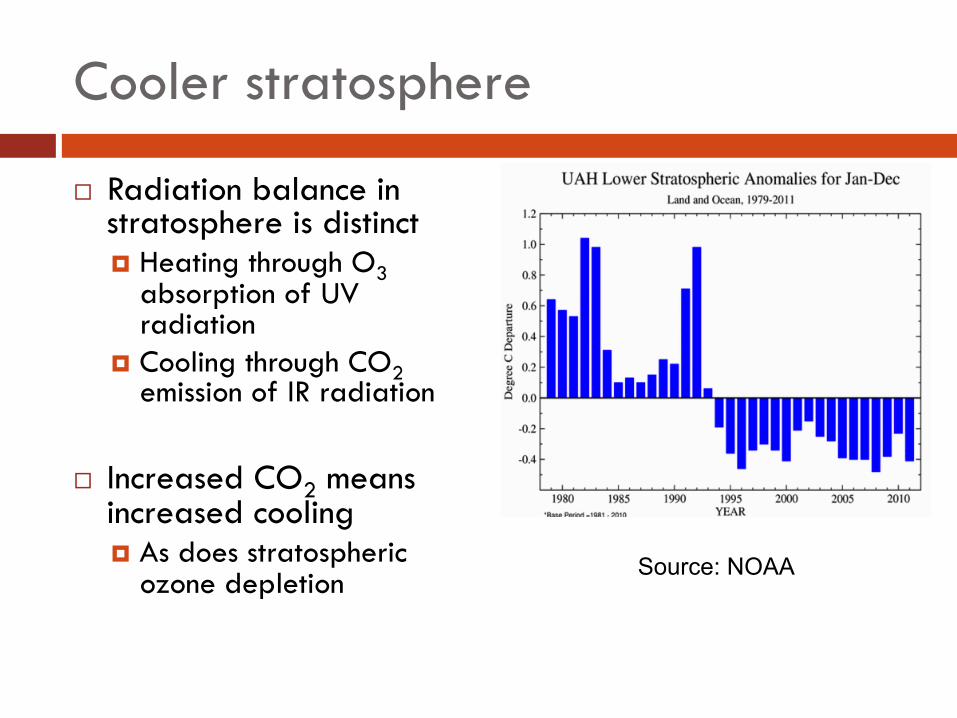
Cooler stratosphere
¨ Radiation balance in stratosphere is distinct ¤ Heating through O3
absorption of UV radiation
¤ Cooling through CO2 emission of IR radiation
¨ Increased CO2 means increased cooling ¤ As does stratospheric
ozone depletion Source: NOAA
Equilibrium response: Also likely
¨ Drier soils at mid-continents in summer ¨ Midlatitude precipitation belts will shift poleward ¨ Increased variability of precipitation
¤ More droughts and floods
¨ Stronger monsoons in Asia and West Africa
Storms
¨ Summer thunderstorms ¤ High confidence in becoming more intense and frequent ¤ Higher temperatures and higher humidity
¨ Midlatitude cyclones ¤ May get weaker ¤ Reduced meridional temperature gradient
¨ Tropical cyclones ¤ May be fewer but more powerful storms ¤ Some predictions of greater numbers in North Atlantic

Rise in sea level
¨ Melting ice sheets ¤ Greenland, Antarctica, high altitudes
¨ Thermal expansion
¨ Likely 25-100 cm by 2100 ¤ Could be more ¤ Will be more, eventually

Impact on natural systems
¨ Loss of habitat ¨ Species extinctions ¨ Ecosystem reorganization ¨ Forest diebacks
¤ Increased fire frequency

Impacts on human systems
¨ Agricultural losses, especially in tropics ¤ Heat-sensitive crops ¤ Valuable coastal land lost to sea level rise ¤ Droughts and floods
¨ Lots of population centres near the ocean
¨ Melting permafrost at high latitudes

Impacts on humans
¨ Water supply ¤ Moisture deficits more common ¤ Saline intrusion along coastlines
¨ Infectious diseases ¤ Disease vectors will shift poleward
n E.g. Malaria mosquito
¨ Heat stress

Mitigation
¨ Need to reduce GHG emissions from a large number of sources
¨ 1992: United Nations Framework Convention on Climate Change (UNFCCC) in Rio de Janiero
¨ 1997: Kyoto Protocol ¤ Ratified by 182 countries

Kyoto Protocol (1997)
¨ CO2, CH4, N2O, HFC, PFCs, SF6
¨ Annex I countries have individual targets for reductions in 2008-2012 compared to 1990
¨ Understanding that additional protocols will include all parties

Details
¨ Cost sharing: countries initially set their own targets ¨ Funding mechanisms: no current targets for LDCs ¨ Non-compliance: no penalties ¨ Policy instruments:
¤ Emissions trading between Annex I countries ¤ Joint implementation with LDCs
¨ Largely countries are on their own to meet targets domestically

Canada
¨ 2002: Ratified the treaty ¨ Never taken any meaningful steps ¨ Harper government withdrew Canada from Kyoto in
2011 at Durban (COP 17) ¨ Will fail to meet targets in 2020
¨ US: never ratified, but bigger reductions than Canada

Kyoto Protocol Targets
Member Target (1990 – 2008-2012)
EU-15, Bulgaria, Czech Republic, Estonia, Latvia, Liechtenstein, Lithuania, Monaco, Romania, Slovakia,
Slovenia, Switzerland
-8%
USA -7%
Canada, Hungary, Japan, Poland -6%
Croatia -5%
New Zealand, Russia, Ukraine 0
Norway +1%
Australia +8%
Iceland +10%
Overall commitment among these countries amounts to -5.6% of 1990 baseline.

Annual Conferences of the Parties (COPs) since Kyoto
COP 15 – Copenhagen (2009) ¤ No binding agreement or binding targets ¤ “Meaningful agreement” on 2°C as a maximum warming
COP 17 – Durban (2011) ¤ Future treaty to be signed in 2015, implemented in 2020 ¤ Kyoto objectives to continue until 2020
COP 18 – Doha (2012) q Wealthy countries may be liable for damages if
climate change is not mitigated COP 21 Paris (2015)

Where do we go from here?
¨ Follow-ups to Kyoto haven’t been inspiring ¤ Kyoto was never expected to do enough on its own
¨ Smaller international groups and actors
¨ Action by individual people is important but insufficient
¨ Change is required ¤ Reduce energy demand ¤ Switch to non-fossil energy sources

Next lecture
¨ Global Engineering