global views 09-19-14 - global banking and markets · global views is available on scotiabank.com,...
TRANSCRIPT

Foreign Exchange Strategy Fixed Income Strategy Fixed Income Research Emerging Markets Strategy Portfolio Strategy Economics
Weekly commentary on economic and financial market developments
Global Views
Corporate Bond Research
Contact Us
Global Views is available on scotiabank.com, Bloomberg at SCOT and Reuters at SM1C
September 19, 2014
Key Data Preview A1-A2
Key Indicators A3-A4
Global Auctions Calendar A5
Events Calendar A6
Global Central Bank Watch A7
Forecasts A8
Latest Economic Statistics A9-A10
Latest Financial Statistics A11
Forecasts & Data
This Week’s Featured Chart
Economics
Connecting The Dots 2-4
Derek Holt
Who’s Buying Treasuries? 5
Derek Holt
Wages Of The Crisis 6-7
Frances Donald and Dov Zigler
The Fed Can Step Away With The Confidence That Markets Will Adapt 8-9
Derek Holt
North America’s Manufacturing Rebound 10
Carlos Gomes and Neil Tisdall
Thailand’s Economic Outlook 11
Tuuli McCully
Fixed Income Strategy
Scottish Referendum — No Thanks! 12
Alan Clarke
Foreign Exchange Strategy
Latin America Week Ahead: For The Week Of September 22 - 26 13-14
Eduardo Suárez
60
80
100
120
140
160
180
90 94 98 02 06 10 14
Adjusted Canadian*
Adjusted U.S.
Official Canadian
* Reflects Statistics Canada's adjustment methodology for comparability.Source: Statistics Canada, Scotiabank Economics.
Household Credit Market Debt to Disposable Income Ratio
%
Economics
Global Views
September 19, 2014
2
Connecting The Dots
Please see our full indicator, central bank, auction and event calendars on pp. A3-A7.
United States — He Said, She Said
Federal Reserve officials will start to fill in the blanks in terms of the beliefs of individual FOMC members as ‘who said what’ and ‘which dot belongs to whom’ starts to come out into the open following the latest FOMC meeting. We know that Fisher and Plosser have stood out as hawkish dissenters, and Yellen’s guidance that she believes there to be more of a cyclical role in driving the labour force participation rate lower than a recent paper by staff economists concluded may have revealed herself to be among the lower ‘dots’, or among the more dovish members of the FOMC. We need to hear from more officials, however, and next week will provide just such an opportunity.
Next week’s key speakers who vote next year will include NY Fed President William Dudley (always voting) who delivers a Bloomberg interview and hence anything is fair game, Chicago Fed President Charles Evans (alternate 2014, voting 2015) on labour market slack, and Atlanta Fed President Dennis Lockhart (alternate 2014, voting 2015) who will comment on the economic outlook and monetary policy. FOMC members who don’t vote next year but who will of course contribute toward shaping the debate at the Fed and who also speak next week will include KC Fed President Esther George (nonvoting 2014, alternate 2015) who speaks twice on the economy, Cleveland Fed President Loretta Mester (voting 2014, alternate 2015) who will address the economic outlook and monetary policy, and St. Louis Fed President James Bullard (nonvoting 2014, alternate 2015) who delivers welcoming remarks at a conference.
One issue to be addressed is the consistency in various elements of Fed communications. To that effect, it’s likely that the ‘considerable time' reference to the period after ending bond purchases (October) to when rate hikes commence will be removed from the FOMC statement by year-end. December is the most likely meeting when that may happen, in our view. Key elements of the FOMC’s guidance are at loggerheads with one another such that one of three things must happen and happen soon consistent with our earlier writings. Option 1: they drop 'considerable time' and stick to the dots signaling hikes next year. Option 2: they keep 'considerable time' and punt the dots out in time or, Option 3: they are implying they'll quickly get off the lower zero bound to some threshold around 1.5% +/- before possibly taking a breather and do so in a very short period of time over late 2015. That would be like the BoC's move off the lower zero bound to 1%. I think option 1 is most likely, followed by option 3 and shifting the dots is unlikely unless they really get a sharp downside set of surprises. Regardless, while this is subject to one’s own judgement, when I hear ‘considerable time’ I think of it as something measured in years, not months or quarters, and so clarification of this issue is the main area of risk facing Fed communications over coming months.
Data risk is expected to be mixed but mildly constructive on balance. To the downside, durable goods orders are expected to drop sharply but that’s only because the prior month’s headline soared by 22.6% on a massive 318% (not a typo) gain in volatile aircraft orders and a large gain in orders for automotive vehicles and parts. A headline drop won’t be viewed harshly by markets and forecasters who are likely to throw it out and look to the next rung of figures in the report like durable goods orders ex-transportation which are expected to get a lift following the prior month’s weakness which itself followed a large gain in June and remains on a volatile path.
In the wake of the quarterly services spending report (here) that was released on September 11th and hence after both of the first two estimates for second quarter GDP growth, expectations are for next Friday’s third GDP report to be upwardly revised by a few tenths of a percentage point from the initial 4.2% annualized q/q gain. Bloomberg consensus expects sustained 3% q/q growth momentum over the rest of 2014-15 and this is consistent with views we have expressed since the start of the year minus our forecast failure for the first quarter that was heavily dragged down by a worse-than-usual winter. This remains an above-potential 3% growth outlook in my view that will challenge fans of secular stagnation views (go here for our fuller thoughts on this in the context of various issues governing the Fed outlook.
Derek Holt (416) 863-7707 [email protected]
THE WEEK AHEAD
Economics
Global Views
September 19, 2014
3
… continued from previous page
Housing updates will round out the hits, including prints for new home sales and existing home sales in August. A large 3%+ gain during July in pending home sales that mostly close within 30-60 days following the initial signatures is expected to buoy resales in August that have fully recovered the winter-swoon effect by climbing back to levels last seen in October of last year. After two months of sharp declines in new home sales that total a hit of over 9% and that have reversed most of the large 10% gain in May, consensus is betting that August will be kinder and restore new home sales to a more positive trend.
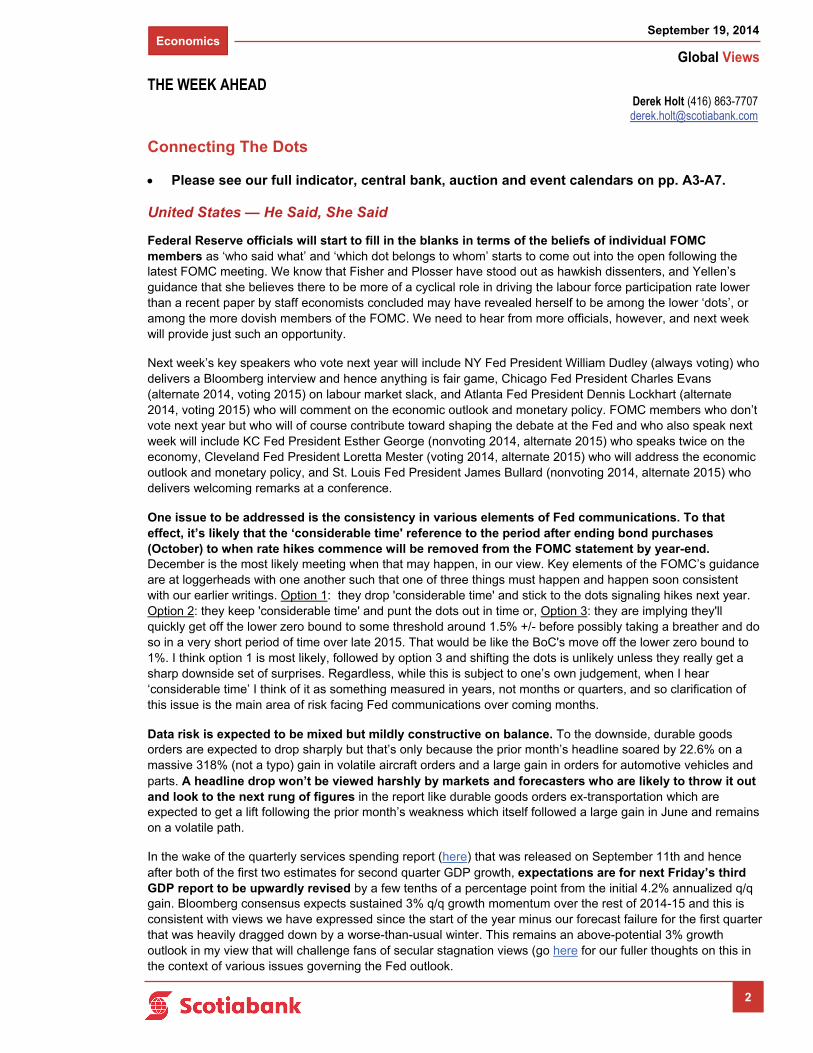
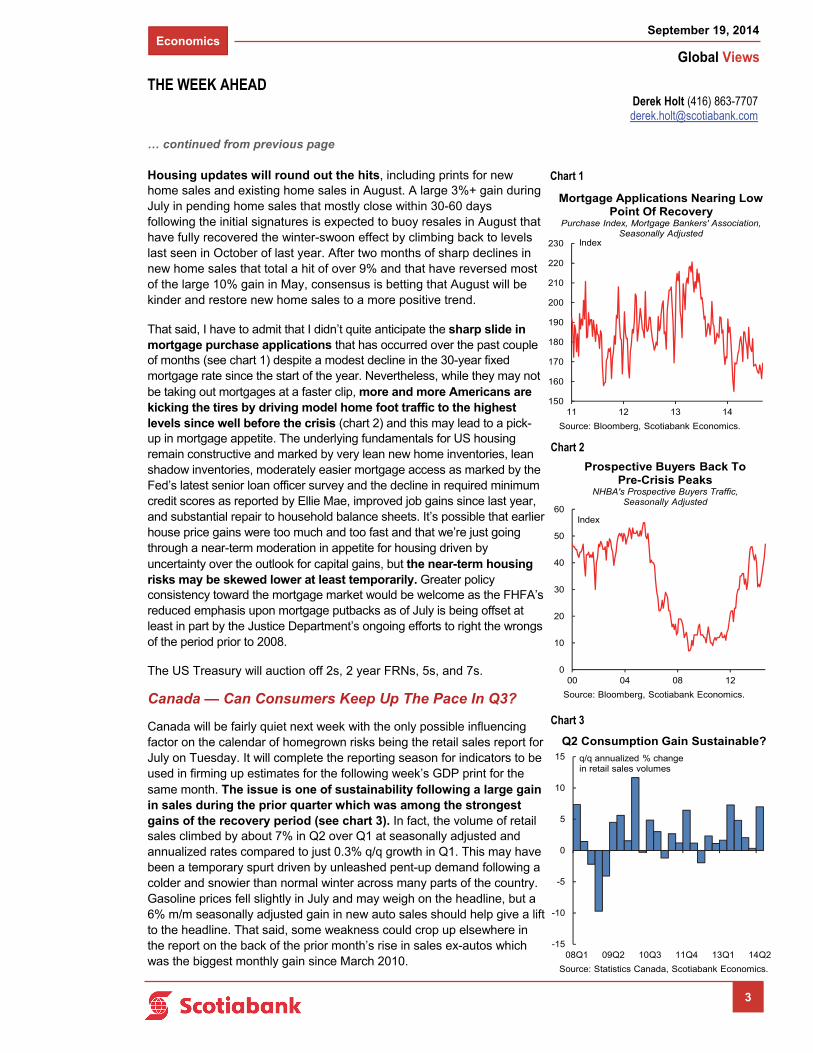
That said, I have to admit that I didn’t quite anticipate the sharp slide in mortgage purchase applications that has occurred over the past couple of months (see chart 1) despite a modest decline in the 30-year fixed mortgage rate since the start of the year. Nevertheless, while they may not be taking out mortgages at a faster clip, more and more Americans are kicking the tires by driving model home foot traffic to the highest levels since well before the crisis (chart 2) and this may lead to a pick-up in mortgage appetite. The underlying fundamentals for US housing remain constructive and marked by very lean new home inventories, lean shadow inventories, moderately easier mortgage access as marked by the Fed’s latest senior loan officer survey and the decline in required minimum credit scores as reported by Ellie Mae, improved job gains since last year, and substantial repair to household balance sheets. It’s possible that earlier house price gains were too much and too fast and that we’re just going through a near-term moderation in appetite for housing driven by uncertainty over the outlook for capital gains, but the near-term housing risks may be skewed lower at least temporarily. Greater policy consistency toward the mortgage market would be welcome as the FHFA’s reduced emphasis upon mortgage putbacks as of July is being offset at least in part by the Justice Department’s ongoing efforts to right the wrongs of the period prior to 2008.
The US Treasury will auction off 2s, 2 year FRNs, 5s, and 7s.
Canada — Can Consumers Keep Up The Pace In Q3?
Canada will be fairly quiet next week with the only possible influencing factor on the calendar of homegrown risks being the retail sales report for July on Tuesday. It will complete the reporting season for indicators to be used in firming up estimates for the following week’s GDP print for the same month. The issue is one of sustainability following a large gain in sales during the prior quarter which was among the strongest gains of the recovery period (see chart 3). In fact, the volume of retail sales climbed by about 7% in Q2 over Q1 at seasonally adjusted and annualized rates compared to just 0.3% q/q growth in Q1. This may have been a temporary spurt driven by unleashed pent-up demand following a colder and snowier than normal winter across many parts of the country. Gasoline prices fell slightly in July and may weigh on the headline, but a 6% m/m seasonally adjusted gain in new auto sales should help give a lift to the headline. That said, some weakness could crop up elsewhere in the report on the back of the prior month’s rise in sales ex-autos which was the biggest monthly gain since March 2010.
Derek Holt (416) 863-7707 [email protected]
THE WEEK AHEAD
-15
-10
-5
0
5
10
15
08Q1 09Q2 10Q3 11Q4 13Q1 14Q2
Source: Statistics Canada, Scotiabank Economics.
q/q annualized % change in retail sales volumes
Q2 Consumption Gain Sustainable?
Chart 3
150
160
170
180
190
200
210
220
230
11 12 13 14
Source: Bloomberg, Scotiabank Economics.
Index
Mortgage Applications Nearing Low Point Of Recovery
Purchase Index, Mortgage Bankers' Association,Seasonally Adjusted
Chart 1
0
10
20
30
40
50
60
00 04 08 12
Source: Bloomberg, Scotiabank Economics.
Index
Prospective Buyers Back To Pre-Crisis Peaks
NHBA's Prospective Buyers Traffic, Seasonally Adjusted
Chart 2

Economics
Global Views
September 19, 2014
4
… continued from previous page
On Monday, the BoC’s Senior Deputy Governor Carolyn Wilkins speaks. This will be her inaugural solo talk since having been appointed to the role back in April and her views on monetary policy matters are not well known in the markets. Wilkins’ speech title is: “The New Economic Reality For Canada Emerging In The Wake Of The Great Recession And What It Means For Monetary Policy.” There will be audience Q&A but no press conference.
Province watchers may also have an eye on New Brunswick’s election on Monday. The ruling Conservative government holds 41 of 55 seats going into the election but is generally well behind in the polls with the Liberals leading. The Liberals are offering higher infrastructure spending and some flag the election as a harbinger of what may transpire in the October 2015 Federal election. Canada auctions 3 year bonds on Wednesday.
Asia — China Slowing?
There are two points of relevance to Asia-macro watchers in next week’s line-up. First is whether China’s manufacturing sector is bottoming. Second is the possibility that the crest in Japanese inflation may stabilize for a moment before resuming what we think will be a downward trend back to one-handled inflation by next April. At that point, the sales tax hike on April 1st 2014 shakes out of the base effects, peak contributions to CPI from electricity price increases may wane, and the effects on import prices of yen depreciation that was concentrated when Abenomics began to be speculated upon from September 2012 to the summer of 2013 may have shaken out. Temporary risks to this view include the possibility of the second sales tax hike later this year or early next which would delay the reversal of base effect arguments until late 2015 or early 2016, and uncertainty over the current trajectory of the yen which commenced depreciating again over the past couple of months as Federal Reserve signals gradually shift toward a tightening bias. Tertiary releases of regional significance will include trade figures from a handful of territories including Hong Kong, New Zealand and Philippines.
It may well be that a bottom in China’s private manufacturing PMI will have to wait until the following month when the People’s Bank of China’s liquidity injection takes effect. Recall that the private PMI differs from the state’s PMI because it is skewed toward smaller producers in more export-oriented coastal cities. They, in turn, are more likely to be dependent upon bank credit and short-term market liquidity. With the PBoC easing liquidity pressures facing banks just this past week, the lagged effects may be focused on smaller firms and hence more focused upon the private PMI. That said, the PBoC’s measures have been relatively modest in nature and not a story changer against the theme that easing off the massive post-2008 acceleration in credit growth likely remains a core policy objective in China.
Europe — Survey Says...
Sentiment surveys will drive much of the European market action next week, apart from developments abroad. Germany’s purchasing managers’ index for the manufacturing sector is on tap for Tuesday and economy watchers will be hoping that the downward trend since January will be arrested. Ditto for the IFO business confidence gauge (see chart 4). Given that the ZEW investors expectations reading for September has already retreated, it’s probable that any hope that the other two survey measures will reach bottom is likely premature. France will also release PMIs for the manufacturing and service sectors, and possible revisions to Q2 GDP after the first print registered no growth throughout the first half of this year.
Moody’s may also update sovereign debt ratings for the European Financial Stability Facility (EFSF) and European Stability Mechanism (ESM) possibly by Friday. Moody’s had already revised its outlook from negative to stable in June.
Derek Holt (416) 863-7707 [email protected]
THE WEEK AHEAD
-30
-20
-10
0
10
20
30
40
50
60
70
01.2012 04.2013 07.2014
Source:Bloomberg, Scotiabank Economics.
Index
Souring German Sentiments
ZEW Survey
Chart 4
Economics
Global Views
September 19, 2014
5
Who’s Buying Treasuries?
Fresh figures from the US Federal Reserve show that buying remains driven by foreign buyers and the Federal Reserve as opposed to domestic investors.
Who’s buying all those Treasuries and therefore driving yields unexpectedly lower so far this year? Theories abound, but only hard data can test them. We do this by drawing upon the Fed’s comprehensive ‘flow of funds’ accounts that were just updated with Q2 figures.
Fed and Foreign Buyers Continue To Dominate
There are two ways of looking at the buying of securities issued by the Treasury department and we consider both: all securities, and issues ex-bills that mostly consist of Treasuries with some saving bonds.
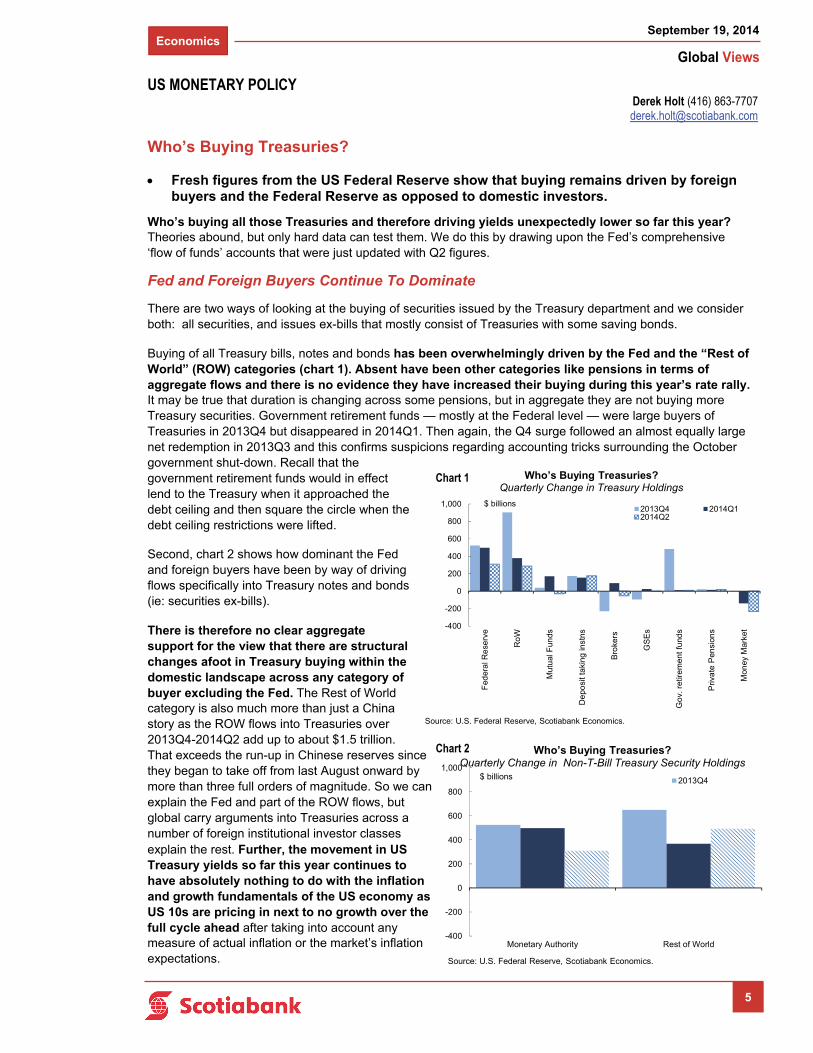
Buying of all Treasury bills, notes and bonds has been overwhelmingly driven by the Fed and the “Rest of World” (ROW) categories (chart 1). Absent have been other categories like pensions in terms of aggregate flows and there is no evidence they have increased their buying during this year’s rate rally. It may be true that duration is changing across some pensions, but in aggregate they are not buying more Treasury securities. Government retirement funds — mostly at the Federal level — were large buyers of Treasuries in 2013Q4 but disappeared in 2014Q1. Then again, the Q4 surge followed an almost equally large net redemption in 2013Q3 and this confirms suspicions regarding accounting tricks surrounding the October government shut-down. Recall that the government retirement funds would in effect lend to the Treasury when it approached the debt ceiling and then square the circle when the debt ceiling restrictions were lifted.
Second, chart 2 shows how dominant the Fed and foreign buyers have been by way of driving flows specifically into Treasury notes and bonds (ie: securities ex-bills).
There is therefore no clear aggregate support for the view that there are structural changes afoot in Treasury buying within the domestic landscape across any category of buyer excluding the Fed. The Rest of World category is also much more than just a China story as the ROW flows into Treasuries over 2013Q4-2014Q2 add up to about $1.5 trillion. That exceeds the run-up in Chinese reserves since they began to take off from last August onward by more than three full orders of magnitude. So we can explain the Fed and part of the ROW flows, but global carry arguments into Treasuries across a number of foreign institutional investor classes explain the rest. Further, the movement in US Treasury yields so far this year continues to have absolutely nothing to do with the inflation and growth fundamentals of the US economy as US 10s are pricing in next to no growth over the full cycle ahead after taking into account any measure of actual inflation or the market’s inflation expectations.
Derek Holt (416) 863-7707 [email protected]
US MONETARY POLICY
-400
-200
0
200
400
600
800
1,000
Fed
era
l Re
serv
e
Ro
W
Mut
ual
Fun
ds
De
posi
t ta
king
inst
ns
Bro
kers
GS
Es
Go
v. r
etire
men
t fu
nds
Priv
ate
Pen
sion
s
Mon
ey M
arke
t
2013Q4 2014Q12014Q2
Who’s Buying Treasuries?Quarterly Change in Treasury Holdings
Source: U.S. Federal Reserve, Scotiabank Economics.
$ billions
-400
-200
0
200
400
600
800
1,000
Monetary Authority Rest of World
2013Q4
Who’s Buying Treasuries?Quarterly Change in Non-T-Bill Treasury Security Holdings
Source: U.S. Federal Reserve, Scotiabank Economics.
$ billions
Chart 1
Chart 2
Economics
Global Views
September 19, 2014
6
Wages Of The Crisis
The financial crisis displaced U.S. workers into part-time and lower-paying jobs — and their return to full-time work in the years ahead will have an opposite effect, boosting wages.
Wage growth in the U.S. has been extraordinarily low in the wake of the financial crisis in part because of the large share of the working population displaced into part-time jobs and lower-paying sectors. Five years after the financial crisis, both of these trends are reversing. The transition of underemployed Americans into full-time jobs, a trend that has already established itself, has driven wage growth up off of highly unusual very-low crisis levels and will continue to do so. From a labor markets perspective, this will help to justify the removal of emergency monetary policy measures.
Why have wage gains been so weak?
The financial crisis of 2008-09 had a dramatic effect on the labor market, pushing the unemployment rate to 10%, and eliminating more than eight million jobs. The recovery has been gradual and a great many displaced workers have struggled to find jobs. For some, the jobs available have paid less than those which prevailed prior to the crisis.
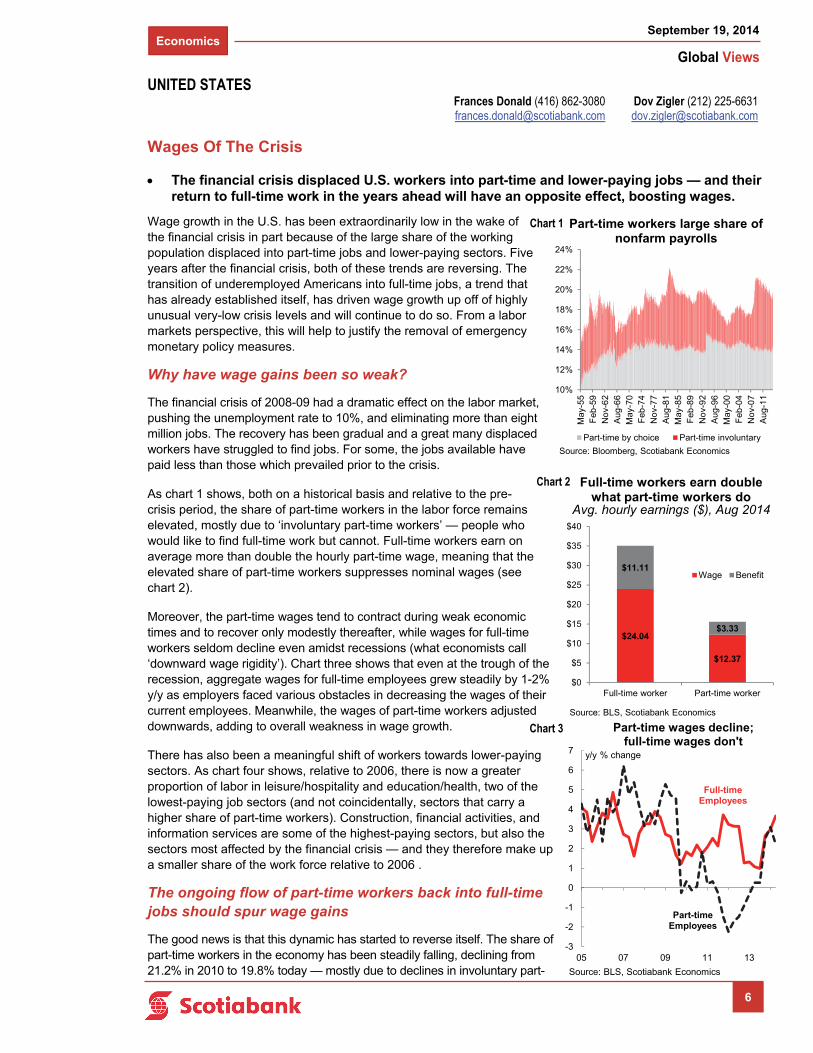
As chart 1 shows, both on a historical basis and relative to the pre-crisis period, the share of part-time workers in the labor force remains elevated, mostly due to ‘involuntary part-time workers’ — people who would like to find full-time work but cannot. Full-time workers earn on average more than double the hourly part-time wage, meaning that the elevated share of part-time workers suppresses nominal wages (see chart 2).
Moreover, the part-time wages tend to contract during weak economic times and to recover only modestly thereafter, while wages for full-time workers seldom decline even amidst recessions (what economists call ‘downward wage rigidity’). Chart three shows that even at the trough of the recession, aggregate wages for full-time employees grew steadily by 1-2% y/y as employers faced various obstacles in decreasing the wages of their current employees. Meanwhile, the wages of part-time workers adjusted downwards, adding to overall weakness in wage growth.
There has also been a meaningful shift of workers towards lower-paying sectors. As chart four shows, relative to 2006, there is now a greater proportion of labor in leisure/hospitality and education/health, two of the lowest-paying job sectors (and not coincidentally, sectors that carry a higher share of part-time workers). Construction, financial activities, and information services are some of the highest-paying sectors, but also the sectors most affected by the financial crisis — and they therefore make up a smaller share of the work force relative to 2006 .
The ongoing flow of part-time workers back into full-time jobs should spur wage gains
The good news is that this dynamic has started to reverse itself. The share of part-time workers in the economy has been steadily falling, declining from 21.2% in 2010 to 19.8% today — mostly due to declines in involuntary part-
Dov Zigler (212) 225-6631 [email protected]
Frances Donald (416) 862-3080 [email protected]
UNITED STATES
10%
12%
14%
16%
18%
20%
22%
24%
May
-55
Feb
-59
No
v-6
2A
ug-6
6M
ay-7
0F
eb-7
4N
ov-
77
Aug
-81
May
-85
Feb
-89
No
v-9
2A
ug-9
6M
ay-0
0F
eb-0
4N
ov-
07
Aug
-11
Part-time by choice Part-time involuntary
Source: Bloomberg, Scotiabank Economics
Part-time workers large share of nonfarm payrolls
-3
-2
-1
0
1
2
3
4
5
6
7
05 07 09 11 13
Source: BLS, Scotiabank Economics
y/y % change
Part-time wages decline; full-time wages don't
Full-timeEmployees
Part-time Employees
Chart 1
Chart 3
$24.04
$12.37
$11.11
$3.33
$0
$5
$10
$15
$20
$25
$30
$35
$40
Full-time worker Part-time worker
Wage Benefit
Source: BLS, Scotiabank Economics
Full-time workers earn double what part-time workers do
Avg. hourly earnings ($), Aug 2014
Chart 2

Economics
Global Views
September 19, 2014
7
… continued from previous page
time workers. These declines have not just been a result of people dropping out of the labor force: those working part-time for economic reasons are finally finding full-time jobs. As the share of part-time workers declines, we expect aggregate wages — and wage gains — to improve, and for employee compensation costs to rise as once part-time workers gain full-time employee benefits.
Structural or cyclical?
Pessimists argue that the share of workers employed in lower-paying sectors (and at part-time jobs) is structural, stemming not just from the crisis but also from larger factors including globalization, information technology, nagging underinvestment and low productivity, etc. This logic, popular among the secular stagnation crowd, dictates that wages are unlikely to rise because workers are likely to remain in lower-paying sectors indefinitely. We disagree. First, even if some of the sectoral displacement is structural, the continuing migration of part-time workers into full-time jobs, even within lower-paying sectors, should boost wages. Pongrace and Zilberman’s “A Comparison of Hourly Wage Rates for Full- and Part-Time Workers by Occupation” (2007) showed that full-time workers earn statistically significantly more per hour than part-time workers for the same job in 94% of occupations examined.
The point is that while a broad shift of workers into higher-wage sectors would help matters, the near-term impetus for wage growth could come from migration of part-time workers to full-time work alone. It could take years to sort out the question of the structural migration of workers out of higher value add sectors, but our core view, as expressed in “New Normal, or Simply the Same Old Mistake” is that we’ve heard the stagnation argument in prior decades — and didn’t buy it then and don’t buy it now.
Not a normal labor market recovery — but a recovery nonetheless
Ultimately, we are seeing a recovery from some of the more extreme labor market distortions created by the financial crisis. As the labor market continues to normalize, wages will accelerate as the business cycle matures — although for different reasons than we have seen in most other business cycles.
The implications for monetary policy as we see them are: (i) The labor underutilization of the post-crisis period will not necessarily mean subdued wage growth as the business cycle matures, and (ii) even if labor markets are not nearly as healed as the recent drop in the unemployment rate to 6.1% would suggest, the most extreme distortion in the labor market — namely extreme labor market underutilization and correspondent downward wage pressure — is abating.
This means that from the perspective of the Federal Reserve’s full employment mandate, even if a neutral monetary policy might not yet be appropriate, a monetary policy conducted at emergency levels isn’t justified by the labor data either.
Dov Zigler (212) 225-6631 [email protected]
Frances Donald (416) 862-3080 [email protected]
UNITED STATES
0%
5%
10%
15%
20%
25%
Leis
ure
/Hos
pita
lity
Tra
de
Edu
catio
n/H
ealth
Man
ufa
ctur
ing
Co
nstr
uctio
n
Pro
f. &
bus
ine
ss
Fin
anc
ial A
ctiv
itie
s
Min
ing
/Log
gin
g
Info
rma
tion
2006
2014
A sectoral shift to lower paying jobs% of total private payrolls, by sector
Source: Bureau of Labor Statistics, Scotiabank Economics
$10
$15
$20
$25
$30
$35
Leis
ure
/Hos
pita
lity
Tra
de
Edu
catio
n/H
ealth
Man
ufa
ctur
ing
Co
nstr
uctio
n
Pro
f & B
usi
ness
Fin
anc
ial a
ctiv
ities
Min
ing
and
Lo
ggin
g
Info
rma
tion
Source: Bureau of Labor Statistics, Scotiabank Economics
Average hourly earnings, by sector
Chart 4
Chart 5
Economics
Global Views
September 19, 2014
8
The Fed Can Step Away With The Confidence That Markets Will Adapt
This is a summary of a fuller collection of essays on various issues connected with the policy outlook for the U.S. Federal Reserve.
As the Federal Reserve debates shifting toward the exit phase, there remain hotly contested areas of debate on a multitude of issues that are all germane to the outlook for bond, equity and currency markets. Our aim in a recently released publication was hardly to answer all or even most of them, but to assemble condensed views on several of the most important issues. The purpose to doing so is to collect together a broad thesis that stock, bond and currency markets are capable of adapting to a different phase of Fed policies and that delaying tightening due to low-for-long soft growth expectations carries risks that probably outweigh benefits.
To this latter point, an important issue concerns whether popular ‘this time is different’ or ‘new normal’ or ‘secular stagnation’ views of the US economy and markets are correct and offer appropriate justifications of continued emergency stimulus. One way of considering this issue is explored in the second article of the aforementioned publication. This article reviews the track record of past forecasts for potential US GDP growth (the noninflationary speed limit, not actual GDP growth). That track record is not pretty. Since the early 1990s, forecasters have demonstrated a repeated tendency to get caught up in the moment and forecast perpetually weak potential growth coming out of soft spots in the economy, and perpetually strong growth coming off periods of strength. Yes, the recent global crisis has been worse than most predecessors, but the current common view that potential growth will be permanently blighted by debt shocks and less favourable demographics was also prevalent in the early 1990s coming off of the combined effects of the LDC debt crisis, the junk bond financing wave and its aftermath, the thrift crisis, and the completed entry of baby boomers into labour, housing and consumer markets — only to be fully revised away later. Indeed, that view was eventually sharply rewritten in 1994 in that year’s sharp bond market sell-off as the Fed aggressively raised the fed funds target rate. This is not intended to be a focus on the outlook for the US economy but suffice it to say that we’re encouraged enough by what we see in the US economy to believe that the risks are skewed toward the consensus and the Fed repeating the same mistake.
The third article in the publication explains why the Federal Reserve’s policies are not — or rather, not yet — creating material inflation upsides. The issues boil down to tools that the Federal Reserve is already employing to counteract the effectiveness of its own expansionary programs in a way that differs markedly from the 1970s, and how to define ‘money.’ The fact that such policies have, in our opinion, removed sharp inflation downsides is nevertheless part of why we think monetary stimulus can be reduced.
The fourth article offers a different perspective to recent Fed research (here) on why the labour force participation rate has declined. Much of this valuable research is strictly US-centric, and yet the international evidence suggests somewhat different results. Canada, for instance, has a virtually identical population pyramid to that of the United States, and yet Canada’s participation rate has declined by considerably less which may be due to a more resilient economy.
That said, how much of an issue is it if labour market slack is being underestimated? The connecting debate is what it means to wage growth, and to what extent that matters. In the fifth article, we argue that we don’t think that weak wage growth is a reason for the Fed to hold back on normalizing interest rate policy; wages only tend to rise later in economic cycles, and the economy can progress a great deal — so much so that it no longer requires emergency levels of monetary accommodation — well before wages rebound, at which point it is often too late and ill-timed shifts in monetary policy risk amplifying boom-bust cycles.
The rest of the articles address policy linkages with various aspects of financial markets beyond previously expressed views on why the Fed cannot let EM concerns hold it back (go here). The sixth article extends our longstanding argument that Fed policy would not debase the USD and therefore one might be cautious regarding the flip side of the argument that it will strongly appreciate along a straight line versus all comers going forward. By extension, this means that the Federal Reserve could likely reduce stimulus without worrying excessively about currency effects on US exports which, in turn, could continue to get a boost in net terms from supply-side developments in the US energy sector.
Derek Holt (416) 863-7707 [email protected]
US MONETARY POLICY

Economics
Global Views
September 19, 2014
9
… continued from previous page
The seventh article argues that the Fed’s role in driving stock markets is often over-stated. Fears that money supply will shrink as Fed policy unwinds would require large net asset selling which is contrary to most guidance from the Fed. In any event, stock valuations are much more about the earnings outlook than poor historical connections to money supply measures.
The eighth article updates a longstanding thesis of ours (like here) that the Fed can shut down its bond purchase program without significantly deleterious implications for bond markets since the supply side marked by net Treasury issuance has also vastly reduced compared to peak episodes of bond buying by the Federal Reserve. The fact that bonds have only rallied during the ‘tapering’ phase supports this view and provides the Fed cover for further stepping away from markets.
Finally, one of the accomplishments of the Fed’s emergency monetary policies has been to help reflate the housing market by leaning on MBS yields. We expect that even as the Fed raises rates, it will only cautiously exit the MBS market as it does its best to maintain an accommodative policy for homeowners even as policy tightens in money markets.
Derek Holt (416) 863-7707 [email protected]
US MONETARY POLICY
Economics
Global Views
September 19, 2014
10
North America’s Manufacturing Rebound
Canada and the U.S. build momentum.
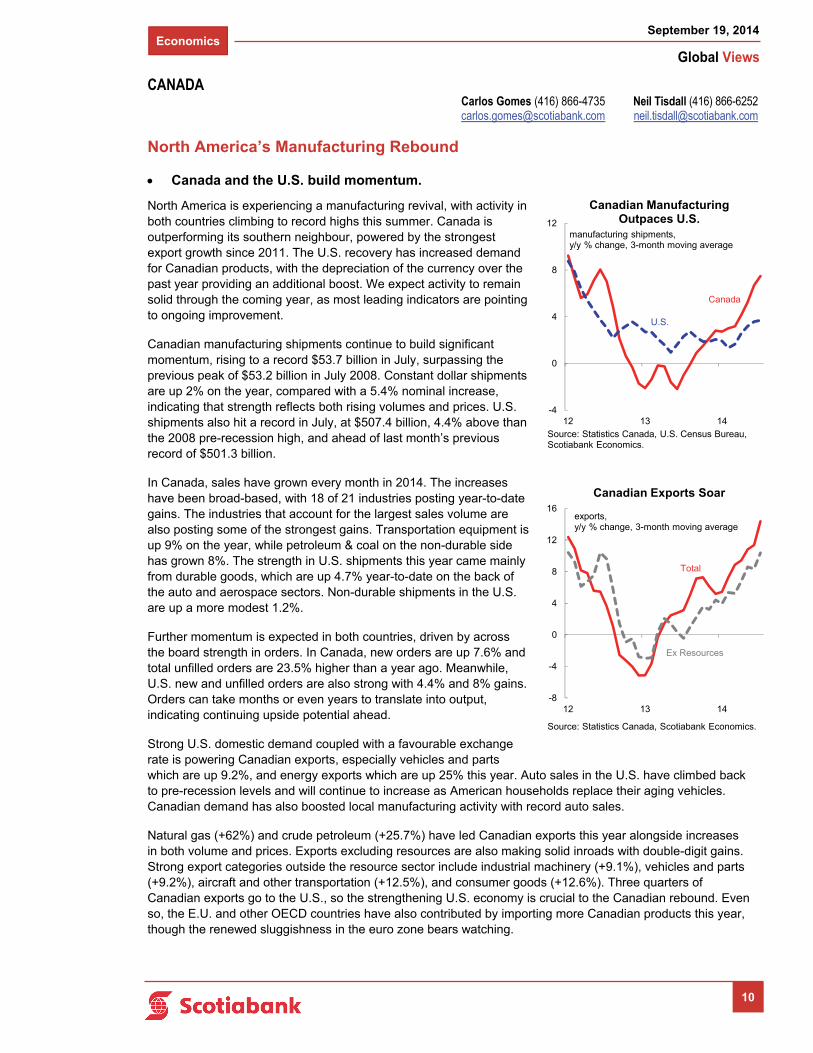
North America is experiencing a manufacturing revival, with activity in both countries climbing to record highs this summer. Canada is outperforming its southern neighbour, powered by the strongest export growth since 2011. The U.S. recovery has increased demand for Canadian products, with the depreciation of the currency over the past year providing an additional boost. We expect activity to remain solid through the coming year, as most leading indicators are pointing to ongoing improvement.
Canadian manufacturing shipments continue to build significant momentum, rising to a record $53.7 billion in July, surpassing the previous peak of $53.2 billion in July 2008. Constant dollar shipments are up 2% on the year, compared with a 5.4% nominal increase, indicating that strength reflects both rising volumes and prices. U.S. shipments also hit a record in July, at $507.4 billion, 4.4% above than the 2008 pre-recession high, and ahead of last month’s previous record of $501.3 billion.
In Canada, sales have grown every month in 2014. The increases have been broad-based, with 18 of 21 industries posting year-to-date gains. The industries that account for the largest sales volume are also posting some of the strongest gains. Transportation equipment is up 9% on the year, while petroleum & coal on the non-durable side has grown 8%. The strength in U.S. shipments this year came mainly from durable goods, which are up 4.7% year-to-date on the back of the auto and aerospace sectors. Non-durable shipments in the U.S. are up a more modest 1.2%.
Further momentum is expected in both countries, driven by across the board strength in orders. In Canada, new orders are up 7.6% and total unfilled orders are 23.5% higher than a year ago. Meanwhile, U.S. new and unfilled orders are also strong with 4.4% and 8% gains. Orders can take months or even years to translate into output, indicating continuing upside potential ahead.
Strong U.S. domestic demand coupled with a favourable exchange rate is powering Canadian exports, especially vehicles and parts which are up 9.2%, and energy exports which are up 25% this year. Auto sales in the U.S. have climbed back to pre-recession levels and will continue to increase as American households replace their aging vehicles. Canadian demand has also boosted local manufacturing activity with record auto sales.
Natural gas (+62%) and crude petroleum (+25.7%) have led Canadian exports this year alongside increases in both volume and prices. Exports excluding resources are also making solid inroads with double-digit gains. Strong export categories outside the resource sector include industrial machinery (+9.1%), vehicles and parts (+9.2%), aircraft and other transportation (+12.5%), and consumer goods (+12.6%). Three quarters of Canadian exports go to the U.S., so the strengthening U.S. economy is crucial to the Canadian rebound. Even so, the E.U. and other OECD countries have also contributed by importing more Canadian products this year, though the renewed sluggishness in the euro zone bears watching.
CANADA
-4
0
4
8
12
12 13 14
Canadian Manufacturing Outpaces U.S.
Canada
manufacturing shipments, y/y % change, 3-month moving average
Source: Statistics Canada, U.S. Census Bureau, Scotiabank Economics.
U.S.
-8
-4
0
4
8
12
16
12 13 14
Canadian Exports Soar
Total
exports, y/y % change, 3-month moving average
Source: Statistics Canada, Scotiabank Economics.
Ex Resources
Neil Tisdall (416) 866-6252 [email protected]
Carlos Gomes (416) 866-4735 [email protected]

Economics
Global Views
September 19, 2014
11
Thailand’s Economic Outlook
Improving confidence regarding the Thai economy reflects the stabilization of the political situation combined with the junta’s focus on growth revival.
Thailand’s growth momentum will continue to rebuild gradually in the coming months as the military administration prioritizes an economic revival. Real GDP rebounded by 0.4% y/y in the second quarter of the year, following a 0.5% y/y contraction in the January-March period. We expect output gains to average 1.6% in 2014, followed by a pick-up to close to 4% next year. The recovery will be driven by net exports and public outlays, while improving private sector confidence bodes well for consumption and investment prospects. With almost 27 million visitors annually, the tourism sector is a major economic driver; tourism receipts amount to US$42 billion annually, equivalent to 11% of the country’s annual output. Reflecting the political and social turmoil, the number of visitors dropped by 8% y/y in the first seven months of the year, compared with a 20% gain in 2013 as a whole. The stabilization of the political situation will help the tourism industry to begin recovering in the near term; the approaching high season will play a key role in the economy’s overall performance.
Inflation in Thailand remains manageable; the headline consumer price index increased by 2.1% y/y in August, recording a modest deceleration from prior months on the back of price controls implemented by the military rule as well as lower food costs. We expect inflation to hover in the 2%-2¾% y/y range through 2015. Despite the moderate inflation environment, the Bank of Thailand will likely keep the benchmark interest rate unchanged at 2% in the coming months. We do not foresee any monetary easing as the central bank continues to highlight its independence and the military administration uses fiscal stimulus, particularly infrastructure spending, as a means to boost economic activity. The most recent interest rate cut of 25 basis points took place in March 2014.
The Thai baht (THB) has been weathering the political turmoil well, assisted by Thai monetary authorities who stand ready to intervene in the case of excess currency volatility. The THB may face modest depreciation pressure against the US dollar (USD) in the near term, reflecting asset re-allocation in favour of developed capital markets. The THB will likely close the year at 33.5 per USD.
Political turmoil, which initially flared up in November 2013, triggered a coup d'état on May 22nd as negotiations between the caretaker administration and the opposition failed. At the end of July, the junta appointed legislators to the 200-member National Assembly; a month later, a new cabinet consisting of various leading military figures was selected. Prime Minister General Prayuth Chan-ocha has indicated that democracy will be restored by the end of 2015, yet uncertainty in this regard persists. In the meantime, the administration aims to focus primarily on structural reforms and the drafting of a new constitution.
Tuuli McCully (416) 863-2859 [email protected]
ASIA
-10
-5
0
5
10
15
20
Mar-10 Mar-11 Mar-12 Mar-13 Mar-14
Real GDP Growth
y/y % change
Source: Bloomberg.
0.0
0.5
1.0
1.5
2.0
2.5
3.0
3.5
4.0
4.5
5.0
Jan-10 Jan-11 Jan-12 Jan-13 Jan-14
Consumer Price Inflation
Source: Bloomberg.
y/y % change
65
67
69
71
73
75
77
79
81
83
85
Jan-11 Jan-12 Jan-13 Jan-14
Source: Bloomberg.
Index
Consumer Confidence

Fixed Income Strategy
Global Views
September 19, 2014
12
Scottish Referendum — No Thanks!
After a short lovers tiff, Scotland and the rest of the UK have decided that their marriage that has lasted for over 300 years will go on. The outcome of the Scottish independence referendum showed 45% for independence versus 55% for the unionist ‘no’ camp.
While there is likely to be speculation that since it was such a close outcome, another referendum can’t be far away, it is worth stressing that the SNP pledged during the campaign not to have another poll for a generation. When pressed on timing, the Scottish First Minister suggested that this meant around 20 years. As a guide, there was a 15 year gap between the first Quebec referendum and the re-run. This removes a considerable amount of the uncertainty in the aftermath of the referendum, but there is plenty of unfinished business that will have to be hammered out in the coming weeks and months.
Market implications — GBP/USD rallied but not dramatically. The currency had already recovered much of the lost ground following the first opinion poll to show the ‘yes’ camp in the lead 2 weeks ago. As such there was much less further movement to the upside than the downside potential had there been a ‘yes’ outcome.
The gilt curve flattened a little, but again, a ‘No’ outcome had largely been priced in ahead of time (despite the very tight opinion polls). The market marginally brought forward the timing of the first Bank of England interest rate hike now that the risk of a ‘yes’ outcome has gone. There is probably a limit to how much earlier the first hike gets priced in since there has been some key dove-friendly developments in the last month or so. Meanwhile, longer-dated bonds rallied as investors that had taken risk off the table and shortened duration came back to the market.
Devo Max — During the latter stages of the referendum campaign, the main party leaders from Westminster pledged to devolve greater powers to Scotland. The specifics of this ‘deal’ are likely to come out in the coming weeks. More specifically, since the 1998 Scotland act, Holyrood already has control over:
Education; The environment; Health; Housing; Law and order; and Sports and the arts.
Meanwhile London still has control over:
Defence; Foreign policy; Employment; Benefits and social security; Immigration; and The Constitution
Devo max would give Holyrood the power over everything except defence and foreign affairs. If this is the deal that is delivered, it would give Scotland full fiscal autonomy, i.e., the Scottish parliament receives all taxation levied in Scotland, but would pay the UK government to cover Scotland’s share in UK wide services including defence and foreign relations.
Devolving more powers to Scotland means that Westminster politicians do not have a say on Scottish matters, yet Scottish MPs still have a say on matters affecting England and Wales. This issue will be addressed in the weeks and months ahead.
Conclusion
All in all, the ‘no’ outcome came as a relief to the market, though there will be some residual fine-tuning left to run once the dust settles. The reduced uncertainty is likely to see the market bring forward the timing of the first BoE rate hike again, though within reason. Inflation has been far lower than expected since the August Inflation Report. Depending on how the GBP exchange rate moves in the coming days, this could lead to another downward revision to the Bank’s inflation projection. In turn that should prevent market expectations of a hike coming too far forward. We still expect the first move to come in February.
Alan Clarke (44 207) 826-5986 [email protected]
Foreign Exchange Strategy
Global Views
September 19, 2014
13
Latin America Week Ahead: For The Week Of September 22 - 26
Highlights from the past week
Our G10 FX team wrote an interesting summary of the key take-aways from a wild week:
Fed — dovish statement, hawkish dots and a warning that interest rate hikes might prove less predictable than they have in the past, puts all the focus on data releases from here.
UK — Scotland votes to stay within the union but the U.K. remains clouded in political uncertainty as Cameron faces a challenged road ahead, potentially delaying BoE interest rate hikes.
ECB — the first TLTRO has a €82.6bn allotment, below expectations; and today’s LTRO repayments jump higher, all warning that for Europe supply of capital isn’t the issue, it is demand. This puts pressure on the ECB, forcing an ongoing dovish policy mix.
Inflation releases from the U.S., Eurozone and U.K. all suggest that pressures are not building and warns that overall slack in the global economy remains high. This deflates expectations for an interest rate hiking cycle.
Market reaction — Over the last five sessions, CAD, GBP, NOK and MXN are higher and gold, EUR, AUD, CHF and JPY have dropped; while U.S. 2-year and 10-year yields are higher (with the 10-2 curve flat at 2.04%) and global equities stronger.
FX going forward — without a clear hawkish shift from the Fed and with inflation off its highs, the USD bull trend is still the core theme but its path has likely been dampened. Accordingly, we still expect EUR and JPY to lose ground but the pace is likely to slow.
Week-ahead views:
Brazil: Last night’s Datafolha poll showed second round voter intentions for Silva and Rousseff are statistically equal, with Marina marginally edging out Dilma 46%-44%. However, the trend seems to indicate a recent modest rebound by Rousseff. Near term, it almost seems like a done deal that a second round run-off will be necessary, and the changes in TV time allocations that take place for R2 could mean that current trends will be poor predictors of post-round 1 patterns. With the BCB seemingly on pause until after the elections, economic data releases are likely to fall into the back-seat until after October 26th (the second round, the first is scheduled for October 5th, but a run-off seems highly likely). However, the BCB’s Quarterly Inflation Report is worth watching for updated views on the economy, given that policy direction after the elections will be important to understand for rates / FX markets. A lot of the candidates’ debate on the economic policy front seems to centre on monetary policy, and the optimum degree of independence that should be granted to the BCB. However, change will likely be very gradual, even with the candidates who favour a stronger shift in direction.
In addition, with the country’s rating still a question mark, the release of Federal debt data is also worth watching, although the key indicator on this front is likely to be the primary surplus’s trend / result. FinMin Mantega is not expected to be part of any of the potential future governments; local media has reported he plans to leave the FinMin due to personal reasons. However, he did indicate that the government’s counter-cyclical fiscal policy is about to end, which he said would pave the way for interest rate cuts, given he described the current monetary policy settings as too tight (which we don’t agree with; we believe current settings are neutral, and the IMF’s estimates seem to suggest the same).
Chile: This looks set to be a very quiet week, in terms of data, where the BCCh’s traders’ survey may well be the top economic release. However, if the trend from the ending week continues, it should still be an exciting one for CLP.
Eduardo Suárez (416) 945-4538 [email protected]

Foreign Exchange Strategy
Global Views
September 19, 2014
14
… continued from previous page
Colombia: This week’s highlight is likely to be BanRep’s meeting, where there are two interesting stories to consider:
1. Will the FX intervention program be extended, despite the move up to 1970 in USD/COP? We think it will, as members of BanRep’s board, including Governor Uribe this week, have said the weaker peso is positive for the economy, and also because the intervention program is defined as an “up to” amount of USD purchases, not an absolute target — hence the central bank can accumulate less USD if it deems necessary.
2. Is the rate hike cycle at an end? We believe this is a tougher question, but ultimately lean towards the hiking cycle ending at the current 4.5% settings. So far, three of the board’s members have signaled the hiking cycle has now come to an end (Maiguashca, Cano and Cardenas). Meisel and Uribe seem harder to call; Governor Uribe said the output gap is closed, but he also said he expects inflation near 3% by year-end, while co-Director Meisel said he thinks rates at 4.5% are still providing stimulus to the economy (which he described as positive), while the economy was operating “near potential”. Between Vallejo and Zarate our sense is that Zarate could on the margin be more likely to push for additional hikes, but ultimately we think that a majority will vote for “on hold rates”. According to the Bloomberg survey, 2 out of 12 analysts expect “no change”.
Mexico: This week we are scheduled to get the monthly economic activity index (IGAE) for July, where it will be important to see whether strengthening of the economy continues. Recent indicators showed that although the previous “leader sectors” lost some steam, the rebound is becoming more broad based, which is a positive sign in our view. In addition, CPI data is also worth watching, as markets continue to debate when the first rate hikes will come in Mexico, although Banxico has also signaled it will be closely watching the Fed… which makes sense to us. USD/MXN seems to have settled on a 13.14-13.30 range for now, but remains subject to Fed related swings.
Eduardo Suárez (416) 945-4538 [email protected]

Economics
Global Views
September 19, 2014
15
Key Data Preview
CANADA
Can Canadian retail sales keep up their momentum into Q3? Retail sales in June were very strong at 1.1% m/m amidst a general consumer spending spree in Q2. The June gain was driven by a surge in sales of food, clothes, sporting goods — pretty much everything except cars. We think that July sales should also be solid at 0.3% m/m, this time on an uptick in car sales even if there is bit of a pull-back in a variety of other categories. Our call is premised on a strong increase in sales of new cars, with Scotiabank’s Carlos Gomes estimating that a seasonally adjusted 1.93m cars were sold in July compared to 1.89m in June. The risk worth noting, however, is that some of the strong gains in core sales in June may reverse themselves aggressively, dampening gains from the autos side of the picture, which explains our 0% m/m ex-autos call. Also, the drop in gasoline prices should provide moderate downward pressure moving into August. The survey of large retailers will be released early next week and could cause us to modify our call somewhat.
UNITED STATES
Durable goods orders for August bring substantial risk after a 22.6% m/m print in July on massive orders of planes as well as cars propelled durable goods orders to their biggest monthly gain on record. We’re expecting a pull back on the order of 17% m/m as much of the surge in the level of orders reverses itself and durable goods return to a more sustainable path. Other factors that normally influence our calls with respect to durable goods don’t quite matter as much given the prior month’s volatility, but for what it’s worth, 107 planes were ordered at Boeing in August vs. 324 in July, and vehicle production flagged moderately after a very strong month, pointing to fewer just-in-time orders. The ISM index remained elevated pointing to upside to orders ex-transportation. Also watch for strength in capital goods orders and shipments, which have been very strong of late (see chart).
New home sales in August should be solid on a rebound from a very weak July, and we’re looking for an increase to an annualized 435k sales as foot traffic at model homes has been climbing reliably. Other leading indicators, including the mortgage purchase index, were soft, however, thus subduing some of our enthusiasm. That is similarly the case when it comes to existing home sales, which should benefit from an increase in the index of pending home sales (see chart), which ought to point to strength; however, overall softness in mortgage apps tempers this enthusiasm and leaves us looking for a flat number.
The third round of GDP revisions have some upside risk. We think GDP could be marked up to 4.6% q/q annualized for two reasons: a) an increase in registered services spending at hospitals in the quarterly survey of services should result in upward revisions, and b) strong trade numbers for July brought with them strong revisions to June that could point to a bit less of a drag from trade than initially registered.
Dov Zigler (212) 225-6631 [email protected]
Derek Holt (416) 863-7707 [email protected]
Frances Donald (416) 862-3080 [email protected]
A1
45
50
55
60
65
70
75
06 08 10 12 14OrdersShipments12 per. Mov. Avg. (Orders)
US$,Billions
Source: Census Bureau, Scotiabank Economics
Capital Goods Orders & Shipments(Non-Defense, Ex-Air)
Back Above Pre-Crisis Levels
80
85
90
95
100
105
110
115
11 13
Pending Home sales
Index
Source: Bloomberg, Scotiabank Economics
Housing Leading Indicators Rebounding?
Economics
Global Views
September 19, 2014
16
… continued from previous page
EUROPE
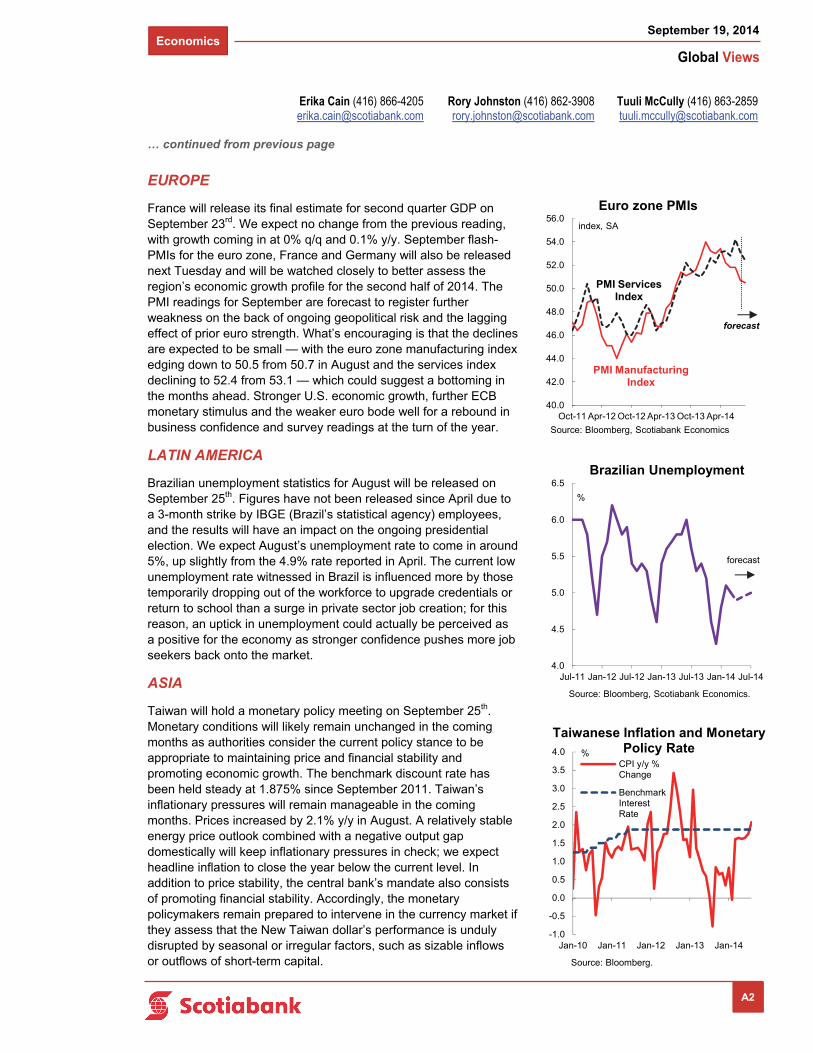
France will release its final estimate for second quarter GDP on September 23rd. We expect no change from the previous reading, with growth coming in at 0% q/q and 0.1% y/y. September flash-PMIs for the euro zone, France and Germany will also be released next Tuesday and will be watched closely to better assess the region’s economic growth profile for the second half of 2014. The PMI readings for September are forecast to register further weakness on the back of ongoing geopolitical risk and the lagging effect of prior euro strength. What’s encouraging is that the declines are expected to be small — with the euro zone manufacturing index edging down to 50.5 from 50.7 in August and the services index declining to 52.4 from 53.1 — which could suggest a bottoming in the months ahead. Stronger U.S. economic growth, further ECB monetary stimulus and the weaker euro bode well for a rebound in business confidence and survey readings at the turn of the year.
LATIN AMERICA
Brazilian unemployment statistics for August will be released on September 25th. Figures have not been released since April due to a 3-month strike by IBGE (Brazil’s statistical agency) employees, and the results will have an impact on the ongoing presidential election. We expect August’s unemployment rate to come in around 5%, up slightly from the 4.9% rate reported in April. The current low unemployment rate witnessed in Brazil is influenced more by those temporarily dropping out of the workforce to upgrade credentials or return to school than a surge in private sector job creation; for this reason, an uptick in unemployment could actually be perceived as a positive for the economy as stronger confidence pushes more job seekers back onto the market.
ASIA
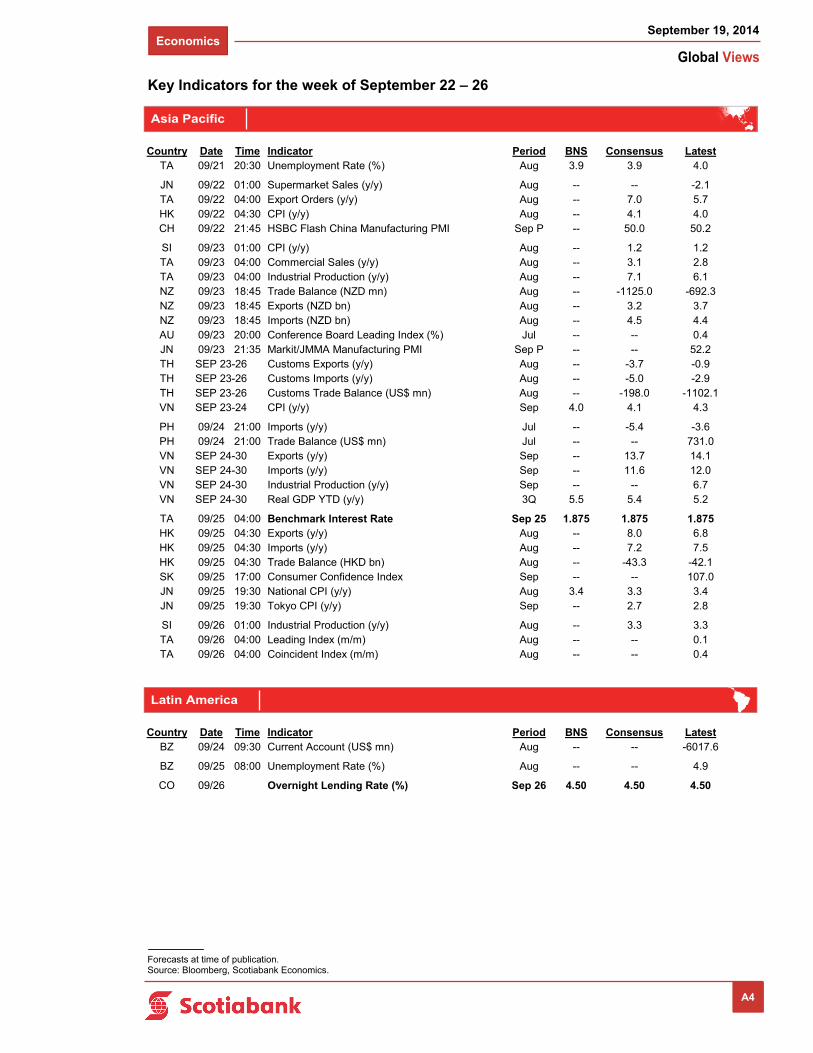
Taiwan will hold a monetary policy meeting on September 25th. Monetary conditions will likely remain unchanged in the coming months as authorities consider the current policy stance to be appropriate to maintaining price and financial stability and promoting economic growth. The benchmark discount rate has been held steady at 1.875% since September 2011. Taiwan’s inflationary pressures will remain manageable in the coming months. Prices increased by 2.1% y/y in August. A relatively stable energy price outlook combined with a negative output gap domestically will keep inflationary pressures in check; we expect headline inflation to close the year below the current level. In addition to price stability, the central bank’s mandate also consists of promoting financial stability. Accordingly, the monetary policymakers remain prepared to intervene in the currency market if they assess that the New Taiwan dollar’s performance is unduly disrupted by seasonal or irregular factors, such as sizable inflows or outflows of short-term capital.
A2
Tuuli McCully (416) 863-2859 [email protected]
Rory Johnston (416) 862-3908 [email protected]
Erika Cain (416) 866-4205 [email protected]
4.0
4.5
5.0
5.5
6.0
6.5
Jul-11 Jan-12 Jul-12 Jan-13 Jul-13 Jan-14 Jul-14
Brazilian Unemployment
Source: Bloomberg, Scotiabank Economics.
%
forecast
-1.0
-0.5
0.0
0.5
1.0
1.5
2.0
2.5
3.0
3.5
4.0
Jan-10 Jan-11 Jan-12 Jan-13 Jan-14
CPI y/y %Change
BenchmarkInterestRate
Taiwanese Inflation and Monetary Policy Rate
Source: Bloomberg.
%
40.0
42.0
44.0
46.0
48.0
50.0
52.0
54.0
56.0
Oct-11 Apr-12 Oct-12 Apr-13 Oct-13 Apr-14
Euro zone PMIs
Source: Bloomberg, Scotiabank Economics
index, SA
forecast
PMI Manufacturing Index
PMI Services Index

Economics
Global Views
September 19, 2014
1
Key Indicators for the week of September 22 – 26
Forecasts at time of publication. Source: Bloomberg, Scotiabank Economics.
North America
Europe
A3
Country Date Time Indicator Period BNS Consensus LatestMX 09/22 09:00 Unemployment Rate (%) Aug -- -- 5.5US 09/22 10:00 Existing Home Sales (mn a.r.) Aug 5.15 5.20 5.15US 09/22 10:00 Existing Home Sales (m/m) Aug -- 1.0 2.4
CA 09/23 08:30 Retail Sales (m/m) Jul 0.3 0.4 1.1CA 09/23 08:30 Retail Sales ex. Autos (m/m) Jul 0.0 -0.2 1.5MX 09/23 09:00 Retail Sales (INEGI) (y/y) Jul -- -- 1.1US 09/23 10:00 Richmond Fed Manufacturing Index Sep 14 10 12
US 09/24 07:00 MBA Mortgage Applications (w/w) SEP 19 -- -- 7.9MX 09/24 09:00 Bi-Weekly Core CPI (% change) Sep 15 -- 0.1 0.1MX 09/24 09:00 Bi-Weekly CPI (% change) Sep 15 -- 0.2 0.2MX 09/24 09:00 Global Economic Indicator IGAE (y/y) Jul -- 2.1 2.7US 09/24 10:00 New Home Sales (000s a.r.) Aug 435 430 412
US 09/25 08:30 Initial Jobless Claims (000s) SEP 20 290 300 280US 09/25 08:30 Continuing Claims (000s) SEP 13 2420 2440 2429US 09/25 08:30 Durable Goods Orders (m/m) Aug -20.0 -17.9 22.6US 09/25 08:30 Durable Goods Orders ex. Trans. (m/m) Aug 0.7 0.7 -0.7
US 09/26 08:30 GDP (q/q a.r.) 2Q T 4.6 4.6 4.2US 09/26 08:30 GDP Deflator (q/q a.r.) 2Q T -- 2.1 2.1MX 09/26 09:00 Trade Balance (US$ mn) Aug P -- -- -979.9US 09/26 09:55 U. of Michigan Consumer Sentiment Sep F -- 85.0 84.6
Country Date Time Indicator Period BNS Consensus LatestEC 09/22 10:00 Consumer Confidence Sep A -- -10.5 -10.0
FR 09/23 02:45 GDP (q/q) 2Q F 0.0 0.0 0.0FR 09/23 03:00 Manufacturing PMI Sep P -- 47.0 46.9FR 09/23 03:00 Services PMI Sep P -- 50.2 50.3GE 09/23 03:30 Manufacturing PMI Sep P -- 51.2 51.4GE 09/23 03:30 Services PMI Sep P -- 54.6 54.9EC 09/23 04:00 Composite PMI Sep P -- 52.5 52.5EC 09/23 04:00 Manufacturing PMI Sep P 50.5 50.6 50.7EC 09/23 04:00 Services PMI Sep P 52.4 53.0 53.1UK 09/23 04:30 PSNB ex. Interventions (£ bn) Aug -- 11.8 0.2UK 09/23 04:30 Public Finances (PSNCR) (£ bn) Aug -- 6.0 -9.7UK 09/23 04:30 Public Sector Net Borrowing (£ bn) Aug -- 10.2 -1.1HU 09/23 08:00 Base Rate (%) Sep 23 2.10 2.10 2.10
GE 09/24 04:00 IFO Business Climate Survey Sep 105.1 105.8 106.3GE 09/24 04:00 IFO Current Assessment Survey Sep 109.5 110.2 111.1GE 09/24 04:00 IFO Expectations Survey Sep 101.0 101.2 101.7FR 09/24 12:00 Total Jobseekers (000s) Aug 3449.0 3441.0 3424.4FR 09/24 12:00 Jobseekers Net Change (000s) Aug 25.0 16.5 26.1
TU 09/25 07:00 Benchmark Repo Rate (%) Sep 25 8.25 8.25 8.25UK SEP 25-30 Nationwide House Prices (m/m) Sep -- 0.5 0.8
GE 09/26 02:00 GfK Consumer Confidence Survey Oct -- 8.5 8.6
Economics
Global Views
September 19, 2014
2
Key Indicators for the week of September 22 – 26
Forecasts at time of publication. Source: Bloomberg, Scotiabank Economics.
A4
Asia Pacific
Latin America
Country Date Time Indicator Period BNS Consensus LatestTA 09/21 20:30 Unemployment Rate (%) Aug 3.9 3.9 4.0
JN 09/22 01:00 Supermarket Sales (y/y) Aug -- -- -2.1TA 09/22 04:00 Export Orders (y/y) Aug -- 7.0 5.7HK 09/22 04:30 CPI (y/y) Aug -- 4.1 4.0CH 09/22 21:45 HSBC Flash China Manufacturing PMI Sep P -- 50.0 50.2
SI 09/23 01:00 CPI (y/y) Aug -- 1.2 1.2TA 09/23 04:00 Commercial Sales (y/y) Aug -- 3.1 2.8TA 09/23 04:00 Industrial Production (y/y) Aug -- 7.1 6.1NZ 09/23 18:45 Trade Balance (NZD mn) Aug -- -1125.0 -692.3NZ 09/23 18:45 Exports (NZD bn) Aug -- 3.2 3.7NZ 09/23 18:45 Imports (NZD bn) Aug -- 4.5 4.4AU 09/23 20:00 Conference Board Leading Index (%) Jul -- -- 0.4JN 09/23 21:35 Markit/JMMA Manufacturing PMI Sep P -- -- 52.2TH SEP 23-26 Customs Exports (y/y) Aug -- -3.7 -0.9TH SEP 23-26 Customs Imports (y/y) Aug -- -5.0 -2.9TH SEP 23-26 Customs Trade Balance (US$ mn) Aug -- -198.0 -1102.1VN SEP 23-24 CPI (y/y) Sep 4.0 4.1 4.3
PH 09/24 21:00 Imports (y/y) Jul -- -5.4 -3.6PH 09/24 21:00 Trade Balance (US$ mn) Jul -- -- 731.0VN SEP 24-30 Exports (y/y) Sep -- 13.7 14.1VN SEP 24-30 Imports (y/y) Sep -- 11.6 12.0VN SEP 24-30 Industrial Production (y/y) Sep -- -- 6.7VN SEP 24-30 Real GDP YTD (y/y) 3Q 5.5 5.4 5.2
TA 09/25 04:00 Benchmark Interest Rate Sep 25 1.875 1.875 1.875HK 09/25 04:30 Exports (y/y) Aug -- 8.0 6.8HK 09/25 04:30 Imports (y/y) Aug -- 7.2 7.5HK 09/25 04:30 Trade Balance (HKD bn) Aug -- -43.3 -42.1SK 09/25 17:00 Consumer Confidence Index Sep -- -- 107.0JN 09/25 19:30 National CPI (y/y) Aug 3.4 3.3 3.4JN 09/25 19:30 Tokyo CPI (y/y) Sep -- 2.7 2.8
SI 09/26 01:00 Industrial Production (y/y) Aug -- 3.3 3.3TA 09/26 04:00 Leading Index (m/m) Aug -- -- 0.1TA 09/26 04:00 Coincident Index (m/m) Aug -- -- 0.4
Country Date Time Indicator Period BNS Consensus LatestBZ 09/24 09:30 Current Account (US$ mn) Aug -- -- -6017.6
BZ 09/25 08:00 Unemployment Rate (%) Aug -- -- 4.9
CO 09/26 Overnight Lending Rate (%) Sep 26 4.50 4.50 4.50

Economics
Global Views
September 19, 2014
3
Global Auctions for the week of September 22 – 26
North America
Europe
Source: Bloomberg, Scotiabank Economics.
A5
Country Date Time EventUS 09/22 11:30 U.S. to Sell USD24 Bln 3-Month BillsUS 09/22 11:30 U.S. to Sell USD23 Bln 6-Month Bills
CA 09/23 10:30 Canada to Sell CAD4.200 Bln 96-Day BillsCA 09/23 10:30 Canada to Sell CAD1.650 Bln 182-Day BillsCA 09/23 10:30 Canada to Sell CAD1.650 Bln 364-Day BillsUS 09/23 11:00 U.S. Fed to Purchase USD1.60-1.90 Bln NotesUS 09/23 11:30 U.S. to Sell 4-Week BillsUS 09/23 13:00 U.S. to Sell USD29 Bln 2-Year Notes
US 09/24 11:00 U.S. Fed to Purchase USD0.95-1.15 Bln NotesUS 09/24 11:30 U.S. to Sell USD13 Bln 2-Year Floating Rate Notes ReopeningCA 09/24 12:00 Canada to Sell 3-Year BondsUS 09/24 13:00 U.S. to Sell USD35 Bln 5-Year Notes
US 09/25 13:00 U.S. to Sell USD29 Bln 7-Year Notes
Country Date Time EventBE 09/22 05:30 Belgium to Sell BondsBE 09/22 05:30 Belgium to Sell 3% 2034 Bonds on Sept. 22FR 09/22 08:50 France to Sell 12-Week BillsFR 09/22 08:50 France to Sell 21-Week BillsFR 09/22 08:50 France to Sell 51-Week Bills
SP 09/23 04:30 Spain to Sell 3-Month and 9-Month BillsNO 09/23 05:00 Norway to Sell BondsSZ 09/23 05:15 Switzerland to Sell 95-Day Bills
NE 09/24 04:00 Netherlands to Sell New 5-Year BondMB 09/24 05:00 Malta to Sell BillsSW 09/24 05:03 Sweden to Sell BillsNE 09/24 05:30 Netherlands to Sell Up to EUR4 Bln 2020 Bonds on Sept. 24
IT 09/25 05:00 Italy to Sell I/L and Zero Coupon BondsSW 09/25 05:03 Sweden to Sell I/L Bonds on Sept. 25
IT 09/26 05:00 Italy to Sell BillsUK 09/26 06:00 U.K. to Sell 1-Month BillsUK 09/26 06:00 U.K. to Sell 3-Month BillsUK 09/26 06:00 U.K. to Sell 6-Month Bills
Asia Pacific
Latin America
Country Date Time EventAU 09/22 21:00 Australia Plans to Sell Index Linked Bonds
JN 09/24 23:35 Japan to Sell 3-Month Bill
JN 09/25 04:00 Japan Auction for Enhanced-Liquidity
Country Date Time EventBZ 09/23 11:15 Brazil to Sell I/L Bonds due 5/15/2019 - NTN-BBZ 09/23 11:15 Brazil to Sell I/L Bonds due 5/15/2023 - NTN-BBZ 09/23 11:15 Brazil to Sell I/L Bonds due 8/15/2030 - NTN-BBZ 09/23 11:15 Brazil to Sell I/L Bonds due 8/15/2040 - NTN-BBZ 09/23 11:15 Brazil to Sell I/L Bonds due 8/15/2050 - NTN-B
BZ 09/25 11:15 Brazil to Sell Bills due 10/01/2015 - LTNBZ 09/25 11:15 Brazil to Sell Bills due 10/01/2016 - LTNBZ 09/25 11:15 Brazil to Sell Bills due 07/01/2018 - LTN

Economics
Global Views
September 19, 2014
4
Events for the week of September 22 – 26
North America
Europe
Source: Bloomberg, Scotiabank Economics.
A6
Asia Pacific
Country Date Time EventUS SEP 18-30 Iran, U.S. Resume Nuclear Talks in New York
US 09/22 10:05 Fed's Dudley Speaks in New YorkCA 09/22 12:40 BOC Deputy Governor Wilkins Speaks at CFA SocietyCA 09/22 19:00 New Brunswick ElectionUS 09/22 19:30 Fed's Kocherlakota Speaks on Monetary Policy in Michigan
US 09/23 09:00 Fed's Bullard Gives Welcome at Community Bank ConferenceUS 09/23 09:30 Fed's George Speaks at Community Bank Conference in St. LouisUS 09/23 14:00 Fed's Kocherlakota Holds Town Hall Forum in MichiganUS 09/23 21:15 Fed's George Speaks on the Economy in Cheyenne, Wyoming
US 09/24 12:05 Fed's Mester Speaks on Monetary Policy in ClevelandUS 09/24 13:00 Fed's Evans Speaks at Labor Market Conference in WashingtonUS SEP 24-30 Obama To Address United Nations 69th General Assembly
US 09/25 13:20 Fed's Lockhart Speaks on Economy in Jackson, Mississippi
Country Date Time EventTU SEP 11-24 IMF Delegation Visit for Regular Review of Economy
AU SEP 19-21 G20 Finance Ministers, Central Bank Deputies Meet in Australia
UK SEP 21-24 Labour Party Conference in Manchester
SW 09/22 02:00 Riksbank's Ekholm Holds SpeechIT 09/22 05:00 Istat Releases New GDP Series up to 2013 Based on ESA2010GE 09/22 06:00 ECB's Praet Discusses Future of Monetary System, BerlinGE 09/22 07:15 Merkel, Valls Hold Talks and Joint News Conference in BerlinEC 09/22 09:00 ECB's Draghi Speaks to EU Parliament Committee in BrusselsPO 09/22 Bank of Portugal Releases Report on Banking System
NO 09/23 04:00 Norway to Buy Back May 2015 BondsGE 09/23 04:00 Merkel Gives Speech at Germany's BDI Industry FederationGE 09/23 05:30 Valls Gives Speech to Germany's BDI Industry FederationGE 09/23 07:30 Merkel, Samaras Meet for Talks on Greek Economy in BerlinHU 09/23 08:00 Central Bank Rate Decision
GE 09/24 08:00 Merkel Briefs Parliament EU Group on Ukraine in Closed SessionFR 09/24 12:00 Total JobseekersPO 09/24 Portugal Releases Year-to-Date Budget Report
PO 09/25 06:00 Cushman & Wakefield Market Report on Portugal Property SectorTU 09/25 07:00 Benchmark Repurchase Rate
EC 09/26 07:00 EMA Releases Drug Approvals & Safety DecisionsSW 09/26 Sweden Sovereign Debt Rating Published by S&PEC 09/26 EFSF Sovereign Debt Rating May Be Published by Moody'sEC 09/26 ESM Sovereign Debt Rating May Be Published by Moody'sUK SEP 26-27 UKIP Conference in Doncaster
Country Date Time EventSK SEP 19-OCT 4 2014 Asian Games Takes Place in Incheon, South Korea
TA 09/25 04:00 CBC Benchmark Interest Rate
Latin America
Country Date Time EventCO 09/26 Overnight Lending Rate

Economics
Global Views
September 19, 2014
5
Global Central Bank Watch
NORTH AMERICARate Current Rate Next Meeting Scotia's Forecasts Consensus ForecastsBank of Canada – Overnight Target Rate 1.00 October 22, 2014 1.00 --
Federal Reserve – Federal Funds Target Rate 0.25 October 29, 2014 0.25 0.25
Banco de México – Overnight Rate 3.00 October 31, 2014 3.00 --
EUROPERate Current Rate Next Meeting Scotia's Forecasts Consensus ForecastsEuropean Central Bank – Refinancing Rate 0.05 October 2, 2014 0.05 --
Bank of England – Bank Rate 0.50 October 9, 2014 0.50 0.50
Swiss National Bank – Libor Target Rate 0.00 December 11, 2014 0.00 --
Central Bank of Russia – One-Week Auction Rate 8.00 October 31, 2014 8.00 --
Hungarian National Bank – Base Rate 2.10 September 23, 2014 2.10 2.10
Central Bank of the Republic of Turkey – 1 Wk Repo Rate 8.25 September 25, 2014 8.25 8.25
Sweden Riksbank – Repo Rate 0.25 October 28, 2014 0.25 --
Norges Bank – Deposit Rate 1.50 October 23, 2014 1.50 --
ASIA PACIFICRate Current Rate Next Meeting Scotia's Forecasts Consensus ForecastsReserve Bank of Australia – Cash Target Rate 2.50 October 6, 2014 2.50 2.50
Reserve Bank of New Zealand – Cash Rate 3.50 October 29, 2014 3.50 3.50
People's Bank of China – Lending Rate 6.00 TBA -- --
Reserve Bank of India – Repo Rate 8.00 September 30, 2014 8.00 --
Bank of Korea – Bank Rate 2.25 October 14, 2014 2.25 --
Bank of Thailand – Repo Rate 2.00 November 5, 2014 2.00 2.00
Bank Indonesia – Reference Interest Rate 7.50 October 7, 2014 7.50 --
LATIN AMERICARate Current Rate Next Meeting Scotia's Forecasts Consensus ForecastsBanco Central do Brasil – Selic Rate 11.00 October 29, 2014 11.00 --
Banco Central de Chile – Overnight Rate 3.25 October 16, 2014 3.25 --
Banco de la República de Colombia – Lending Rate 4.50 September 26, 2014 4.50 4.50
Banco Central de Reserva del Perú – Reference Rate 3.50 October 9, 2014 3.50 3.50
AFRICARate Current Rate Next Meeting Scotia's Forecasts Consensus ForecastsSouth African Reserve Bank – Repo Rate 5.75 November 20, 2014 5.75 --
Fed: Markets will be watching for the Fed to clarify the reasoning behind the more aggressive 'dot plot' so there'll be increased focus on next week's onslaught of Fed speak: NY Fed Pres. Dudley, Chicago Fed Pres. Evans, Atlanta Fed Pres. Lockhard, KC Fed Pres. George, Cleveland Fed Pres. Mester, Minnesota Fed Pres. Kocherlakota and St. Louis Fed Pres. Bullard are all making remarks. Next week's housing data, durable goods and final reading of Q2 GDP will also be key data releases. BoC: A quiet week but BoC's Senior Deputy Gov Carolyn Wilkin speaks and answers Q&A and July retail sales will add color to the strong CPI numbers.
Banco de la República de Colombia will announce its benchmark interest rate on September 26th. We believe that Colombian monetary authorities will pause their recent tighenting cycle and opt to hold at the 4.50% mark until the effects of the 125 bps worth of increases made since April are determined.
The Central Bank of Hungary’s Monetary Council will meet on September 23rd and is expected to keep its base rate unchanged at 2.10%. After embarking on an unprecedented two-year easing cycle, the bank plans to keep borrowing costs low for an extended period to support the country’s ailing economy. Therefore, authorities are working to reduce Hungary’s international debt exposure, so in the event that emerging-market turmoil resurfaces, officials are not forced to increase interest rates to defend financial stability and the Hungarian forint. The Turkish Central Bank will also announce a decision on interest rates on September 25th. Incoming economic indicators have been disappointing, with weaker-than-expected second quarter growth and unemployment rising to a 3½ year high. Government officials continue to call for further rate cuts, however, the weakness in the Turkish lira will likely reduce the potential for a rate cut at next week’s meeting.
North America
Europe
Asia Pacific
Latin America
Africa
Forecasts at time of publication. Source: Bloomberg, Scotiabank Economics.
A7

Economics
Global Views
September 19, 2014
6
Forecasts as at July 31, 2014* 2000-12 2013 2014f 2015f 2000-12 2013 2014f 2015f
Output and Inflation (annual % change) Real GDP Consumer Prices2
World13.7 3.1 3.2 3.6
Canada 2.2 2.0 2.2 2.5 2.1 0.9 2.0 2.0 United States 1.9 2.2 2.0 3.2 2.5 1.5 1.9 2.3 Mexico 2.4 1.1 2.7 3.7 4.7 4.0 4.1 4.0
United Kingdom 1.7 1.8 2.9 2.5 2.3 2.0 1.6 2.1 Euro zone 1.3 -0.4 1.1 1.4 2.1 0.8 0.7 1.1
Japan 0.9 1.5 1.6 1.2 -0.3 1.6 2.3 1.9 Australia 3.1 2.4 3.0 2.8 3.0 2.7 2.7 2.9 China 9.3 7.7 7.4 7.2 2.4 2.5 2.6 3.1 India 7.2 4.7 5.2 5.7 6.7 6.4 5.3 5.8 Korea 4.2 3.0 3.6 3.2 3.1 1.1 2.1 2.5 Thailand 4.2 2.9 2.0 4.0 2.7 1.7 2.4 2.8
Brazil 3.4 2.5 1.2 1.8 6.5 5.9 6.5 6.0 Chile 4.5 4.1 2.8 3.8 3.2 2.9 3.5 3.1 Peru 5.5 5.6 4.5 5.8 2.6 2.9 3.0 2.8
Central Bank Rates (%, end of period) 13Q4 14Q1 14Q2 14Q3f 14Q4f 15Q1f 15Q2f 15Q3f
Bank of Canada 1.00 1.00 1.00 1.00 1.00 1.00 1.00 1.00Federal Reserve 0.25 0.25 0.25 0.25 0.25 0.25 0.50 0.75European Central Bank 0.25 0.25 0.15 0.15 0.15 0.15 0.15 0.15Bank of England 0.50 0.50 0.50 0.50 0.50 0.75 1.00 1.25Swiss National Bank 0.00 0.00 0.00 0.00 0.00 0.00 0.00 0.00Reserve Bank of Australia 2.50 2.50 2.50 2.50 2.50 2.50 2.75 3.00
Exchange Rates (end of period)
Canadian Dollar (USDCAD) 1.06 1.11 1.07 1.08 1.10 1.12 1.12 1.11Canadian Dollar (CADUSD) 0.94 0.90 0.94 0.93 0.91 0.89 0.89 0.90Euro (EURUSD) 1.37 1.38 1.37 1.34 1.30 1.28 1.26 1.25Sterling (GBPUSD) 1.66 1.67 1.71 1.73 1.72 1.70 1.69 1.68Yen (USDJPY) 105 103 101 104 109 110 111 112Australian Dollar (AUDUSD) 0.89 0.93 0.94 0.94 0.92 0.91 0.90 0.90Chinese Yuan (USDCNY) 6.1 6.2 6.2 6.2 6.1 6.1 6.0 6.0Mexican Peso (USDMXN) 13.0 13.1 13.0 13.1 13.2 13.3 13.2 13.2Brazilian Real (USDBRL) 2.36 2.27 2.21 2.40 2.40 2.48 2.48 2.50
Commodities (annual average) 2000-12 2013 2014f 2015f
WTI Oil (US$/bbl) 60 98 102 103Brent Oil (US$/bbl) 62 109 109 110Nymex Natural Gas (US$/mmbtu) 5.45 3.73 4.35 4.50
Copper (US$/lb) 2.22 3.32 3.16 3.10Zinc (US$/lb) 0.78 0.87 0.99 1.25Nickel (US$/lb) 7.64 6.80 8.35 10.75Gold, London PM Fix (US$/oz) 745 1,410 1,300 1,350
Pulp (US$/tonne) 730 941 1,000 1,020Newsprint (US$/tonne) 585 608 607 630Lumber (US$/mfbm) 274 356 355 390
1 World GDP for 2003-12 are IMF PPP estimates; 2013-15f are Scotiabank Economics' estimates based on a 2012 PPP-weighted sample of 38 countries. 2 CPI for Canada and the United States are annual averages. For other countries, CPI are year-end rates.
* See Scotiabank Economics 'Global Forecast Update' report for additional forecasts & commentary.
Brazil
India South Korea Thailand
Chile Peru
Japan
Canada
United States
Mexico
United Kingdom
Australia China
Euro Zone
A8
Forecasts as at August 28, 2014*

Economics
Global Views
September 19, 2014
7
North America
Canada 2013 14Q1 14Q2 Latest United States 2013 14Q1 14Q2 Latest Real GDP (annual rates) 2.0 0.9 3.1 Real GDP (annual rates) 2.2 -2.1 4.2 Current Acc. Bal. (C$B, ar) -60.3 -48.1 -47.5 Current Acc. Bal. (US$B, ar) -400 -445 Merch. Trade Bal. (C$B, ar) -7.3 7.2 7.4 31.0 (Jul) Merch. Trade Bal. (US$B, ar) -702 -729 -757 -722 (Jul) Industrial Production 0.4 2.5 3.4 2.9 (Jul) Industrial Production 2.9 3.6 4.0 3.9 (Aug) Housing Starts (000s) 188 175 196 192 (Aug) Housing Starts (millions) 0.93 0.93 0.99 0.96 (Aug) Employment 1.3 0.8 0.6 0.4 (Aug) Employment 1.7 1.7 1.8 1.8 (Aug) Unemployment Rate (%) 7.1 7.0 7.0 7.0 (Aug) Unemployment Rate (%) 7.4 6.7 6.2 6.1 (Aug) Retail Sales 3.2 4.2 5.2 5.9 (Jun) Retail Sales 4.3 2.4 4.5 4.8 (Aug) Auto Sales (000s) 1744 1712 1816 1949 (Jul) Auto Sales (millions) 15.5 15.7 16.5 17.4 (Aug) CPI 0.9 1.4 2.2 2.1 (Aug) CPI 1.5 1.4 2.1 1.7 (Aug) IPPI 0.4 2.5 3.4 -2.9 (Jul) PPI 1.2 1.6 2.8 2.2 (Aug) Pre-tax Corp. Profits -1.7 7.0 12.1 Pre-tax Corp. Profits 4.6 5.9 10.0
Mexico Real GDP 1.1 1.9 1.6 Current Acc. Bal. (US$B, ar) -26.3 -17.6 -27.9 Merch. Trade Bal. (US$B, ar) -1.2 -5.3 4.3 -11.8 (Jul) Industrial Production -0.7 1.6 1.0 2.1 (Jul) CPI 3.8 4.2 3.6 4.1 (Aug)
Euro Zone 2013 14Q1 14Q2 Latest Germany 2013 14Q1 14Q2 Latest Real GDP -0.4 0.9 0.7 Real GDP 0.2 2.2 1.3 Current Acc. Bal. (US$B, ar) 288 173 309 524 (Jul) Current Acc. Bal. (US$B, ar) 255.2 271.1 253.8 352.1 (Jul) Merch. Trade Bal. (US$B, ar) 230.3 202.3 279.3 341.4 (Jul) Merch. Trade Bal. (US$B, ar) 282.6 290.6 302.1 380.2 (Jul) Industrial Production -0.7 1.5 0.8 1.7 (Jul) Industrial Production 0.1 4.0 0.8 2.4 (Jul) Unemployment Rate (%) 11.9 11.7 11.6 11.5 (Jul) Unemployment Rate (%) 6.9 6.8 6.7 6.7 (Aug) CPI 1.4 0.6 0.6 0.4 (Aug) CPI 1.5 1.2 1.1 0.8 (Aug)
France United Kingdom Real GDP 0.4 0.8 0.1 Real GDP 1.7 3.0 3.2 Current Acc. Bal. (US$B, ar) -36.6 -69.5 -81.4 11.4 (Jul) Current Acc. Bal. (US$B, ar) -114.3 -102.7 Merch. Trade Bal. (US$B, ar) -46.9 -42.6 -42.8 -49.1 (Jul) Merch. Trade Bal. (US$B, ar) -168.7 -175.2 -184.4 -208.7 (Jul) Industrial Production -0.7 -0.3 -2.1 0.1 (Jul) Industrial Production -0.4 2.5 2.1 1.7 (Jul) Unemployment Rate (%) 10.3 10.2 10.2 10.3 (Jul) Unemployment Rate (%) 7.6 6.8 6.4 6.2 (Jun) CPI 0.9 0.7 0.6 0.4 (Aug) CPI 2.6 1.7 1.7 1.5 (Aug)
Italy Russia Real GDP -1.8 -0.4 -0.2 Real GDP 1.3 0.9 0.8 Current Acc. Bal. (US$B, ar) 20.7 -4.7 42.6 110.7 (Jul) Current Acc. Bal. (US$B, ar) 34.1 27.1 17.1 Merch. Trade Bal. (US$B, ar) 40.3 37.8 57.4 111.4 (Jul) Merch. Trade Bal. (US$B, ar) 15.2 16.9 17.4 17.1 (Jul) Industrial Production -3.1 0.0 -0.1 -1.2 (Jul) Industrial Production 0.4 1.1 1.9 0.0 (Aug) CPI 1.2 0.4 0.3 0.0 (Aug) CPI 6.8 6.4 7.6 7.6 (Aug)
Europe
All data expressed as year-over-year % change unless otherwise noted.
Economic Statistics
Source: Bloomberg, Global Insight, Scotiabank Economics.
A9

Economics
Global Views
September 19, 2014
8
Asia Pacific
Australia 2013 14Q1 14Q2 Latest Japan 2013 14Q1 14Q2 Latest Real GDP 2.3 3.4 3.1 Real GDP 1.5 2.7 0.0 Current Acc. Bal. (US$B, ar) -49.7 -26.0 -39.1 Current Acc. Bal. (US$B, ar) 33.6 -31.0 12.2 49.2 (Jul) Merch. Trade Bal. (US$B, ar) 20.7 25.7 18.0 15.8 (Jul) Merch. Trade Bal. (US$B, ar) -117.5 -173.5 -109.4 -107.7 (Aug) Industrial Production 3.6 5.4 4.6 Industrial Production -0.6 8.3 2.6 -0.6 (Jul) Unemployment Rate (%) 5.7 6.0 5.9 6.1 (Aug) Unemployment Rate (%) 4.0 3.6 3.6 3.8 (Jul) CPI 2.4 2.9 3.0 CPI 0.4 1.5 3.6 3.4 (Jul)
South Korea China Real GDP 3.0 3.9 3.5 Real GDP 7.7 7.4 7.5 Current Acc. Bal. (US$B, ar) 79.9 60.3 96.5 94.9 (Jul) Current Acc. Bal. (US$B, ar) 182.8 Merch. Trade Bal. (US$B, ar) 44.1 20.9 59.6 40.4 (Aug) Merch. Trade Bal. (US$B, ar) 259.2 67.8 345.3 598.0 (Aug) Industrial Production 0.2 1.3 1.2 3.5 (Jul) Industrial Production 9.7 8.8 9.2 6.9 (Aug) CPI 1.3 1.1 1.6 1.4 (Aug) CPI 2.5 2.4 2.3 2.0 (Aug)
Thailand India Real GDP 2.9 -0.5 0.4 Real GDP 4.7 4.6 5.7 Current Acc. Bal. (US$B, ar) -2.5 8.2 0.5 Current Acc. Bal. (US$B, ar) -49.3 -1.2 -7.8 Merch. Trade Bal. (US$B, ar) 0.6 2.2 2.0 1.5 (Jul) Merch. Trade Bal. (US$B, ar) -12.7 -9.4 -11.1 -10.8 (Aug) Industrial Production -3.1 -7.2 -5.2 -5.1 (Jul) Industrial Production 0.6 -0.4 4.2 0.5 (Jul) CPI 2.2 2.0 2.5 2.1 (Aug) WPI 6.3 5.4 5.8 3.7 (Aug)
Indonesia Real GDP 5.8 5.2 5.1 Current Acc. Bal. (US$B, ar) -29.1 -4.2 -9.1 Merch. Trade Bal. (US$B, ar) -0.3 0.4 -0.7 0.1 (Jul) Industrial Production 6.0 3.5 4.6 7.3 (Jun) CPI 6.4 7.8 7.1 4.0 (Aug)
Brazil 2013 14Q1 14Q2 Latest Chile 2013 14Q1 14Q2 Latest Real GDP 2.3 1.8 -0.7 Real GDP 4.1 2.4 1.9 Current Acc. Bal. (US$B, ar) -81.2 -100.6 -72.7 Current Acc. Bal. (US$B, ar) -4.6 -2.7 0.1 Merch. Trade Bal. (US$B, ar) 2.6 -24.3 14.3 14.0 (Aug) Merch. Trade Bal. (US$B, ar) 8.0 8.7 11.9 4.3 (Aug) Industrial Production 2.2 -0.5 -4.4 -3.4 (Jul) Industrial Production 3.0 0.6 2.1 -2.6 (Jul) CPI 6.2 5.8 6.4 6.5 (Aug) CPI 1.9 3.2 4.5 4.5 (Aug)
Peru Colombia Real GDP 6.0 5.1 1.7 Real GDP 4.7 6.5 4.3 Current Acc. Bal. (US$B, ar) -9.1 -2.7 -3.5 Current Acc. Bal. (US$B, ar) -12.4 -4.0 Merch. Trade Bal. (US$B, ar) 0.1 -0.2 -0.4 -0.5 (Jul) Merch. Trade Bal. (US$B, ar) 0.2 -0.2 -0.2 -0.8 (Jul) Unemployment Rate (%) 5.9 6.8 5.9 5.9 (Aug) Industrial Production -1.7 4.4 -0.3 1.6 (Jul) CPI 2.8 3.4 3.5 2.7 (Aug) CPI 2.0 2.3 2.8 3.0 (Aug)
Latin America
Economic Statistics
All data expressed as year-over-year % change unless otherwise noted.
Source: Bloomberg, Global Insight, Scotiabank Economics.
A10

Economics
Global Views
September 19, 2014
9
Financial Statistics
A12
Interest Rates (%, end of period)
Canada 14Q1 14Q2 Sep/12 Sep/19* United States 14Q1 14Q2 Sep/12 Sep/19*BoC Overnight Rate 1.00 1.00 1.00 1.00 Fed Funds Target Rate 0.25 0.25 0.25 0.25 3-mo. T-bill 0.89 0.95 0.93 0.93 3-mo. T-bill 0.03 0.02 0.01 0.01 10-yr Gov’t Bond 2.46 2.24 2.24 2.27 10-yr Gov’t Bond 2.72 2.53 2.61 2.60 30-yr Gov’t Bond 2.96 2.78 2.76 2.78 30-yr Gov’t Bond 3.56 3.36 3.34 3.33 Prime 3.00 3.00 3.00 3.00 Prime 3.25 3.25 3.25 3.25 FX Reserves (US$B) 76.3 75.7 75.3 (Jul) FX Reserves (US$B) 133.2 134.1 131.9 (Jul)
Germany France 3-mo. Interbank 0.27 0.15 -0.02 0.03 3-mo. T-bill 0.19 0.02 -0.06 -0.03 10-yr Gov’t Bond 1.57 1.25 1.08 1.04 10-yr Gov’t Bond 2.08 1.70 1.43 1.39 FX Reserves (US$B) 66.8 66.1 66.3 (Jul) FX Reserves (US$B) 53.1 55.2 54.3 (Jul)
Euro Zone United Kingdom Refinancing Rate 0.25 0.15 0.05 0.05 Repo Rate 0.50 0.50 0.50 0.50 Overnight Rate 0.69 0.34 -0.01 0.01 3-mo. T-bill 0.39 0.44 0.44 0.50 FX Reserves (US$B) 338.8 340.2 337.2 (Jul) 10-yr Gov’t Bond 2.74 2.67 2.53 2.54
FX Reserves (US$B) 97.3 99.4 98.8 (Jul)
Japan Australia Discount Rate 0.30 0.30 0.30 0.30 Cash Rate 2.50 2.50 2.50 2.50 3-mo. Libor 0.07 0.07 0.06 0.06 10-yr Gov’t Bond 4.08 3.54 3.61 3.73 10-yr Gov’t Bond 0.64 0.57 0.58 0.56 FX Reserves (US$B) 54.1 55.9 55.2 (Jul) FX Reserves (US$B) 1247.5 1251.5 1244.4 (Jul)
Exchange Rates (end of period)
USDCAD 1.11 1.07 1.11 1.10 ¥/US$ 103.23 101.33 107.34 108.91CADUSD 0.91 0.94 0.90 0.91 US¢/Australian$ 0.93 0.94 0.90 0.89GBPUSD 1.666 1.711 1.627 1.632 Chinese Yuan/US$ 6.22 6.20 6.14 6.14EURUSD 1.377 1.369 1.296 1.284 South Korean Won/US$ 1065 1012 1035 1045JPYEUR 0.70 0.72 0.72 0.71 Mexican Peso/US$ 13.058 12.968 13.259 13.228USDCHF 0.88 0.89 0.93 0.94 Brazilian Real/US$ 2.272 2.214 2.339 2.372
Equity Markets (index, end of period)
United States (DJIA) 16458 16827 16988 17309 U.K. (FT100) 6598 6744 6807 6854 United States (S&P500) 1872 1960 1986 2016 Germany (Dax) 9556 9833 9651 9822 Canada (S&P/TSX) 14335 15146 15532 15374 France (CAC40) 4392 4423 4442 4470 Mexico (IPC) 40462 42737 45800 45951 Japan (Nikkei) 14828 15162 15948 16321 Brazil (Bovespa) 50415 53168 56928 57763 Hong Kong (Hang Seng) 22151 23191 24595 24306 Italy (BCI) 1181 1155 1140 1144 South Korea (Composite) 1986 2002 2042 2054
Commodity Prices (end of period)
Pulp (US$/tonne) 1030 1030 1030 1030 Copper (US$/lb) 3.01 3.15 3.11 3.12 Newsprint (US$/tonne) 605 605 605 605 Zinc (US$/lb) 0.90 1.00 1.03 1.02 Lumber (US$/mfbm) 354 346 362 351 Gold (US$/oz) 1291.75 1315.00 1231.50 1219.75 WTI Oil (US$/bbl) 101.58 105.37 92.27 91.88 Silver (US$/oz) 19.97 20.87 18.64 18.45 Natural Gas (US$/mmbtu) 4.37 4.46 3.86 3.86 CRB (index) 304.67 308.22 281.90 279.16
* Latest observation taken at time of writing. Source: Bloomberg, Scotiabank Economics.
A11

Global Views
September 19, 2014
Fixed Income Strategy (London) www.gbm.scotiabank.com © 2012, The Bank of Nova Scotia This material, its content, or any copy of it, may not be altered in any way, transmitted to, copied or distributed to any other party without the prior express written consent of ScotiabankTM. This material has not been prepared by a member of the research department of Scotiabank, it is solely for the use of sophisticated institutional investors, and this material does not constitute investment advice or any personal recommendation to invest in a financial instrument or “investment research” as defined by the Financial Services Authority. This material is provided for information and discussion purposes only. An investment decision should not be made solely on the basis of the contents of this publication. It is not to be construed as a solicitation or an offer to buy or sell any financial instruments and has no regard to the specific investment objectives, financial situation or particular needs of any recipient. It is not intended to provide legal, tax, accounting or other advice and recipients should obtain specific professional advice from their own legal, tax, accounting or other appropriate professional advisers before embarking on any course of action. The information in this material is based on publicly available information and although it has been compiled or obtained from sources believed to be reliable, such information has not been independently verified and no guarantee, representation or warranty, express or implied, is made as to its accuracy, completeness or correctness. Information included in this material related to comparison performance (whether past or future) or simulated performance (whether past or future) is not a reliable indicator of future returns. This presentation is not directed to or intended for use by any person resident or located in any country where the distribution of such information is contrary to the laws of such country. Scotiabank its directors, officers, employees or clients may currently or from time to time own or hold interests in long or short positions in any securities referred to herein, and may at any time make purchases or sales of these securities as principal or agent. Scotiabank may also have provided or may provide investment banking, capital markets or other services to the companies referred to in this communication.
TM Trademark of The Bank of Nova Scotia. Used under license, where applicable. Scotiabank, together with "Global Banking and Markets", is a marketing name for the global corporate and investment banking and capital markets businesses of The Bank of Nova Scotia and certain of its affiliates in the countries where they operate, including Scotia Capital Inc., Scotia Capital (USA) Inc., Scotiabanc Inc.; Citadel Hill Advisors L.L.C.; The Bank of Nova Scotia Trust Company of New York; Scotiabank Europe plc; Scotia Capital (Europe) Limited; Scotiabank (Ireland) Limited; Scotiabank Inverlat S.A., Institución de Banca Múltiple, Scotia Inverlat Casa de Bolsa S.A. de C.V., Scotia Inverlat Derivados S.A. de C.V. – all members of the Scotiabank Group and authorized users of the mark. The Bank of Nova Scotia is incorporated in Canada with limited liability. Scotia Capital Inc. is a member of CIPF. Scotia Capital (USA) Inc. is a registered broker-dealer with the SEC and is a member of the NASD and SIPC. The Bank of Nova Scotia, Scotiabank Europe plc, Scotia Capital (Europe) Limited and Scotia Capital Inc. are each authorised and regulated by the Financial Services Authority (FSA) in the U.K. Scotiabank Inverlat, S.A., Scotia Inverlat Casa de Bolsa, S.A. de C.V., and Scotia Derivados, S.A. de C.V., are each authorized and regulated by the Mexican financial authorities. Fixed Income Strategy (Paris) Disclaimer © 2011, The Bank of Nova Scotia This material, its content, or any copy of it, may not be altered in any way, transmitted to, copied or distributed to any other party without the prior express written consent of Scotiabank™. This material has not been prepared by a member of the research department of Scotiabank, it is solely for the use of sophisticated institutional investors, and this material does not constitute investment advice or any personal recommendation to invest in a financial instrument or “investment research” as defined by the Financial Services Authority. This material is provided for information and discussion purposes only. An investment decision should not be made solely on the basis of the contents of this publication. It is not to be construed as a solicitation or an offer to buy or sell any financial instruments and has no regard to the specific investment objectives, financial situation or particular needs of any recipient. It is not intended to provide legal, tax, accounting or other advice and recipients should obtain specific professional advice from their own legal, tax, accounting or other appropriate professional advisers before embarking on any course of action. The information in this material is based on publicly available information and although it has been compiled or obtained from sources believed to be reliable, such information has not been independently verified and no guarantee, representation or warranty, express or implied, is made as to its accuracy, completeness or correctness. Information included in this material related to comparison performance (whether past or future) or simulated performance (whether past or future) is not a reliable indicator of future returns. This presentation is not directed to or intended for use by any person resident or located in any country where the distribution of such information is contrary to the laws of such country. Scotiabank its directors, officers, employees or clients may currently or from time to time own or hold interests in long or short positions in any securities referred to herein, and may at any time make purchases or sales of these securities as principal or agent. Scotiabank may also have provided or may provide investment banking, capital markets or other services to the companies referred to in this communication.
Disclaimer
Global Views
September 19, 2014
Foreign Exchange Strategy This publication has been prepared by The Bank of Nova Scotia (Scotiabank) for informational and marketing purposes only. Opinions, estimates and projections contained herein are our own as of the date hereof and are subject to change without notice. The information and opinions contained herein have been compiled or arrived at from sources believed reliable, but no representation or warranty, express or implied, is made as to their accuracy or completeness and neither the information nor the forecast shall be taken as a representation for which Scotiabank, its affiliates or any of their employees incur any responsibility. Neither Scotiabank nor its affiliates accept any liability whatsoever for any loss arising from any use of this information. This publication is not, and is not constructed as, an offer to sell or solicitation of any offer to buy any of the currencies referred to herein, nor shall this publication be construed as an opinion as to whether you should enter into any swap or trading strategy involving a swap or any other transaction. The general transaction, financial, educational and market information contained herein is not intended to be, and does not constitute, a recommendation of a swap or trading strategy involving a swap within the meaning of U.S. Commodity Futures Trading Commission Regulation 23.434 and Appendix A thereto. This material is not intended to be individually tailored to your needs or characteristics and should not be viewed as a “call to action” or suggestion that you enter into a swap or trading strategy involving a swap or any other transaction. You should note that the manner in which you implement any of the strategies set out in this publication may expose you to significant risk and you should carefully consider your ability to bear such risks through consultation with your own independent financial, legal, accounting, tax and other professional advisors. Scotiabank, its affiliates and/or their respective officers, directors or employees may from time to time take positions in the currencies mentioned herein as principal or agent, and may have received remuneration as financial advisor and/or underwriter for certain of the corporations mentioned herein. Directors, officers or employees of Scotiabank and its affiliates may serve as directors of corporations referred to herein. All Scotiabank products and services are subject to the terms of applicable agreements and local regulations. This publication and all information, opinions and conclusions contained in it are protected by copyright. This information may not be reproduced in whole or in part, or referred to in any manner whatsoever nor may the information, opinions and conclusions contained in it be referred to without the prior express written consent of Scotiabank. ™Trademark of The Bank of Nova Scotia. Used under license, where applicable. Scotiabank, together with “Global Banking and Markets”, is a marketing name for the global corporate and investment banking and capital markets businesses of The Bank of Nova Scotia and certain of its affiliates in the countries where they operate, all members of the Scotiabank group and authorized users of the mark. The Bank of Nova Scotia is incorporated in Canada with limited liability and is authorised and regulated by the Office of the Superintendent of Financial Institutions Canada. The Bank of Nova Scotia and Scotiabank Europe plc are authorised by the UK Prudential Regulation Authority. The Bank of Nova Scotia is subject to regulation by the UK Financial Conduct Authority and limited regulation by the UK Prudential Regulation Authority. Scotiabank Europe plc is authorised by the UK Prudential Regulation Authority and regulated by the UK Financial Conduct Authority and the UK Prudential Regulation Authority. Details about the extent of The Bank of Nova Scotia's regulation by the UK Prudential Regulation Authority are available on request. Scotiabank Inverlat, S.A., Scotia Inverlat Casa de Bolsa, S.A. de C.V., and Scotia Inverlat Derivados, S.A. de C.V., are each authorized and regulated by the Mexican financial authorities.Not all products and services are offered in all jurisdictions. Services described are available in jurisdictions where permitted by law.
Disclaimer

Scotiabank Economics
Scotia Plaza 40 King Street West, 63rd Floor
Toronto, Ontario Canada M5H 1H1
Tel: (416) 866-6253 Fax: (416) 866-2829
Email: [email protected]
For general and publication-related inquiries, contact
us by telephone, email and/or fax.
Scotiabank Economics
This report has been prepared by Scotiabank Economics as a resource for the clients of Scotiabank. Opinions, estimates and projections contained herein are our own as of the date hereof and are subject to change without notice. The information and opinions contained herein have been compiled or arrived at from sources believed reliable but no representation or warranty, express or implied, is made as to their accuracy or completeness. Neither Scotiabank nor its affiliates accepts any liability whatsoever for any loss arising from any use of this report or its contents. TM Trademark of The Bank of Nova Scotia. Used under license, where applicable.
Disclaimer
Global Views
September 19, 2014