global trends in non food uses in europe - australian … · global trends in non food uses in...
TRANSCRIPT

Australian oilseeds FederationForum 2005
Global trends in non food usesin EuropeEmile CHONÉ
Directeur AGROPOL
With data from the European Biodiesel Board

PROLEA, a young and well-structured agro-industrial chain
PROLEA gathers five bodies:
- The producers’ Union FOP:Represents 150.000 farmers, defends their interests vis-à-vis the French and EU public authorities and the WTO.
- The Interprofession ONIDOL for oilseeds,- The Interprofession UNIP for protein crops
Gather producers, handlers and users of oilseeds and protein crops. Contribute to economic organisation, research enhancement, valorisation, diversification and promotion of the sector.
Technical centres: CETIOM for oilseedsUNIP Technique for protein crops
Produce technical innovations and improve economic competitiveness of crops.
The Financial Establishment SOFIPROTEOL:Manages industrial assets through Saipol-Lesieur (vegetable oils), Diester Industrie (biodiesel) and its subsidiary Novance(lipochemistry).
Operates investment funds fed with money collected from the farmers, one that invests in enterprises of the sector, the other one that finances R&D and promotion of the sector.
AGROPOL in charge of studies and cooperation abroad

Origin of biodiesel• In the 80’s:
– Work of IFP on FAME as diesel fuel– new market for vegetable oils– Brand name DIESTER in 1987
• 1992 CAP reform and BHA– sourcing from set aside land– First biodiesel plant launched in Compiègne
• R&D with other EU countries (F, I, G)– Eurobiodiesel– costs/benefits: economy, taxes, environment

Biofuels: UE Policy• Motivation
– Kyoto protocol– energetic independance– economy
• 2 EU directives in 2003– Promotion of biofuels
• 2% 2005• 5,75% 2010
– possibility of fiscal exemption

Changes (%) in EU greenhouse gas emissionsby sector
1990-99, Sources: European Environment Agency, BAFF

EU Biodiesel production in Member Statesand in the EU (’000 t)
0
500
1000
1500
2000
1998 2000 2002 2003 2004
GermanyFranceItalyOthers EU-25Total EU
EU-25
EU-15
EU-15
EU-15
EU-15

2004 production of biofuels in the EU-25Sources: EBB, ADECA
0.5
1.9
0
0.5
1
1.5
2
Mt
Bioethanol Biodiesel

Member States' targets for 2005 and 2004 biofuels consumption(percentage in energy content of conventional fuel market)
0.00
0.50
1.00
1.50
2.00
2.50
3.00
3.50
4.00
Czech R
ep.
Sw
eden
Austria
Germ
any
France
Lithuania
Spain
Netherlands
Latvia
Portugal
Hungary
UK
Finland
Ireland
Italy
Poland
Slovakia
Denm
ark
Belgium
Greece
Luxemburg
Cyprus
Estonia
Slovenia
Malta
EU
-25
%
2005 target biofuel consumption
(Percentage in energy content of conventional fuel market)
Where are we now: Member States 2005 targets and 2004 biofuels use
EU-25

Biodiesel/bioethanol relative contribution to biofuels market penetration in 2004(percentage in energy content of conventional fuel market)
0.04
0.43
0.01
1.98
0.72
0.67
0.21
0.02
0.590.34
0.42
0.15
0.38
0.08
0.00
0.50
1.00
1.50
2.00
2.50
Germ
any
Italy
France
Lithuania
Austria
Spain
UK
Sw
eden
Poland
Czech R
ep.
Netherlands
Latvia
Portugal
Hungary
Finland
Ireland
Slovakia
Denm
ark
Belgium
Greece
Luxemburg
Cyprus
Estonia
Slovenia
Malta
EU
-25
%
biodiesel bioethanol
(Percentage in energy content of the conventional fuel market)
EU-25
Where are we now? Biofuels use in 2004Biodiesel/Bioethanol relative contribution to EU biofuels market penetration in 2004

EU and Worldwide biodiesel production in 2004(estimate - million tonnes)
0
0,2
0,4
0,6
0,8
1
1,2
1,4
1,6
1,8
2
EU Worldwide
mill
ion
ton
nes
US (0,14)
world (0,29)
EU (1,93)

Biodiesel: quality & sourcing
• EN 14214– established with
• biodiesel producers, • petroleum companies,• motor makers.

minimum maximumTeneur en esters % (m/m) 96,5 - EN 14103
Masse volumique à 15°C kg/m3 860 900 EN ISO 3675EN ISO 12185
Vicosité à 40°C mm2/s 3,50 5,0 EN ISO 3104Point d'éclair °C 120 - prEN ISO 3679
Teneur en soufre mg/kg - 10,0 prEN ISO 20846prEN ISO 20844
Résidu de carbone (sur résidu 10% de distillation) % (m/m) - 0,30 EN ISO 10370Indice de cétane - 51,0 - EN ISO 5165Teneur en cendres sulfatées % (m/m) - 0,02 ISO 3987Teneur en eau mg/kg - 500 EN ISO 12937Contamination totale mg/kg - 24 EN 12662Corrosion à la lame de cuivre (3 h à 50°C) cotation EN ISO 2160Stabilité à l'oxydation, 110°C heures 6,0 - EN 14112Indice d'acide mg KOH/g - 0,50 EN 14104Indice d'iode g iode/100 g - 120 EN 14111Teneur en ester méthylique d'acide linolénique % (m/m) - 12,0 EN 14103Esters méthyliques polyinsaturés (>= 4 double liaisons) % (m/m) - 1 -Teneur en méthanol % (m/m) - 0,20 1N 14110Teneur en monoglycérides % (m/m) - 0,80 EN 14105Teneur en diglycérides % (m/m) - 0,20 EN 14105Teneur en triglycérides % (m/m) - 0,20 EN 14105
Glycérol libre % (m/m) - 0,02 EN 14105EN 14106
Glycérol total % (m/m) - 0,25 EN 14105
Métaux Groupe I (NA + K)Métaux Groupe II (Ca + Mg)
mg/kgmg/kg
--
5,05,0
EN 14108EN 14109
prEN 14538Teneur en phosphore mg/kg - 10,0 EN 14107
classe 1
Valeurs limitesCaractéristique Unité Méthode d'essai
Norme NF EN 14214 – Avril 2004(Esters méthyliques d’acides gras (EMAG) pour moteurs diesel)

Biodiesel: quality & sourcing
• rapeseed oil ME fits the standard– Iodine value– cold temperatures– stability
• process• functional properties• environmental propreties
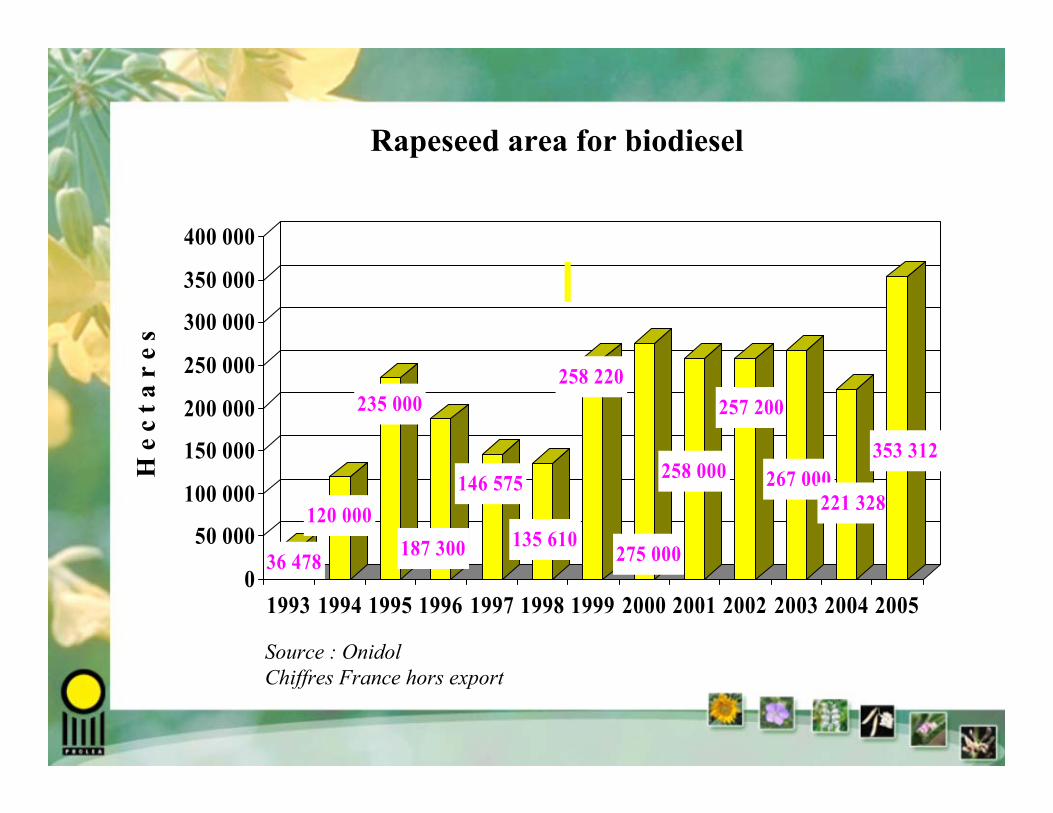
Rapeseed area for biodiesel
36 478
120 000
235 000
187 300
146 575
135 610
258 220
275 000
258 000
257 200
267 000221 328
353 312
0
50 000
100 000
150 000
200 000
250 000
300 000
350 000
400 000
1993 1994 1995 1996 1997 1998 1999 2000 2001 2002 2003 2004 2005
H e
c t
a r
e s
Source : OnidolChiffres France hors export

Gain net des émissions de gaz à effet de serre
Versus
g.eq CO2/MJ
%
teq CO2/t
%EMHV colza Gazole 55,6
-70%2.502
-74%
EMHV tournesol Gazole 59,2 -75%
2.645 -78%
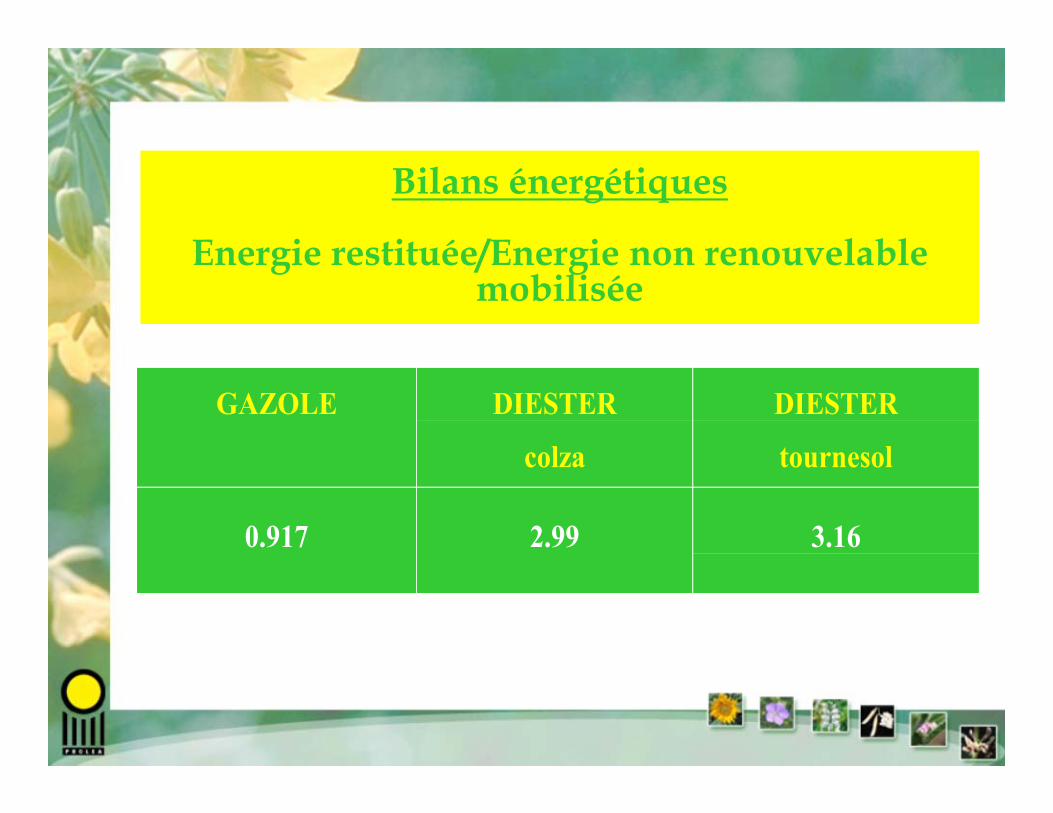
Bilans énergétiques
Energie restituée/Energie non renouvelable mobilisée
GAZOLE DIESTER
colza
DIESTER
tournesol
0.917 2.99 3.16

Effect of RME production process (HFRR results)
0100150200250300350400450500550600
1 2 3 4 5
Swedish diesel fuel + RME A
Swedish diesel fuel + RME B
Results not accurate below 150
RME (% vol)
Ave
rage
wea
r dia
met
er(m
icro
ns)

National policies
Excise duty exemption– full exemption of a
total 470 euros/m3– no quota
Either pure or blended
Excise duty exemption– 330 euros/m3 out of
419 euros/m3 in total– fiscal quota– exempted quota for
each production plant
TGAP from 2005
GermanyFrance

Un ratio gazole/essence qui explose consécutivement aux progrès attendus (injection directe, « down sizing »,…) pour les moteurs à essence, même en cas de ralentissement notable des immatriculations diesel
Demande de carburants en France
0,000
5,000
10,000
15,000
20,000
25,000
30,000
35,000
40,000
45,000
50,000
1990 1995 2000 2005 2010 2015 2020 2025
Mt
Tous carburants
Gazole
Essence
Statistiques CPDP
prévisions
Trend on fuels demand in France
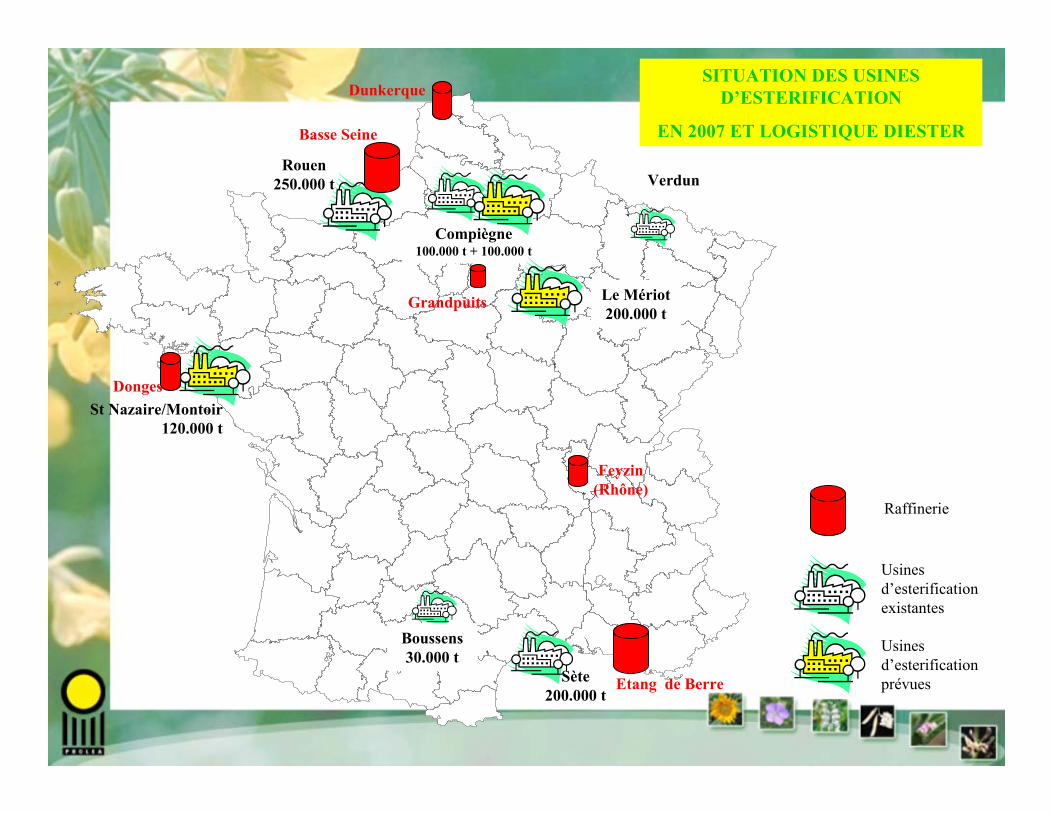
Compiègne100.000 t + 100.000 t
St Nazaire/Montoir120.000 t
Le Mériot200.000 t
Sète200.000 t
Rouen250.000 t
Boussens30.000 t
Verdun
Feyzin(Rhône)
Etang de Berre
Grandpuits
Dunkerque
Donges
Basse Seine
Raffinerie
Usinesd’esterificationexistantes
Usines d’esterificationprévues
SITUATION DES USINES D’ESTERIFICATION
EN 2007 ET LOGISTIQUE DIESTER

Biodiesel: trend on prices
• diesel oil• glycerin• methanol• rapeseed oil UE

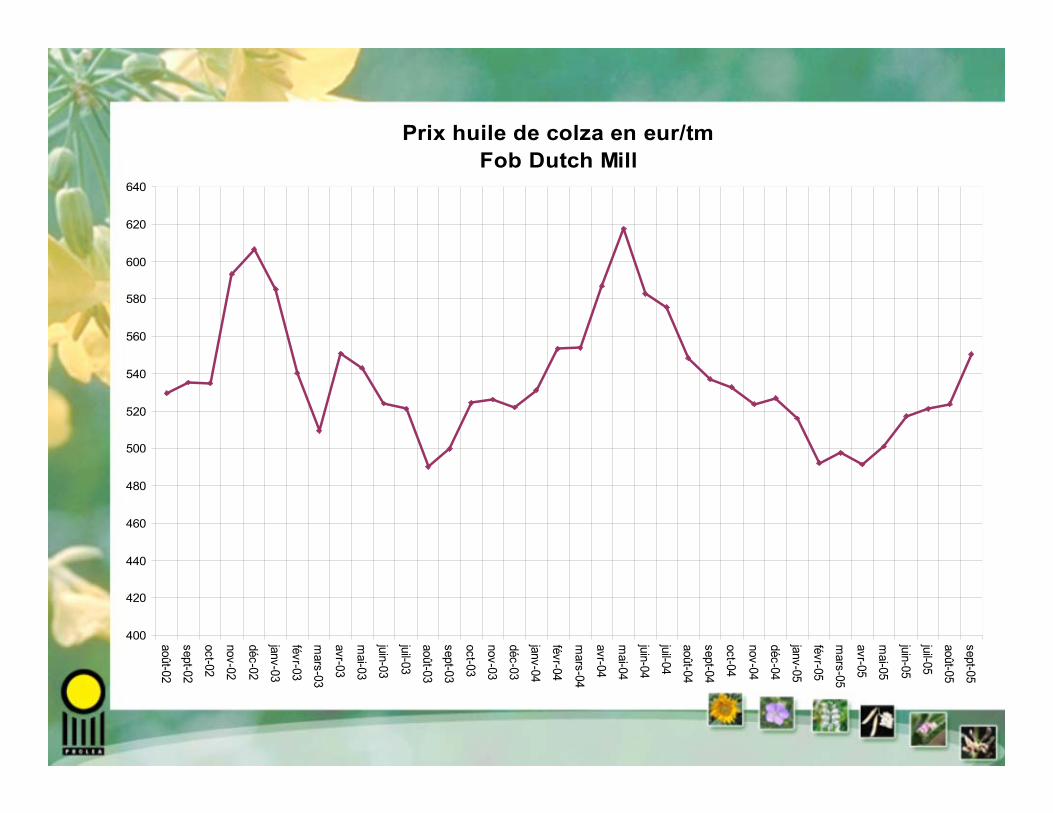
Prix huile de colza en eur/tmFob Dutch Mill
400
420
440
460
480
500
520
540
560
580
600
620
640
août-02
sept-02
oct-02
nov-02
déc-02
janv-03
févr-03
mars-03
avr-03
mai-03
juin-03
juil-03
août-03
sept-03
oct-03
nov-03
déc-03
janv-04
févr-04
mars-04
avr-04
mai-04
juin-04
juil-04
août-04
sept-04
oct-04
nov-04
déc-04
janv-05
févr-05
mars-05
avr-05
mai-05
juin-05
juil-05
août-05
sept-05

METHANOL : EVOLUTION DU PRIX DE CONTRAT ( source ICIS-LOR)
en EURO/ MT
50
100
150
200
250
300
Q11999
Q3 Q12000
Q3 Q12001
Q3 Q12002
Q3 Q12003
Q3 Q12004
Q3 Q12005
Q3

PRIX DE LA GLYCERINE
0
100
200
300
400
500
600
700
800
900
1000
1100
1200
1300
1400
1500
1600
1700
1800
1900
2000
EUR
OS
/ TM
RAFFINEE BASE 100%
BRUTE BASE 100%
RAFFINEE BASE 100%
BRUTE BASE 100%
janv 1995 sept 2000 june 2005

BiodieselConsequences on lipochemistry
• Glycerin– mass production – price drop– EU new exporter– new uses
• alkyd resins again• substitution in personal care products• feed

• FAME– new raw material– Cost-effective compared to FA
• saving energy through transesterification
– new markets (examples)• Tar fluxant• tank mix additives• industrial solvants & cleaners
BiodieselConsequences on lipochemistry

TAR fluxant

Biodiesel Conclusion
• will spread everywhere• new big market for agriculture• new opportunity for lipochemistry