global transfer pricing conference · michael porter’s vca oecd’s beps project 2013 ... fmcg...
TRANSCRIPT
Global Transfer Pricing ConferenceUsing value chain analysis post-BEPS
October 2016
www.pwc.com/transferpricing
The new normal – full TransParency

Global Transfer Pricing Conference │ October 2016
VCA Video
PwC │ 2
https://pwc.mediaspace.kaltura.com/media/t/1_x9layyk6

Global Transfer Pricing Conference │ October 2016
Agenda
PwC │ 3
Why are we discussing VCA?1
The internal approach2
The empirical approach3
VCA in practice: case studies4
Global Transfer Pricing Conference │ October 2016

Global Transfer Pricing Conference │ October 2016
Today’s presenters
PwC │ 4
Andrew CasleyPwC UK
Sara HerstinPwC US
Jonas Van de GuchtPwC Belgium

Global Transfer Pricing Conference │ October 2016
Why are we discussing VCA?
PwC │ 5
1984
Michael Porter’s VCA
OECD’s BEPS Project
2013
Masterfile
Corporate structures matter less
Activities are geographically
dispersed
The single firm
Flexibility
CbCreporting
Profit split forhighly
integratedoperations?
Two or more make uniqueand valuablecontributions
DEMPE
Action 1: Digital
Economy
Action 13: TP
Documentation
Action 8-10:
Aligning TP outcomes withvalue creation
Action

Global Transfer Pricing Conference │ October 2016 PwC │ 6
“Members of the MNE group are to be compensated based on the value they create through functions performed, assets used and risks assumed in the development, enhancement, maintenance, protection and exploitation of intangibles”
“Action 5 specifically requires substantial activity for any preferential regime…, which is to align taxation with substance by ensuring that taxable profits can no longer be artificially shifted away from the country where value is created”
“The economist's conception of a single firm operating in a co-ordinated fashion to maximize opportunities in a global economy”
Statement from article 8-10 BEPS paper – Aligning TP Outcomes with Value Creation
Statement from article 8-10 BEPS paper –Aligning TP Outcomes with Value Creation
Statement from article 1 BEPS paper – Addressing the Tax Challenges of the Digital Economy
“The sharing of profits or losses under a profit split may...reflect a fundamentally different commercial relationship between the parties in particular concerning risk allocation, to the paying of a [price] for goods or services”
Statement from article 8-10 BEPS paper – Aligning TP Outcomes with Value Creation
Why are we discussing VCA?

Global Transfer Pricing Conference │ October 2016
Why are we discussing VCA?
PwC │ 7
Traditional approach – One-sided transfer pricing
Principal / HQIP, Group strategy,
Group synergies and Management services
R&D Centres
Procurement
Manufacturing
Limited Risk Distributors
Regional Hubs
Cost plus services “Residual” Return on sales
Tax authorities’ focus historically

Global Transfer Pricing Conference │ October 2016
Why are we discussing VCA?
PwC │ 8
Post BEPS transfer pricing profit distribution should align to the group’s value chain
R&D Centres
Principal / HQ
IP, Group strategy, Group synergies and Management services
Co
mp
etit
ive
Ad
va
nta
ges
DistributionRegional HubsProcurement Manufacturing
Supply risk
Productrisk
Risk of insufficient
product development
Market risk

Global Transfer Pricing Conference │ October 2016
Overview of the value drivers of the business and profit location
across the group
PwC VCA experience
PwC │ 9
Multi function for TP services
Identify substance
requirements, e.g. for principal
companies and profit allocation
to PEs
Support local entity TP when dealing with tax
authorities:
• Tax audits • APA
negotiations
10%
30%Corroborate internal economic analysis in Master
file and CbCreporting
20%
Feasibility study prior to
aligning international
business model to BEPS; identify
potential TP issues
40%

Global Transfer Pricing Conference │ October 2016
PwC VCA experience
PwC │ 10
Number of approved and pending projects
22
13
11
11
10
5
43 Manufacturing
Healthcare
Retail
Other
Services
Industrial
Automotive
FMCG
• We have extensive experience in analysing value chains in a broad spectrum of industries
PwC has either completed or is currently carrying out 31 VCA projects worldwide
• There is a significant interest for VCA from the market
44 VCA projects are pending to start or being considered by our clients

Global Transfer Pricing Conference │ October 2016
How to do it for tax purposes
PwC │ 11
The internal approach
Outcome driven / What if management changes / What if someone challenges what you did?
OECD Profit Split Method

Global Transfer Pricing Conference │ October 2016
Current situation
PwC │ 12
MarketingR&DSalesManufacturingBrand

Global Transfer Pricing Conference │ October 2016
Current situation
PwC │ 13
Marketing
R&
Sales
Manufacturing
Brand
MarketingR&DSalesManufacturingBrand
38%
21%
8%
8%
25%
Functional contribution analysis

Global Transfer Pricing Conference │ October 2016
Current situation (based on internal analysis)
PwC │ 14
10%10% 10%
70%
70%
25%
5%
20%
70%
10%
25%
10%
10%
10%
10%
25%
75%
10%
10%
10%
25%
10%
60%
10%
Marketing
R&D
Sales
Manufacturing
Brand 70% 10% 10% 10%
CH NL BEL US

Global Transfer Pricing Conference │ October 2016 PwC │ 15Global Transfer Pricing Conference │ October 2016
Current situation(based on internal analysis)
Per country
70%
25%
5%
20%
70%
10%
25%
10%
10%
10%
10%
25%
75%
10%
10%
10%
25%
10%
60%
10%
Marketing
R&D
Sales
Manufacturing
Brand
MarketingR&DSalesManufacturingBrand
38%
17%
21%
21%
8%
8%
8%42%
25%13%
Functional contribution analysis Challenge by TA
CH NL BEL US
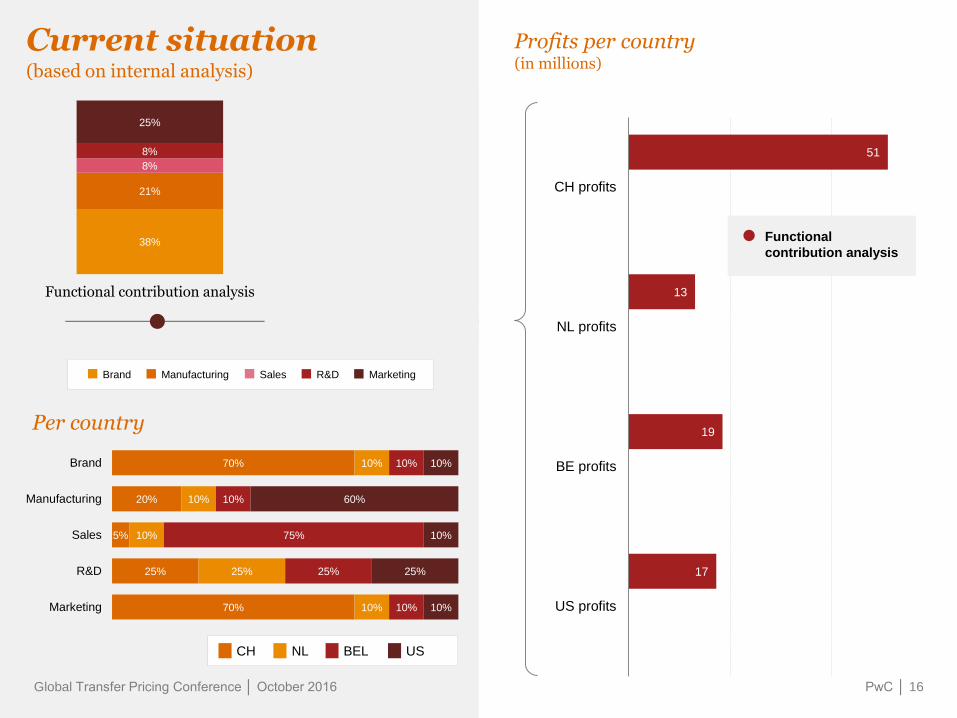
Global Transfer Pricing Conference │ October 2016 PwC │ 16Global Transfer Pricing Conference │ October 2016
Current situation(based on internal analysis)
Per country
70%
25%
5%
20%
70%
10%
25%
10%
10%
10%
10%
25%
75%
10%
10%
10%
25%
10%
60%
10%
Marketing
R&D
Sales
Manufacturing
Brand
MarketingR&DSalesManufacturingBrand
38%
17%
21%
21%
8%
8%
8%42%
25%13%
Functional contribution analysis Challenge by TA
CH NL BEL US
17
19
13
51
US profits
BE profits
NL profits
CH profits
Profits per country (in millions)
Functional
contribution analysis

Global Transfer Pricing Conference │ October 2016 PwC │ 17Global Transfer Pricing Conference │ October 2016
Challenge by the tax authorities
Per country
70%
25%
5%
20%
70%
10%
25%
10%
10%
10%
10%
25%
75%
10%
10%
10%
25%
10%
60%
10%
Marketing
R&D
Sales
Manufacturing
Brand
MarketingR&DSalesManufacturingBrand
38%
17%
21%
21%
8%
8%
8%42%
25%13%
Functional contribution analysis Challenge by TA
CH NL BEL US
17
19
13
51
US profits
BE profits
NL profits
CH profits
Profits per country (in millions)
Functional
contribution analysis
-
+
-

Global Transfer Pricing Conference │ October 2016 PwC │ 18Global Transfer Pricing Conference │ October 2016
Challenge by the tax authorities
Per country
70%
25%
5%
20%
70%
10%
25%
10%
10%
10%
10%
25%
75%
10%
10%
10%
25%
10%
60%
10%
Marketing
R&D
Sales
Manufacturing
Brand
MarketingR&DSalesManufacturingBrand
38%
17%
21%
21%
8%
8%
8%42%
25%13%
Functional contribution analysis Challenge by TA
CH NL BEL US
17
19
13
51
US profits
BE profits
NL profits
CH profits
Profits per country (in millions)
Functional
contribution analysis
-
+
-
34
19
13
34
17
19
13
51
Functional
contribution analysis
Challenge by TA
€ 17 m EBIT shifted from
CH to US

Global Transfer Pricing Conference │ October 2016
Profit split vs Empirical VCA
PwC │ 19
The OECD promises that a value chain analysis can help
identifying when a profit split is appropriate but ...
VCA is not a profit split
method, it is only a tool
To identify where and how value is created, whether the value creation is sustainable, the level of integration and
economically relevant contributions
So a VCA does not replace any aspect of the traditional TP analysis,
it is an overarching broad based analysis to put the TP into the right
economic and group context
1984 2013
Global Transfer Pricing Conference │ October 2016

Global Transfer Pricing Conference │ October 2016
How to do it for tax purposes
PwC │ 20
The empirical approach
1. Peer group analysis
• Identify a representative peer group
• Collect quantitative and qualitative information
GoogleAvention
Bureau Van DukBloomberg
2. Competency mapping
• Identify and analyse the competencies of each peer
• Compare peer competencies with profitability to identify premium returns attributable to specific competencies
Global Transfer Pricing Conference │ October 2016
Case studies
PwC │ 21
Luxury Retail Pharma

Global Transfer Pricing Conference │ October 2016
VCA in practice – Luxury Retail
PwC │ 22
Background
Objective 1. Support and check the outcome
of one-sided benchmark studies
Action1. Peer group analysis
2. Competency analysis
3. Entity mapping
Result
1. Support in TP audits available
2. Weaknesses in TP policy identified
Peer group
We screened over 66 companies involved in the luxury and fashion industry.
We identified 29 companies (excluding Company Y) as relevant for the VCA for being involved in the fashion retail industry, 14 of them being categorised as luxury companies.
23
833
29
Rejected (lack of financial information)
Rejected (operating losses)
Rejected (different activity)
Rejected (unreliable data)
Remaining peers
66

Global Transfer Pricing Conference │ October 2016
VCA in practice
PwC │ 23
Peer group analysis
5%6%
7% 7%
9%
12% 12%
15%16%
18% 18%19% 19% 19%
20%
24% 24%
28% 28%29% 29%
31% 31%32%
0%
5%
10%
15%
20%
25%
30%
35%
Consolidated Operating Profit Margins - 2012-2014 average

Global Transfer Pricing Conference │ October 2016
VCA in practice
PwC │ 24
Vertical integration
peer 1
peer 2
peer 3
Company Y
Retail
Wholesale premium
Wholesale
Company Y
Global Transfer Pricing Conference │ October 2016

Global Transfer Pricing Conference │ October 2016
VCA in practice
PwC │ 25
Vertical integration
19% 24%
76%
27%
73%
6%
31%
8%
17%
0%
10%
20%
30%
OPM- Wholesale(adjusted)
OPM- Retail OPM- TotalCompany Y (as
per AR)
14%
3. Gathering of publically available financial information for both type of companies and determination of an average return
6%
10%11%
13% 14%
0%
2%
4%
6%
8%
10%
12%
14% Avg:
10.9%
Adjusted weighted average Operating
Margins -- Wholesale business (2012-2014)
2. Identification of companies involved respectively in wholesale and retail competencies
Companies
buying
and selling
Procurement
SourcingLogistics Marketing
Internet
Platform
Companies
involved in
wholesale
activities
Design and
creative media
Product Brand &
Management
Control over
production
Stores
operation and
architecture
Vertically integrated peers
+
Process
1. Identification of vertically integrated
value chain components:
• players in this industry can be vertically integrated and combine both wholesale and retail competencies;

Global Transfer Pricing Conference │ October 2016
VCA in practice
PwC │ 26
Horizontal integration
Global Transfer Pricing Conference │ October 2016
peer 1-peer 3
peer 4 – peer 5
peer 6 – peer 7
Company Y
Distinctive retailers
Stores operation
Online retail
Company Y
Global Transfer Pricing Conference │ October 2016
VCA in practice
PwC │ 27
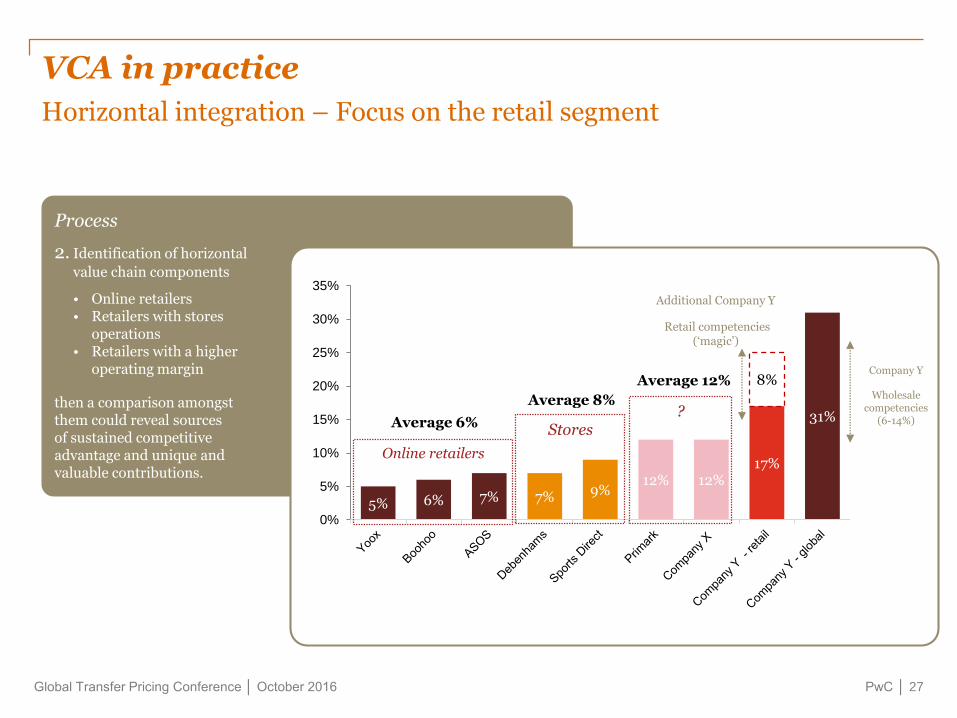
Horizontal integration – Focus on the retail segment
Process
2. Identification of horizontal
value chain components
• Online retailers • Retailers with stores
operations • Retailers with a higher
operating margin
then a comparison amongst them could reveal sources of sustained competitive advantage and unique and valuable contributions.
5% 6% 7% 7% 9%12% 12%
17%
31%
8%
0%
5%
10%
15%
20%
25%
30%
35%Additional Company Y
Retail competencies (‘magic’)
Online retailers
Stores?
Average 6%
Average 8%
Average 12%Company Y
Wholesale competencies
(6-14%)

Global Transfer Pricing Conference │ October 2016
VCA in practice
PwC │ 28
Cross industries comparison - Wholesale & Retail
For Industry 1, the split of profits between the retail and wholesale business is respectively 20%-80%.
For Industry 2, the split of profits varies depending on the level of sophistication of both retail and wholesale businesses:
• 60-40% for both basic or high-end activities;
• 35-65% for basic retail and high end wholesale activities; and
• 50%-50% for high-end retail and basic wholesale activities.
1.5%
6.5%
8%
17%
6%
14%
0%
10%
20%
Retail Wholesale Retail Retailpremium
Wholesale Wholesalepremium
Fashion Retail
Toy retail

Global Transfer Pricing Conference │ October 2016
VCA in practice
PwC │ 29
Vertical & Horizontal
Global Transfer Pricing Conference │ October 2016
6%
8%
12%
17%
Distinctive retailers
Stores operation
Retail “magic” for Company Y
Wholesale
Wholesale premium
Company Y
23%
31%
Online retail

Global Transfer Pricing Conference │ October 2016
VCA in practice – Pharma industry
PwC │ 30
Background
Objective 1. Identify the value creating
activities in the principal and local distribution entities after the reorganisation.
Action1. Peer group analysis
2. Competency analysis
Result
1. Identify value creating activities
2. Empirical assessment of local activities contra central activities
Peer group
We screened peers with similar activities as the company, i.e. branded pharma. To find data on returns attributable to patent and blue sky R&D we also analysed companies acting in the generic pharma industry.
We identified 30 companies as relevant for the VCA for being involved in the pharmaceutical industry, 11 of them being categorised as potentially relevant for the VCA.

Global Transfer Pricing Conference │ October 2016Global Transfer Pricing Conference │ October 2016
VCA in practice
Peer group analysis
0%
5%
10%
15%
20%
25%
30%
35%
40%
45%
Average OPM 30.6%
Selected peers – average OPM* (2010-2014)

Global Transfer Pricing Conference │ October 2016Global Transfer Pricing Conference │ October 2016
VCA in practice
Vertical integration
peer 1
peer 2
peer 3
Vertically integrated pharma company
R&D and Pattern
Marketing and Distribution
Sourcing and Manufacturing
Vertically integrated pharma company

Global Transfer Pricing Conference │ October 2016Global Transfer Pricing Conference │ October 2016
VCA in practice
Vertical integration
15%
2%
13%
0%
2%
4%
6%
8%
10%
12%
14%
16%
Generic (15%) Sourcing andManufacturing
(2%)
Marketing andDistribution (13%)
Process
1. Identification of vertically integrated value chain components
• players in this industry are vertically integrated and sourcing directly from producers of raw materials
• third party sourcing companies can provide insight into contribution of value chain component
• where these parties operate as tollers for industry players, such margins can provide insight into manufacturing competency
2%
15%
30%
0%2%4%6%8%
10%12%14%16%18%20%22%24%26%28%30%32%
CMO Generic Vertically integratedpharma group
24%
Sourcing of
ingredientsManufacturing Marketing DistributionGeneric
Fully integrated
Pharma GroupsR&D
Sourcing of
IngredientsPattern Manufacturing Distribution
CMOs Sourcing Manufacturing
Marketing

Global Transfer Pricing Conference │ October 2016
Taking action - so why consider doing one
Corroborate one-sided methods
APA, MAP, tax auditRequested by tax
authorities
TransparencySubstance
Support your residual
PwC │ 34

Global Transfer Pricing Conference │ October 2016
Panel Q&A
PwC │ 35

Global Transfer Pricing Conference │ October 2016 PwC │ 36
“When the facts change, I change my mind. What do you do, sir?”
John Keynes
Andrew CasleyTP Partner, PwC UK
T: +44 (0)20 7213 3685
Jonas Van de GuchtTP Director, PwC Belgium
T: +32 (0)2 710 83 36
Sara HerstinTP Director, PwC US
T: +1 646 471 0757

Global Transfer Pricing Conference │ October 2016
In-session Q&A
PwC │ 37
To submit questions electronically, select the current session from the agenda (on the main menu), and tap on Participate and Q&A.

Global Transfer Pricing Conference │ October 2016
What did you think?
PwC │ 38
At the end of the session, tap Session Survey and provide your rating on any or all survey questions. Tap submit response.

This publication has been prepared for general guidance on matters of interest only, and does not constitute professional advice. You should not act upon the
information contained in this publication without obtaining specific professional advice. No representation or warranty (express or implied) is given as to the
accuracy or completeness of the information contained in this publication, and, to the extent permitted by law, PwC does not accept or assume any liability,
responsibility or duty of care for any consequences of you or anyone else acting, or refraining to act, in reliance on the information contained in this publication or
for any decision based on it.
© 2016 PwC. All rights reserved. PwC refers to the PwC network and/or one or more of its member firms, each of which is a separate legal entity. Please see
www.pwc.com/structure for further details.
Design services 30335_PRES_09/16
Thank you