global to local observations of atmospheric ammonia with iasi
TRANSCRIPT
Pierre Coheur, IASI Conference, Sévrier, January 2010
Global to local observations
of atmospheric ammonia with IASI
Lieven Clarisse, Pierre Coheur, Daniel Hurtmans, Cathy Clerbaux,
Frank Dentener

Pierre Coheur, IASI Conference, Sévrier, January 2010
Global to local observations
of atmospheric ammonia with IASI
Lieven Clarisse, Pierre Coheur, Daniel Hurtmans, Cathy Clerbaux,
Frank Dentener
Pierre Coheur, IASI Conference, Sévrier, January 2010
Introduction
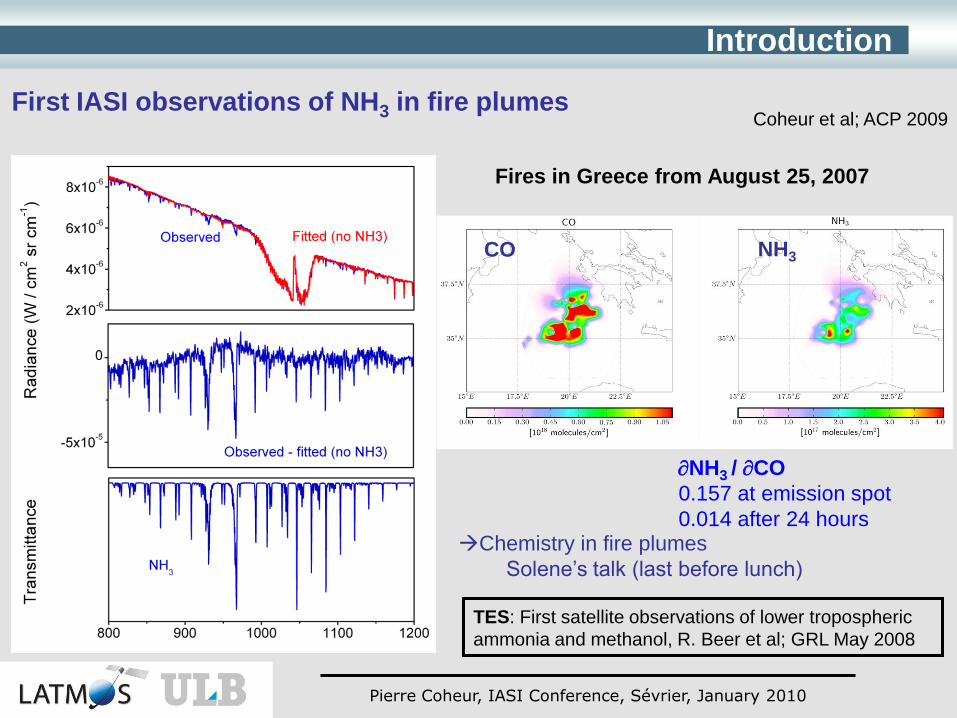
First IASI observations of NH3 in fire plumes
TES: First satellite observations of lower tropospheric
ammonia and methanol, R. Beer et al; GRL May 2008
Fires in Greece from August 25, 2007
Coheur et al; ACP 2009
NH3 / CO
0.157 at emission spot
0.014 after 24 hours
CO NH3
Chemistry in fire plumes
Solene’s talk (last before lunch)

Pierre Coheur, IASI Conference, Sévrier, January 2010
First IASI observations of NH3 in fire plumes
Fires in Eastern Mongolia May 18, 2008
Coheur et al; ACP 2009
NH3 / CO
0.013 at emission spot
NH3 seen in
absorption or
emission
depending on T
profile close to the
surface
Introduction

Pierre Coheur, IASI Conference, Sévrier, January 2010
First IASI observations of NH3 in fire plumes
But fires represent only a small
(locally strong) fraction of
total emissions.
Emissions from agriculture dominates fertilizers and animals account for 56 %
Animals
Biomass
burning
Fertilizers
Humans and waste water
Oceans• Can IASI monitor NH3?
• How well?
• Do we care?
Introduction

Pierre Coheur, IASI Conference, Sévrier, January 2010
Ammonia and the perturbed N-cycle: Causes and
consequences
Global mapping of NH3 using IASI radiance indexing
• Method
• Yearly averages: hotspots and description of sources
Local (boundary layer) monitoring
• How close to the surface do we see?
• small-scale variations
Outline

Pierre Coheur, IASI Conference, Sévrier, January 2010
Ammonia and the perturbed N-cycle
Ammonia and the perturbed N-cycle
Anthropogenic nitrogen fixation
Energy
NOx
Food
NH3
Today ~40 % the world population
depends on Haber Bosch process
Haber-Bosch
N2+3H22NH3
Future trends highly uncertain

Pierre Coheur, IASI Conference, Sévrier, January 2010
Ammonia and the perturbed N-cycle
Ammonia and the perturbed N-cycle
1860 1995
N-deposition
N-fluxes
Adapted from Galloway, 2003

Pierre Coheur, IASI Conference, Sévrier, January 2010
Ammonia and the perturbed N-cycle
Ammonia and the perturbed N-cycle
Anthropogenic nitrogen fixation
Form of Nr Ecosystem Impacts scale
NOx Atmosphere Acid precipitation / AQ (BL O3, PM) Regional
NH3 Atmosphere AQ (PM) Regional / local
N2O Atmosphere Climate / Stratospheric ozone Global
NH3 + other Nr Aquatic Eutrophication / acidification Regional / local
NH3 + other Nr Terrestrial Acid deposition / biodiversity loss Local
NH3 likely to become the
dominating primary anthropogenic
source to particles in ambient air
2020From CAFÉ
Gulf of Mexico dead zone

Pierre Coheur, IASI Conference, Sévrier, January 2010
Ammonia and the perturbed N-cycle
Ammonia and the perturbed N-cycle
The nitrogen cascade (Galloway, 2003): Circulation of anthropogenic Nr in Earth’s
atmosphere, hydrosphere, and biosphere has a wide variety of consequences, which are
magnified with time as Nr moves along its biogeochemical pathway. The same atom of Nr can
cause multiple effects in the atmosphere, in terrestrial ecosystems, in freshwater and marine
systems, and on human health. We call this sequence of effects the nitrogen cascade.
As the cascade
progresses, the origin of Nr
becomes unimportant.

Pierre Coheur, IASI Conference, Sévrier, January 2010
Ammonia and the perturbed N-cycle: Causes and
consequences
Global mapping of NH3 using IASI radiance indexing
• Method
• Yearly averages: hotspots and description of sources
Local (boundary layer) monitoring
• How close to the surface do we see?
• daily to yearly variations
Outline
800 1000 1200 1400 1600 1800 2000 2200 2400 2600
0.0
2.0x10⁻⁶
4.0x10⁻⁶
6.0x10⁻⁶
8.0x10⁻⁶
1.0x10⁻⁵
1.2x10⁻⁵
1.4x10⁻⁵
CH4
HODH2
16O
H218
O
H216
O, HOD
N2O, CH4
O3
HNO3
CFC11, CFC12
CO
CO2, N2O
Ra
dia
nce
(W
/ c
m2 s
r cm
-1)
Wavenumber (cm-1)
CO2
Ts=275 K
S A/CNRS – ULB
800 1000 1200 1400 1600 1800 2000 2200 2400 2600
0.0
2.0x10⁻⁶
4.0x10⁻⁶
6.0x10⁻⁶
8.0x10⁻⁶
1.0x10⁻⁵
1.2x10⁻⁵
1.4x10⁻⁵
CH4
HODH2
16O
H218
O
H216
O, HOD
N2O, CH4
O3
HNO3
CFC11, CFC12
CO
CO2, N2O
Ra
dia
nce
(W
/ c
m2 s
r cm
-1)
Wavenumber (cm-1)
CO2
Ts=275 K
S A/CNRS – ULB
800 1000 1200 1400 1600 1800 2000 2200 2400 2600
0.0
2.0x10⁻⁶
4.0x10⁻⁶
6.0x10⁻⁶
8.0x10⁻⁶
1.0x10⁻⁵
1.2x10⁻⁵
1.4x10⁻⁵
CH4
HODH2
16O
H218
O
H216
O, HOD
N2O, CH4
O3
HNO3
CFC11, CFC12
CO
CO2, N2O
Ra
dia
nce
(W
/ c
m2 s
r cm
-1)
Wavenumber (cm-1)
CO2
Ts=275 K
S A/CNRS – ULB
NH3

Pierre Coheur, IASI Conference, Sévrier, January 2010
Mapping Ammonia
Global mapping using radiance indexing
Target feature at 867.75 cm-1
Two window channels
Wavenumber (cm-1)
DBT= BTtarget - BTwindow
1. Brightness temperature difference
IASI
No-ILS
No P-broadening

Pierre Coheur, IASI Conference, Sévrier, January 2010
Mapping Ammonia
Global mapping using radiance indexing
2. Brightness temperature difference Total columns (Curve of growth)
1K 15 7.5 mg.m-2
Advantages
•Simple
•Fast (NRT global)
•Robust
Limitations
•No explicit RT
(thermal contrast!)
•No profile information

Pierre Coheur, IASI Conference, Sévrier, January 2010
Mapping Ammonia
Global mapping using radiance indexing
2008 average
Clarisse et al., Nature Geo 2009
28 emission hotspots identified

Pierre Coheur, IASI Conference, Sévrier, January 2010
Mapping Ammonia
Global mapping using radiance indexing
2008 average
Inland empire High Plains AquiferEbro valley
Nile Delta
The link to agriculture

Pierre Coheur, IASI Conference, Sévrier, January 2010
Mapping Ammonia
Global mapping using radiance indexing
2008 average The link to agriculture
December/January/February June/July/August
30°
Increased fertilizer use + enhanced volatilisation in NH during summer(+ also enhanced surface sensitivity…)

Pierre Coheur, IASI Conference, Sévrier, January 2010
Mapping Ammonia
Global mapping using radiance indexing
Comparison with models
IASI TM5
IASI-TM5
IAS
I < T
M5
IAS
I > T
M5
Missing emissions
Detection threshold Daily 0.2K 3mg/m2
Monthly 0.08K 1.2mg/m2
(Thermal contrast!)

Pierre Coheur, IASI Conference, Sévrier, January 2010
Mapping Ammonia
Global mapping using radiance indexing
2009
2008 average 2009 average

Pierre Coheur, IASI Conference, Sévrier, January 2010
Ammonia and the perturbed N-cycle: Causes and
consequences
Global mapping of NH3 using IASI radiance indexing
• Method
• Yearly averages: hotspots and description of sources
Local (boundary layer) monitoring
• How close to the surface do we see?
• small-scale variations
Outline

Pierre Coheur, IASI Conference, Sévrier, January 2010
Local source monitoring
2008 yearly average
• Typical agricultural valley
• Elevated NH3 and PM levels throughout the year
• Large temperature variations at surface(including temperature inversions) ULB — CNRS/ LATMOS
US central valley
Prior information built from TM5 1x1 output,
With xa and Sa >1ppb surface (polluted)
Retrievals using Atmosphit (line-by-line RTM + OE inversion)
xa
Sa1 ppb
10 ppb
5
2.5
0150 %
220 %
Clarisse et al., accepted for
publication in JGR

Pierre Coheur, IASI Conference, Sévrier, January 2010
Local source monitoring
US central valley
Two good cases for surface sensitivity
Significant absorption contribution from
ammonia in the TOA radiance spectrum
IASI Averaging
kernels
DT ~ + 10 K
Large POSITIVE thermal contrast (AM) Temperature inversion (PM)
DT ~ - 5 K
emission contribution from ammonia in the
TOA radiance spectrum

Pierre Coheur, IASI Conference, Sévrier, January 2010
Local source monitoring
US central valley
AM PM
NH3 vmr at 700 m
DOFS
Z of max. sensitivity
DT
1.0
1.0
0.5
1.5
+10
0
0
-5
Clarisse et al., accepted for
publication in JGR

Pierre Coheur, IASI Conference, Sévrier, January 2010
Local source monitoring
US central valley
Sources at “micro”-
scale and on a (close
to) daily basis
Clarisse et al., accepted for
publication in JGR
0.0675° × 0.0675°

Pierre Coheur, IASI Conference, Sévrier, January 2010
conclusions
• first example of volatilization processes seen from TIR nadir sounders
• first example of significant boundary layer sensitivity in favorable cases of atmospheric
thermal structure ( detection down to 5 ppb!)
• Allows detecting sources globally, and monitoring the largest on a daily basis
High BL pollution
Moderate BL pollution
AM PM
0.1 K
0.2 K
0.2 K
0.1 K
NH3 from IASI –conclusions-
Towards the
next generation
+ higher spectral resolution would further help!

Pierre Coheur, IASI Conference, Sévrier, January 2010
SPECAT/ULB
L. Clarisse
P.F. Coheur
D. Hurtmans
F. Karagulian
J.L. Lacour
A.Razavi
M. Theunissen
M. Van Damme C.
Wespes
CNRS/LATMOS
A. Boynard
C. Clerbaux
M. George
J. Hadji-Lazaro
M. Pommier
C. Scannell
Global to local observations
of atmospheric ammonia with IASI
CNRS/LMD
S. Turquety