global sourcing annual report 2005 –preview
TRANSCRIPT

Global Sourcing
Annual Report 2005 – Preview

Proprietary & Confidential. © 2005 Everest Partners, L.P.2
Section I: Executive summary and implications for stakeholders
Section II: Offshore Market overview� Executive summary� Value proposition� Market state
� Maturity� Size
� Future prospects� Evolution of drivers/external forces� Evolution of demand structures� Market growth� Supply considerations
Section III: Buyer adoption� Executive summary� Adoption and penetration
� Geography� Size� Industry� Function/process
� Operating models
Section IV: Supplier developments� Executive summary � Impact of offshoring� Supplier segmentation� Future evolution and challenges
Topic
Table of contents (page 1 of 2)
4
1515182224283233363840
4242444648515354
5858606575

Proprietary & Confidential. © 2005 Everest Partners, L.P.3
Table of contents (page 2 of 2)
Section V: Savings� Executive summary � Estimating savings
� Discrepancies in savings� Savings analysis and estimates
� Controlling savings� Implications and case studies
Section VI: Billing rates and supplier margins� Executive summary � Background� Historical trends� Future outlook� Implications
Section VII: Location optimization� Executive summary � Analysis framework
Section VIII: Risks and case studies� Executive summary � Risk impact� Understanding offshoring risks
� Dimensions/types� Case studies
� A perspective on offshoring risks
Appendix: Glossary of terms
78788080849094
9898101104108117
120120122
131131133136137139144
148
Topic

Proprietary & Confidential. © 2005 Everest Partners, L.P.4
10.00%
12.00%
14.00%
16.00%
18.00%
20.00%
22.00%
24.00%
26.00%
28.00%
30.00%
Dec Mar Jun Sep Dec Mar Jun Sep Dec
10
12
14
16
18
26
20
22
24
Dec-02
Mar-03
Jun -03
Sep-03
Dec-03
Mar-04
Jun -04
Sep-04
Dec-04
28
30
IT - Package implementation
The Global Sourcing report will have over 100 pages of
insightful information
Pioneers Emerging rapid growth Reaching maturity
Market value creation
MaturityOffshore IT market
Offshore BPO market
“Pure” offshore revenues
Onsite revenues
23-24
12-13
17.5-18
5.5-6
11-11.5
1-1.5
Market sizeMarket maturity
Industry adoption Supplier performance
Business models
Rates, costs and margins
23%
60%15%
9%62%
31%
Indian third-party model
US$ 9.2 billion US$ 3.6 billion
MNC captive model
BPOIT services
MNC1 third-party model
100% =
BPO – Core processes
BPO - Call centers
IT - ADM
BPO - OthersIT -Others
IT – R&D
BPO - HRO
BPO - FAO
BPO -Procurement IT - Infrastructure
Offshore process maturity Offshore market2004, US$ billion
Offshore model share in Indian market2004, US$ billion
Offshore process maturity2004, Percentage (100% = US$35 billion)
Net margin for new global players
Net margin for select Tier 2 Indian players
Net margins across new global and select Tier II Indian SuppliersDec 2002-2004, Percentage (%)
0.4%
0.4%
4%
4%
12%
16%
19%
45%
Pharmaceuticals
Healthcare
Transportation
Retail
Manufacturing
Others
Telecom and hi-tech
Financial services
0
10
20
30
2001 2002 2003 2004
Supplier operating margins2000-2004, Percentage
Average annual decrease3: -1.5%
CAGR 1%
Billing rates2000-2004, US$/hr
On-siteOffshore
CAGR -6%
0
20
40
60
80
2001 2002 2003 2004
Operating costs/employeesUS$ (‘000)
CAGR 5.8%
0
10
20
30
40
2001 2002 2003 2004

Proprietary & Confidential. © 2005 Everest Partners, L.P.5
The overall offshore market has evolved from its early
stages and offers larger value creation opportunities
today
1 Estimated growthSource: Everest Research Institute
Key characteristics� Emergence of locations outside of India as strong, feasible offshore alternatives
� Rapid growth in offshoring of BPO services
� Offshoring of IT services other than ADM services
� Increase in size of offshore deals� Entry of US IT suppliers into offshore locations to meet cost pressures
� Rapid maturity of pure-play offshore suppliers
� Substantial M&A activity� Establishment of select operating models and standards
Pioneers Emerging rapid growth Reaching maturity
Market value creation
Key characteristics� Emergence of India as a feasible offshore destination for IT services
� Setup of captives by select large global players
� Development of a handful of offshore suppliers
1998-991993-94 2000-01
Key characteristics� Increased adoption by a large number of companies
� Increased focus on processes and quality among suppliers
� Emergence of some operating models and standards
2005

Proprietary & Confidential. © 2005 Everest Partners, L.P.6
Mega companies - heavy adopters
Other users2
100% = ~5001
companies100% = US$ 7.7billion
Large companies – heavy adopters
Share of IT services imports from India
US-based companies
Mega companies - steady users
Large companies3 – steady users
IT services imports (from India) by US-based companies2004 Percentage (%)
1 Companies with revenues greater than US$10 billion2 Excludes companies with very small offshore deals2 Companies with revenues between US$1 billion and US$10 billion
Source: Everest Research Institute analysis
Offshore adoption is being driven by only a handful of the
Mega1 companies, with most of the other companies
being steady but small users
3%
25%13%
40%
6%
6%
26%
9%
20%
52%

Proprietary & Confidential. © 2005 Everest Partners, L.P.7
Companies offshoring are using multiple business
models
Typical offshore business models
Pure Captive Model• An internal cost center or a 100% subsidiary company to cater exclusively to the parent company
• Examples: Amex, Dell,
HSBC, Ford, Sun, etc.
Captive model
Build Operate Transfer (BOT)/ Joint Venture (JV)• Provider-owned/joint operations that are allowed to be transferred back to the customer
• Example: eServe-Citibank
Strategic alliance/Joint venture model
Inverted BOT• The offshore provider who provides only implementation support to start with and is allowed to buy in to the entity later
• Examples: AIG- Polaris, BA -
WNS
Pure third party offshoring• Use of a offshore provider to outsource business processes or IT services
• Examples: Lehman-Wipro,
NY Life-Infosys, Amazon-
Daksh
Third party offshoring model
Managed third party offsoring• Full/ part-time resources on the ground to facilitate transition, relationship mgmt and transfer of organization and domain knowledge to third party providers
• Example: Greenpoint-
Progeon
Offshore business models
Illustrative
Eventually, BOT model ends up as captive whereas inverted BOT ends up as third party

Proprietary & Confidential. © 2005 Everest Partners, L.P.8
13
41
29
13
4
Savings from offshore, while high, tend to be
inconsistent
20-29 30-39 40-49 50-59 60+
Buyers achieving select range of savingsPercentage
While 70 percent of buyers achieved savings between 30 and 50 percent, 30 percent of the buyers experienced savings that were outside this range, reinforcing the wide range of savings achieved in offshore contracts
While 70 percent of buyers achieved savings between 30 and 50 percent, 30 percent of the buyers experienced savings that were outside this range, reinforcing the wide range of savings achieved in offshore contracts
Range of savings (%)
Source: Everest 2004 Offshore Market Survey

Proprietary & Confidential. © 2005 Everest Partners, L.P.9
Recommended approach to defining and calculating savings
Gross savings = (percent of services offshored X labor arbitrage) + percent productivity improvement1
Net savings = Gross savings – (setup costs/contract term) – governance costs
Savings disparity occurs partially due to the variation in
definitions and complexity of calculations
Key notes
� The formulae above are for annualized savings over the term of a typical offshoring deal� Productivity improvements are assumed to include the entire process, and not only the offshored element (which might vary from one situation to another). Further, they refer to only cost savings and not quality improvements
� A portion of the savings might be reinvested into the business. These reinvestments are assumed to be actual savings, and accordingly, reinvestments are not deducted when calculating savings
� In addition to the above factors, macro-economic factors, such as inflation and exchange rate fluctuation, will affect savings over time
� Quality improvements in the offshored process can also increase savings
1 Effective savings on the original cost base, using appropriate formula for converting throughput increases to savingsSource: Everest Research Institute analysis

Proprietary & Confidential. © 2005 Everest Partners, L.P.10
However, a large part of the disparity arises due to
potential variations in the many factors which
impact savings, such as productivity
Annualized productivity improvement Percentage
No productivityImprovement
0-30% productivity improvement
30%+ productivityimprovement
27
38
35
Note:Productivity improvements were derived by measuring a wide range of relevant productivity measures such as average call handle time, number of invoices processed per FTE, claims per hour, agent utilization, reduction in development tine, etc.
Sample size: 30 transactionsSource: Everest 2004 Offshore Market Survey

Proprietary & Confidential. © 2005 Everest Partners, L.P.11
While offshoring still has a small share of the overall IT
and BPO services business, supplier adoption of offshore
ranges from low to highCSC
Capgemini
EDS
Accenture
Perot
IBM GS
ACS
Sapient
Infosys
Wipro
TCS
Cognizant
Satyam
HCL
Mphasis
Offshore/onsite ratio of employees1
20052, 100% = Total ‘000s employees
79 119 59 123 18 191 52 2 40 49 42 20 21 24 8
Capegemini
CSC
IBM GS
EDS
Accenture
Perot
ACS
Sapient
Cognizant
Infosys
Satyam
Wipro
HCL
Mphasis
Onsite FTEs
Offshore FTEs
TCS
1 Includes the entire FTE’s of the organization – IT services and BPO2 As of June 30, 2005; estimated where data not available
Source: Everest Research Institute
Proprietary & Confidential. © 2005 Everest Partners, L.P.12
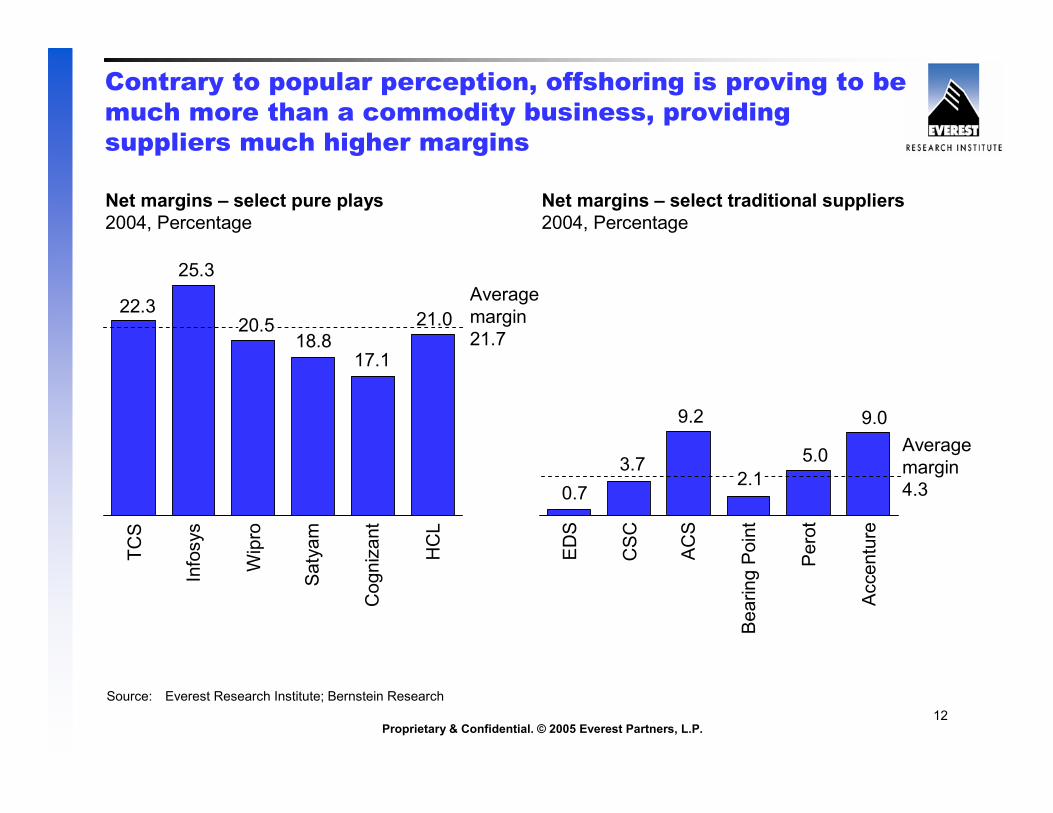
Contrary to popular perception, offshoring is proving to be
much more than a commodity business, providing
suppliers much higher margins
Net margins – select pure plays2004, Percentage
Net margins – select traditional suppliers2004, Percentage
Average margin 21.7
Average margin 4.3
22.3
0.7
9.2 9.0
18.817.1
21.0
25.3
TCS
Infosys
Wipro
Satyam
Cognizant
HCL
3.7 5.0
EDS
CSC
ACS
Bearing Point
Perot
Accenture
20.5
Source: Everest Research Institute; Bernstein Research
2.1

Proprietary & Confidential. © 2005 Everest Partners, L.P.13
In order to understand supplier segments in an offshoring
context, we view suppliers across two key dimensions
Rationale for “cutoffs”� Scale cutoff: 40,000 FTEs translates to roughly US$5 billion in revenues for IT services providers, an important size landmark in Everest’s opinion
� Offshore centricity cutoff: While this varies with suppliers’ business models, in general, Everest believes that having 20% of workforce offshore is indicative of a reasonable commitment to offshoring
100%
Scale (Total FTEs)
100,000
1. Are there suppliers who have achieved both scale and strong offshore presence?
2. How many large suppliers exist
who have the scale but have not
yet fully leveraged offshore?
3. How are the smaller suppliers doing in terms of leveraging offshore?
200,000
0
0%
Cutoff=40,000
Offshore centricity (Offshore FTEs as % of Total FTEs)
Cutoff=20%
50%
Supplier information collated from an Everest global survey on offshore capabilities –approximately 50 suppliers surveyed
Supplier information collated from an Everest global survey on offshore capabilities –approximately 50 suppliers surveyed
Supplier segmentation from an offshoring perspective2005
Source: Everest Research Institute

Proprietary & Confidential. © 2005 Everest Partners, L.P.14
Offshore billing rates and supplier margins have seen
significant variations over the last 7-8 years due to
changes in the market and competitive forces
Forces1 1998-2001 2001-2004
Offshore billing rates decreased by 6.0% p.a.; margins decreased by 1.5% p.a.
Demand for offshore services
Competitive intensity
Supplier cost structures
� Limited number of mature offshore suppliers
� Low cost structures� Low wages and wage increases� Favorable onsite-offshore mix
� Overall recession and an IT industry depression
� Increased supplier pressure due to � Increasing maturity of pure plays� Overcapacity built during 1998-2001
� Increase in cost structures� High wage growth
� Strong growth in overall IT spend� Surge of Y2K-related work� Dot-com boom leading to heavy investments in e-business
1 For the purpose of our analysis
Offshore billing rates increased by 12.0% p.a.; margins increased by 5.0% p.a.
Proprietary & Confidential. © 2005 Everest Partners, L.P.15
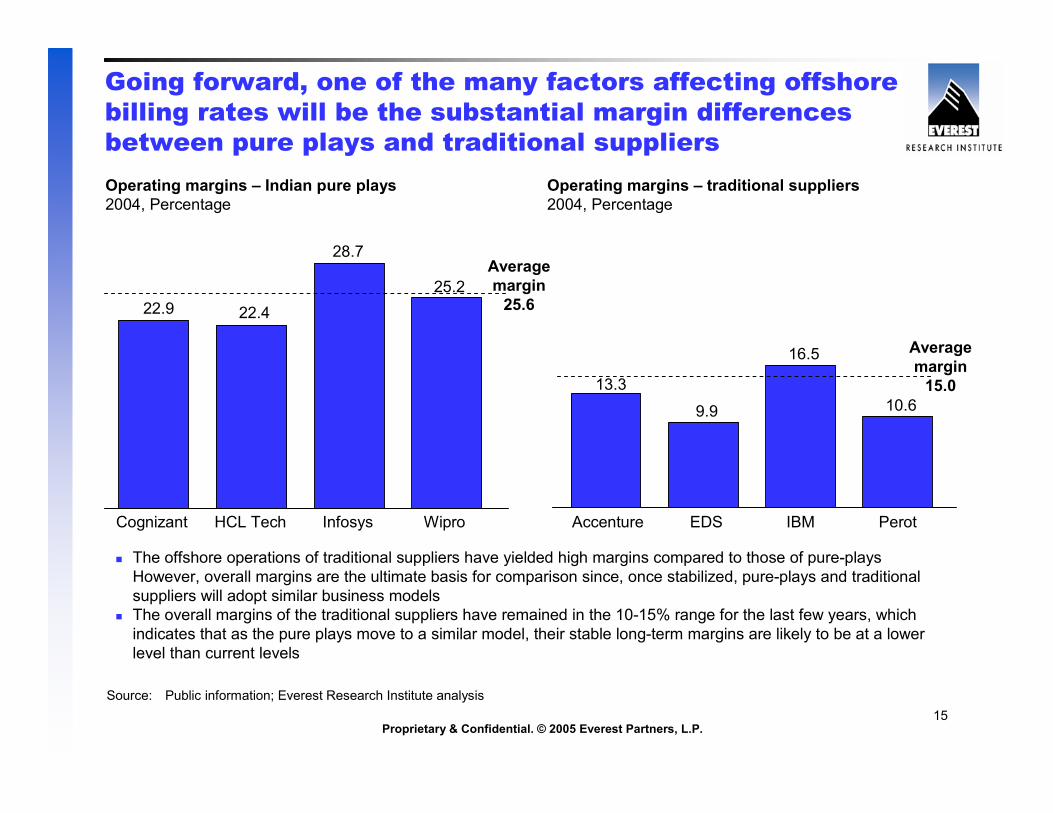
Going forward, one of the many factors affecting offshore
billing rates will be the substantial margin differences
between pure plays and traditional suppliers
Operating margins – Indian pure plays2004, Percentage
Operating margins – traditional suppliers2004, Percentage
Average margin 25.6
Average margin 15.0
� The offshore operations of traditional suppliers have yielded high margins compared to those of pure-plays However, overall margins are the ultimate basis for comparison since, once stabilized, pure-plays and traditional suppliers will adopt similar business models
� The overall margins of the traditional suppliers have remained in the 10-15% range for the last few years, which indicates that as the pure plays move to a similar model, their stable long-term margins are likely to be at a lower level than current levels
22.9 22.4
28.7
25.2
13.3
9.9
16.5
10.6
Cognizant HCL Tech Infosys Wipro Accenture EDS IBM Perot
Source: Public information; Everest Research Institute analysis

Proprietary & Confidential. © 2005 Everest Partners, L.P.16
Margin pressures will be strong too, but suppliers can
leverage measures such as improved utilization levels
and offshore-onsite revenue mix to combat rising costsEmployee utilization Sep-01 to Dec-04, Percentage
Sep-01
Dec-01
Mar-02
Jun-02
Sep-02
Dec-02
Mar-03
Jun-03
Sep-03
Dec-03
Mar-04
Jun-04
Sep-04
Dec-04
57% 56%45% 43% 36%
43% 44%55% 57% 64%
Offshore-onsite revenues mix FY 2000-2005E Offshore
Onsite
� The mix seems to be changing in favor of offshore due to the substantial increase of BPO services, which are predominantly delivered offshore
� Excluding offshore BPO revenues, the offshore proportion stands at about 50% for FY04
99-00 00-01 01-02 02-03 03-04
1 Infosys, Wipro, SatyamSource: Smith Barney, NASSCOM
7071
73
7778
7677
7877 76
7476
73 72

Proprietary & Confidential. © 2005 Everest Partners, L.P.17
Offshore location optimization is determined by two key
factors: the savings potential offered by the location, and
the maturity of the location for the given process
Framework for analysis of location optimization
Savings potential determined by comparing fully-loaded direct cost of destination with that of the source location� Direct salary cost� Management and administration costs
� Real estate cost� Telecom cost� Equipment cost� Cost impact of attrition
Savings potential
Location maturity
� Cultural compatibility� Government support� Infrastructure quality and availability
� Labor availability� Risks� Market activity
Limited savings opportunity –may be near-shore options
Optimal destinations
Not ready for offshoring
Could evolve as attractive locations
ILLUSTRATIVE
Source: Everest Research Institute
Relative importance of each dimension can be subjective. Further, overall scores can vary with buyer’s risk profiles
Excludes supplier margins, sales and marketing expenses, and centralized corporate overhead

Proprietary & Confidential. © 2005 Everest Partners, L.P.18
Toronto
Shanghai
Mumbai
Prague
PuneManila
Dalian
Budapest
Bangalore
Country/region comparisons offer some high-level
perspective, but within a region, savings potential and
maturity can vary significantly by city
ILLUSTRATIVE
KL
Potential savings per FTE p.a. (%)
Location maturityLow
Low
High
High
Location optimization for transactional F&A workIndian cities
Chinese cities
East European cities
Other cities
1 Excluding Manila and ShanghaiSource: Everest Research Institute

Proprietary & Confidential. © 2005 Everest Partners, L.P.19
Of the various offshore risk dimensions, operational
risks are the most frequent cause of offshore problems
1 Based on a sample of 28 deals, identified through secondary sources, in which the buyer had problems with offshoring2 The above categories do not add up to 100% since multiple sources of risk may have caused a problem/failure
Source: Everest Analysis, June 2005
Quality
Process control
Buyer adaptability
to offshoring
Transition and
knowledge transfer
Infrastructure
Source of operational risk1
Percentage (%)
50
36
21
21
14
Operational risk
Organizational risk
Legal risk
Financial risk
Strategic risk
Dimension of risk causing problem/failure1
Percentage (%)
61
50
25
21
14

Proprietary & Confidential. © 2005 Everest Partners, L.P.20
Examining various offshoring cases illustrates the kind
of operational problems encountered
Initial Q&A bottleneck due to limited US-based resources available to audit offshore work
Limited face time at the beginning of the process resulted in avoidable mistakes
Supplier’s internal audit detected employee misconduct while making outbound sales calls
Corporate clients’ call center in India discontinued due to customer complaints about quality of problem resolution and “thick accent”
Transition and knowledge transfer
Barry Wehmiller
Quality Dell
Buyer adaptability to offshoring
Radio Shack
Process control Capital One
Long lead times for acquiring the hardware in offshore location delayed development work for several months, leading to higher costs
Transition and knowledge transfer
DHL
Source: Everest Research Institute
Risk Buyer Problem(s) encountered

Proprietary & Confidential. © 2005 Everest Partners, L.P.21
Robust risk mitigation practices address and can
overcome offshoring risks
1 Based on a sample of 28 deals, identified through secondary sources, where the buyer had problems with offshoringSource: Everest Analysis, June 2005
Quality
Process control
Buyer adaptability
to offshoring
Transition and
knowledge transfer
Infrastructure
� Adequate training of offshore resources� Strong transition management, including knowledge transfer and documentation of processes
� Audit quality and security processes� Station some buyer resources offshore
� Employ job shadowing� Retain critical buyer resources through the transition period� Use pilots to identify bottlenecks in transitioning
� Upgrade maturity of buyer processes such as generation of specifications, etc.
� Clear communication with buyer’s employees
� Dedicated infrastructure� Redundant systems for critical infrastructure such as satellite links
ILLUSTRATIVEOperational Risk High-level mitigation mechanisms

Proprietary & Confidential. © 2005 Everest Partners, L.P.22
Get the answers today that lead to tomorrow’s
success
Everest Research Institute has the resources, experience, and capabilities to provide companies with the strategic intelligence, analysis, and insight that are crucial to making the right decisions in today’s outsourcing marketplace.
With the vision of our leadership team, the personal commitment, and indeed, the passion of our professionals to deliver real value to our clients, our organization is unsurpassed in its ability to guide your company’s future success.
Everest Research InstituteTwo Galleria Tower13455 Noel Road, Suite 2100Dallas, TX 75240+1-214-451-3000www.everestresearchinstitute.cominfo@everestresearchinstitute.com
Everest AustralasiaLevel 6, 90 Mount StreetNorth Sydney, NSW 2060Australia+61-3-9833-1018
Everest India Ground Floor, Tower AUnitech Business ParkSouth City - I, GurgaonNew Delhi National Capital Region India 122001+91-124-304-1000
Everest UKGainsborough House100 Pall MallSt. James's London, SW1Y 5HP+44-20-7664-8920
Everest Group150 E., 52nd Street, 16th FloorNew York, NY 10022+1-646-805-4000
Everest Canada5915 Airport Rd #400 Mississauga, ON L4V1T1Canada+1-905-405-5640