global shrimp farming situation - fenacam -...
TRANSCRIPT

GLOBAL SHRIMP FARMING SITUATION
George Chamberlain
President

GLOBAL AQUACULTURE ALLIANCE
• Communications
– Global Aquaculture Advocate magazine
– Website (www.gaalliance.org)
– Electronic newsletter
• BAP Certification
– Market driven standards for best practices
• Annual GOAL meeting
– Production, markets
• Advocacy
– Issues and solutions

• Health
• Breeding
– Kona Bay vannamei
– Brunei monodon
• Nutrition
– Fishmeal replacement
• Hatchery
• Farm
• Seafood
– Kauai Shrimp
– Kauai clams Brunei
Hawaii, USA
TOPICS
1. The Challenge
2. Disease Case Studies
3. Shrimp Health Management
– The Past
– The Present – Early Mortality Syndrome
– The Future
4. Conclusions
5. Panel Discussion
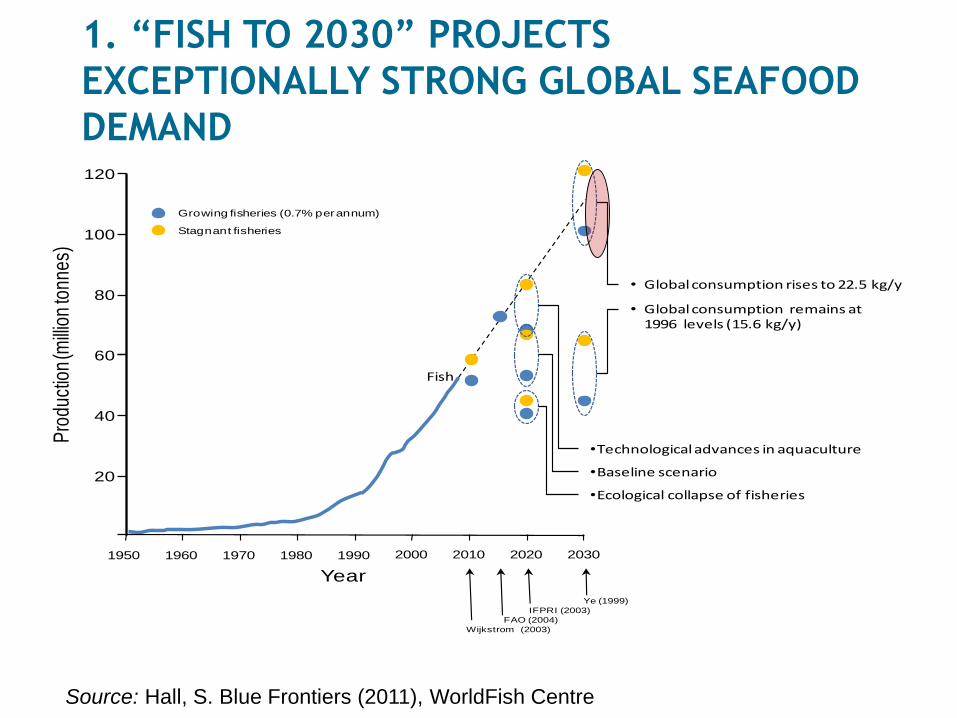
1. “FISH TO 2030” PROJECTS
EXCEPTIONALLY STRONG GLOBAL SEAFOOD
DEMAND
Year
Pro
duct
ion
(mill
ion
tonn
es)
20
40
60
1950 1960 1970 1980 1990 2000 2010 2020 2030
80
100
120
FAO (2004)
Wijkstrom (2003)
IFPRI (2003)
Ye (1999)
Fish
•Baseline scenario
•Technological advances in aquaculture
•Ecological collapse of fisheries
• Global consumption remains at1996 levels (15.6 kg/y)
• Global consumption rises to 22.5 kg/y
Growing fisheries (0.7% per annum)
Stagnant fisheries
Source: Hall, S. Blue Frontiers (2011), WorldFish Centre

Aquaculture, with growth potential
Limited
Wild capture: Limited and stable
Vo
lum
e (
mill
ion
s o
f to
ns)
2. AQUACULTURE IS THE ONLY WAY
TO INCREASE OUR SEAFOOD SUPPLY

8,7 9,0 9,9
11
,2
13
,1
15
,0
16
,9
17
,9
18
,5
19
,9
20
,8
22
,2
23
,5
24
,2
26
,3
28
,0
29
,9
31
,6
34
,3
36
,1
38
,3 41
,6
0
50
100
150
200
250
0,0
5,0
10,0
15,0
20,0
25,0
30,0
35,0
40,0
45,0
19
90
19
91
19
92
19
93
19
94
19
95
19
96
19
97
19
98
19
99
20
00
20
01
20
02
20
03
20
04
20
05
20
06
20
07
20
08
20
09
20
10
20
11
% t
en
ye
ar g
row
th r
ate
Pro
du
ctio
n in
Mill
. me
tric
to
nn
es Production % growth
7Source: FAO
3. THE GROWTH RATE OF
AQUACULTURE IS SLOWING DOWN

4. DISEASE IS THE PRIMARY FACTOR
LIMITING THE GROWTH OF AQUACULTURE
1. Disease
2. Feed
3. Environment
4. Financing
5. Market
8

TOPICS
1. Our Challenge
2. Disease Case Studies
3. Shrimp Health Management
– The Past
– The Present – Early Mortality Syndrome
– The Future
4. Conclusions
5. Panel Discussion
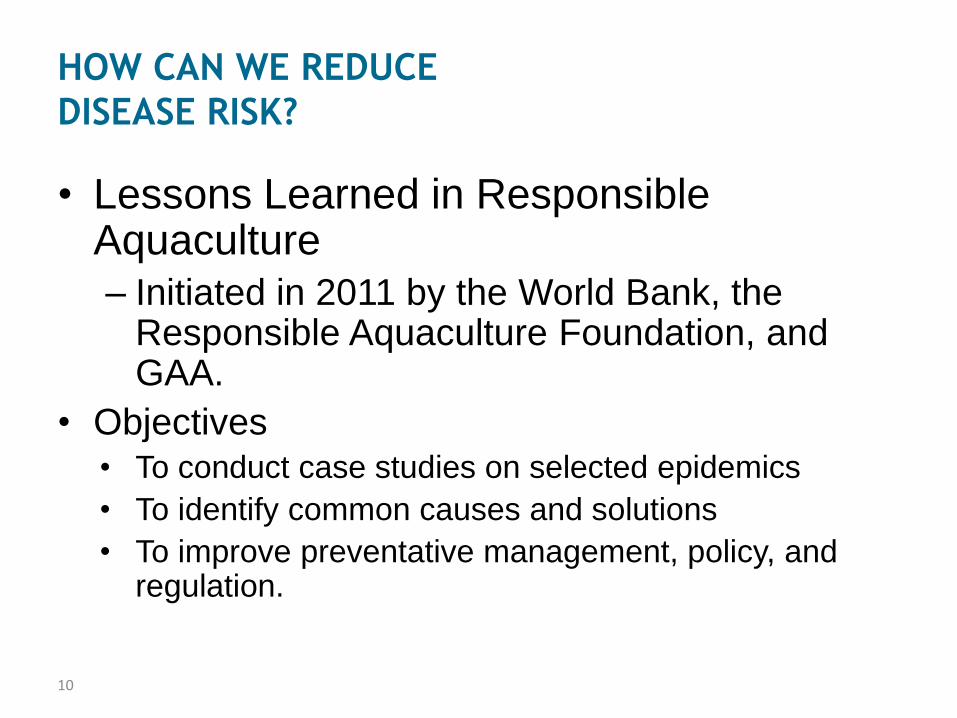
HOW CAN WE REDUCE
DISEASE RISK?
• Lessons Learned in Responsible Aquaculture
– Initiated in 2011 by the World Bank, the Responsible Aquaculture Foundation, and GAA.
• Objectives• To conduct case studies on selected epidemics
• To identify common causes and solutions
• To improve preventative management, policy, and regulation.
10

“REDUCING DISEASE RISK IN AQUACULTURE”
• Three Case Studies:
– 2011: ISA in Chile
– 2012: EMS in Vietnam
– 2013: WSSV in Mozambique and Madagascar
• Report can be downloaded from the GAA website:
– www.gaalliance.org/newsroom/whitepapers.php

2011 CASE STUDY IN CHILE: INFECTIOUS
SALMON ANEMIA VIRUS
• Producers captivated by rapid growth of the sector.
• Inadequate biosecurity, surveillance, zone management
• Fast response by industry, banks, and regulators
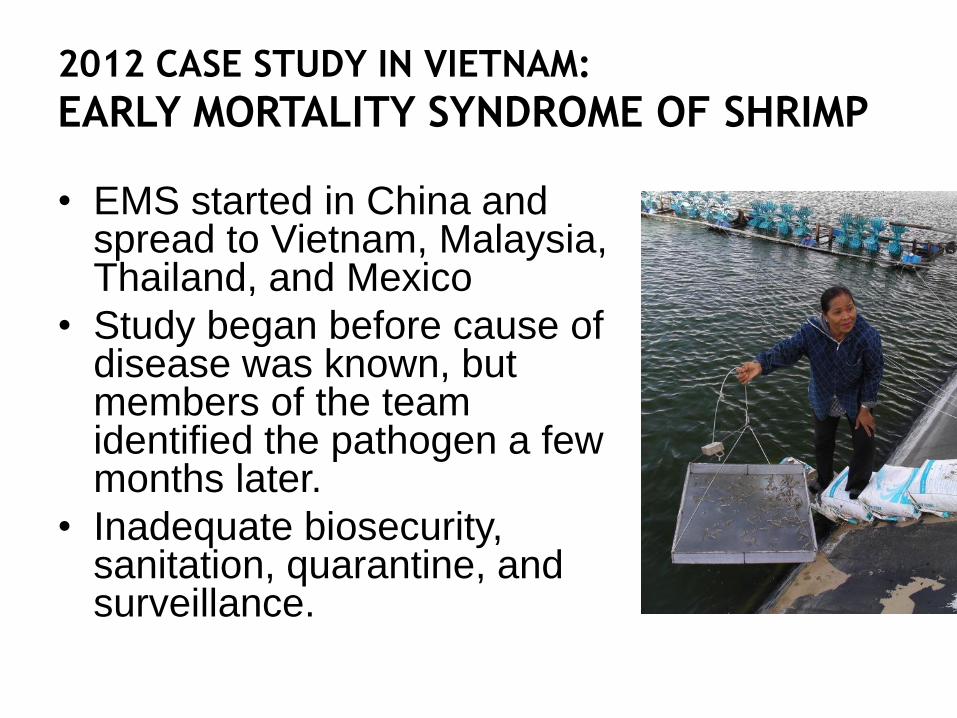
2012 CASE STUDY IN VIETNAM:
EARLY MORTALITY SYNDROME OF SHRIMP
• EMS started in China and spread to Vietnam, Malaysia, Thailand, and Mexico
• Study began before cause of disease was known, but members of the team identified the pathogen a few months later.
• Inadequate biosecurity, sanitation, quarantine, and surveillance.

2013 CASE STUDY IN MOZ AND MAD: WHITE SPOT
VIRUS OF SHRIMP
• Strain identification of the WSSV
pathogen indicated that it originated
from the Middle East.
• Limited surveillance and biosecurity
• Need for cooperation between
Mozambique and Madagascar

TOPICS
1. Our Dilemma
2. Disease Case Studies
3. Shrimp Health Management
– The Past
– The Present – Early Mortality Syndrome
– The Future
4. Conclusions
5. Panel Discussion

THE PAST:
BEGINNING WITH PRIMITIVE SYSTEMS, LOW
YIELDS
– Crude, tidal ponds
– Wild postlarvae
– Minimal control of
stocking density,
predators,
environment,
nutrition, or health
• For centuries, shrimp farming was conducted in a very
primitive manner
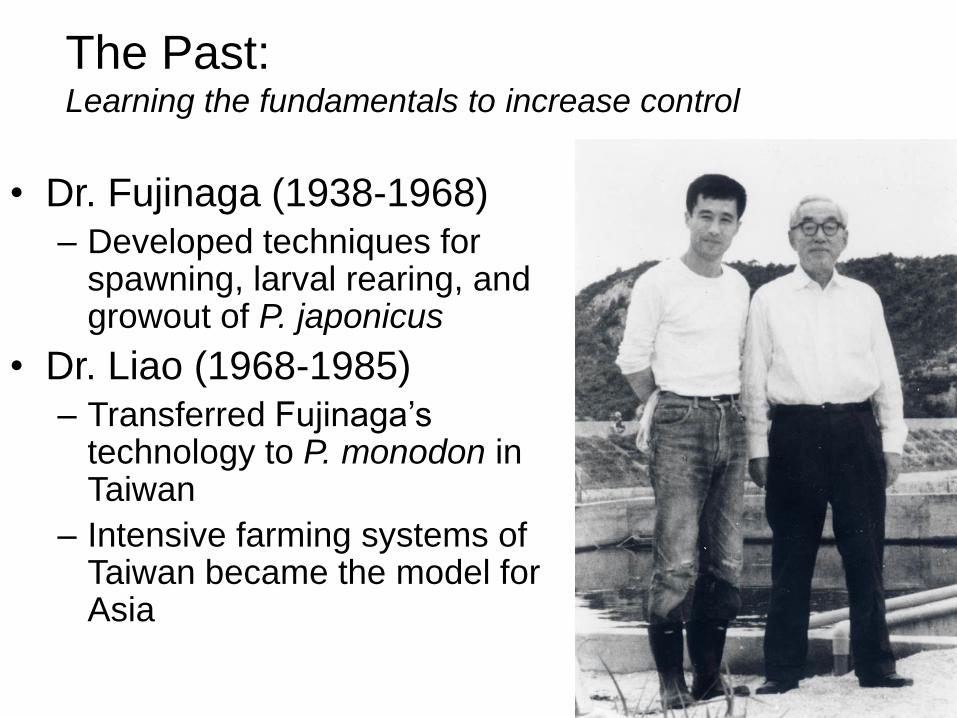
The Past:Learning the fundamentals to increase control
• Dr. Fujinaga (1938-1968)
– Developed techniques for spawning, larval rearing, and growout of P. japonicus
• Dr. Liao (1968-1985)
– Transferred Fujinaga’stechnology to P. monodon in Taiwan
– Intensive farming systems of Taiwan became the model for Asia

TAIWAN IN 1980’S: INTENSIFICATION AND FRAGMENTATION

0,0
0,3
0,5
0,8
1,0Million Mt
RAPID INDUSTRY EXPANSION,
BUT HIGHLY VULNERABLE TO DISEASE

REPEATED DISEASE OUTBREAKS
Year Countries Disease
1982 Ecuador BP
1988 Taiwan YHV
1992 China, pandemic WSSV
1994 Ecuador, pandemic TSV
2002 Thailand, Indonesia MSGV
2004 Brazil, Indonesia IMNV
2006 Belize, Mexico PvNv
2010 China, Vietnam, Malaysia,
Thailand, Mexico
EMS

WSSV EPIDEMIC TRIGGERED ENVIRONMENTAL
ATTACKS.
• WSSV began in China and spread throughout
Asia and Americas.
• Global shrimp production was flat for a decade.
• Critics asserted that shrimp farming is inherently unsustainable (mangrove destruction, pollution, banned chemicals, social issues)
• Supreme Court of India ruled against shrimp farming in 1996.

FORMATION OF GAA
• Founded in 1997
• Gathered facts to refute exaggerations
• Developed Codes of Practice for Responsible Shrimp Farming in 1999
• Developed BAP standards for certification of farms, hatcheries, feed mills, and processing plants
• Great improvements in mangrove conservation, pollution, etc.
• 1.4 mlllion MT now BAP certified.

WSSV EPIDEMIC LED TO
IMPROVED HEALTH MANAGEMENT
• Biosecurity
– Widespread use of PCR testing
– Tightening regulations on movement of
animals
• Farm management
– Reduced water exchange which led to
development of biofloc systems
– Control of disease carriers with disinfectants,
crustacides, and bird netting

THE BREAKTHROUGH:
SPF L. VANNAMEI
• Breeding of Specifc Pathogen Free stocks by Oceanic Institute in Hawaii
• Initial trials successful in Texas, but failed in Ecuador due to Taura Syndrome Virus
• Bred SPF stocks for
resistance to TSV
• Rapidly replaced infected
P. monodon.
• Led to development of
private breeding
companies (e.g., CP,
SIS, Kona Bay).

WSSV EPIDEMIC LED TO INDUSTRY
TRANSFORMATION
AND QUADRUPLING OF PRODUCTION
0,0
0,5
1,0
1,5
2,0
2,5
3,0
3,5
4,0
4,5
1991 1993 1995 1997 1999 2001 2003 2005 2007 2009
Million MT
P. vannamei P. monodon M. rosenbergii Other
WSSV epidemic
Sources: FAO (2013) for 1991-2011; GOAL (2013) for 2012-2015.

THE PRESENT
ANOTHER EPIDEMIC – EARLY MORTALITY SYNDROME
26

SHRIMP PRODUCTION IS DOWN,
BUT THE TIDE IS TURNING
EMS epidemic
0.0
0.6
1.2
1.8
2.4
3.0
3.6
4.2
4.8
Million MT
1995 1996 1997 1998 1999 2000 2001 2002 2003 2004 2005 2006 2007 2008 2009 2010 2011 2012 2013 2014 2015 2016
P. vannamei P. monodon M. rosenbergii Other

SHRIMP AQUACULTURE IN ASIA: 2009 – 2016
MAJOR PRODUCERS
0.0
0.3
0.6
0.9
1.2
1.5
1.8
Million MT
China Thailand Vietnam Indonesia India
2009 2010 2011 2012 2013 2014 2015 2016
Sources: FAO (2014) for 2009-2012; GOAL (2014) for 2013-2016.
M. rosenbergii is not included.
China is expected to recover slightly in 2014; recovery in Thailand
will begin in 2015.
Production increases are expected in all countries in the region by
2016. Thailand will be displaced from second to fifth position .

SHRIMP AQUACULTURE IN ASIA:
2009-2012 VS. 2012-2016
1.60%
6.00% 6.90%
3.00%
37.40%
1.40%
5.20%4.90%
10.00%
5.30%
-1.80%
-14.00%-16%
-8%
0%
8%
16%
24%
32%
40%
China Thailand Vietnam Indonesia India Bangladesh
Average Annual Growth
Rate
2009-2012 2012-2016
Sources: FAO (2014) for 2009-2012; GOAL (2014) for 2013-2016.
M. rosenbergii is not included.

SHRIMP AQUACULTURE IN LATIN AMERICA: 2009 – 2016
MAJOR PRODUCERS
0
40
80
120
160
200
240
280
320
360
400
Thousand MT
Ecuador Mexico Brazil
2009 2010 2011 2012 2013 2014 2015 2016
Mexico heavily impacted by EMS in 2013:
production down by 50%, with partial recovery afterwards.
Brazil expects to reach 100,000 tons by 2016.
Ecuador is ramping up production as output from other
countries falters. Production in 2016 is expected to be 28%
higher than in 2013.
Sources: FAO (2014) for 2009-2012; GOAL (2014) for 2013-2016.
M. rosenbergii is not included.

31
SHRIMP AQUACULTURE IN LATIN AMERICA:
2009-2012 VS. 2012-2016
16.20%
4.40%
11.90%
23.20%
4.00%
0.50%
-7.30%
9.90%
22.70%
-3.40%-3.80%
6.10% 6.00%
3.60%
9.30%9.70%
-10%
-5%
0%
5%
10%
15%
20%
25%
Ecuador Mexico Brazil Honduras Peru Guatemala Nicaragua Venezuela
Average Annual Growth
Rate
2009-2012 2012-2015
Sources: FAO (2014) for 2009-2012; GOAL (2014) for 2013-2016.
M. rosenbergii is not included.

2014 SURVEY ON EMS
IN AFFECTED COUNTRIES
• Expert Committee– Patrick Sorgeloos, Don Lightner, Victoria Alday, Noriaki
Akazawa, Stephen Newman, Loc Tran, James Brock, Bruno Gil, Indrani Karunasagar, Randall Brummett, Huang Jie, Angus Cameron, CV Mojan, Peter van Wyk, George Chamberlain
• Online survey of farms in each affected country– Identify practices associated with successful EMS
management
– Dr. Brendan Cowlan will summarize during the panel
• Followup case studies of selected farms– In-depth audits to validate trends seen in survey

THE EMS EXPERT COMMITTEE TESTED THE
SURVEY BY INTERVIEWING VIETNAMESE FARMERS

WHAT HAVE WE LEARNED?
• Early mortality syndrome
(EMS), or acute
hepatopancreatic necrosis
syndrome (AHPNS), is a
bacterial disease caused
by a strain of Vibrio
parahaemolyticus
• It does not affect humans
34
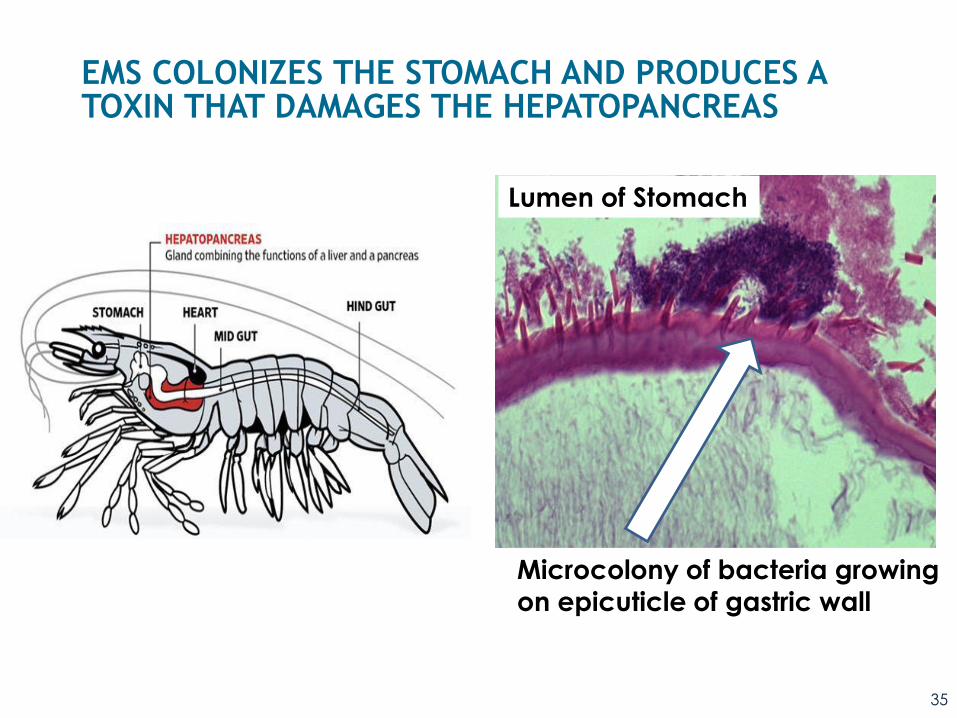
Microcolony of bacteria growing
on epicuticle of gastric wall
Lumen of Stomach
EMS COLONIZES THE STOMACH AND PRODUCES A TOXIN THAT DAMAGES THE HEPATOPANCREAS
35

HOW IS IT TRANSMITTED?
• Vertically
– Can be carried in broodstock and larvae
– Live feeds for shrimp reproduction, esp. polychaete worms are a major concern
• Horizontally
– Cannibalism, consumption of carriers, fecal/oral, and water.
36 Cannibalism
Bacterial plaque on egg

WHY IS THE EMS PATHOGEN DIFFERENT THAN A
VIRUS?
• Unlike viruses, it does not require a host organism to replicate
• Once established in the environment. It colonizes quickly
• It can be displaced by a mature microbial community
37
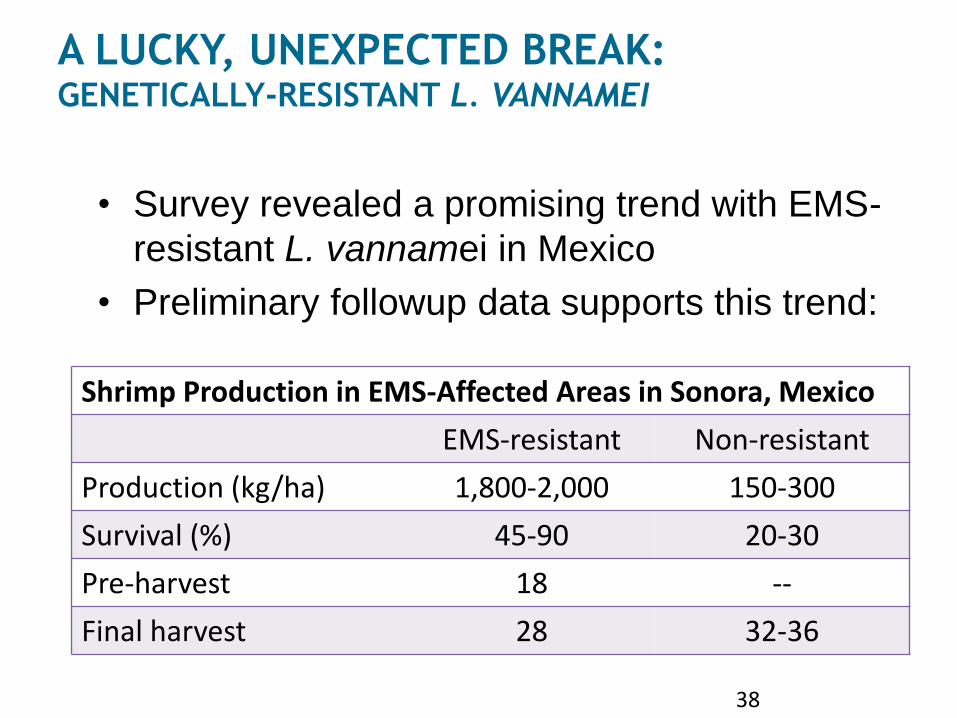
A LUCKY, UNEXPECTED BREAK:GENETICALLY-RESISTANT L. VANNAMEI
• Survey revealed a promising trend with EMS-
resistant L. vannamei in Mexico
• Preliminary followup data supports this trend:
38
Shrimp Production in EMS-Affected Areas in Sonora, Mexico
EMS-resistant Non-resistant
Production (kg/ha) 1,800-2,000 150-300
Survival (%) 45-90 20-30
Pre-harvest 18 --
Final harvest 28 32-36

PUTTING IT ALL TOGETHER
• Diagnostics– Improved PCR tests
• Breeding – Genetic resistance to EMS
• Hatchery – Avoid infected foods– Improve sanitation
• Farm– Manage microbial
community• Feed
– Additives to improve EMS resistance

WHAT’S NEXT?
• We are learning to manage EMS, but already
other new diseases are emerging
– Microsporidean parasite
– Covert Nodavirus
40

STUDY OF 200 SHRIMP PONDS IN THAILAND
41
AHPND
No AHPND
but
bacterial
lesions
Early
mortality
but No HP
lesions
Collapsed HP
epithelium Normal HP
03, 07, 11, 12,
16, 20, 32,
34,40, 45, 47,
50, 52, 54, 55,
58, 73, 74, 82,
83, 84, 87,
90,91, 92, 93,
105, 110, 112,
116, 119, 122,
126, 131, 144,
150
04, 05, 21, 24,
44, 51, 69, 75,
79, 86, 88, 96,
99, 101, 117,
130, 133, 136,
139, 143
57, 70, 98, 100,
111
02, 15, 17, 25, 26,
29, 30, 37, 38, 46,
48, 49, 53, 64, 65,
76, 80, 81, 95, 97,
104, 109, 113, 114,
115, 123, 125, 127,
128, 134, 135
01, 06, 08, 09, 10, 13, 14,
18, 19, 22, 23, 27, 28, 31,
33, 35, 36, 39, 41, 42, 43,
56, 59, 60, 61, 62, 63, 66,
67, 68, 71, 72, 77, 78, 85,
89, 94, 102, 103, 106, 107,
108, 118, 120, 121, 124,
129, 132, 137, 138, 140,
141, 142, 145, 148, 149
36/148
(24%)
20/148
(14%)
5/148
(3%)
31/148
(21%)
56/148
(38%)
Infected with the microsproidian E. hepatopenaei (EHP) 72/148 = 49%
Mortality <35 days (study definition of EMS = 21/148 = 14%)
Infected with white spot syndrome virus (WSSV) = 8/148 = 5%
Covert mortality nodavirus (CMNV) = 64/148 = 43%
Specimens 146 and 147 un-readable (poor fixation)
THE FUTURE
• Our journey
– As shrimp farming matures, it must
continue to develop improved controls that
help reduce disease risk, increase
production, and improve sustainability.
42
0
10
20
30
40
50
60
70
80
90
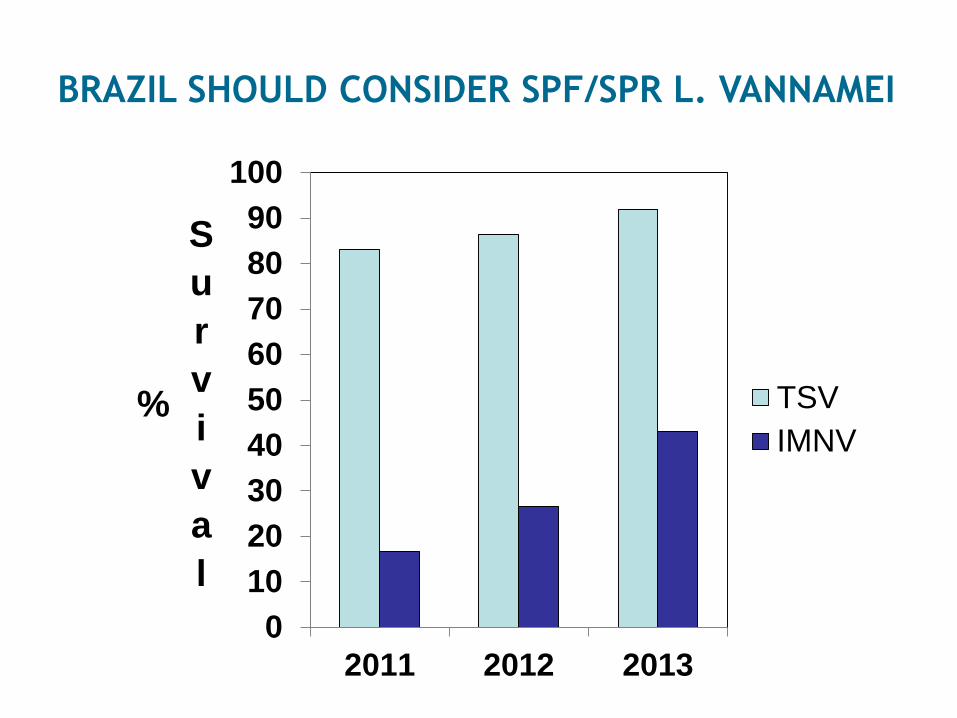
100
2011 2012 2013
%
S
u
r
v
i
v
a
l
TSV
IMNV
BRAZIL SHOULD CONSIDER SPF/SPR L. VANNAMEI
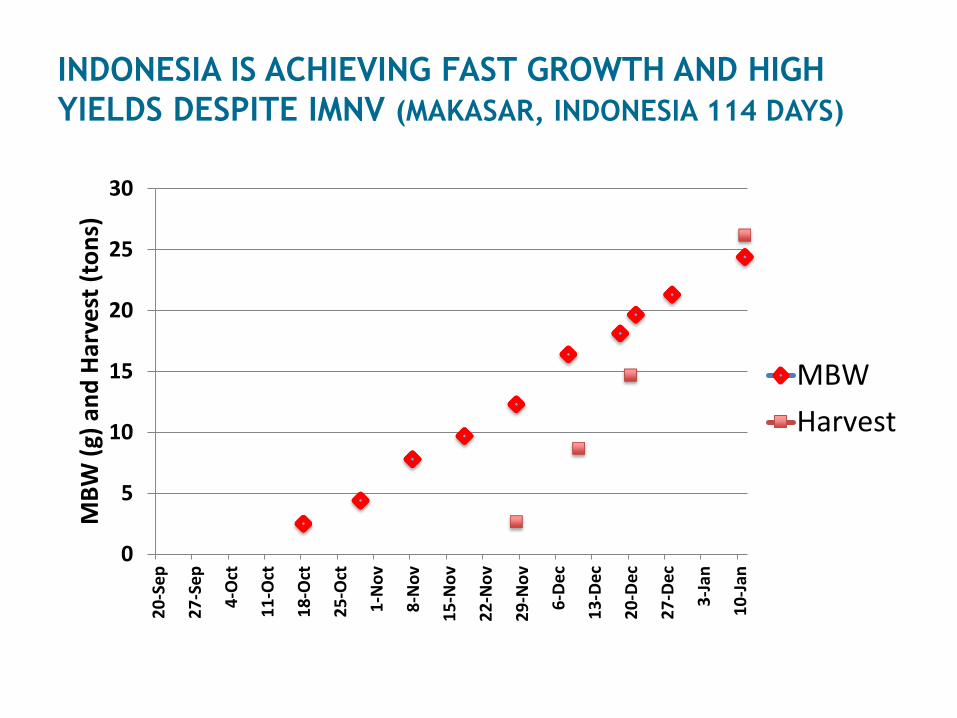
INDONESIA IS ACHIEVING FAST GROWTH AND HIGH
YIELDS DESPITE IMNV (MAKASAR, INDONESIA 114 DAYS)
0
5
10
15
20
25
30
20
-Se
p
27
-Se
p
4-O
ct
11
-Oct
18
-Oct
25
-Oct
1-N
ov
8-N
ov
15
-No
v
22
-No
v
29
-No
v
6-D
ec
13
-Dec
20
-Dec
27
-Dec
3-J
an
10
-Jan
MB
W (
g) a
nd
Har
vest
(to
ns)
MBW
Harvest

SPF STOCKS WITH RESISTANCE TO WSSV ARE
ALSO AVAILABLE

MARKER-ASSISTED BREEDING
• Molecular Markers (SNPs)
used for trait identification
in mainstream agriculture.
• In Hawaii, soy farmers are
funding research on
markers for dietary soy
tolerance in shrimp
0
5
10
15
20
Fishmeal Soybean meal
Wei
ght

DEEP INTENSIVE PONDS
• Deep ponds (3-5 m) used in Vietnam for Pangasius now being built for shrimp in China
• Can achieve yields of 30-50 mt/ha/cycle.
Pangasius

MORE EFFICIENT FEEDING
• Salmon farms achieve the lowest FCRs in aquaculture
• Centralized computer controlled feeding systems being used in shrimp ponds in Brunei to drive down FCR
Salmon farming

INTEGRATED MULTI-TROPHIC AQUACULTURE
• Mussels feed on algae and organic waste from salmon farms in Chile
• Clams feed on algae and organic waste in shrimp ponds in Hawaii and produce a valuable secondary crop.
Salmon/mussel/kelp farming

ZONE MANAGEMENT STANDARD
• Zone management standards are under development as BAP 5th star• Proximity among farms• Veterinary services• Quarantine• Management practices• Information sharing

0
1
2
3
4
5
6
7
8
9
Mil
lio
n M
etr
ic T
on
nes
OUR EXPECTION: SHRIMP FARMING WILL
DOUBLE IN THE NEXT DECADE
51
*
CONCLUSIONS
• Seafood demand is strong due to rising middle class in Asia and aquaculture is the only way to meet this increasing demand
• Disease is a key factor limiting industry growth, but the industry is recovering from EMS.
• Brazil is in a strong position to implement improving technology and expand production to meet the growing global shrimp demand.
• Major opportunities: – Utilize SPF L. vannamei lines that are genetically
resistant to IMNV and WSSV
– Implement biosecure intensive systems