global research and consulting econometric advisors cbre econometric advisors client conference 2012...
TRANSCRIPT

Global Research and ConsultingEconometric Advisors
CBRE Econometric Advisors
Client Conference 2012 October 2, 2012
Global Research and ConsultingEconometric Advisors
CBRE Econometric Advisors Client Conference 2012
October 2, 2012 Seaport Hotel, Boston, MA
How Can The U.S. Grow?
Session 1 | U.S. Economic Outlook
Presented by:Jon Southard, Managing Director, Director of ForecastingWilliam Wheaton, Senior Consultant
CBRE | Page 2Global Research and Consulting ● Econometric Advisors
CBRE Econometric Advisors Client Conference 2012
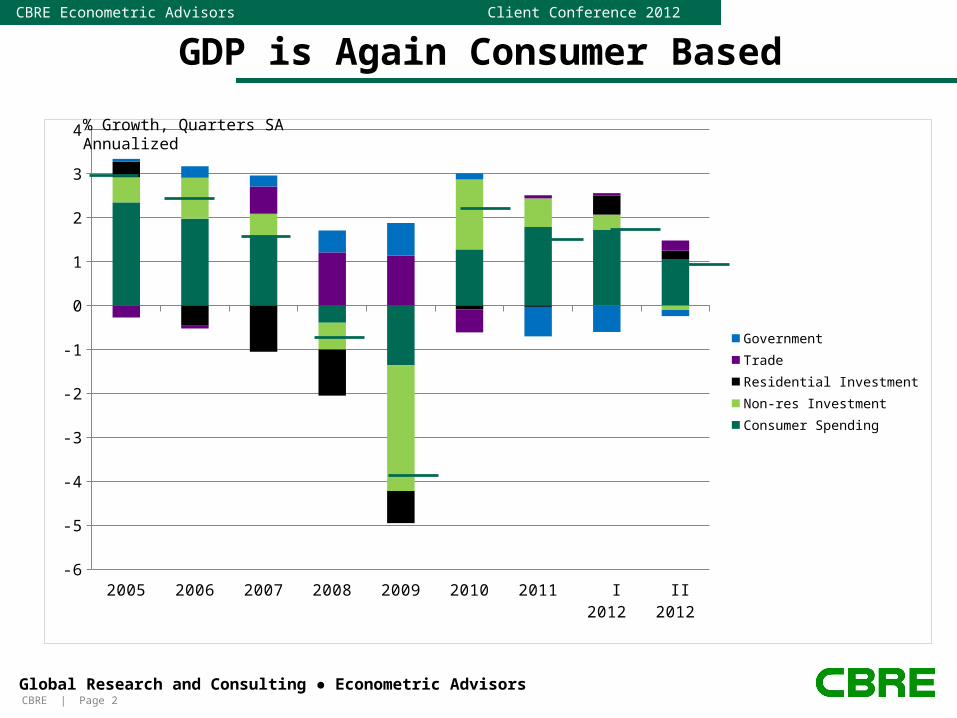
GDP is Again Consumer Based
2005 2006 2007 2008 2009 2010 2011 I 2012 II 2012-6
-5
-4
-3
-2
-1
0
1
2
3
4
Government
Trade
Residential Investment
Non-res Investment
Consumer Spending
% Growth, Quarters SA Annualized
CBRE | Page 3Global Research and Consulting ● Econometric Advisors
CBRE Econometric Advisors Client Conference 2012
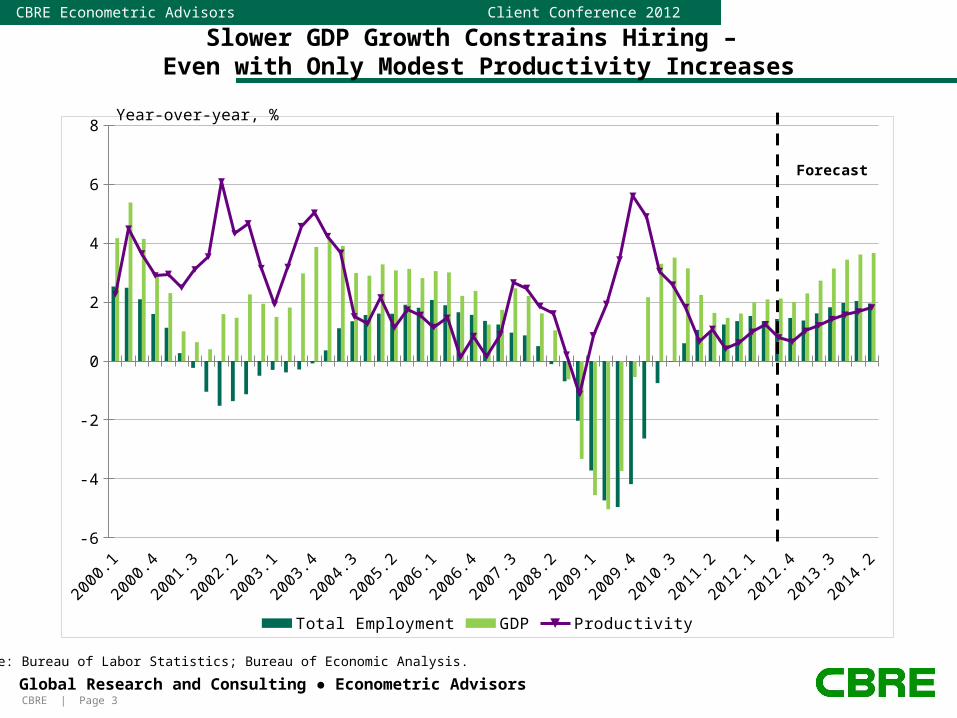
Slower GDP Growth Constrains Hiring – Even with Only Modest Productivity Increases
2000
.1
2000
.3
2001
.1
2001
.3
2002
.1
2002
.3
2003
.1
2003
.3
2004
.1
2004
.3
2005
.1
2005
.3
2006
.1
2006
.3
2007
.1
2007
.3
2008
.1
2008
.3
2009
.1
2009
.3
2010
.1
2010
.3
2011
.1
2011
.3
2012
.1
2012
.3
2013
.1
2013
.3
2014
.1-6
-4
-2
0
2
4
6
8
Total Employment GDP Productivity
Forecast
Source: Bureau of Labor Statistics; Bureau of Economic Analysis.
Year-over-year, %
CBRE | Page 4Global Research and Consulting ● Econometric Advisors
CBRE Econometric Advisors Client Conference 2012
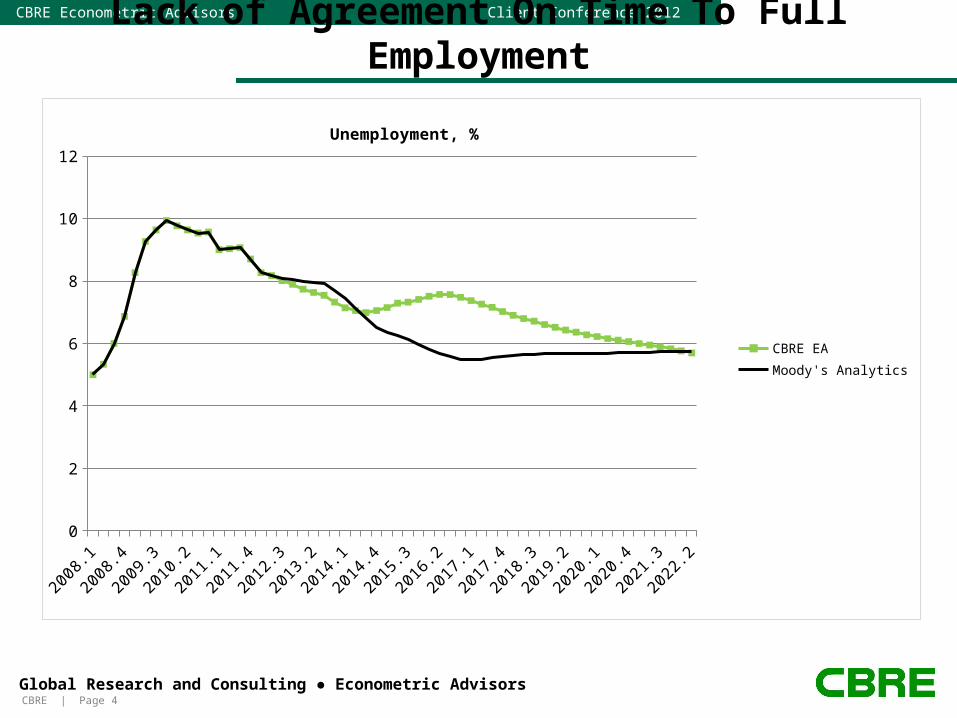
Lack of Agreement On Time To Full Employment
2008
.1
2008
.4
2009
.3
2010
.2
2011
.1
2011
.4
2012
.3
2013
.2
2014
.1
2014
.4
2015
.3
2016
.2
2017
.1
2017
.4
2018
.3
2019
.2
2020
.1
2020
.4
2021
.3
2022
.20
2
4
6
8
10
12
Unemployment, %
CBRE EA
Moody's Analytics
CBRE | Page 5Global Research and Consulting ● Econometric Advisors
CBRE Econometric Advisors Client Conference 2012
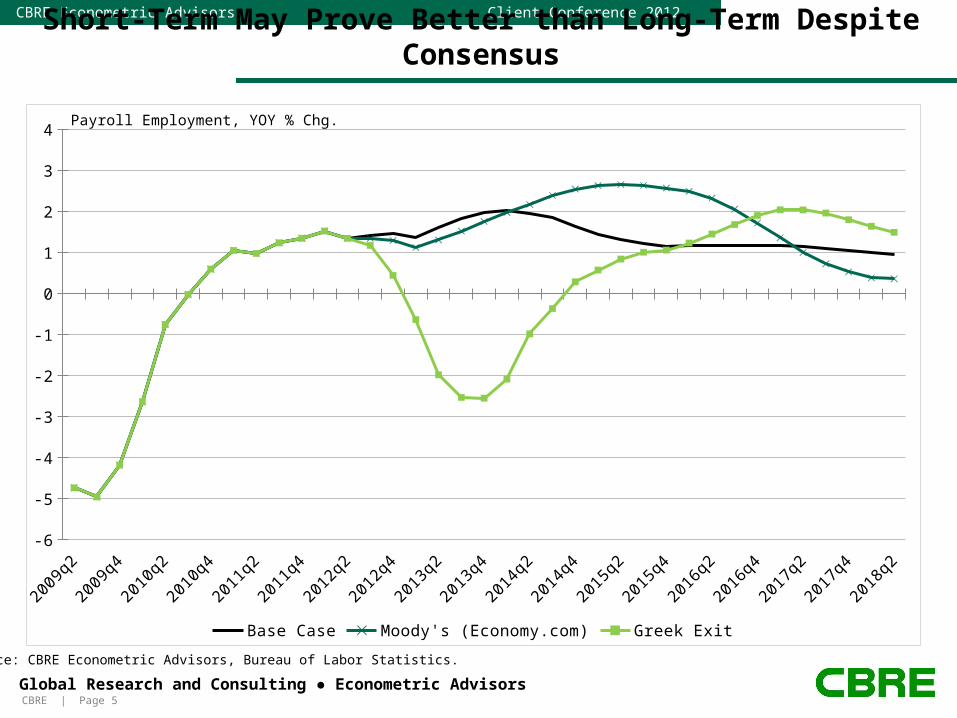
Short-Term May Prove Better than Long-Term Despite Consensus
2009
q2
2009
q4
2010
q2
2010
q4
2011
q2
2011
q4
2012
q2
2012
q4
2013
q2
2013
q4
2014
q2
2014
q4
2015
q2
2015
q4
2016
q2
2016
q4
2017
q2
2017
q4
2018
q2-6
-5
-4
-3
-2
-1
0
1
2
3
4
Base Case Moody's (Economy.com) Greek Exit
Payroll Employment, YOY % Chg.
Source: CBRE Econometric Advisors, Bureau of Labor Statistics.

CBRE | Page 6Global Research and Consulting ● Econometric Advisors
CBRE Econometric Advisors Client Conference 2012
Questions to be Answered:
Where will productivity go in the short term?
What are the mid-term term prospects for return to full employment?
What GDP sectors can contribute to future growth: consumption, housing, trade,..?
Are there different longer-term headwinds this cycle compared to the recent past? What are they and how strong?
CBRE | Page 7Global Research and Consulting ● Econometric Advisors
CBRE Econometric Advisors Client Conference 2012
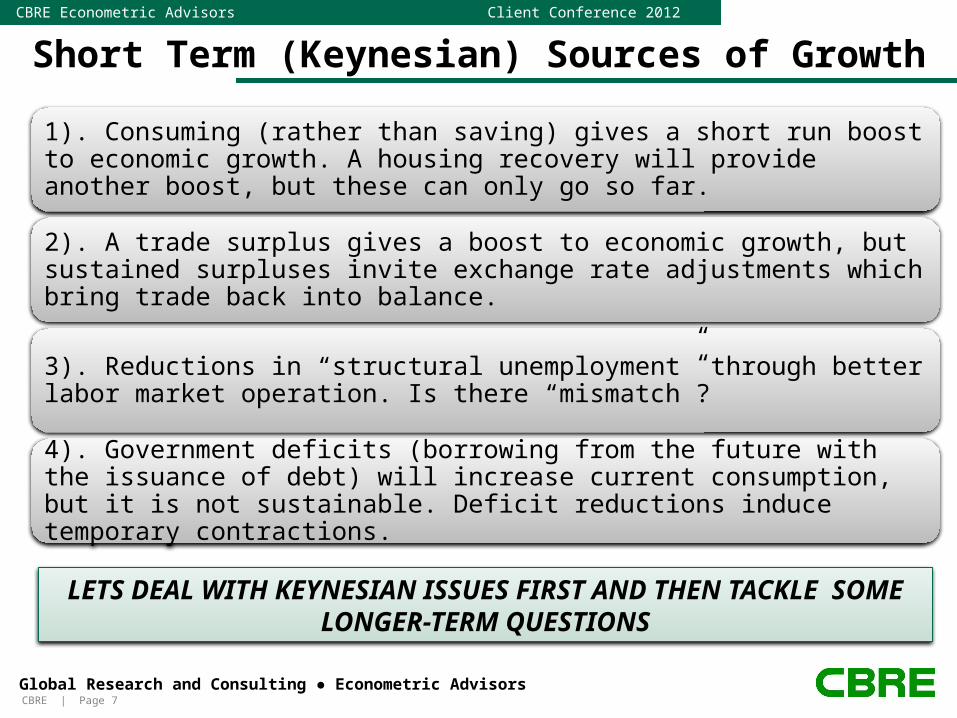
Short Term (Keynesian) Sources of Growth
1). Consuming (rather than saving) gives a short run boost to economic growth. A housing recovery will provide another boost, but these can only go so far.
2). A trade surplus gives a boost to economic growth, but sustained surpluses invite exchange rate adjustments which bring trade back into balance.
3). Reductions in “structural unemployment” through better labor market operation. Is there “mismatch”?
4). Government deficits (borrowing from the future with the issuance of debt) will increase current consumption, but it is not sustainable. Deficit reductions induce temporary contractions.
LETS DEAL WITH KEYNESIAN ISSUES FIRST AND THEN TACKLE SOME LONGER-TERM QUESTIONS
CBRE | Page 8Global Research and Consulting ● Econometric Advisors
CBRE Econometric Advisors Client Conference 2012
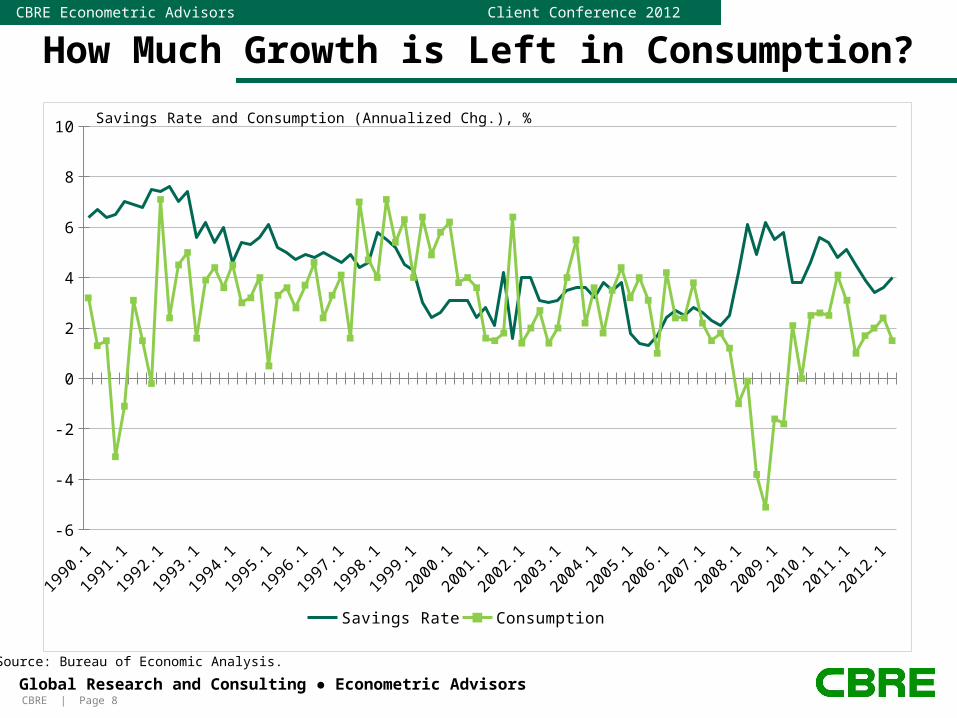
How Much Growth is Left in Consumption?
1990
.1
1990
.4
1991
.3
1992
.2
1993
.1
1993
.4
1994
.3
1995
.2
1996
.1
1996
.4
1997
.3
1998
.2
1999
.1
1999
.4
2000
.3
2001
.2
2002
.1
2002
.4
2003
.3
2004
.2
2005
.1
2005
.4
2006
.3
2007
.2
2008
.1
2008
.4
2009
.3
2010
.2
2011
.1
2011
.4-6
-4
-2
0
2
4
6
8
10
Savings Rate Consumption
Savings Rate and Consumption (Annualized Chg.), %
Source: Bureau of Economic Analysis.
CBRE | Page 9Global Research and Consulting ● Econometric Advisors
CBRE Econometric Advisors Client Conference 2012
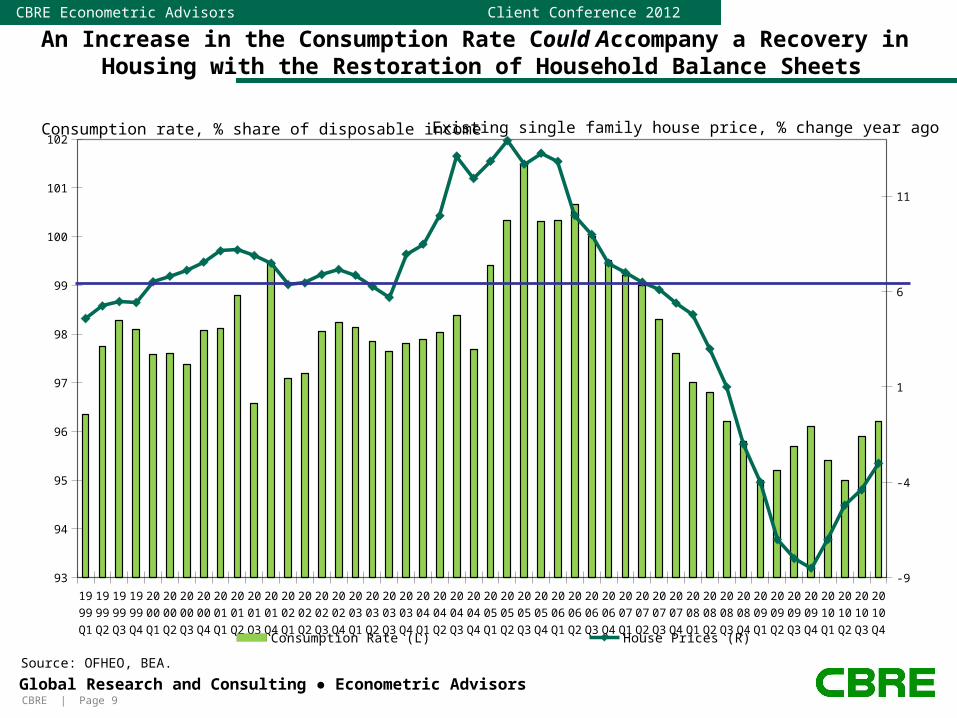
An Increase in the Consumption Rate Could Accompany a Recovery in Housing with the Restoration of Household Balance Sheets
1999Q1
1999Q2
1999Q3
1999Q4
2000Q1
2000Q2
2000Q3
2000Q4
2001Q1
2001Q2
2001Q3
2001Q4
2002Q1
2002Q2
2002Q3
2002Q4
2003Q1
2003Q2
2003Q3
2003Q4
2004Q1
2004Q2
2004Q3
2004Q4
2005Q1
2005Q2
2005Q3
2005Q4
2006Q1
2006Q2
2006Q3
2006Q4
2007Q1
2007Q2
2007Q3
2007Q4
2008Q1
2008Q2
2008Q3
2008Q4
2009Q1
2009Q2
2009Q3
2009Q4
2010Q1
2010Q2
2010Q3
2010Q4
93
94
95
96
97
98
99
100
101
102
-9
-4
1
6
11
Consumption Rate (L) House Prices (R)
Source: OFHEO, BEA.
Consumption rate, % share of disposable income Existing single family house price, % change year ago
CBRE | Page 10Global Research and Consulting ● Econometric Advisors
CBRE Econometric Advisors Client Conference 2012
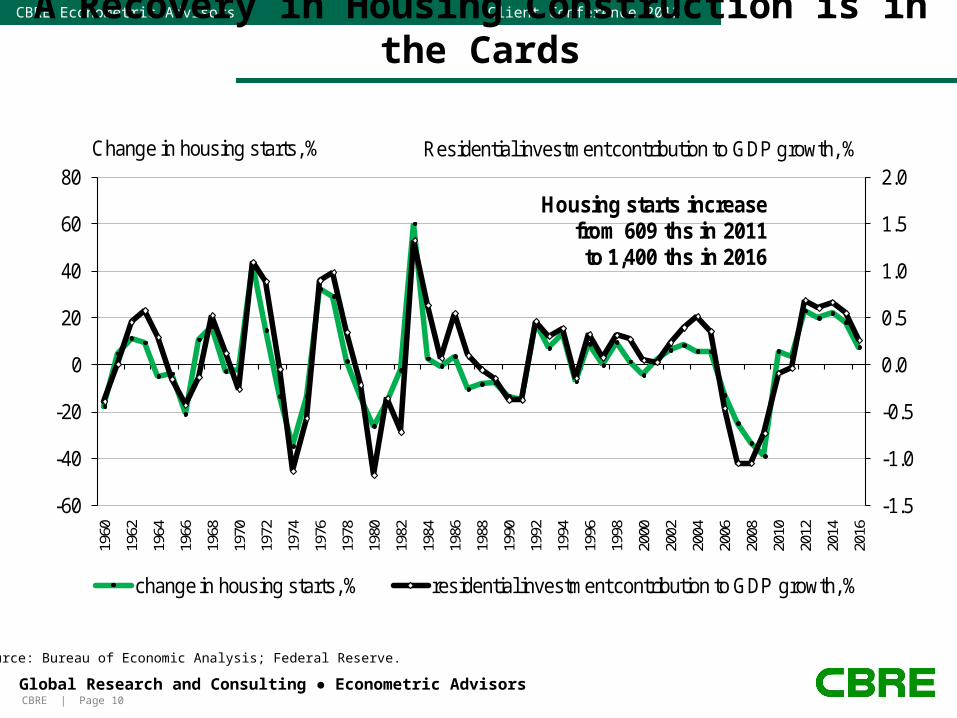
A Recovery in Housing Construction is in the Cards
-1.5
-1.0
-0.5
0.0
0.5
1.0
1.5
2.0
-60
-40
-20
0
20
40
60
80
1960
1962
1964
1966
1968
1970
1972
1974
1976
1978
1980
1982
1984
1986
1988
1990
1992
1994
1996
1998
2000
2002
2004
2006
2008
2010
2012
2014
2016
change in housing starts, % residential investment contribution to GDP growth, %
Change in housing starts, % Residential investment contribution to GDP growth, %
Housing starts increasefrom 609 ths in 2011to 1,400 ths in 2016
Source: Bureau of Economic Analysis; Federal Reserve.
CBRE | Page 11Global Research and Consulting ● Econometric Advisors
CBRE Econometric Advisors Client Conference 2012
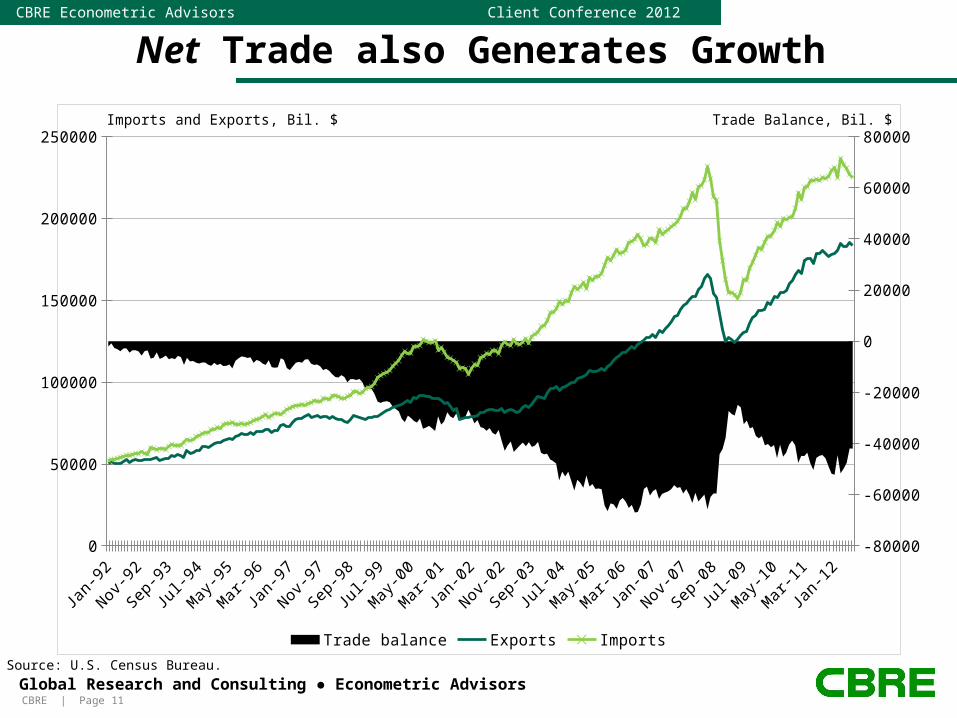
Net Trade also Generates Growth
0
50000
100000
150000
200000
250000
-80000
-60000
-40000
-20000
0
20000
40000
60000
80000
Trade balance Exports Imports
Imports and Exports, Bil. $ Trade Balance, Bil. $
Source: U.S. Census Bureau.
CBRE | Page 12Global Research and Consulting ● Econometric Advisors
CBRE Econometric Advisors Client Conference 2012
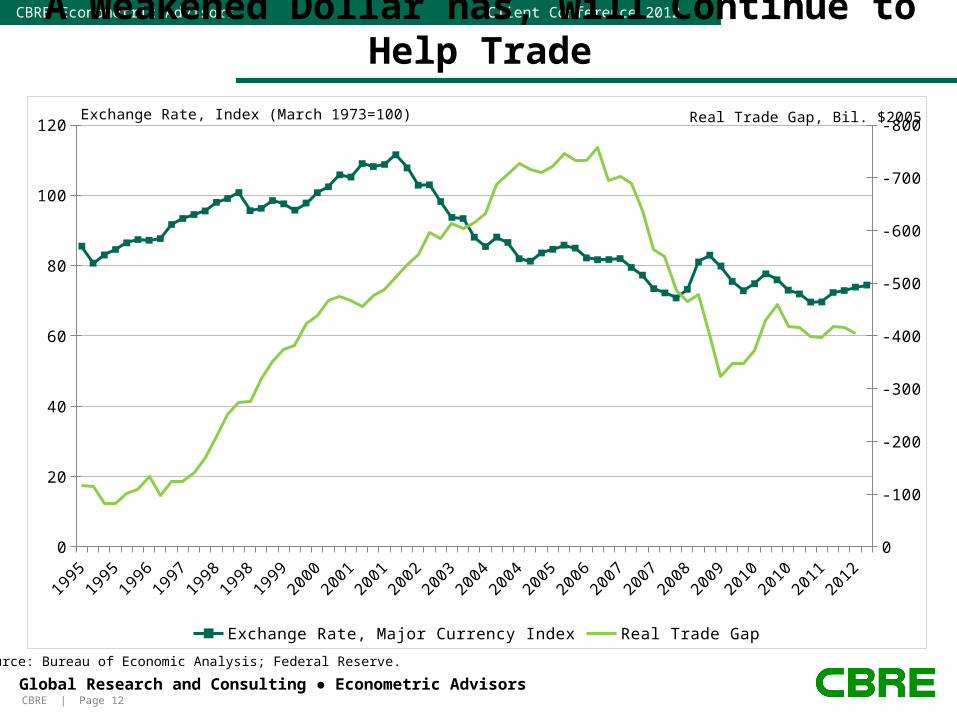
A Weakened Dollar has, will Continue to Help Trade
1995
1995
1996
1996
1997
1997
1998
1999
1999
2000
2000
2001
2002
2002
2003
2003
2004
2004
2005
2006
2006
2007
2007
2008
2009
2009
2010
2010
2011
2011
2012
0
20
40
60
80
100
120 -800
-700
-600
-500
-400
-300
-200
-100
0
Exchange Rate, Major Currency Index Real Trade Gap
Exchange Rate, Index (March 1973=100) Real Trade Gap, Bil. $2005
Source: Bureau of Economic Analysis; Federal Reserve.
CBRE | Page 13Global Research and Consulting ● Econometric Advisors
CBRE Econometric Advisors Client Conference 2012
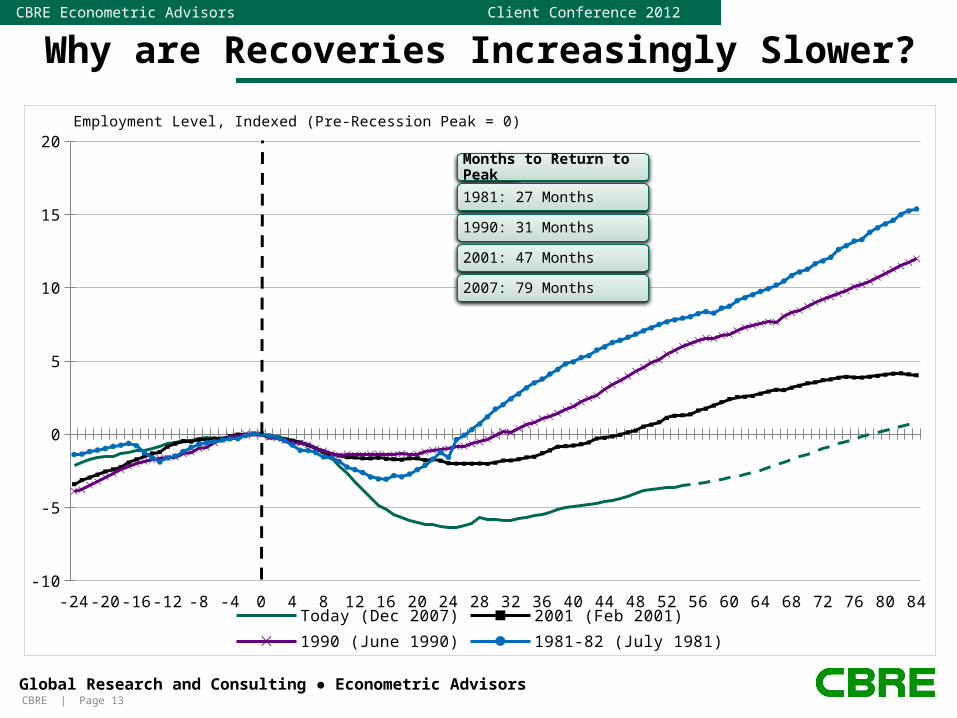
Why are Recoveries Increasingly Slower?
-24-21-18-15-12 -9 -6 -3 0 3 6 9 12 15 18 21 24 27 30 33 36 39 42 45 48 51 54 57 60 63 66 69 72 75 78 81 84-10
-5
0
5
10
15
20
Today (Dec 2007) 2001 (Feb 2001) 1990 (June 1990) 1981-82 (July 1981)
Employment Level, Indexed (Pre-Recession Peak = 0)
Months to Return to Peak
1981: 27 Months
1990: 31 Months
2001: 47 Months
2007: 79 Months

CBRE | Page 14Global Research and Consulting ● Econometric Advisors
CBRE Econometric Advisors Client Conference 2012
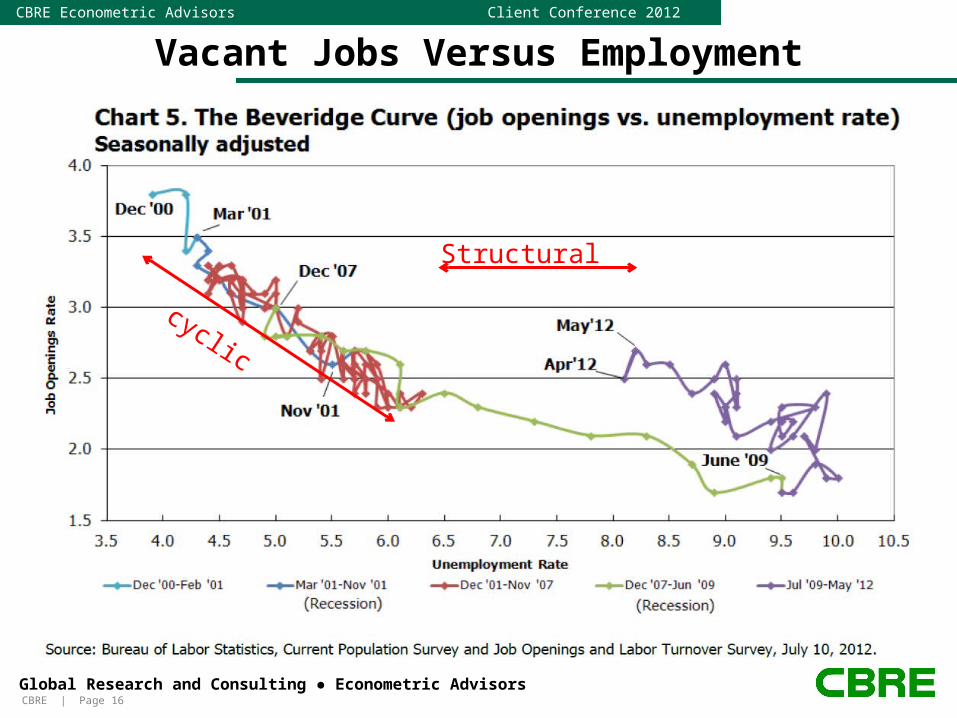
Is this also Caused by a Skill Mismatch, and also a Geographic Mismatch?
Perhaps firms cannot find candidates with suitable skills and unemployed workers have old skills that employers are not interested in. • If true, could explain persistent unemployment despite higher job
vacancy rate• Economies always have some degree of mismatch, but some believe
the extent of this mismatch has grown considerably• Housing market hold back workers from moving
Why we care. Re-training, selective immigration, fixing underwater houses, better labor market IT platforms could all help.
CBRE | Page 15Global Research and Consulting ● Econometric Advisors
CBRE Econometric Advisors Client Conference 2012
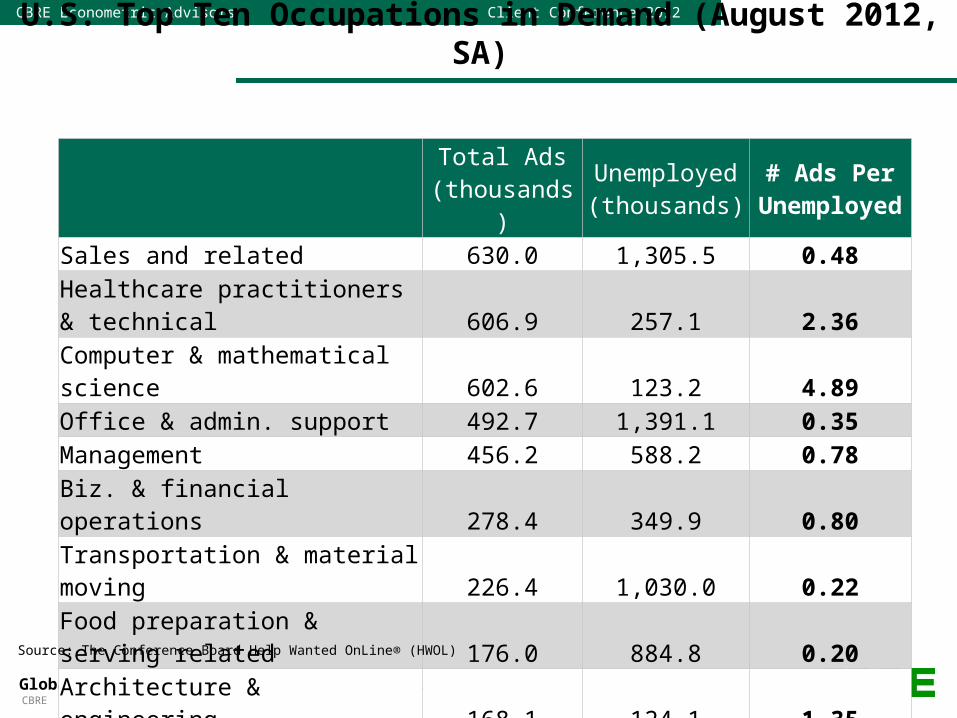
U.S. Top Ten Occupations in Demand (August 2012, SA)
Total Ads (thousands)
Unemployed (thousands)
# Ads Per Unemploye
dSales and related 630.0 1,305.5 0.48Healthcare practitioners & technical 606.9 257.1 2.36Computer & mathematical science 602.6 123.2 4.89Office & admin. support 492.7 1,391.1 0.35Management 456.2 588.2 0.78Biz. & financial operations 278.4 349.9 0.80Transportation & material moving 226.4 1,030.0 0.22Food preparation & serving related 176.0 884.8 0.20Architecture & engineering 168.1 124.1 1.35Installation, maintenance, & repair 162.2 325.4 0.50Source: The Conference Board Help Wanted OnLine® (HWOL)
CBRE | Page 16Global Research and Consulting ● Econometric Advisors
CBRE Econometric Advisors Client Conference 2012
Vacant Jobs Versus Employment
Structural
cyclic
CBRE | Page 17Global Research and Consulting ● Econometric Advisors
CBRE Econometric Advisors Client Conference 2012
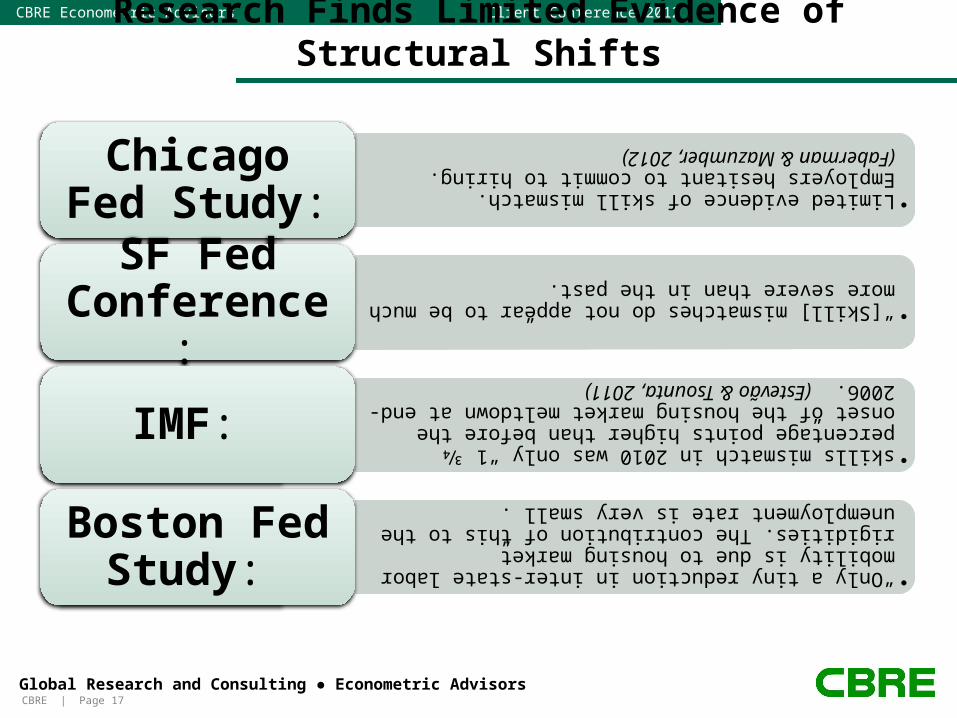
Research Finds Limited Evidence of Structural Shifts
•Limited evidence of skill mismatch. Employers hesitant to commit to hiring. (Faberman & Mazumber, 2012)
Chicago Fed Study:
•“[Skill] mismatches do not appear to be much more severe than in the past.”
SF Fed Conference:
•skills mismatch in 2010 was only “1 3⁄4 percentage points higher than before the onset of the housing market meltdown at end-2006.” (Estevão & Tsounta, 2011)
IMF:
•“Only a tiny reduction in inter-state labor mobility is due to housing market rigidities. The contribution of this to the unemployment rate is very small”.
Boston Fed Study:
CBRE | Page 18Global Research and Consulting ● Econometric Advisors
CBRE Econometric Advisors Client Conference 2012
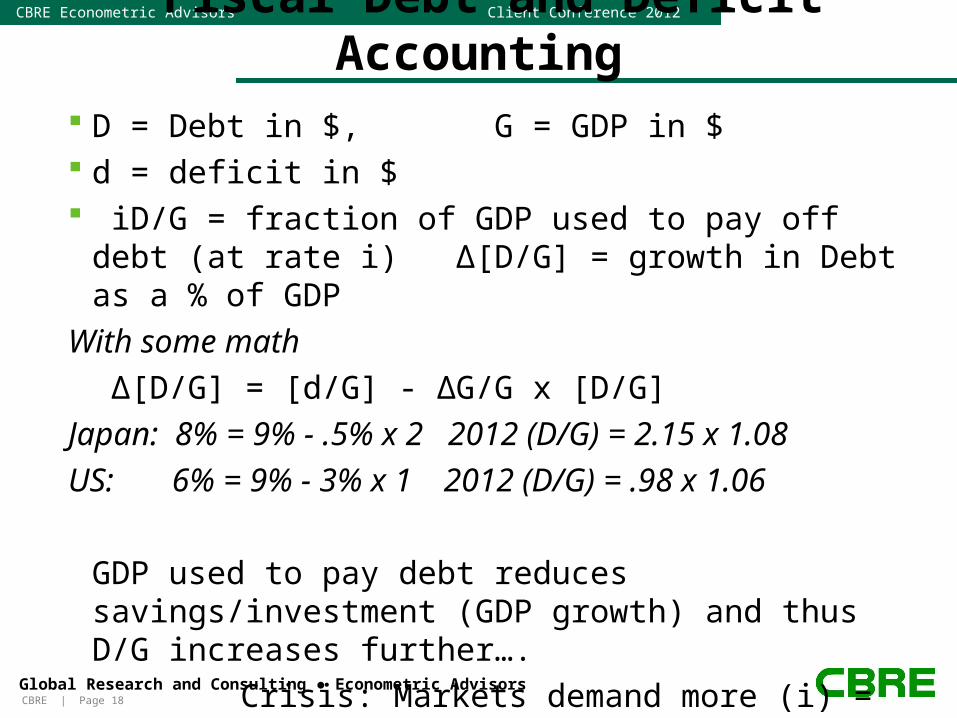
Fiscal Debt and Deficit Accounting D = Debt in $, G = GDP in $ d = deficit in $ iD/G = fraction of GDP used to pay off debt (at rate i)
∆[D/G] = growth in Debt as a % of GDP
With some math
∆[D/G] = [d/G] - ∆G/G x [D/G]
Japan: 8% = 9% - .5% x 2 2012 (D/G) = 2.15 x 1.08
US: 6% = 9% - 3% x 1 2012 (D/G) = .98 x 1.06
GDP used to pay debt reduces savings/investment (GDP growth) and thus D/G increases further….
Crisis: Markets demand more (i) = makes it worse
CBRE | Page 19Global Research and Consulting ● Econometric Advisors
CBRE Econometric Advisors Client Conference 2012
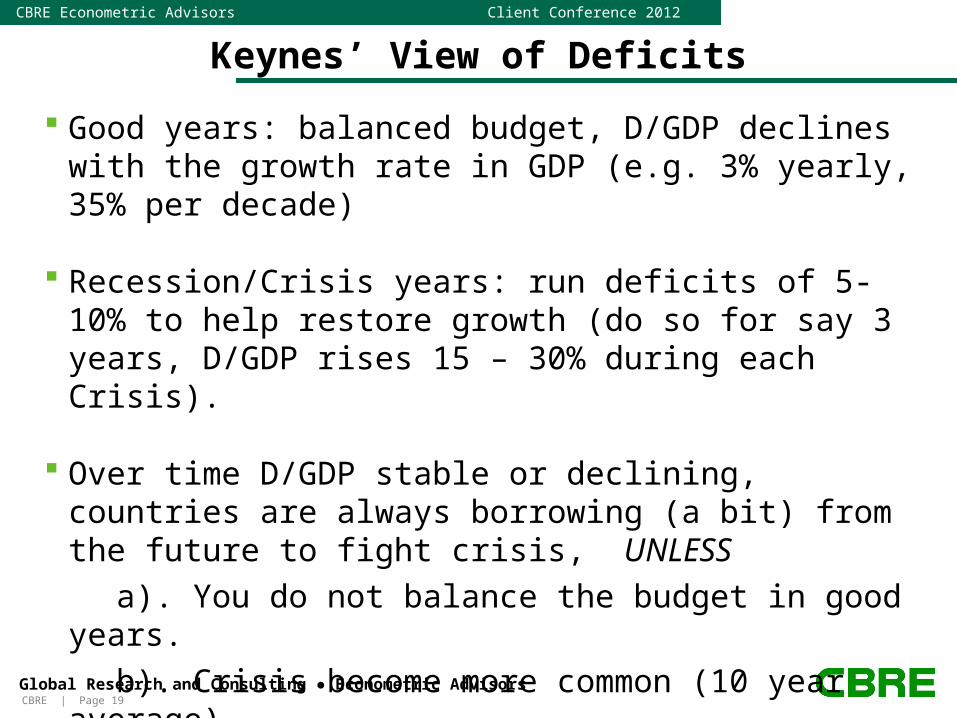
Keynes’ View of Deficits
Good years: balanced budget, D/GDP declines with the growth rate in GDP (e.g. 3% yearly, 35% per decade)
Recession/Crisis years: run deficits of 5-10% to help restore growth (do so for say 3 years, D/GDP rises 15 – 30% during each Crisis).
Over time D/GDP stable or declining, countries are always borrowing (a bit) from the future to fight crisis, UNLESS
a). You do not balance the budget in good years.
b). Crisis become more common (10 year average)
c). GDP grows more slowly.
d). Your initial D/GDP is (too) high (e.g. >1)
CBRE | Page 20Global Research and Consulting ● Econometric Advisors
CBRE Econometric Advisors Client Conference 2012
The Twin Impacts of Deficit Reductions
Raise taxes by 4 Trillion: leads to a large negative “Keynesian” shock to output demand as money is siphoned from the private sector to pay off debt government debt.
In addition high tax rates can lower longer-term incentives for individuals to work/save, for corporations to invest = reduced productivity and slower GDP growth.
Cut public spending by $4 trillion: leads to an equally large negative “Keynesian” shock to output demand. Entitlements are just another form of consumption.
In addition to being consumption, some government expenditure has longer-term positive productivity effects: schooling, infrastructure, R+D…
BALANCE: how do tax disincentives compare with lost productivity from lower public expenditure?

CBRE | Page 21Global Research and Consulting ● Econometric Advisors
CBRE Econometric Advisors Client Conference 2012
Bowles-Simpson Plan Components
Reduce Government Expenditures• Cut Discretionary Spending: infrastructure, defense, schools
(10 – 20%). $464B over 4 years, $1.661T over 9 years• Cut Non-Discretionary Spending: SS, Health, Welfare only (2-
4%). $134B over 4 years, $556B over 9 years
Cutting Discretionary spending may harm productivity the most and B-S does NOT deal with long term Heath care and retirement reform.
CBRE | Page 22Global Research and Consulting ● Econometric Advisors
CBRE Econometric Advisors Client Conference 2012
Bowles-Simpson Plan Components
Increase Taxes• Corporate Income
• Eliminate all tax expenditures i.e. tax breaks• Replace current rates (35% top bracket) with one 28%
bracket• Personal Income
• Itemized deductions, Mortgage, Local taxes phased out • From 2011 high bracket of 39.6% to 28% maximum• Capital gains and dividends taxed at ordinary income rates
2012-2015 revenue: $174B, 2016-2020 revenue:
$820B
“Revenue with Reform”: a sound idea
CBRE | Page 23Global Research and Consulting ● Econometric Advisors
CBRE Econometric Advisors Client Conference 2012
How Economies Grow in the Longer Term
Population growth increases GDP, but not GDP per capita which is real prosperity.
Workers generate GDP, retirees receive some form of transfer from them. • More workers less retirees = higher GDP per capita. • More retirees and less workers = lower GDP per capita. • Demographic dividend from a young population and Demographic
penalty from an older population eventually evens, but only in the long run.
• Hence Aging is a big drag and will reduce economic growth (next session)
CBRE | Page 24Global Research and Consulting ● Econometric Advisors
CBRE Econometric Advisors Client Conference 2012
Long Term Sources of Growth (continued)
Solow: saving eventually generates investment which increases Capital/Worker = growth in wages, prosperity.
• capital deepening requires sacrificing current consumption for growth which enables higher future consumption. The U.S. does not save.
Capital deepening explains only ½ or less of actual increases in productivity over time or across countries. The rest is attributed to knowledge, innovation, and “Industrial revolutions”.
Robert Gordon suggests major long-term variation in productivity growth due mainly to “Industrial Revolutions”. Can the IT revolution save us?
CBRE | Page 25Global Research and Consulting ● Econometric Advisors
CBRE Econometric Advisors Client Conference 2012
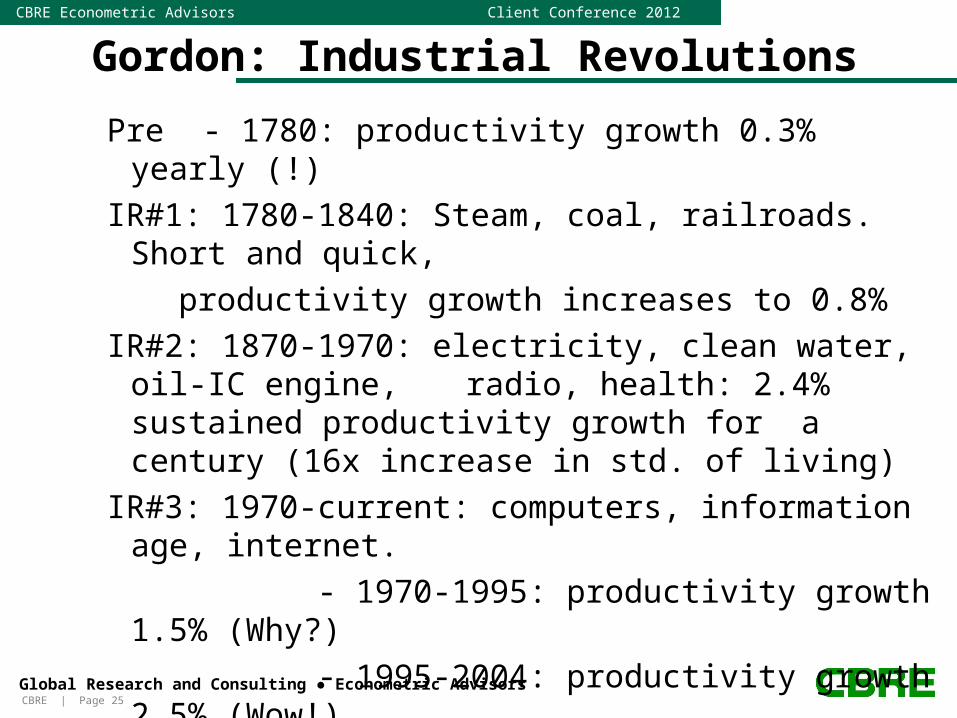
Gordon: Industrial Revolutions
Pre - 1780: productivity growth 0.3% yearly (!)
IR#1: 1780-1840: Steam, coal, railroads. Short and quick,
productivity growth increases to 0.8%
IR#2: 1870-1970: electricity, clean water, oil-IC engine, radio, health: 2.4% sustained productivity growth for a century (16x increase in std. of living)
IR#3: 1970-current: computers, information age, internet.
- 1970-1995: productivity growth 1.5% (Why?)
- 1995-2004: productivity growth 2.5% (Wow!)
- 2005-2012: productivity growth 1.3% (Ugh)
- 2013-2020: ?

CBRE | Page 26Global Research and Consulting ● Econometric Advisors
CBRE Econometric Advisors Client Conference 2012
The Current IT Industrial Revolution
YES• Most recent IT revolution not really productivity enhancing and just a form
of consumption • iPods, social networking, streaming video, connectivity have a big
“consumption” component. • ?? - US changing patent protection:“first to invent” (encourage ex post
court claims) to “first to file” (rest of the world). “First to file” favors larger corporations, big patents
NO• Enormous revolution in logistics has been productivity enhancing with a
huge boom to trade.• Coming revolution in shopping frees up time/travel• Robotics is not over: 3D “direct” production.• (more on these in pm sessions)
Is the IT productivity boom (IR #3) really petering out?

CBRE | Page 27Global Research and Consulting ● Econometric Advisors
CBRE Econometric Advisors Client Conference 2012
Current Industrial Revolution (continued)
AND IT is enabling a host of new Scientific and Technological innovations that have potential for future Industrial Revolutions (IR#4+). • The Cloud and new mainframes are boosting corporate
and scientific computing, allow access to “Big Data”…. • The growing Medical sector has been late to adopt IT and
this has enormous potential productivity gains. • Materials (Nano) technology about to become practical,
Carbon (CO2 sequestering) replaces steel, aluminum, copper (CO2 producing)...
• Natural Gas revolution = cheap, clean energy, and replacing gasoline could be just down the road.
• OUR BEST HOPE FOR GROWTH