global report: global survey of retirement plan accounting
TRANSCRIPT

Aon Legislative Reporting
Global Report: Global Survey of Retirement Plan Accounting Assumptions This report presents the results of Aon’s global survey of accounting assumptions used for employee benefit plans at 2019 year-end. The results of this survey may be useful to companies when setting preliminary assumptions for 2020 year-end and budgets for 2021. In addition, companies should consider the following:
During 2019, discount rates decreased in most countries from 2018 year-end, to varying degrees. The largest decreases were in the United States and the United Kingdom. During 2020 to date, the yields on corporate bonds in countries with large pension liabilities (i.e., Canada, the Eurozone, Switzerland, the United Kingdom, and the United States) have been very volatile. They had risen well above the 2019 year-end levels in March 2020 and have gradually fallen back close to or below their December 2019 levels. Additionally, depending on the length and severity of the economic impacts associated with COVID-19, it is possible that there could be future credit downgrades, which could significantly impact the available high-quality bond universe in some markets. Any planning for 2020 year-end or budgeting for 2021 should take these and subsequent movements into consideration.
Changes in bond yields mentioned above may be due, in part, to changes in inflationary expectations. When plan sponsors consider a change in their discount rate, they should review other assumptions linked to inflation.
In the UK, following a House of Lords report in 2019 stating that there are critical flaws in RPI (a measure of inflation used to index a large portion of UK pension benefits), the Government set out plans to consult on changes to the calculation of RPI. This consultation period runs to August 2020 and concerns the timing and implementation of changing the calculation of RPI to be in line with CPIH from 2030 or earlier. CPIH is expected to be around 1% p.a. lower than RPI in the long-term and therefore such a change would result in a significant reduction in pension liabilities, although it may also impact the value of index-linked pension assets. The implied market price for RPI inflation reduced significantly during 2019, partly as a result of these announcements. However, the market did not appear to fully reflect a full move to CPIH and therefore approximately 20% of companies chose to make a further reduction to the RPI assumption at the end of 2019 to reflect this expectation.
In the Eurozone, many companies look to the European Central Bank inflation target to set their inflation assumption. However, falling bond yields have led to falling market-implied inflation rates leading to lower inflation assumptions in the Eurozone which can impact pension increase assumptions. So far in 2020, market-implied inflation has reduced further, suggesting lower assumptions may be appropriate if current market conditions persist.
July 2020
Global Survey Retirement Plan Accounting Assumptions—YE2019 | Aon | July 2020 2
We continue to see companies, especially those with closed or frozen plans, establish a “glide path” as part of their investment and risk policy, with a view to automatically adjusting the risk level in the plans as market conditions vary. The glide path typically sets a specific asset allocation the investment manager must follow based on predefined triggers such as the funded status of the pension plan. If such a policy is applied, plan sponsors using U.S. GAAP should consider how the asset allocation in the relevant plans may vary when setting an assumption for the expected rate of return on assets.
Most countries in which defined benefit plans are prevalent have mortality assumptions that recognize anticipated future mortality improvements. Currently mortality assumptions are typically not being adjusted to reflect COVID-19 as the long-term impact of the pandemic on future mortality is still uncertain. However, it is to be expected that a view will develop during 2020. Below are comments concerning mortality assumptions in several countries:
– United Kingdom—In March 2020, the Continuous Mortality Investigation (CMI) released a further update to UK mortality projections, CMI_2019. This update showed a deviation from the recent trend with slightly higher improvements to future mortality rates compared to CMI_2018. There were no changes to any of the core parameters underlying the projections. Updating mortality projections from CMI_2018 to CMI_2019 is typically expected to result in a small increase to pension obligations (usually less than 0.5%), although impacts can vary depending on a given plan’s specific circumstances. The CMI is expected to consult on how the impact of COVID-19 should be reflected in CMI_2020.
– United States—In October 2019, new base mortality tables for private-sector retirement plans and new mortality improvement assumptions were issued in the United States. Many plan sponsors adopted these new assumptions for 2019 year-end. Some clients performed mortality studies and adjusted the standard tables to better fit their experience. Since the last update to the base mortality tables for private-sector plans in 2014, additional data has shown a slowdown in mortality improvements for the general population in the U.S., and new mortality improvement scales reflecting this experience have been issued each year in 2015–2019, with the next update expected in 2020. These updated improvement scales have been adopted by many companies. As a result, the impact of adopting the new base mortality tables at 2019 year-end was often fairly small for most plans.
– Germany—New mortality tables (Heubeck RT 2018 G) were issued in Germany in 2018. As the RT 2018 G standard tables use flat and potentially cautious mortality improvement projections, some companies have applied at year-end 2019 (or intend to apply in 2020) alternate mortality improvement projections to the RT 2018 G base table based on the CMI model used in the UK. Usually this may lead to a decrease of pension obligations by 1% to 3%.
– Japan—The Ministry of Health, Labour and Welfare of Japan released the latest revision of expected mortality rates in late March. These rates (referred to as MHLW 2020) supersede the previous mortality expectation published in 2015. Next update is expected to be released in 2025. Our initial review suggests that the impact on longevity and liability is limited and changing to the new rate will result in an accounting loss less than 1% in most cases.
– Switzerland—New mortality tables will be issued late December 2020. These mortality tables referred as BVG/LPP 2020 will replace the BVG/LPP 2015. Provisional results show that mortality rates have largely developed in line with expectations, while a further decrease in disability rates has been observed.
Companies have been continuing to undertake exercises to reduce the financial risks related to their pension plans, such as lump-sum windows, buy-ins, buy-outs and longevity swaps. The accounting treatment of these exercises (in particular, whether settlement accounting according to U.S. GAAP may be required) should be considered, based on the nature of the exercise and the accounting standard being applied.
In August 2018, the U.S. Financial Accounting Standards Board (FASB) issued Accounting Standards Update (ASU) 2018-14, which changes the disclosure requirements for pension and other postretirement benefits under U.S. GAAP, eliminating certain existing disclosures and adding certain new disclosures. Among the new disclosures is a description of significant sources of gain or loss in the benefit obligation. The new requirements are generally effective for fiscal years ending after December 15, 2020 for public business entities, with early adoption permitted. Approximately 10-15% of companies had elected to adopt early by the end of 2019. Retrospective application of the changes is required.
Global Survey Retirement Plan Accounting Assumptions—YE2019 | Aon | July 2020 3
Following proposals in the IASB 2015 Exposure Draft, changes to IAS 19 were issued in February 2018. The standard was revised to the extent that:
– the expense for the remaining reporting period after an amendment, curtailment, or settlement is recognized in a way to reflect those events similar to U.S. GAAP (i.e. the pension cost components for the remaining reporting period are calculated on the basis of assumptions as of the date of the special event), and
– IAS 19 clarifies the treatment of the IFRIC 14 asset ceiling in the event of an amendment, curtailment or settlement.
However, "clarification" regarding the availability of a surplus under IFRIC 14 (IAS 19 – The Limit on a Defined Benefit Asset, Minimum Funding Requirements and their Interaction) had been deferred and the IASB decided at its February 2020 meeting not to finalise the proposed amendments. The IASB will consider the project’s direction at a future meeting.
In the UK, there has been a significant increase in deferred members and members approaching retirement transferring their benefits out of DB plans to DC vehicles via a cash equivalent transfer value, as a result of the increased flexibilities which have been made available, such as the ability to take the entire DC account balance as a lump sum. This has in some cases resulted in a settlement event. We would recommend tracking such payments from UK plans during the course of the year in order to assess the likelihood of a settlement event being triggered.
If you would like an update on current economic indices or the current status of changes in accounting standards, please contact your local Aon consultant.
Global Survey Retirement Plan Accounting Assumptions—YE2019 | Aon | July 2020 4
Background Aon conducted this survey of fiscal 2019 year-end accounting assumptions by gathering assumptions used by our clients.
As in previous surveys, we have focused on four economic assumptions that companies select under ASC 715, IAS 19, FRS 102 and other accounting standards with similar requirements for assumption setting. The assumptions are:
Discount rate;
Expected long-term rate of return (U.S. GAAP only);
Salary increase; and
Pension increase assumptions (for certain countries only).
Similar to last year, we are only showing assumptions for companies with fiscal years ending on December 31, 2019. The tables on the following pages show the average assumption as of the end of 2018 and 2019.
The Appendix provides the following additional information about 2019 year-end assumptions:
Average discount rate by duration of the pension liabilities for countries with larger pension obligations (Canada, Eurozone, Japan, Switzerland, and the U.K.);
Range of assumptions used at 2019 year-end for specific countries; and
Prevalent mortality table along with life expectancies for countries with larger pension liabilities.
Global Survey Retirement Plan Accounting Assumptions—YE2019 | Aon | July 2020 5
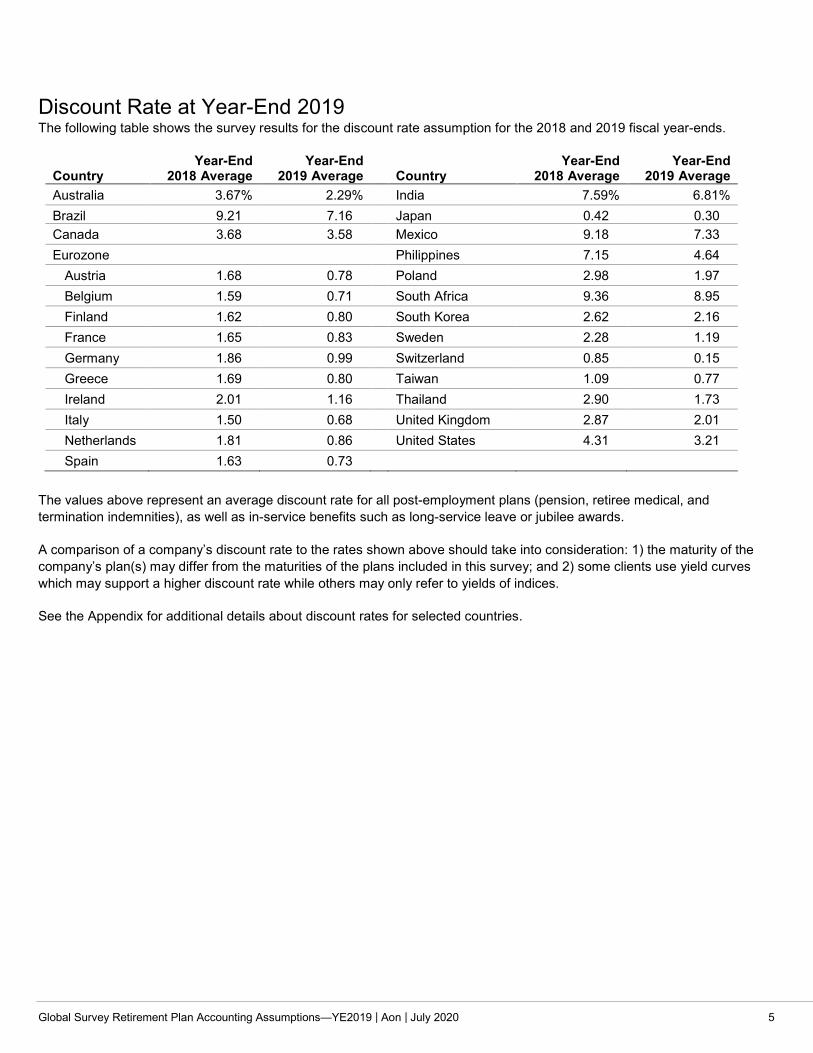
Discount Rate at Year-End 2019 The following table shows the survey results for the discount rate assumption for the 2018 and 2019 fiscal year-ends.
Country Year-End
2018 Average Year-End
2019 Average
Country Year-End
2018 Average Year-End
2019 Average Australia 3.67% 2.29% India 7.59% 6.81% Brazil 9.21 7.16 Japan 0.42 0.30 Canada 3.68 3.58 Mexico 9.18 7.33 Eurozone Philippines 7.15 4.64 Austria 1.68 0.78 Poland 2.98 1.97 Belgium 1.59 0.71 South Africa 9.36 8.95 Finland 1.62 0.80 South Korea 2.62 2.16 France 1.65 0.83 Sweden 2.28 1.19 Germany 1.86 0.99 Switzerland 0.85 0.15 Greece 1.69 0.80 Taiwan 1.09 0.77 Ireland 2.01 1.16 Thailand 2.90 1.73 Italy 1.50 0.68 United Kingdom 2.87 2.01 Netherlands 1.81 0.86 United States 4.31 3.21 Spain 1.63 0.73
The values above represent an average discount rate for all post-employment plans (pension, retiree medical, and termination indemnities), as well as in-service benefits such as long-service leave or jubilee awards.
A comparison of a company’s discount rate to the rates shown above should take into consideration: 1) the maturity of the company’s plan(s) may differ from the maturities of the plans included in this survey; and 2) some clients use yield curves which may support a higher discount rate while others may only refer to yields of indices.
See the Appendix for additional details about discount rates for selected countries.
Global Survey Retirement Plan Accounting Assumptions—YE2019 | Aon | July 2020 6
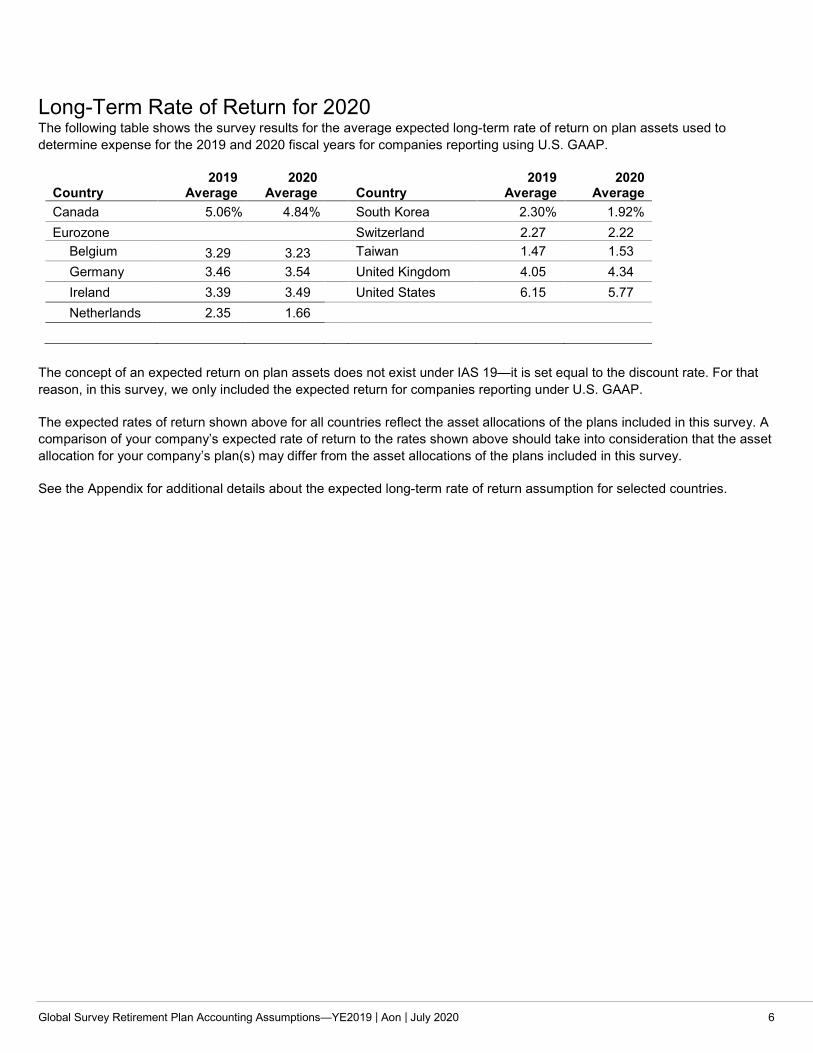
Long-Term Rate of Return for 2020 The following table shows the survey results for the average expected long-term rate of return on plan assets used to determine expense for the 2019 and 2020 fiscal years for companies reporting using U.S. GAAP.
Country 2019
Average 2020
Average
Country 2019
Average 2020
Average Canada 5.06% 4.84% South Korea 2.30% 1.92% Eurozone Switzerland 2.27 2.22 Belgium 3.29 3.23 Taiwan 1.47 1.53 Germany 3.46 3.54 United Kingdom 4.05 4.34 Ireland 3.39 3.49 United States 6.15 5.77 Netherlands 2.35 1.66
The concept of an expected return on plan assets does not exist under IAS 19—it is set equal to the discount rate. For that reason, in this survey, we only included the expected return for companies reporting under U.S. GAAP.
The expected rates of return shown above for all countries reflect the asset allocations of the plans included in this survey. A comparison of your company’s expected rate of return to the rates shown above should take into consideration that the asset allocation for your company’s plan(s) may differ from the asset allocations of the plans included in this survey.
See the Appendix for additional details about the expected long-term rate of return assumption for selected countries.

Global Survey Retirement Plan Accounting Assumptions—YE2019 | Aon | July 2020 7
Salary Increase at Year-End 2019 The following table shows the survey results for the salary increase assumption for 2018 and 2019 fiscal year-ends.
Country Year-End
2018 Average Year-End
2019 Average
Country Year-End
2018 Average Year-End
2019 Average Australia 3.05% 2.88% India 8.68% 8.37% Canada 3.03 2.97 Japan 2.20 2.31 Eurozone Mexico 5.24 5.26 Austria 2.63 2.56 Philippines 5.52 5.41 Belgium 2.81 2.77 Poland 3.16 2.96 Finland 2.10 2.10 South Korea 4.46 4.30 France 2.39 2.32 Sweden 2.83 2.74 Germany 2.60 2.54 Switzerland 1.46 1.50 Greece 1.88 1.84 Taiwan 3.26 3.29 Ireland 2.54 2.32 Thailand 5.12 5.17 Italy 2.42 2.24 United Kingdom 3.00 2.82 Netherlands 2.27 2.27 United States 3.81 3.74 Spain 2.06 1.98
The salary increase assumptions shown above reflect the situation of each company included in this survey. Your company’s situation may differ from that of the companies included in the survey; hence, a different salary increase assumption may be appropriate.
See the Appendix for additional details about the salary increase assumption for selected countries.
Global Survey Retirement Plan Accounting Assumptions—YE2019 | Aon | July 2020 8
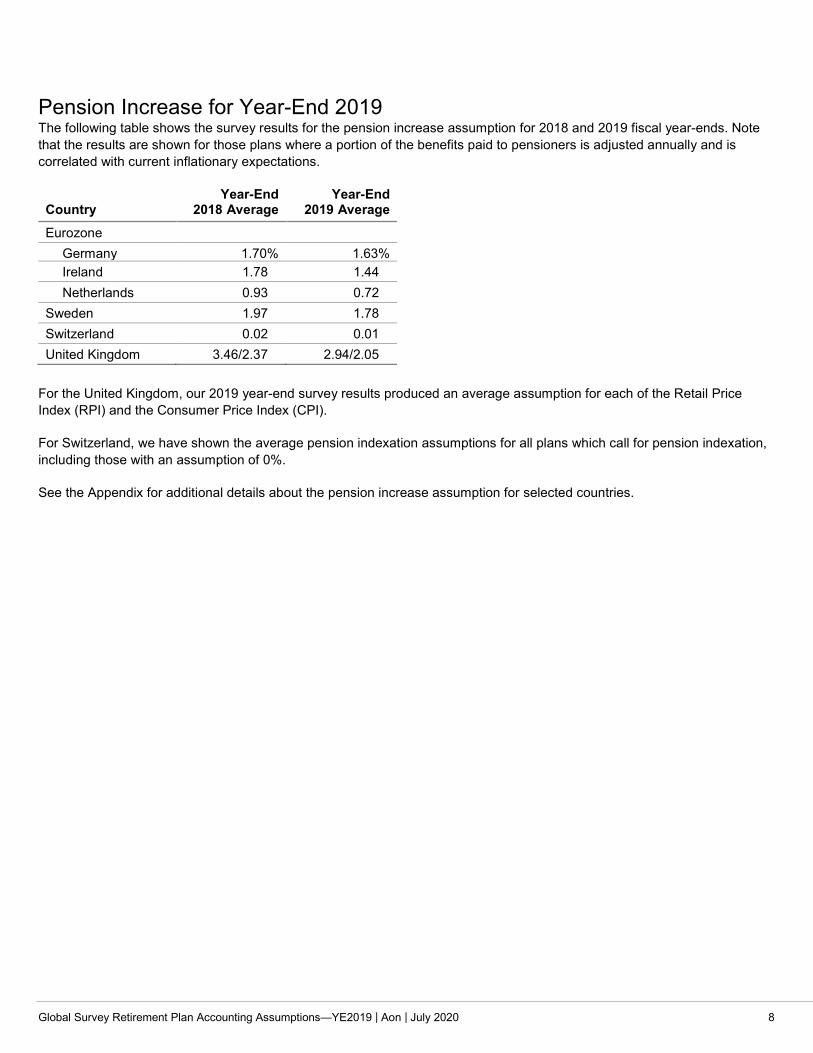
Pension Increase for Year-End 2019 The following table shows the survey results for the pension increase assumption for 2018 and 2019 fiscal year-ends. Note that the results are shown for those plans where a portion of the benefits paid to pensioners is adjusted annually and is correlated with current inflationary expectations.
Country Year-End
2018 Average Year-End
2019 Average
Eurozone Germany 1.70% 1.63% Ireland 1.78 1.44 Netherlands 0.93 0.72 Sweden 1.97 1.78 Switzerland 0.02 0.01 United Kingdom 3.46/2.37 2.94/2.05
For the United Kingdom, our 2019 year-end survey results produced an average assumption for each of the Retail Price Index (RPI) and the Consumer Price Index (CPI).
For Switzerland, we have shown the average pension indexation assumptions for all plans which call for pension indexation, including those with an assumption of 0%.
See the Appendix for additional details about the pension increase assumption for selected countries.
Global Survey Retirement Plan Accounting Assumptions—YE2019 | Aon | July 2020 9
Appendix The Appendix provides the following additional information about 2019 year-end assumptions:
For countries with larger pension obligations (Canada, Eurozone, Japan, Switzerland, and the U.K.), the average discount rate by duration. Note: We were only able to include plans for which the duration of the plan was available;
For specific countries, the range of assumptions used at 2019 year-end; and
For certain countries, the prevalent mortality table used at 2019 year-end along with life expectancies.
Global Survey Retirement Plan Accounting Assumptions—YE2019 | Aon | July 2020 10
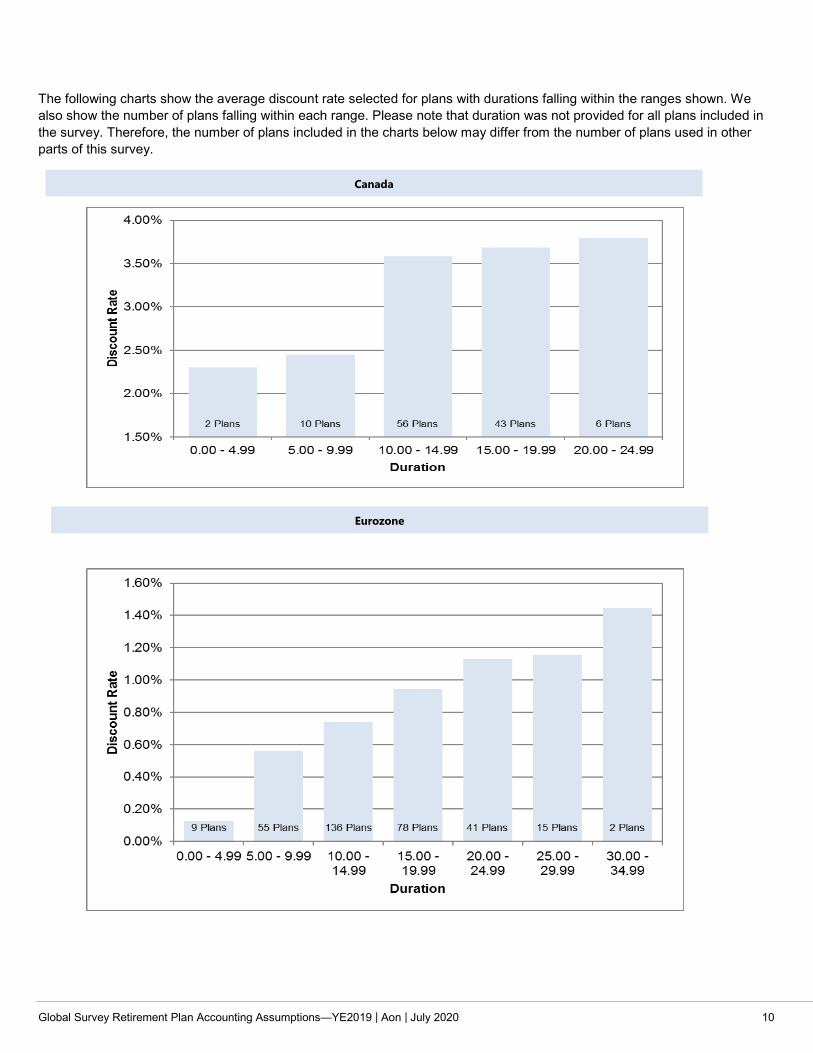
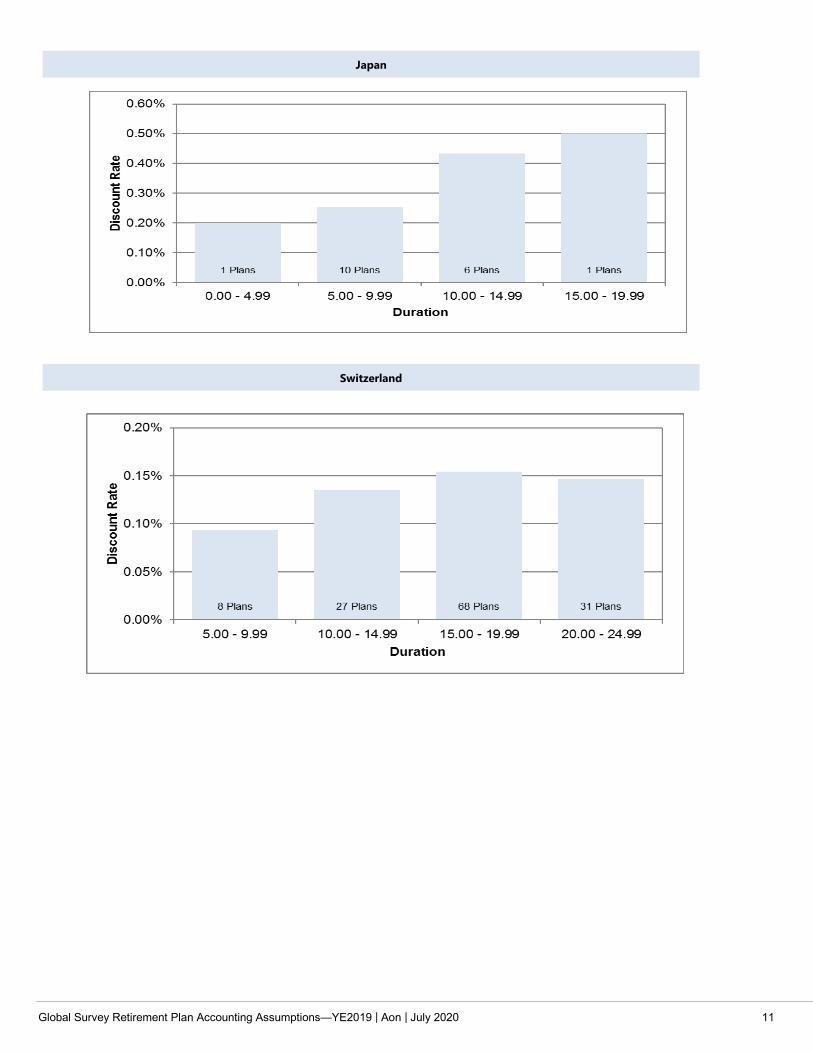
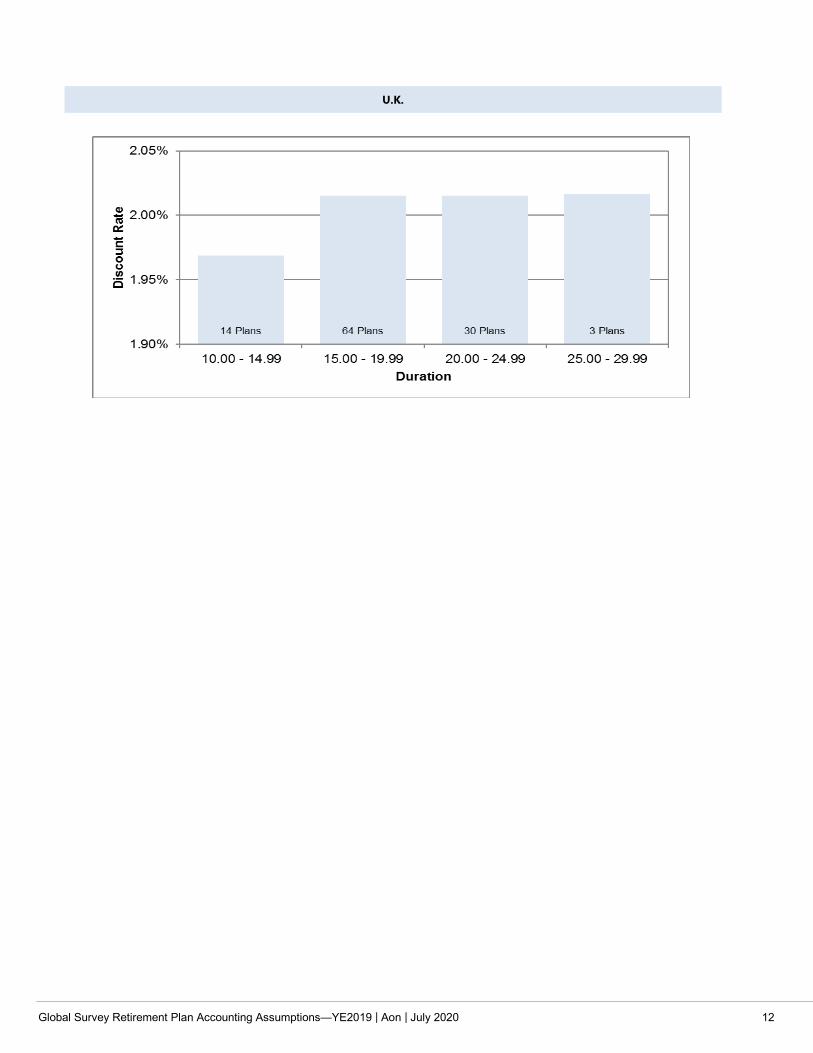
The following charts show the average discount rate selected for plans with durations falling within the ranges shown. We also show the number of plans falling within each range. Please note that duration was not provided for all plans included in the survey. Therefore, the number of plans included in the charts below may differ from the number of plans used in other parts of this survey.
Canada
Eurozone
Global Survey Retirement Plan Accounting Assumptions—YE2019 | Aon | July 2020 11
Switzerland
Japan
Global Survey Retirement Plan Accounting Assumptions—YE2019 | Aon | July 2020 12
U.K.
Global Survey Retirement Plan Accounting Assumptions—YE2019 | Aon | July 2020 13
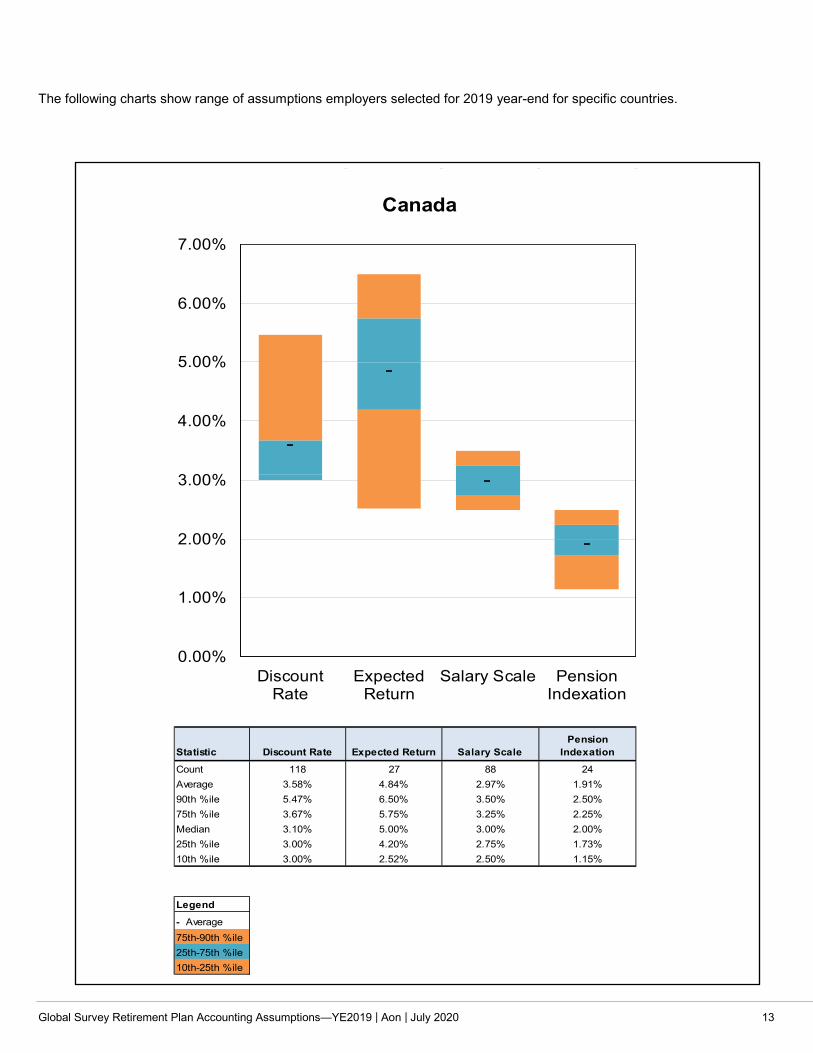
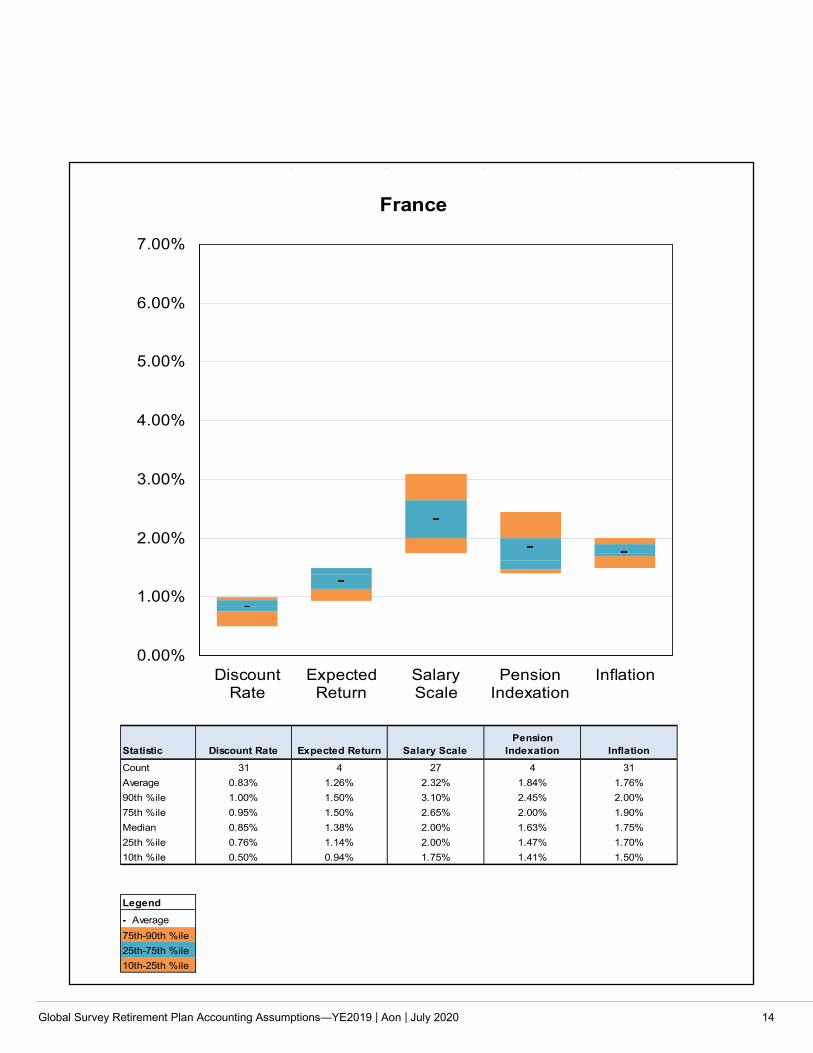
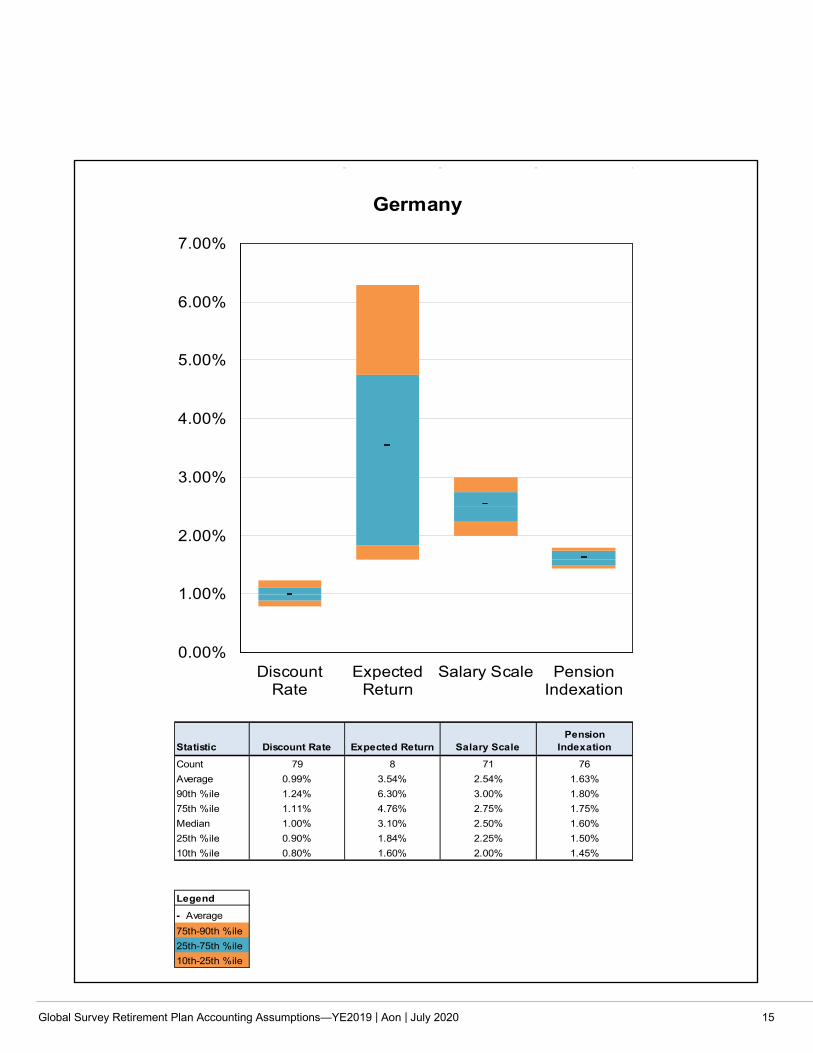
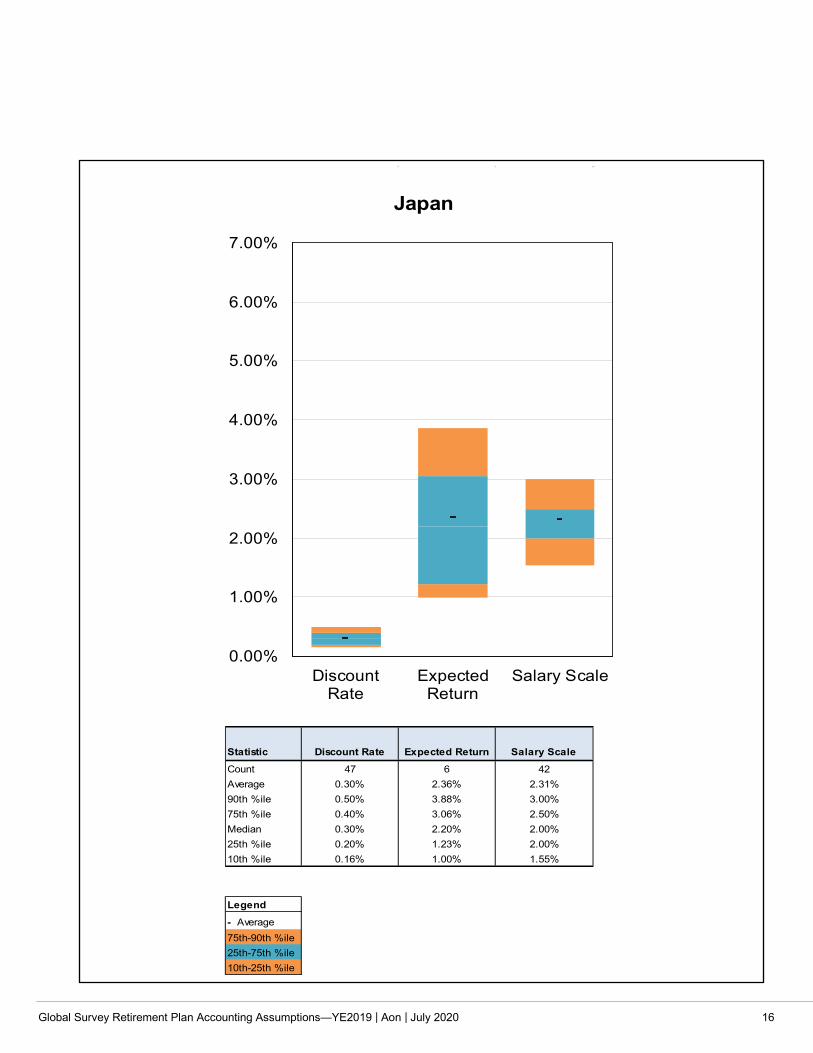
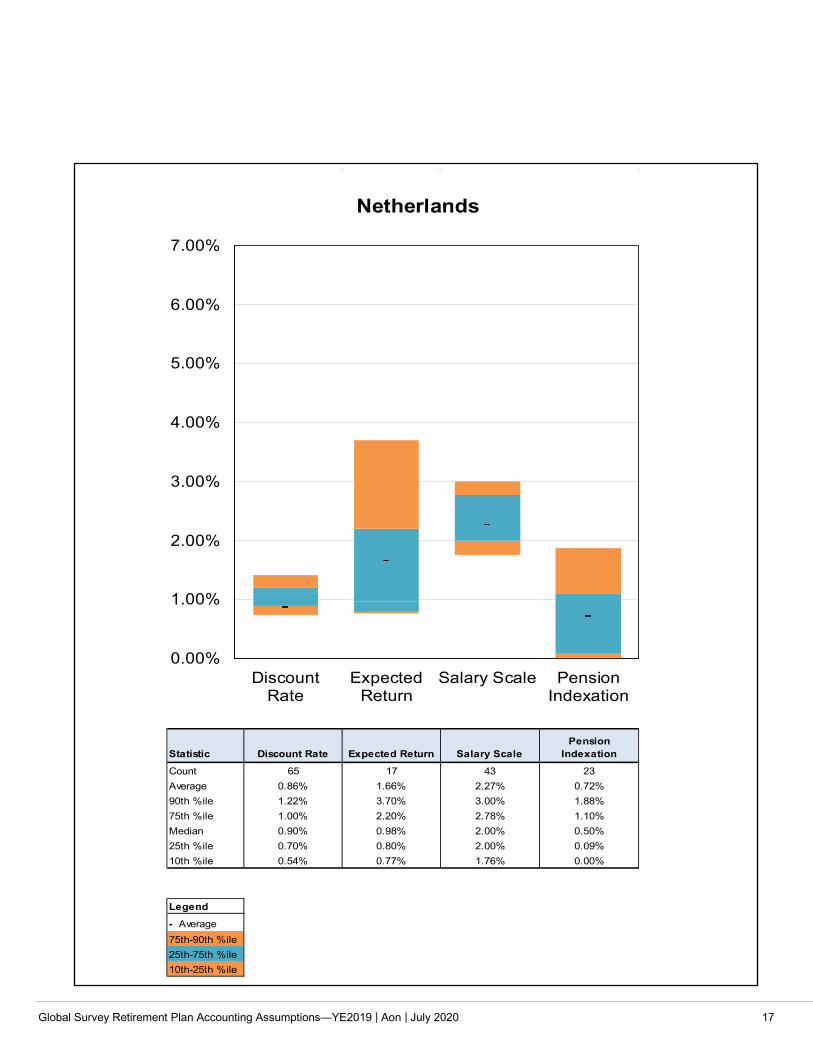
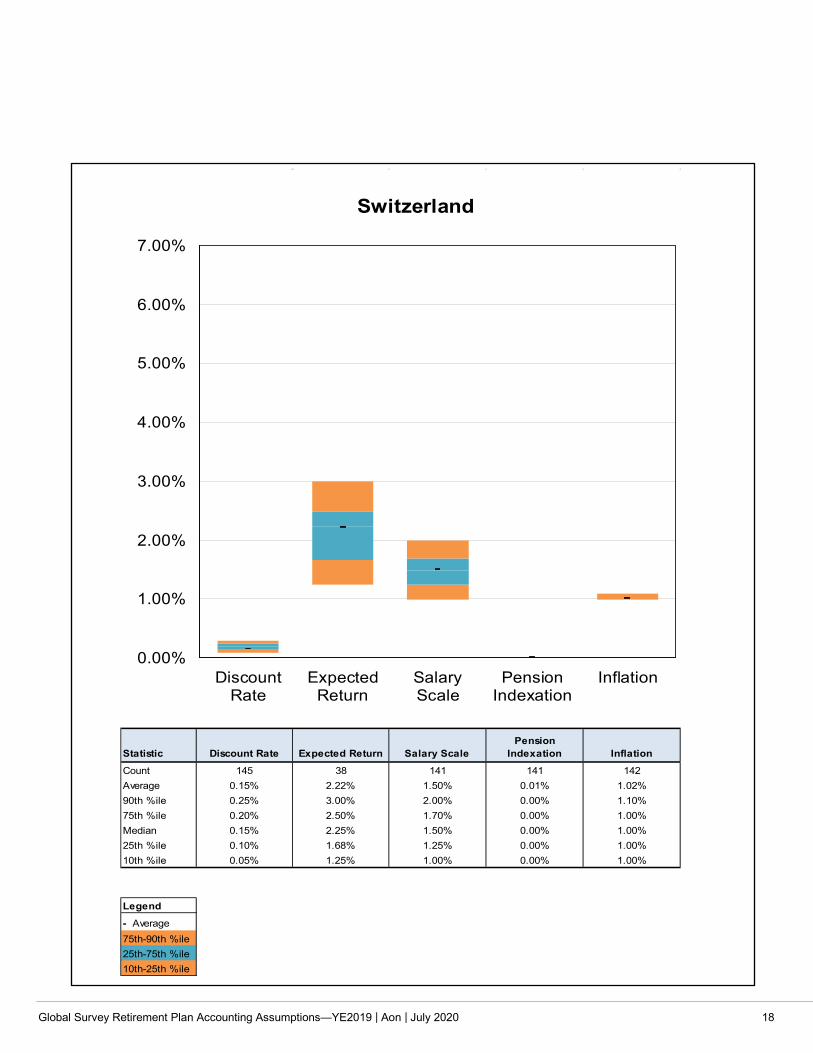
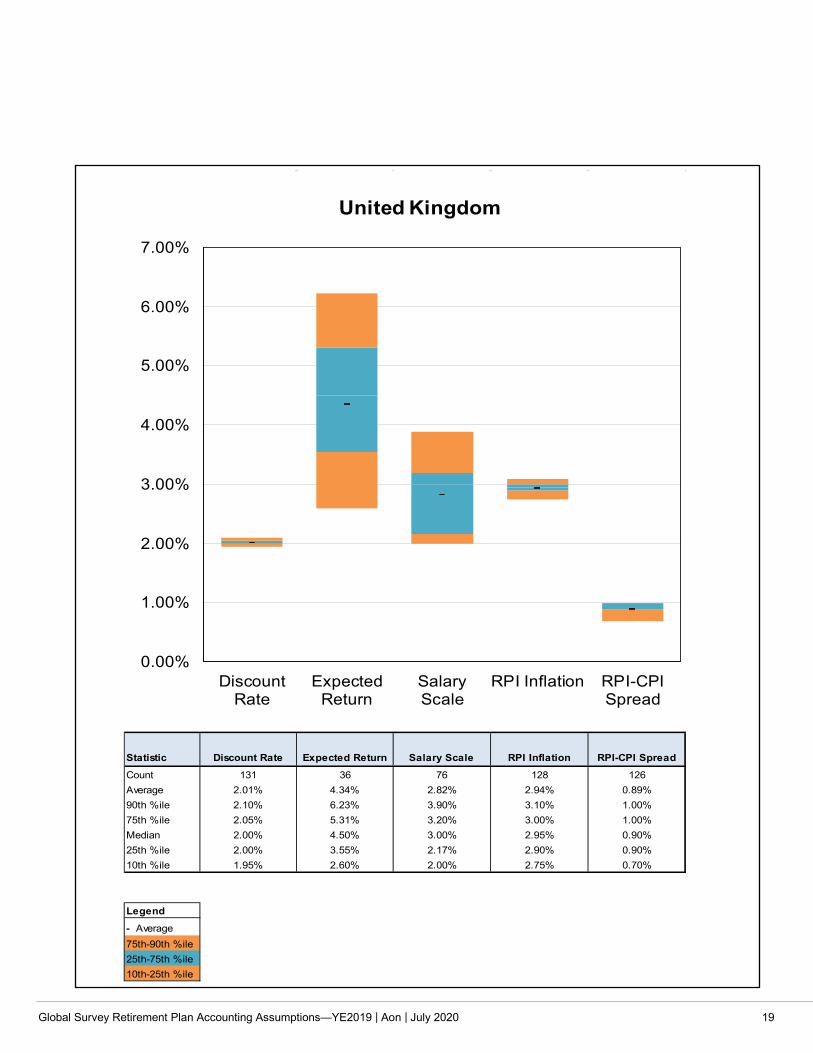
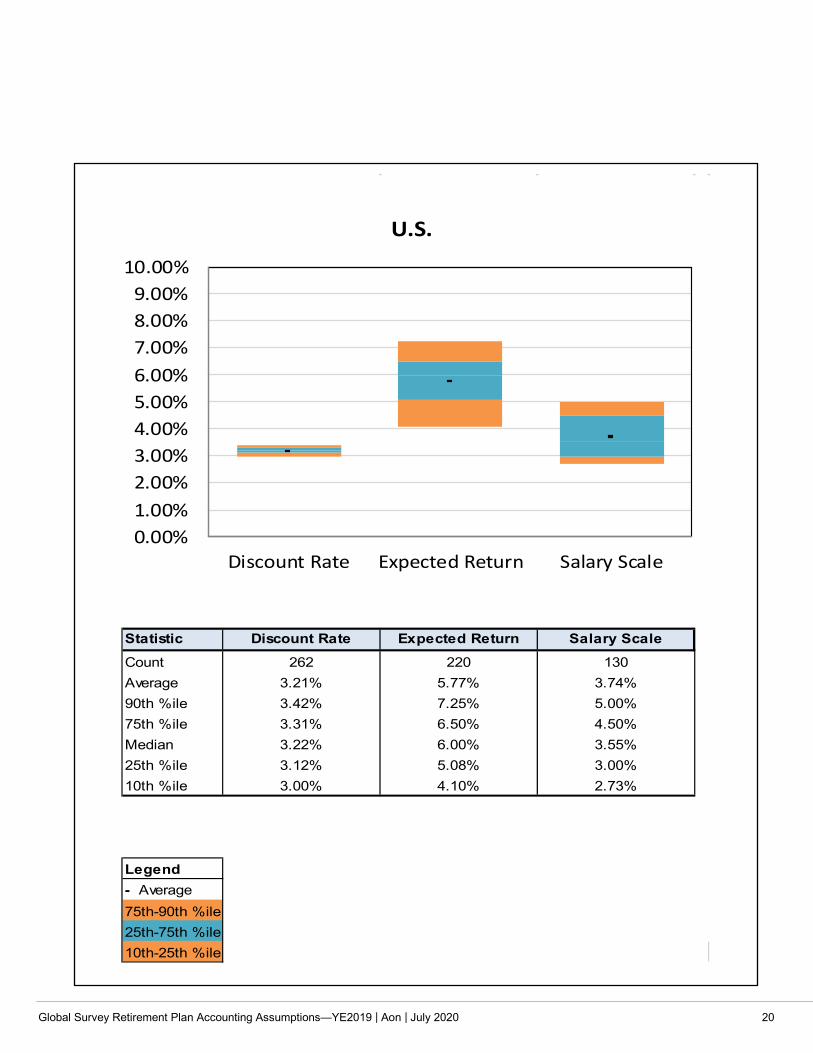
The following charts show range of assumptions employers selected for 2019 year-end for specific countries.
Statistic Discount Rate Expected Return Salary ScalePension
Indexation
Count 118 27 88 24Average 3.58% 4.84% 2.97% 1.91%90th %ile 5.47% 6.50% 3.50% 2.50%75th %ile 3.67% 5.75% 3.25% 2.25%Median 3.10% 5.00% 3.00% 2.00%25th %ile 3.00% 4.20% 2.75% 1.73%10th %ile 3.00% 2.52% 2.50% 1.15%
Legend
- Average75th-90th %ile25th-75th %ile10th-25th %ile
0.00%
1.00%
2.00%
3.00%
4.00%
5.00%
6.00%
7.00%
DiscountRate
ExpectedReturn
Salary Scale PensionIndexation
Canada
Global Survey Retirement Plan Accounting Assumptions—YE2019 | Aon | July 2020 14
Statistic Discount Rate Expected Return Salary ScalePension
Indexation Inflation
Count 31 4 27 4 31Average 0.83% 1.26% 2.32% 1.84% 1.76%90th %ile 1.00% 1.50% 3.10% 2.45% 2.00%75th %ile 0.95% 1.50% 2.65% 2.00% 1.90%Median 0.85% 1.38% 2.00% 1.63% 1.75%25th %ile 0.76% 1.14% 2.00% 1.47% 1.70%10th %ile 0.50% 0.94% 1.75% 1.41% 1.50%
Legend
- Average75th-90th %ile25th-75th %ile10th-25th %ile
0.00%
1.00%
2.00%
3.00%
4.00%
5.00%
6.00%
7.00%
DiscountRate
ExpectedReturn
SalaryScale
PensionIndexation
Inflation
France
Global Survey Retirement Plan Accounting Assumptions—YE2019 | Aon | July 2020 15
Statistic Discount Rate Expected Return Salary ScalePension
Indexation
Count 79 8 71 76Average 0.99% 3.54% 2.54% 1.63%90th %ile 1.24% 6.30% 3.00% 1.80%75th %ile 1.11% 4.76% 2.75% 1.75%Median 1.00% 3.10% 2.50% 1.60%25th %ile 0.90% 1.84% 2.25% 1.50%10th %ile 0.80% 1.60% 2.00% 1.45%
Legend
- Average75th-90th %ile25th-75th %ile10th-25th %ile
0.00%
1.00%
2.00%
3.00%
4.00%
5.00%
6.00%
7.00%
DiscountRate
ExpectedReturn
Salary Scale PensionIndexation
Germany
Global Survey Retirement Plan Accounting Assumptions—YE2019 | Aon | July 2020 16
Statistic Discount Rate Expected Return Salary Scale
Count 47 6 42Average 0.30% 2.36% 2.31%90th %ile 0.50% 3.88% 3.00%75th %ile 0.40% 3.06% 2.50%Median 0.30% 2.20% 2.00%25th %ile 0.20% 1.23% 2.00%10th %ile 0.16% 1.00% 1.55%
Legend
- Average75th-90th %ile25th-75th %ile10th-25th %ile
0.00%
1.00%
2.00%
3.00%
4.00%
5.00%
6.00%
7.00%
DiscountRate
ExpectedReturn
Salary Scale
Japan
Global Survey Retirement Plan Accounting Assumptions—YE2019 | Aon | July 2020 17
Statistic Discount Rate Expected Return Salary ScalePension
Indexation
Count 65 17 43 23Average 0.86% 1.66% 2.27% 0.72%90th %ile 1.22% 3.70% 3.00% 1.88%75th %ile 1.00% 2.20% 2.78% 1.10%Median 0.90% 0.98% 2.00% 0.50%25th %ile 0.70% 0.80% 2.00% 0.09%10th %ile 0.54% 0.77% 1.76% 0.00%
Legend
- Average75th-90th %ile25th-75th %ile10th-25th %ile
0.00%
1.00%
2.00%
3.00%
4.00%
5.00%
6.00%
7.00%
DiscountRate
ExpectedReturn
Salary Scale PensionIndexation
Netherlands
Global Survey Retirement Plan Accounting Assumptions—YE2019 | Aon | July 2020 18
Statistic Discount Rate Expected Return Salary ScalePension
Indexation Inflation
Count 145 38 141 141 142Average 0.15% 2.22% 1.50% 0.01% 1.02%90th %ile 0.25% 3.00% 2.00% 0.00% 1.10%75th %ile 0.20% 2.50% 1.70% 0.00% 1.00%Median 0.15% 2.25% 1.50% 0.00% 1.00%25th %ile 0.10% 1.68% 1.25% 0.00% 1.00%10th %ile 0.05% 1.25% 1.00% 0.00% 1.00%
Legend
- Average75th-90th %ile25th-75th %ile10th-25th %ile
0.00%
1.00%
2.00%
3.00%
4.00%
5.00%
6.00%
7.00%
DiscountRate
ExpectedReturn
SalaryScale
PensionIndexation
Inflation
Switzerland
Global Survey Retirement Plan Accounting Assumptions—YE2019 | Aon | July 2020 19
Statistic Discount Rate Expected Return Salary Scale RPI Inflation RPI-CPI Spread
Count 131 36 76 128 126Average 2.01% 4.34% 2.82% 2.94% 0.89%90th %ile 2.10% 6.23% 3.90% 3.10% 1.00%75th %ile 2.05% 5.31% 3.20% 3.00% 1.00%Median 2.00% 4.50% 3.00% 2.95% 0.90%25th %ile 2.00% 3.55% 2.17% 2.90% 0.90%10th %ile 1.95% 2.60% 2.00% 2.75% 0.70%
Legend
- Average75th-90th %ile25th-75th %ile10th-25th %ile
0.00%
1.00%
2.00%
3.00%
4.00%
5.00%
6.00%
7.00%
DiscountRate
ExpectedReturn
SalaryScale
RPI Inflation RPI-CPISpread
United Kingdom
Global Survey Retirement Plan Accounting Assumptions—YE2019 | Aon | July 2020 20
Statistic Discount Rate Expected Return Salary Scale
Count 262 220 130Average 3.21% 5.77% 3.74%90th %ile 3.42% 7.25% 5.00%75th %ile 3.31% 6.50% 4.50%Median 3.22% 6.00% 3.55%25th %ile 3.12% 5.08% 3.00%10th %ile 3.00% 4.10% 2.73%
Legend- Average75th-90th %ile25th-75th %ile10th-25th %ile
0.00%1.00%2.00%3.00%4.00%5.00%6.00%7.00%8.00%9.00%
10.00%
Discount Rate Expected Return Salary Scale
U.S.
Global Survey Retirement Plan Accounting Assumptions—YE2019 | Aon | July 2020 21
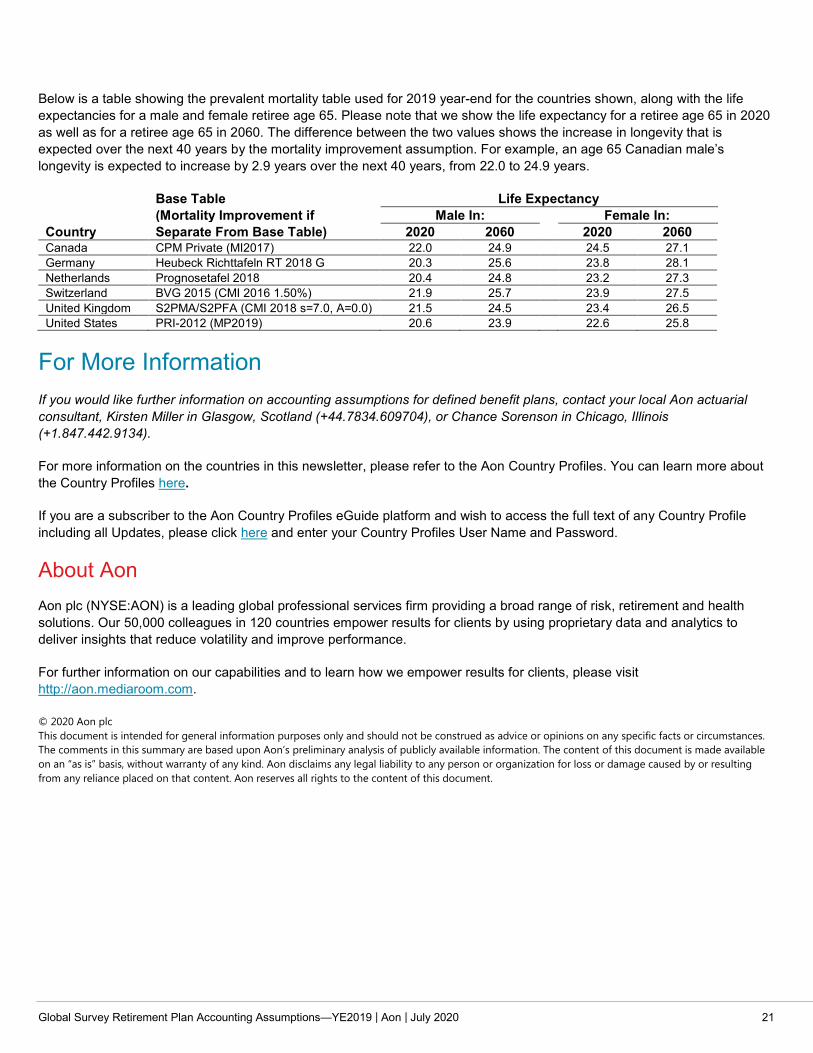
Below is a table showing the prevalent mortality table used for 2019 year-end for the countries shown, along with the life expectancies for a male and female retiree age 65. Please note that we show the life expectancy for a retiree age 65 in 2020 as well as for a retiree age 65 in 2060. The difference between the two values shows the increase in longevity that is expected over the next 40 years by the mortality improvement assumption. For example, an age 65 Canadian male’s longevity is expected to increase by 2.9 years over the next 40 years, from 22.0 to 24.9 years.
Base Table Life Expectancy (Mortality Improvement if Male In: Female In: Country Separate From Base Table) 2020 2060 2020 2060 Canada CPM Private (MI2017) 22.0 24.9 24.5 27.1 Germany Heubeck Richttafeln RT 2018 G 20.3 25.6 23.8 28.1 Netherlands Prognosetafel 2018 20.4 24.8 23.2 27.3 Switzerland BVG 2015 (CMI 2016 1.50%) 21.9 25.7 23.9 27.5 United Kingdom S2PMA/S2PFA (CMI 2018 s=7.0, A=0.0) 21.5 24.5 23.4 26.5 United States PRI-2012 (MP2019) 20.6 23.9 22.6 25.8
For More Information If you would like further information on accounting assumptions for defined benefit plans, contact your local Aon actuarial consultant, Kirsten Miller in Glasgow, Scotland (+44.7834.609704), or Chance Sorenson in Chicago, Illinois (+1.847.442.9134).
For more information on the countries in this newsletter, please refer to the Aon Country Profiles. You can learn more about the Country Profiles here.
If you are a subscriber to the Aon Country Profiles eGuide platform and wish to access the full text of any Country Profile including all Updates, please click here and enter your Country Profiles User Name and Password.
About Aon Aon plc (NYSE:AON) is a leading global professional services firm providing a broad range of risk, retirement and health solutions. Our 50,000 colleagues in 120 countries empower results for clients by using proprietary data and analytics to deliver insights that reduce volatility and improve performance.
For further information on our capabilities and to learn how we empower results for clients, please visit http://aon.mediaroom.com.
© 2020 Aon plc This document is intended for general information purposes only and should not be construed as advice or opinions on any specific facts or circumstances. The comments in this summary are based upon Aon’s preliminary analysis of publicly available information. The content of this document is made available on an “as is” basis, without warranty of any kind. Aon disclaims any legal liability to any person or organization for loss or damage caused by or resulting from any reliance placed on that content. Aon reserves all rights to the content of this document.