global reinsurance and risk appetite report 2016 · 3 global reinsurance and risk appetite report...
TRANSCRIPT

Global Reinsurance and Risk Appetite Report 2016

March 2016 2
Foreword ......................................................................................................................................................................................................... 3
Adopting a Risk Appetite Statement ....................................................................................................................................................... 5
Linking Risk Appetite to Reinsurance ..................................................................................................................................................... 8
Focus on Earnings ....................................................................................................................................................................................... 11
Focus on Capital .......................................................................................................................................................................................... 13
Key Takeaways............................................................................................................................................................................................. 15
Table of Contents

3 Global Reinsurance and Risk Appetite Report 2016
In the last decade, our privileged position as reinsurance advisors has allowed us to observe the rising importance of risk appetite statements within insurance organisations. Throughout, we have been instrumental in linking these to clients’ reinsurance strategies.
Whilst the insurance industry is saturated with data regarding losses, portfolio metrics and market dynamics, it became clear that there was a lack of information on risk appetite and how it influences the reinsurance decision making process.
To fill this gap, in 2013 Willis Re launched the pilot Risk Appetite Survey in Europe, which gained great traction with clients across the continent and generated interest further afield. Building on this success, we conducted a new global survey in 2015, aimed at providing a worldwide perspective on risk appetite.
With responses from over 240 insurers in nearly fifty countries, the importance of this theme in our industry is apparent.
We are confident that the survey findings in the following report will provide an interesting insight into the trends we are observing and will help you better understand how your company’s position concerning risk appetite and reinsurance compares with others. We will also be glad to provide you with a more in-depth, customised analysis to further help you on this journey.
Tony Melia CEO – Willis Re International
Foreword

March 2016 4
The Willis Re Risk Appetite Survey in Numbers
241 respondents from 48 countries
*84 chose not to disclose size
*86 chose not to disclose ownership structure
70Europe
69Privately Owned
39Publicly Owned
40Mutual
7State Owned
77APMETA
Asia Pacific, Middle East, Turkey, Africa
59North America
35LAC
Latin America & Caribbean
47Small
GWP under $100M
41Medium
GWP between $100M and $500M
49Large
GWP between $500M and $5B
20Very Large
GWP over $5B

5 Global Reinsurance and Risk Appetite Report 2016
Almost two-thirds of those surveyed have a formal risk appetite statement, with a further 17% planning to develop one in the near future.
Adopting a Risk Appetite Statement
APMETA
73%
12%
16%
North America51%
34%
15%
Europe
71%
14%
14%
LAC
20%
26%
54%
�Yes
�No, but planning to
�No
Figure 1: Risk appetite adoption by geography% of companies who responded to the question ‘Do you have a formal risk appetite statement?’ split by region. In the above pie charts and in subsequent exhibits, the percentages shown may not sum to 100% due to rounding.
Geography
73% of companies in APMETA along with 71% of companies in Europe have a risk appetite statement
These figures reduce to 54% for LAC and 51% for North America
Whilst the use of a formal risk appetite statement is now widespread across the globe, the levels of adoption in different regions are at varying stages. Companies based in APMETA (Asia Pacific, Middle East, Turkey, Africa) are most likely to have a risk appetite statement (73%). The percentage is similar across Europe, with 71% of companies surveyed adopting a formal statement.
These figures can be explained by a combination of regulatory pressures (such as the implementation of Solvency II in Europe) and internal governance standards, with stakeholders increasingly expecting companies to employ transparent and detailed risk management frameworks.
In contrast, the take-up rates in the Americas are 51% and 54% for North America and LAC (Latin America and Caribbean) respectively. Although these are lower than in the other two regions, it is perhaps more telling that a further 15% and 26% of companies in these regions are planning on having a formal risk appetite statement in the near future; this increase would bring the total in line with APMETA and Europe. Just as Solvency II has driven European companies to place a greater emphasis on risk management, the rolling out of Own Risk and Solvency Assessment (ORSA) requirements in the immediate future will no doubt have a similar effect on companies based in North America.

March 2016 6
Size
The larger the company, the more likely it is to have a risk appetite statement
All of the $5bn+ companies surveyed either have a statement or plan to have one shortly
Ownership Structure
Publicly held companies are most likely to have a risk appetite statement
Whilst companies of all sizes are using risk appetite statements, there is a notable correlation between size of company and usage. Of the 20 very large companies in the survey (those who write $5bn or more premium annually), 18 confirmed they have a risk appetite statement, with the remaining two suggesting they will develop one in the near future. 71% of large companies confirmed that they have a statement compared with approximately 60% for the medium and smaller size respondents.
Figure 2: Risk appetite adoption by size% of companies who responded to the question ‘Do you have a formal risk appetite statement?’ split by company Size
0%
20%
40%
60%
80%
100%
21
19
60 59
20
22
18
71
10 10
90
Small Medium Large V. Large
�Yes �No, but planning to �No
Examining the ownership structure of respondents also reveals that publicly owned companies place greater emphasis on the use of formal risk appetite statements when compared to privately owned (68%), mutual (55%) and state-owned (43%) companies.
Shareholders’ requirements for increased transparency around risk management practices might impose greater pressure on these public companies compared with their peers. Yet a significant proportion of privately owned and mutual companies either have a risk appetite statement or plan to adopt one in the short term, suggesting that regardless of structure companies are increasingly aware of the value of a formal risk appetite statement.
Since the pilot survey in Europe in 2013, the influence of risk appetite within insurance companies has been growing. For example if focusing on Europe, the number of companies having a risk appetite statement in place has increased from 56% to 71%. Many companies may be driven into taking action by external forces; being under the regulatory spotlight with new regimes such as Solvency II forces companies into change, as does pressure from stakeholders for more clarity around performance targets. That said, there is a growing consensus within the industry that strong risk management can lead to an alignment of interests at all levels within an organisation and ultimately lead to better decision making for the group.
Again, this can be explained by a greater demand for internal governance as company size increases. Larger companies tend to have a more sophisticated Enterprise Risk Management (ERM) framework in place which ensures they formalise their risk management targets. Some of the respondents in this grouping may even be deemed Systemically Important Financial Institutions (SIFIs), whose failure would impact the global economy. The risk management strategies of these companies will be under even greater scrutiny from external stakeholders.

7 Global Reinsurance and Risk Appetite Report 2016
Application of Risk Appetite
The presence of a risk appetite statement does not necessarily indicate it is being applied as part of a company’s strategic direction.
Reinsurance is one of the most powerful risk management tools available and therefore the use of risk appetite within reinsurance decision-making is a good indicator of how influential these statements are within an organisation.
7 Global Reinsurance and Risk Appetite Report 2016

March 2016 8
With 87% of respondents confirming that they do use risk appetite to optimise their reinsurance, it is clear how reinsurance purchasing has evolved. Companies are increasingly likely to evaluate the full economic impact of their reinsurance purchase, rather than making solely a price-based decision. Reinsurance buyers and brokers are dedicating more time and resource towards financial modelling tools which allow these parties to evaluate reinsurance against predetermined Key Performance Indicators (KPIs).
The use of risk appetite in the reinsurance decision making process may indicate influence from stakeholders higher up the corporate structure. The survey asked respondents
Linking Risk Appetite to Reinsurance
Application and Influence
Companies are unanimously positive about their ability to apply risk appetite to reinsurance, regardless of region, size or ownership structure
The vast majority (87%) of companies with a formal risk appetite statement use this to drive their reinsurance decisions, with purchasing power increasingly moving to the centre.
at what level in the organisation is the risk appetite statement used to optimise reinsurance, with 61% of companies confirming that these decisions are being made from a group perspective. 35%, a smaller but significant subset, use it at an operational unit level.
Figure 3: Is risk appetite being used to influence reinsurance decisions?% of companies with a Risk Appetite statement who responded to the question ‘Is your Group Risk appetite statement used to optimize reinsurance?’ split by region
Yes Not Yet No
APMETA 91.84% 6.12% 2.04%
Europe 82.61% 13.04% 4.35%
North America 92.86% 0.00% 7.14%
LAC 75.00% 18.75% 6.25%
Worldwide 86.81% 9.72% 3.47%
The observed patterns are indicative of how companies are required to operate within an Enterprise Risk Management (ERM) framework. The enhanced scrutiny upon decision making favours a top-down approach with a robust application. A fundamental risk management decision such as reinsurance purchase therefore has increased importance at the highest level of an organisation.
APMETA Europe North America LAC Worldwide0%
20%
40%
60%
80%
69
3127
65
43
22
64
32
11
19
25
44
61
35
24
�Group level �Operational level �Business level
Figure 4: How is risk appetite being used to influence reinsurance decisions by geography? % of companies who responded to the question ‘How is risk appetite used in reinsurance decisions?’ split by region

9 Global Reinsurance and Risk Appetite Report 2016
There are exceptions to this however. These trends are common across all geographic subsets except for LAC where more respondents report that decisions are made at business level perspective rather than by group (44% vs. 19%). This may be driven by the fact that there are a greater number of independent local offices in this region amongst the respondents, which may prefer making decisions at a business level.
When investigating who within the organisation is involved in the final reinsurance purchasing decision, top executives were named by 86% of participants. That said, although usually holding final authority, they are rarely alone in the process. The responses indicate involvement from variety of disciplines, reflecting both the range of skillsets required and the strategic importance of the decision. Risk management, Finance, Underwriting and Actuarial are all involved to some extent, further supporting the theory that reinsurance decision making is now a group concern.
Benchmarking
Over two-thirds of respondents use benchmarking when considering their own reinsurance, with this increasing to almost 80% in APMETA
Despite the growing influence of risk appetite in reinsurance, companies do still acknowledge wider market trends when considering their options. Of the insurers surveyed, 68% admitted to having at least a small interest in the risk appetite and reinsurance strategy of their peers. In a large systemic event, shareholders may accept companies making a loss providing these losses are in line with the market. A worse than expected net position post-event could have negative implications internally and externally, so companies strive to keep at least small interest in the reinsurance purchased by their peers.
This approach is most prevalent in APMETA (78%) and North America (76%) where benchmarking is an important part of the reinsurance review process. It also appears that as company size increases, benchmarking becomes more important, with 85% of very large companies reporting to have at least a small interest in the programmes of their peers.
Figure 5: The relevance of benchmarking by size % of companies who responded to the question ‘Do you consider the reinsurance programme of your peers when deciding on your risk appetite and/or reinsurance structure?’
Small Medium Large V. Large0%
20%
40%
60%
80%
100%
38
45
17
44
49
7
25
61
14
15
70
15
�Yes �A little �Not at all
Willis Re Case Study: aligning reinsurance with group risk appetite
Company A made the decision to use a captive to internally manage risk and to purchase reinsurance centrally on behalf of the group. Their goals were:
� Use their scale and ability to diversify risk internally to retain more profit
� Have the ability to manage total retained risk in line with the group risk appetite
� Maintain existing levels of protection for each of the individual underwriting units
Whilst the client’s group risk appetite statement clearly determined the amount of risk they were willing to retain net of reinsurance, there was a need to test which mechanism of risk transfer was to be used to ensure the reinsurance purchase was aligned with the group profitability targets.
Through financial modelling of the client’s portfolio it emerged that the biggest risk to the captive was multiple lines of business being adversely affected in the same calendar year. After testing numerous structure options against a pre-determined set of KPIs, a multiline reinsurance cover was structured and successfully executed. This gave the group the greatest probability of achieving their profitability and risk management goals, while ensuring the total losses will not exceed their stated appetite.

Measuring Reinsurance Effectiveness
With such a broad range of stakeholders involved, it is inevitable that there will be a wide set of metrics used to evaluate reinsurance. Typically a balance needs to be found between capital and earnings protection, finding a programme which maximises the benefit achieved for one of these without sacrificing the other.
The 2013 pilot survey in Europe highlighted the importance of KPIs to measure reinsurance effectiveness. The 2015 survey expands on this by providing a worldwide perspective and offering a more granular insight into quantitative metrics used for both capital and earnings protection.
March 2016 10

11 Global Reinsurance and Risk Appetite Report 2016
77% of companies chose a traditional earnings measure (loss ratio, combined ratio or underwriting profit) as the most important metric when evaluating reinsurance.
Focus on Earnings
Earnings Protection
Combined ratio is still the top priority but the use of capital based earnings metrics is increasing
Larger companies favour return on equity as their most important earnings metric
As expected, the significant majority of respondents (77%) continue to prioritise traditional earnings measures when making reinsurance decisions. However, the use of capital based metrics, such as return on equity (RoE) or return on economic capital (RoEC) is increasing, with 23% of respondents selecting one of these as the most important earnings metric. Globally, combined ratio is the top priority followed by loss ratio and underwriting profit, although there is only a marginal difference between the three. This trend is consistent across geographies, with the percentage of companies using traditional measures increasing further to 87% for LAC.
In contrast to the global average, over 50% of companies writing more than $5bn of premium use a capital based earnings metric (return on economic capital or return on equity) when making reinsurance decisions.
Companies of this scale are more likely to have the resource and sophistication of modelling needed to calculate these measures. Indeed, two-thirds of the companies selecting return on economic capital as their most important earnings measure have an internal economic capital model. This requires a significant level of investment which causes stakeholders to place a greater emphasis on risk adjusted performance (i.e. return on capital based metrics) when making reinsurance decisions.
Despite their unique ownership structure, mutuals are just as likely to use traditional metrics as public, private and state-owned companies. Among more than 40 mutual insurers surveyed just 17% class return on economic capital as their most important metric, with the majority preferring to use combined ratio, loss ratio or underwriting profit.
Figure 6: Most important earnings measure when considering reinsurance % of companies who responded to the question ‘Which of the following earnings measures is the most important to your reinsurance decisions?” ‘Which of the following earnings measures is the most important to your reinsurance decisions?’
�Underwriting Profit
�Combined Ratio
�Loss Ratio
�Return on Economic Capital
�Return on Equity
�Other Earnings Measure
28%26%
11%
5%42%
11%5%
23%20%
15%
9%
6%
Very LargeCompanies
All Respondents
March 2016 12
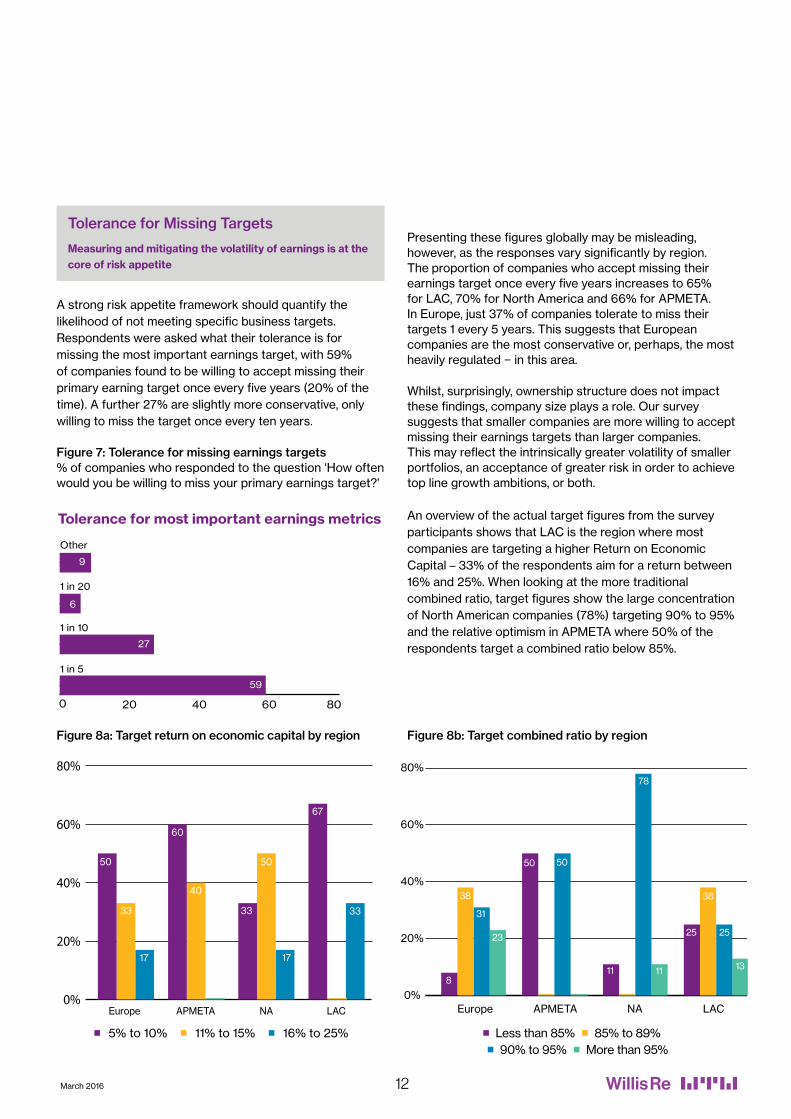
A strong risk appetite framework should quantify the likelihood of not meeting specific business targets. Respondents were asked what their tolerance is for missing the most important earnings target, with 59% of companies found to be willing to accept missing their primary earning target once every five years (20% of the time). A further 27% are slightly more conservative, only willing to miss the target once every ten years.
Figure 7: Tolerance for missing earnings targets % of companies who responded to the question ‘How often would you be willing to miss your primary earnings target?’
0 20 40 60 80
Other
1 in 20
1 in 10
1 in 5
Tolerance for most important earnings metrics
59
6
9
27
Tolerance for Missing Targets
Measuring and mitigating the volatility of earnings is at the core of risk appetite
Presenting these figures globally may be misleading, however, as the responses vary significantly by region. The proportion of companies who accept missing their earnings target once every five years increases to 65% for LAC, 70% for North America and 66% for APMETA. In Europe, just 37% of companies tolerate to miss their targets 1 every 5 years. This suggests that European companies are the most conservative or, perhaps, the most heavily regulated − in this area.
Whilst, surprisingly, ownership structure does not impact these findings, company size plays a role. Our survey suggests that smaller companies are more willing to accept missing their earnings targets than larger companies. This may reflect the intrinsically greater volatility of smaller portfolios, an acceptance of greater risk in order to achieve top line growth ambitions, or both.
An overview of the actual target figures from the survey participants shows that LAC is the region where most companies are targeting a higher Return on Economic Capital – 33% of the respondents aim for a return between 16% and 25%. When looking at the more traditional combined ratio, target figures show the large concentration of North American companies (78%) targeting 90% to 95% and the relative optimism in APMETA where 50% of the respondents target a combined ratio below 85%.
Europe APMETA NA LAC0%
20%
40%
60%
80%
50
33
60
40
33
17
67
33
50
17
Europe APMETA NA LAC0%
20%
40%
60%
80%
8
38
31
23
50 50
11 11
25
38
25
13
78
�5% to 10% �11% to 15% �16% to 25% �Less than 85% �85% to 89%
�90% to 95% �More than 95%
Figure 8a: Target return on economic capital by region Figure 8b: Target combined ratio by region

13 Global Reinsurance and Risk Appetite Report 2016
43% of respondents identify regulatory capital as the most important capital measure driving reinsurance decision making. Regulators across the world require that insurance companies hold capital to protect policyholder interests. In jurisdictions where regulatory capital requirements exceed those of rating agencies or internal models, satisfying regulatory metrics also satisfies other stakeholders.
Focus on Capital
Regulators vs. Rating Agencies
Regulatory capital is the most important capital metric driving reinsurance decisions; but economic, catastrophe and rating agency capital are also well represented
Just under half of respondents deemed regulatory capital as their primary driver to measure the capital efficiency of their reinsurance.
On the other hand, in North America respondents were as likely to focus on Rating Agency capital as on Regulatory capital, suggesting that the rating agencies have a greater influence in this region. A downgrade in rating can lead to serious commercial consequences, even if regulatory capital requirements are still met.
Comparatively, only 2% of European companies reported rating agency capital as their dominant capital driver. Instead greater focus is placed on regulatory capital (43%) and economic capital (30%).The implementation of Solvency II, and the resultant development of internal capital models, is a plausible explanation for this. With the regime now in force, European respondents will make meeting these requirements a priority in the short term. 50% of European companies surveyed have an internal economic capital model, which coincides with the high proportion of respondents who use economic capital as their most important metric.
APMETA Europe North AmericaLAC0%
10%
20%
30%
40%
50%
60%
56
18
11
16
43
2
30
23
2
38
19
23
19
33
29
24
12
2
Figure 9: Most Important capital measure when considering reinsurance % of companies who responded to the question ‘Which of the following capital measures is the most important in reinsurance decision making?’
Companies based in North America (29%) and APMETA (18%) place a significantly greater emphasis on rating agency capital than their peers in Europe (2%)
�Regulatory Capital �Rating Agency Capital �Economic Capital �Catastrophe Risk Capital �Other (please specify)

March 2016 14
Larger companies are both more likely to have an internal capital model, and more likely to be focussed on economic rather than regulatory capital, as compared with the rest of the sample.
Capital Buffer
Two-thirds of respondents hold a safety margin above their most important target capital measure
About two-thirds of survey respondents choose to hold additional capital, or a ‘capital buffer’, in excess of their targeted amount – with 55% seeking to reach a level as high as 20% over their target level.
A buffer reduces the chance of capital falling below the targeted amount, avoiding the need to raise additional capital at short notice and reducing the chance of action by the rating agency or regulator.
Holding a buffer is more common amongst public companies than any other company type. 82% of these companies are already doing so and another 10% plan to. This might be due to public companies’ pressure to maintain a constant flow of dividends.

15 Global Reinsurance and Risk Appetite Report 2016
Key Takeaways
Adoption of a risk appetite statement is on the rise and it is having a dramatic influence on how reinsurance is being purchased.
A Global Shift in Attitude
It is becoming increasingly common for companies across the world to link their reinsurance decisions to a formalized risk appetite statement. Whilst companies in all territories are doing this, they are at differing stages of development. Regulatory influences are important, with formal risk appetite statements most common in APMETA and Europe; however, with recent changes in regulation we expect the percentage of companies in the Americas with formal statements will continue to expand.
Larger Firms Lead the Way
The existence and usage of a formal risk appetite statement is more common as company size increases. Larger companies tend to have greater resources that they can dedicate to risk management, and are also required to follow stricter internal governance rules compared to their smaller peers.
The most common capital measure also changes depending on the size of the company, with return on economic capital becoming more relevant as size increases.
Public Ownership Demands Greater Transparency
Company ownership structure clearly influences the take-up rate and use of risk appetite statements between Investors in public companies are demanding increased clarity around targets and risk tolerances; these companies are under greater scrutiny than privately held companies and mutuals.
Where Next?
Risk appetite statements are already a key consideration for companies when setting reinsurance strategy. There has been a shift in focus towards risk quantification and management driven both by external parties, such as the regulator and shareholders, and the internal desire to have a clear performance measurement framework.
All of these considerations are placing reinsurance higher on the priority list and changing how it is purchased.
The inescapable conclusion of our research is that a clear risk appetite statement is essential to provide macro-level guidance to underwriting, retention and cession strategies. The relative weighting of components will vary according to stakeholder objectives but achieving an optimal blend of minimal earnings volatility with maximum return on equity requires the experience and expertise of Willis Re, who remain at the forefront of establishing bespoke risk appetite statements and aligned reinsurance structures which underpin your objectives.
Please contact your Willis Re Client Advocate for more details.

Willis Limited, Registered number: 181116 England and Wales.Registered address: 51 Lime Street, London, EC3M 7DQ. A Lloyd’s Broker. Authorised and regulated by the Financial Conduct Authority for its general insurance mediation activities only. 15310/03/16
willistowerswatson.com | www.willisre.com
About Willis Towers WatsonWillis Towers Watson (NASDAQ: WLTW) is a leading global advisory, broking and solutions company that helps clients around the world turn risk into a path for growth. With roots dating to 1828, Willis Towers Watson has 39,000 employees in more than 120 territories. We design and deliver solutions that manage risk, optimize benefits, cultivate talent, and expand the power of capital to protect and strengthen institutions and individuals. Our unique perspective allows us to see the critical intersections between talent, assets and ideas — the dynamic formula that drives business performance. Together, we unlock potential. Learn more at willistowerswatson.com.
© Copyright 2016 Willis Limited / Willis Re Inc. All rights reserved: No part of this publication may be reproduced, disseminated, distributed, stored in a retrieval system, transmitted or otherwise transferred in any form or by any means, whether electronic, mechanical, photocopying, recording, or otherwise, without the permission of Willis Limited / Willis Re Inc. Some information contained in this document may be compiled from third party sources and we do not guarantee and are not responsible for the accuracy of such. This document is for general information only and is not intended to be relied upon. Any action based on or in connection with anything contained herein should be taken only after obtaining specific advice from independent professional advisors of your choice. The views expressed in this document are not necessarily those of Willis Limited / Willis Re Inc., its parent companies, sister companies, subsidiaries or affiliates, Willis Towers Watson PLC and all member companies thereof (hereinafter “Willis Towers Watson”). Willis Towers Watson is not responsible for the accuracy or completeness of the contents herein and expressly disclaims any responsibility or liability for the reader’s application of any of the contents herein to any analysis or other matter, or for any results or conclusions based upon, arising from or in connection with the contents herein, nor do the contents herein guarantee, and should not be construed to guarantee, any particular result or outcome. Willis Towers Watson accepts no responsibility for the content or quality of any third party websites to which we refer.
The contents herein are provided for informational purposes only and do not constitute and should not be construed as professional advice. Any and all examples used herein are for illustrative purposes only, are purely hypothetical in nature, and offered merely to describe concepts or ideas. They are not offered as solutions to produce specific results and are not to be relied upon. The reader is cautioned to consult independent professional advisors of his/her choice and formulate independent conclusions and opinions regarding the subject matter discussed herein. Willis Towers Watson is not responsible for the accuracy or completeness of the contents herein and expressly disclaims any responsibility or liability for the reader’s application of any of the contents herein to any analysis or other matter, nor do the contents herein guarantee, and should not be construed to guarantee, any particular result or outcome