global patterns of terrestrial biological nitrogen (n...
TRANSCRIPT
GLOBAL BIOGEOCHEMICAL CYCLES, VOL. 13, NO 2, PAGES 623-645, JUNE 1999
Global patterns of terrestrial biological nitrogen (N2)
fixation in natural ecosystems
Cory C. Cleveland,t,2 Alan R. Townsend,l,2 David S. Schimel,3 Hank Fisher,3 Robert W. Howarth,4 Lars O. Hedin,4Steven S. Perakis,4 Erika F. Latty,4 Joseph C. Von Fischer,4 Adrien Elseroad,4 and Matt F. Wasson 4
Abstract. Human activities have clearly caused dramatic alterations of the terrestrial nitrogen cycle, and analyses of the extent and effects of such changes are now common in the scientific literature. However, any attempt to evaluate N cycling processes within ecosystems, as well as anthropogenic influences on the N cycle, requires an understanding of the magnitude of inputs via biological nitrogen fixation (BNF). Although there have been many studies addressing the microbiology, physiology, and magnitude ofN fixation at local scales, there.are very few estimates of BNF over large scales. We utilized> 1 00 preexisting published estimates of BNF to generate biome- and global-level estimates of biological N fixation. We also used net primary productivity (NPP) and evapotranspiration (ET) estimates from the Century terrestrial ecosystem model to examine global relationships between these variables and BNF as well as to compare observed and Century-modeled BNF. Our data-based estimates showed a strong positive relationship between ecosystem ET and BNF, and our analyses suggest that while the model's simple relationships for BNF predict broad scale patterns, they do not capture much of the variability or magnitude of published rates. Patterns of BNF were also similar to patterns of ecosystem NPP. Our "best estimate" of potential nitrogen fixation by natural ecosystems is -195 Tg N yr- l , with a range of 100-290 Tg N yr- l . Although these estimates do not account for the decrease in natural N fixation due to cultivation, this would not dramatically alter our estimate, as the greatest reductions in area have occurred in systems characterized by relatively low rates of N fixation (e.g., grasslands). Although our estimate of BNF in natural ecosystems is similar to previously published estimates of terrestrial BNF, we believe that this study provides a more documented, constrained estimate of this important flux.
1. Introduction
In the absence of human influence, two major processes "fix" atmospheric N2 into biologically available forms: lightning [Liaw et aI., 1990; Logan, 1983] and biological nitrogen fixation (BNF). In the pristine biosphere, it is generally believed that nitrogen (N) fixation by terrestrial BNF was roughly an order of magnitude greater than that by lightning [Galloway et al., 1995] and that it was therefore the dominant source of newly fixed N to the landscape. However, in recent decades human activities have caused dramatic alterations of the terrestrial nitrogen cycle, and analyses of the extent and effects of such changes are now common in the scientific literature [e.g., Hedin et aI., 1995; Vitousek, 1994a; Galloway et al., 1995; Townsend et al., 1996; Howarth et al., 1996; Vitousek et at., 1997]. Three of the major
lDepartment of EPO Biology, University of Colorado, Boulder. 2Also at Institute for Arctic and Alpine Research, Boulder, Colorado. 3National Center for Atmospheric Research, Boulder, Colorado. 4Department of Ecology and Systematics, Cornell University, Ithaca,
New York.
Copyright 1999 by the American Geophysical Union
Paper number 1999GB900014 0886-6236/99/1999GB9000 14$12.00
623
anthropogenic changes are the production of nitrogen fertili7:er, widespread cultivation of legumes, and incidental N fixation in internal combustion engines. Vitousek et at. [1997] estimate that these three processes together now more than double the total natural rate of N fixation and highlight this comparison as "the most fundamental human-caused change to the global N cycle."
While it is unquestionable that humans have sharply increased the rate at which atmospheric N2 is fixed into reactive forms, the comparison between anthropogenic sources and BNF is tenuous. Prior estimates of BNF in terrestrial ecosystems range from -40-200 Tg N y(l (1 Tg = 1012 g; [Soderland and Rosswall, 1982; Stedman and Shetter, 1983; Paul and Clark, 1989; Schlesinger, 1991]), which appears relatively constrained; yet the data from which all of these estimates were obtained are difficult to discern as few present a list of data sources for their global number. At best, the global value is broken down into a few very broad components (e.g., forest, grassland and other [Soderlund and Rosswall, 1982]), but such a division averages enormous land areas that contain significant variation in both BNF data sets and biome types. These poorly documented, spatially unresolved estimates of.. BNF represent a sharp contrast to the estimates of anthropogenic sources of N, which can be derived for much of the developed world by county, state, and/or country [e.g.,

624 CLEVELAND ill AL.: GLOBAL PATfERNS OF1ERRES1RIAL N FIXATION
Matthews, 1996; Boden et aI., 1995]. As suggested by Hedin et al. [1995], estimates of the degree to which the global N cycle has changed depend on a good understanding of baseline conditions (i.e., conditions prior to human influences). A primary determinant of that baseline is the rate of biological N fixation; therefore a more robust estimate of this value at both global and biome-specific scales is critically needed.
While changes in the N cycle can be summarized in global terms, reactive and biologically available forms of nitrogen do not truly cycle globally. Rather, their transport occurs over distances of tens to many hundreds of kilometers [Logan, 1983; Vitousek, 1994al Consequently, alteration of the global nitrogen cycle results from changes in cycling at the scale of large regions [Townsend et aI., 1996; Asner et al., 1997]. At the global scale, N fixation may have roughly doubled; however, in heavily industrial and/or agricultural regions of the world anthropogenic sources of nitrogen may be orders of magnitude greater than the natural inputs [Chameides et aI., 1994; Howarth et aI., 1996], while in more pristine regions natural processes may still dominate [Hedin et al., 1995]. Thus the focus on changes in the N cycle must be at the regional scale, and such analyses will depend on estimates of BNF that are regionally specific.
Our main objectives in this study were to assemble a global database of BNF in terrestrial biomes derived from a compilation of all available data, which was linked to the spatial scale of currently available databases on land cover and land use [Schimel et aI., 1997]. We present that database here, along with tables detailing the original sources of all the data from which it is derived, and discuss the difficulties in translating plot- and laboratory-level BNF data to biome-scale averages. We also use estimates of net primary productivity (NPP) and evapotranspiration (ET) from the Century ecosystem model [Parton et aI., 1987; Schimel et aI., 1997] to examine the relationships between those variables and BNF. Models such as Century have proven to be a valuable tool in largescale analyses of terrestrial ecosystems and their response to global environmental change, but none of the major simulation models have robust, predictive relationships addressing N fixation and its response to a changing N cycle [Vitousek and Field, 1999]. Century predicts BNF from crude relationships with climate; we also use the database presented here to evaluate the general accuracy of this approach at the scale of large regions.
2. Methods
2.1. Symbiotic versus Nonsymbiotic N Fixation
Symbiotic N fixation provides the dominant input of nitrogen in many ecosystems, although it is probably most important during early successional stages· (especially in temperate ecosystems), with inputs tending to decrease as succession proceeds [Gutschick, 1981, 1987]. The majority of symbiotic BNF occurs via a root-nodule symbiosis. Root nodules are structures on roots inhabited by specific N fixing microorganisms [Akkermans and Houwers, 1983]. In this relationship, the N fixer is maintained by the plant and uses the plant as a carbon source, while excreting fixed nitrogen for the benefit of the plant. Nonsymbiotic nitrogen fixation
includes fixation by the true free-living N2 fixers, as well as by autotrophic and heterotrophic organisms not in direct symbioses with vascular plants, including cyanobacteria symbiotic in lichens, bryophytes, or associative N2 fixing systems. In addition, it is worth noting that many filamentous actinomycetes (e.g., Frankia) can fix nitrogen as free-living microorganisms or in symbiosis with a number of nonleguminous vascular species.
2.2. Nitrogen Fixation Rate Estimates: Review of Methodology
2.2.1. Nitrogen accumulation method. The simplest method of estimating BNF, the nitrogen accumulation method, involves comparing the total nitrogen content of an ecosystem at two points in time. Increases in N in all system components (soil and vegetation) or differences in N accumulation between nitrogen fixing and nonfixing species over time are measured to determine nitrogen fixation rates [Warembourg, 1993]. A variation of this method involves using a sequence of plots at different locations to approximate the accretion that would occur in a single site over time [Roskowski, 1980]. However, estimating the actual gain of nitrogen from BNF using this method is difficult because it does not account for other inputs (e.g., atmospheric deposition) or losses of nitrogen from the system (e.g., via N leaching, denitrification). In some systems, mass balance studies have been used to determine nitrogen accumulation [Likens et aI., 1977; Swank and Waide, 1987). 'However, estimates of BNF using this approach are relatively difficult to obtain, as they require a precise quantification of all N inputs and outputs. Mass balance estimates of N fixation have been used successfully in temperate forest ecosystems in the United States and Europe [Silvester, 1983], but this approach has not been widely used in other ecosystems.
2.2.2. Acetylene reduction method. The most common method used to determine BNF rates is the acetylene reduction assay (ARA). This method relies on the fact that the nitrogenase enzyme, the enzyme primarily responsible for N fixation, has a high preference for acetylene (C2H2) over N2,
and the product of acetylene reduction (ethylene, C2H4) is easy to measure. Samples are amended with C2H2 and incubated; a gas sample is removed; and ethylene (C2H4) concentrations are evaluated using gas chromatography. A rate of N fixation is calculated by dividing the rate of C2H2 reduction by a factor that accounts for the greater electron requirement of N fixation per mole of atmospheric nitrogen [Binkley et aI., 1994). In most studies, a 3: 1 (C2H2:N2) conversion ratio is used, representing the theoretical stoichiometric relationship between C2H2 reduction and N fixation [Roskowski, 1981; Hardy et aI., 1968]. However, there is evidence that experimental ratios may vary from the theoretical 3: 1 ratio. Therefore, literature estimates that were not converted using a 3: I ratio are also included and reflect the actual con version ratio used in these studies [e.g. Vitousek, 1994b). A detailed explanation of the acetylene reduction method is provided by Hardy et at. [1968, 1973).
2.2.3. 15N methods. Other techniques to estimate N fixation rates utilize the stable isotope IsN. The 15N natural abundance method [Shearer and Kohl, 1986] uses differences in naturally occurring 15N signatures of plants reliant on soil N

CLEVELAND ill AL.: GLOBAL PATTERNS OF 1ERRES1RIAL N AXATION 625
2 3 4 5 6 7 8 9 10 1 1
D B D D 12 13 14 15 16 17 18 19 20 21 22 23
Plate 1. Map of the 23 major ecosystems used in the current study and classified under the IGBP GAIM Potsdam model intercomparison. Color numbers correspond to the ecosystem types in Table I.
relative to plants which utilize N derived solely from atmospheric N2 through fixation. The 15N abundance of fixing plants, reference plants, and symbiotic plants grown in the absence of inorganic N can be used to provide an integrated estimate of symbiotic N fixation in the field.
The 15N enrichment technique entails enriching the soil with 15N [Silvester, 1983]; over time, 15N:14N ratios in N fixing plants will be lower relative to nonfixing species, and these ratios can be used to calculate N2 derived from the atmosphere. In some cases, the natural ratio of 15N:14N in soil is sufficiently different from that of the atmosphere, thus enabling a calculation of N fixation by comparing ratios of N fixing species and nonfixing species. A detailed description of 15N methods of estimating N fixation is provided by Warembourg [1993].
2.3. Statistical Analysis and Calculations
We estimated current rates of terrestrial biological ni tro gen fixation by conducting a thorough review of the literature.
Much of our current knowledge of nitrogen fixation is derived from work in agricultural systems, and large gaps still exist in our knowledge of the quantitative, long-term importance of the process in many natural ecosystems [Boring et ai., 1988]. The majority of studies on rates of N fixation in natural systems available in the literature are from North America, with fewer contributions from Europe and Australia. Estimates of N fixation from Asian, South American, and African ecosystems are extremely rare.
Our estimates of N fixation are the means of the available published estimates of both symbiotic and asymbiotic components of N fixation measured for each ecosystem, using the ecosystem classification from Schimel et ai. [1996] developed for the International Geosphere-Biosphere Programme (IGBP) Global Analysis and Modeling (GAIM) Potsdam model intercomparison (Plate I). Attributes of each ecosystem are depicted in Table I. In some cases we applied an arithmetic mean to represent a "component average," and in others we applied a geometric mean [Parkin and Robinson, 1993], depending on the distribution of the published data.

626 aEVELAND Ef AL.: GLOBAL PATfERNS OF1ERRESTRIAL N FIXATION
Table 1. _Average Net Primary Productivity, Evapotranspiration, and Mean Annual Temperature by Ecosystem Type.
Color Potsdam Vegetation Average NPP, Average ET, Mean Annual Number . Type! g C m-2 yr-l cm yr-l Temperature, °C
1 polar desert/alpine tundra 144 17 -2 2 moist tundra 197 18 -8 3 boreal borest 271 45 -2 4 boreal woodland 216 32 -6 5 temperate mixed forest 478 78 11 6 temperate coniferous forest 646 53 10 7 temperate deciduous forest 484 66 9 8 talVmedium grassland 304 59 10 9 short grassland 130 34 8 10 tropical savanna 180 89 24 11 arid shrubland 77 23 16 12 tropical evergreen forest (rain forest) 945 136 25 13 xeromorphic forest 187 60 21 14 tropical forested floodplain 1123 148 26 15 desert 31 7 24 16 tropical non-forested floodplain 542 114 26 17 temperate forested floodplain 508 58 9 18 temperate non-forested floodplain 241 50 9 19 wet savanna 411 115 22 20 temperate savanna 194 43 11 21 temperate broadleafed evergreen forest 702 84 17 22 mediterranean shrubland 151 37 17 23 tropical deciduous forest 395 104 24
'Color numbers correspond to those depicted in Plate 1. !The ecosystem classification was developed for the IGBP GAIM Potsdam model intercomparison [Schimel et aI.,
1996].
Specifically, in cases where the distribution of the published N fixation rates were not symmetric (Le., the mean and the median had vastly different values), a geometric mean was applied to temper extremely high rates of fixation which would otherwise inflate an arithmetic mean [Parkin and Robinson, 1993]. In cases where the distribution of rate frequencies of N fixation were symmetric with no obvious outliers, the arithmetic mean was used to represent the N fixation rate.
More than 75% of the published papers used in this study utilized the ARA method to determine nitrogen fixation rates. In most cases, rates of N fixation in the literature were expressed in molar units (C2H2 gol dOl) and were converted by the original investigators to more standard units (g N m-2 yr-l; kg N ha-l yr-l) to account for growing season length within each ecosystem. Owing to the variability in other conversion factors used in the published studies (e.g., depth of active soil nitrogen fixation), we made no attempt to normalize the published estimates, but rather assumed that "site specific" conversion factors used by the authors were accurately assessed and applied to derive each estimate. Estimates of N fixation obtained using other methods were not normalized or rescaled in any way but were assumed to accurately reflect the individual attributes of the study site being investigated.
Estimates of N fixation that did not explicitly report the contribution of symbiotic and not symbiotic fixers, but rather only reported a total N fixation value at a site were not used to generate our "total" estimates of N fixation. However, where these estimates are available, they are included in the tables for comparison to our total estimate. It should also be emphasized
that N fixation rates reported in the tables are extracted from plot-scale studies of either symbiotic or nonsymbiotic N fixation and as such may not represent N fixation rates for an entire ecosystem. In addition, symbiotic N fixation estimates reported in the tables represent temporally averaged contributions of symbiotic fixers, although there is clear evidence from many ecosystems that N fixation rates vary with successional status and ecosystem age [Vitousek, 1994; Blundon and Dale, 1990; Boring and Swank, 1984; Gorham et at., 1979].
For each biome, we provide three estimates of N fixation which differ only in the possible contribution of symbiotic fixation to the total estimate. We refer to these as our "conservative," "central," and "upper-bound" estimates. This was done to account for the heterogeneous distribution of symbiotic nitrogen fixers (e.g., leguminous species) over large landscapes [Johnson and Mayeux, 1990; Piccolo et aI., 1994]0 In this study, we located a total of 46 estimates of symbiotic N fixation in natural ecosystems. Of these, 11 studies (24%) included estimates of legume cover at the study sites from which rates of N fixation were obtained. For ecosystems in which some literature rates of symbiotic N fixation were associated with published estimates of N fixer coverage, a coverage is calculated that represents the average of all cover estimates for that ecosystem. We then assume that this coverage is associated with our calculated rate of N fixation. Unless otherwise indicated, "conservative" and "upper-bound" estimates are +/- 213 of the empirically derived coverage value. This range was chosen because it captures +/-

CLEVELAND ill AL.: GLOBALPATIERNS OF1ERRES1RIAL N FIXATION 627
2 standard errors (SE) from the geomean of all coverage estimates (geomean = 15.5; SE = 5.7). Since several coverage estimates for individual ecosystems were <10%, using a range of +1- 10% in all cases would produce negative values. Thus we scaled the range to the magnitude of the coverage estimate by using +1- 2/3.
For ecosystems that did not include any coverage estimates of N-fixing species, we calculated an average N fixation rate and assumed that this was associated with an average coverage of 15%, which represents the geometric mean of all available coverage estimates from all ecosystems combined (n= 11). For consistency, "conservative" and "upper-bound" estimates are based on a hypthetical range of coverages +1- 213 of this value. Each estimate of N fixation also includes a value that represents nonsymbiotic fixation, and we assume that this value does not vary within individual systems (Le. coverage of non symbiotic fixers over the landscape is relatively homogeneous). Although this may be unrealistic, for our purposes we believe it is reasonable considering the low contribution of nonsymbiotic N fixation relative to symbiotic N fixation in systems where both components have been studied.
2.4. Modeling Methods
Data on fluxes of and controls over BNF in natural ecosystems are fairly sparse, and data that give ecosystemaverage fluxes (as opposed to data from stands containing symbiotic fixers or on a species basis) are even more rare. In addition, we had no site-level data on potential correlates and controls of BNF across sites from the N fixation literature. Therefore we compared our compilation of measurements to estimates of BNF (symbiotic plus nonsymbiotic) generated by a global model of terrestrial biogeochemistry, the Century model, and we used estimates of NPP and ET from this model in analyzing the literature results [Ojima et al., 1994; Schimel e t al., 1997; Parton et al., 1987]. Century, to our knowledge, is the only ecosystem model that explicitly computes the principal input and loss fluxes for N. A full description of Century is found in the literature by Parton et al. [1987, 1993] and Schimel et al. [1996, 1997], and is available at (http://www.nrel.colostate.eduIPROGRAMSIMODELING/CEN
TURY/CENTURY.html). In Century, N fixation is computed using very simple routines, reflecting the sparse data and low degree of synthesis in BNF studies. The first fixation flux is computed by a simple regression on evapotranspiration (Nfix = 0.006 x (ET - 40». This allows high fixation in moist, warm regions or periods and provides the bulk of N inputs in rain forest ecosystems. This relationship is not derived from any thorough, mechanistic understanding but captures phenomenologically the assumption that most observations of high rates of BNF are from humid settings with relatively high evapotranspiration [e.g., Boring and Swank, 1988]. The second fixation flux built into Century is estimated by computing a potential rate of fixation, using ecosystemspecific maximum rates of N fixation per unit NPP (based 0 n literature values), multiplied by the amount of NPP. Thus, in Century, as NPP increases, potential N fixation increases, leading to a codependency with carbon uptake. However, in this second equation, N fixation decreases as N available from other sources increases [Vitousek and Howarth, 1991; Ojima et al., 1994; Eisele et al., 1989], reflecting the energetic expense of BNF relative to root uptake. This second equation provides substantial N inputs in frequently burned savanna and shrublandlchaparral ecosystems but fails in rain forests where large amounts of N circulate, causing this equation to reduce N fixation. The two equations are added together in Century to compute the BNF flux.
3. Results and Discussion
3.1. Alpine Tundra (1) and Moist Tundra (2)
The low-temperature regimes of high-latitude/high-altitude systems reduce biological processes associated with N fixation compared with rates in temperate ecosystems [Van Cleve and Alexander, 1981]. Evidence suggests that free-living bacteria (e.g., Nostoc commune, Gleotrichia spp.) are the dominant N fixing organisms in tundra ecosystems [Solheim et ai., 1996; Lennihan et ai., 1994; Chapin et ai., 1990]. Rates are extremely variable, ranging from 0040 to 3.0 kg N ha'l yr,l (Table 2a). In addition, cyanobacteria living as cryptogamic crusts or in association with bryophytes may contribute to N fixation [Solheim, 1996].
Table 2a. Summary of Literature-Derived Estimates of Symbiotic and Nonsymbiotic N Fixation in Moist Tundra (1) and Alpine Tundra (2) Ecosystems
Ecosystem Vegetation N Fixation Rate, g N m,2 yr·1 Method Source
Location Type Symbiotic Nonsymbiotic (% Cover)
Marion Island, Antarctica mire/grassland 0.042 C2Hz Smith, [1988] Truelove Island, Canada sedge/moss meadows 0.130 CzHz Babb and Whitfield, [1977] Signy Island, Antarctica mire/grassland 0.240 C2Hz Christie, [1987] Stordalen, Sweden mire 0.200 C2Hz Rosswall and Granhall, [1980] Truelove Island, Canada sedge/moss meadows 0.300 CzHz Chapin et al .. [1990] Alaska, U. S. wet meadow tundra 0.070 unspecified Van Cleve and Alexander. [1981] Alexandra Fjord, Sweden arctic sedge meadow 0.080 CZH2 Henry and Svoboda, [1986] Niwot Ridge, CO (U. S.) sedge/moss meadows 0.490 (9) 15N Bowman et at., [1996]

628 ClEVELAND Ef AL.: GLOBALPATIERNS OFlERRES1RIAL N FIXATION
Table 2b. Data-Based Estimates of N Fixation in Moist Tundra (1) and Alpine Tundra (2) Ecosystems
N Fixation Rate, g N m·2 yr! NFixed, NFixed,
Symbiotic Nonsymbiotic g N m-2 yr-! kg N ha-! yr-!
Arithmetic mean 0.490 0.152 Standard deviation 0.097
Geometric mean 0.123 Variance 0.009 3% cover 0.163 0.123 9% cover 0.490 0.123
15% cover 0.817 0.123
In local regions, symbiotic N fixation may be important, however actual data-based estimates are extremely rare. Bowman [1996] found that Trifolium was an important source ofN fixation in alpine tundra regions, contributing 5.0 kg N ha'! yr-!, based on Trifolium coverage of -9% (Table 2a). However Trifolium abundance in tundra ecosystems is highly variable, ranging from 2 to 20% (May and Webber, 1982). Therefore, based on published data, our best estimate of N fixation by symbiotic N fixers is between 1.6 and 8.2 kg ha'! yr-!, and total nitrogen input via biological fixation ranges from 2.8 to 9.4 kg N ha-! yr·! (Table 2b). This compares to inputs of 0.3-2.5 kg N ha·! yr"! in precipitation in many arctic sites [Van Cleve and Alexander, 1981]. Thus, in some sites, N fixation may provide the dominant N input, while, in others, the dominant source of N may be precipitation. In any case, N inputs into tundra ecosystems are consistently low relative to many other systems.
0.286 2.86 0.613 6.13 0.940 9.40
3.2. Boreal Forests (3) and Boreal Woodlands (4)
In boreal forest and boreal woodland ecosystems, the majority of nitrogen accretion through BNF is contributed by heterotrophic cyanobacteria, either free-living or symbiotic in lichens, or in association with bryophytes [Alexander and Billington, 1986; Weber and Van Cleve, 1981; Hendrickson, 1990]. There are also some N-fixing higher plants in northern areas such as Alnus spp. and Dryas spp., as well as a number of indigenous legumes, but these are generally not quantitatively important in true arctic regions or in taiga [Alexander and Billington, 1986]. Despite the enormous extent of boreal forest systems, previously measured rates of N fixation from different regions are consistently very low (Table 3a). Nitrogen additions in precipitation are also consistently low, owing to the relative isolation of these systems from areas of industrial activity [Van Cleve and Alexander, 1981].
Table 3a. Summary of Literature-Derived Estimates of Symbiotic and Nonsymbiotic N Fixation in Boreal Forest (3) and Boreal Woodland (4) Ecosystems
Ecosystem Vegetation N Fixation Rate, g N m·2 yr·! Method Source
Location Type Symbiotic (% Cover) Nonsymbiotic Nonsymbiotic Soil Lichens Total
Centra! Sweden spruce/pine 0.093 C2H2 Nohrstedt, [1985] Alaska, V. S. black spruce 0.100 C2H2 Alexander and
Ontario, Canada jack pine Billington, [1986]
0.025 C2H2 Hendrickson,
British Columbia, lodgepole pine [1990]
0.280 C2H2 Hendrickson and Canada Burgess, [1989] British Columbia, firslbryophytesl 0.030 (11) 0.030 0.05 C2H2 Blundonand Canada lichens Dale, [1990] Vmea, Sweden pine forest 0.10 C2H2 Huss-Danell,
Hardangervidda, birch forest unspecified [1976]
unspecified unspecified 0.165' unspecified Van Cleve and Norway Alexander, [1981] Hardangervidda, lichen heath unspecified unspecified unspecified 0.056' unspecified Van Cleve and Norway Alexander, [1981] Fairbanks, Alaska spruce forest unspecified unspecified unspecified 0.007' unspecified Van Cleve and (V. S.) Alexander, [1981] Kevo, Finland pine forest unspecified unspecified unspecified 0.350' unspecified Van Cleve and
Kevo, Finland birch forest unspecified unspecified Alexander, [1981]
unspecified 0.139' unspecified Van Cleve and Alexander, [1981]
'Total N fixation estimates reported in the literature, and provided for comparison only.

CLEVELANDEfAL.:GLOBALPATIERNSOF1ERRES1RIALNFIXATION 629
Table 3b. Data-Based Estimates of N Fixation in Boreal Forest (3) and Boreal Woodland (4) Ecosystems
N Fixation Rate g N m-2 yr-I NFixed, NFixed,
Symbiotic Nonsymbiotic Nonsymbiotic Total g N m·2 yr-I kg N ha-I yr- I
Soil Lichens
Arithmetic mean 0.030 0.106 0.075 0.150' 0.150' 1.50' Standard deviation 0.103 0.035 0.132'
Geometric mean 0.072 0.071 0.079' 0.079' 0.79' Variance 0.011 0.001 0.017' 4% cover 0.011 0.072 0.075 0.158 0.158 1.58
11% cover 0.030 0.072 0_075 0.177 0.177 1.77 18% cover 0.049 0.072 0.075 0.196 0.196 1.96
'Total N fixation estimates reported in the literature, and provided for comparison only.
We estimate that BNF in boreal forest ecosystems contributes between 1.5 and 2.0 kg N ha·1 yr-I (Table 3b). This rate is similar to total nitrogen exports in rivers from undisturbed sites in eastern Canada (0.4-1.0 kg N ha- I y(l, with a median value of 0.8 kg N ha- I yr- I [Clair et al., 1994]), suggesting that our estimate is reasonable. It is likely that cold temperatures and low precipitation during the growing season restricts biological activity in high latitude systems, thus contributing to the observed low N inputs in boreal ecosystems [Alexander, 1981].
3.3. Temperate Mixed Forests (5), Temperate Coniferous Forests (6), Temperate Deciduous Forests (7), and Temperate Forested Floodplains (17)
Nitrogen fixation in temperate forests is fairly well studied, owing to the fact that primary productivity in temperate ecosystems is thought to be N limited, [Vitousek and Howarth, 1991] and because of the abundance of research institutions located in close proximity to temperate forests. Current data do not show substantial differences in rates of N fixation between coniferous and deciduous forests [Boring et at., 1988], and therefore we have grouped temperate deciduous, temperate coniferous, and temperate mixed forests into one group (temperate forests).
Both symbiotic and asymbiotic forms of N fixation are important in temperate forests. However, published rates of N fixation by overstory woody plants (e.g., Alnus incana, Robinia pseudocacacia) and by understory legumes (e.g., Lupinus spp.) overestimate the average for all forests, since these species are abundant in only a small percentage of temperate forests or are prominent only in early successional forests [Faheyet-al., 1985; Boring and Swank, 1984]. When symbiotic N fixing woody plants are present in early successional forests, rates of N fixation in temperate forests can be quite high relative to other potential sources of N fixation in temperate forests. Rates of N fixation estimated from chronosequence studies range from 33.0 to 150.0 kg N ha- I yrol in pure stands of these species, on the basis of extremely dense coverages of -60% [Binkley et at., 1994; Boring and Swank, 1984]. However, these species are generally abundant only on clear-felled areas, abandoned pastures, and disturbed roadsides [Boring and Swank, 1984],
all of which are relatively rare over temperate forest ecosystems as a whole. To reflect the scarcity of abandoned lands available for colonization by these species, we calculate N fixation rates by symbiotic overstory species arbitrarily assuming lower coverages of 1, 5, and 10% over these ecosystems, and we suggest that these species fix between 1.08 and 10.83 kg N ha- I yr- I in temperate forested ecosystems.
Rates of N fixation by understory plant genera (e.g., Lupinus, Ceanothus, Myrica, Bossiaea, and Hedysarum) from a diversity of temperate forest ecosystems range widely from 1.0 to 160.0 kg N ha- I y(1 (Table 4a). Reported coverages of these species range from 5 to 20%, and the average from published estimates is 9.8% (Table 4a). Thus we assume a geometric mean rate of 7.3 kg N haol yr- I is distributed over 3, 10, and 17% of the temperate forest landscape to generate rates of N fixation (Table 4a).
The best studied pathway of N fixation in temperate forests is asymbiotic fixation in soils and decaying wood. Several studies have shown rates of asymbiotic nitrogen fixation to increase with accumulations of woody debris [Harvey et al., 1989, Jurgensen et al., 1992] and logging slash [Waide et al., 1988]. However, aside from the relationship with woody debris noted above, there is no clear relationship between asymbiotic nitrogen fixation and forest age across studies [Grant and Binkley, 1987; DiStefano and Gholz, 1989; Roskowski, 1977; Boring et at., 1989]. Therefore we assigned a single mean value 1.48 kg N ha-l yr-l (potential range 1.0 to >25.0 kg N ha-l yr- I ) to characterize rates of asymbiotic nitrogen fixation in temperate forest soils and woody debris. This value represents the sum of geometric means of N fixation in litter (0.3 kg N ha- I yr- I ), soil (0.64 kg N ha- I y(l), and decaying woody debris (0.54 kg N ha- I y(l) (Tables 4a and 4b).
Asymbiotic nitrogen fixation on the bole and in the canopy is perhaps the most poorly studied biological vector of nitrogen inputs to temperate forests. Considerable difficulties exist in both the accurate estimation of rates in the field and in the extrapolation from individual measurements to entire forests [see Sollins et at., 1980]. From Roskowski, [1977], Boring et at. [1988], Sollins et al. [1980], Todd et at. [1978], and Tjepkema [1979], we estimate an average rate of nitrogen fixation in the phyllosphere of 1.8 kg N ha -I yr·l 0.2-2.8 kg N ha- I yr- l ).

0\ W 0
Table 4a. Summary of Literature-Derived Estimates of Symbiotic and Nonsymbiotic N Fixation in Temperate Mixed Forest (5), Temperate Coniferous Forest (6),
Temperate Deciduous Forest (7), Temperate Forested Floodplain (17), and Temperate Broadleafed Evergreen Forest (21) Ecosystems
Ecosystem Location Vegetation Type N Fixation Rate, g N m·2 yr·! Method Source
Symbiotic (%Cover) Nonsymbiotic
Trees Vnderstory Litter Soil Wood Phy llosphere ~ Southeast v. S. mixed-deciduous forest 4.80 (60) N accumulation Boring and Swank, [1984] i Southeast V. S. mixed-deciduous forest 7.50 N accumulation Boring and Swank, [1984] Southeast v. S. mixed-deciduous forest 330 N accumulation Boring and Swank, [1984] Northwest V. S. alder stand 15.00 (NA) C2H2 Binkley et aI., [1994] ~ Northwest v. S. alder stand 4.00 (NA) C2H2 Luken and Fonda, [1983] r Northeast V. S. peat bog 3.50 (NA) unspecified Schwintzer, [1983] Western Australia eucalyptus forest 20400 (NA) C2H2 Adams and Attiwill, [1984] S Central Rocky Mountains, aspen 0.630 (NA) 0.390 C2H2 Skujins et aI., [1987] V.S. ttl Southwest Australia eucalyptus forest 0.793 (5) C2H2 Grove and Malajczuk, [1992] ~ New Zealand pine forest 8.000 (20) N accumulation Baker et al., [1986]
! Canadian Rockies lodgepole pine forest 0.275 (NA) C2H2 Hendrickson and Burgess, [1989]
Southeast V. S. slash pine plantatation 1.060 (8) N accumulation Permar and Fisher, [1983] New Zealand lupin-marram stand 16.000 (NA) N accumulation Gadgi/, [1971] Central Rocky lodgepole pine forest 0.100 (5) 0.030 C2H2 Fahey et al., [1985]
~ Mountains, V. S. Western Australia jarrah forest 0.600 (NA) C2H2 Hingston et al., [1982] I Canadian Rockies spruce forest 0.165 (11) C2H2 Blundon and Dale, [1990] Southeast V. S. piedmont forst 0.000 C2H2 Grant and Binkley, [1987] Southeast v. S. slash pine 0.010 0.250 0.100 C2H2 DiStefano and Gholz, [1989]
~ Southwest Australia eucalyptus forest 0.250 C2H2 O'Connel and Grove, [1987] Coastal B. C., Canada fir/hemlock/cedar 0.030 0.060 C2H2 Cushon and Feller, [1989] Northeast v. S. mixed-deciduous forest 0.020 0.004 C2H2 Tjepkema, [1979] Z Eastern Austria alpine vegetation 0.280 C2H2 Zechmeister-Boltenstern and ::!l
Kinzel, [1990]
~ Northwest V. S. douglas fir 0.074 C2H2 Heath et al., [1987. Northwest V. S. douglas fir 0.033 0.028 0.500 0.280 N accumulation Sollins et al., [1980] ~ Southern Ontario, Canada mixed deciduous, confers 0.086 C2H2 Hendrickson, [1990] Central Sweden mixed deciduous, conifers 0.093 C2H2 Nohrstedt, [1985] Northwest V. S. mixed conifers 0.100 C2H2 Jurgensen et aI., [1992] Northwest V. S. mixed conifers 0.010 C2H2 Harvey et al., [1989] Southeast V. S. mixed deciduous forest 0.090 C2H2 Cornabyand Waide, [1973] Northwest v. S. mixed conifers 0.070 C2H2 Larsen et aI., [1978] Southeast v. S. mixed deciduous forest 0.120 unspecified Todd et al., [1978]

CLEVELAND ET AL.: GLOBAL PATfERNS OFlERRESTRIAL N FIXATION 631
Table 4b. Data-Based Estimates of N Fixation in Temperate Mixed Forest (5), Temperate Coniferous Forest (6), Temperate Deciduous Forest (7), Temperate Forested Floodplain (17), and Temperate Broadleafed Evergreen Forest (21) Ecosystems
N Fixation Rate, g N m·2 yr'! NFixed, N Fixed,
Symbiotic (%Cover)
Trees Understory Litter Soil
Arithmetic mean 6.350 2.946 (9.8) 0.099 0.165 Standard deviation 4505 5.177 0.123 0.118 Geometrric mean 6.497 0.732 0.030 0.064
Variance 202.99 268.03 0.153 0.153 Coverage
(Trees/Understory) 1%/3% 0.108 0.220 0.030 0.064
5%/10% 0541 0.732 0.030 0.064 10%/17% 1.083 1.244 0.030 0.064
On the basis of estimates of N fixation within each separate component, we estimate that biological N fixation currently contributes between 6.5 and 26.6 kg N ha'] yr'! to temperate forests and temperate forested floodplains, depending on the abundance of canopy and understory symbiotic N fixing species (Table 4b). This range is similar to the range of 1-20 kg N ha'! yr· l reported by Todd et ai. [1978] and reflects the notion that peak rates of N fixation (i.e. 10-30 kg N ha'! yr'!) occur in early to intermediate stages of forest and may decline thereafter to much lower values (i.e., 1-3 kg ha· l y(!) [Waide et ai., 1988; Likens et ai., 1977; Boring et al., 1988].
3.4. Tall/Medium Grasslands(8), Short Grasslands (9), Temperate Nonforested Floodplains (18), and Temperate Savannas (20)
Leguminous species are not a dominant component of the vegetation in most grasslands, frequently accounting for
Nonsymbiotic g N m·2 yr'] kg N ha'] yr'!
Wood Phyllosphere
0.117 0.200 0.159 0.113 0.054 0.183 0.254 0.128
0.054 0.183 0.659 6.59 0.054 0.183 1.604 16.04 0.054 0.183 2.658 26.58
between I and 5% of the primary productivity, and therefore contributing little nitrogen via N fixation to grassland ecosystems [Woodmansee et ai., 1981]. Also, legumes that are present may not be nodulated or may be only sparsely nodulated [Woodmansee et aI., 1981]. However, following disturbances in unimproved annual grasslands, N fixation by
legumes may be large. Nonetheless, such inputs are extremely variable in space and time, with large inputs (i.e. >50 kg N ha'! yr· l ) in some sites and insignificant inputs in others [Woodmansee et aI., 1981]. Rates of symbiotic N fixation range from 0.1 to 10.0 kg N ha· l yr· l [Woodmansee et al., 1981; Robertson and Rosswall, 1986].
The principal contributors of biologically fixed N in grasslands appear to be asymbiotic bacteria and heterocystous bacteria [DuBois and Kapustka, 1983]. Eisele et ai. [1989] reported high rates of nonsymbiotic fixation corresponding to higher phosphorus (P) availability following prairie burning.
Table Sa. Summary of Literature-Derived Estimates of Symbiotic and Nonsymbiotic N Fixation in Tall/Medium Grassland (8), Short Grassland (9), Temperate Nonforested Floodplain (18), and Temperate Savanna (20) Ecosystems
Ecosystem Location Vegetation Type
North America shortgrass steppe North America mixed prairie North America tall grass prairie Unspecified annual grassland
Unspecified annual grassland
North America short-tall-grass prairie
West Africa subdesert grassland
United Kingdom upland pasture North America tall grass prairie
North America tallgrass prairie West Africa subdesert grassland
N Fixation Rate, g N m·2 yr· l
Symbiotic (% Cover)
0.025 (NA) 0.025 (NA) 0.025 (NA) 0.01 (NA)
0.01 (NA)
0.8 (NA)
1.000 (NA)
Algal Other Nonsymbiotic Nonsymbiotic
0.010
0.020
0.350
0.100
0.820
2.100 1.000
0.025 0.025 0.025
0.080
0.600
1.000
Method
unspecified unspecified unspecified unspecified
unspecified
literature review
unspecified C2H2
nitrogenase activity literature review
Source
Whitehead. [1995] Whitehead, [1995] Whitehead, [1995] Woodmansee et aI., [1981] Woodmansee et al. , [1981] Kaputsa and DuBois, [1987] Robertson and Rosswall, [1986] Whitehead, [1995] DuBois and Kaputsa, [1983] Eisele et al., [1989] Robertson and Rosswall, [1986]

632 CLEVELAND ill AL.: GLOBAL PATIERNS OF1ERRESTRIAL N FIXATION
Table 5b. Data-Based Estimates of N fixation in TalVMedium Grassland (8), Short Grassland (9), Temperate Nonforested Floodplain (18), and Temperate Savanna (20) Ecosystems
N Fixation Rate, g N m02 yro' NFixed, NFixed,
Symbiotic Algal Nonsymbiotic
Arithmetic mean 0.271 0.629 Standard deviation 0.434 0.758
Geometric mean 0.053 0.198 Variance 00188 0.575 5% cover 0.018 0.198
15% cover 00053 0.198 25% cover 0.088 0.198
DuBois and Kapustka [1983] also reported high rates of asymbiotic fixation. An estimate of N fixation in grasslands is complicated by the fact that tropical grasslands are often managed and contain N fixing forage plants [Cadisch et ai., 1994]. In addition, fire greatly affects the abundance of N fixing species in grasslands, with symbiotic nitrogen fixation being more important immediately following a fire. We estimate that symbiotic species may contribute between 0.2 and 0.9 kg N hao
' yr"' to grasslands, and that an additional 2.2 kg N hao
' yrO
' is added via nonsymbiotic N fixation to grasslands worldwide. Thus between 2.3 and 3.1 kg N hao
' yr O
'
are added to grassland via biological fixation (Tables Sa and Sb). These rates are also used to represent N fixation in temperate savannas and temperate nonforested floodplains because data in these ecosystems are unavailable and because they are likely similar in composition to temperate grasslands.
3.5. Tropical Savannas (10) and Wet Savannas ( 19)
In tropical savannas, N fixation by legume nodules probably provides the major input of nitrogen fixed per unit area annually, although there is also evidence of fixation by soil algae [Bate and Gunton, 1982; Stewart et al., 1978]. These systems contain a high proportion of trees in the genus Acacia or other members of the Mimosaceae family [Schulze et al., 1991]. Therefore it is possible that N fixation in these
Other g N m02 yro' kg N hao
' yro'
Nonsymbiotic
0.251 0.393 0.019 0.155 0.019 0.235 2.35 0.019 0.270 2.70 0.019 0.305 3.05
systems could be very high. However, many nitrogen fixers in this system show large species specific variation in N fixation rates, and species distribution and abundance varies widely over large areas of savannas [Schulze et at., 1991].
Assuming asymbiotic N fixation contributes 9.S kg N hao
'
y(' and rates of symbiotic N fixation range from 0.7 to 34.S kg N hao
' yrO
' [Stewart et al., 1978; Bate and Gunton, 1982], we estimate that N fixation in tropical and wet savannas ranges from 16.3 to 44.0 kg N ha" yr-' (Tables 6a and 6b). These estimates are greatly influenced by the high rates of symbiotic N fixation commonly observed in tropical savannas; however, these estimates, particularly the upper-bound estimate, may overestimate N fixation over the entirety of these systems.
Although N inputs from atmospheric deposition vary widely in tropical savannas, the amount of N entering them via N fixation appears to greatly exceed atmospheric inputs, which typically range from 2 to S kg N ha-' yr-' depending on the total amount of rainfall [Bate, 1981]. This suggests that biological N fixation may be the largest source of N in savanna ecosystems.
3.6. Arid Shrub lands (11)
The N fixing genus Prosopis (mesquite) is the dominant vegetation on millions of square kilometers of arid woodlands in North and South America [Rundel et at., 1982; Johnson and Mayeux, 1990]. Rundel et at. [1982] reported that net nitrogen uptake by above ground Prosopis is 69.8 kg N ha-'
Table 6a. Summary of Literature-Derived Estimates of Symbiotic and Nonsymbiotic N Fixation in Tropical Savanna (10) and Wet Savanna (19) Ecosystems
Ecosystem Location Vegetation Type N Fixation Rate (g N m02 yrO') Method Source
Symbiotic Nonsymbiotic (% Cover)
Nigeria unspecified 3.000 C2H2 Stewart et aI., [1978] Nigeria tallgrass savanna 3.800 (NA) C2H2 Bate and Guntan, [1981] South Africa unspecified 9.000 (NA) C2H2 * Nigeria unspecified 0.300 (NA) 0.300 C2H2 Bate and Guntan, [1981] West Africa unspecified 3.000 (NA) C2H2 Stewart et alo, [1978] Brazil Paspalum spp. 20850 (NA) unspecified Dabereiner, [1977] Ivory Coast unspecified 0.900 (NA) unspecified Balandreau and Villemin, [1973]
'N. Grobbelaar and M. W. Rosch, unpublished data, 1979.
CLEVELAND ET AL.: GLOBAL PATIERNS OF 1ERRES1RIAL N AXATION 633
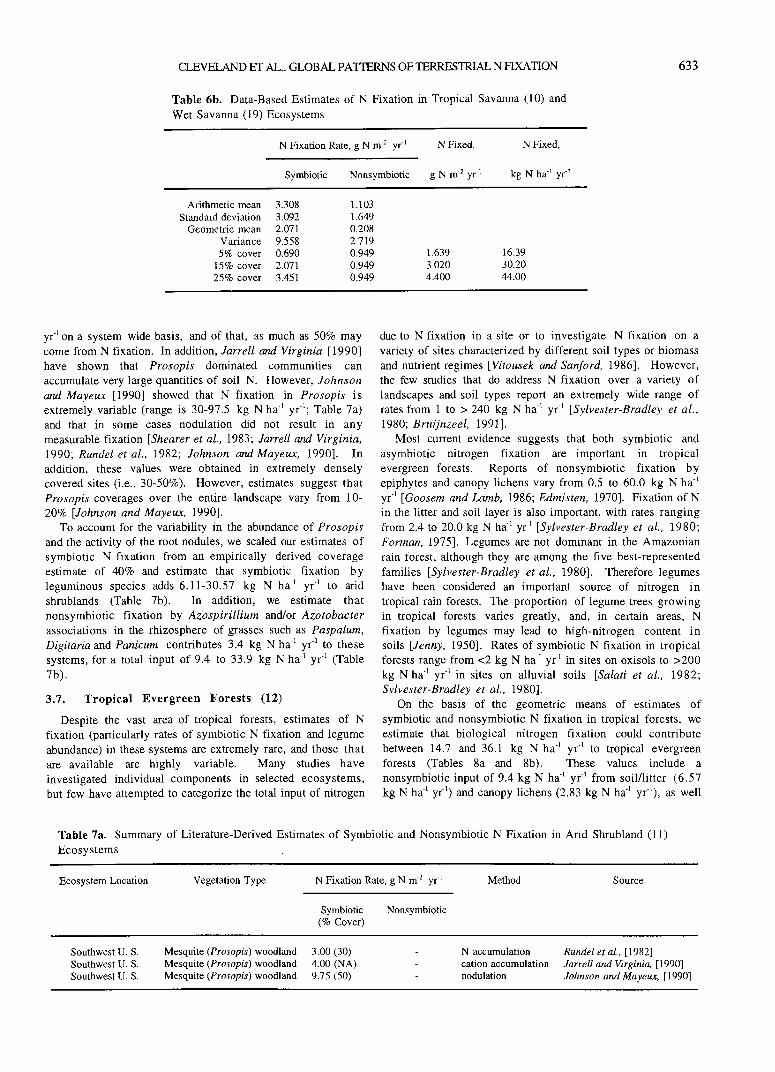
Table 6b. Data-Based Estimates of N Fixation in Tropical Savanna (10) and Wet Savanna (19) Ecosystems
N Fixation Rate, g N m,2 yr,l NFixed, N Fixed,
Symbiotic Nonsymbiotic
Arithmetic mean B08 Ll03 Standard deviation 3,092 L649
Geometric mean 2ml 0.208 Variance 9.558 2.719 5% cover 0.690 0,949
15% cover 2.071 0.949 25% cover 3.451 0.949
y(l on a system wide basis, and of that, as much as 50% may come from N fixation. In addition, Jarrell and Virginia [1990] have shown that Prosopis dominated communities can accumulate very large quantities of soil N. However, Johnson and Mayeux [1990] showed that N fixation in Prosopis is extremely variable (range is 30-97,5 kg N ha,l yr,l; Table 7a) and that in some cases nodulation did not result in any measurable fixation [Shearer et ai., 1983; Jarrell and Virginia, 1990; Rundel et al., 1982; Johnson and Mayeux, 1990]. In addition, these values were obtained in extremely densely covered sites (i.e., 30-50%). However, estimates suggest that Prosopis coverages over the entire landscape vary from 10-20% [Johnson and Mayeux, 1990].
To account for the variability in the abundance of Prosopis and the activity of the root nodules, we scaled our estimates of symbiotic N fixation from an empirically derived coverage estimate of 40% and estimate that symbiotic fixation by leguminous species adds 6.11-30.57 kg N ha,l yr,l to arid shrublands (Table 7b). In addition, we estimate that nonsymbiotic fixation by Azospirillium and/or Azotobacter associations in the rhizosphere of grasses such as Paspalum, Digitaria and Panicum contributes 3.4 kg N ha,1 yr,l to these systems, for a total input of 9.4 to 33.9 kg N ha,1 yr,1 (Table 7b).
3.7. Tropical Evergreen Forests (12)
Despite the vast area of tropical forests, estimates of N fixation (particularly rates of symbiotic N fixation and legume abundance) in these systems are extremely rare, and those that are available are highly variable. Many studies have investigated individual components in selected ecosystems, but few have attempted to categorize the total input of nitrogen
1.639 3.020 4.400
due to N fixation in a site or to investigate N fixation on a variety of sites characterized by different soil types or biomass and nutrient regimes [Vitousek and Sanford, 1986]. However, the few studies that do address N fixation over a variety of landscapes and soil types report an extremely wide range of rates from 1 to > 240 kg N ha,1 yr,1 [Sylvester-Bradley et al., 1980; Bruijnzeel, 1991].
Most current evidence suggests that both symbiotic and asymbiotic nitrogen fixation are important in tropical evergreen forests. Reports of nonsymbiotic fixation by epiphytes and canopy lichens vary from 0.5 to 60.0 kg N ha,1 yr,1 [Goosem and Lamb, 1986; Edmisten, 1970]. Fixation of N in the litter and soil layer is also important, with rates ranging from 2.4 to 20.0 kg N hal yrl [Sylvester-Bradley et ai., 1980; Forman, 1975]. Legumes are not dominant in the Amazonian rain forest, although they are among the five best-represented families [Sylvester-Bradley et al., 1980]. Therefore legumes have been considered an important source of nitrogen in tropical rain forests. The proportion of legume trees growing in tropical forests varies greatly, and, in certain areas, N fixation by legumes may lead to high-nitrogen content in soils [Jenny, 1950]. Rates of symbiotic N fixation in tropical forests range from <2 kg N ha,1 yr,l in sites on oxisols to >200 kg N ha,l y(l in sites on alluvial soils [Salati et ai., 1982; Sylvester-Bradley et ai., 1980].
On the basis of the geometric means of estimates of symbiotic and nonsymbiotic N fixation in tropical forests, we estimate that biological nitrogen fixation could contribute between 14.7 and 36.1 kg N ha,l yr,l to tropical evergreen forests (Tables 8a and 8b). These values include a nonsymbiotic input of 9.4 kg N ha,l yr,l from soil/litter (6.57 kg N ha,1 yr,l) and canopy lichens (2.83 kg N ha,l yr,1), as well
Table 7a. Summary of Literature-Derived Estimates of Symbiotic and Nonsymbiotic N Fixation in Arid Shrub land (11) Ecosystems
Ecosystem Location
Southwest U. S. Southwest U. S. Southwest U, S.
Vegetation Type
Mesquite (Prosopis) woodland Mesquite (Prosopis) woodland Mesquite (Prosopis) woodland
N Fixation Rate, g N m,2 yr,l
Symbiotic (% Cover)
3.00 (30) 4,00 (NA) 9,75 (50)
Nonsymbiotic
Method
N accumulation cation accumulation nodulation
Source
Rundel et ai., [1982] Jarrell and Virginia, [1990] Johnson and Mayeux, [1990]

634 CLEVELAND Ef AL.: GLOBAL PATIERNS OF TERRES1RIAL N FIXATION
Table 7b. Data-Based Estimates of N Fixation in Arid Shrubland (11) Ecosystems
N Fixation Rate, g N m-2 yr- l NFixed, NFixed,
Symbiotic Nonsymbiotic kg N ha- l yr- l
Arithmetic mean Standard deviation
Geometric mean Variance 5% cover
15% cover 25% cover
5_583 3_643 4-891 13271 0.611 1.868 3_057
0.336'
0.336' 0_336' 0.336'
0.947 2204 3.393
9.47 22_04 33.93
'Due to a lack of published estimates of non-symbiotic N2-fixation in arid shrublands, this value is obtained from estimates of N-fixation in desert ecosystems (Tables lla and llb)_
as symbiotic inputs which reflect possible variability in coverages of symbiotic species. Atmospheric inputs of nitrogen to the Amazon basin have been estimated at 6 kg N ha-l y(l, and the available data suggest this input is balanced by hydrologic outputs of 5-6 kg N ha-l yr-l [Lewis et ai., 1999; Salati et ai., 1982]. Thus a balanced N budget requires a total flux of N trace gases (via nitrification, denitrification, and/or volatilization) that is equal to N fixation rates.
3.S. Tropical Forested Floodplains (14) and Tropical Nonforested Floodplains (16)
The Amazon floodplain (varzea) is one of the most fertile and productive regions within the Amazon Basin, and rates of nitrogen fixation by varzea plants, including leguminous and non-leguminous species, emergent, semi-aquatic grasses, and free-living periphyton and plankton, are extremely high [Martinelli et aI., 1992; Doyle and Fisher, 1982; SylvesterBradley et aI., 1980]. For example, Sylvester-Bradley et al. [1980] noted that nodules on some floodplain trees were so abundant that it was nearly impossible to see the roots. Here N fixation rates in the varzea have been measured as high as 243 kg N hal y(l [Sylvester-Bradley et aI., 1980]. However, on the basis of the high variability of nodule abundance and activity of the species investigated, we believe that 243 kg N ha-l yr-l is a maximum (Le., we assume this rate is based on 100% coverage of N fixing species). Therefore our conservative (5% coverage) estimate of symbiotic N fixation
in tropical floodplain ecosystems globally is 12.2 kg N ha- l
yr-l; our "best-guess" (15% coverage) estimate is 36.5 kg N ha-l y(l; and our upper-bound estimate of N fixation in tropical floodplains is 60.75 kg N ha-l y(l.
The rate of N fixation via periphyton and plankton in tropical nonforested floodplains is estimated at 6.3 kg N ha- l
yr- l [Doyle and Fisher, 1994]. In addition, N fixing aquatic grasses such as Paspalum are abundant in tropical nonforested floodplains, and have been shown to fix 28.5 kg N ha-l yr- l
[Martinelli et al., 1992; Dobereiner, 1977]. Therefore we estimate that N fixation in these ecosystems contributes between 15.8 (5% coverage of symbiotic N fixers) and 53.8 kg N ha-l y(l (25% coverage of symbiotic N fixers) (Tables 9a and 9b).
3.9. Xeromorphic Forests/Woodlands (13)
The xeromorphic woodlands that occur in West Africa (e. g., Kenya) and South America (eastern Brazil/northeastern Argentina) are variable in species composition, structure, and density [Felfili and Da Silva, 1993]. Nonetheless, legumes and myrtles are abundant in all of these systems, suggesting that rates of N fixation are high [Sprent et aI., 1996]. This is supported by l5N data, which showed significant N fixation in species of Chamaecrista, Mimosa, and Calliandra, Leucaena, and Casuarina spp., which are all abundant in xeromorphic woodlands globally [Sprent et aI., 1996].
In spite of the likely importance of N fixation in
Table Sb. Data-Based Estimates of N Fixation in Tropical Evergreen Forest (12) Ecosystems
N Fixation Rate, g N m-2 yr- l N Fixed, N Fixed,
Symbiotic. Nonsymbiotic
Arithmetic mean 1.600 Standard deviation
Geometric mean 1.600 Variance 5% cover 0.533
15% cover 1.600 25% cover 2.667
Soil/Litter
0.886 0_716 0.657 0.512 0.657 0.657 0_657
Epiphytes/ Lichens
1.340 3.323 0.283 6.803 0.283 0.283 0_283
1.473 2.540 3.607
14.73 25.40 36_07

CLEVELAND ET AL.: GLOBAL PA TIERNS OF 1ERRESlRIAL N FIXATION 635
Table 8a. Summary of Literature-Derived Estimates of Symbiotic and Nonsymbiotic N Fixation in Tropical Evergreen Forest (12) Ecosystems
Ecosystem Location Vegetation Type N Fixation Rate, g N m·2 yr- 1 Method Source
Symbiotic Nonsymbiotic Epiphytes! (% Cover) Soil/Litter Lichens
New Guinea tropical rain forest Columbia tropical rain forest Central Amazonia tropical rain forest 0.245
Sri Lanka tropical rain forest 0.800
Central Amazonia secondary forest 2.000
Northern Amazonia tropical rain forest 1.600 (NA) 1.500 Kilauea Volcano, tropical rain forest 0.280 Hawaii La Soufriere, cloud forest volcano Guadeloupe Vocanoes NP, tropical dry forest 0.490 Hawaii Unspecified tropical rain forest
xeromorphic woodlands, there are few rate estimates in these systems. Because of the lack of estimates and on the basis of the similarities in species composition between tropical deciduous forests and xeromorphic forests [e.g., Ambasht and Srivastava, 1994; Yoneyama et at., 1993], we apply a maximum nitrogen fixation rate of 34.0 and a minimum of 9.4 kg N ha-1 yr-1 to characterize xeromorphic forests and woodlands (Tables lOa and lOb).
3.10. Deserts (15)
Primary productivity in deserts is generally very low, owing to the limiting factors of water stress and low nitrogen availability [Runde! et at., 1982; Wallace et aI., 1978]. Consequently, the largest source of nitrogen in desert systems is provided by biological fixation [Metting, 1991]. Both symbiotic and asymbiotic forms of N fixation are important in deserts. Legumes are often present in desert communities and can provide large localized inputs of nitrogen [Crawford and Gosz, 1982]. For example, in the American southwest Prosopis glandulosa fixes 2.3-15.0 kg N ha·1 yr-1 [Rundel et ai., 1982; Johnson and Mayeux, 1990]. In Australia, native desert legumes fix between 0.04 and 7.46 kg N ha·1 yr- 1
[Lawrie, 1981]. However, unsuitable temperature and moisture often limit nodule development in desert legumes, and little is
0.050 C2H2 Goosem and Lamb, [1986] 0.150 literature review Forman, [1975]
C2H2 Sylvester-Bradley et aI., [1980]
C2H2 Maheswaran and Gunatilleke, [1990]
C2H2 Sylvester-Bradley et aI., [1980]
0.100 C2H2 Jordan et al., [1983] 0.000 C2H2 Vitousek, [1994]
0.402 C2H2 Sheridan, [1991]
C2H2 Ley and D'Antonio, [1998]
6.000 unspecified Edmiston, [1970]
known on the rates of legume-Rhizobium N fixation in other desert ecosystems [Crawford and Gosz, 1982].
Associative symbioses in the rhizosphere and nonsymbiotic cyanobacteria are spatially more important sources of N fixation in deserts than symbiotic sources [Herman et aI., 1993; West and Skujins, 1977]. Surfaces of desert soils are often covered by cryptogamic crusts composed of fungi, lichens, and cyanobacteria, and nitrogen fixation by cyanobacteria-dominated crusts provides a significant input of nitrogen to many desert ecosystems worldwide [West and Skujins, 1977]. In the Great Basin desert, estimates of N fixation by cryptogamic crusts range from 10.0 to 100.0 kg N ha·1 yr-1 depending on environmental conditions [Rychert and Skujins, 1974]. On the basis of estimates of both symbiotic (1.5-7.5 kg N ha·1 y(l) and nonsymbiotic N fixation (3.3 kg N ha·1 yr-1), we estimate that N fixation contributes between 4.8 and 10.8 kg N ha-1 yr-1 to desert ecosystems globally (Tables Iia and lIb).
3.11. (21 )
Temperate Broadleafed Evergreen Forests
The majority of the world's temperate broadleafed evergreen forests are located in Southeast Asia and South America, with smaller tracts in Eastern Australia. Increasing population,
Table 9a. Summary Literature-Derived Estimates of Symbiotic and Nonsymbiotic N Fixation Estimates in Tropical Nonforested Floodplain (16) Ecosystems
Ecosystem Location Vegetation Type N Fixation Rate, g N m-2 yr' I Method Source
Symbiotic (% Cover) Nonsymbiotic
Brazil Paspalum spp. 2.850 (NA) unspecified Dobereiner, [1977] Brazil Amazon floodplain 0.630 C2H2 Doyle and Fisher, [1994]

636 CLEVELAND ET AL.: GWBAL PATTERNS OF 1ERRESTRIAL N FIXATION
Table 9b. Data-Based Estimates of N Fixation in Tropical Nonforested Floodplain (16) Ecosytems
N Fixation Rate, g N m·2 yr'! NFixed, NFixed,
Symbiotic Nonsymbiotic g N m·2 yr'! kg N ha'! yr'!
5% cover 0.950 0.630 15% cover 2.850 0.630 25% cover 4.750 0.630
coupled with an increase in the demand for timber has resulted in a decrease in area of these forests [Domingo, 1983]. They are composed mainly of rain forest-like dipterocarp species but are distinguished from evergreen tropical forests, as these more temperate forests experience cooler average temperatures and a more pronounced seasonality, with most of the rain falling during a 4-5 month period [Domingo, 1983].
We were unable to locate N fixation rates for temperate broadleafed evergreen forests in the literature; therefore, because of the similarity of climate and overall physiognomy of these forests to other temperate forests, our best estimate suggests that the remaining temperate broadleafed evergreen forests fix a minimum of 6.5 and a maximum of 26.6 kg N ha'! yr'! (i.e., rates equal to rates in other temperate forests; Tables 4a and 4b).
3.12. Mediterranean Shrublands (22)
Mediterranean ecosystems all share similar climates, with cool, moist winters and hot, dry summers [Schlesinger et al., 1982]. The shrubland formations (matorral, chaparral, and
1.580 15.80 3.480 34.80 5.380 53.80
maquis), which characterized these ecosystems, are common in central Chile, northern Mexico, and southern California [Yates et aI., 1982]. Ceanothus shrubs, which are common in Mediterranean shrublands, contribute to the nitrogen balance of these systems via symbiotic associations with the N fixer Frankia [Kummerow et aI., 1978]. We estimate that this symbiosis contributes 0.5 to 2.5 kg N ha'! y(! to Mediterranean-type ecosystems (Table l2a). In addition, asymbiotic N fixation may provide an additional l.0 kg N ha'! yr'! to these ecosystems [Schlesinger et al., 1982]. Therefore we estimate that BNF contributes between 1.5 and 3.5 kg N ha'! yr'! to Mediterranean shrub lands (Table 12b). Published rates of N fixation in European Mediterranean shrublands are unavailable, so we assume that this value is typical of these ecosystems worldwide.
3.13. Tropical Deciduous Forests (23)
Reported rates of N fixation in dry tropical deciduous forests are extremely rare, due to deforestation and conversion to other land uses such as savanna and cropland [Srivastava and Singh,
Table lOa. Summary of Literature-Derived Estimates of Symbiotic and Nonsymbiotic N Fixation in Xeromorphic ForestIWoodland (13) and Tropical Deciduous Forest (23) Ecosystems
Ecosystem Location
Nigeria India India
Vegetation type N Fixation Rate, g N m·2 yr'! Method Source
Symbiotic (% Cover) Nonsymbiotic
mixed deciduous forest 3.000 (NA) 0.331 C2H2 Stewart et al., [1978] Casuarina plantation 1.760 (NA) N accumulation Ambasht and Srivastava, [1994] Casuarina plantation 0.750 (NA) N accumulation Ambasht and Srivastava, [1994]
Table lOb. Data-Based Estimates of N Fixation in Xeromorphic Forest/Woodland (13) and Tropical Deciduous Forest (23) Ecosystems
Arithmetic mean Standard deviation
Geometric mean Variance 5% cover
15% cover 25% cover
N Fixation Rate, g N m·2 yr'!
Symbiotic
1.837 1.127 1.582 1.270 0.612 1.837 3.062
Nonsymbiotic
0.331
0.331 0.331 0.331
NFixed,
0.943 2.168 3.393
NFixed,
9.43 21.68 33.93

CLEVELAND ET AL.: GLOBAL PATIERNS OFTERRES1RIAL N FIXATION 637
Table lIa. Summary of Literature-Derived Estimates of Symbiotic and Nonsymbiotic N Fixation in Desert (15) Ecosystems
Ecosystem Location Vegetation Type N Fixation Rate, g N m-2 yr- l Method Source
Symbiotic (% Cover)
North America cryptogamic crusts (Mojave Desert) North America cryptogamic crusts (Sonoran Desert) North America unspecified 2.950 (NA) (Sonoran Desert) North America cryptogamic crusts (Great Basin) North America cryptogamic crusts (Great Basin) Australia cryptogamic crusts Australia unspecified 0.067 (NA) Africa (Kalahari crytogamic crusts Desert)
1991]. However, tropical and subtropical deciduous forests and woodlands are likely to have high rates of N fixation because high temperatures, moderate moisture, and fertile soils provide conditions conducive to N fixation [Stewart et aI., 1978]. Work by Ambasht and Srivastava [1994] suggests that actinorrhizal tree species such as Casuarina may contribute 7.5-17.6 kg N ha-! y(! to tropical dry forests (see Tables lOa and lOb). In addition, it has been demonstrated that canopy lichens and epiphytes may be a source of nitrogen fixation in the canopies of tropical dry forests; however, the magnitude of this input is largely unknown [Lugo and Scatena, 1995]. Our best estimate is that BNF rates in dry tropical deciduous forests range from 9.4 to 34.0 kg N ha-l y(l (see Table lOb).
3.14. Global Patterns of Terrestrial BNF
Woodmansee and Wallach [1981] postulated a strong relationship between climatic factors conducive to high productivity (such as high precipitation and air temperature) and the potential for significant N fixation by symbiotic species. In addition, since nitrogen fixation is an energetically "expensive" process [Vitousek and Field, 1999; Vitousek and Howarth, 1991], it stands to reason that it would be most important in systems where large amounts of energy as carbon are available for fixing organisms. These are likely
Nonsymbiotic
0.050 C2H2 Rychert et aI., [1978]
0.900 C2H2 Rychert et aI., [1978]
C2H2 Rundel et aI., [1982]
1.300 C2H2 Crawford and Gosz, [1982]
1.000 C2H2 Rychert and Skujins, [1974]
0.130 C2H2 Melting, [1991] C2H2 Lawrie, [1981]
0.190 C2H2 Sharpe and Hendrickson, [1987]
to be systems with at [east seasonally high solar radiation, precipitation, and resultant net primary productivity. Ef provides information on both water and energy availability in an integrated fashion [Rosenzweig, 1968], and we believe that ET may relate to BNF as a correlate for the resources available to nitrogen fixing organisms. Schimel et al. [1996, 1997] argued that N inputs may be correlated with actual evapotranspiration based on the qualitative observation that high rates of N fixation are highest in ecosystems (e.g., temperate and tropical rain forests) and seasons (rainy periods in deserts and grasslands) with high ET.
We performed a regression analysis of our data-based estimates of N fixation on ecosystem ET, as computed by Century (Figure 1). We found significant relationships between ET and our data-based estimates of N fixation (conservative estimate: R2=0.60, P<O.OOI; central estimate: R2=0.63; P<O.OOI; upper-bound estimate: R2=0.62; P<O.OOl). Just as ET may relate to N fixation (as a correlate for the resources available to nitrogen fixing organisms), NPP could also relate to N fixation; NPP may be a proxy for carbon potentially available to fixers. The relationships between N fixation and modeled NPP are depicted in Figure 2. Although the relationships between the data-based N fixation and NPP are not as strong as with ET (conservative estimate: R2=0.22; P=0.02; central estimate: R2=0.34; P=0.004; upper-bound
Table lIb. Data-Based Estimates of N Fixation in Desert (15) Ecosystems
N Fixation Rate, g N m-2 yr-! NFixed, NFixed,
Symbiotic Nonsymbiotic g N m-2 yr-! kg N ha-l yr-1
Arithmetic mean 1.509 0.595 Standard deviation 2.039 0.535
Geometric mean 0.445 0.336 Variance 4.156 0.286 5% cover 0.148 0.336 0.484 4.84
15% cover 0.445 0.336 0.781 7.81 25% cover 0.742 0.336 1.078 10.78

638 CLEVELAND ET AL.: GLOBAL PA TIERNS OF TERRES1RIAL N FIXATION
Table 12a. Summary of Literature-Derived Estimates of Symbiotic and Nonsymbiotic N Fixation Estimates in Mediterranean Shrubland (22) Ecosystems
Ecosystem Location Vegetation Type N Fixation Rate, N m,2 yr,l Method Source
Symbiotic (% Cover)
Coastal California, U. S. chaparral 0.010 (32) Coastal California, U. S. chaparral Australia shrub land 0.075 (NA) Coastal California, U. S. chaparral 0.690 (NA) Unspecified chaparral 1.000 (NA)
estimate: R2=0.38; P=0.002), the general trend suggests that higher nitrogen fixation corresponds with higher NPP. However, we believe that higher rates of NPP may be, in part, a consequence of a given level of BNF as the cause.
We utilized the observed relationship between our central, data-based N fixation estimate and ET to map global N fixation rates using the ET values in Century (Plate 2). The fact that Ef accounts for >60% of the variability in our whole range of estimates of N fixation suggests that it may be a useful predictor for annual nitrogen fixation at the ecosystem scale. However, this procedure is certainly not appropriate for estimating instantaneous nitrogen fixation rates (e.g., in units of mol em" d,l) which can be transiently high even in very arid ecosystems under appropriate conditions. Nevertheless, as demonstrated in Plate 2, the highest rates of N fixation occur in tropical latitudes and decrease with increasing latitude. On the basis of our calculations, greater than 20% of global terrestrial BNF occurs in tropical rain forests (Table 13). This may help explain why these systems are frequently N-rich, with primary productivity apparently limited by some combination of P, base cation and/or light availability rather than by N [Vitousek and Howarth, 1991; Martinelli et ai, 1999]. Combined, tropical rain forests, arid shrublands and tropical savannas account for> 60% of the total global BNF, where as all the temperate forests combined account for <10% of global BNF (Table 13). However, the paucity of available estimates of N fixation in tropical rain forests, arid shrublands, and tropical savannas and the large variability in the estimates that are available (Table 13) decreases the reliability of these estimates relative to estimates of N
Nonsymbiotic
C2H2 Kummerow et aI., [1978] 0.100 C,H2 Schlesinger et al., [1982]
C2H, Groves, [1981] C2H2 Lepper and Fleschner, [1977] C,H2 Rundel and Neel, [1978]
fixation in temperate forests (where reported rates are much more abundant) and emphasizes the need for more data-based estimates in such ecosystems, where N fixation appears to be extremely important.
The fact that areas with high ET have correspondingly high rates of N fixation suggests that at the ecosystem level, ET is a reasonable predictor of N fixation. However, the variability in the data-based regressions with ET suggests that contrary to the model, in which Ef "drives" N fixation, N fixation is likely influenced by many other factors beyond Ef and NPP [Vitousek and Field, 1999]. Also, it is possible that the strength of this relationship would be further diminished at smaller scales, where variation in factors such as light availability, soil type, and hydrology may lead to significant ranges in N fixation at the community to ecosystem scale. Finally, the relationship between Ef and N fixation may be more applicable to asymbiotic nitrogen fixation, as symbiotic nitrogen fixation may be controlled more by ecosystem successional status, species composition and species abundance.
4. Conclusions
Estimates of potential biological nitrogen fixation by vegetation type are shown in Table 13. From our data-based estimates, we believe that BNF contributes a maximum of 289 Tg N y(l (1 Tg = 1012 g) to terrestrial ecosystems. However, we believe that this estimate is absolutely an upper limit, as this estimate is based on at least 25% coverages of symbiotic N fixers over all ecosystems. Although legumes may be quite
Table 12b. Data-Based Estimates of N Fixation in Mediterranean Shrubland (22) Ecosystems
N Fixation Rate, g N m·2 yr'! NFixed, NFixed,
Symbiotic Nonsymbiotic g N m" yr'! kg N ha'! yr'!
Arithmetic mean 0.444 0.100 Standard deviation 0.481
Geometric mean 0.151 Variance 0.231
11% cover 0.052 0.100 0.152 1.52 32% cover 0.151 0.100 0.251 2.51 53% cover 0.250 0.100 0.350 3.50

70
,-.. 60 ...... ,
I-< ;>-
...... 50 , ro
,.J:::l
Z 40 OJ:)
,.!od '-"
I::::: 30 0 ..... ~ ~ ..... ~ 20
Z 10
0
CLEVELANDEI'AL.:GLOBALPAITERNSOF1ERRESlRIALNFIXATION 639
~f(x~~;.SI~;:!~~5~4~~~!~~0] • Central N Fixation2 [f(x)=0.234x-0.172; R =0.63] • ~f(x~:.~6~~~;.~~; ~!!~~;]
•
0 Century-derived N Fixation • • •
• • • • @
• 0 • 0 0 OJ 0 0 0 0 0 0
o
o 0
0 20 40 60 80 100 120 140 160
ET (em yr-1) Figure 1. Conservative, central, and upper-bound data-based and modeled estimates of terrestrial biological nitrogen fixation by ecosystem plotted versus modeled ecosystem ET.
abundant in some parts and/or successional stages of all ecosystems, we believe that it is extremely unlikely that this value represents a realistic average spatial and temporal coverage. The contribution suggested by the conservative and central data-based estimates (100 Tg N yr'! and 195 Tg N yr'! , respectively) are much more reasonable values, and since our
central value is based on an average of explicitly reported coverages of N fixers, our best estimate of potential N fixation in natural ecosystems globally is 195 Tg N yr'!, or an average of -15 kg N yr'! for each hectare of the Earth's land surface. Our failure to include an error term on this central value reflects the fact that we are unaware of an appropriate statistical
,-.. ...... ,
I-< ;>-
...... 'ro ,.J:::l
Z ~ '-"
I::::: 0 ..... ~ ~ ..... ~
Z
70 -e- Conservative N Fixation
60 -+- Central N Fixation
--- Upper-bound N Fixation
50 -e-
40
30
20
10
o 0
NPP (g C m-2 yr-1) Figure 2. Conservative, central, and upper-bound data-based and modeled estimates of terrestrial biological nitrogen fixation by ecosystem plotted versus modeled ecosystem NPP.

o o o o v
640
o o o o f"')
CLEVELAND ill AL.: GLOBAL PATIERNS OFlERRES1RIAL N FIXATION
o o o o N
o o o ci
procedure for doing so. Thus we caution the treatment of this value as an absolute and emphasize that we are much more comfortable that our range of possible global N fixation estimates includes the true value of global N fixation, than we are that our central estimate is the true value of global N fixation. Our data-based estimates compare to a modeled total N fixation input of 25 Tg N yr·' (data not shown), suggesting that while Century does seem to capture broad-scale patterns in N fixation (Figure 2) it also appears to significantly underestimate total inputs.
These estimates represent potential nitrogen fixation (i .e., ecosystem areas do not account for land-use changes), but accounting for the decrease in natural N fixation due to cultivation would not dramatically alter our estimate, as the greatest reductions in area have occurred in systems characterized by relatively low rates of N fixation (e .g. temperate forests and temperate grasslands; [Matthews, 1983]). Matthews [1983] suggests that -18 x 106 km2
(13 .6%) of all lands have been converted for cultivation. This value includes a contribution of -3 x 10⁶ km2 from extensive subsistence agriculture and -15 x 106 km2 for global crop acreage [Matthews, 1983]. Therefore we believe that decreasing our value by this value (i.e., 13 .6%) may provide a conservative estimate of actual present-day terrestrial BNF in natural ecosystems.
Our central value of 195 Tg N fixed per year in terrestrial ecosystems is higher than the values of 90-140 Tg N yr·' previously reported by Stedman and Shetter [1983], Soderland and Rosswall [1982], and Galloway et aI. , [1995]. Thus we believe that these authors may have underestimated terrestrial BNF. However, both our conservative and central estimates do fall within the range of 44-200 Tg N y(' reported by Schlesinger [1991] . Despite the similarity, we believe that our rigorous literature review provides a more documented, constrained estimate. Nonetheless, it is noteworthy that our independently derived estimate of terrestrial BNF is remarkably similar overall to this latter estimate.
Although we believe this study provides a much improved estimate of biological nitrogen fixation in terrestrial ecosystems, perhaps the most valuable aspect of this work is that it points out critical gaps in our understanding of N fixation at the local , regional, and global scale. In order to improve our understanding, key research needs include continued and expanded research investigating N fixation rates in natural and managed ecosystems, particularly in parts of Asia, Africa, and South America, where nitrogen fixation is likely to be important, but where data are scarce. For example, several of our ecosystem-scale estimates are based on only one-to-several published estimates, and data often vary widely (Table 13). A more rigorous evaluation of ecosystem-scale estimates will require more studies of BNF at the local scale within individual ecosystems. In addition, a greater emphasis should be placed on estimating the aerial coverage of N-fixing microsites and species, in order to improve estimates of N fixation budgets from the watershed-to-ecosystem scale . Finally, we would suggest that whenever possible, studies estimate BNF inputs within the context of other N inputs (e.g., wet and dry deposition), as well as the full suite of N loss vectors (e.g ., trace gas fluxes , organic and inorganic N leaching) . However, a recent global inventory of nitric oxide

Table 13. Global Inventory of Terrestrial Biological N Fixation in Natural Ecosystems
Potsdam Vegetation Type Area, Mean Estimate, Range of Estimates, kg N ha'! yr! Number of Total N Fixation, Tg yr· l Total N n
x 108 ha kg N ha'! yr'! Symbiotic Non·symbiotic Estimates ,
Conservative Central Upper-bound Fixation, %t e;;
~ Polar desert/alpine tundra 5.37 6.13 4.90 0.42 - 3.00 8a 1.54 3.29 5.05 1.69 Moist tundra 5.36 6.13 4.90 0.42 - 3.00 8a 1.53 3.29 5.04 1.69 Boreal forest 12.70 1.77 0.30 0.50 - 2.80 6h 2.00 2.24 2.48 LIS ~ Boreal woodland 6.60 1.77 0.30 0.50 - 2.80 6h 1.04 1.17 1.29 0.60 r Temperate mixed forest 5.30 16.04 1.00 - 160.00 0.00 - 2.80 31' 3.49 8.50 14.10 4.36 Temperate coniferous forest 2.51 16.04 1.00 - 160.00 0.00 - 2.80 31' 1.66 4.03 6.68 2.07 § Temperate deciduous forest 3.69 16.04 1.00 - 160.00 0.00 - 2.80 31' 2.43 5.92 9.81 3.03 Tall/medium grassland 3.65 2.70 0.10 - 10.00 0.10 - 21.00 lid 0.86 0.99 Ll1 0.51 t:C Short grassland 4.75 2.70 0.10 - 10.00 0.10 - 21.00 11 d 1.12 1.28 1.45 0.66 F: Tropical savanna 13.90 30.20 3.00 - 90.00 3.00 - 30.00 7' 22.70 41.90 61.10 21.48
~ Arid shrubland 14.80 22.04 30.00 - 97.50 0.50 - 13.001 3 13.99 32.56 50.12 16.69 Tropical evergreen forest (rain forest) 17.80 25.40 16.00 0.50 - 60.00 10 26.20 45.20 64.20 23.17 Xeromorphic forest 6.86 21.68 7.50 - 30.00 3.31 3 f 6.47 14.90 23.30 7.64 Tropical forested floodplain 0.18 36.45 243.00 NA 2 0.56 0.93 0.93 0.48 CI:l Desert 11.70 7.81 0.67 - 29.50 0.50 - 13.00 8 5.65 9.12 12.60 4.68 ~ Tropical non-forested floodplain 0.36 34.80 28.50 6.30 2 0.57 1.25 1.93 0.64 Temperate forested floodplain 0.11 16.04 1.00 - 160.00 0.00 - 2.80 31' 0.07 0.17 0.28 0.09 I Temperate non-forested floodplain 0.10 2.70 0.10 - 10.00 0.10 - 21.00 lid 0.02 0.03 0.03 0.Q2 Wet savanna 0.16 30.20 3.00 - 90.00 3.00 - 30.00 7e 0.27 0.49 0.72 0.25 Temperate savanna 6.89 2.70 0.10 - 10.00 0.10 - 21.00 11d 1.62 1.86 2.10 0.95
~ Temperate broadleafed evergreen forest 3.35 16.04 1.00 - 160.00 0.00 - 2.80 31' 2.20 5.37 8.89 2.75 Mediterranean shrubland 1.47 2.51 0.10 - 6.90 1.00 5 0.22 0.37 0.52 0.19 ~ Tropical deciduous forest 4.70 21.68 7.50 - 30.00 3.31 3f 4.43 10.20 16.00 5.23 Z
::!l Global Total 132.28 106 100.64 195.06 289.63 100.00 ~
'Like letters indicate estimates derived from the same set of literature values. ~ tpercentages based on central estimate of global N fixation. lOwing to a lack of published estimates, nonsymbiotic N fixation in arid shrublands was assumed to be equal to nonsymbiotic N fixation rates observed in desert ecosystems.

642 CLEVELAND ET AL.: GLOBAL PATIERNS OF 1ERRESTRlAL N FIXATION
(NO) emissions from soil suggests some possible correlations between N fixation inputs and trace gas outputs [Davidson and Kingerlee, 1997]. For example, both NO fluxes and N fixation are relatively low in grassland ecosystems, while both fluxes are relatively high in tropical savannas [Davidson and Kingertee, 1997]. Although these two studies utilize different vegetation classifications (which prohibits a direct comparison), these trends suggest a possible pOSitIve relationship between N fixation and N trace gas losses.
It is clear that human activity is dramatically increasing the amount of reactive N in many terrestrial systems and that such increases have a variety of environmental consequences [Galloway et aI., 1995; Howarth et aI., 1996; Vitousek et at., 1997]. It is worth noting that our estimates of BNF support prior claims that human activity has roughly doubled N fixation [Vitousek et aI., 1997; Vitousek, 1994a; Galloway et aI., 1995]. In addition, our ecosystem specific values show that in much of the temperate zone, the human effect is far greater; in some regions, anthropogenic N fixation is probably at least an order of magnitude greater than BNF. However, both the extent and the consequences of a changing N cycle are difficult to determine without a much improved understanding of biological N fixation. In particular, our ability to predict future changes in terrestrial N cycling is constrained by a lack of mechanistic knowledge about the primary controls over BNF. The simple relationships between ET and BNF shown here may have some predictive power, but a much more mechanistic understanding is necessary to predict how BNF will respond to simultaneous changes in climate, N deposition, and atmospheric CO2,
Acknowledgments. We would like to acknowledge Sujay Kaushal, Francis Chan, Chris Barteld, Brent Alspach, Andy Kurtz, Kerry Hughes and Ruth Sherman for their work on the original project. In addition, we thank Greg Asner and two anonymous reviewers for helpful comments on the initial manuscript. This work was supported in part by a Biosphere-Atmosphere Research Training Grant (e. Cleveland) to the University of Colorado from the National Science Foundation (BIR-9413218), and by a NASA New Investigator Program Award to Alan R. Townsend (NAGW-5253). In addition, we wonld like to acknowledge the Mellon Foundation and the National Science Foundation through the National Center for Ecological Analysis and Synthesis, for their support of the International SCOPE N Project.
References
Adams, M.A., and P.M. Attiwill, Role of Acacia spp. in nutrient balance and cycling in regenerating Eucalyptus regnans F. Mue\1. forests, II, Field studies of acetylene reduction, Aust. J. Bot., 32, 217-223, 1984.
Akkermans, A.D.L, and A. Houwers, Morphology of nitrogen fixers in forest ecosystems, in Biological Nitrogen Fixation in Forest Ecosystems: Foundations and Applications, edited by J.e. Gordon and e.T Wheeler, pp. 7-53, Martinus Nijhoff/Zoetermeer, Netherlands, 1983.
Alexander, V., and M.M. Billington, Nitrogen fixation in the Alaskan Taiga, in Forest Ecosystems in the Alaskan Taiga, edited by K. Van Cleve et aI., pp. 112-121, Springer-Verlag, New York, 1986.
Alexander, M. (Ed.), Biological Nitrogen Fixation: Ecology, Technology and Physiology, 247 pp., Plenum, New York, 1981.
Ambasht, R.S., and A.K. Srivastava, Nitrogen dynamics of actinorhizal Casuarina forest stands and its comparison with Alnus and Leucaena forests, Curro Sci., 66,160-163,1994.
Asner, G.P., T.R. Seastedt, and A.R. Townsend, The decoupling of terrestrial carbon and nitrogen cycles, BioScience, 47, 226-234, 1997.
Babb, T.A., and D.W.A. Whitfield, Mineral nutrient cycling and limitation of plant growth in the Truelove Lowland Ecosystem, in Truelove Lowland, Devon Island, Canada: A High Arctic Ecosystem, edited by Le. Bliss, pp. 589-606, Univ. of Alberta Press, Edmonton, Canada, 1977.
Baker, TG., G.R. Oliver, and P.D. Hodgkiss, Distribution and cycling of nutrients in Pinus radiata as affected by past lupine growth and fertilizers, For. Eco!. Manage., 17, 169-188, 1986.
Balandreau, J., and G. Villemin, Fixation biologique de l'azote moleculaire en savanna de Lamto, resultats preliminaires, Rev. Eco!. BioI. Sol., 10,25-33, 1973.
Bate, G.e., and e. Gunton, Nitrogen in the Burkea savanna, in Ecology of Tropical Savannas, edited by BJ. Huntley and B.H. Walker, pp. 498-513, Springer-Verlag, New York, 1982.
Binkley, D., K. Cromack Jr., and D.D. Baker, Nitrogen fixation by red alder: Biology, rates, and controls, in The Biology and Management oj Red Alder, edited by D.E. Hibbs et aI., pp. 57-72, Oregon State Univ. Press, Corvalis, 1994.
Blundon, DJ., and M.RT Dale, Dinitrogen fixation (acetylene reduction) in primary succession near Mount Robson, British Columbia, Canada, Arct. Alp. Res., 22, 255-263, 1990.
Boden, T, G. Marland, and B. Andres, Estimates of global, regional and national annual C02-emissions from fossil-fuel burning, hydraulic cement production and gas flaring: 1950-1992, rep., Carbon Dioxide InL and Anal. Cent., Oak Ridge Nat. Lab., Oak Ridge, Tenn., 1995.
Boring, LR., W.T. Swank, J.B. Waide, and G.S. Henderson, Sources, fates and impacts of nitrogen inputs to terrestrial ecosystems: Review and synthesis, Biogeochemistry, 6, 119-159, 1988.
Boring, LR., and WT Swank, The role of black locust (Robinia pseudoacacia) in forest succession, 1. Ecol., 72, 749-766, 1984.
Bowman, W.D., J.e. Schardt, and S.K. Schmidt, Symbiotic N2-fixation in alpine tundra: Ecosystem input and variation in fixation rates among communities, Oecologia, 108, 345-350,1996.
Bruijnzeel, LA., Nutrient input-output budgets of tropical forest ecosystems: A review, J. Trop. Ecol., 7,1-24,1991.
Cadisch, G., R.M. Schunke, and K.E. Giller, Nitrogen cycling in a pure grass pasture and a grass-legume mixture on a red latosol in Brazil, Trop. Grass .. 28,43-52,1994.
Chameides, W.L, P.S. Kasibhatla, J. Yienger, and H. Levy II, The growth of continental-scale metro-agro-plexes, regional ozone pollution, and world food production, Science, 264, 74-77, 1994.
Chapin, D.M., L.e. Bliss, and L.J. Bledsoe, Environmental regulation of nitrogen fixation in a high arctic lowland ecosystem, Can. J. Bot., 69, 2744-2755,1990.
Christie, P., Nitrogen in two contrasting Antarctic bryophyte communities, J Ecol., 75, 73-93, 1987.
Clair, TA, TL Pollock, and J.M. Ehrman, Exports of carbon and nitrogen from river basins in Canada's Atlantic Provinces, Global Biogeochem. Cycles, 8,441-450, 1994
Cornaby, B.W. and J.B. Waide, Nitrogen fixation in decaying chestnut logs, Plant Soil, 39, 445-448, 1973.
Crawford, E., and J. Gosz, Desert ecosystems: Their resources in space and time, Environ. Conserv.,9, 181-195, 1982.
Cushon, G.H., and M.e. Feller, Asymbiotic nitrogen fixation and denitrification in a mature forest in coastal British Columbia, Canada, Can. 1. For. Res., 19, 1194-1200, 1989.
Davidson, E.A and W. Kingerlee, A global inventory of nitric oxide emissions from soils, Nutrient Cycling Agroecosystems, 48, 37-50, 1997.
DiStefano, J.F., and H.L Gholz, Nonsymbiotic biological nitrogen fixation (acetylene reduction) in an age sequence of slash pine plantations in North Florida, USA, For. Sci., 35, 863-869, 1989.
Dobereiner, J., Potential for nitrogen fixation in tropical legumes and grasses, in Limitations and Potentials jor Biological Nitrogen Fixation in the Tropics, edited by J. Dobereiner, R. Burris, A. Hollaender, pp. 13-24, Plenum, New York, 1977.
Domingo, LL., Nitrogen fixation in Southeast Asian forestry: Research and practice, in Biological Nitrogen Fixation in Forest Ecosystems: Foundations and Applications, edited by J.e. Gordon and e.T Wheeler, pp. 295-315, Martinus Nijhoff/Zoetermer, Netherlands, 1983.
Doyle, RD., and T.R. Fisher, Nitrogen fixation by periphyton and plankton on the Amazon floodplain at Lake Calado, Plant Soil, 67, 41-66,1982.

CLEVELAND Ef AL.: GLOBAL PATIERNS OF 1ERRESTRIAL N FIXATION 643
DuBois, J.D., and L.A. Kapustka, Biological nitrogen influx in an Ohio relict prairie, Am. J. Bot., 70, 8-16, 1983.
Edmisten, J., Preliminary studies on the nitrogen budget of a tropical rainforest, in A Tropical Rainforest, edited by H.T. Odurn and RF. Pigeon, pp.H211-H215, Office of Info. Serv., U.S. At. Energy Comm., Springfield, Va., 1970.
Eisle, K.A., D.S. Schimel, L.A. Kapustka, and WJ. Parton, Effects of available P and N:P ratios on non-symbiotic dinitrogen fixation in tallgrass prairie soils, Oecologia, 79,471-474, 1989.
Fahey, T.J., J.B. Yavitt, J.A. Pearson, and D.H. Knight, The nitrogen cycle in lodgepole pine forests, southeastern Wyoming, Biogeochemistry, 1, 257-275,1985.
Felfili, J.M., and M.C. Da Silva, A comparative study of cerrado (sensu stricto) vegetation in Central Brazil, J. Trop. Ecol., 9, 277-289,1993.
Forman, R.T.T., Canopy lichens with blue-green algae: A nitrogen source in a Colombian rain forest, Ecology, 56, 1176-1184, 1975.
Gadgil, RL., The nutritional role of Lupinus arboreus in coastal dune forestry, III, Nitrogen distribution in the ecosystem before tree planting, Plant Soil, 35,113-126,1971.
Galloway, 1.N., W.H. Schlesinger, H. Levy II, A. Michaels, and J.L. Schnoor, Nitrogen fixation: Anthropogenic enhancement, environmental response, Global Biogeochem. Cycles, 9, 235-252, 1995.
Goosem, S., and D. Lamb, Measurements of Phyllosphere nitrogen fixation in a tropical and two sub-tropical rainforests, J. Trop. Ecol., 2, 373-376, 1986.
Gorham, E., P.M. Vitousek, and W.A. Reiners, The regulation of chemical budgets over the course of terrestrial ecosystem succession, Ann. Rev. Ecol. Syst., 10, 53-84, 1979.
Grant, D., and D. Binkley, Rates of free-living nitorogen fixation in some Piedmont forest types, For. Sci., 33, 548-551,1987.
Grove, T.S., and N. Malajczuk, Nodule production and nitrogen fixation (acetylene reduction) by an understory legume (Bossiaea laidlawiana) in Eucalyptus forest, J. Ecol., BO, 303-314,1992.
Groves, RH., Nutrient cycling in heathlands. in Ecosystems of the world, vol. 9B Heathlands and related shrublands, edited by R L. Sprecht. pp. 151-163. Elsevier, New York, 1981.
Gutschick. V.P .• Evolved strategies in nitrogen acquisition in plants, Am. Nat.,11B, 607-637, 1981.
Gutschick. V.P. (Ed.), A junctional biology of crop plants. 230 pp .• Timber Press, Portland, Oreg .• 1987.
Hardy, RW.F .• R.D. Holsten, B.K. Jackson, and RC. Bums, The acetylene-ethylene assay for Nz-fixation: Laboratory and field evaluation, Plant Physiol., 43.1185-1207,1968. .
Hardy, RW.F., RC. Bums, and R.D. Holstein, Applications of the acetylene-ethylene assay for measurement of nitrogen fixation, Soil BioI. Biochem., 5.47-81. 1973.
Harvey, A.E., MJ. Larsen, M.F. Jurgensen, and E.A. Jones, Nitrogenase activity associated with decayed wood of living northern Idaho. USA conifers, Mycologia, BI. 765-771.1989.
Heath, B., P. Sollins, D.A. Perry, and K. Cromack, Asymbiotic nitrogen fixation in litter from Pacific Northwest forests, Can. J. For. Res .• lB. 68-74,1988.
Hedin, L.O., lJ. Armesto. and A.H. Johnson, Patterns of nutrient loss from unpolluted, old-growth temperate forests: Evaluation of biogeochemical theory, Ecology, 76,493-509. 1995.
Hendrickson, O.Q., Asymbiotic nitrogen fixation and soil metabolism in three Ontario forests, Soil Bioi. Biochem., 22. 967-971, 1990.
Hendrickson, O.Q., and D. Burgess, Nitrogen-fixing plants in a cut-over lodgepole pine stand of southern British Columbia, Can. J. For. Res., 19,936-939.1989.
Henry. G.H.R.. and J. Svoboda, Dinitrogen fixation (acetylene reduction) in high arctic sedge meadow communities. Arct. Alp. Res., IB, 181-187. 1986.
Herman, R.P .• K.R. Provencio, R.J. Torrez. and G.M. Seager. Effect of water and nitrogen additions on free-living nitrogen fixer populations in desert grass root zones, Appl. Environ. Microbiol., 59. 3021-3026. 1993.
Hingston, FJ., N. Malajczuk, and T.S. Grove, Acetylene reduction by jarrah forest legumes following fire and phosphate application, J. Appl. Ecol..I9. 631-645,1982.
Howarth, R.W. et al., Regional nitrogen budgets and rivering N and P fluxes for the drainages to the North Atlantic Ocean: Natural and human influences. in Nitrogen Cycling in the North Atlantic Ocean
and Its Watersheds, Report of the International Scope Nitrogen Project, edited by R.W. Howarth, pp. 75-141, Kluwer Acad., Norwell. Mass, 1996.
Huss-Danell, K., Nitrogen fixation by Stereocaulon paschale under field conditions, Can. J. Bot., 55, 585-592,1977.
Jarrell, W.M .• and R.A. Virginia, Soil cation accumulation in a mesquite woodland: Sustained production and long-term estimates of water use and nitrogen fixation, J. Arid Environ.,IB, 51-58, 1990.
Jenny. H., Causes of the high nitrogen and organic matter content of certain tropical forest soils, Soil Sci., 69, 63-69, 1950.
Johnson, H.B .• and H.S. Mayeux. Prosopis glandulosa and the nitrogen balance of rangelands: Extent and occurrence of nodulation, Oecologia. B4. 176-185. 1990.
Jordan. C.W .• W. Caskey. G. Escalante. R Herrera, F. Montagnini, R. Todd, and C. Uhl. The nitrogen cycle in a 'Terra Firme' rainforest on oxisol in the Amazon territory of Venezuela, Plant Soil. 67, 325-332. 1982.
Jurgensen, M.F., R.T. Graham. M.J. Larsen, and A.E. Harvey, Clearcutting woody residue removal and nonsymbiotic nitrogen fixation in forest soils of the inland Pacific Northwest, Can. J. For. Res., 22, 1172-1178,1992.
Kapustka, L.A., and J.D. DuBois. Dinitrogen fixation by cyanobacteria and associative rhizosphere bacteria in the Arapaho Prairie in the Sand Hills of Nebraska, Am. J. Bot., 74. 107-113. 1987.
Kummerow, J., J.V. Alexander. J.W. Neel. and K. Fishbeck, Symbiotic nitrogen fixation in Ceanothus roots. Am. J. Bot., 65. 63-69,1978.
Larsen, lJ., M.F. Jurgensen, and A.E. Harvey, N z fixation associated with wood decayed . by some common fungi in western Montana, Can. 1. For. Res., B. 341-345, 1978.
Lawrie, A.C., Nitrogen fixation by native Australian legumes, Aust. 1. Bot., 29, 143-157, 1981.
Lennihan, R .• D.M. Chapin, and L.G. Dickson. Nitrogen fixation and photosynthesis in high arctic forms of Nostoc commune, Can. J. Bot., n,940-945, 1994.
Lepper. M.G .• and M. Fleschner, Nitrogen fixation by Cercocarpus ledifolius in pioneer habitats. Oecologia, 27,333-338,1977.
Lewis, W.M., J.M. Melack, W.H. McDowell. M. McClain, and J.E. Richey, Nitrogen yields from undisturbed watersheds, Biogeochemistry, in press, 1999.
Ley, RE., and C.M. D'Antonio. Exotic grass invasion alters potential rates ofN fixation in Hawaiian woodlands, Oecologia, 113, 179-187, 1997.
Liaw. Y.P., D.L. Sisterson, and N.L. Miller, Comparison of field. laboratory, and theoretical estimates of global nitrogen fixation by lightning. 1. Geophys. Res .• 95. 22489-22494, 1990.
Likens. G.E., F.R. Bormann, R.S. Pierce, J.S. Eaton, and N.M. Johnson, Biogeochemistry of a Forested Ecosystem, Springer-Verlag. New York,1977.
Logan, J.A., Nitrogen oxides in the troposphere: Global and regional budgets,l. Geophys. Res., BB, 10785-10807, 1983.
Lugo, A.E., and F.N. Scatena. Ecosystem-level properties of the Luquillo experimental forest with emphasis on the Tabonuco forest, In Tropical Forests: Management and Ecology. edited by A. E. Lugo and C. Lowe, pp. 59-109, Springer-Verlag, New York, 1995.
Luken, 1.0.. and RW. Fonda, Nitrogen accumulation in a chronosequence of red alder communities along the Hoh River, Olympic National Park, Washington, Can. J. For. Res., 13, 1228-1237.1983.
Maheswaran. J., and LA.U.N. Gunatilleke, Nitrogenase activity in soil and litter of a tropical lowland rain forest and an adjacent fernland in Sri Lanka, J. Trop. Ecol., 6, 281-289, 1990.
Martinelli, L.A., RL. Victoria, P.C.O. Trivelin, A.H. Devol, and J.E. Richey. ISN Natural abundance in plants of the Amazon River floodplain and potential atmospheric Nz fixation, Oecologia, 90, 591-596, 1992.
Martinelli, L.A., M.C. Piccolo, A.R. Townsend, P.M. Vitousek, E. Cuevas, W. McDowell, G.P. Robertson, O.C. Santos. and K. Treseder, Nitrogen stable isotopic composition of leaves and soil: Tropical versus temperate forests, Biogeochemistry, in press. 1999.
Matthews, E .• Global vegetation and land use: New high-resolution data bases for climate studies, J. Clim. Appl. Meteorol., 22, 474-487, 1983.
Matthews. E .• Nitrogenous fertilizers: Global distribution of consumption and associated emissions of nitrous oxide and ammonia, Global Biogeochem. Cycles, B,411-439.1996.

644 CLEVELAND ill AL.: GWBAL PA TIERNS OF TERRESTRIAL N FlXA nON
May. D.E., and PJ. Webber, Spatial and temporal variation of vegetation and its productivity on Niwot Ridge, Colorado, in Ecological Studies in the Colorado Alpine, a Festschrift for Iohn W. Marr, edited by H. Halfpenny, pp. 35-62, Institute for Arctic and Alpine Research, Univ. of Colorado, Boulder, Colo., 1982.
Metting, B., Biological surface features of semi-arid lands and deserts, in Semiarid Lands and Deserts, edited by J. Skujins, pp. 257-293, Marcel Dekker, New York, 1991.
Nohrstedt, H., Non symbiotic nitrogen fixation in the topsoil of some forest stands in central Sweden, Can. I. For. Res., 15,715-722,1985.
O'Connell, A.M., and T.S. Grove, Seasonal variation in C2H2 reduction (N2-fixation) in the litter layer of eucalypt forests of south-western Australia, Soil Bioi. Biochem., 19, 135-142, 1987.
Ojima, D.S., D.S. Schimel, W.J. Parton, and C.E. Owensby, Long- and short-term effects of fire on nitrogen cycling in tallgrass prairie, Biogeochemistry, 24, 67-84, 1994.
Parkin, T.B., and 1.A. Robinson, Statistical evaluation of median estimators for lognormally distributed variables, Soil Sci. Soc. Am. I., 57,317-323, 1993.
Parton, WJ., D.S. Sehimel, C.V. Cole, and D.S. Ojima, Analysis of factors controlling soil organic matter levels in Great Plains grasslands, Soil Sci. Soc. Am. I., 51,1173-1179,1987.
Parton, W.J. et al., Observations and modeling of biomass and soil organic matter dynamics for the grassland biome worldwide, Global Biogeochem. Cycles, 7,785-809,1993.
Paul, E.A., and FE. Clark, Soil Microbiology and Biochemistry, Academic, San Diego, Calif., 1989.
Permar, T.A., and RF Fisher, Nitrogen fixation and accretion by wax myrtle in slash pine plantations, For. Ecol. Manage., 5, 39-46, 1983.
Piccolo, M.e., c. Neill, and e.C. Cerri, Natural abundance of lsN in soils along forest-to-pasture chronosequences in the western Brazilian Amazon Basin, Oecologia, 99,112-117,1994.
Robertson, G.P., and T. Rosswall, Nitrogen in West Africa: The regional cycle, Ecol. Monogr., 56, 43-72, 1986.
Rosenzweig, M.L., Net primary productivity of terrestrial communities: Prediction from climatological data, Am. Nat., 102,67-74,1968.
Roskowski, J.P., Nitrogen fixation in northern hardwood forests, Ph.D. dissertation, Yale University, New Haven, Conn., 1977.
Roskowski, J., Nitrogen fixation in hardwood forests of the northeastern United States, Plant Soil, 54, 33-44, 1980.
Roskowski, J.P., Comparative C2H2 reduction and 15N 2 fixation in deciduous woody litter, Soil BioI. Biochem., 13,83-85, 1981.
Rosswall, T., and U. Granhall, Nitrogen cycling in a subarctic ombrotrophic mire, in Ecology of a Subarctic Mire, edited by M. Sonesson, Eco!. Bull. 30, pp. 209-234, 1980.
Rundel, P.W., and J.W. Neel, Nitrogen fixation by Trevoa trinervis in the Chilean matorral, Flora, 167, 127-132, 1978.
Rundel, PW., E.T. Nelson, M.R. Sharifi, R.A. Virginia, W.M. Jarrell, D.H. Kohl, and G.B. Shearer, Seasonal dynamics of nitrogen cycling for a Prosopis woodland in the Sonoran Desert, Plant Soil, 67, 343-353, 1982.
Rychert, R, and J. Skujins, Nitrogen fixation by blue-green algae-lichen crusts in the Great Basin Desert, Soil Sci. Soc. Am. Proc., 38, 768-771,1974.
Rychert, R., J. Skujins, 1. Sorenson, and D. Porcella, Nitrogen fixation by lichens and free-living microorganisms in deserts, in Nitrogen in Desert Ecosystems, edited by N. E. West and 1 Skujins, pp. 20-30, Van Nostrand Reinhold, New York, 1978.
Salati, E., R. Sylvester-Bradley, and R.L. Victoria, Regional gains and losses of nitrogen in the Amazon basin, Plant Soil, 67, 367-376, 1982.
Schimel, D.S., B.H. Braswell, and W.J. Parton, Equilibration of the terrestrial water, nitrogen and carbon cycles, Proc. Nat. Acad. Sci. U.S.A. 94,8280 .. 8283,1997.
Schimel, D.S., B.H. Braswell, R McKeown, D.S. Ojima, W.J. Parton and W. Pulliam, Climate and nitrogen controls on the geography and times cales of terrestrial biogeochemical cycling, Global Biogeochem. Cycles, 10,677-692,1996.
Schlesinger, W.H., Biogeochemistry: An Analysis oj Global Change, Academic, San Diego, Calif., 1991.
Schlesinger, W.H., J.T. Gray, D.S. Gill, and B.E. Mahall, Ceanothus megacarpus chaparral: A synthesis of ecosystem processes during development and annual growth, Bot. Rev., 48, 71-117, 1982.
Schulze, E.D., G. Gebauer, H. Ziegler, and O.L. Lange, Estimates of
nitrogen fixation by trees on an aridity gradient in Nabibia, Oecologia, 88, 451-455,1991.
Schwintzer, C.R., Nonsymbiotic and symbiotic nitrogen fixation in a weakly minerotrophic peatJand, Am. I. Bot., 70, 1071-1078, 1983.
Shearer, G., D.H. Kohl, RA. Virginia, B.A. Bryan, J. Skeeters, E.T. Nilsen, M.R Sharifi, and P.W. Rundel, Estimates of N-fixation from variations in the natural abundance of 15N in Sonoran Desert ecosystems, Oecologia, 56, 363-373, 1983.
Shearer, R., and D.H. Kohl, N2-fixation in field settings: Estimations based on natural 15N abundance, Aust. I. Plant Physiol., 13, 699-756, 1986.
Sheridan, R.P., Nitrogenase activity by Hapalosiphon flexuosus associated with Sphagnum erythrocalyx in cloud forest on the volcano La Soufriere, French West Indies, Biotropica, 23, 134-140, 1991.
Silvester, W.B., Analysis of nitrogen fixation, in Biological Nitrogen Fixation in Forested Ecosystems: Foundation and Applications, edited by J.e. Gordon and C.T. Wheeler pp. 173-212, Martinus NijhoffiZoetermeer, Netherlands, 1983.
Skujins, J.C., C. Tann, and I. BoIjesson, Dinitrogen fixation in a montane forest sere determined by nitrogen-IS assimilation and in-situ acetylene reduction, Soil Bioi. Biochem., 19, 465-472, 1987.
Smith, V.R., Production and nutrient dynamics of plant communities on a sub-Antarctic Island, Polar Bioi., 8, 255-269, 1988.
Soderland, R., and T. Rosswall, The nitrogen cycles, in The Handbook of Environmental Chemistry, edited by O. Hutzinger, pp. 61-81, Springer-Verlag, New York, 1982.
Solheim, B., A. Endal, and H. Vigstad, Nitrogen fixation in Arctic vegetation and soils from Svalbard, Norway, Polar Bioi., 16, 35-40, 1996.
Sollins, P., C.C. Grier, F.M. McCorison, K. Cromack, R. Fogel, and R.L. Fredriksen, The internal element cycles of an old-growth Douglas-fir ecosystem in western Oregon, Ecol. Monogr., 50,261-285, 1980.
Sprent, J.I., I.E. Geoghegan, P.W. Whitty, and E.K. James, Natural abundance of lsN and 13C in nodulated legumes and other plants in the cerrado and neighboring regions of Brazil, Oecologia, 105, 440-446,1996.
Srivastava, S.c., and lS. Singh, Microbial C, N, and P in dry tropical forest soils: Effects of alternate land-uses and nutrient flux, Soil BioI. Biochem., 23, 117-124, 1991.
Stedman, D.H., and RE. Shetter, The global budget of atmospheric nitrogen species, in Trace Atmospheric Constituents: Properties, Transformations and Fates, edited by S.S. Schwartz, pp. 411-454, John Wiley, New York, 1983.
Stewart, W.D.P., MJ. Samapio, A.O. Isichei, and R Sylvester-Bradley, Nitrogen fixation by soil algae of temperate and tropical soils, in Limitations and Potentials for Biological Nitrogen Fixation in the Tropics, edited by J. Dobereiner, R.H. Burris, and A. Hollaender, pp. 41-63, Plenum, New York, 1978.
Swank, W.T., and J.B. Waide, Characterization of baseline precipitation and stream chemistry and nutrient budgets for control watersheds, in Forest Hydrology and Ecology at Coweeta, edited by W.T. Swank and D.A. Crossley, pp. 57-81, Springer-Verlag, New York, 1987.
Sylvester-Bradley, R., L.A. De Oliviera, J.A. De Podesta Filho, and T.V. S!. John, Nodulation of legumes, nitrogenase activity of roots, and occurrence of nitrogen-fixing Azospirillum spp. in representative soils of Central Amazonia, Agro-Ecosystems, 6, 249-266, 1980.
Tjepkema, J., Nitrogen fixation in forests of central Massachusetts, Can. I. Bot., 57, 11-16, 1979.
Todd, R.L., R.D. Meyer, and lB. Waide, Nitrogen fixation in a deciduous forest in the south-eastern United States, in Environmental Role of Nitrogen-Fixing Blue-Green Algae and Asymbiotic Bacteria, edited by U. Granhall, pp. 172-177, Swedish Nat. Sci. Res. Counc., Stockholm, 1978.
Townsend, A.R., B.H. Braswell, E.A. Holland, and 1.E. Penner, Spatial and temporal patterns in terrestrial carbon storage due to deposition of fossil fuel nitrogen, Ecol. Appl., 6, 806-814,1996.
Van Cleve, K., and V. Alexander, Nitrogen cycling in tundra and boreal ecosystems, in Terrestrial Nitrogen Cycles, edited by F.E. Clark and T. Rosswall, Eco!. Bull. 33, pp. 375-404, 1981.
Vitousek, P.M., Beyond global warming: Ecology and global change, Ecology, 75,1861-1876, 1994a.
Vitousek, P.M., Potential nitrogen fixation during primary succession in Hawaii Volcanoes National Park, Biotropica, 26,234-240, 1994b.

CLEVELAND Ef AL.: GLOBAL PATIERNS OFlERRES1RIAL N FIXATION 645
Vitousek, P.M., and C.B. Field, Ecosystem constraints to symbiotic nitrogen fixers: A simple model and its implications, Biogeochemistry, in press, 1999.
Vitousek, P.M., and R.W. Howarth, Nitrogen limitation on land and sea: How can it occur? Biogeochemistry, 13, 87-115, 1991.
Vitousek, P.M., and R.L. Sanford, lr., Nutrient cycling in moist tropical forest, Ann. Rev. Ecol. Syst. U.S.A., 17,137-167,1986.
Vitousek, P.M., 1.D. Aber, RW. Howarth, G.E. Likens, P.A. Matson, D.W. Schindler, W.H. Schlesinger, and D.G. Tilman, Human alteration of the global nitrogen cycle: Sources and consequences, Ecol. Appl., 7, 737-750,1997.
Waide, 1.B., W.H. Caskey, R.L. Todd, and L.R Boring, Changes in soil nitrogen pools and transformations following forest clearcutting, in Forest Hydrology and Ecology at Coweeta, edited by W.T. Swank and D.A. Crossley, pp. 221-232, Springer-Verlag, New York, 1988.
Wallace, A., E.M. Romney, and R.B. Hunter, Nitrogen cycle in the northern Mojave desert: Implications and predictions, in Nitrogen in Desert Ecosystems, edited by N.E. West and 1.1. Skujins, pp. 207-218, Van Nostrand Reinhold, New York, 1978.
Warembourg, P.R, Nitrogen fixation in soil and plant systems, in Nitrogen Isotope Techniques, edited by R. Knowles and T.H. Blackburn, pp. 127-156, Academic, San Diego, Calif., 1993.
Weber, M.G., and K. Van Cleve, Nitrogen dynamics in the forest floor of interior Alaska black spruce ecosystems, Can. 1. For. Res., 11, 743-751,1981.
West, N.E., and 1. Skujins, Nitrogen cycle in semi-desert ecosystems, Oecol. Plant., 12, 46-53,1977.
Whitehead, D.C., Grassland Nitrogen, CAB International, Guilford, U.K.,1995.
Woodmansee, RG., and L.S. Wallach, Effects of fire regimes on biogeochemical cycles, in Terrestrial Nitrogen Cycles, edited by P.E. Clark and T. Rosswall, Eco!. Bull. 33, pp. 649-669, 1981.
Woodmansee, R.G., I. Vallis, and 1.1. Mott, Grassland nitrogen, in Terrestrial Nitrogen Cycles, edited by P.E. Clark and T. Rosswall, Eco!. Bull. 33, pp. 443-462, 1981.
Yates, L.R., P.W. Rundel, R Sylvester-Bradley, and R.E. Cisternas, Report of the work group on savannas and shrublands, Plant Soil, 67, 409-413, 1982.
Yoneyama, T., T. Muraoka, T. Murakami, and N. Boonkerd, Natural abundance of 15N in tropical plants with emphasis on tree legumes, Plant Soil, 153,295-304,1993.
Zechmeister-Boltenstern, S., and H. Kinzel, Non-symbiotic nitrogen fixation associated with temperate soils in relation to soil properties and vegetation, Soil BioI. Biochem., 22, 1075-1084, 1990.
c. C. Cleveland and A. R. Townsend, Institute for Arctic and Alpine Research, Campus Box 450, University of Colorado, Boulder, CO 80309. ([email protected])
A. Elseroad, L. O. Hedin, R W. Howarth, E. F. Latty, S. S. Perakis, 1. C. Von Fischer, and M. Wasson, Department of Ecology and Systematics, Cornell University, Ithaca, NY, 14853.
H. Fisher and D. S. Schimel, National Center for Atmospheric Research, P. O. Box 3000, Boulder, CO 80307-3000.
(Received April 10, 1998; revised February 10, 1999; accepted February 19, 1999.)