global oil gas - wolfe research · global oil & gas collapse of the ... source: bloomberg...
TRANSCRIPT

Paul SankeyManaging Director, Global Oil & Gas646‐582‐[email protected]
David T. Clark, CFA646‐582‐[email protected]
Silvio Micheloto, CFA646‐582‐[email protected]
Vin Lovaglio646‐582‐[email protected]
Bob Parija, CFA646‐582‐[email protected]
Global Oil & GasCollapse of the Saudi Put, Rise of the
Eagle Ford CallJanuary 12, 2015
This report is limited solely for the use of clients of Wolfe Research. Please refer to the DISCLOSURE SECTION located at the end of this report for Analyst Certifications and Other Disclosures. For Important Disclosures, please go to www.WolfeResrearch.com/Disclosures or write to us at Wolfe Research LLC, 420 Lexington Avenue, Suite 648, New York, NY 10170. 1

2
New Forecasts and How The Market Has Changed
Note: “Big Four” basins included in this chart are Bakken, Eagle Ford, Permian and Niobrara/DJ BasinSource: EIA, IEA, Company reports, Wolfe Research estimates
40
50
60
70
80
90
100
110
3Q14
E
4Q14
E
Spot
1Q15
E
2Q15
E
3Q15
E
4Q15
E
1Q16
E
2Q16
E
3Q16
E
4Q16
E
1Q17
E
2Q17
E
3Q17
E
4Q17
E
Consensus WTI
WR WTI
Strip WTI
40
50
60
70
80
90
100
110
3Q14
E4Q
14E
Spot
1Q15
E2Q
15E
3Q15
E4Q
15E
1Q16
E2Q
16E
3Q16
E4Q
16E
1Q17
E2Q
17E
3Q17
E4Q
17E
Consensus Brent
WR Brent
Strip Brent
0
20
40
60
80
100
120
Feb‐08 Jul‐09 Nov‐10 Apr‐12 Aug‐13 Dec‐14 May‐16 Sep‐17 Feb‐19
2008 2009 2010 2011 2012 2013 2014
$74 for YE17delivery
$66 front month
Current futures strip
2008 futures strip
30
40
50
60
70
80
90
100
110
120
Feb‐08 Jul‐09 Nov‐10 Apr‐12 Aug‐13 Dec‐14 May‐16 Sep‐17 Feb‐19
$/bb
l
2009 2010 2011 2012 2013 2014 2015
$72/bbl for 2018 delivery
$22 contango overthree year curve ‐ and
first contango post 2010$50/bbl spot
Contango steeper in 2008/9
BRENT WTI

Get ready for really bad earningsThat get worse in 2015
3Source: Bloomberg Finance LP, Wolfe Research estimates
Technology change destroys cartelsAssuming market is now set not by call on OPEC by “Call on Big Four US” Marginal cost of US supply is long term price setter; economics not politics
Cut 2015 from $75 to $56/BrentCut long term oil price from $90 to $80/Brent

4
Energy capex in the S&P 500
Source: Wolfe Research Portfolio Strategy, Standard & Poor’s, Compustat, Factset
4%
4%
7%
7%
9%
10%
11%
12%
33%
0% 5% 10% 15% 20% 25% 30% 35%
Healthcare
Materials
Telecom
Staples
Tech
Industrials
Cons Disc
Utilities
Energy
Sector Contributions to Overall S&P 500 Capex

5
Demand growth & global oil pricesLong‐term OECD & Non‐OECD oil demand growth
Source: IEA, BP,. Wolfe Research
Oil broke $50/bbl (real 2013 US$ in 1986 and did not rise above that until 2005
But unlike 1986 larger total market today faces more rapid decline rates in marginal growth –market should adjust much faster

0
10
20
30
40
50
60
70
80
0 5,000 10,000 15,000 20,000 25,000 30,000 35,000 40,000 45,000 50,000 55,000 60,000 65,000 70,000 75,000 80,000 85,000 90,000 95,000
Oil
pric
e $/
bbl
Global Liquids Production Kbd
SAUDI & OPEC NGLs IRAQ
KUWAITUAE
QATARProc Gains Biofuels VE
NEZUELA
LIBY
A/OMAN
/EGYP
T
IRAN
US DW GULF OF MEX
ICO
MAL
AYSIA
INDONESIA
ASIA
PAC
NIGER
IA
CASPIAN
NORT
HAM
ERICAN
CONVE
NTIONAL
MEX
ICO
RUSSIA
CHINA ONSH
ORE
/SHA
LLOW
CANAD
IAN OIL SAN
DS IN
SITU
COLO
MBIA/
ARGEN
TINA/
ECUAD
OR
NORT
HSEA
ANGOLA
OFFSH
ORE
OTH
ERAF
RICA
/MIDDL
E EA
ST
BRAZ
ILCA
NAD
IANOIL SAN
DS MINING
NORT
HAM
ERICAN
UNCO
NVE
NTIONAL
CORE
NORT
HAM
ERICAN
UNCO
NVE
NTIONAL
2nd
TIER PLAY
SNORT
HAM
ERICAN
UNCO
NVE
NTIONAL
MAR
GINAL
The sustainable level for global oil prices in the medium-term should be set by the short-cycle cash cost of supply of existing production. For long-cycle projects, that is cash opex and ongoing sustaining
capex per barrel. For short-cycle unconventional, it is the cost of drilling an incremental well (i.e., not the
full-cycle cost including allocation of infrastructure/SG&A, etc.). Given the time lag in
reducing production (several months or quarters), short -term support is inherently uncertain.
We calculate the WTI price breakeven for a zero percent return for the marginal producers/areas of the
key unconventional basins to be about $70/bbl.
In 2008 oil fell to the level of cash costs in the Canadian oil sands ($35-40/bbl).
The growth of US uonventional has moved the cost of the marginal barrel higher, but in the short term, given the amount of supply imbalance, oil sands
may still be the floor.
6
Medium‐term global oil cost curveButterfly market, next psychological anchor is probably Oil Sands
mining/upgrading at $35‐40/bbl
Source: IEA, EIA, Wood Mackenzie, Company reports, Bloomberg Finance LP, Wolfe Research

7
Long term global oil cost curveDebatable where Saudi/OPEC fit, need around 100Mbd of development
Source: IEA, EIA, Wood Mackenzie, Company reports, Bloomberg Finance LP, Wolfe Research
0
20
40
60
80
100
120
140
0 10 20 30 40 50 60 70 80 90 100 110 120 130 140 150 160 170 180 190 200 210 220 230 240 250 260 270 280 290 300 310 320
Oil
pric
e $/
bbl
Potential Oil Reserves Development
SAUDI
IRAQ
KUWAITUAE
QATAR
Proc Gains Biofuels
VENEZUELA
IRAN
US DW GULF OF MEX
ICO
Liby
a
MEX
ICO
RUSSIA
CHINA ONSH
ORE
/SHAL
LOW
CANAD
IAN OIL SAN
DS IN
SITU
Latin
American
Non
Ven
ezue
la
NORT
HSEA
ANGOLA
OFFSH
ORE
North American
Conven
tiona
l/EO
R
North
American
Uncon
v 2n
d Tier
CANAD
IANOIL SAN
DS MINING
US core unconventional sits very low in the long term development cost curve
Whereas OPEC is increasingly uninvestable at almost any price
NIGER
IA
US Big 4Unconven.
Afric
a conven
tiona
l
Asia BR
AZIL
US margina
l Uncon
ventioan
l
Nigeria
CASPIAN
0
20
40
60
80
100
2015 2016 2017 2018 2019 2020 2021 2022 2023 2024 2025
New Development Barrels Base
100 bn barrels of required development for next decade
8
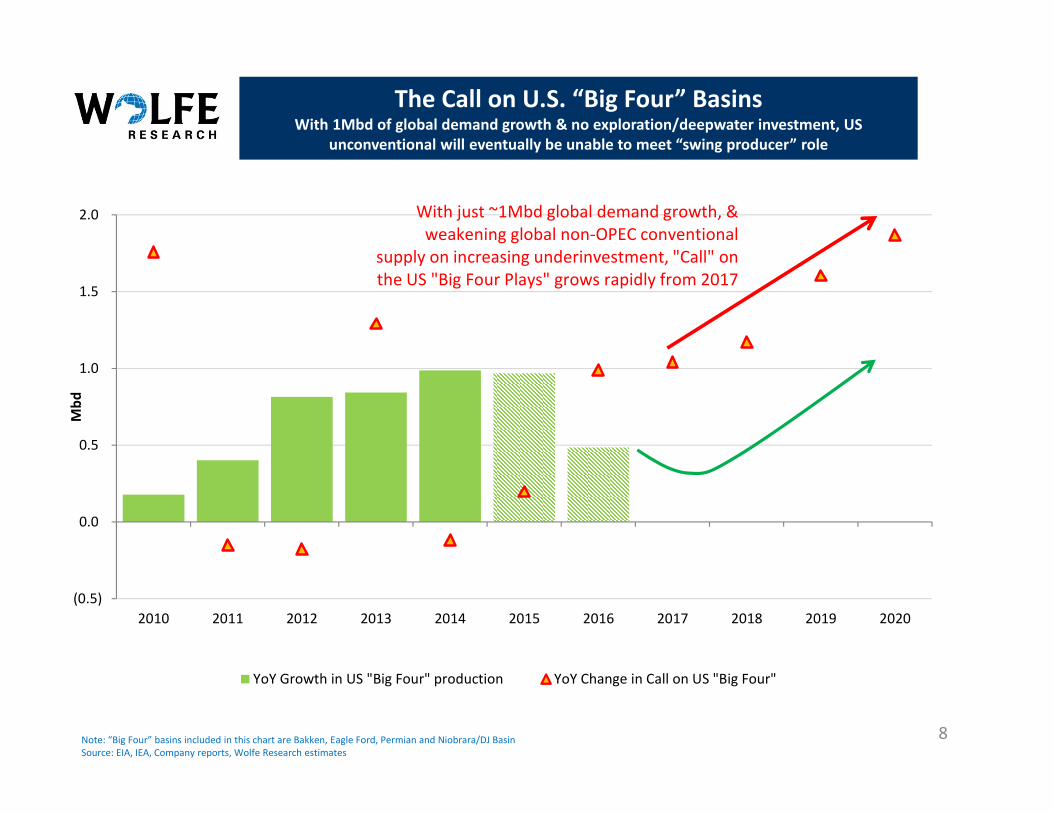
The Call on U.S. “Big Four” BasinsWith 1Mbd of global demand growth & no exploration/deepwater investment, US
unconventional will eventually be unable to meet “swing producer” role
Note: “Big Four” basins included in this chart are Bakken, Eagle Ford, Permian and Niobrara/DJ BasinSource: EIA, IEA, Company reports, Wolfe Research estimates
(0.5)
0.0
0.5
1.0
1.5
2.0
2010 2011 2012 2013 2014 2015 2016 2017 2018 2019 2020
Mbd
YoY Growth in US "Big Four" production YoY Change in Call on US "Big Four"
With just ~1Mbd global demand growth, & weakening global non‐OPEC conventional
supply on increasing underinvestment, "Call" on the US "Big Four Plays" grows rapidly from 2017

9
2015 CapexTotal Oil‐focused E&P budgets likely down 25‐30%
Source: Company reports, Bloomberg Finance LP, News reports, Wolfe Research
2015 capex YoY% change 2015 capex YoY $M change
PRODUCER CAPEX PLANSSummary DataCompanies that have announced 2015 plan 52Total companies we are tracking 902014 Capex of announced plans 195,5952014 Capex of remaining unannounced 240,277
2015 announced budgets vs. 2014 budgets 2014 So Far 2015 So Far YoY Change % ChangeTotal integrateds and E&Ps 195,595 172,082 (23,513) ‐12.0%Ex‐integrateds 109,595 86,582 (23,013) ‐21.0%Oil‐focused E&Ps only 97,013 74,509 (22,504) ‐23.2%US Oil‐focused (i.e., ex‐Canadians) 62,698 47,916 (14,782) ‐23.6%Canadians only 34,315 26,593 (7,722) ‐22.5%Integrateds only 86,000 85,500 (500) ‐0.6%Gas‐focused E&Ps only 12,582 12,073 (509) ‐4.0%
‐25,000
‐20,000
‐15,000
‐10,000
‐5,000
0
Totalintegratedsand E&Ps
Ex‐integrateds Oil‐focusedE&Ps only
US Oil‐focused(i.e., ex‐
Canadians)
Canadians only Gas‐focusedE&Ps only
Integratedsonly
US$
millions
‐25%
‐20%
‐15%
‐10%
‐5%
0%
US Oil‐focused(i.e., ex‐
Canadians)
Oil‐focusedE&Ps only
Canadians only Ex‐integrateds Totalintegratedsand E&Ps
Gas‐focusedE&Ps only
Integratedsonly
YoY % declin
e

10
The Call on U.S. “Big Four” BasinsUnderinvesting in “long‐cycle” production results in slower non‐OPEC/non‐Big Four growth on
a 1 year lag, but the sluggishness lasts for 2‐3 years
Note: “Big Four” basins included in this chart are Bakken, Eagle Ford, Permian and Niobrara/DJ BasinSource: EIA, IEA, Company reports, Wolfe Research estimates
‐0.5%
0.0%
0.5%
1.0%
1.5%
2.0%
2.5%
3.0%
‐40%
‐30%
‐20%
‐10%
0%
10%
20%
30%
40%
2007 2008 2009 2010 2011 2012 2013 2014 2015 2016 2017 2018
Top 25 Oil Company Capex YoY Change % Non‐OPEC/Non‐Big Four Supply Growth YoY %
Major drop in investment in 2009 (Capex from top 25 companies down 17% YoY) led to 2‐3 years of sluggish growth for long cycle
non‐OPEC supply.
Underinvestment in 2015 will be just as substantial as 2009, expect long‐cycle supply to be increasingly weak from 2016 to 2018, leaving short‐cycle US unconventional to fill
rising demand
Capex likely down 20‐30%+ in
2015

0
100
200
300
400
500
600
1/9/2011 1/9/2012 1/9/2013 1/9/2014 1/9/2015Canadian Oil Rigs Canadian Gas Rigs Canadian Horizontal Rigs
$40
$50
$60
$70
$80
$90
$100
1,400
1,450
1,500
1,550
1,600
1,650
8/1/2014 9/1/2014 10/1/2014 11/1/2014 12/1/2014 1/1/2015
US Oil Rigs WTI Front Month (RHS)11
North American activityRig counts falling quickly now
Source: Bloomberg Finance LP, Baker Hughes, Wolfe Research
0
200
400
600
800
1,000
1,200
1,400
1,600
1,800
1/9/2011 1/9/2012 1/9/2013 1/9/2014 1/9/201
US Oil Rigs US Gas Rigs US Horizontal Rigs
40
50
60
70
80
90
100
110
170
175
180
185
190
195
200
1/1/14
2/1/14
3/1/14
4/1/14
5/1/14
6/1/14
7/1/14
8/1/14
9/1/14
10/1/14
11/1/14
12/1/14
1/1/15
OIL RIGS WTI Front Month $/bbl (RHS)
US Active Rig Count Canadian Active Rig Count
Recent US Oil Rigs vs. WTI Bakken Oil Rigs vs. WTI

0
200
400
600
800
1,000
1,200
0
200,000
400,000
600,000
800,000
1,000,000
1,200,000
1,400,000
1,600,000
1,800,000
Jan‐07
Mar‐07
May‐07
Jul‐0
7Sep‐07
Nov‐07
Jan‐08
Mar‐08
May‐08
Jul‐0
8Sep‐08
Nov‐08
Jan‐09
Mar‐09
May‐09
Jul‐0
9Sep‐09
Nov‐09
Jan‐10
Mar‐10
May‐10
Jul‐1
0Sep‐10
Nov‐10
Jan‐11
Mar‐11
May‐11
Jul‐1
1Sep‐11
Nov‐11
Jan‐12
Mar‐12
May‐12
Jul‐1
2Sep‐12
Nov‐12
Jan‐13
Mar‐13
May‐13
Jul‐1
3Sep‐13
Nov‐13
Jan‐14
Mar‐14
May‐14
Jul‐1
4Sep‐14
Nov‐14
Jan‐15
Mar‐15
May‐15
Jul‐1
5Sep‐15
Nov‐15
Jan‐16
Mar‐16
May‐16
Jul‐1
6Sep‐16
Nov‐16
YoY Monthly Production Growth (LHS) Kbd Annual Growth Implied by Monthly Sequential (LHS) Kbd Major Basin Rig Count (RHS)
With a 15‐20% drop in rigs in "Big Four" basins (~200 rigs) over the course of the next year, we estimate a 500‐600kbd
deceleration in US oil production growth rate by YE15
US production growth , already 1Mbdin 2013, accelerated remarkably through 2014, which likely set off
alarm bells for Saudi in light of weak global demand growth
12
Capex cuts to rig count reductions to slower growth15‐20% drop in rigs in “Big Four” basins = ~500‐600kbd decline in growth rate by YE15
Note: “Big Four” basins included in this chart are Bakken, Eagle Ford, Permian and Niobrara/DJ BasinSource: EIA, Company reports, Wolfe Research estimates

150
160
170
180
190
200
210
220
J F M A M J J A S O N D
09‐'13 range 2012 2013 2014 2015
Starting 2015 ~20Mbd above
last year
10
15
20
25
30
35
40
45
50
55
J F M A M J J A S O N D
09‐'13 range 2013 2014 2015
With turnarounds, production growth & Saudi/Kuwait pushing for share, crude should back up from GC to
Cushing in 1H15
0
20,000
40,000
60,000
80,000
100,000
120,000
140,000
Feb‐10
Mar‐10
Apr‐10
May‐10
Jun‐10
Jul‐1
0Au
g‐10
Sep‐10
Oct‐10
Nov‐10
Dec‐10
Jan‐11
Feb‐11
Mar‐11
Apr‐11
May‐11
Jun‐11
Jul‐1
1Au
g‐11
Sep‐11
Oct‐11
Nov‐11
Dec‐11
Jan‐12
Feb‐12
Mar‐12
Apr‐12
May‐12
Jun‐12
Jul‐1
2Au
g‐12
Sep‐12
Oct‐12
Nov‐12
Dec‐12
Jan‐13
Feb‐13
Mar‐13
Apr‐13
May‐13
Jun‐13
Jul‐1
3Au
g‐13
Sep‐13
Oct‐13
Nov‐13
Dec‐13
Jan‐14
Feb‐14
Mar‐14
Apr‐14
May‐14
Jun‐14
Jul‐1
4Au
g‐14
Sep‐14
Oct‐14
Nov‐14
Dec‐14
'000
bbls
Asia/Pacific
Middle East
AtlanticBasin/Med
Waterborne storage up
~30Mbd since beginning of November
13
“Too Much Oil” ‐ crude stocks risingFloating storage, Cushing, PADD 3 all rising quickly
Source: Bloomberg Finance LP, EIA, Wolfe Research
US Crude Inventory PADD 3 Crude Inventory
Cushing Crude Inventory
1,000
1,010
1,020
1,030
1,040
1,050
1,060
1,070
1,080
1,090
1,100
J F M A M J J A S O N D
Mbb
l
09‐'13 range 2013 2012 2014 2015
Counter‐seasonal increase at end of year, almost always falls in
December
Global Floating Storage

‐20
‐15
‐10
‐5
0
5
10
15
20
2520
40
60
80
100
120
140
160
J‐04 J‐05 J‐06 J‐07 J‐08 J‐09 J‐10 J‐11 J‐12 J‐13 J‐14 J‐15
($/bbl)
($/bbl)
WTI 1st Month WTI 12th Month 12m Contango (RHS)
12 month WTI contango hit $15 in late Dec 2008, and $23 mid‐Jan 2009
Current 12 month contango is widnening, but is still only ~$7.50
14
WTI contangoMay need to steepen towards $20 to reverse decline in WTI
Source: Bloomberg Finance LP, Wolfe Research
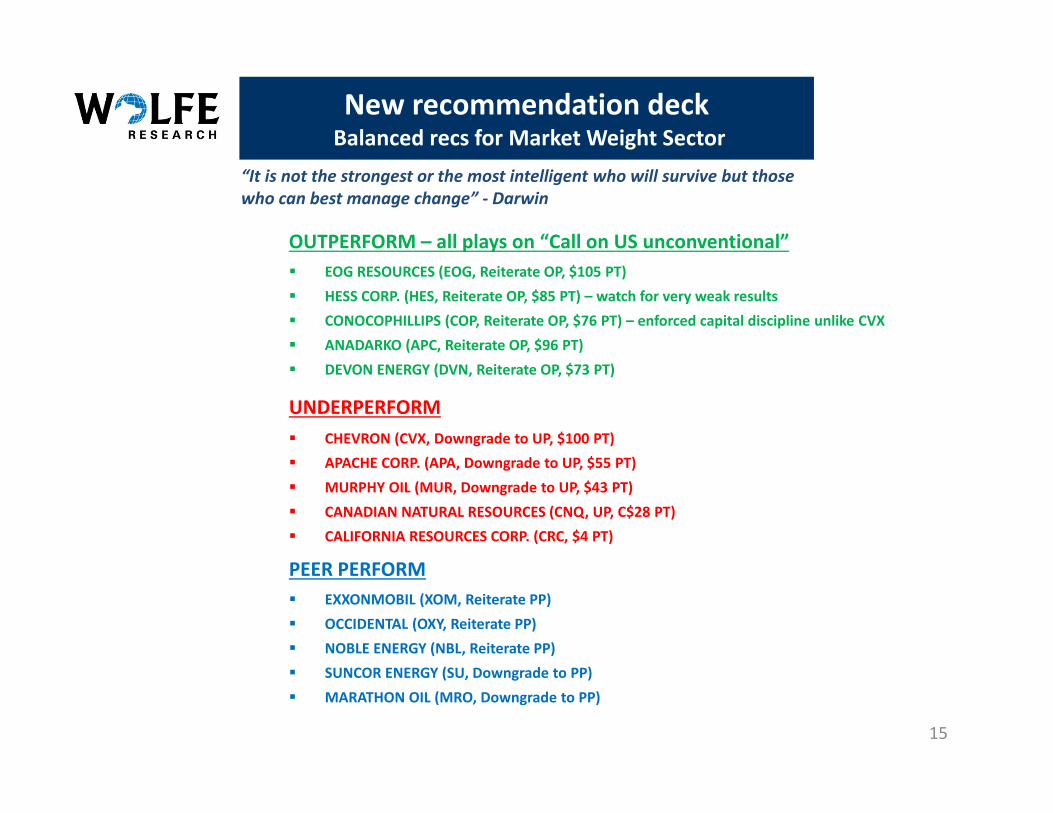
New recommendation deck Balanced recs for Market Weight Sector
15
OUTPERFORM – all plays on “Call on US unconventional” EOG RESOURCES (EOG, Reiterate OP, $105 PT) HESS CORP. (HES, Reiterate OP, $85 PT) – watch for very weak results CONOCOPHILLIPS (COP, Reiterate OP, $76 PT) – enforced capital discipline unlike CVX ANADARKO (APC, Reiterate OP, $96 PT) DEVON ENERGY (DVN, Reiterate OP, $73 PT)
UNDERPERFORM CHEVRON (CVX, Downgrade to UP, $100 PT) APACHE CORP. (APA, Downgrade to UP, $55 PT) MURPHY OIL (MUR, Downgrade to UP, $43 PT) CANADIAN NATURAL RESOURCES (CNQ, UP, C$28 PT) CALIFORNIA RESOURCES CORP. (CRC, $4 PT)
PEER PERFORM EXXONMOBIL (XOM, Reiterate PP) OCCIDENTAL (OXY, Reiterate PP) NOBLE ENERGY (NBL, Reiterate PP) SUNCOR ENERGY (SU, Downgrade to PP) MARATHON OIL (MRO, Downgrade to PP)
“It is not the strongest or the most intelligent who will survive but those who can best manage change” ‐ Darwin

16
Refining Downgrade Sector relative valuations
Source: FactSet, Wolfe Research
Refiners 2015 EV/EBITDA and P/E
Refiners share of SP500 EPS vs. share of mkt cap Refiners P/E relative to market
0.0%
0.2%
0.4%
0.6%
0.8%
1.0%
1.2%
1.4%
Dec-98
Dec-99
Dec-00
Dec-01
Dec-02
Dec-03
Dec-04
Dec-05
Dec-06
Dec-07
Dec-08
Dec-09
Dec-10
Dec-11
Dec-12
Dec-13
Dec-14
Forecast Refiners Attributable Income as % of S&P500
Current Refiners Sector Weight % of S&P500
PSX
VLO
MPC
HFCTSO
WNR
PBF
DK
3.5x
4.0x
4.5x
5.0x
5.5x
6.0x
6.5x
7.0x
7.0x 8.0x 9.0x 10.0x 11.0x 12.0x 13.0x
2015
EV/
EBITDA
2015 P/E
0%
20%
40%
60%
80%
100%
120%
140%
0%
20%
40%
60%
80%
100%
120%
140%
Dec-98
Dec-99
Dec-00
Dec-01
Dec-02
Dec-03
Dec-04
Dec-05
Dec-06
Dec-07
Dec-08
Dec-09
Dec-10
Dec-11
Dec-12
Dec-13
Dec-14
Refiners P/E vs Market P/E
Refiners % of Market - Historical Average

17
Wolfe Research Commodity Price Deck
Source: Bloomberg Finance LP, Wolfe Research
$/bbl 2012 2013 1Q14 2Q14 3Q14 4Q14 2014E 1Q15E 2Q15E 3Q15E 4Q15E 2015E 1Q16E 2Q16E 3Q16E 4Q16E 2016E
COMMODITY PRICES
Brent 112.17 108.19 107.86 109.76 102.16 75.84 98.91 48.00 54.00 59.00 65.00 56.50 70.00 75.00 75.00 80.00 75.00WTI 94.37 97.98 98.61 103.11 97.67 72.94 93.00 45.00 50.00 55.00 61.00 52.75 65.00 70.00 70.00 75.00 70.00Midland 90.07 96.22 92.72 95.47 87.07 69.65 86.23 43.00 48.00 53.50 59.50 51.00 64.00 69.00 69.00 74.00 69.00LLS 111.69 107.45 104.37 105.59 101.09 75.83 96.72 47.00 53.00 57.50 63.50 55.25 68.00 73.00 73.00 78.00 73.00Clearbrook 88.39 92.87 94.82 98.42 91.23 67.10 87.89 39.00 44.00 48.00 53.00 46.00 58.00 63.00 63.00 68.00 63.00Syncrude 92.60 97.31 98.29 103.70 94.99 70.23 91.80 42.00 47.00 52.00 58.00 49.75 62.00 67.00 67.00 72.00 67.00ANS 110.70 107.79 105.96 109.52 102.30 75.12 98.23 47.00 52.00 57.00 63.00 54.75 67.00 72.00 72.00 77.00 72.00WTS 88.67 95.27 93.18 95.87 88.98 70.74 87.00 43.00 48.00 53.00 59.00 51.00 63.00 68.00 68.00 73.00 68.00Mars 106.88 102.35 100.86 100.81 97.45 72.02 93.00 43.00 49.00 53.50 59.50 51.00 64.00 69.00 69.00 74.00 69.00Maya 99.62 97.40 89.24 95.74 91.03 66.73 85.69 37.00 43.00 47.50 53.50 45.25 58.00 63.00 63.00 68.00 63.00WCS 71.82 73.49 77.67 83.84 78.77 57.44 74.43 29.00 34.00 39.00 45.00 36.75 49.00 54.00 54.00 59.00 54.00Henry Hub ($/mmBtu) 2.76 3.73 5.18 4.53 3.94 3.74 4.35 3.75 3.65 4.00 4.40 3.95 4.25 4.25 4.25 4.25 4.25UK NBP ($/mmBtu) 9.47 10.55 10.02 7.61 7.08 8.39 8.28 7.50 8.00 8.00 8.00 7.88 9.00 9.00 9.00 9.00 9.00
CRUDE DIFFERENTIALS
Brent-WTI 17.80 10.21 9.25 6.65 4.49 2.90 5.80 3.00 4.00 4.00 4.00 3.80 5.00 5.00 5.00 5.00 5.00Brent-LLS 0.48 0.74 3.49 4.17 1.07 0.01 2.19 1.00 1.00 1.50 1.50 1.25 2.00 2.00 2.00 2.00 2.00Brent-Clearbrook 23.78 15.31 13.04 11.34 10.93 8.74 11.01 9.00 10.00 11.00 12.00 10.50 12.00 12.00 12.00 12.00 12.00Brent-Midland 22.10 11.97 15.14 14.29 15.09 6.19 12.68 5.00 6.00 5.50 5.50 5.50 6.00 6.00 6.00 6.00 6.00LLS-WTI 17.32 9.47 5.76 2.48 3.42 2.89 3.64 2.00 3.00 2.50 2.50 2.50 3.00 3.00 3.00 3.00 3.00WTI-Midland 4.30 1.76 5.89 7.64 10.60 3.29 6.86 2.00 2.00 1.50 1.50 1.75 1.00 1.00 1.00 1.00 1.00WTI-Clearbrook 5.98 5.10 3.79 4.69 6.44 5.84 5.19 6.00 6.00 7.00 8.00 6.75 7.00 7.00 7.00 7.00 7.00WTI-Syncrude 1.77 0.67 0.32 (0.59) 2.68 2.71 1.28 3.00 3.00 3.00 3.00 3.00 3.00 3.00 3.00 3.00 3.00WTI-ANS (16.33) (9.81) (7.35) (6.41) (4.63) (2.18) (5.14) (2.00) (2.00) (2.00) (2.00) (2.00) (2.00) (2.00) (2.00) (2.00) (2.00)LLS-Mars 4.81 5.10 3.51 4.78 3.64 3.81 3.94 4.00 4.00 4.00 4.00 4.00 4.00 4.00 4.00 4.00 4.00WTI-WTS 5.69 2.71 5.43 7.24 8.69 2.20 5.89 2.00 2.00 2.00 2.00 2.00 2.00 2.00 2.00 2.00 2.00Brent-Maya 12.55 10.79 18.62 14.02 11.13 9.11 13.22 11.00 11.00 11.50 11.50 11.25 12.00 12.00 12.00 12.00 12.00LLS-Maya 12.06 10.05 15.13 9.85 10.06 9.10 11.04 10.00 10.00 10.00 10.00 10.00 10.00 10.00 10.00 10.00 10.00WTI-Maya (5.25) 0.58 9.37 7.37 6.64 6.21 7.40 8.00 7.00 7.50 7.50 7.50 7.00 7.00 7.00 7.00 7.00WTI-WCS 22.55 24.49 20.94 19.27 18.90 15.50 18.65 16.00 16.00 16.00 16.00 16.00 16.00 16.00 16.00 16.00 16.00Brent-WCS 40.35 34.69 30.19 25.92 23.39 18.40 24.48 19.00 20.00 20.00 20.00 19.75 21.00 21.00 21.00 21.00 21.00
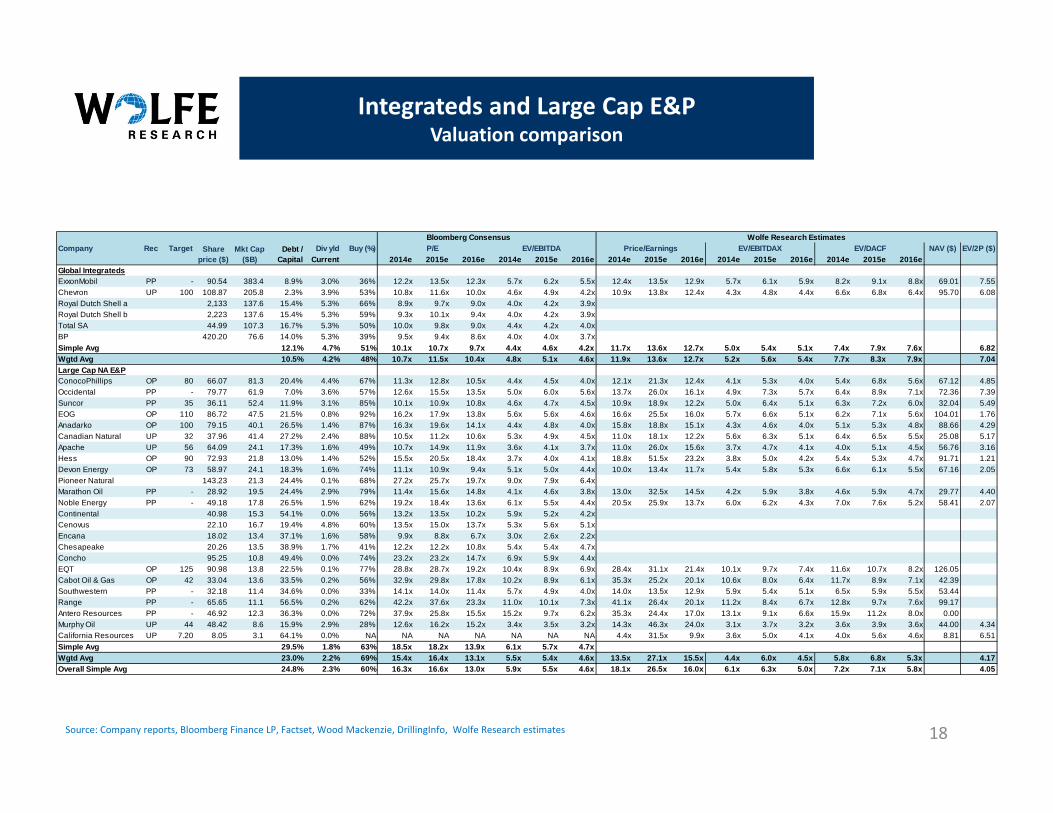
Integrateds and Large Cap E&PValuation comparison
18Source: Company reports, Bloomberg Finance LP, Factset, Wood Mackenzie, DrillingInfo, Wolfe Research estimates
Company Rec Target Div yld Buy (%) NAV ($) EV/2P ($)Current 2014e 2015e 2016e 2014e 2015e 2016e 2014e 2015e 2016e 2014e 2015e 2016e 2014e 2015e 2016e
Global IntegratedsExxonMobil PP - 90.54 383.4 8.9% 3.0% 36% 12.2x 13.5x 12.3x 5.7x 6.2x 5.5x 12.4x 13.5x 12.9x 5.7x 6.1x 5.9x 8.2x 9.1x 8.8x 69.01 7.55Chevron UP 100 108.87 205.8 2.3% 3.9% 53% 10.8x 11.6x 10.0x 4.6x 4.9x 4.2x 10.9x 13.8x 12.4x 4.3x 4.8x 4.4x 6.6x 6.8x 6.4x 95.70 6.08Royal Dutch Shell a 2,133 137.6 15.4% 5.3% 66% 8.9x 9.7x 9.0x 4.0x 4.2x 3.9xRoyal Dutch Shell b 2,223 137.6 15.4% 5.3% 59% 9.3x 10.1x 9.4x 4.0x 4.2x 3.9xTotal SA 44.99 107.3 16.7% 5.3% 50% 10.0x 9.8x 9.0x 4.4x 4.2x 4.0xBP 420.20 76.6 14.0% 5.3% 39% 9.5x 9.4x 8.6x 4.0x 4.0x 3.7xSimple Avg 12.1% 4.7% 51% 10.1x 10.7x 9.7x 4.4x 4.6x 4.2x 11.7x 13.6x 12.7x 5.0x 5.4x 5.1x 7.4x 7.9x 7.6x 6.82Wgtd Avg 10.5% 4.2% 48% 10.7x 11.5x 10.4x 4.8x 5.1x 4.6x 11.9x 13.6x 12.7x 5.2x 5.6x 5.4x 7.7x 8.3x 7.9x 7.04Large Cap NA E&PConocoPhillips OP 80 66.07 81.3 20.4% 4.4% 67% 11.3x 12.8x 10.5x 4.4x 4.5x 4.0x 12.1x 21.3x 12.4x 4.1x 5.3x 4.0x 5.4x 6.8x 5.6x 67.12 4.85Occidental PP - 79.77 61.9 7.0% 3.6% 57% 12.6x 15.5x 13.5x 5.0x 6.0x 5.6x 13.7x 26.0x 16.1x 4.9x 7.3x 5.7x 6.4x 8.9x 7.1x 72.36 7.39Suncor PP 35 36.11 52.4 11.9% 3.1% 85% 10.1x 10.9x 10.8x 4.6x 4.7x 4.5x 10.9x 18.9x 12.2x 5.0x 6.4x 5.1x 6.3x 7.2x 6.0x 32.04 5.49EOG OP 110 86.72 47.5 21.5% 0.8% 92% 16.2x 17.9x 13.8x 5.6x 5.6x 4.6x 16.6x 25.5x 16.0x 5.7x 6.6x 5.1x 6.2x 7.1x 5.6x 104.01 1.76Anadarko OP 100 79.15 40.1 26.5% 1.4% 87% 16.3x 19.6x 14.1x 4.4x 4.8x 4.0x 15.8x 18.8x 15.1x 4.3x 4.6x 4.0x 5.1x 5.3x 4.8x 88.66 4.29Canadian Natural UP 32 37.96 41.4 27.2% 2.4% 88% 10.5x 11.2x 10.6x 5.3x 4.9x 4.5x 11.0x 18.1x 12.2x 5.6x 6.3x 5.1x 6.4x 6.5x 5.5x 25.08 5.17Apache UP 56 64.09 24.1 17.3% 1.6% 49% 10.7x 14.9x 11.9x 3.6x 4.1x 3.7x 11.0x 26.0x 15.6x 3.7x 4.7x 4.1x 4.0x 5.1x 4.5x 56.76 3.16Hess OP 90 72.93 21.8 13.0% 1.4% 52% 15.5x 20.5x 18.4x 3.7x 4.0x 4.1x 18.8x 51.5x 23.2x 3.8x 5.0x 4.2x 5.4x 5.3x 4.7x 91.71 1.21Devon Energy OP 73 58.97 24.1 18.3% 1.6% 74% 11.1x 10.9x 9.4x 5.1x 5.0x 4.4x 10.0x 13.4x 11.7x 5.4x 5.8x 5.3x 6.6x 6.1x 5.5x 67.16 2.05Pioneer Natural 143.23 21.3 24.4% 0.1% 68% 27.2x 25.7x 19.7x 9.0x 7.9x 6.4xMarathon Oil PP - 28.92 19.5 24.4% 2.9% 79% 11.4x 15.6x 14.8x 4.1x 4.6x 3.8x 13.0x 32.5x 14.5x 4.2x 5.9x 3.8x 4.6x 5.9x 4.7x 29.77 4.40Noble Energy PP - 49.18 17.8 26.5% 1.5% 62% 19.2x 18.4x 13.6x 6.1x 5.5x 4.4x 20.5x 25.9x 13.7x 6.0x 6.2x 4.3x 7.0x 7.6x 5.2x 58.41 2.07Continental 40.98 15.3 54.1% 0.0% 56% 13.2x 13.5x 10.2x 5.9x 5.2x 4.2xCenovus 22.10 16.7 19.4% 4.8% 60% 13.5x 15.0x 13.7x 5.3x 5.6x 5.1xEncana 18.02 13.4 37.1% 1.6% 58% 9.9x 8.8x 6.7x 3.0x 2.6x 2.2xChesapeake 20.26 13.5 38.9% 1.7% 41% 12.2x 12.2x 10.8x 5.4x 5.4x 4.7xConcho 95.25 10.8 49.4% 0.0% 74% 23.2x 23.2x 14.7x 6.9x 5.9x 4.4xEQT OP 125 90.98 13.8 22.5% 0.1% 77% 28.8x 28.7x 19.2x 10.4x 8.9x 6.9x 28.4x 31.1x 21.4x 10.1x 9.7x 7.4x 11.6x 10.7x 8.2x 126.05Cabot Oil & Gas OP 42 33.04 13.6 33.5% 0.2% 56% 32.9x 29.8x 17.8x 10.2x 8.9x 6.1x 35.3x 25.2x 20.1x 10.6x 8.0x 6.4x 11.7x 8.9x 7.1x 42.39Southwestern PP - 32.18 11.4 34.6% 0.0% 33% 14.1x 14.0x 11.4x 5.7x 4.9x 4.0x 14.0x 13.5x 12.9x 5.9x 5.4x 5.1x 6.5x 5.9x 5.5x 53.44Range PP - 65.65 11.1 56.5% 0.2% 62% 42.2x 37.6x 23.3x 11.0x 10.1x 7.3x 41.1x 26.4x 20.1x 11.2x 8.4x 6.7x 12.8x 9.7x 7.6x 99.17Antero Resources PP - 46.92 12.3 36.3% 0.0% 72% 37.9x 25.8x 15.5x 15.2x 9.7x 6.2x 35.3x 24.4x 17.0x 13.1x 9.1x 6.6x 15.9x 11.2x 8.0x 0.00Murphy Oil UP 44 48.42 8.6 15.9% 2.9% 28% 12.6x 16.2x 15.2x 3.4x 3.5x 3.2x 14.3x 46.3x 24.0x 3.1x 3.7x 3.2x 3.6x 3.9x 3.6x 44.00 4.34California Resources UP 7.20 8.05 3.1 64.1% 0.0% NA NA NA NA NA NA NA 4.4x 31.5x 9.9x 3.6x 5.0x 4.1x 4.0x 5.6x 4.6x 8.81 6.51Simple Avg 29.5% 1.8% 63% 18.5x 18.2x 13.9x 6.1x 5.7x 4.7xWgtd Avg 23.0% 2.2% 69% 15.4x 16.4x 13.1x 5.5x 5.4x 4.6x 13.5x 27.1x 15.5x 4.4x 6.0x 4.5x 5.8x 6.8x 5.3x 4.17Overall Simple Avg 24.8% 2.3% 60% 16.3x 16.6x 13.0x 5.9x 5.5x 4.6x 18.1x 26.5x 16.0x 6.1x 6.3x 5.0x 7.2x 7.1x 5.8x 4.05
Bloomberg Consensus Wolfe Research EstimatesShare
price ($)Mkt Cap
($B)Debt /
CapitalP/E EV/EBITDA Price/Earnings EV/EBITDAX EV/DACF

US RefinersValuation comparison
19Source: Company reports, FactSet, Wolfe Research estimates
Company Rec.2014e 2015e 2014e 2015e 2014e 2015e 2014e 2015e
US Large Cap RefinersPhillips 66 Peer Perform $67.31 38.0 79% -14% 10.6x 10.1x 6.1x 6.1x 10.5x 9.4x 5.5x 5.8xValero Outperform $63 $48.65 25.8 64% -8% 8.2x 8.9x 4.2x 4.5x 8.0x 8.6x 4.1x 4.4xMarathon Petroleum Outperform $103 $88.49 25.1 60% -3% 11.7x 10.9x 6.3x 5.7x 12.4x 10.4x 6.5x 5.7xHollyFrontier Peer Perform $35.71 7.1 8% -29% 11.5x 11.3x 5.2x 5.1x 11.5x 9.8x 5.4x 4.8xTesoro Peer Perform $72.86 9.4 60% 26% 10.9x 11.2x 5.5x 5.3x 10.4x 11.2x 5.3x 5.4xUS Small Cap RefinersWestern Refining Outperform $52 $37.21 3.8 20% -10% 8.3x 9.6x 5.5x 6.4x 8.9x 9.8x 5.6x 6.9xPBF Energy Peer Perform $25.22 2.5 29% -13% 6.4x 7.4x 3.8x 4.3x 6.7x 8.2x 3.8x 4.3xDelek US Outperform $38 $28.25 1.7 67% -17% 8.9x 11.9x 4.3x 4.8x 9.4x 8.3x 4.0x 4.0xAverage Peer Perform 14.2 48% -8% 9.6x 10.2x 5.1x 5.3x 9.7x 9.5x 5.0x 5.2x
Crude Dist.Company Capacity NCI NAV
(000 b/d) 2014e 2015e 2014e 2015eUS Large Cap RefinersPhillips 66 2,156 18,596 1,675 11.1 $83 $3,105 7.5% 13.7% 14.4% 5.4% -1.8% 3.1% 4.4% 7.5%Valero 2,384 9,925 799 12.4 $67 $2,192 7.7% 13.0% 11.0% 7.7% 7.3% 2.7% 6.6% 9.2%Marathon Petroleum 1,714 17,489 1,592 11.0 $114 $4,410 14.7% 13.6% 13.8% -7.9% 6.5% 2.5% 3.7% 6.2%HollyFrontier 443 16,254 1,377 11.8 $46 ($440) -6.1% 8.5% 9.8% 13.2% 14.8% 9.2% 2.9% 12.1%Tesoro 850 14,298 1,765 8.1 $87 $1,414 11.6% 13.2% 10.5% 7.0% 6.1% 2.2% 5.6% 7.8%US Small Cap RefinersWestern Refining 250 24,244 2,886 8.4 $50 $603 13.8% 9.6% 8.1% 11.1% 15.0% 3.2% 8.2% 11.4%PBF Energy 540 6,326 688 9.2 $29 $427 14.8% 15.2% 11.3% -5.1% 7.9% 5.2% 5.3% 10.5%Delek US 140 14,037 1,523 9.2 $42 $97 5.4% 11.5% 11.6% 0.8% 7.8% 4.2% 5.0% 9.3%Average 15,146 1,538 11.0 8.7% 12.3% 11.3% 4.0% 8.0% 4.0% 5.2% 9.2%
1 Year % Chg
FactSet Consensus Wolfe ResearchP/E EV/EBITDA
ROCE
Share Price Buy (%)Target Price
Dividend Yield
Mkt Cap ($bn)
P/E EV/EBITDA
EV/CEDC ($)EV/bbl ($)
2015e Cash ReturnTotal Yield
Net Debt ($m)
Buyback Yield
FCF Yield Net Debt/ Capital

Disclosure Section
20
DISCLOSURE SECTION
Analyst Certification:
The analyst of Wolfe Research, LLC primarily responsible for this research report whose name appears first on the front page of this research report hereby certifies that (i) the recommendations and opinions expressed in this research report accurately reflect the research analysts’ personal views about the subject securities or issuers and (ii) no part of the research analysts’ compensation was, is or will be directly or indirectly related to the specific recommendations or views contained in this report.
Other Disclosures:
Wolfe Research, LLC Fundamental Stock Ratings Key:
Outperform (OP): The security is projected to outperform analyst's industry coverage universe over the next 12 months.
Peer Perform (PP): The security is projected to perform approximately in line with analyst's industry coverage universe over the next 12 months.
Underperform (UP): The security is projected to underperform analyst's industry coverage universe over the next 12 months.
Wolfe Research, LLC uses a relative rating system using terms such as Outperform, Peer Perform and Underperform (see definitions above). Please carefully read the definitions of all ratings used in Wolfe Research, LLC research. In addition, since Wolfe Research, LLC research contains more complete information concerning the analyst’s views, please carefully read Wolfe Research, LLC research in its entirety and not infer the contents from the ratings alone. In all cases, ratings (or research) should not be used or relied upon as investment advice and any investment decisions should be based upon individual circumstances and other considerations.
Wolfe Research, LLC Sector Weighting System:
Market Overweight (MO): Expect the industry to outperform the primary market index for the region (S&P 500 in the U.S.) by at least 10% over the next 12 months.
Market Weight (MW): Expect the industry to perform approximately in line with the primary market index for the region (S&P 500 in the U.S.) over the next 12 months.
Market Underweight (MU): Expect the industry to underperform the primary market index for the region (S&P 500 in the U.S.) by at least 10% over the next 12 months.
Wolfe Research, LLC Distribution of Fundamental Stock Ratings (As of December 31, 2014):
Outperform: 41% 2% Investment Banking Clients Peer Perform: 50% 1% Investment Banking Clients Underperform: 9% 0% Investment Banking Clients
Wolfe Research, LLC does not assign ratings of Buy, Hold or Sell to the stocks it covers. Outperform, Peer Perform and Underperform are not the respective equivalents of Buy, Hold and Sell but represent relative weightings as defined above. To satisfy regulatory requirements, Outperform has been designated to correspond with Buy, Peer Perform has been designated to correspond with Hold and Underperform has been designated to correspond with Sell.
Wolfe Research Securities and Wolfe Research, LLC have adopted the use of Wolfe Research as brand names. Wolfe Research Securities, a member of FINRA (www.finra.org) is the broker-dealer affiliate of Wolfe Research, LLC and is responsible for the contents of this material. Any analysts publishing these reports are dually employed by Wolfe Research, LLC and Wolfe Research Securities.
The content of this report is to be used solely for informational purposes and should not be regarded as an offer, or a solicitation of an offer, to buy or sell a security, financial instrument or service discussed herein. Opinions in this communication constitute the current judgment of the author as of the date and time of this report and are subject to change without notice. Information herein is believed to be reliable but Wolfe Research and its affiliates, including but not limited to Wolfe Research Securities, makes no representation that it is complete or accurate. The information provided in this communication is not designed to replace a recipient's own decision-making processes for assessing a proposed transaction or investment involving a financial instrument discussed herein. Recipients are encouraged to seek financial advice from their financial advisor regarding the appropriateness of investing in a security or financial instrument referred to in this report and should understand that statements regarding the future performance of the financial instruments or the securities referenced herein may not be realized. Past performance is not indicative of future results. This report is not intended for distribution to, or use by, any person or entity in any location where such distribution or use would be contrary to applicable law, or which would subject Wolfe Research, LLC or any affiliate to any registration requirement within such location. For additional important disclosures, please see www.WolfeResearch.com/Disclosures.
The views expressed in Wolfe Research, LLC research reports with regards to sectors and/or specific companies may from time to time be inconsistent with the views implied by inclusion of those sectors and companies in other Wolfe Research, LLC analysts’ research reports and modeling screens. Wolfe Research communicates with clients across a variety of mediums of the clients’ choosing including emails, voice blasts and electronic publication to our proprietary website.