global oil and gas transactions review 2017 · 2018-02-13 · and gas sector in general. in 2017 we...
TRANSCRIPT

Global oil and gas transactions review 2017

Welcome to our annual review of global oil and gas transaction activity. In this report, we look at significant trends in oil and gas deal activity over 2017 and the outlook for transactions in 2018. We consider the diverse dynamics in all of the subsectors, as well as the macro environment find out more online at ey.com/oilandgas/transactions.
Last year, we took note of a positive outlook for M&A in 2017. Oil prices were widely expected to have hit bottom, as had upstream valuations. Operators were transforming their business model and cutting costs through digitization and standardization. Capex had dropped to unsustainable levels and service company revenues were likely to recover.
As many predicted, 2017 brought significant improvement in oil prices and an increasing sense that the market was approaching a new normal, recognizing the availability and cost of North American shale oil putting a floor and ceiling on the markets. 2016 was, in fact, the bottom. Appropriately, the market has also found stability, with oil price volatility falling by about a third during the year.
Despite last year’s outlook and positive trends, deal volume hit a five year low in 2017. Deal value fell overall across the sector with upstream showing the only increase. Although now moving to growth agendas which will drive deal activity, companies are recognizing the need to embed effective portfolio optimization practices to get the right type and mix of assets to secure mid-term growth while maximizing returns. The stability that should have contributed to increased confidence in valuations and deal activity may also have affected perceptions of upside potential and downside risk, and reduced interest in moving assets from one company’s column to another. Uncertainty around the effectiveness of traditional portfolio reviews and future energy mix has also delayed the uptick in deal volume in 2017. However, replenishing project pipelines and a desire to take advantage of the best opportunities arising in 2018, is pushing companies to transform their portfolio reviews and deliver on their growth agendas.
IntroductionContents
Introduction01
Key drivers for 2018Valuations and deal flow
NOCs
02
Upstream review and outlook03
Midstream review and outlook04
Downstream review and outlook05
Oilfield services review and outlook06
This report presents our analysis of transaction data largely compiled by Derrick Petroleum Services. Throughout this report, disclosed or reported transaction values are expressed in US dollars.Note

Notwithstanding rising commodity prices and reduced volatility, deal volumes were muted in the upstream space. Severe backwardation in the forward curve for oil, reflecting short-term supply-demand balance and long run production economics, may be driving divergence. Three of the top 10 non-corporate deals (including the top two which were divestments of Canadian oil sands assets from international to Canadian companies) were transactions driven by consolidation and a flight to core assets, on the part of buyers and sellers rather than valuation. Excluding megadeals, upstream deal volume actually fell 47% to a five-year low while deal value fell 18%.
Deal volume was up in the midstream subsector, but the quantity and size (or absence) of big ticket corporate mergers and acquisitions drove midstream deal value down significantly. There were two transactions in 2016 with valuations approaching US$50 billion and none approaching that in 2017. If we look only at smaller deals, the total valuations continued a four-year downward trend, perhaps reflecting a settling-in of valuations following the market disruptions in the upstream subsector. However, given the US centric nature of large midstream transactions the uncertainty over timing and extent of tax reforms would have also played a part.
Interestingly, downstream was the only oil and gas subsector in which deal volume and deal value moved in the same direction. There were no deals over US$10 billion in 2017, and the most remarkable feature of the landscape was the dramatic reduction in deal volume and deal value for service station assets.
In the oilfield services (OFS) sector, shrinkage in deal value was driven by the absence of megadeals involving any of the big three companies. Excluding GE’s acquisition of Baker Hughes deal value was up by 138% in 2017 vs. 2016. Large deals (US$1–US$10 billion) led the way with eight transactions contributing over US$13 billion to the US$17 billion year over year increase in value in 2017, (adjusted for GE/Baker Hughes transaction). As in every downturn, the service sector was hit particularly hard and interest in smaller, distressed assets and a near-doubling of transaction value was no surprise.
Total global transaction value
13%decline in the number of global transaction deals compared to 2016
2017US$343.5
2016US$390.5
47deals in 2015
Megadeals(more than US$1b) increase 21%
61deals in 2016
74 deals in 2017

Key drivers for 2018
Narrowing of valuation expectationsIn 2017, we saw a material increase in upstream deal values compared to 2016 and 2015 due to:
• Greater confidence in a reasonably stable oil price in the medium term
• Stronger/restructured balance sheets
• Risk sharing and deferred deal structures
This has led to a tightening of valuation expectations from both buyers and sellers and resulted in the confidence to perform larger higher-value transactions.
Changing deal structures in the sectorWe are experiencing an increased use of deferred and contingent considerations in transactions: essentially, this means that headline valuations are being broken up by risk exposure, and more risk sharing is taking place. An example of this is the major international oil companies selling off mature assets to strengthen their balance sheets and pay down debt. This has been successful because they are retaining the decommissioning liabilities, which is increasing the marketability of these assets and thus the ability to achieve higher valuations given the reduction in risk.
Improving environment for the independentsThe independent oil companies have been through a challenging time with the lower oil price environment. Having weathered this downturn via a number of initiatives including renegotiation of their debt positions, they are now in a stronger position. Helped by the improving oil price environment, these companies are generating better margins: with their lower cost of debt, and thus lower cost of capital, they are coming back into the deal market increasing liquidity.
Increasing interest from private equity (PE)We are seeing increased capital flow and deal activity from financial buyers, which helped to support the increased upstream transaction value in 2017. This trend is further evidenced by our Capital Confidence Barometer where nearly 50% of respondents are expecting increased competition for assets from PE buyers. The financial buyers typically focus on pre-development assets where they can manage the development risk and extract value once the asset has operational history, or later life mature assets where the increased focus can maximize production and thus value. Typically financial buyers do not benefit from operational synergies and are likely, therefore, to pay a price closer to the fundamental value of the asset.
Valuationsanddealflow
NOCs
4 | Global oil and gas transactions review 2017

Global oil and gas transactions review 2017 | 5
However, the combination of the oil price drop, and a changing set of views on long-term energy mix and oil market dynamics, has led most of the larger NOCs to undertake a fundamental re-think regarding their:
• Portfolios
• Capital structure
• Contribution to their host society and economy
Out of this will come a series of transactions as NOCs:
• Divest or demerge none core divisions
• Seek funding from third parties through a range of mechanisms
• Enter into more complex partnerships to support their long-term businesses
Based on their public pronouncements, dominating global transaction activity in 2018 will be the IPO of Saudi Aramco, which will become, on flotation, the most valuable publicly listed company in the world. In addition, other NOCs can be expected to come to the public markets or attract strategic investors looking to restructure their capital base and finance their ongoing capital requirements.
From a portfolio perspective, we expect the oil-producing NOCs to continue to gain access to midstream and downstream infrastructure in high-growth markets, to underpin demand for their core product and allow them to extract more value from the molecules they produce. This may be by building new infrastructure, acquisitions or partnerships with market incumbents (or a combination thereof) and should be a trend that continues for the medium-term.
Activity can also be expected from the resource-seeking NOCs as they move to supplement their now-depleting reserve bases following their pre-crash acquisition campaigns. However, as these organizations have continued to mature, expect divestments too as they seek to focus their portfolios and drive financial efficiencies.
Impact of a rising interest rate environment on capital structuresThe beginning of 2018 has marked a decisive move in expectations towards an environment of rising US interest rates. This will have a global impact on costs of capital and may spark capital restructuring activity in those parts of the sector that have made heavy use of cheap debt.
Oilfield services The OFS sector is lagging behind the overall recovery of the oil and gas sector in general. In 2017 we experienced further consolidation in the sector, with more transactions compared to 2016 albeit with a lower overall value. We also saw a lot of restructuring activity between the equity and debt holders to try and ensure going concern status and to maximize value for all parties. As the recovery continues, the sector may look at taking on more risk, which will have implications for value via potentially an increased cost of capital.
A lower level of reported transactions masks a fundamental transformation underway amongst the NOCsNOCs’ reported transaction volumes and values seem to indicate a high level of portfolio and capital stability. However, this is very different to the underlying situation. This will become increasingly apparent as 2018 progresses and the extensive transformation activities within the NOC community become progressively more visible.
Over recent years we have seen two trends in NOC transactions. In the pre-downturn era this activity was dominated by the overseas expansion of the resource-seeking (predominantly Chinese) NOCs. More recently, activity has been supported by NOCs exiting midstream and downstream assets at healthy valuations to financial buyers.
0
50
100
150
200
250
300
Num
ber o
f dea
ls
Repo
rted
dea
l val
ue (U
S$ b
illio
n)
2013 2014 2015 2016 2017
Value Volume
10,000
20,000
30,000
40,000
50,000
60,000
70,000
80,000
90,000
—
NOCs transactions
Source: EY analysis of data from Derrick Petroleum Services

Upstream
50%Upstream % of total deal value up 16%
year on year
Movinginto2017weprojectedastronger upstream transactions market, rebounding from the worstyearinrecentmemory,withoil price recovery and stability. Thisprovedtobethecasewithdeal value climbing 30% to US$172.2 billion, the second strongest performance in the last fiveyears.Akeyfeaturewasaverystrongfirstquarterwhichoutpacedotherquarter’saveragedeal value by more than 82%. Canadianplayersdrovethefirstquarterresultbyaggressivelymanaging pricing challenges from location differentials and heavy oil.
Although 2017 deal values were up substantially, deal counts were down by 19%, which resulted in the average deal value increasing from US$111 million to US$178 million. Management teams and their boards, particularly those with higher leverage, acted to improve balance sheets, high-grade portfolios and lower equity risk.
Regional trendsNorth America again led the way with US$94 billion in deal value in 2017 versus US$79 billion in 2016, representing a 19% increase. Key themes were Canadian oil sands consolidation under Canadian ownership, independents consolidating their core basins (primarily Permian, Eagle Ford, and Marcellus) and majors extending unconventional positions. New for 2017 was the European resurgence which (excluding the 2015 Shell-BG deal) was the best performance in over five years at US$27 billion. Differing North Sea perspectives created divergent approaches across similar players: Majors both acquired and divested, as did independents. Russia was the third truss in the deal market structure experiencing its second strong year at US$26 billion. Elsewhere, there were pockets of activity such as Africa, where majors took positions in large discoveries, and Latin America, where activity revolved around Brazilian and Mexican license awards. The Middle East and North Africa were surprisingly quiet given the pending IPOs and the continued strategic portfolio reviews under consideration in the region.
US$172.2bTotal upstream deal value increases 30%
year on year
970Total upstream deal volumedown19%
year on year
| Global oil and gas transactions review 20176

Distress recedesThankfully the scale and depth of the 2016 distress was not repeated during 2017. OPEC agreements held as global economic recovery began, and stronger oil prices alleviated the short-term cash pressures for many. That said, many “overhang” situations remained which forced corporate transformation activity and higher quality portfolio asset sales. As with 2016, responses varied but included both capital preservation strategies, as well as capital raising through selling assets, entire businesses, mergers and (dilutive) equity sales. Distress in many smaller and highly leveraged independents persisted but moves into financial restructuring declined, while equity and debt bought into price and performance recovery narratives.
Bigger deals emergeAlthough we did not experience a “Block Buster” transaction (>US$50 billion), for the first time in over five years we had two US$13 billion mega deals (>US$10 billion) in upstream: Cenovus/ConocoPhillips in Canada and the Wintershall/L1 Energy deal. CEFC taking Glencore positions in Rosneft and Qatar for US$9.1 billion, and CNR acquiring Shell’s oil sands interests for a total consideration of US$8.5 billion, almost pushed us to four mega deals. Deal counts were in fact up in every category above US$0.5 billion, and overall, the top 20 upstream transactions drove over US$100 billion or 58% of the deal value.
Majors and independents — continued portfolio optimization and innovation2017 saw the continued shift from “growth to value” which we identified and covered last year. Public investor-owned players continued realigning their portfolios to take advantage of new capital allocation realities and transaction opportunities.
Among the majors, Royal Dutch Shell continued its divestment program with North Sea asset sales to Chrysaor. The North Sea divestment strategic shift was noteworthy and was illustrated by Maersk, Dong and Engie divesting their European E&P operations. Conversely, perhaps driven by increasing confidence and opportunity, 2017 saw other majors increasing their M&A activity illustrated by two key transactions: Total acquiring the Maersk upstream business; and ExxonMobil acquiring private companies including its US$5.6 billion asset acquisition from BOPCO.
Deal structure innovation accelerated in 2017 with joint ventures (JV) between independents becoming increasingly common. Spirit Energy (JV between Centrica and SWM’s Bayerngas Norge) was completed in December 2017. At the same time, Wintershall and Dea announced their intention to create a JV. Several other JVs and merger rumours have emerged in 2018. The aim of these JVs is capturing operating synergies and potentially monetizing investments through a subsequent IPO.
$0
$50
$100
$150
$200
$250
Repo
rted
dea
l val
ue (U
S$ b
illio
n)
Num
ber o
f dea
ls
200
400
600
800
1,000
1,200
1,400
1,600
1,800
2,000
2013 2014 2015 2016 2017
Africa IndiaAsia M. EastCanada OceaniaEurope Oth AmerFSU US Deals
Upstream oil and gas transactions
7Global oil and gas transactions review 2017 | 7
Source: EY analysis of data from Derrick Petroleum Services

| Global oil and gas transactions review 2017 8
NOC continued capital transformation and China returnsWhile the proposed Saudi Aramco IPO was the most heavily reported capital transformation example, several additional NOC transformations were rumored to be quietly underway. North African and Middle Eastern players are logically considering JV and outright sales across their hydrocarbon value chain positions, but these are primarily tied to downstream assets. African and Latin American players are looking at portfolio competitiveness and how their fiscal regimes compete to attract capital, needed to offset the ever-present decline curve.
Last year we speculated that 2017 may see the Chinese players return into the market. During the year, overall China investment activity increased to levels last seen in 2014. We saw several sizable deals, CEFC’s announcement to acquire Glencore and Qatar Investment’s stake in Rosneft for US$9.1 billion and CNPC was awarded 8% WI in ADCO concession.
PE increasesDeep-pocketed PE firms with patient capital have significant funds targeted for upstream oil and gas and experienced and proven leadership teams in reserve. With the improving fundamentals and oil price stabilization, it is surprising that investment activity was not more robust. Given the portfolio rebalancing among the majors and independents, and the NOC capital structure resets, private equity opportunities exist. An emerging cautionary theme in this sector, however, is frustration that PE-backed management teams struggle to generate growth with an exit option or operate in a manner that accelerates the drilling backlog whilst providing cash returns and dividends. That said, PE remains willing to invest in the sector as proven by Neptune acquiring the Energie E&P business and Chrysoar capturing the Shell North Sea assets.
2017 saw our industry emerge from one of the worst downturns in some time. 2018 should see the industry in a stronger position with the oil price stabilizing above a US$50/bbl floor, provided economic expansion and demand persists, and the OPEC and major export players continue to balance the market. Furthermore, cost cutting and rationalization have provided upstream players with healthier balance sheets to consider growth investment.
Keythemesweexpectduring2018include:
2018 outlook
• A deal market that is highly sensitive to OPEC and non-OPEC export players cooperation and economic performance and expansion indicators.
• Proven North American shale players that consistently generate cash returns gaining more and lower cost capital to consolidate positions in basins where they have an operating advantage.
• Rapidly increasing US and Canadian shale oil production that will offset some recent pricing gains that pressures the supply side.
• Focus on moving offshore and deepwater cost curves can lower cycle times to access higher rate conventional resources — anticipating host governments with advantaged resource positions will reconsider their fiscal regimes.
• PE activity to increase as several players seek to ‘cut their losses,’ release stranded capital and exit positions taken before the downturn, while other PE players seek creative deals.
• Strong NOCs closely evaluating the Saudi Aramco IPO and related fiscal regime redesign to launch similar efforts.
• Challenged NOCs will reconsider their fiscal terms and capital structures to create more investment opportunities for the resource-constrained NOCs (i.e., China), majors and strong conventional independent operators.
• 2017 demonstrated the willingness of PE to invest into certain sectors such as the North Sea, where they see opportunity. We expect PE activity and investor opportunities to increase in 2018 as expected strategic players look to monetize mature and marginal assets in South East Asia and the North Sea. In North America, unconventional drilling continues to attract private capital, primarily because of the short cycle times and project scalability.
• The majors to continue to divest non-core late life assets, and are able to use increasing operational cash flows and assume additional debt to focus on developments in US and Latin America deal opportunities.
• More innovative transaction structures to realize value.

Global oil and gas transactions review 2017 | 9

24%midstream % of total deal value decreases
13% year on year
Asforecasted,midstreamplayerscontinuedthetrendtowardcapitalstructure reset during 2017, looking inwardtolowercapitalcosts,increasecapital access and improve balance sheets for expected longer-term trends forinfrastructureexpansion.Evenwiththe forecasted oil price increases, the commodity exposure and price declines since 2014 drove many leadership teams, especially those under Master Limited Partnership (MLP) structures, totakeaction.Althoughstrengtheningoil price led to increased rig activity and midstream infrastructure expansion opportunities, the E&P players continued their intense pressure on pipeline companies for lowercontractpricingandbettermarketaccess.OurviewthatNorthAmericanshaleisbecomingtheswingproducerisreflectedinmidstreamcapital allocation, infrastructure build out and deal activity.
Midstream deal value contracted to US$84 billion, down 43% relative to 2016 and returning to levels not seen since 2013. The trend toward large North American transactions continued with nearly 90% of the deal market concentrated in the top 20 deals and every one of these transactions in the USA and Canada. The following four key themes emerged across midstream transaction activity:
MLP resetA very interesting feature for 2017 was the prominent MLP capital structure reset. Nearly US$53 billion (or 63%) of midstream transaction value were corporate-based General Partners increasing their position or acquiring all of the limited partner interests. Midstream players under the MLP structure have recently enjoyed low capital costs driven by income investors seeking consistent and “somewhat secured” dividends at yields that are stronger than the very lower government-backed securities, as well as taxes paid at the individual level (as opposed to corporate and individual). With the infrastructure buildout driven by North American shale and strong commodity prices leading up to 2014, midstream MLP players took on increasing
US$84bTotal midstream deal value decreases 43%
year on year
115Total midstream deal
volume increases 14% year on year
Midstream
| Global oil and gas transactions review 2017 10

11
commodity exposure in their contracts vs. the traditional capital recovery, transport and processing fee arrangements. With strong pricing, they were able to provide the agreed yields to their Limited Partners and enjoy gains from incentive distribution rights (IDRs). However, the decline in commodity pricing over the last three years and contract price exposure has driven cash flows down, and lowered dividend coverage ratios to the point that underlying LP share prices declined and yields increased. Lower LP share pricing and higher yields substantially increased capital costs for the MLP General Partners. At the same time, oil prices are strengthening, rig activity is up and infrastructure buildout capital is needed. Given this confluence of events, MLP General Partners took action to strengthen their balance sheets and lower their financing costs. The three largest midstream deals were centered on MLP resets: OneOk at US$17.2 billion; Williams at US$13.6 billion; and Marathon at US$10.1 billion. This trend extended to seven of the top 10 midstream transactions.
Basin focusCorporate and asset transactions in 2017 are best characterized by “strengthening existing positions.” Over US$14 billion in transaction value were driven
by companies acquiring competitors operating in the same basins where leadership believes growth and margin opportunity will continue. Pembina’s US$7.1 billion acquisition of Veresen is the prime example. Pembina responded to rival moves last year by Enbridge and TransCanada by increasing its Western Canadian Sedimentary Basin pipeline and processing infrastructure in major growth plays such as the Montney. They gained a strong Asian LNG export position with Jordan Cove. Similar “basin focus” logic is tracked to Targa: Outrigger (US$1.5 billion) in the Permian, NuStar; Navigator Energy (US$1.5 billion) in the Permian; and American Midstream Partners; Southcross (US$0.8 billion) in the Eagle Ford and Texas Gulf Coast.
Continued private equity investmentPE players continue seeking positions and assets in advantaged midstream infrastructure and drove nearly US$7 billion in transaction activity. The largest player in 2017 was Blackstone, who acquired EagleClaw Midstream for US$2 billion in the Permian and some of ETP’s Rover Pipeline interests in the Marcellus and Utica.
Global oil and gas transactions review 2017 | 11
$0
$20
$40
$60
$80
$100
$120
$140
$160
$180
20
40
60
80
100
120
140
160
2013 2014 2015 2016 2017
Repo
rted
dea
l val
ue (U
S$ b
illio
n)
Num
ber o
f dea
ls
Africa IndiaAsia M. EastCanada OceaniaEurope Oth AmerFSU US Deals
Midstream oil and gas transactions
Source: EY analysis of data from Derrick Petroleum Services

| Global oil and gas transactions review 2017 12
2017 was clearly a challenging year for midstream players as they dealt with capital structure challenges in the face of increasing investment requirements and E&P customer pressures. 2018 should see the industry sector return to its fundamental business, connecting producers and products to markets. We anticipate a stronger deal market as commodity prices strengthen and drilling and development activity unfold.
Overall, we believe there will be focused investment in crude oil gathering and field gas processing in the better positioned North American shale basins such as the Permian, Anadarko and Eagle Ford. Furthermore, we anticipate some interesting moves in Western Canada as their drilling and development costs continue to decline and Provincial Governments and First Nations cooperate and find creative ways to move products to market and create value for all stakeholders.
Internationally, we expect political tensions to ease in the Middle East, and development in Iraq and Iran to expand: this will create midstream infrastructure growth potential. Challenged African plays are likely to improve as nations change their fiscal regimes to deal with the new “lower for longer” oil price reality (and the flexibility for North American shale to absorb market shifts), resulting in renewed offshore drilling and focused activity to bring several scale and “stranded” discoveries to market.
Finally, the continued preference trend toward cleaner energy will drive interest in natural gas and LNG. In the longer-term we see more nations pressing for fuel oil power generation conversion to natural gas, which will drive LNG development infrastructure.
2018 outlookOther key private equity transactions were multiparty deals. In the first, Global Infrastructure Partners acquired Medallion Gathering & Processing (crude oil gathering and transport in the Permian) from the Energy & Minerals Group (EMG) and Laredo Petroleum for US$1.8 billion.
The second multiparty private equity deal was a creative US$1.4 billion deal that connects the Riverstone-backed Silver Run II special purpose fund and management with Alta Mesa, an independent E&P player focused in the Anadarko basin and Kingfisher Midstream.
Deal creativityMidstream companies continue innovating to find opportunities with the potential for value creation aligned with basin strategies. In addition to the Silver Run/Alta Mesa/Kingfisher deal, Noble Midstream and Greenfield Midstream demonstrated this creative trait by creating their Black Diamond JV to acquire Saddle Butte Rockies Midstream.
In another creative move, Plains All American acquired US$1.2 billion in Concho and Frontier Midstream interests (via their Alpha Holding Company) to gain crude gathering interests in the Permian Basin Northern Delaware, while exiting interests in Michigan and a Midwest pipeline. At the same time, Concho continued the trend for E&P companies to exit midstream operations and reinvest the released capital in shale resource development.
Trends beyond North AmericaWith over 95% of 2017 midstream deal value in North America, the story for the rest of the world is similar to last year. Midstream players continue to look for opportunity in other global regions and there is intense focus on restructuring regions such as Brazil, where Brookfield has taken a position, and Mexico, where companies position for anticipated production growth and opportunities driven by the recent E&P bidding rounds. Other regions either have adequate infrastructure (i.e., the North Sea) or there is uncertainty on development and above ground risks delaying investment (i.e., Iraq and Africa).

Global oil and gas transactions review 2017 | 13

17%Downstream%of
deal value level year on year
Onaglobalbasis,downstreamdealvalues declined by 12% in 2017 comparedto2016(US$59.4billionvs. US$67.6 billion). The number of transactions during the same period declined by 16% (124 vs. 147) reflectinglesstransactionactivityandnosignificantchangein theaverage deal size. Despite the decline,dealvaluesin2017wereUS$14.6 billion higher than the averageforthepastfiveyears.Unlike2015and2016,therewereno transactions over US$10 billion. The top 20 transactions represented 86% of total deal value and the three largest transactions represented 36% of total deal values.
There were a number of themes driving global downstream transactions during the year including:
• US companies dropping down assets into MLPs
• NOCs acquiring assets in markets outside of their core geographies
• International oil companies selling non-core assets
• Investment funds and pensions investing in distribution assets
• Trading companies buying distribution and retail assets
Investments into integrated downstream assets (combination of either refining, storage, pipelines and/or distribution assets) continue to outpace other standalone subsectors, representing 40% of total deal value, similar to the levels in 2016. This highlights the focus on acquiring assets across the integrated supply chain. Investments into refining increased by 276% during the year, mainly due to Saudi Aramco’s investment in RAPID refining and petrochemical complex in Malaysia. Investments in service stations have decreased by 45%, mainly due to lower deal volumes. Pipeline investment activity is heavily focused on natural gas assets in North America and Europe and there has been strong interest from infrastructure and pension funds.
US$59bTotaldownstream
deal value decreases 12% year on year
124Totaldownstream
deal volume decreases 16% year
on year
Downstream
| Global oil and gas transactions review 2017 14

Similar to the past five years, the US and Europe continue to have the highest levels of activity in the downstream sector, despite a decline compared to prior years. Deal values in these two regions represented 72% of the total (compared to 67% in 2016) and 65% of the deal volume (compared to 65% in 2016). A number of regions including Canada, FSU and Oceana saw a significant decrease in deal activity vs. 2016 levels.
The US led other regions in both transactions and deal value with 43 transactions totaling US$32.2 billion in value. Transactions related to MLPs continue to be a key driver of transaction activity, representing 50% of deal values during 2017. Significant transactions included: Marathon Petroleum’s US$8.1 billion and US$1.1 billion drop down of refining, logistics and fuel distribution assets into MLPX; Andeavor’s purchase of Andeavor LP (US$3.8 billion) and Western Logistics LP (US$1.8 billion); and Shell Midstream Partners LP’s purchase of certain Shell refined product and crude oil terminal assets (US$0.8 billion). Other notable transactions include AltaGas US$6.4 billion corporate acquisition of WGL holdings distribution/pipeline asset, 7-Eleven’s acquisition of Sunoco’s retail assets (US$3.3 billion) and Chevron’s sale of Canadian retail assets to Parkland Fuel Corporation (US$1.1 billion).
Europe had a total of 38 transactions, but deal value declined by over 53% to US$10.3 billion (vs. US$21.7 billion) or an average deal value of less than US$0.3 billion. There were three transactions over US$1 billion including EDP’s divesture of its gas distribution business in Spain for US$2.8 billion to Nature Investments, Allianz Capital and CPPIB’s acquisition of 20% interest in Spanish distribution business for US$1.8 billion and OMV’s divesture of its stake in OMV Ofisi to Vitol for US$1.4 billion.
Similar to past years, Asia was third overall, with a deal value of US$7.7 billion and 13 transactions. Activity in the region was dominated by one large transaction, Aramco’s acquisition of a 50% interest in the RAPID refining and petrochemical project for US$7 billion from Petronas as it continues to pursue growth in downstream outside of the Middle East.
Global oil and gas transactions review 2017 | 15
Downstreamoilandgastransactions
Repo
rted
dea
l val
ue (U
S$ b
illio
n)
2014 2015 2016 2017$0
$10
$20
$30
$40
$50
$60
$70
$80
20
40
60
80
100
120
140
160
180
2013
Num
ber o
f dea
ls
Africa IndiaAsia M. EastCanada OceaniaEurope Oth AmerFSU US Deals
Source: EY analysis of data from Derrick Petroleum Services

| Global oil and gas transactions review 2017 16
Looking forward, we expect to see a continued focus on transactions in downstream globally as companies look to further balance their portfolios across the value chain to take advantage of attractive economics and look for opportunities to grow. In particular, NOCs and major oil companies have expressed their desire to grow in refining and petrochemicals to take advantage of low natural gas and demand growth fundamentals in markets like North America and Asia. There is also a renewed focus on retail in certain markets as companies look for opportunities to access attractive margin pools in convenience retailing and as a hedge against declining fuel margins.
In North America, both US-based and foreign companies are still in the process of assessing the impact on the US tax reform on potential investment opportunities. Although it is still unclear how companies will respond, there is potential for an increase in activity due to the lower corporate tax rates. We should also continue to see transaction activity from the MLPs, who will continue to acquire assets to sustain growth.
In refining, we do not expect to see significant activity, due to improved profitability and reduced pressure on integrated players to divest assets due to improving economics across the value chain. Large-scale refineries in the Middle East and India will continue to put pressure on European refiners to invest in their refineries to stay competitive, but it is unclear if this will lead to any material transaction activity in the coming year. There are also opportunities to forward integrate into petrochemicals to take advantage of attractive economics. This may lead to increased organic investment and deal activity in the coming years.
In retail, there will continue to be a focus on developing regions like Asia and India to take advantage of fuel and non-fuel margins in a growing markets. We expect the stronger independents, trading houses and convenience retail specialists will continue to acquire and consolidate the non-core retail assets of the major oil companies within the more developed regions.
Storage terminals went through a period of rebalancing due to overcapacity and a shift into forward price curves to backwardation during Q4 of 2017. If this continues in 2018, this may put pressure on trading with significant positions in storage terminals and may lead to deal activity. Infrastructure funds with investments in storage assets coming towards the end of their fund life may also be looking to divest storage assets. In terms of natural gas pipelines, opportunities would again be concentrated in North America and Europe, and there will be continued interest from infrastructure and pension funds.
Longer term, we continue to believe advancement in electric vehicles, changing consumer preferences for cleaner energy and regulation have the potential to put pressure on the downstream sector. These trends will have the highest impact on smaller refiners in mature markets and may lead to exports and eventually to refinery divestitures or closures. We also expect to see an increased emphasis on acquiring retail assets with a strong convenience store offering to capture margin from non-fuel activities.
2018 outlook

Global oil and gas transactions review 2017 | 17
| Global oil and gas transactions review 2017 18
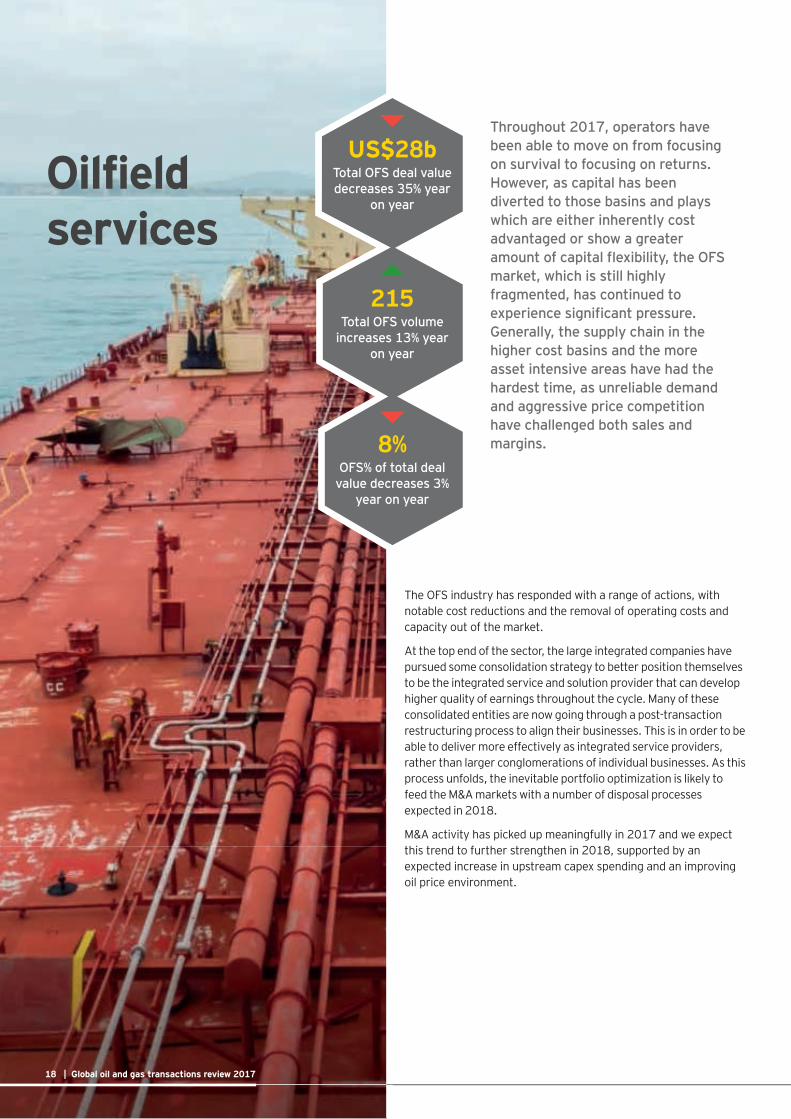
8%OFS% of total deal
value decreases 3% year on year
Throughout 2017, operators have been able to move on from focusing on survival to focusing on returns. However,ascapitalhasbeendiverted to those basins and plays whichareeitherinherentlycostadvantagedorshowagreateramountofcapitalflexibility,theOFSmarket,whichisstillhighlyfragmented, has continued to experiencesignificantpressure.Generally, the supply chain in the higher cost basins and the more asset intensive areas have had the hardest time, as unreliable demand and aggressive price competition have challenged both sales and margins.
The OFS industry has responded with a range of actions, with notable cost reductions and the removal of operating costs and capacity out of the market.
At the top end of the sector, the large integrated companies have pursued some consolidation strategy to better position themselves to be the integrated service and solution provider that can develop higher quality of earnings throughout the cycle. Many of these consolidated entities are now going through a post-transaction restructuring process to align their businesses. This is in order to be able to deliver more effectively as integrated service providers, rather than larger conglomerations of individual businesses. As this process unfolds, the inevitable portfolio optimization is likely to feed the M&A markets with a number of disposal processes expected in 2018.
M&A activity has picked up meaningfully in 2017 and we expect this trend to further strengthen in 2018, supported by an expected increase in upstream capex spending and an improving oil price environment.
US$28bTotal OFS deal value decreases 35% year
on year
215Total OFS volume
increases 13% year on year
Oilfield services
| Global oil and gas transactions review 2017 18

Global oil and gas transactions review 2017 | 19
2017 OFS transaction activity recapIn 2017, we saw 215 deals announced in the OFS sector, which is up by 13% from 2016 levels of 191 and approximately half the number of deals pre-crisis.
Deal value (US$28 billion) is down by 35% compared to 2016, similar to levels seen in 2013 and 2015. This sharp decrease is due to the absence of large transformational deals such as GE-Baker Hughes, which had a value of US$32 billion in 2016. Adjusted
for large transactions which are more sporadic, 2017 deal levels show a continuous upward trend since 2015 and are up by 144% in 2017 vs. 2016 adjusted levels (adjusted for GE-Baker Hughes deal, US$32 billion) and by 154% vs. 2015 adjusted levels (adjusted for Schlumberger/Cameron transaction, US$15 billion).
Average deal value of US$131 million is more than double 2016 levels adjusted for the GE-Baker Hughes transaction, as well as almost triple the average deal value pre-crisis, highlighting the presence of larger transactions during the past year.
Global oil and gas transactions review 2017 | 19
OFS oil and gas transactions
Num
ber o
f dea
ls
Rep
orte
d de
al v
alue
(US$
bill
ion)
$0
$5
$10
$15
$20
$25
$30
$35
$40
$45
$50
50
100
150
200
250
300
350
400
450
500
Value Deals
2014 2015 2016 20172013
2013 2014 2015 2016 2017
Value (US$ billion) 23.1 33.6 25.9 43.5 28.2
Number of deals 449 455 193 191 215
Average deal value (US$ million) 52 74 134 228 131
Adjusted for large deals > US$5 billion
Adjusted deal value (US$ billion) 23.1 26.0 11 .1 11.5 28.2
Adjusted number of deals 449 454 192 190 215
Adjusted average deal value (US$ million) 52 57 58 60 131
Source: EY analysis of data from Derrick Petroleum Services

| Global oil and gas transactions review 2017 20
Drivers of M&A activityA key reason for this increase in M&A activity in 2017 has been the gradual increase in the oil price during the year and the rig count recovery (particularly in North America). This is in addition to improvement in market sentiment with a view that several subsectors may have bottomed out in 2017 and that the overall market is recovering.
After several years of downturn, buyers and sellers expectations have also been narrowing and a robust pipeline of actionable M&A opportunities is now available.
There are five drivers of M&A activity in 2017:
• Value chain integration
• Economies of scale
• Technology/digital
• Distress
• Increased access to capital markets
We expect these themes to continue to prevail in 2018, with additional M&A activity coming from portfolio optimization: this is an important theme for 2018, with various contractors and service providers already planning divestments of non-core divisions, either as a direct result of M&A activity or as a continued move towards improving cashflows and returns on capital.
Value chain integrationThe FMC-Technip merger and the GE Oil & Gas acquisition of Baker Hughes in 2016, along with Schlumberger’s acquisition of Cameron announced in April 2015, marked the premises of an acquisition strategy centered around the integration of products and services from different parts of the oil and gas value chain.
This trend continued in 2017, although to a lower extent than in 2016 given the absence of large transactions and through investments, alliances and JVs between companies in different parts of the value chain, rather than full consolidation.
An example was Schlumberger’s acquisition of a minority interest in Borr Drilling, a recently established offshore drilling company. The goal was to enable both companies to offer integrated, performance-based drilling contracts in the offshore jack-up market.
Another example was the OneStimSM joint venture between Schlumberger and Weatherford announced in March 2017. The joint venture was to create a new leading unconventional products and services provider in North America: Weatherford would contribute its multistage completions portfolio, regional
manufacturing capability and supply chain, with Schlumberger providing the JV with access to its surface and downhole technologies, operational processes and geo-engineered workflows. At the end of December 2017, the parties called off the JV with Weatherford agreeing to the sale of its US pressure pumping and pump down perforating related facilities and supplier and customer contracts for US$430 million in cash, retaining the entirety of its leading multistage completions portfolio, manufacturing capability and supply chain.
In the engineering and construction sector, Wood Group’s acquisition of Amec FosterWheeler (US$4 billion) is another example of two UK contractors merging to create a global leader in project, engineering, and technical services delivery, with enhanced capability across diversified industry markets (oil and gas, chemicals, power, environment and infrastructure, mining) and across the asset life cycle (projects, engineering, modifications, construction, operations and maintenance). Scale, diversification and desire to be present in the full asset life cycle were key drivers for this consolidation.
Following a slightly similar rationale, McDermott announced its merger with Chicago Bridge & Iron at the end of 2017, creating a fully vertically integrated Engineering, Procurement, Construction and Installation provider with a presence across the full project lifecycle and in the onshore and offshore sector.
With the focus on improving cost efficiencies still high on the agenda, it is expected that this collaboration between contractors will continue and that companies in different parts of the value chain (onshore vs. offshore, service vs. manufacturing, front end vs. project development vs operation) will enter into partnerships, joint ventures and/or full consolidation.
Economies of scaleGiven cost efficiencies are still high on the agenda, a large volume of M&A activity has been driven by the need to achieve economies of scale through the creation of more dominant companies with greater scale and a broader portfolio of assets.
With some sectors entering a recovery phase in 2017, various asset-heavy companies have made counter-cyclical investments by purchasing businesses at what appears to be all-time cyclical lows. This has been particularly true in the offshore drilling sector, which has been struggling with significant oversupply and has been sharply impacted by the downturn.
Two transactions highlight this trend in the offshore drilling sector:
• Transocean’s acquisition of Songa Offshore for US$3.4 billion, strengthening Transocean’s position in the harsh environment market and its technical and operational presence in the Norwegian market.

Global oil and gas transactions review 2017 | 21
• Ensco’s acquisition of Atwood (US$1.6 billion), aimed at creating a larger offshore driller with a broader and more diversified customer base and a diversified geographic profile.
This type of consolidation has also been prevalent in the offshore support vessel sector in Norway: with the merger of Norway’s biggest offshore support vessel operators (Solstad Offshore, Farstad Shipping, Deep Sea Supply) for a total value of US$2.3 billion in 2017; and the merger of Rem Offshore and Solstad Offshore in 2016. In a restructuring supported by lenders, bondholders, long-standing family owners and industrial investors, the merger, seen as a necessary structural measure in today’s offshore support vessel market, created a new player with one of the biggest fleets in the sector, more efficient operations and a lower cost base.
Given the continued oversupply of some types of rigs and vessels, we expect this trend to continue in 2018 with well-capitalized companies and financial investors engaging into more consolidation activity and/or acquiring assets out of administration.
Continued focus on technology and digital data integrationThe oil and gas industry is one of the world’s most advanced users of technologies. However to-date, these technologies have been primarily focused on improving time to first oil and improving the effectiveness of hydrocarbon extraction, rather than operational performance and end-to-end integration.
The industry also collects massive volumes of data: this data is generally highly technically specialized and sits within functional silos, limiting cross-functional interaction and understanding. Significant opportunities exist to enhance data transparency and enterprise understanding to drive better decision making and operating performance.
The past few years have shown a number of transactions driven by the acquisition of technology and the integration of digital data and we expect these acquisitions to continue to be on the wish list of OFS companies looking to differentiate in 2018. While mostly small-sized transactions, these acquisitions could form a strong basis for operational outperformance and contribute to an increase in market share for the players involved.
Specific examples of technology acquisitions in the drilling/well sector include:
• Schlumberger’s acquisition of Peak Well systems in the first week of 2017: with Peak’s portfolio of downhole flow control technologies, Schlumberger aims to create a fully integrated well intervention solution designed to drive further project development efficiency.
• In June 2017, Helmerich & Payne, a leading US onshore drilling company, announced the acquisition of Motive Drilling Technologies, an industry leader in the use of cognitive computing to guide the directional drilling process. A few months later, the company complemented this acquisition with the acquisition of Magnetic Variation Services, a leader in enhancing the accuracy of directional drilling and wellbore optimization, thereby improving well placement and decreasing drilling days and creating further value for E&P clients by decreasing drilling costs.
• A month after announcing its agreement to acquire Tesco in August 2017, Nabors Industries announced the acquisition of Robotic Drilling Systems (RDS), a provider of automated tubular and tool handling equipment for the onshore and offshore drilling markets. This transaction integrates the RDS team and product offering with the technology portfolio of Canrig, Nabors rig equipment subsidiary, strengthening the development of Nabors’ drilling automation solutions.
The majority of OFS companies are working to streamline their offerings with data-enhanced processes, increasing flows, shortening process times and ultimately increasing efficiencies. There are no doubts that this trend is going to continue in the years to come.
DistressFinancial stress has been a key driver of M&A activity in 2017, specifically on the highly fragmented end of the market focused on serving non-complex oil and gas development projects or providing relatively commoditized products and services. In the offshore support vessel sector for instance, consolidation has been a means of survival for companies with large debt burdens in a significantly oversupplied market.
With the downturn persisting, various companies have filed for bankruptcy protection (e.g., CGG, EMAS Chiyoda, Seadrill) undertaking complex restructurings, in many cases led by their banks and bondholders. As their ownership changes, it is anticipated that the new financial owners will embark on divesting non-core divisions or assets and/or pursue M&A acquisitions to better position their investments before an exit when the market has improved and the operational performance of these companies has been restored.
A continued “medium for longer” commodity price environment will continue to force poorly operated or highly leveraged companies to face increasing balance sheet pressure, compounded by often significant impairment adjustments. This pressure is expected to result in the liquidation or forced sale of assets and distressed businesses, creating M&A opportunities for financial investors and industry players alike.

| Global oil and gas transactions review 2017 22
Increased access to capital marketsGlobal IPO activity surged in 2017, making it the most active year since 2007. With 39 oil and gas IPOs and more than US$11 billion of proceeds raised, the oil and gas sector has been an active sector in 2017, with the OFS sector raising approximately US$2 billion, out of Canada, the United Kingdom and the United States. With two OFS companies filing IPOs in the first two weeks of January, we expect this trend to continue in 2018.
Accessing capital to pursue growth opportunities has been one of the drivers of these IPOs, with several companies engaging in M&A activity after their IPO.
As an example, four months after its IPO on the NASDAQ stock exchange in April 2017, NSC Multistage, an American independent technology and services company specializing in multistage completions, announced the US$80 million acquisition of Spectrum Tracer Services. Spectrum is a leading provider of chemical and radioactive tracer diagnostics technologies used by oil and gas operators to assess completion performance, evaluate well production, and optimize field development strategies.
2017 was also the year when several prominent special purpose acquisition companies (SPACs) went public, raising billions of funds to deploy to the energy sector. After Silver Run Acquisition Corp. II raised US$1 billion in March 2017 and TPG Pace Energy Holdings Corp. raised US$650 million early May, National Energy Services Reunited Corp. (NESR) raised US$210 million mid May 2017 to focus on businesses and assets in the energy services industry, with an emphasis on oil and gas services
globally. In November 2017, NESR announced the acquisition and consolidation of two Middle East companies, Gulf Energy SAOC and National Petroleum Services, for an aggregate purchase price of approximately US$1.1 billion, creating a leading regional OFS companies offering a mix of drilling, completion and production services and equipment in the MENA and Asia Pacific regions.
The growth of SPACs targeting the energy sector and, with NESR, the OFS sector in particular highlights the attractiveness of such structures for target companies and investors alike. For target companies, SPACs can be seen as an attractive business combination partner, due to their public listing, strong financial position, highly experienced management teams and backing from reputable financial sponsors. For investors, their attractiveness lies in the fact that they can potentially profit from advantageous business transactions in the future without exposing much of their capital until a transaction is proposed. In today’s oil market environment, this could be very attractive.
The success of these IPOs is a testament that investors have started to believe that sectors’ valuations have reached a bottom and are placing bets that M&A activity will pick-up. On the debt side, capital market conditions have remained robust in 2017 and are expected to continue to remain so in 2018. Early signs of market recovery, greater market visibility and robust equity and debt market conditions should contribute to a further increase in M&A activity in 2018. It is also anticipated that more M&A activity will be financed by cash rather than through all-stock transactions as seen in previous years.

Global oil and gas transactions review 2017 | 23

EY | Assurance | Tax | Transactions | Advisory
AboutEY EY is a global leader in assurance, tax, transaction and advisory services. The insights and quality services we deliver help build trust and confidence in the capital markets and in economies the world over. We develop outstanding leaders who team to deliver on our promises to all of our stakeholders. In so doing, we play a critical role in building a better working world for our people, for our clients and for our communities.
EY refers to the global organization, and may refer to one or more, of the member firms of Ernst & Young Global Limited, each of which is a separate legal entity. Ernst & Young Global Limited, a UK company limited by guarantee, does not provide services to clients. For more information about our organization, please visit ey.com.
HowEY’sGlobalOil&GasSectorcanhelpyourbusinessThe oil and gas sector is constantly changing. Increasingly uncertain energy policies, geopolitical complexities, cost management and climate change all present significant challenges. EY’s Global Oil & Gas Sector supports a global network of more than 10,000 oil and gas professionals with extensive experience in providing assurance, tax, transaction and advisory services across the upstream, midstream, downstream and oil field subsectors. The Sector team works to anticipate market trends, execute the mobility of our global resources and articulate points of view on relevant sector issues. With our deep sector focus, we can help your organization drive down costs and compete more effectively.
© 2018 EYGM Limited. All Rights Reserved.
EYG no. 00803-184GBL
BMC Agency GA 1006889
ED None.
In line with EY’s commitment to minimize its impact on the environment, this document has been printed on paper with a high recycled content.
This material has been prepared for general informational purposes only and is not intended to be relied upon as accounting, tax or other professional advice. Please refer to your advisors for specific advice.
ey.com/oilandgas/transactions
Andy Brogan +44 20 7951 7009 [email protected]
Vance Scott +1 312 879 2185 [email protected]
Jon Clark +44 20 7951 7352 [email protected]
Celine Delacroix +44 (0) 20 7806 9204 [email protected]
Sanjeev Gupta +65 6309 8688 [email protected]
Evgeny Khrustalev +61 8 9429 2416 [email protected]
Dilip Khanna +91 11 667 18700 [email protected]
Kunihiko Taniyama +81 3 4582 6400 [email protected]
Tabrez Khan +44 20 7951 4674 [email protected]
Grigory Arutunyan +7 495 641 2941 [email protected]
Lance Mortlock +1 403 206 5277 [email protected]
EY Global Oil & Gas Transaction Advisory Services contacts:
Connectwithus
Visit us on Linkedin
Follow us on Twitter @EY_OilGas
See us on YouTube