global ocean monitoring: recent evolution, current status, and predictions
DESCRIPTION
Global Ocean Monitoring: Recent Evolution, Current Status, and Predictions. Prepared by Climate Prediction Center , NCEP/NOAA May 7, 2013. http://www.cpc.ncep.noaa.gov/products/GODAS/ This project to deliver real-time ocean monitoring products is implemented - PowerPoint PPT PresentationTRANSCRIPT
1
Global Ocean Monitoring: Recent Evolution, Current Status, and Predictions
Prepared byClimate Prediction Center, NCEP/NOAA
May 7, 2013
http://www.cpc.ncep.noaa.gov/products/GODAS/This project to deliver real-time ocean monitoring products is implemented
by CPC in cooperation with NOAA Ocean Climate Observation Program (OCO)
2
Outline• Overview
• Recent highlights– Pacific/Arctic Ocean
(Show possible impact of TAO missing on NCEP data assimilation)
– Indian Ocean
– Atlantic Ocean
(check the evolution of some factors which might affect the hurricane activity)
• Global SST Predictions

3
Overview Pacific and Arctic Oceans ENSO-neutral condition continued during Apr 2013 with Nino3.4=-0.15C.
NOAA officially forecast ENSO-neutral condition to continue in the Northern Hemisphere spring-summer 2013.
Negative PDO phase weakened with PDO index =-0.8 in Apr 2013, and NCEP CFSv2 predicted negative phase of PDO would continue.
Arctic sea ice extent in Apr 2013 was well below-normal.
Indian Ocean SSTs in Indian Ocean were above or near-normal in Apr 2013.
Atlantic Ocean NAO switched from negative to positive phase with NAO index =0.6 in
Apr 2013.
Tripolar SSTA in N. Atlantic enhanced in Apr 2013, may due to the impact of persistent negative phase of NAO in Jan-Mar 2013.
4
Global Oceans
5
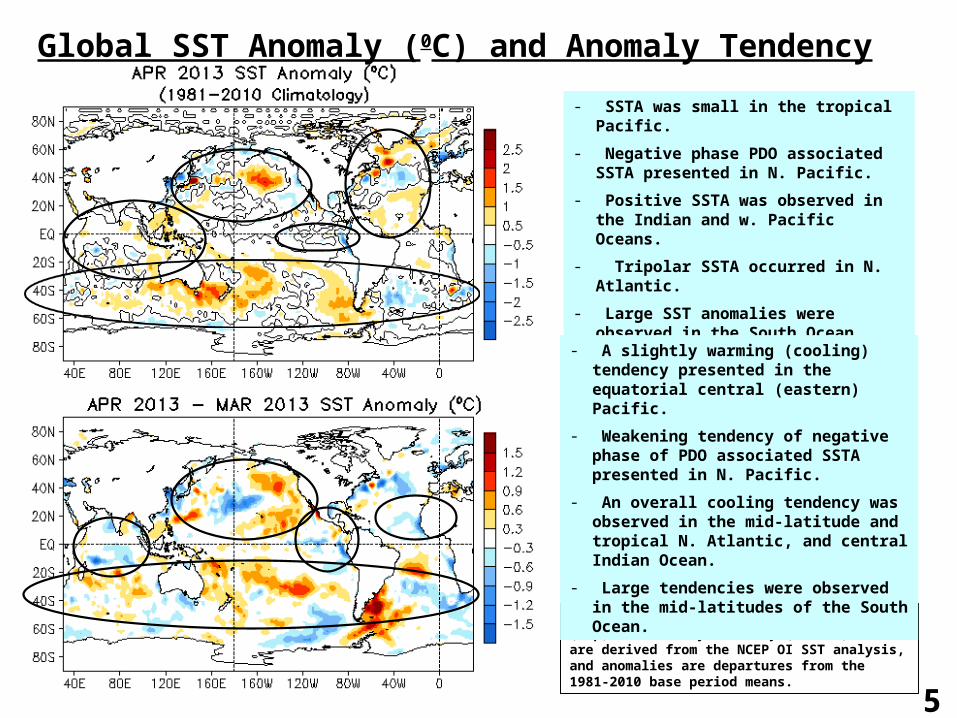
Fig. G1. Sea surface temperature anomalies (top) and anomaly tendency (bottom). Data are derived from the NCEP OI SST analysis, and anomalies are departures from the 1981-2010 base period means.
Global SST Anomaly (0C) and Anomaly Tendency
- SSTA was small in the tropical Pacific.
- Negative phase PDO associated SSTA presented in N. Pacific.
- Positive SSTA was observed in the Indian and w. Pacific Oceans.
- Tripolar SSTA occurred in N. Atlantic.
- Large SST anomalies were observed in the South Ocean.
- A slightly warming (cooling) tendency presented in the equatorial central (eastern) Pacific.
- Weakening tendency of negative phase of PDO associated SSTA presented in N. Pacific.
- An overall cooling tendency was observed in the mid-latitude and tropical N. Atlantic, and central Indian Ocean.
- Large tendencies were observed in the mid-latitudes of the South Ocean.
6
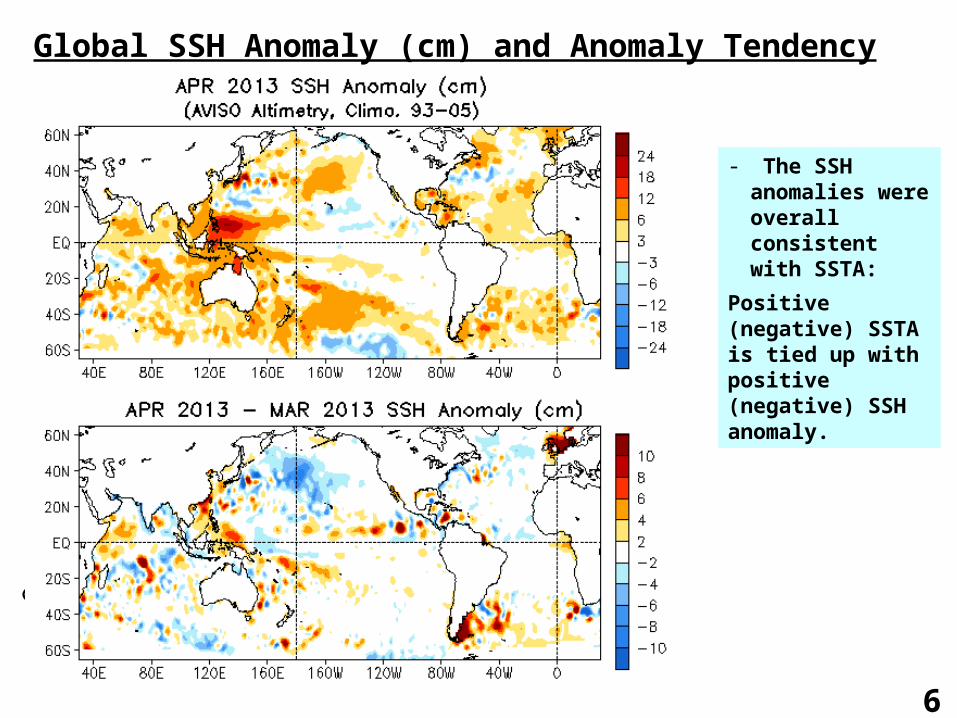
Global SSH Anomaly (cm) and Anomaly Tendency
- The SSH anomalies were overall consistent with SSTA:
Positive (negative) SSTA is tied up with positive (negative) SSH anomaly.
7
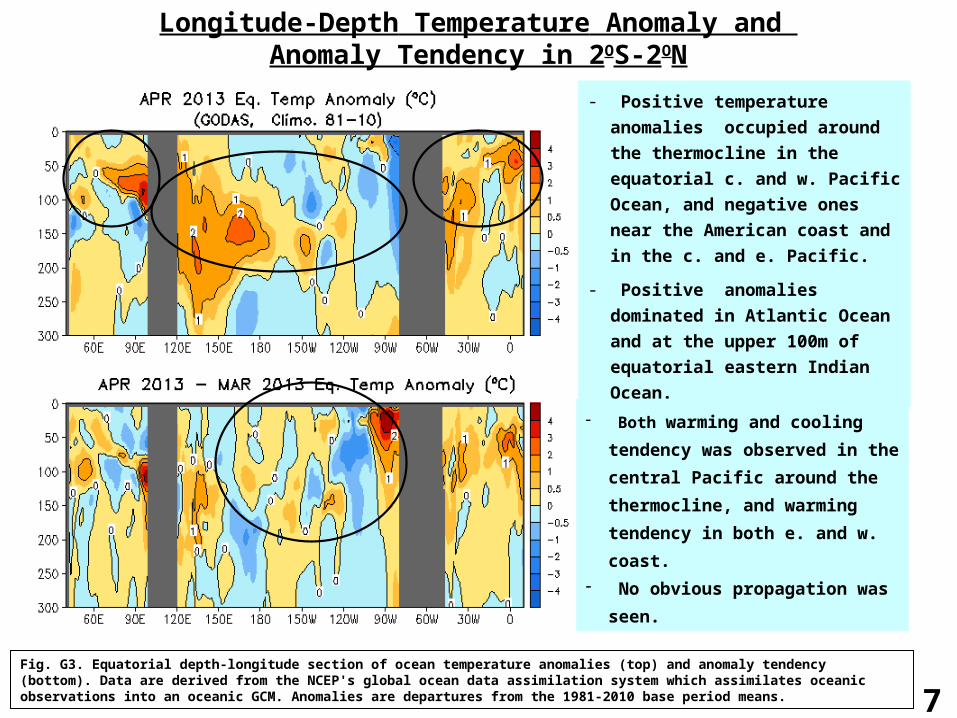
Longitude-Depth Temperature Anomaly and Anomaly Tendency in 2OS-2ON
Fig. G3. Equatorial depth-longitude section of ocean temperature anomalies (top) and anomaly tendency (bottom). Data are derived from the NCEP's global ocean data assimilation system which assimilates oceanic observations into an oceanic GCM. Anomalies are departures from the 1981-2010 base period means.
- Positive temperature
anomalies occupied around
the thermocline in the
equatorial c. and w. Pacific
Ocean, and negative ones
near the American coast and
in the c. and e. Pacific.
- Positive anomalies
dominated in Atlantic Ocean
and at the upper 100m of
equatorial eastern Indian
Ocean.
- Both warming and cooling
tendency was observed in
the central Pacific around the
thermocline, and warming
tendency in both e. and w.
coast.- No obvious propagation was
seen.

8
- Positive TCHP anomalies presented in the w. Pacific and negative ones in the c. and e. Pacific.
- Both the anomalies and the tendencies over the w. Atlantic Ocean were small positive.
TCHP field is the anomalous heat storage associated with temperatures larger than 26°C.

9
Tropical Pacific Ocean and ENSO Conditions

10
Pentad Mean Equatorial Pacific
Temperature Anomaly
TAO GODAS-TAO
- Positive temperature
anomalies in the c. and w.
Pacific did not have clear
propagation.
- Negative temperature
anomalies in the c. and e.
Pacific were intensified in
recent 2 pentads.
- However, the differences
between TAO and GODAS
were large in the c. and e.
Pacific (150W, 120W). What
causes the differences?

11
Last 3-Month Mean Equatorial Pacific
Temperature Anomaly
TAO GODAS
- The differences
between TAO and
GODAS, and
between TAO and
CFSR were large
in the c. and e.
Pacific.
- What causes the
differences?
CFSR
12
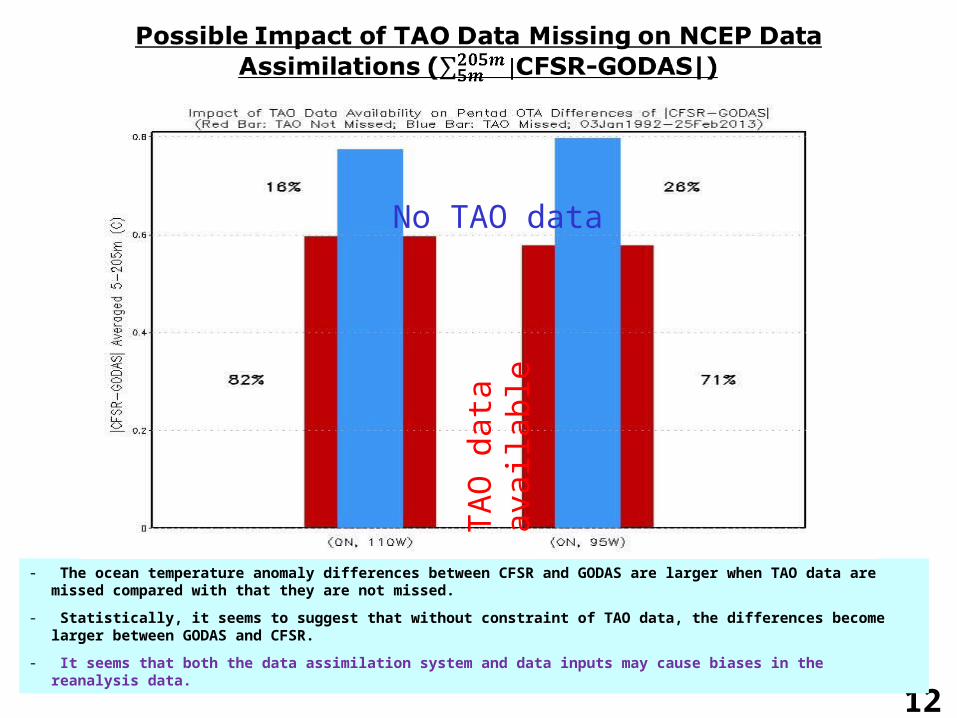
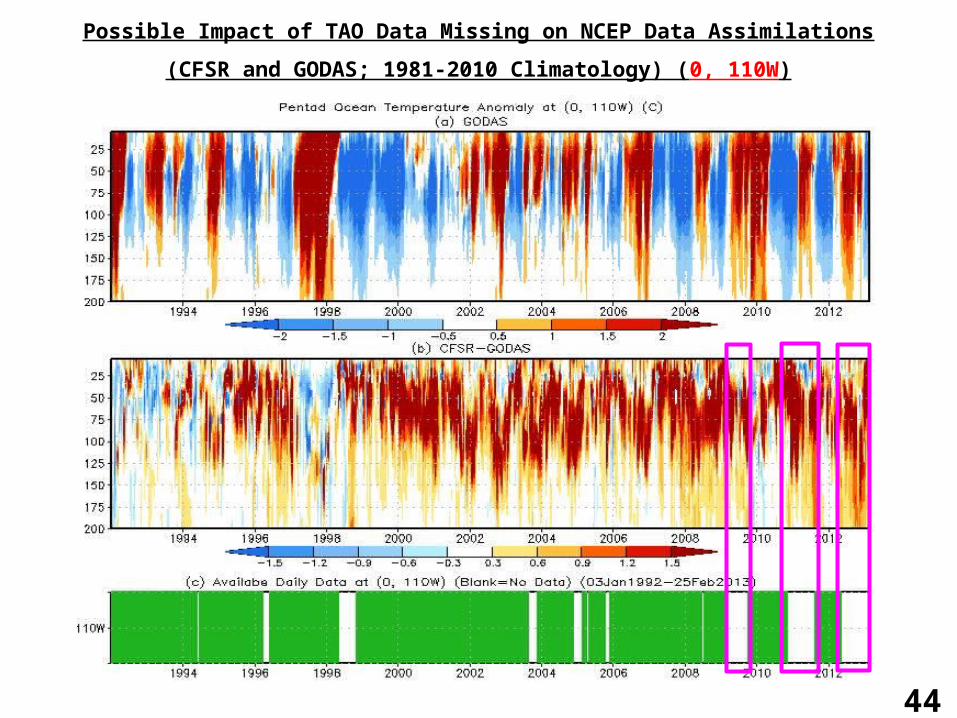
- The ocean temperature anomaly differences between CFSR and GODAS are larger when TAO data are missed compared with that they are not missed.
- Statistically, it seems to suggest that without constraint of TAO data, the differences become larger between GODAS and CFSR.
- It seems that both the data assimilation system and data inputs may cause biases in the reanalysis data.
No TAO data
TAO
dat
a av
aila
ble
13
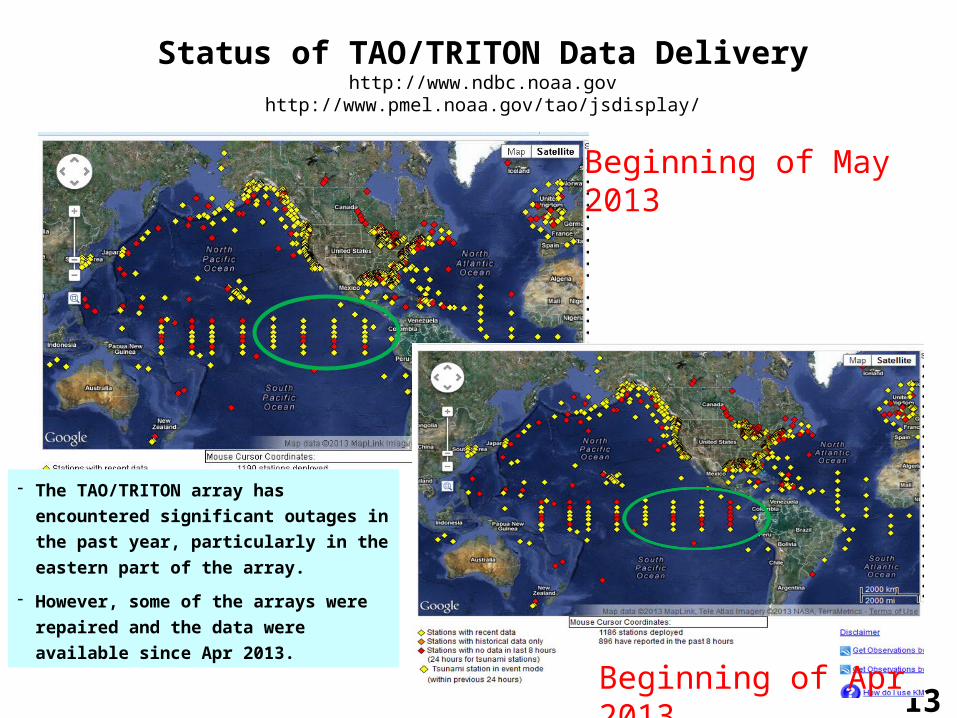
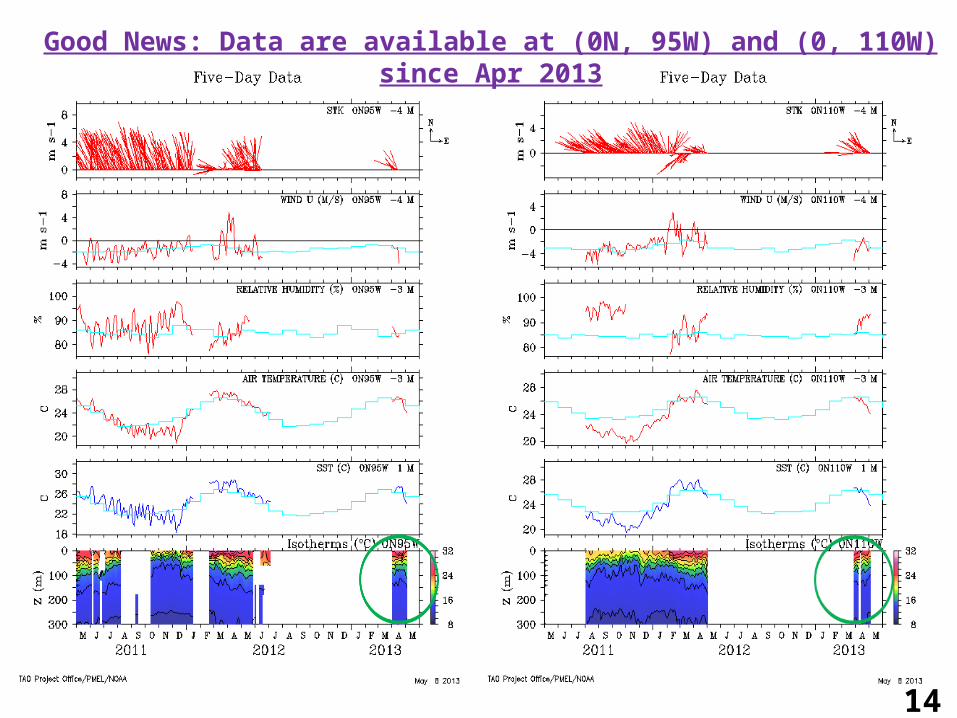
Status of TAO/TRITON Data Deliveryhttp://www.ndbc.noaa.gov
http://www.pmel.noaa.gov/tao/jsdisplay/
- The TAO/TRITON array has
encountered significant outages in
the past year, particularly in the
eastern part of the array.
- However, some of the arrays were
repaired and the data were
available since Apr 2013.
Beginning of May 2013
Beginning of Apr 2013
14
CFSR CFSv2
Good News: Data are available at (0N, 95W) and (0, 110W) since Apr 2013
15
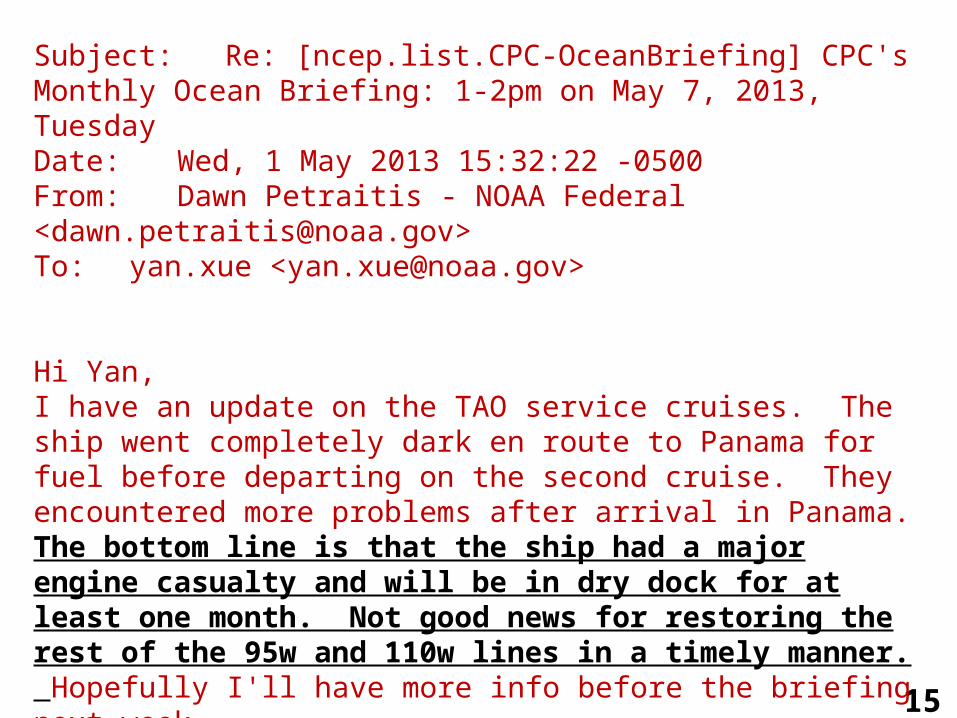
Subject: Re: [ncep.list.CPC-OceanBriefing] CPC's Monthly Ocean Briefing: 1-2pm on May 7, 2013, TuesdayDate: Wed, 1 May 2013 15:32:22 -0500From: Dawn Petraitis - NOAA Federal <[email protected]>To: yan.xue <[email protected]>
Hi Yan,I have an update on the TAO service cruises. The ship went completely dark en route to Panama for fuel before departing on the second cruise. They encountered more problems after arrival in Panama. The bottom line is that the ship had a major engine casualty and will be in dry dock for at least one month. Not good news for restoring the rest of the 95w and 110w lines in a timely manner. Hopefully I'll have more info before the briefing next week.
Thanks,Dawn

16
NINO3.4 Heat Budget
- SSTA tendency (dT/dt) in NINO3.4 region (dotted black line) was near zero in Apr 2013.
- All the advection terms, as well as thermodynamical term (Qq) were positive.
- The RHS and dT/dt had large differences in Apr 2013.
Huang, B., Y. Xue, X. Zhang, A. Kumar, and M. J. McPhaden, 2010 : The NCEP GODAS ocean analysis of the tropical Pacific mixed layer heat budget on seasonal to interannual time scales, J. Climate., 23, 4901-4925.
Qu: Zonal advection; Qv: Meridional advection;
Qw: Vertical entrainment; Qzz: Vertical diffusion
Qq: (Qnet - Qpen + Qcorr)/ρcph; Qnet = SW + LW + LH +SH;
Qpen: SW penetration; Qcorr: Flux correction due to relaxation to OI SST

17
Evolution of Equatorial Pacific Surface Zonal Current Anomaly (cm/s)
- In the last three months, eastward anomaly current was observed, and weakened in Apr
2013. That seems consistent with the Kelvin wave activities (next slide).
- Some differences were noted for both anomaly and climatology between OSCAR and
GODAS.
18
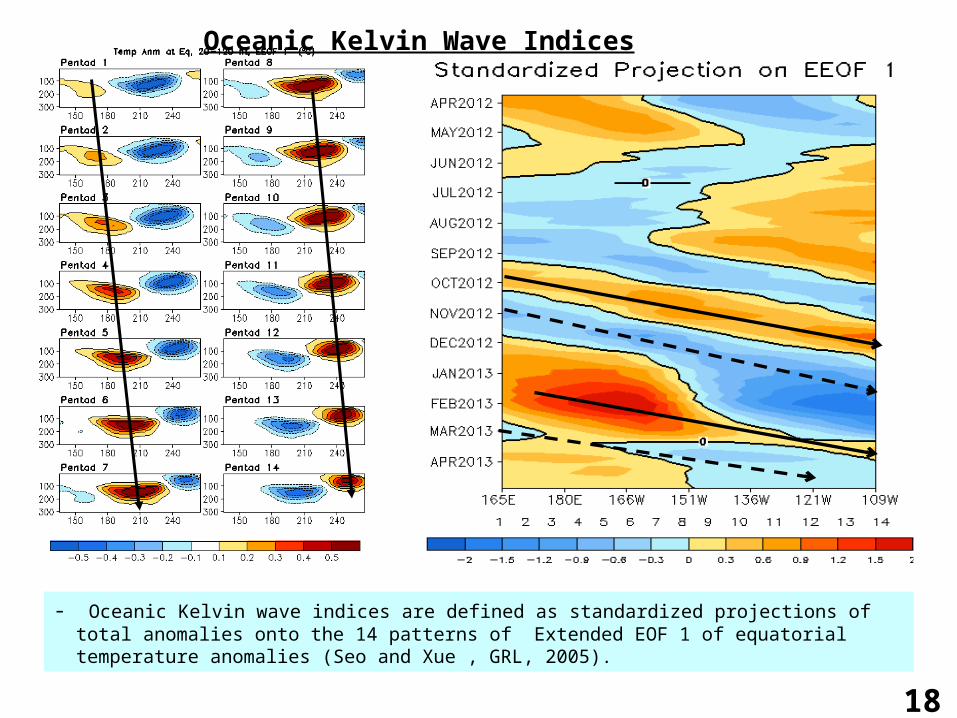
Oceanic Kelvin Wave Indices
- Oceanic Kelvin wave indices are defined as standardized projections of total anomalies onto the 14 patterns of Extended EOF 1 of equatorial temperature anomalies (Seo and Xue , GRL, 2005).

19
Evolution of Pacific NINO SST Indices
- All Nino indices were negative and NINO
3.4 = -0.15oC.
- The indices were calculated based on
OISST. They may have some differences
compared with those based on ERSST.v3b.
Fig. P1a. Nino region indices, calculated as the area-averaged monthly mean sea surface temperature anomalies (oC) for the specified region. Data are derived from the NCEP OI SST analysis, and anomalies are departures from the 1981-2010 (bar) and last ten year (green line) means.
20
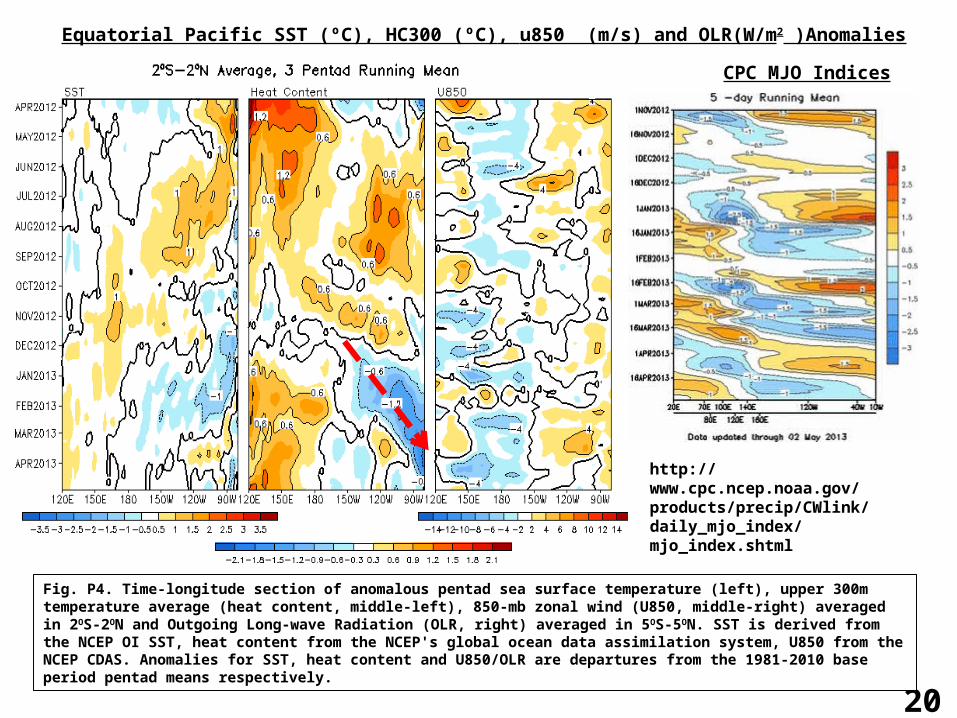
Equatorial Pacific SST (ºC), HC300 (ºC), u850 (m/s) and OLR(W/m2 )Anomalies
Fig. P4. Time-longitude section of anomalous pentad sea surface temperature (left), upper 300m temperature average (heat content, middle-left), 850-mb zonal wind (U850, middle-right) averaged in 2OS-2ON and Outgoing Long-wave Radiation (OLR, right) averaged in 5OS-5ON. SST is derived from the NCEP OI SST, heat content from the NCEP's global ocean data assimilation system, U850 from the NCEP CDAS. Anomalies for SST, heat content and U850/OLR are departures from the 1981-2010 base period pentad means respectively.
http://www.cpc.ncep.noaa.gov/products/precip/CWlink/daily_mjo_index/mjo_index.shtml
CPC MJO Indices

21
Evolution of Pacific NINO SST Indices
- Positive SSTA in 2012
propagated from east to
western Pacific.
- Both Cold Tongue, Warm
Pool, and ENSO-Modoki
indices were slightly
negative, consistent
with overall small SSTA
in the equatorial Pacific.
- The indices were
calculated based on
OISST. They may have
some differences
compared with those
based on ERSST.v3b.
22
North Pacific & Arctic Oceans

23
Pacific Decadal Oscillation Index
- Negative PDO phase since May 2010 has persisted for 3 years (36 months) now, and the PDO index weakened in Apr 2013 with PDO index=-0.8.
- The apparent connection between Nino3.4 and PDO indices suggest connections between tropics and extra-tropics.
- However, the negative phase of PDO during Jun-Nov 2012 seems not connected with the positive Nino3.4 SSTA.
- Pacific Decadal Oscillation is defined as the 1st EOF of monthly ERSST v3b in the North Pacific for the period 1900-1993. PDO index is the standardized projection of the monthly SST anomalies onto the 1st EOF pattern.
- The PDO index differs slightly from that of JISAO, which uses a blend of UKMET and OIv1 and OIv2 SST.

24
Last Three Month SST, SLP and 925hp Wind Anom.
- Negative phase of PDO associated SSTA persisted.
- Anomalous anti-cyclone was observed near the high-latitudes of N. Pacific in Apr 2013.

25
North America Western Coastal Upwelling
Fig. NP2. Total (top) and anomalous (bottom) upwelling indices at the 15 standard locations for the western coast of North America. Upwelling indices are derived from the vertical velocity of the NCEP's global ocean data assimilation system, and are calculated as integrated vertical volume transport at 50 meter depth from each location to its nearest coast point (m3/s/100m coastline). Anomalies are departures from the 1981-2010 base period pentad means.
- Consisted with the anomalous northerly wind, upwelling was enhanced in low latitudes and downwelling was suppressed in 48-57N.
- Area below (above) black line indicates climatological upwelling (downwelling) season.
- Climatologically upwelling season progresses from March to July along the west coast of North America from 36ºN to 57ºN.

26
Monthly Chlorophyll Anomaly
- Positive chlorophyll anomaly in 45-50N increased in Apr 2013, consistent with suppressed downwelling.
httphttp://coastwatch.pfel.noaa.gov/FAST
27
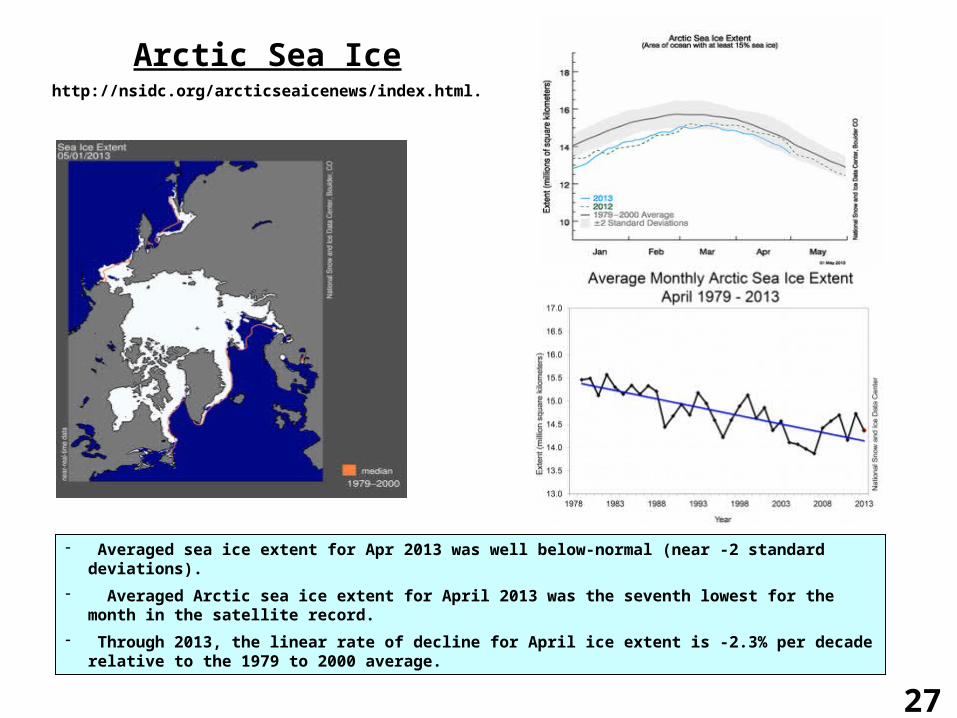
Arctic Sea Icehttp://nsidc.org/arcticseaicenews/index.html.
- Averaged sea ice extent for Apr 2013 was well below-normal (near -2 standard deviations).
- Averaged Arctic sea ice extent for April 2013 was the seventh lowest for the month in the satellite record.
- Through 2013, the linear rate of decline for April ice extent is -2.3% per decade relative to the 1979 to 2000 average.

28
Indian Ocean
29
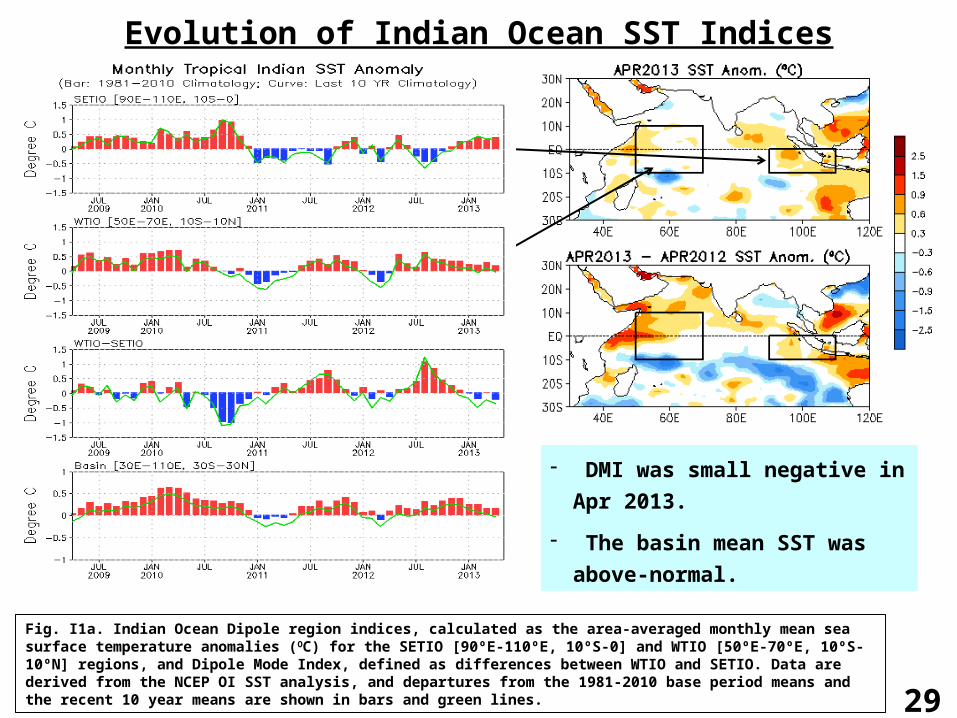
Evolution of Indian Ocean SST Indices
Fig. I1a. Indian Ocean Dipole region indices, calculated as the area-averaged monthly mean sea surface temperature anomalies (OC) for the SETIO [90ºE-110ºE, 10ºS-0] and WTIO [50ºE-70ºE, 10ºS-10ºN] regions, and Dipole Mode Index, defined as differences between WTIO and SETIO. Data are derived from the NCEP OI SST analysis, and departures from the 1981-2010 base period means and the recent 10 year means are shown in bars and green lines.
- DMI was small negative in
Apr 2013.
- The basin mean SST was
above-normal.
30
Tropical and North Atlantic Ocean

31
Evolution of Tropical Atlantic SST Indices
Fig. A1a. Tropical Atlantic Variability region indices, calculated as the area-averaged monthly mean sea surface temperature anomalies (ºC) for the TNA [60ºW-30ºW, 5ºN-20ºN], TSA [30ºW-10ºE, 20ºS-0] and ATL3 [20ºW-0, 2.5ºS-2.5ºN] regions, and Meridional Gradient Index, defined as differences between TNA and TSA. Data are derived from the NCEP OI SST analysis, and departures from the 1981-2010 base period means and the recent 10 year means are shown in bars and green lines.
- Basin-wide SST was above-normal in
Apr 2013.
- SSTA in the tropical N. Atlantic (TNA)
was positive since May 2012.
- Meridional Gradient Mode index (TNA-
TSA) was positive since May 2011.
- ATL3 SSTA was positive since Aug
2012.
32
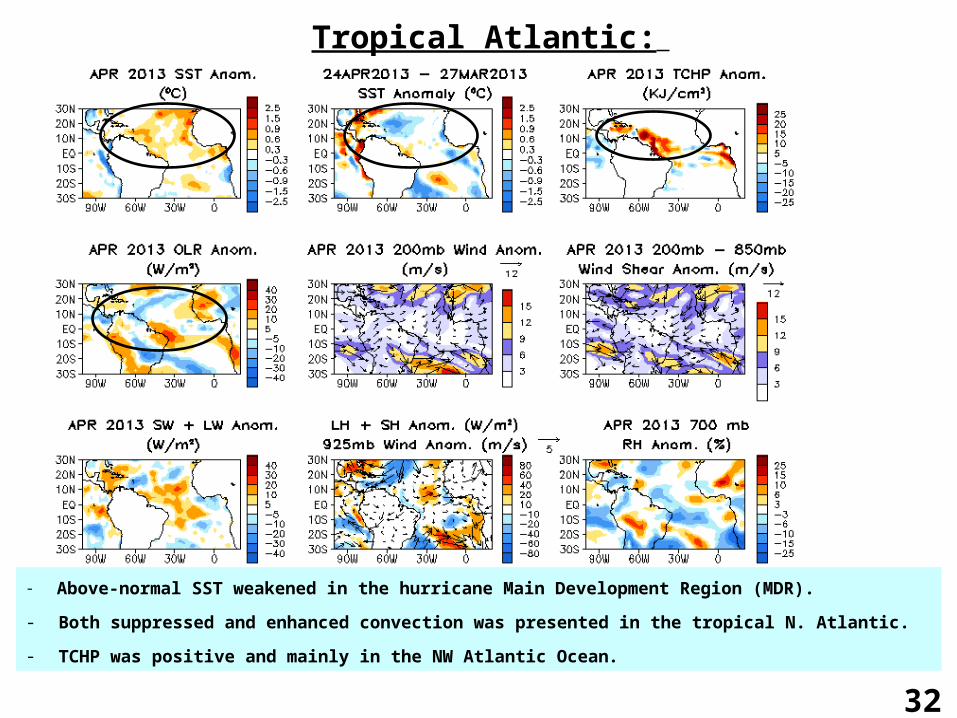
Tropical Atlantic:
- Above-normal SST weakened in the hurricane Main Development Region (MDR).
- Both suppressed and enhanced convection was presented in the tropical N. Atlantic.
- TCHP was positive and mainly in the NW Atlantic Ocean.

33
NAO and SST Anomaly in North Atlantic
Fig. NA2. Monthly standardized NAO index (top) derived from monthly standardized 500-mb height anomalies obtained from the NCEP CDAS in 20ºN-90ºN (http://www.cpc.ncep.noaa.gov). Time-Latitude section of SST anomalies averaged between 80ºW and 20ºW (bottom). SST are derived from the NCEP OI SST analysis, and anomalies are departures from the 1981-2010 base period means.
- NAO switched from negative to positive phase in Apr 2013, with NAO index = 0.6.
- High-latitude North Atlantic SSTA is generally related to NAO index (negative NAO results
in SST warming and positive NAO leads to SST cooling) (Hu et al. 2011: J. Climate, 24(22)).

34
North Atlantic: SST Anom., SST Anom. Tend., OLR,
SLP, Sfc Rad, Sfc Flx
Fig. NA1. Sea surface temperature (SST) anomalies (top-left), anomaly tendency (top-right), Outgoing Long-wave Radiation (OLR) anomalies (middle-left), sea surface pressure anomalies (middle-right), sum of net surface short- and long-wave radiation anomalies (bottom-left), sum of latent and sensible heat flux anomalies (bottom-right). SST are derived from the NCEP OI SST analysis, OLR from the NOAA 18 AVHRR IR window channel measurements by NESDIS, sea surface pressure and surface radiation and heat fluxes from the NCEP CDAS. Anomalies are departures from the 1979-1995 base period means except SST anomalies are computed with respect to the 1971-2000 base period means.
- N-S SLP gradient
in Apr 2013
reduced
significantly,
compared with
Mar 2013,
consistent with
weakening of
negative phase of
NAO.
- E-W SLP gradient
presented in Apr
2013.

35
Global SST Predictions
36
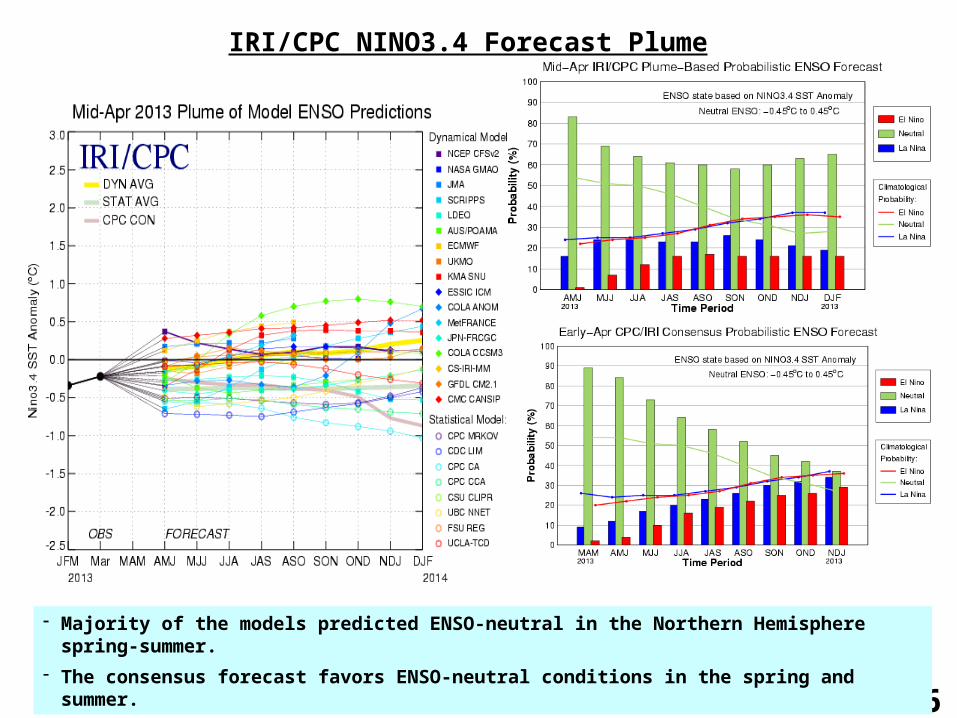
- Majority of the models predicted ENSO-neutral in the Northern Hemisphere spring-summer.
- The consensus forecast favors ENSO-neutral conditions in the spring and summer.
IRI/CPC NINO3.4 Forecast Plume

37
NCEP CFSv2 NINO3.4 Forecast
- The Nino3.4 predictions of CFSv2 shifted from positive SSTA in summer-autumn with IC in Feb 2013 to negative with IC in Mar 2013, then near normal with IC in Apr 2013, may imply the impact of short-term fluctuation and challenge of ENSO prediction with IC in spring.
(Wang, W., M. Chen, A. Kumar, and Y. Xue, 2011: How important is intraseasonal surface wind variability to real-time ENSO prediction? Geophys. Res. Lett., 38, L13705. DOI: 10.1029/2011GL047684.)

38
Individual Models: divided results JMA: Nino3, IC=Apr2013
Australia: Nino3.4, IC=02May2013 UKMO: Nino3.4, IC=16Apr2013
ECMWF: Nino3, IC=01Apr2013

39
NCEP CFSv2 Pacific Decadal Oscillation (PDO) Forecast
PDO is the first EOF of monthly ERSSTv3b anomaly in the region of [110oE-100oW, 20oN-60oN].
CFS PDO index is the standardized projection of CFS SST forecast anomalies onto the PDO EOF pattern.
- Latest CFSv2 prediction suggests negative phase of PDO will persist through the coming summer and autumn.

40
NCEP CFSv2 Tropical North Atlantic SST Forecast
- Latest CFSv2 prediction suggests that above-normal SST in the tropical N. Atlantic will continue in spring-autumn 2013 (hurricane season).

41
Backup Slides
http://www.cpc.ncep.noaa.gov/products/GODAS/
42
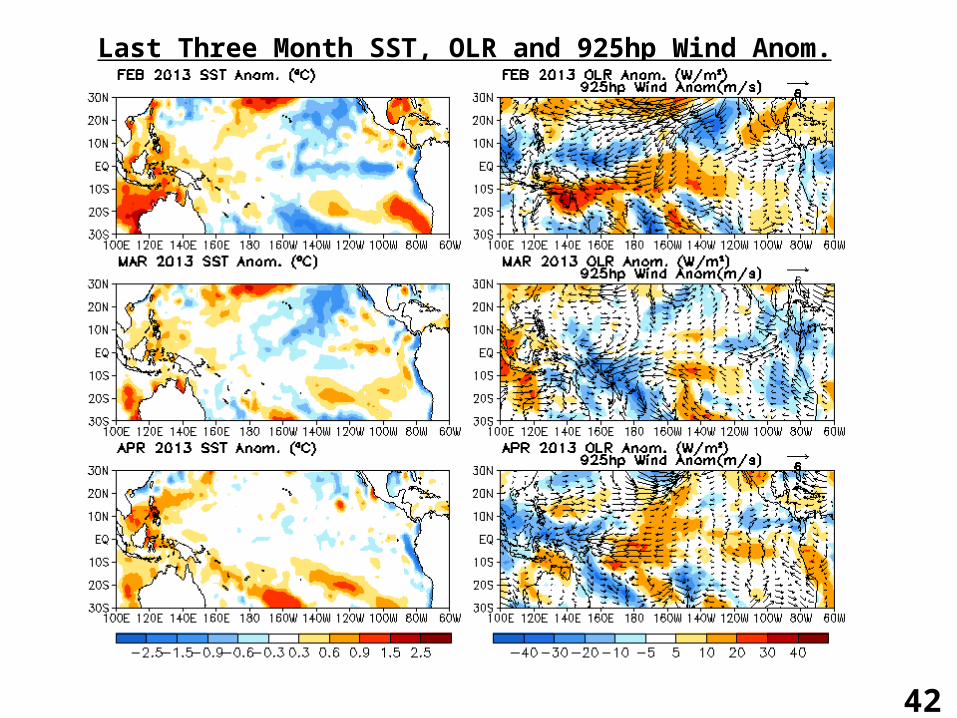
Last Three Month SST, OLR and 925hp Wind Anom.

43
Possible Impact of TAO Data Missing on NCEP Data Assimilations
(CFSR and GODAS; 1981-2010 Climatology) at (0, 95W)
44
Possible Impact of TAO Data Missing on NCEP Data Assimilations
(CFSR and GODAS; 1981-2010 Climatology) (0, 110W)

45
Equatorial subsurface ocean temperature monitoring: Right now, in recharge phase; recharge/discharge were weak in last 2 years.
Projection of OTA onto EOF1 and EOF2 (2S-2N, 0-459m, 1979-2010)EOF1: Tilt mode (ENSO peak phase);EOF2: WWV mode, Recharge/discharge oscillation (ENSO transition phase).
Recharge process: heat transport from outside of equator to equator :Negative -> positive phase of ENSO
Discharge process: heat transport from equator to outside of equator: Positive -> Negative phase of ENSO
For details, see:Kumar, A. and Z.-Z. Hu, 2013: Interannual and interdecadal variability of ocean temperature along the equatorial Pacific in conjunction with ENSO. Clim. Dyn. DOI: 10.1007/s00382-013-1721-0 (published online).
46
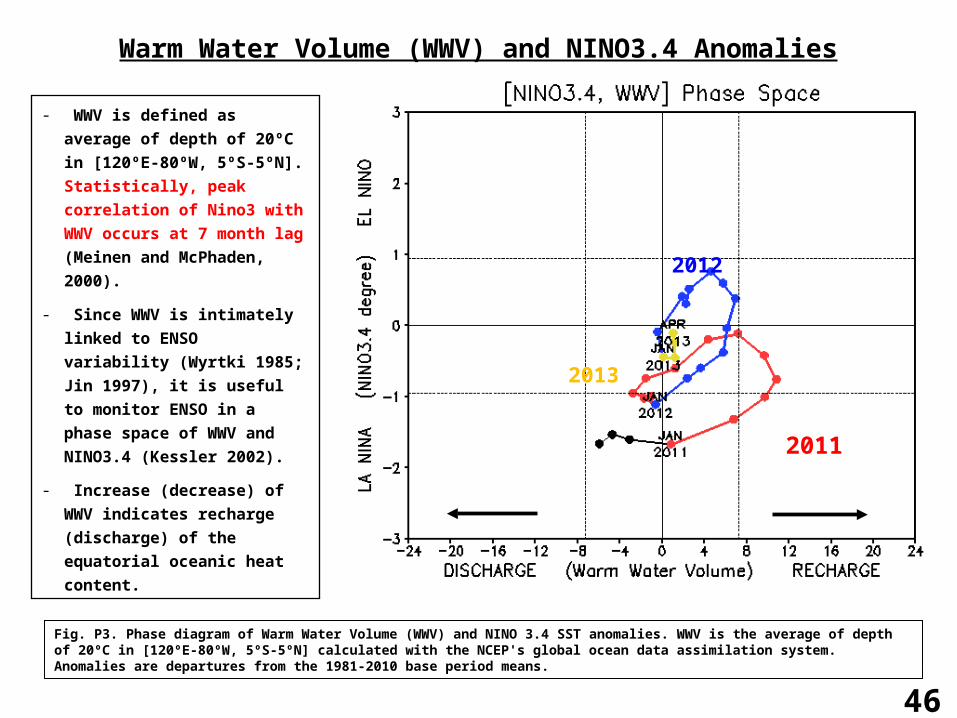
Warm Water Volume (WWV) and NINO3.4 Anomalies
Fig. P3. Phase diagram of Warm Water Volume (WWV) and NINO 3.4 SST anomalies. WWV is the average of depth of 20ºC in [120ºE-80ºW, 5ºS-5ºN] calculated with the NCEP's global ocean data assimilation system. Anomalies are departures from the 1981-2010 base period means.
- WWV is defined as average of
depth of 20ºC in [120ºE-80ºW, 5ºS-
5ºN]. Statistically, peak correlation
of Nino3 with WWV occurs at 7
month lag (Meinen and McPhaden,
2000).
- Since WWV is intimately linked to
ENSO variability (Wyrtki 1985; Jin
1997), it is useful to monitor ENSO
in a phase space of WWV and
NINO3.4 (Kessler 2002).
- Increase (decrease) of WWV
indicates recharge (discharge) of
the equatorial oceanic heat content.
2012
2011
2013
47
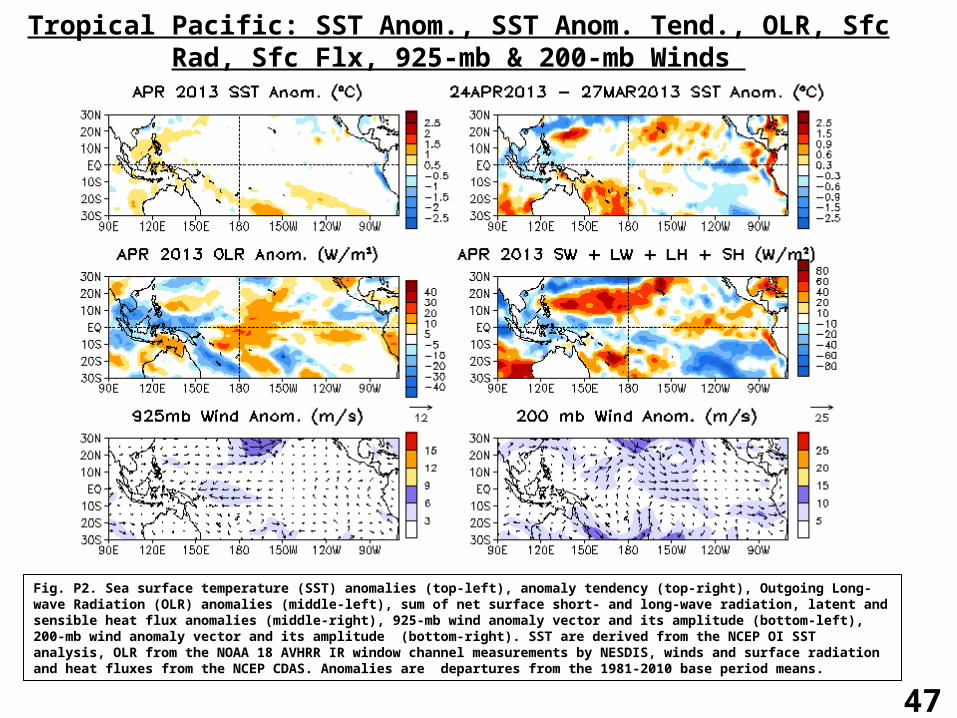
Tropical Pacific: SST Anom., SST Anom. Tend., OLR, Sfc Rad, Sfc Flx, 925-mb & 200-mb Winds
Fig. P2. Sea surface temperature (SST) anomalies (top-left), anomaly tendency (top-right), Outgoing Long-wave Radiation (OLR) anomalies (middle-left), sum of net surface short- and long-wave radiation, latent and sensible heat flux anomalies (middle-right), 925-mb wind anomaly vector and its amplitude (bottom-left), 200-mb wind anomaly vector and its amplitude (bottom-right). SST are derived from the NCEP OI SST analysis, OLR from the NOAA 18 AVHRR IR window channel measurements by NESDIS, winds and surface radiation and heat fluxes from the NCEP CDAS. Anomalies are departures from the 1981-2010 base period means.

48
North Pacific & Arctic Ocean: SST Anom., SST Anom. Tendency, OLR, SLP, Sfc Rad, Sfc Flx
Fig. NP1. Sea surface temperature (SST) anomalies (top-left), anomaly tendency (top-right), Outgoing Long-wave Radiation (OLR) anomalies (middle-left), sea surface pressure anomalies (middle-right), sum of net surface short- and long-wave radiation anomalies (bottom-left), sum of latent and sensible heat flux anomalies (bottom-right). SST are derived from the NCEP OI SST analysis, OLR from the NOAA 18 AVHRR IR window channel measurements by NESDIS, sea surface pressure and surface radiation and heat fluxes from the NCEP CDAS. Anomalies are departures from the 1981-2010 base period means.
49
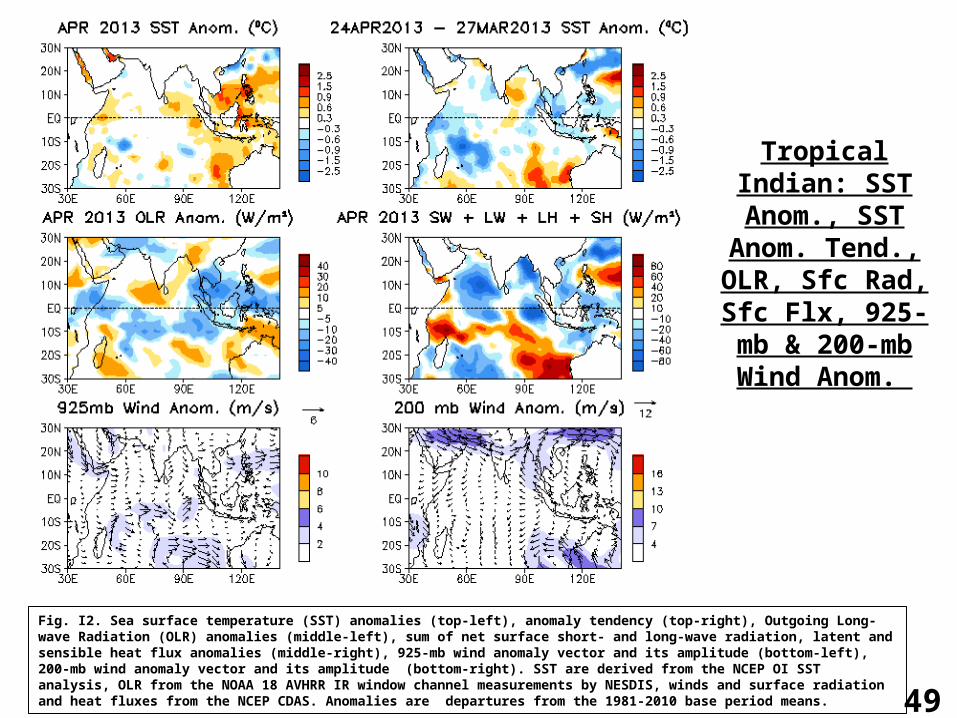
Tropical Indian: SST Anom., SST
Anom. Tend., OLR, Sfc Rad,
Sfc Flx, 925-mb & 200-mb Wind
Anom.
Fig. I2. Sea surface temperature (SST) anomalies (top-left), anomaly tendency (top-right), Outgoing Long-wave Radiation (OLR) anomalies (middle-left), sum of net surface short- and long-wave radiation, latent and sensible heat flux anomalies (middle-right), 925-mb wind anomaly vector and its amplitude (bottom-left), 200-mb wind anomaly vector and its amplitude (bottom-right). SST are derived from the NCEP OI SST analysis, OLR from the NOAA 18 AVHRR IR window channel measurements by NESDIS, winds and surface radiation and heat fluxes from the NCEP CDAS. Anomalies are departures from the 1981-2010 base period means.

50
51
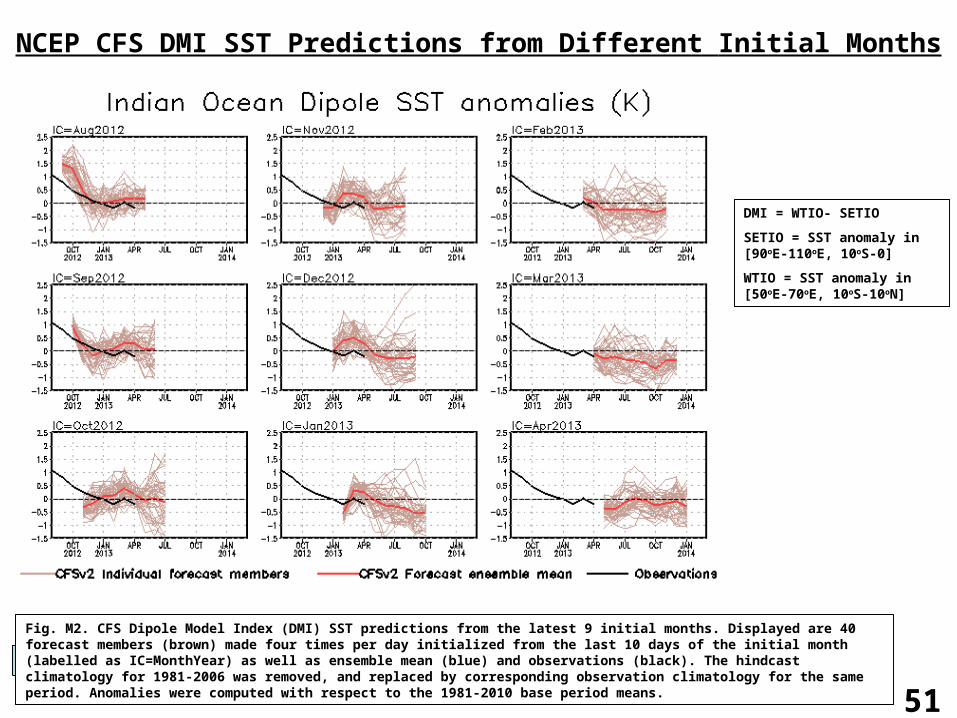
NCEP CFS DMI SST Predictions from Different Initial Months
DMI = WTIO- SETIO
SETIO = SST anomaly in [90oE-110oE, 10oS-0]
WTIO = SST anomaly in [50oE-70oE, 10oS-10oN]
Fig. M2. CFS Dipole Model Index (DMI) SST predictions from the latest 9 initial months. Displayed are 40 forecast members (brown) made four times per day initialized from the last 10 days of the initial month (labelled as IC=MonthYear) as well as ensemble mean (blue) and observations (black). The hindcast climatology for 1981-2006 was removed, and replaced by corresponding observation climatology for the same period. Anomalies were computed with respect to the 1981-2010 base period means.

52
Atlantic Hurricane Activity in 1958, 1998, 2005, 2010
<Hu, Z.-Z., A. Kumar, B. Huang, Y. Xue, W. Wang, and B. Jha, 2011: Persistent atmospheric and oceanic
anomalies in the North Atlantic from Summer 2009 to Summer 2010. J. Climate, 24(22), 5812-5830.>
52
1958 1998
2005
The 4 years that had a similar juxtaposition of a warm ENSO (decay phase) and negative phase of the NAO, i.e., 1958, 1998, 2005, and 2010 had above normal Atlantic hurricane seasons.
The Atlantic Accumulated Cyclone Energy (ACE) index value in the North Atlantic (http://en.wikipedia.org/wiki/Accumulated_cyclone_energy) is 121 in 1958, 182 in 1998, 248 in 2005, and 165 in 2010.
For 1950-2009, the mean of ACE is 101 and the median is 88.0.2010

53
Switch to 1981-2010 Climatology
• SST from 1971-2000 to 1981-2010
Weekly OISST.v2, monthly ERSST.3b
• Atmospheric fields from 1979-1995 to 1981-2010
NCEP CDAS winds, sea level pressure, 200mb velocity potential, surface shortwave and longwave radiation, surface latent and sensible fluxes, relative humidity
Outgoing Long-wave Radiation
• Oceanic fields from 1982-2004 to 1981-2010
GODAS temperature, heat content, depth of 20oC, sea surface height, mixed layer depth, tropical cyclone heat potential, surface currents, upwelling
• Satellite data climatology 1993-2005 unchanged
Aviso Altimetry Sea Surface Height
Ocean Surface Current Analyses – Realtime (OSCAR)

54
- The seasonal mean SST in February-April (FMA) increased by more than 0.2oC over much of the Tropical Oceans and N. Atlantic, but decreased by more than 0.2oC in high-latitude N. Pacific, Gulf of Mexico and along the east coast of U.S.
- Compared to FMA, the seasonal mean SST in August-October (ASO) has a stronger warming in the tropical N. Atlantic, N. Pacific and Arctic Ocean, and a weaker cooling in Gulf of Mexico and along the east coast of U.S.
1971-2000 SST Climatology (Xue et al. 2003): http://www.cpc.ncep.noaa.gov/products/predictions/30day/SSTs/sst_clim.htm
1981-2010 SST Climatology: http://origin.cpc.ncep.noaa.gov/products/people/yxue/sstclim/
Be aware that new climatology (1981-2010) was applied since Jan 2011
55
Data Sources and References
• Optimal Interpolation SST (OI SST) version 2 (Reynolds et al. 2002)
• NCEP CDAS winds, surface radiation and heat fluxes
• NESDIS Outgoing Long-wave Radiation
• NDBC TAO data (http://tao.noaa.gov)
• PMEL TAO equatorial temperature analysis
• NCEP’s Global Ocean Data Assimilation System temperature, heat content, currents (Behringer and Xue 2004)
• Aviso Altimetry Sea Surface Height
• Ocean Surface Current Analyses – Realtime (OSCAR)
Please send your comments and suggestions to [email protected]. Thanks!