global monitoring report 2005
DESCRIPTION
Millennium Development Goals: From Consensus to MomentumTRANSCRIPT

GLOBALMONITORING REPORT 2005
Millennium Development Goals:From Consensus to Momentum

GLOBALMONITORING REPORT 2005


GLOBALMONITORING REPORT 2005
Millennium Development Goals:From Consensus to Momentum

© 2005 The International Bank for Reconstruction and Development / The World Bank1818 H Street NWWashington DC 20433Telephone: 202-473-1000Internet: www.worldbank.orgE-mail: [email protected]
Cover design: Richard Fletcher, Fletcher Design, Washington, D.C.Cover photo credits: Top left, Getty Images, Eric Wheater. Top right, World BankPhoto Library, Dominic Sansoni. Bottom left, World Bank Photo Library. Bottom right, World Bank Photo Library, by Sebastian Szyd.Typesetter: Precision Graphics, Champaign, Illinois.
All rights reserved
1 2 3 4 09 08 07 06
This volume is a product of the staff of the World Bank and the International Monetary Fund. Thefindings, interpretations, and conclusions expressed herein do not necessarily reflect the views of theBoard of Executive Directors of the World Bank, the Board of Executive Directors of the InternationalMonetary Fund, or the governments they represent.
The World Bank and the International Monetary Fund do not guarantee the accuracy of the dataincluded in this work. The boundaries, colors, denominations, and other information shown on anymap in this work do not imply any judgment on the part of the World Bank or the InternationalMonetary Fund concerning the legal status of any territory or the endorsement or acceptance of suchboundaries.
Rights and PermissionsThe material in this publication is copyrighted. Copying and/or transmitting portions or all of this workwithout permission may be a violation of applicable law. The International Bank for Reconstructionand Development / The World Bank encourages dissemination of its work and will normally grant per-mission to reproduce portions of the work promptly.For permission to photocopy or reprint any part of this work, please send a request with completeinformation to the Copyright Clearance Center Inc., 222 Rosewood Drive, Danvers, MA 01923, USA;telephone: 978-750-8400; fax: 978-750-4470; Internet: www.copyright.com.All other queries on rights and licenses, including subsidiary rights, should be addressed to the Office ofthe Publisher, The World Bank, 1818 H Street NW, Washington, DC 20433, USA; fax: 202-522-2422;e-mail: [email protected].
ISBN 0-8213-6077-9

G L O B A L M O N I T O R I N G R E P O R T 2 0 0 5 v
Foreword . . . . . . . . . . . . . . . . . . . . . . . . . . . . . . . . . . . . . . . . . . . . . . . . . . . . . . . xi
Acknowledgments . . . . . . . . . . . . . . . . . . . . . . . . . . . . . . . . . . . . . . . . . . . . . . . xiii
Abbreviations and Acronyms . . . . . . . . . . . . . . . . . . . . . . . . . . . . . . . . . . . . . . . xv
Executive Summary. . . . . . . . . . . . . . . . . . . . . . . . . . . . . . . . . . . . . . . . . . . . . . xvii
Millennium Development Goals (MDGs) . . . . . . . . . . . . . . . . . . . . . . . . . . . . . xxii
1 Overview: Building Momentum toward the Millennium Development Goals . . . . . . . . . . . . . . . . . . . . . . . . . . . . . . . . 1
2 Spurring and Sustaining Economic Growth . . . . . . . . . . . . . . . . . . . . . . . 17
3 Scaling Up Service Delivery . . . . . . . . . . . . . . . . . . . . . . . . . . . . . . . . . . . 67
4 Realizing the Development Promise of Trade . . . . . . . . . . . . . . . . . . . . . 117
5 Increasing Aid and Its Effectiveness . . . . . . . . . . . . . . . . . . . . . . . . . . . . 151
6 Strengthening and Sharpening Support from International Financial Institutions . . . . . . . . . . . . . . . . . . . . . . . . . . . . . . . . . . . . . . . 189
References . . . . . . . . . . . . . . . . . . . . . . . . . . . . . . . . . . . . . . . . . . . . . . . . . . . . . 239
BoxesMillennium Development Goals . . . . . . . . . . . . . . . . . . . . . . . . . . . . . . . . xxii
1.1 A five-point agenda for accelerating progress toward the MDGs . . . . . . . . . 32.1 Growth is central to sustained poverty reduction . . . . . . . . . . . . . . . . . . . . 182.2 South Asia shows that stronger growth and better service delivery
are key to the MDGs . . . . . . . . . . . . . . . . . . . . . . . . . . . . . . . . . . . . . . . . . 242.3 Do poverty traps account for Africa’s underdevelopment? . . . . . . . . . . . . . 282.4 A gush of oil rents and surge in public investment
do not ensure sustained growth . . . . . . . . . . . . . . . . . . . . . . . . . . . . . . . . . 302.5 Political commitment is central to breaking the conflict cycle . . . . . . . . . . . 31
Contents

C O N T E N T S
vi G L O B A L M O N I T O R I N G R E P O R T 2 0 0 5
2.6 Better macroeconomic policies and stronger institutions are associated with longer growth accelerations . . . . . . . . . . . . . . . . . . . . . 34
2.7 Challenges for fiscal policy in oil-producing Sub-Saharan countries . . . . . . 372.8 Fiscal transparency has improved in Africa, but much remains to be done. . . . 392.9 Strengthening expenditure monitoring under the enhanced HIPC Initiative . . . 422.10 Comparing business regulations in two resource-dependent economies:
Angola and Botswana. . . . . . . . . . . . . . . . . . . . . . . . . . . . . . . . . . . . . . . . . 482.11 High returns to investment climate improvements in Uganda. . . . . . . . . . . 502.12 How does governance affect per capita incomes in Africa, and vice versa? . . . 572.13 The Economic Commission for Africa’s governance indicators and agenda . . 593.1 Sub-Saharan Africa shows that fast progress is possible
in closing the gender gap . . . . . . . . . . . . . . . . . . . . . . . . . . . . . . . . . . . . . . 703.2 Reducing child mortality in Mozambique. . . . . . . . . . . . . . . . . . . . . . . . . . 733.3 Improving sanitation in India’s slums . . . . . . . . . . . . . . . . . . . . . . . . . . . . 773.4 Attracting doctors to rural areas in Thailand . . . . . . . . . . . . . . . . . . . . . . . 883.5 IMF programs and MDG progress . . . . . . . . . . . . . . . . . . . . . . . . . . . . . . . 983.6 Scaling up service delivery in low-income countries
under stress (LICUS). . . . . . . . . . . . . . . . . . . . . . . . . . . . . . . . . . . . . . . . . 1013.7 Rewarding schools for MDG outcomes . . . . . . . . . . . . . . . . . . . . . . . . . . 1084.1 The varying effects of the Agreement on Textiles and Clothing . . . . . . . . 1244.2 Why has rapid export growth failed to significantly reduce poverty
in Madagascar? . . . . . . . . . . . . . . . . . . . . . . . . . . . . . . . . . . . . . . . . . . . . 1394.3 Many of the rents created by trade preferences accrue to importers . . . . . 1415.1 The U.S. Millennium Challenge Account—poised to deliver . . . . . . . . . . 1555.2 Estimates of MDG financing needs vary widely, but all point
to the need for a major increase . . . . . . . . . . . . . . . . . . . . . . . . . . . . . . . . 1625.3 Addressing absorptive capacity in Ethiopia . . . . . . . . . . . . . . . . . . . . . . . 1645.4 Scaling up development efforts . . . . . . . . . . . . . . . . . . . . . . . . . . . . . . . . . 1685.5 Alignment and harmonization: country examples show
a wide variety of approaches . . . . . . . . . . . . . . . . . . . . . . . . . . . . . . . . . . 1755.6 Mozambique’s performance assessment framework—for donors . . . . . . . 1765.7 Proposals for additional debt relief—moving beyond HIPC . . . . . . . . . . 1846.1 Profile of the “Big 5” multilateral development banks . . . . . . . . . . . . . . . 1916.2 Independent evaluation of the World Bank’s role in poverty
reduction strategies . . . . . . . . . . . . . . . . . . . . . . . . . . . . . . . . . . . . . . . . . 1946.3 Grant financing in the African and Asian Development Funds
and IDA . . . . . . . . . . . . . . . . . . . . . . . . . . . . . . . . . . . . . . . . . . . . . . . . . 2006.4 IDA’s strategy in Sub-Saharan Africa . . . . . . . . . . . . . . . . . . . . . . . . . . . . 2096.5 Cambodia’s country strategies—coordinating efforts
among multiple donors . . . . . . . . . . . . . . . . . . . . . . . . . . . . . . . . . . . . . . 2136.6 Malawi’s sectorwide—and multisectoral—approach to HIV/AIDS . . . . . 2146.7 Multilateral development banks’ support to build Colombia’s
culture of evaluation . . . . . . . . . . . . . . . . . . . . . . . . . . . . . . . . . . . . . . . . 2186.8 IDA13’s Results Measurement System—comparing targets and results . . 222

6.9 Indicators introduced under IDA14’s Results Measurement System . . . . 2236.10 IMF activities in Sub-Saharan Africa . . . . . . . . . . . . . . . . . . . . . . . . . . . . 2266.11 Recent evaluations by the IMF’s Independent Evaluation Office . . . . . . . 2286.12 Key elements of the IMF’s role in low-income countries . . . . . . . . . . . . . 230
Figures1.1 Country focus and leadership are key to coherent and effective
implementation of the MDG agenda . . . . . . . . . . . . . . . . . . . . . . . . . . . . . . 42.1 Growth prospects are promising, but wide regional disparities remain. . . . 212.2 Most regions will reach the poverty MDG by 2015,
but Sub-Saharan Africa is seriously off track . . . . . . . . . . . . . . . . . . . . . . . 232.3 Sub-Saharan Africa has lagged behind other regions . . . . . . . . . . . . . . . . . 252.4 And the gap in income levels is widening . . . . . . . . . . . . . . . . . . . . . . . . . . 252.5 Lower investment rates in Sub-Saharan Africa
have been a source of low growth . . . . . . . . . . . . . . . . . . . . . . . . . . . . . . . 262.6 Sub-Saharan Africa has suffered from many conflicts . . . . . . . . . . . . . . . . . 312.7 Annual growth rates during accelerations are improving
in Sub-Saharan Africa. . . . . . . . . . . . . . . . . . . . . . . . . . . . . . . . . . . . . . . . . 332.8 There is scope for allocating more to priority sectors such as health. . . . . . 382.9 Sub-Saharan firms view taxes, finance, electricity, and corruption
as particularly constraining . . . . . . . . . . . . . . . . . . . . . . . . . . . . . . . . . . . . 432.10 Sub-Saharan Africa lags other regions in the quality
of the business environment . . . . . . . . . . . . . . . . . . . . . . . . . . . . . . . . . . . . 452.11 The cost of starting a business varies widely. . . . . . . . . . . . . . . . . . . . . . . . 462.12 A weak investment climate entails high costs . . . . . . . . . . . . . . . . . . . . . . . 502.13 Business environment reforms need to be scaled up
in Sub-Saharan Africa. . . . . . . . . . . . . . . . . . . . . . . . . . . . . . . . . . . . . . . . . 512.14 Registering property is unduly time-consuming in Malawi . . . . . . . . . . . . . 512.15 Financial depth is lowest among low-income Sub-Saharan countries . . . . . 522.16 The cost of borrowing is higher in Sub-Saharan Africa. . . . . . . . . . . . . . . . 532.17 Weak access to infrastructure is a major constraint
in Sub-Saharan Africa and South Asia . . . . . . . . . . . . . . . . . . . . . . . . . . . . 542.18 Infrastructure spending fails to meet needs, particularly
in Sub-Saharan Africa. . . . . . . . . . . . . . . . . . . . . . . . . . . . . . . . . . . . . . . . . 552.19 Private participation in infrastructure remains low in most
Sub-Saharan countries, and has recently fallen . . . . . . . . . . . . . . . . . . . . . 552.20 Participatory processes are improving in developing countries,
but most rapidly in Africa . . . . . . . . . . . . . . . . . . . . . . . . . . . . . . . . . . . . . 58Stronger performance on political representation; weaker performance on public sector management and institutional effectiveness . . . . . . . . . . . 60
3.1 Despite progress, the 2005 gender target will not be met . . . . . . . . . . . . . . 683.2 Several regions are off track to achieve to universal
primary completion by 2015 . . . . . . . . . . . . . . . . . . . . . . . . . . . . . . . . . . . 713.3 Despite progress on child mortality, all regions are off track . . . . . . . . . . . 72
C O N T E N T S
G L O B A L M O N I T O R I N G R E P O R T 2 0 0 5 vii

C O N T E N T S
viii G L O B A L M O N I T O R I N G R E P O R T 2 0 0 5
3.4 Since 1990 the number of people living with HIV/AIDS has quadrupled. . . . . . . . . . . . . . . . . . . . . . . . . . . . . . . . . . . . . . . . . . . . . . . . . 74
3.5 Progress is being made in water supply, especially in South Asia . . . but sanitation progress is slower. . . . . . . . . . . . . . . . . . . . . . . . . . . . . . . . . 76
3.6 Progress on health does not always benefit poor people . . . . . . . . . . . . . . . 783.7 Progress on education is generally more equitable . . . . . . . . . . . . . . . . . . . 783.8 Health service coverage increases with the number of providers. . . . . . . . . 793.9 Provider presence is also associated with better health outcomes . . . . . . . . 803.10 Projected primary teacher needs are large in Sub-Saharan Africa . . . . . . . . 813.11 Projected primary teacher needs far exceed training capacity
in many African countries . . . . . . . . . . . . . . . . . . . . . . . . . . . . . . . . . . . . . 823.12 Low-income countries are spending more on health and education . . . . . . 893.13 Budget shares for health and education have increased in many regions. . . 903.14 Seventy percent of bilateral education aid is reported to be technical
assistance . . . . . . . . . . . . . . . . . . . . . . . . . . . . . . . . . . . . . . . . . . . . . . . . . . 933.15 Donor commitments can oscillate substantially . . . . . . . . . . . . . . . . . . . . . 943.16 Total ODA for health and education is increasing . . . . . . . . . . . . . . . . . . . 963.17 Higher spending on education and health do not always mean
better outcomes. . . . . . . . . . . . . . . . . . . . . . . . . . . . . . . . . . . . . . . . . . . . . 1013.18 Leakage of funds can be high but is not inevitable . . . . . . . . . . . . . . . . . . 1053.19 Absence rates can be very high, especially in health . . . . . . . . . . . . . . . . . 1074.1 LDC Exports: Less food and raw materials, more energy
and apparel . . . . . . . . . . . . . . . . . . . . . . . . . . . . . . . . . . . . . . . . . . . . . . . 1204.2 Nontariff measures are more important in rich countries . . . . . . . . . . . . 1264.3 Trade restrictiveness at home and abroad falls as countries
become richer . . . . . . . . . . . . . . . . . . . . . . . . . . . . . . . . . . . . . . . . . . . . . . 1264.4 Trade restrictiveness at home and abroad rises with poverty headcount . . . 1274.5 Agricultural protection is high in OECD countries,
and border barriers account for most of it . . . . . . . . . . . . . . . . . . . . . . . . 1284.6 OECD trade restrictiveness remains high for developing countries . . . . . . 1304.7 A low ambition round vs. deep WTO reforms . . . . . . . . . . . . . . . . . . . . . 1354.8 WTO Market access commitments for services by mode of supply. . . . . . 1364.9 Foreign direct investment and cross-border exchange account
for most trade in services . . . . . . . . . . . . . . . . . . . . . . . . . . . . . . . . . . . . . 1374.10 Distribution of ODA for trade-related activities and infrastructure
by region and main category . . . . . . . . . . . . . . . . . . . . . . . . . . . . . . . . . . 1434.11 Bank trade-related lending . . . . . . . . . . . . . . . . . . . . . . . . . . . . . . . . . . . . 1445.1 ODA is rising but is well short of what is needed; donors need to raise
their post-Monterrey commitments and extend them beyond 2006 . . . . . 1545.2 Wide variation in donor effort . . . . . . . . . . . . . . . . . . . . . . . . . . . . . . . . . 1555.3 Debt relief and technical assistance dominate the increase in ODA . . . . . 1565.4 Dependence on aid varies by region and is highest in Sub-Saharan
Africa . . . . . . . . . . . . . . . . . . . . . . . . . . . . . . . . . . . . . . . . . . . . . . . . . . . . 1585.5 Sub-Saharan Africa’s largest donors . . . . . . . . . . . . . . . . . . . . . . . . . . . . . 158

C O N T E N T S
G L O B A L M O N I T O R I N G R E P O R T 2 0 0 5 ix
5.6 Official flows are the main source of external finance for Sub-Saharan Africa, twice as large as FDI and nearly four times as large as remittances. . . . . . . . . . . . . . . . . . . . . . . . . . . . . . . . . . . . . . . . . . . . . . 159Projected income poverty in Ethiopia, 2003–15 (Headcount index) . . . . . 164
5.7 Higher development assistance is increasingly supporting and catalyzingmore spending in priority areas . . . . . . . . . . . . . . . . . . . . . . . . . . . . . . . . 167
5.8 In low-income countries donors allocate more aid to better performers; more generous donors also tend to be more selective. . . . . . . 170
5.9 Difficult partnership countries receive less aid than predicted by their policy/institutional quality and poverty levels . . . . . . . . . . . . . . . 171
5.10 Aid fragmentation is high, especially in Sub-Saharan Africa . . . . . . . . . . . 1725.11 Progress on alignment, harmonization, and predictability
of aid needs to be accelerated . . . . . . . . . . . . . . . . . . . . . . . . . . . . . . . . . . 1776.1 Financial flows from the Big 5 multilateral development banks,
IMF, and private sources . . . . . . . . . . . . . . . . . . . . . . . . . . . . . . . . . . . . . 190Differences in the Big 5 client bases . . . . . . . . . . . . . . . . . . . . . . . . . . . . . 191Average incomes of Big 5 client countries . . . . . . . . . . . . . . . . . . . . . . . . . 191Small states in the Big 5 . . . . . . . . . . . . . . . . . . . . . . . . . . . . . . . . . . . . . . 192Borrower shares in Big 5 ownership . . . . . . . . . . . . . . . . . . . . . . . . . . . . . 192Big 5 decentralization. . . . . . . . . . . . . . . . . . . . . . . . . . . . . . . . . . . . . . . . . 192
6.2 Trends in lending and grant commitments by multilateral development banks. . . . . . . . . . . . . . . . . . . . . . . . . . . . . . . . . . . . . . . . . . 197
6.3 Policy and poverty selectivity of aid from multilateral development banks, 2003. . . . . . . . . . . . . . . . . . . . . . . . . . . . . . . . . . . . . 201
6.4 Big 5 multilateral development banks: sectoral distribution of lending, 1999–2004 . . . . . . . . . . . . . . . . . . . . . . . . . . . . . . . . . . . . . . . 206
6.5 DFID Scorecard for multilateral development banks . . . . . . . . . . . . . . . . 221
Tables2.1 Over the next 10 years growth is expected to rise and poverty fall
around the world . . . . . . . . . . . . . . . . . . . . . . . . . . . . . . . . . . . . . . . . . . . . 222.2 Many Sub-Saharan countries require rapid growth
to achieve the income poverty MDG . . . . . . . . . . . . . . . . . . . . . . . . . . . . . 232.3 Macroeconomic policies are weaker in Sub-Saharan Africa
than in other low-income countries . . . . . . . . . . . . . . . . . . . . . . . . . . . . . . 272.4 Growth accelerations have been much less common
in Sub-Saharan Africa. . . . . . . . . . . . . . . . . . . . . . . . . . . . . . . . . . . . . . . . . 322.5 Macroeconomic indicators have generally improved
in low-income countries . . . . . . . . . . . . . . . . . . . . . . . . . . . . . . . . . . . . . . . 36Many HIPCs need to substantially upgrade public expenditure management . . . . . . . . . . . . . . . . . . . . . . . . . . . . . . . . . . . . . 42
2.6 Investment climate constraints vary across Sub-Saharan Africa . . . . . . . . . 44Businesses face a lower regulatory burden in Botswana than Angola . . . . . 48

C O N T E N T S
x G L O B A L M O N I T O R I N G R E P O R T 2 0 0 5
3.1 Public health spending per capita has fallen in some regions . . . . . . . . . . . 913.2 Significant additional financing is needed to achieve the
health and primary education MDGs . . . . . . . . . . . . . . . . . . . . . . . . . . . . 924.1 Trade has grown rapidly in recent years, especially in developing
countries. . . . . . . . . . . . . . . . . . . . . . . . . . . . . . . . . . . . . . . . . . . . . . . . . . 1194.2 Developing countries account for a growing share of non-oil exports . . . 1194.3 Applied most favored nation tariffs are highest in South Asia
and Sub-Saharan Africa . . . . . . . . . . . . . . . . . . . . . . . . . . . . . . . . . . . . . . 1224.4 Nontariff measures remain high in several regions, 2002 . . . . . . . . . . . . . 1224.5 Developing countries initiate more antidumping investigations,
1995–2003 . . . . . . . . . . . . . . . . . . . . . . . . . . . . . . . . . . . . . . . . . . . . . . . 1234.6 A few large developing countries have launched the most antidumping
investigations, 1995–2003 . . . . . . . . . . . . . . . . . . . . . . . . . . . . . . . . . . . . 1234.7 OECD trade restrictiveness is highest toward low-income countries,
2002. . . . . . . . . . . . . . . . . . . . . . . . . . . . . . . . . . . . . . . . . . . . . . . . . . . . . 1294.8 Globally, trade restrictiveness is highest for agriculture, 2002 . . . . . . . . . 1294.9 Developing countries impose high restrictions on trade with one another,
2002. . . . . . . . . . . . . . . . . . . . . . . . . . . . . . . . . . . . . . . . . . . . . . . . . . . . . 1314.10 Key elements of the August 2004 WTO framework agreement . . . . . . . . 1324.11 Most economic welfare benefits of full merchandise trade liberalization
would come from agriculture, 2015 . . . . . . . . . . . . . . . . . . . . . . . . . . . . . 1334.12 Developing countries have made fewer market access
and national treatment commitments for services under the WTO . . . . . 137Estimates of additional ODA requirements vary widely . . . . . . . . . . . . . 162
5.1 Selectivity in aid allocation: Donors’ policy and poverty focus is improving, but bilateral donors could do more . . . . . . . . . . . . . . . . . . 169
5.2 Indicators of progress (on ownership, harmonization, alignment, and results). . . . . . . . . . . . . . . . . . . . . . . . . . . . . . . . . . . . . . . . . . . . . . . . 174
5.3 African governments are viewing donor behavior more favorably . . . . . . 1795.4 Debt service is falling and poverty-reducing spending rising
among the 27 HIPCs that have reached their decision points . . . . . . . . . . 1826.1 Country strategies of multilateral development banks . . . . . . . . . . . . . . . 1966.2 Lending instruments of multilateral development banks . . . . . . . . . . . . . 1996.3 Transparency among multilateral development banks . . . . . . . . . . . . . . . 2176.4 Managing for development results in multilateral development banks . . . 2186.5 Project monitoring, evaluation, and reporting in multilateral
development banks . . . . . . . . . . . . . . . . . . . . . . . . . . . . . . . . . . . . . . . . . 220

G L O B A L M O N I T O R I N G R E P O R T 2 0 0 5 xi
The Global Monitoring Report 2005 isthe second in a series of annual reportsassessing progress on the policy
agenda for achieving the Millennium Devel-opment Goals (MDGs) and related outcomes.It is prepared jointly by the staff of the WorldBank and the International Monetary Fund(IMF), in close collaboration with partneragencies. This report comes at an importanttime, when the international developmentcommunity is taking stock of implementationof the Millennium Declaration in the fiveyears since its adoption and discussing howprogress toward the MDGs can be acceler-ated. We hope that the analysis presented inthis report will make a useful contribution tothose efforts.
The report’s central message is clear: with-out early and tangible action to accelerateprogress, the MDGs will be seriously jeopar-dized—especially in Sub-Saharan Africa,which at current trends will fall short of allthe goals. At stake are prospects not only forhundreds of millions of people to escapepoverty, disease, and illiteracy, but also forlong-term peace and security—objectives inti-mately linked to development. During 2005the international community must seize theopportunities presented by increased globalattention on development to build momen-tum for the MDGs. Special focus must be
Foreword
given to accelerating progress in Sub-SaharanAfrica.
How to generate momentum? This reportsets out an agenda spanning the responsibili-ties of all key actors. Developing countriesmust take the lead in articulating and imple-menting development strategies that aimhigher. They should build on recent progresson reforms by deepening improvements inpolicies and governance to achieve strongereconomic growth and scale up human devel-opment and related key services. The recentpickup in growth in many developing coun-tries, including several Sub-Saharan coun-tries, demonstrates the payoff to reforms.
Developed countries must step up imple-mentation of the commitments they made aspart of the Monterrey Consensus. Theyshould substantially increase the volume ofdevelopment aid and improve its delivery tofacilitate more effective use by recipients. Andthey should show leadership on trade policyreforms that open markets to developingcountry exports and that give greater coher-ence to developed country policies in terms oftheir impact on development. Progress onboth aid and trade is crucial—and the needfor action urgent.
International financial institutions shouldstrengthen and sharpen their support for thisagenda. A priority for us is to strengthen our

F O R E W O R D
xii G L O B A L M O N I T O R I N G R E P O R T 2 0 0 5
support for country-led poverty reductionstrategies in low-income countries andsharpen our focus on development results.We also need to continue to adapt ourapproaches and instruments to the evolvingand varying needs of middle-income coun-tries. Geared to the needs of both low- andmiddle-income countries, internationalfinancial institutions should also do more
and better on global and regional publicgoods.
With just 10 years until 2015, achievingthe MDGs seems daunting, especially in Sub-Saharan Africa. But rapid progress is possibleif there is sufficient commitment to reformand support from development partners,within the framework of the enhanced globalpartnerships envisaged at Monterrey.
James D. Wolfensohn Rodrigo de RatoPresident Managing DirectorWorld Bank International Monetary Fund

G L O B A L M O N I T O R I N G R E P O R T 2 0 0 5 xiii
This report has been prepared jointlyby the staff of the World Bank and theInternational Monetary Fund. In
preparing the report, staff have collaboratedclosely with partner institutions—othermultilateral development banks, the UnitedNations, World Trade Organization, Orga-nization for Economic Cooperation andDevelopment and its Development Assis-tance Committee, and the European Com-mission. The cooperation and support ofstaff of these institutions are gratefullyacknowledged.
Zia Qureshi was the lead author and man-ager of the report. The work was carried outunder the general guidance of ShengmanZhang, Managing Director, World Bank.The core team included Barbara Bruns,Punam Chuhan, Poonam Gupta, BernardHoekman, Marcelo Olarreaga, JoanneSalop, and Lada Strelkova (World Bank) andAndrew Berg, Peter Fallon, Elliott Harris,and Carlos Leite (IMF).
A number of other staff made contribu-tions. They included the following from theWorld Bank: Dina Abu-Ghaida, OlusojiAdeyi, Christine Allison, Jorge Araujo,Gilles Bauche, Rosemary Bellew, Rene Bon-nel, Eduard Bos, Donald Bundy, PaulCollier, Edgardo Campos, Jose De Luna
Acknowledgments
Martinez, William Dorotinsky, Poul Eng-berg-Pedersen, Antonio Estache, Qiu Fang,Manuel Felix, Ariel Fiszbein, Lucia Fort,Paul Gertler, Alison Gillies, Bee Ean Gooi,Pablo Gottret, Laura Gregory, EngilbertGudmundsson, Christopher Hall, MaryHallward-Driemeier, Jonathan Halpern,Kirk Hamilton, Amy Heyman, BarbryKeller, Steve Knack, Aart Kraay, Inna Kush-narova, Ranjit Lamech, Victoria Levin,Magnus Lindelow, Susan McAdams, Car-alee McLiesh, Raymond Muhula, MohuaMukherjee, Alessandro Nicita, EustacheOuayoro, Sulekha Patel, Long Quach, Clau-dio Raddatz, Gary Reid, Viorica Revutchi,Klas Ringskog, Maria Rivero-Fuentes,George Schieber, Susan Sebastian, ShekharShah, Nicola Smithers, Ahmet Soyleme-zoglu, Abigail Spring, Mark Sundberg, EricSwanson, Marilou Uy, Dominique Van DerMensbrugghe, Linda Van Gelder, ChristelVermeersch, Marco Vujicic, Dana Weist,Jerome Wolgin, and Alan Wright.
Other contributors from the IMF includedDavid Andrews, Jean Clément, SanjeevGupta, Michael Hadjimichael, Peter Heller,Simon Johnson, Godfrey Kalinga, Ritha Khe-mani, Hans Peter Lankes, Brad McDonald,Wayne Mitchell, Catherine Pattillo, ArvindSubramanian, and Chris Wu.

A C K N O W L E D G M E N T S
xiv G L O B A L M O N I T O R I N G R E P O R T 2 0 0 5
Guidance received from the ExecutiveDirectors of the Bank and the Fund duringdiscussions of the draft report is gratefullyacknowledged. The report has also benefitedfrom many useful comments and suggestionsreceived from Bank and Fund managementand staff in the course of the preparation and
review of the report. The World Bank's Officeof the Publisher managed the editorial,design, production, and printing of the book.In particular, Susan Graham, Paul Holtz, andMonika Lynde deserve special mention fortheir skill and professionalism in editing andproducing this book on a very tight schedule.

G L O B A L M O N I T O R I N G R E P O R T 2 0 0 5 xv
Abbreviations and Acronyms
ACP African, Caribbean, and PacificACT Artemisinin combination
treatmentAfDB African Development BankAGOA African Growth and
Opportunity Acceleration ActAIDS Acquired immune deficiency
syndromeAPRM African Peer Review
MechanismADB Asian Development BankASEAN Association of South-East
Asian NationsBEEP Business Environment and
Enterprise Performance SurveyCAS Country assistance strategyCPIA Country policy and
institutional assessmentDAC Development Assistance
Committee (OECD)DANIDA Danish International
Development AgencyDFID U.K. Department for
International DevelopmentDIME Development Impact
Evaluation (World Bank)DOTS Directly observed treatment
strategy EBRD European Bank for
Reconstruction andDevelopment
ECLAC United Nations EconomicCommission for Latin America
EFA Education For AllEFF Extended Fund Facility (IMF)
EPA Economic PartnershipAgreement
EU European UnionFDI Foreign direct investmentFSAP Financial Sector Assessment
Program (IMF)FSO Fund for Special Operations
(Inter-American DevelopmentBank)
FTI Fast Track Initiative (EducationFor All)
GAO U.S. General Accounting OfficeGATS General Agreement on Trade in
ServicesGAVI Global Alliance for Vaccination
and ImmunizationGFATM Global Fund to Fight AIDS,
Tuberculosis, and MalariaGNI Gross national incomeHIPC Heavily indebted poor countryHIV Human immunodeficiency
virusIBRD International Bank for
Reconstruction andDevelopment (World Bank)
ICRG International Country RiskGuide
IDA International DevelopmentAssociation (World Bank)
IDB Inter-American DevelopmentBank
IEO Independent Evaluation Office(IMF)
IFC International FinanceCorporation (World Bank)

A B B R E V I A T I O N S A N D A C R O N Y M S
xvi G L O B A L M O N I T O R I N G R E P O R T 2 0 0 5
IFF International Finance FacilityIFFIm International Finance Facility
for ImmunizationIFI International financial
institutionIMF International Monetary FundLDC Least developed countryLICUS Low-income countries under
stressMAP Multi-country AIDS Program
(World Bank)MCA Millennium Challenge AccountMDB Multilateral development bankMDG Millennium Development GoalMFN Most favored nationMIF Multilateral Investment Fund
(Inter-American DevelopmentBank)
MIGA Multilateral InvestmentGuarantee Agency (WorldBank)
MTEF Medium-term expenditureframework
NAFTA North American Free TradeAgreement
NEPAD New Partnership for Africa’sDevelopment
NGO Nongovernmental organizationNLF New Lending Framework
(Inter-American DevelopmentBank)
ODA Official development assistanceOECD Organisation for Economic
Co-operation and DevelopmentOED Operations Evaluation
Department (World Bank)OLS Ordinary least squaresOTRI Overall trade restrictiveness
indexOVE Office of Evaluation and
Oversight (Inter-AmericanDevelopment Bank)
PAHO Pan-American HealthOrganization
PARIS21 Partnership in Statistics forDevelopment in the 21stCentury
PEFA Public Expenditure andFinancial Accountabilityprogram
PEPFAR U.S. President’s Emergency Planfor AIDS Relief
PETS Public Expenditure TrackingSurvey (World Bank)
PRGF Poverty Reduction and GrowthFacility (IMF)
PRS Poverty Reduction StrategyPRSC Poverty Reduction Support
Credit (World Bank)PRSP Poverty Reduction Strategy
PaperPSIA Poverty and Social Impact
Analysis (IMF)QAG Quality Assurance Group
(World Bank)ROSC Report on the Observance of
Standards and CodesSDR Special Drawing Right (IMF)SPA Strategic Partnership for
AfricaSWAp Sectorwide approachTRAINS Trade Analysis and Information
System (UNCTAD)UN United NationsUNAIDS Joint United Nations
Programme on HIV/AIDSUNCTAD United Nations Conference on
Trade and DevelopmentUNDP United Nations Development
ProgrammeUNECA United Nations Economic
Commission for AfricaUNESCO United Nations Educational,
Scientific, and CulturalOrganization
UNICEF United Nations Children’s FundVAT Value added taxWHO World Health OrganizationWP-EFF Working Party on Aid
Effectiveness and DonorPractices
WTO World Trade Organization

Bold actions are urgently needed if thedevelopment vision that world leaderslaid out in remarkable unison at the
turn of the century is to be realized. The Mil-lennium Development Goals (MDGs) and theMonterrey Consensus have created a power-ful global compact for development. TheMDGs set clear targets for eradicatingpoverty and related human deprivations. TheMonterrey Consensus stresses the mutualaccountability of developing and developedcountries in achieving these goals. But thecontinued credibility of this compact hingeson expediting its implementation. Nearly fiveyears have passed since the Millennium Dec-laration was adopted, and current stocktak-ing of progress during that time has focusedglobal attention on the need to scale upaction—making 2005 a crucial year to buildmomentum for the MDGs.
Without faster progress, the MDGs will beseriously jeopardized—especially in Sub-Saharan Africa, which is off track on all thegoals. At stake are prospects not only forhundreds of millions of people to escapepoverty, disease, and illiteracy, but alsoprospects for long-term global security andpeace—objectives intimately linked to devel-opment. Behind cold statistics on the MDGsare real people, and lack of progress hasimmediate and tragic consequences. Everyweek in the developing world, 200,000 chil-
dren under five die of disease and 10,000women die giving birth. In Sub-SaharanAfrica alone, 2 million people will die ofAIDS this year. And as many as 115 millionchildren in developing countries are not inschool. The need to scale up and speed upaction is thus urgent, and the opportunitiespresented by the year 2005 must be seized.
To be sure, there has been progress. Devel-oping countries have continued to improvetheir policies and governance, which has con-tributed to an encouraging acceleration in theireconomic growth. Even Sub-Saharan Africamay be turning the corner, with several coun-tries in the region showing notable progress inreforming policies and reviving growth.Developed countries have increased aid andintroduced actions to make it more effective.Some initial steps have also been taken towardtrade policy reform. But, overall, progress hasbeen slower than envisaged, uneven across pol-icy areas and countries, and far short of whatis needed to achieve the MDGs.
With just a decade to go until 2015, achiev-ing the MDGs seems daunting, especially inSub-Saharan Africa. But rapid progress is pos-sible—if there is sufficient commitment toreform and sufficient support from develop-ment partners. Better-performing developingcountries provide reasons for hope for others.Even in many lagging countries, including inSub-Saharan Africa, advances are being made
G L O B A L M O N I T O R I N G R E P O R T 2 0 0 5 xvii
Executive Summary

and the ground is being laid for better perfor-mance. What is needed is to quicken andbroaden this progress, based on the frame-work of the enhanced global partnershipenvisaged at Monterrey.
How to generate momentum and broadenprogress? Developing countries must take thelead in articulating and implementing strate-gies that aim higher—to rise above currenttrends and substantially accelerate progress.Deeper improvements are needed in policiesand governance, to expedite economic growthand scale up human development and relatedkey services. Developed countries must alsostep up implementation of their part of thedevelopment compact. They must providemore and better aid but also show leadershipon trade policy reform that would open mar-kets for developing country exports and givegreater coherence to their policies in terms oftheir impact on development.
A Five-Point AgendaTo build the momentum needed to achieve theMDGs, this report proposes a five-pointagenda of accelerated and concerted actions bydeveloping and developed countries—based onthe Monterrey framework of mutual account-ability. Within this agenda, special focus mustbe given to accelerating progress in Sub-Saha-ran Africa, the region that is furthest from thedevelopment goals but that has recentlydemonstrated a capacity for improvement ineconomic performance—capacity that must befostered through further domestic reform andstronger support from development partners.
Anchor Actions to Achieve the MDGs inCountry-Led Development Strategies
• For coherence and effectiveness, the scalingup of development efforts at the countrylevel must be guided by country-ownedand -led poverty reduction strategies(PRSs) or equivalent national developmentstrategies. Framed against a long-termdevelopment vision, these strategies should
set medium-term targets—tailored to coun-try circumstances—for progress toward theMDGs and related development outcomes.And they should define clear national plansand priorities for achieving those targets,linking policy agendas to medium-term fis-cal frameworks. Donors should use thesestrategies as the basis for aligning and har-monizing assistance.
Improve the Environment for Stronger,Private Sector–Led Economic Growth
• Promotion of economic growth must be atthe center of the strategy to achieve theMDGs. Sub-Saharan Africa needs to almostdouble its growth rate, to an annual averageof about 7 percent over the next decade.
• Progress in macroeconomic managementshould be deepened, with a focus on fiscalmanagement and the structure of publicspending—to create more fiscal space forpriority expenditures while ensuring fiscalsustainability.
• Improving the enabling climate for privateactivity—by removing regulatory andinstitutional constraints and strengtheninginfrastructure—is key. An important areaof reform in many countries is thestrengthening of property rights and therule of law, including legal and judicialreform. Countries should use theimproved diagnostics and metrics of theprivate business environment now avail-able (such as the World Bank’s Doing Busi-ness Indicators and Investment ClimateSurveys) to guide action and monitorprogress. Spending on infrastructure, forboth investment and operation and main-tenance, needs to rise in all regions butmust double in Sub-Saharan Africa—fromabout 4.7 percent of GDP in recent yearsto more than 9 percent over the nextdecade—as gaps in infrastructure are espe-cially severe in that region. Across coun-tries, the pace of the increase in investmentwill depend on institutional capacity andmacroeconomic conditions.
E X E C U T I V E S U M M A R Y
xviii G L O B A L M O N I T O R I N G R E P O R T 2 0 0 5

• Overarching this agenda is the need toimprove governance—upgrading public sec-tor management, controlling corruption—as doing so is crucial to both the privatesector’s business environment and the pub-lic sector’s development interventions. TheNew Partnership for Africa’s Developmentand its African Peer Review Mechanism arepromising African-led initiatives with afocus on strengthening institutions. Membercountries should take advantage of theimpetus they provide to develop and imple-ment national capacity building strategies,which donors should support. Developedcountries can also help curb corruption bydemanding high standards from their com-panies active in developing countries,including by giving high-level politicalendorsement to the Extractive IndustriesTransparency Initiative.
Scale Up Human Development Services
• The human development MDGs require amajor scaling up of education and healthservices—primary education, basic healthcare and control of major diseases such asHIV/AIDS, and women’s access to educa-tion and health care—and of water and san-itation infrastructure, which is closelylinked to health outcomes. Again, the short-falls are most serious, and the need to scaleup most urgent, in Sub-Saharan Africa.
• Critical to effective scaling up are: rapidlyincreasing the supply of skilled serviceproviders (health workers, teachers); pro-viding increased, flexible, and predictablefinancing for these recurrent cost-intensiveservices; and managing the service deliverychain to ensure that money produces results.
• To strengthen the Education for All FastTrack Initiative, partners should makemonitorable, public, long-term commit-ments to significant annual increases infunding for primary education. Still largeradditional resources are needed to achievethe health MDGs. It is important to ensurethat global programs organized around spe-
cific health interventions are aligned withrecipient countries’ priorities and support—rather than undermine—the coherence oftheir health sector strategies and systems.
Dismantle Barriers to Trade
• The international community must aim foran ambitious outcome to the Doha Roundthat fully realizes its development promise,including in particular a major reform ofagricultural trade policies in developedcountries. The round should be completedby 2006.
• “Aid for trade” should be scaled up sub-stantially to help poor countries addressbehind-the-border constraints to their tradecapacity, including through investments incritical trade-related infrastructure.
Substantially Increase the Level and Effectiveness of Aid
• Official development assistance (ODA)must at least double in the next five yearsto support the MDGs, particularly in low-income countries and Sub-Saharan Africa,with the pace of the increase aligned withrecipients’ absorptive capacity. To signalthat needed resources will be forthcoming,2005 is an opportune time for donors toraise their initial post-Monterrey commit-ments and extend them over a longer timehorizon—2010 or beyond. Also, explo-ration should continue on the merits andfeasibility of innovative financing mecha-nisms to complement increased aid flowsand commitments.
• Equally important is improving the qualityof aid, with faster progress on alignmentand harmonization, and delivery modali-ties that increase aid flexibility and pre-dictability. Firm implementation of theParis Declaration on Aid Effectiveness iscentral to this agenda.
• Closure should be reached in 2005 on cur-rent proposals for additional debt relief forpoor countries with heavy debt burdens
E X E C U T I V E S U M M A R Y
G L O B A L M O N I T O R I N G R E P O R T 2 0 0 5 xix

that are pursuing credible reforms. Anyadditional debt relief should not cut intothe provision of needed new financing—which for these countries should be pri-marily in the form of grants—and shouldnot undermine the financial viability ofinternational financial institutions.
Role of International Financial InstitutionsHow should international financial institu-tions—multilateral development banks andthe International Monetary Fund (IMF)—strengthen and sharpen their support for thisagenda? This report emphasizes action in fiveareas, as outlined below. In each of these areasthere has been progress, but there is a need todo more and pick up the pace. The prioritiesfor action and monitoring progress are:
• Support the deepening of the PRS frame-work in low-income countries, and theoperationalization of the MDGs and align-ment of assistance within that framework.For low-income countries under stress,support to building institutional capacitiesis especially important.
• Continue to adapt approaches and instru-ments to better respond to the evolvingand differentiated needs of middle-income
countries, including further streamliningof conditionality and investment lending.
• Ensure that the implications of dismantlingtrade barriers and increasing the scale andeffectiveness of aid are adequately reflectedin support for country capacity building, sothat emerging opportunities can be fully uti-lized. International financial institutionsshould sharpen the strategic focus andimprove the effectiveness of their support forglobal and regional public goods.
• Strengthen partnerships and harmonizefurther by improving transparency, reduc-ing red tape and enhancing the flexibility ofassistance (through simplification and useof sectorwide approaches), and promotingthe development and use of country sys-tems—for procurement, financial manage-ment, and environmental assessment.
• Strengthen the focus on results and account-ability by supporting country efforts to man-age for development results—strengtheningpublic sector management and developmentstatistics—and furthering progress withininternational financial institutions in enhanc-ing the results orientation of their countrystrategies and quality assurance processes.Adopt a common framework for self-evalu-ation of multilateral development banks’performance and results measurement, andadapt to IMF operations as much as possible.
E X E C U T I V E S U M M A R Y
xx G L O B A L M O N I T O R I N G R E P O R T 2 0 0 5


xxii G L O B A L M O N I T O R I N G R E P O R T 2 0 0 5
Millennium Development Goals (MDGs)Goals and Targets from the Millennium Declaration
GOAL 1 ERADICATE EXTREME POVERTY AND HUNGER
TARGET 1 Halve, between 1990 and 2015, the proportion of people whose income is less than $1 a day
TARGET 2 Halve, between 1990 and 2015, the proportion of people who suffer from hunger
GOAL 2 ACHIEVE UNIVERSAL PRIMARY EDUCATION
TARGET 3 Ensure that by 2015, children everywhere, boys and girls alike, will be able to complete a fullcourse of primary schooling
GOAL 3 PROMOTE GENDER EQUALITY AND EMPOWER WOMEN
TARGET 4 Eliminate gender disparity in primary and secondary education, preferably by 2005, and at alllevels of education no later than 2015
GOAL 4 REDUCE CHILD MORTALITY
TARGET 5 Reduce by two-thirds, between 1990 and 2015, the under-five mortality rate
GOAL 5 IMPROVE MATERNAL HEALTH
TARGET 6 Reduce by three-quarters, between 1990 and 2015, the maternal mortality ratio
GOAL 6 COMBAT HIV/AIDS, MALARIA, AND OTHER DISEASES
TARGET 7 Have halted by 2015 and begun to reverse the spread of HIV/AIDS
TARGET 8 Have halted by 2015 and begun to reverse the incidence of malaria and other major diseases
GOAL 7 ENSURE ENVIRONMENTAL SUSTAINABILITY
TARGET 9 Integrate the principles of sustainable development into country policies and programs andreverse the loss of environmental resources
TARGET 10 Halve by 2015 the proportion of people without sustainable access to safe drinking water and basicsanitation
TARGET 11 Have achieved a significant improvement by 2020 in the lives of at least 100 million slum dwellers
GOAL 8 DEVELOP A GLOBAL PARTNERSHIP FOR DEVELOPMENT
TARGET 12 Develop further an open, rule-based, predictable, nondiscriminatory trading and financial system(including a commitment to good governance, development, and poverty reduction, nationallyand internationally)
TARGET 13 Address the special needs of the least developed countries (including tariff- and quota-free accessfor exports of the least developed countries; enhanced debt relief for heavily indebted poorcountries and cancellation of official bilateral debt; and more generous official developmentassistance for countries committed to reducing poverty)
TARGET 14 Address the special needs of landlocked countries and small island developing states (through theProgramme of Action for the Sustainable Development of Small Island Developing States and theoutcome of the 22nd special session of the General Assembly)
TARGET 15 Deal comprehensively with the debt problems of developing countries through national andinternational measures to make debt sustainable in the long term
TARGET 16 In cooperation with developing countries, develop and implement strategies for decent andproductive work for youth
TARGET 17 In cooperation with pharmaceutical companies, provide access to affordable, essential drugs indeveloping countries
TARGET 18 In cooperation with the private sector, make available the benefits of new technologies, especiallyinformation and communication
Note: The Millennium Development Goals and targets come from the Millennium Declaration signed by 189 countries, including 147 heads of state, in September 2000. The goals and targets are related and should be seen as a whole. They represent a partnership of countries determined, as the Declaration states, “to create an environment—at the national and global levels alike—which is conducive to developmentand the elimination of poverty.”Source: United Nations. 2000 (September 18). Millennium Declaration. A/RES/55/2. New York.United Nations. 2001 (September 6). Road Map towards the Implementation of the United Nations Millennium Declaration. Report of the SecretaryGeneral. New York.

The Millennium Development Goals(MDGs) and the Monterrey Consen-sus have created a powerful global
compact for development.1 But the continuedcredibility of this compact hinges on fosteringmomentum in its implementation. With thefive-year stocktaking of implementation ofthe Millennium Declaration focusingincreased global attention on development,2005 is a crucial year to build momentum.
Without tangible action to accelerateprogress, the MDGs will be seriously jeopar-dized. At stake are prospects not only forhundreds of millions of people to escapepoverty, disease, and illiteracy, but also forlong-term global security and peace—objec-tives that are intimately linked to develop-ment. Behind cold data on the MDGs are realpeople, and lack of progress on the goals hasimmediate and tragic consequences. Everyweek in the developing world, 200,000 chil-dren under five die of disease and 10,000women die giving birth. In Sub-SaharanAfrica alone, 2 million people will die ofAIDS this year. Moreover, 115 million chil-dren in developing countries are not inschool. The need to scale up and speed upaction is thus urgent, and the opportunitiespresented by the year 2005 must be seized.
The MDGs set clear targets for dramati-cally reducing poverty and related human
deprivations and for promoting sustainabledevelopment. The Monterrey Consensus cre-ated a framework of mutual accountabilitybetween developing and developed countriesin the quest for these goals, calling on devel-oping countries to improve their policies andgovernance and developed countries to opentheir markets and provide more and betteraid. With consensus reached on the MDGsand on responsibilities for action, the focus ofdevelopment efforts shifted to implementa-tion. As this report shows, both groups ofcountries have made progress on needed poli-cies and actions. But progress has beenuneven and slower than envisaged. The pacemust pick up if the vision of the MillenniumDeclaration is to be realized—hence the titleof this report.
This report should be read in the contextof the broader review of progress on thedevelopment agenda in 2005, which includesseveral other major reports—the UN Secre-tary-General’s report, the UN MillenniumProject report, and the Commission forAfrica report.2 All these reports complementone another in assessing, from their respectivevantage points, progress toward the MDGsand related goals and in identifying prioritiesfor the agenda ahead. They all share the com-mon objective of expediting and broadeningprogress toward these goals.
G L O B A L M O N I T O R I N G R E P O R T 2 0 0 5 1
Overview: Building Momentumtoward the Millennium
Development Goals
1

Daunting Challenges—and Grounds for HopeGlobally, prospects are promising for halvingincome poverty between 1990 and 2015—thefirst MDG. China and India, the two coun-tries with the highest numbers of poor people,have achieved strong, sustained growth andmade major, rapid progress in reducingpoverty. Due largely to their efforts, East Asiahas already achieved the poverty MDG, andSouth Asia is on target. Most other develop-ing regions are also making steady progressand are expected to achieve the goal or comeclose—though some countries will fall shortin every region, and others will continue tohave large pockets of poverty even whilemeeting the goal at the national level. In Sub-Saharan Africa the momentum has beenmuch slower, and most countries are at riskof falling far short. Indeed, between 1990 and2001 the incidence of poverty rose in Sub-Saharan Africa. Almost half of the region’spopulation lives on less than $1 a day.
Across regions, the risks of falling shortare far greater for the human developmentMDGs. Prospects are gravest in health. Oncurrent trends, most regions will fall short—some seriously—of the health and relatedgoals, including reduced child and maternalmortality and increased access to sanitation.The number of people with HIV/AIDS con-tinues to grow. Prospects are brighter in edu-cation, but in three of the six developingregions the pace of progress is too slow toattain the goal of universal primary schoolcompletion. Although significant progresshas been made in all regions in reducing gen-der disparities in education, again half of theregions will not achieve the goal of genderequality in primary and secondary educationby 2005. Prospects for achieving genderequality in tertiary education by 2015 areeven less encouraging. Sub-Saharan Africa isoff track on all these goals.
Against this backdrop, and with just 10years until 2015, achieving several of theMDGs seems daunting. Indeed, it is a hugechallenge. But rapid progress is possible. The
success of better-performing regions andcountries provides reason for hope for others.A particularly striking example is Vietnam, alow-income country that reduced povertyfrom 51 percent in 1990 to 14 percent in2002. And even in many lagging countries,including in Sub-Saharan Africa, progress isbeing made and the ground is being laid forbetter performance. This progress needs to befurthered and quickened, within the frame-work of the enhanced partnership for globaldevelopment envisaged at Monterrey.
Building Momentum: A Five-Point AgendaHow to generate momentum and broadenprogress? Developing countries must take thelead in articulating and implementing strate-gies that aim higher, to rise above currenttrends and substantially accelerate progress.That will require improving policies and gov-ernance to achieve stronger economic growthand scaling up human development and keyrelated services. Developed countries mustalso bolster their efforts and live up to thecommitments they made at Monterrey. Pro-viding more and better aid is an importantpart of such efforts. But a big push in aid is notthe sole answer. International developmentpolicy needs to move beyond aid and aim fora set of actions that cohere into a broader bigpush—including, importantly, trade policyreform but also other policies that affectdevelopment, such as those involving privatecapital flows, knowledge and technologytransfer, security, and the environment.
Based on its analysis, the report proposes afive-point agenda for accelerating progresstoward the MDGs (box 1.1). Within its globalcoverage, the report has a special focus onSub-Saharan Africa—the region that is fur-thest from the development goals and facesthe toughest challenges in acceleratingprogress.3 But much of the analysis of Sub-Saharan countries is relevant for similar coun-tries in other regions. For example,Sub-Saharan Africa contains the largest num-ber of least developed countries (LDCs) and
C H A P T E R 1
2 G L O B A L M O N I T O R I N G R E P O R T 2 0 0 5

low-income countries under stress (LICUS).But other regions also contain countries inthese groups, with similar characteristics andchallenges. For example, East Asia, thoughbetter known for its major emerging marketeconomies, contains 6 of the 25 LICUS.
Anchoring Efforts in Country-LedDevelopment Strategies
An overarching theme of this report is thecentrality of country-based developmentstrategies in pursuing the MDGs. Country-owned and -led poverty reduction strategies
(PRSs) should provide the framework foroperationalizing the MDGs at the countrylevel in low-income countries. (Equivalentnational development strategies should per-form this role in middle-income countries.)Framed against a long-term developmentvision, PRSs should define medium-term tar-gets, tailored to country circumstances, forprogress toward the MDGs and related devel-opment outcomes. They should also articu-late a clear national plan and priorities forachieving those targets, including policyreforms, institutional strengthening, andinvestments. The development program set
O V E R V I E W : B U I L D I N G M O M E N T U M T O W A R D T H E M I L L E N N I U M D E V E L O P M E N T G O A L S
G L O B A L M O N I T O R I N G R E P O R T 2 0 0 5 3
Anchor efforts to achieve the MDGs in country-led development strategies
• Operationalize the MDGs in country-owned and -led poverty reduction strategies, linked tomedium-term fiscal frameworks. Donors should use these strategies as the basis for aligning andharmonizing assistance.
Improve the environment for stronger, private sector–led economic growth
• Strengthen fiscal management, with a focus on the structure of public spending.• Improve the enabling climate for private activity by removing regulatory and institutional con-
straints and strengthening economic infrastructure.• Improve governance by upgrading public sector management and combating corruption.
Scale up human development services
• Rapidly increase the supply of skilled service providers (health workers, teachers).• Provide increased, flexible, and predictable financing for these recurrent cost–intensive services.• Manage the service delivery chain to ensure that money produces results.
Dismantle barriers to trade
• Achieve an ambitious outcome to the Doha Round that fully realizes its development promise,including in particular a major reform of agricultural trade policies in high-income countries,completing the round no later than 2006.
• Augment assistance to poor countries to address behind-the-border constraints to their tradecapacity, including through investments in critical trade-related infrastructure.
Substantially increase the level and effectiveness of aid
• Double official development assistance over the next five years to support the MDGs, particu-larly in low-income countries and Sub-Saharan Africa, aligning the pace of the increase withrecipients’ absorptive capacity.
• Improve the quality of aid, with faster progress on alignment and harmonization, and deliverymodalities that increase aid flexibility and predictability.
• Reach closure in 2005 on current proposals for additional debt relief. Any additional debt reliefshould not cut into the provision of needed new financing—nor undermine the financial viabil-ity of international financial institutions.
BOX 1.1 A five-point agenda for accelerating progress toward the MDGs

out in a PRS should be linked to a medium-term fiscal framework and annual budgets toalign budget allocations with program prior-ities. Donors should use this framework ofnationally articulated priorities—and theirbudget implications—to align and harmonizetheir assistance. In this way the PRS processcan bring coherence both to the setting andimplementation of national priorities forachieving the MDGs and to donor supportfor the country. It can also, through annualreviews of PRS implementation, provide amechanism for monitoring progress on thedevelopment program in an integrated man-ner and for adjusting it as needed (figure 1.1).
To perform this central strategic and oper-ational role effectively, PRSs need strengthen-ing in many countries. Overall, there has beengood progress in extending and deepening thePRS process in developing countries. At pre-sent, 47 countries are implementing PRSs,and another 12 have prepared interim PRSs.Of these, 33 are Sub-Saharan countries.Countries are increasingly reflecting theMDGs more centrally in their PRSs. The PRSprocess is also being deepened along various
dimensions, including its transparency andinclusiveness, articulation of the growthagenda, attention to institutional capacitybuilding (such as public expenditure manage-ment), and incorporation of poverty andsocial impact analysis. But progress on thesedimensions varies across countries.
Going forward, an area requiring particu-lar attention is strengthening the linksbetween PRSs and fiscal frameworks, whichin most countries will require further devel-opment of medium-term expenditure frame-works. This is key both for enhancing theoperational effectiveness of PRSs for nationalauthorities in setting and implementing devel-opment priorities and for donors in betteraligning their support with country priorities.In most low-income countries, achieving theMDGs will require a major scaling up ofdevelopment efforts. Countries should usethe PRS framework to assess alternative sce-narios that can help them map out how toscale up, drawing implications for intensifieddomestic policy reform, mobilization of addi-tional external assistance, and enhancementof absorptive capacity.
C H A P T E R 1
4 G L O B A L M O N I T O R I N G R E P O R T 2 0 0 5
Long-term vision for developmentFor achieving MDGs and related outcomes
Annual review of PRSimplementation •Monitoring of progress•Feedback to PRS for any adjustments
Medium-term poverty reduction strategy (PRS)•Intermediate development goals and targets linked to MDGs
•Development strategy and priorities– policies, institutions, and investments to promote growth and improve delivery of key services
•Scaling-up scenarios
External assistance•Predictable, long-term aid, aligned with PRS priorities and related fiscal framework•PRS-aligned support for capacity building
MDGs: Framework for implementation at the country level
Translating PRS into budget terms
Medium-term fiscal framework
Annual budgets
FIGURE 1.1 Country focus and leadership are key to coherent and effective implementation of the MDG agenda

Spurring and Sustaining Economic Growth
PRSs and other national development strate-gies must define clear programs for promot-ing stronger and sustained economic growth,and governments must firmly commit tothose programs. Growth is central to achiev-ing the MDGs and related development out-comes. It reduces poverty directly andexpands resources and capacities for achiev-ing the nonincome MDGs. In recent yearsdeveloping countries have achieved anencouraging pickup in economic growth,thanks to continuing progress on improvingpolicies and governance. In 2004 GDPgrowth in developing countries averaged 6.7percent—the highest level in three decades.
Sub-Saharan Africa also appears to beturning the corner. Twelve countries in theregion—such as Ghana, Mali, Mozambique,Tanzania, and Uganda—are experiencinggrowth accelerations of the type more com-monly associated with other regions, withannual GDP growth averaging more than 5.5percent since the mid-1990s. Many Africancountries face region-specific handicaps,including unfavorable geography, vulnerabil-ity to shocks, and widespread disease. Still, asin other regions, policies and institutions mat-ter in achieving higher growth. Differences inpolicies and institutions largely explain thedifferences in growth and poverty reductionbetween other regions and Sub-SaharanAfrica and among countries in Sub-SaharanAfrica. Sound policies also position countriesbetter to deal with economic shocks.
The recent strengthening of growth is onlythe beginning of what Sub-Saharan Africaneeds to achieve and sustain necessaryimprovements in income levels. Historically,it has been far more difficult for countries tosustain growth than to initiate it. To achievethe income poverty MDG, Sub-SaharanAfrica would have to achieve average annualGDP growth of around 7 percent over thenext decade—almost twice the current rate.Though this is a big challenge, past achieve-ments by countries in other regions and some
Sub-Saharan countries show that rapidprogress is possible if there is sufficient com-mitment to reform and support from devel-opment partners.
Specific priorities and sequencing of actionsto promote growth necessarily vary by coun-try. Across developing countries there is con-siderable diversity in economic circumstances.Sub-Saharan Africa alone contains middle-income countries and least developed coun-tries, large countries and small islandeconomies, resource-rich countries (includingoil exporters) and resource-poor countries,coastal countries and landlocked countries,and countries experiencing conflict and otherforms of severe stress. Thus the specifics of thepolicy agenda for growth at the country levelmust be defined as part of individual countrydevelopment strategies. Looking across coun-tries, this report’s analysis finds that threebroad areas require particular attention.
D E E P E N I N G P R O G R E S S O N M A C R O E C O N O M I C M A N A G E M E N T
Macroeconomic management has improvedin all regions, yet progress has been unevenand remains fragile in many countries. Themain area requiring attention is fiscal man-agement, particularly the structure and qual-ity of public spending—to create more fiscalspace for priority expenditures while ensur-ing fiscal sustainability. Better public expen-diture management would allow allocationsto growth-promoting and poverty-reducingspending to rise in a way consistent with sus-tainable fiscal and debt positions. The scopefor such improvements in spending remainsconsiderable in many countries. Sound fiscalmanagement and macroeconomic stabilityare also important underpinnings of an envi-ronment conducive to growth in privateinvestment.
I M P R O V I N G T H E E N A B L I N G C L I M A T EF O R P R I V A T E S E C T O R A C T I V I T Y
A vigorous private sector drives economicgrowth, but government plays a vital role increating a climate where entrepreneurship can
O V E R V I E W : B U I L D I N G M O M E N T U M T O W A R D T H E M I L L E N N I U M D E V E L O P M E N T G O A L S
G L O B A L M O N I T O R I N G R E P O R T 2 0 0 5 5

flourish. An improved business environmentnot only delivers higher and more productiveprivate investment, it also expands the privatesector by establishing a level playing field—encouraging small businesses (often the mostdynamic business segment), inducing a shiftfrom the informal to the formal economy, andbetter engaging the energies of women. A bet-ter business environment is also essential toattracting more foreign investment. Action isneeded on two fronts:
• Improving the regulatory and institutionalenvironment for private activity, with afocus on simplifying regulations for start-ing a business, securing property rights,and strengthening contract enforcementand the rule of law. Access to finance alsoneeds to be improved, but fundamentallydepends on the same regulatory and insti-tutional underpinnings. Sub-SaharanAfrica considerably lags other regions onthese dimensions. Countries should use theimproved diagnostics and metrics of theprivate business environment now avail-able—such as the World Bank’s DoingBusiness Indicators and Investment Cli-mate Surveys—to guide action and moni-tor progress. Further reductions in tradebarriers (discussed below) are also neededto improve the climate for private invest-ment and growth.
• Substantially increasing investment in phys-ical infrastructure, promoting private par-ticipation, and reversing the decline in publicinvestment that persisted for much of thepast decade—recognizing that the bulk ofthe increase in infrastructure investment,especially in Sub-Saharan Africa, will haveto come from the public sector. Gaps ininfrastructure are especially severe in Sub-Saharan Africa, reflecting low past invest-ment as well as the large needs implied bythe region’s challenging geography—such asfor transportation linking distant rural areasto markets (key to boosting agriculture,which accounts for the bulk of employmentin most countries) and regional infrastruc-ture linking landlocked countries to interna-
tional trade. Infrastructure spending (invest-ment plus operation and maintenance) willneed to rise in all regions to support strongergrowth and service delivery consistent withMDG targets. But such spending will needto double in Sub-Saharan Africa, fromabout 4.7 percent of GDP in recent years to9.2 percent over the next decade—implyingannual infrastructure spending of about $20billion and a need for about $10 billion ayear in additional external financing. Theincrease in spending will need to be man-aged well to ensure effectiveness and quality,with the pace of the increase depending oninstitutional capacity and macroeconomicconditions in the countries concerned.
S T R E N G T H E N I N G P U B L I C S E C T O RG O V E R N A N C E
Improving governance—upgrading public sec-tor management, controlling corruption—overarches this agenda, because it is crucial toboth the private sector’s business environmentand the public sector’s development interven-tions. Although governance is getting better inmost countries, reforms need to be acceleratedin many. Sub-Saharan Africa has seen encour-aging progress on political representation,reflecting a trend toward broader participatoryprocesses that enable citizens to influence pol-icymaking and hold leaders accountable.There has been less progress on public sectormanagement and institutional effectiveness.But the improvements in political institutionscould create the momentum needed tostrengthen institutions of economic gover-nance. The African Peer Review Mechanism,recently introduced by the African Union’sNew Partnership for Africa’s Development(NEPAD), focuses on improving governanceand could provide impetus. Informed by thepeer reviews, countries should develop capac-ity building strategies, with NEPAD providinga forum to share best practices, reinforce peerpressure, and advocate for external support.External partners should support the strength-ening of this promising African-led reformframework. Developed countries can also helpcurb corruption by demanding high standards
C H A P T E R 1
6 G L O B A L M O N I T O R I N G R E P O R T 2 0 0 5

from their companies active in developingcountries, including by giving high-level polit-ical endorsement to the Extractive IndustriesTransparency Initiative.
The context for economic growth in Sub-Saharan Africa also appears to be improvingin terms of the region’s peace and securityoutlook, with some decline in the incidenceof conflicts. Still, preventing, managing, andrecovering from conflicts remain major chal-lenges in the region.
Long-term growth prospects also dependon ensuring environmental sustainability. Animportant element of the agenda is enhancingaccess to reliable, affordable, and clean energyoptions. So is checking environmental degra-dation to mitigate the threat of increased cli-matic volatility. Environmental sustainabilityis an MDG in its own right, but it has stronglinks to the achievement of many other goals.
Scaling Up Service Delivery
The human development MDGs require amajor scaling up of education and health ser-vices—including primary education, basichealth care and control of diseases such asHIV/AIDS, and women’s access to educationand health care—and of water and sanitationinfrastructure, which is closely linked tohealth outcomes. The shortfalls are most seri-ous, and the need to scale up most urgent, inSub-Saharan Africa.
As with the growth agenda, priorities foraction in scaling up human development ser-vices must be determined in the context ofcountry-owned development strategies. Theappropriateness of individual interventions,be they “quick wins” or longer-term efforts,needs to be evaluated in these country-specificframeworks. The analysis in this report findsthat most countries face three critical chal-lenges in scaling up service delivery.
I N C R E A S I N G T H E S U P P L Y O F S K I L L E DS E R V I C E P R O V I D E R S
Expanding education and health services on thescale needed to achieve the MDGs will requiremajor increases in the supply of teachers, doc-
tors, nurses, and community health workers—especially in Sub-Saharan Africa. Estimatessuggest that the region will need to as much astriple its health workforce by 2015, adding 1million workers. The impact of AIDS on theworkforce is exacerbating the capacity problemin countries such as Malawi, Tanzania, andZambia. Human resource shortages will likelybe a binding constraint on service expansion,especially in health, unless countries adapt poli-cies and increase provider productivity. Strate-gies that are proving effective include:
• Pragmatic adjustments to recruitment andtraining standards, to increase productionof community teachers and health workers.
• Careful deployment and management ofservice providers, to avoid underutilization.
• Maximum use of nonsalary incentives tomake public sector positions attractive,especially in rural areas.
• Selective salary adjustments for the high-est-skilled workers (such as doctors) in thepublic sector, to restrain migration.
• Cost-effective investments in medical, nurs-ing, and teacher training capacity, to com-plement the shorter-term strategies above.
Donors have an important role to play inaddressing the health worker crisis. Devel-oped countries that benefit from African-trained medical personnel can help financeexpanded training facilities in home countriesand assist those countries in recouping med-ical students’ loans.
M O B I L I Z I N G F L E X I B L E A N D P R E D I C T A B L E F I N A N C I N G
Developing countries have increased budgetallocations to education and health, butmany need to go further to achieve theMDGs. For education, 20 percent of therecurrent budget is the benchmark under theEducation for All Fast Track Initiative(FTI)—while Sub-Saharan countries average15 percent. For health, in 2000 African gov-ernments set a target of 15 percent of therecurrent budget, well above their currentaverage of 8 percent.
O V E R V I E W : B U I L D I N G M O M E N T U M T O W A R D T H E M I L L E N N I U M D E V E L O P M E N T G O A L S
G L O B A L M O N I T O R I N G R E P O R T 2 0 0 5 7

But allocating more from countries’ ownfiscal resources will not be enough: A sub-stantial increase in external financing isrequired. Achieving the universal primaryeducation MDG in low-income countries willrequire at least $3 billion a year in additionalexternal financing. Much more is needed tomeet the health goals—at least $25 billion ayear. Equally important are deep changes inthe nature of donor support. A significantshare of bilateral assistance falls outsidenational planning and budgeting processes.Transaction costs severely strain countries’limited administrative capacity. Aid flows areoften volatile. And there is often a disconnectbetween the types of expenditures that coun-tries need to finance to scale up education andhealth services—recurrent, local, largely per-sonnel costs—and what bilateral donors pro-vide—in-kind financing, technical assistance.Roughly two-thirds of aid for education isextended as technical assistance.
Flexible and predictable financing is espe-cially important for these recurrent cost-intensive services. Priorities for improving thedelivery of financing for these services include:
• Making aid flexible. All aid should supportpriorities identified in PRSs and endorsedsector plans. In countries that meet publicexpenditure management thresholds, moreaid should be provided as budget support.
• Creating a stable funding framework forthe Fast Track Initiative. To strengthen theFTI, partners should make monitorable,public, long-term commitments to annualincreases in funding for primary educa-tion. The target should be a significantincrease from each partner’s 2005 base,which the FTI Secretariat should monitor.Annual funding commitments should helpfill agreed financing gaps for endorsedcountries where partners have a presenceor interest; any residual should be allo-cated to the FTI’s Education ProgramDevelopment Fund or Catalytic Fund.
• Aligning global health initiatives withnational policies and priorities. Additionalexternal resources are needed to prevent
and treat childhood diseases, reducematernal mortality, expand HIV/AIDStreatment, and make progress againstmalaria and tuberculosis. Increases indonor funding must be long-term andaligned with country priorities. The inter-national health community urgently needsto look at all options for ensuring thatglobal programs organized around specifichealth interventions do not undermine thecoherence of country health strategies, thebalanced allocation of resources, and thestrengthening of health systems. Whilepreserving the mandates these programshave for mobilizing resources, raisingawareness, monitoring results, and financ-ing global public goods with respect toindividual diseases, these functions mustbe better coordinated at the global leveland better aligned at the country level withgovernment-led sector plans, with harmo-nized procurement, disbursement, andreporting procedures. The High LevelForum for the Health MDGs, establishedin 2003, offers a platform for this collabo-rative rethinking of the global health archi-tecture and the development of commonprinciples and standards of good practicefor engaging global health partnerships atthe country level.
I M P R O V I N G M A N A G E M E N T O F T H ES E R V I C E D E L I V E R Y C H A I N
Sound expenditure management and a focuson development results are crucial to effectiveservice delivery. The realization of increasedaid, especially in the form of flexible budgetsupport, also depends on them. Sound expen-diture management requires systems for bud-get formulation, allocation, and reportingthat meet threshold standards of integrity andefficiency. In a number of countries in great-est need of external support for recurrentcosts, these systems are too weak to givedonors confidence that resources can betracked and used well. Donors are giving highpriority to building capacity in this area, butprogress depends crucially on domestic com-mitment to reform.
C H A P T E R 1
8 G L O B A L M O N I T O R I N G R E P O R T 2 0 0 5

A focus on development results requiresthe capacity to gather and analyze real-timedata on MDG progress. Countries need to beable to track the primary completion rate anduse regular household surveys and sentinelmonitoring to generate data on child andmaternal mortality and major communicablediseases. Since these indicators improve rela-tively slowly, intermediate indicators ofprogress are also important—as are measuresof system efficiency, such as those for educa-tion developed by the FTI. A similar frame-work is being developed by the HealthMetrics Network, a donor consortium inhealth. Progress also requires a better evi-dence base for policy, built on rigorousimpact evaluation of key programs.
Ultimately, strengthening service deliveryand ensuring that services reach poor peoplerequire action to improve the core account-ability relationships identified in the WorldDevelopment Report 2004: responsiveness ofgovernments to citizen demands through thepolitical process; responsiveness of serviceproviders to clients; and effectiveness of gov-ernment agencies in turning resources intoresults.4 Weaknesses in these accountabilityrelationships can be the deepest threat toeffective service delivery. But countries aremaking progress. Sector management can behelped by clear funding norms, competency-based recruitment, results focus, attention tocost-effective standards, and strategies tomake effective use of the private sector. Aboveall, governments can strengthen the voice ofclients at the point of service delivery—through the power of information, directinvolvement in school and health facility mon-itoring and management, and the use of con-ditional cash transfers.
Realizing the Development Promise of TradeT H E D O H A D E V E L O P M E N T A G E N D A
Improving market access for developing coun-tries would provide a major boost to economicgrowth and progress toward the MDGs. Mul-tilateral, reciprocal, nondiscriminatory trade
liberalization offers the best means for realiz-ing the development promise of trade. Atimely, pro-development outcome to the DohaRound is therefore crucial. Based on develop-ments to date, there is a significant risk that alimited, “business as usual” outcome mayemerge. Not only would such an outcomegreatly reduce the potential of trade to helpachieve the MDGs, it could imply a furthererosion of the multilateral trading system.
The 2001 Doha ministerial declaration putdevelopment at the center of the trade reformagenda. The international community mustraise the level of its ambition with respect tothe Doha Round and aim for an outcomeequal to that vision. High-income countriesmust lead by example. Efforts should focuson a major reduction in market access barri-ers—particularly a transformation of agricul-tural trade policy in high-income countries.Taking into account both tariff and nontariffmeasures, trade policy in high-income coun-tries is more than seven times as restrictive inagriculture as in manufacturing. Ambitiousreference points would be helpful in guidingthe negotiations, including:
• Agriculture: reducing all agricultural tar-iffs to no more than 10 percent, eliminat-ing agricultural export subsidies, and fullydecoupling domestic agricultural subsidiesand rural support from production.
• Manufacturing: eliminating tariffs onmanufactured products.
• Services: committing to free cross-bordertrade in services delivered over telecom-munications networks, complemented byactions to liberalize the temporary migra-tion of service providers.
For these actions to assist in attaining theMDGs, they should be completed by 2015,with major progress achieved by 2010.
Significant trade policy commitments bydeveloping countries are an essential, andequally urgent, part of the agenda to realizethe potential of trade for development,including tapping the considerable scopefor expanded trade among them. Trade
O V E R V I E W : B U I L D I N G M O M E N T U M T O W A R D T H E M I L L E N N I U M D E V E L O P M E N T G O A L S
G L O B A L M O N I T O R I N G R E P O R T 2 0 0 5 9

restrictions are generally much higher indeveloping than developed countries, andare highest on average in Sub-SaharanAfrica, South Asia, and the Middle East andNorth Africa.
An ambitious Doha Round would yieldlarge gains for the world as a whole and fordeveloping countries. Most estimates placethe gains from such an outcome at more than$250 billion a year by 2015, with 33–40 per-cent accruing to developing countries—morethan their 20 percent share of world GDP.This would imply a boost to the GDP of low-income countries of about 2 percent and thatof Sub-Saharan Africa of 1.3 percent; corre-sponding estimates for a low-ambition, busi-ness-as-usual Doha outcome are 0.3 percentand 0.1 percent, respectively. More thanthree-fifths of the estimated global gains arerelated to reform of agricultural trade. Theestimates of gains are from merchandise tradereform only, and capture mainly static gains.Significant liberalization of services couldincrease the gains considerably—by a multi-ple on some estimates.
A I D F O R T R A D E
Complementing an ambitious Doha outcome,aid for trade should be scaled up substantially.For many low-income countries, fully captur-ing the opportunities arising from improvedmarket access, as well as their own tradereforms, requires addressing the behind-the-border constraints on their trade capacity.This applies particularly to the least developedcountries, most of which are in Africa, forwhom lack of trade capacity and competitive-ness is the binding constraint. The agendaincludes improving trade logistics and facili-tation, strengthening critical trade-relatedinfrastructure (such as transport), and furtherreforming policies that create anti-export bias.
A host of diagnostic trade integration stud-ies undertaken for least developed countriesunder the Integrated Framework for Trade-Related Technical Assistance have identifiedareas where aid can be used to build tradecapacity. The Integrated Framework, a collab-orative venture among multilateral agencies,
bilateral donors, and governments of leastdeveloped countries, offers a mechanism toidentify priorities and allocate additional assis-tance to trade-related investments and supportfor policy reforms. Resources provided to theIntegrated Framework to date have been ableto support only small-scale technical assis-tance. But the framework offers a ready-madevehicle for boosting aid for trade, supported byincreased integration of the trade capacitybuilding agenda by countries in their PRSs.
T A R I F F P R E F E R E N C E S
Recent policy in OECD countries has empha-sized tariff preferences for small, poor coun-tries—mainly the least developed countriesand Sub-Saharan countries. While actions tomake existing tariff preferences more effec-tive—for example, through adoption of com-mon, liberal rules of origin—would bebeneficial in the short run, in the long run thefocus should shift toward alternative forms oftrade assistance that generate greater benefitsfor recipients and are less trade-distorting. Tar-iff preferences have been of limited value tomany African countries and have negativeeffects on the functioning of the global tradesystem. Alternative measures include stepped-up financial assistance to strengthen tradecapacity and help countries deal with theadjustment costs of trade policy reform,including preference erosion and revenuelosses. They also include action by majorimporters to minimize the incidence of nontar-iff measures (quotas, licensing requirements,health- and safety-related product standards)on exports from poor countries. Regardless oftheir intent, regulatory product standardsapplied at the border have a major restrictiveimpact on trade and affect poor countries dis-proportionately. Reducing their incidence onthese countries, including by assisting in build-ing their capacity to meet the regulatoryrequirements, would have a high payoff.
R E G I O N A L I N T E G R A T I O N
Regional trade agreements can also helpleverage trade for development—providedthey do not detract from the pursuit of an
C H A P T E R 1
10 G L O B A L M O N I T O R I N G R E P O R T 2 0 0 5

ambitious Doha outcome. Full realization ofthe development contributions of bothNorth-South and South-South regional inte-gration arrangements requires that develop-ing country members of these arrangementsimplement significant liberalization on anondiscriminatory basis, in addition to grant-ing preferential access to partner countries.Because a number of Sub-Saharan countriesstill rely on import duties for a significantportion of government receipts, revenue con-cerns and the ability to put in place alterna-tive revenue sources are factors indetermining the appropriate speed of liberal-ization. Agreements that the European Unionand the United States are negotiating withdeveloping countries can do much good ifdesigned in a way that puts development con-siderations at the center.
Increasing Aid and Its Effectiveness S C A L I N G U P O F F I C I A L D E V E L O P M E N T A S S I S T A N C E
Developing countries must make strongerefforts to mobilize more domestic resources toaccelerate progress toward the MDGs—mov-ing more vigorously to spur economic growth,strengthening revenue administration, andimproving the efficiency of spending. Theymust also build on reforms that enhance theirability to attract private nondebt capitalinflows, especially foreign direct investment.Moreover, in many countries worker remit-tances are becoming an increasingly impor-tant source of private external finance.
Still, for most low-income countries offi-cial development assistance (ODA) remains amajor source of external finance—and forpoor and least developed countries it remainsthe predominant source. In Sub-SaharanAfrica, home to most of these countries, offi-cial flows account for about two-thirds ofcapital inflows. Even with stronger efforts tomobilize more domestic resources and attractmore private capital inflows, these countrieswill need a substantial increase in ODA toimprove their prospects for achieving theMDGs. In middle-income countries aid plays
a much smaller but still important role, bycatalyzing reforms, supporting efforts totackle concentrations of poverty, and helpingto counter negative shocks.
Donors are beginning to respond to theneed to increase aid, following up on theirMonterrey commitments. Aid volumes havebeen recovering since 2001, following a decadeof almost continuous decline. Between 2001and 2003 net ODA increased by 12 percent inreal terms. This is encouraging, but aidremains well short of what poor countries needand can use effectively. At least a doubling ofODA is needed within the next five years tobuild sufficient momentum in progress towardthe MDGs. Further increases will likely beneeded beyond that period up to 2015. Theneed for more ODA is especially great in Sub-Saharan Africa—and analysis suggests that,provided countries continued and strength-ened policy and institutional reforms, theregion could effectively use a doubling of aidover a five-year timeframe.
To signal that needed resources will beforthcoming, 2005 is an opportune time fordonors to raise their initial post-Monterreycommitments and extend them over a longerhorizon—2010 or beyond. Only half of Devel-opment Assistance Committee (DAC) donorshave announced aid commitments beyond2006. The others should do so in 2005.
While aid volumes are rising, it is impor-tant to ensure that development aid to poorcountries to support their efforts to achievethe MDGs is not crowded out by donors’strategic and security objectives. Largeamounts of aid have recently been committedto geopolitically important countries. A bet-ter balance in aid is needed, focusing more onpoverty reduction. Reducing poverty and thehopelessness that comes with human depri-vation is perhaps the most effective way ofpromoting long-term peace and security. Andit costs less: doubling ODA would amount toless than one-tenth of what high-incomecountries devote to military spending. It isalso eminently affordable, representing onlyabout 0.2 percent of high-income countries’gross national income (GNI).
O V E R V I E W : B U I L D I N G M O M E N T U M T O W A R D T H E M I L L E N N I U M D E V E L O P M E N T G O A L S
G L O B A L M O N I T O R I N G R E P O R T 2 0 0 5 11

A L I G N I N G A I D W I T H A B S O R P T I V E C A P A C I T Y
Both how aid is allocated across countries andhow increases are sequenced within countriesmust be aligned with recipients’ absorptivecapacity. Country readiness to use significantincreases in external assistance varies consider-ably. Which countries should be “fast tracked”depends on the robustness and strength ofownership of development programs articu-lated in their PRSs and on progress in gover-nance and institutional capacity to implementthem, and should be approached on a countryby country basis through the normal dialoguebetween donors and recipients.
A number of low-income countries, includ-ing several in Sub-Saharan Africa, havedemonstrated the capacity to effectively man-age a scaling up of development efforts sup-ported by external assistance. Examplesinclude Tanzania’s scaling up of primary edu-cation, Indonesia’s rapid development of ruralinfrastructure in its kecamatans, Uganda’saccelerated expansion of poor people’s accessto primary health care and of programs tocombat HIV/AIDS, Mozambique’s transfor-mation of its growth performance by harness-ing significant aid flows in support ofstepped-up domestic reforms and investments,and Vietnam’s rapid reduction of poverty andof the incidence of scourges such as malaria.Recent detailed work on absorptive capacity inEthiopia, carried out by the World Bank incooperation with the government, shows thefeasibility of substantial increases in aid in sup-port of the MDGs being used effectively—butalso underscores the importance of appropri-ate sequencing of aid to minimize costs andensure desired development results. There arealso many countries where absorptive capacityis weak and increases in aid need to be moremeasured. Absorptive capacity is neither staticnor exogenous to aid; aid can be instrumentalin expediting the buildup of capacity.
T A I L O R I N G A I D T O T H E N E E D S O F L I C U S
Support for capacity building is particularlyimportant for LICUS. Appropriately timed and
directed aid can be effective in these situations.Key elements of effective support are appropri-ate sequencing of aid within a long-termengagement (rather than a stop-go or quick-in,quick-out approach) and use of instrumentsand delivery mechanisms responsive to specificlocal conditions while supporting the longer-term buildup of national institutional capacity.Well-timed aid can also be quite productive fol-lowing adverse exogenous shocks, helping tolimit the diversion of development resourcesinto short-run relief efforts.
R A I S I N G A I D Q U A L I T Y
Increasing the quality of aid is just as impor-tant as increasing its quantity. As noted abovein relation to the financing of human devel-opment services, aid is often fragmented andvolatile, aligned more with donor agendasand preferences than country priorities, andentails high transaction costs. These issues arereceiving more attention and progress is beingmade, but it has been slow and uneven. Theoutcome and follow-up to the Second HighLevel Forum on Aid Effectiveness, held inParis in March 2005, must lead to a signifi-cant step-up in progress. Key areas for atten-tion are achieving closer strategic andoperational alignment with country-ownedand -led strategies (PRSs or other nationaldevelopment strategies), improving the pre-dictability of aid (including making longer-term commitments when recipientperformance warrants it), and strengtheningthe focus on development results. The ParisDeclaration on Aid Effectiveness, which aimsfor improvements in these and other areas,must be implemented firmly and expedi-tiously. A notable outcome of the ParisForum was the adoption of a set of indicatorsof aid quality that should help with closermonitoring of progress and reinforcement ofdonor and recipient responsibilities.
D E B T R E L I E F
For heavily indebted poor countries (HIPCs),debt relief is important for increasing the fis-cal space for much-needed increases in spend-ing to promote growth and reduce poverty
C H A P T E R 1
12 G L O B A L M O N I T O R I N G R E P O R T 2 0 0 5

and for relieving the debt overhang. Contin-ued and effective implementation of theHIPC Initiative remains key. The ExecutiveBoards of the IMF and the World Bank haveendorsed key elements of a debt sustainabil-ity framework for low-income countries thatwould support these countries in their effortsto achieve the MDGs without creating futuredebt problems and keep countries that havereceived debt relief under the HIPC Initiativeon a sustainable path. With respect to recentproposals for additional debt relief, effortsshould be made to reach closure in 2005. Anyadditional debt relief should not cut into theprovision of needed new financing, which forthese countries should be primarily in theform of grants. Nor should it undermine thefinancial viability of international financialinstitutions. Recent steps to increase the shareof grants in concessional financing from theInternational Development Association(IDA) and other multilateral developmentbanks and to link the mix of grants and loansto recipients’ debt sustainability representnotable improvements in the framework forassisting poor countries.
I N N O V A T I V E F I N A N C I N G M O D A L I T I E S
The year 2005 should also see progress onongoing work assessing the merits and feasi-bility of innovative modalities for mobilizingresources to fund the needed increases in aidand ensure their timely availability, includingthe proposed International Finance Facilityand global taxes related to important inter-national externalities, such as carbon emis-sions. Blending arrangements, whichcombine flows with different financial termsand characteristics to increase concessional-ity or gain leverage, also offer possibilities toaugment resources for the MDG agenda,including in middle-income countries withlarge pockets of poverty, and to financeglobal and regional public goods. Finally, theimpressive scale of private contributions inresponse to the recent Asian tsunami, andmajor private contributions to causes such ascombating HIV/AIDS, point to the impor-tance of exploring ways to enhance the role
and effectiveness of voluntary contributionsin supporting development.
Strengthening and SharpeningSupport from InternationalFinancial InstitutionsHow are international financial institutions(IFIs)—multilateral development banks(MDBs) and the International MonetaryFund—contributing to implementation of theabove agenda, by supporting country devel-opment, drawing on sectoral, regional, andglobal programs and research, strengtheningpartnerships, and managing for developmentresults? The report finds that there has beenprogress in each of these areas, but there is aneed to do more and pick up the pace.
Low-Income Countries
Recent replenishment negotiations for theAfrican Development Fund (AfDF), AsianDevelopment Fund (AsDF), and IDAendorsed a common framework for the use ofPRSs that reflect the MDGs, grants, debt sus-tainability, and disclosure of country policyand institutional assessments. They also sup-ported piloting of results-based countrystrategies, adoption of results measurementsystems, and special programs for low-income countries under stress. Given thatthese replenishments cover some 95 percentof MDB programs in low-income countries,they have established a concrete platform foraccelerating implementation of these initia-tives and harmonizing them across the banks.Support for countries in the event of exoge-nous shocks is also being strengthened.Reflecting independent evaluations, theWorld Bank and the IMF need to supportstronger country leadership of the PRSprocess while deepening the dialogue withcountries on the policy agenda. Clearer own-ership of the PRS by countries, with the Bankand the IMF reflecting their views in JointStaff Advisory Notes and related process,would also help clarify the accountabilities ofBank and IMF staff.
O V E R V I E W : B U I L D I N G M O M E N T U M T O W A R D T H E M I L L E N N I U M D E V E L O P M E N T G O A L S
G L O B A L M O N I T O R I N G R E P O R T 2 0 0 5 13

Middle-Income Countries
For middle-income countries there has alsobeen a trend toward harmonization across theMDBs, albeit slower, reflecting the evolvingand varying needs of these countries. Middle-income countries have been vocal in callingfor reductions in the costs of doing businesswith the banks, especially when those costsarise in the context of replenishment exercisesfor concessional funds that they cannotaccess. Competitive pressures among thebanks have led to the transmission of innova-tions in one—such as liberalization of expen-diture eligibility categories for investmentlending or increased reliance on country sys-tems—to the others in fairly rapid succession.
Knowledge and Capacity Building
Research by IFIs has helped to articulate theglobal development agenda, making notablecontributions on trade and aid, among otherareas. These institutions have also con-tributed much to building trade capacity andenhancing countries’ fiduciary and fiscal sys-tems for the absorption of aid. But they needto do more—including systematically keepingtrack of where capacity gaps are, as a basisfor guiding donor actions—if developingcountries are to fully exploit the opportuni-ties emerging from the dismantling of tradebarriers and increasing the scale and effec-tiveness of aid proposed above.
Partnerships
The MDBs are partnering more effectivelywith clients, with each other, and with otherdonors. This progress is largely due to thedevelopments cited above with respect to thereplenishments of the banks’ concessionalwindows and their greater reliance on countrysystems to process their funding. Relative tocivil society, disclosure remains a major issue,because despite improvements many criticsfeel that IFIs have not met a standard ofaccountability commensurate with theirpower and influence in a number of areas.
World Bank–IMF relations have continued tomature, based on comparative advantage anda mandate-driven division of labor high-lighted by ongoing collaboration on PRSs,debt sustainability analysis and its applicationto concessional and grant financing, and fur-ther streamlining of structural conditionality.
Managing for Development Results
During 2004 important milestones wereachieved in building results-based systems inthe MDBs. These include the completion of thefirst cycle of the IDA13 results measurementsystem, the adoption of the IDA14 and AfDFX results measurement systems, the comple-tion of results-based country strategy pilots bythe Asian Development Bank and the WorldBank (and their commitment, along with theAfrican Development Bank’s, to conduct fur-ther pilots in 2005), the Inter-American Devel-opment Bank’s adoption of a Medium-TermAction Plan for Development Effectiveness, thenew independence of the Asian DevelopmentBank’s evaluation department, the launch ofthe draft Results Sourcebook prepared jointlyby these institutions and bilateral donors, andthe major PRS evaluations carried out in coop-eration by the World Bank’s Operations Eval-uation Department (OED) and the IMF’sIndependent Evaluation Office (IEO). TheIMF is considering how to conceptualize andoperationalize the results agenda within itsinstitutional framework, drawing on recom-mendations from various reports of the IEO.
Priorities for Action
How can IFIs strengthen and sharpen theirsupport? This report suggests five prioritiesfor action and monitoring progress:
• Support the deepening of the PRS frame-work in low-income countries, and theoperationalization of the MDGs andalignment of IFI assistance within thatframework. Support for building institu-tional capacity is especially important forlow-income countries under stress.
C H A P T E R 1
14 G L O B A L M O N I T O R I N G R E P O R T 2 0 0 5

• Continue to adapt approaches and instru-ments to better respond to the evolvingand varying needs of middle-income coun-tries, including further streamlining ofconditionality and investment lending.
• Ensure that the implications of dismantlingtrade barriers and increasing the scale andeffectiveness of aid are adequately reflectedin support for country capacity building, sothat emerging opportunities can be fullyutilized. International financial institutionsshould sharpen the strategic focus andimprove the effectiveness of their supportfor global and regional public goods.
• Strengthen partnerships and harmonizefurther by improving transparency, reduc-ing red tape and enhancing the flexibility ofassistance (through simplification and useof sectorwide approaches), and promotingthe development and use of country sys-tems—for procurement, financial manage-ment, and environmental assessment.
• Strengthen the focus on results and account-ability by supporting country efforts to man-age for development results (strengtheningpublic sector management and developmentstatistics) and furthering progress within IFIson enhancing the results orientation of their
country strategies and programs and qualityassurance processes. In addition, a commonframework should be adopted for self-eval-uation of MDB performance and resultsmeasurement, and adapted to IMF opera-tions as much as possible.
Notes1. The MDGs flowed from the Millennium
Declaration adopted by 189 countries at theUnited Nations Millennium Summit, held in NewYork in 2000. The Monterrey Consensus emergedfrom the UN Conference on Financing for Devel-opment, held in Monterrey, Mexico, in 2002.
2. UN (2005); UNMP (2005); Commission forAfrica (2005).
3. The Global Monitoring Report 2004, pre-pared for the Spring 2004 Development Commit-tee meeting and published in June of that year,provided a comprehensive assessment of the policyagenda for achieving the MDGs and related devel-opment outcomes, spanning the responsibilities, asreflected in the Monterrey Consensus, of all the keyactors—developing countries, developed countries,and international financial institutions. Building onthat analysis, this report has a more selective focuson key areas of the policy agenda but provides amore in-depth assessment of those areas.
4. World Bank (2003).
O V E R V I E W : B U I L D I N G M O M E N T U M T O W A R D T H E M I L L E N N I U M D E V E L O P M E N T G O A L S
G L O B A L M O N I T O R I N G R E P O R T 2 0 0 5 15


Economic growth is central to reducingpoverty and meeting the MillenniumDevelopment Goals (MDGs). Globally,
prospects are promising for halving incomepoverty—the first goal—by 2015. The twocountries that in 1990 were home to the mostpoor people, China and India, have acceler-ated economic growth for sustained periodsand made significant inroads into reducingthe incidence of poverty. Due partly to theirefforts, East Asia has already achieved thepoverty goal, and South Asia is on target.Most other developing regions are makingsteady progress and are expected to eitherachieve the goal or come close, even as pock-ets of poverty remain at the national and sub-national levels. But in Sub-Saharan Africa themomentum has been slower, and most coun-tries are at severe risk of falling short.
To accelerate progress toward the povertygoal, Sub-Saharan Africa will need to sub-stantially boost economic growth. Increasesin a country’s overall income tend to lift theincome of its poor people proportionately,and there is little doubt that differences inpolicies and institutions have played a majorrole in explaining the divergent povertytrends seen, for example, in East Asia andSub-Saharan Africa. The growth process inAfrica, although subject to some initial dis-advantages such as difficult geography and
high incidence of disease, responds to keypolicy drivers in a manner fundamentallysimilar to economies elsewhere. Thus the pro-motion of higher growth rates through policyand institutional reforms is critical forpoverty reduction (box 2.1), and outliningthe agenda for spurring and sustaininggrowth in Sub-Saharan Africa is the focus ofthis chapter.
Recently there has been evidence that Sub-Saharan Africa is starting to turn the corner.Twelve countries are experiencing a growthacceleration of the type more commonlyassociated with other regions. More gener-ally, improvements in economic policies andpolitical institutions have supported highergrowth rates across the region. But theseachievements are only the beginning of whatis needed to sustain needed improvements inincome levels and living standards. It is con-siderably more difficult to sustain growththan merely to initiate it.
Sub-Saharan Africa’s weak economic per-formance over the past four decades, and itsdifficult prospects for reaching the MDGs,have led some analyses to conclude that manyAfrican countries are caught in “povertytraps.” The suggestion in these analyses isthat large amounts of aid are needed to jump-start growth across the region. But increasedaid is insufficient to spur and sustain higher
G L O B A L M O N I T O R I N G R E P O R T 2 0 0 5 17
Spurring and SustainingEconomic Growth
2

C H A P T E R 2
18 G L O B A L M O N I T O R I N G R E P O R T 2 0 0 5
The strong relationship between income growth and poverty reduction has been documented in alarge empirical literature. This relationship can also be seen in the figure below, which showschanges in poverty over the past two decades—using the $1 a day headcount measure—for a largesample of developing countries. (For details on the data and decomposition methodology used inthis box, see Kraay, forthcoming.) The figure also indicates wide variation around this average rela-tionship. What implications do these differences have for poverty reduction?
Consistent with other developing regions, most countries in Sub-Saharan Africa are clustered inthe top left quadrant (with negative growth and rising poverty) or bottom right quadrant (with pos-itive growth and declining poverty). Sub-Saharan countries have a median per capita growth rateof 0.8 percent a year, substantially lower than the overall median of 2.1 percent, and most fall abovethe regression line, indicating worse poverty reduction performance than for a typical developingcountry with similar growth performance.
The figure also indicates important differences across countries in the rate at which povertydeclines for a given growth rate. Ghana, and Uganda, for example, had similar annual growth rates(1–3 percent), but their rates of annual change in poverty ranged from about –8 percent to +2 per-cent. There are two reasons for such differences: cross-country differences in the sensitivity ofpoverty to growth, holding constant the distribution of income; and cross-country differences inhow the distribution of income changes over time.
Note: Sub-Saharan countries are labeled, including the years of the change in poverty.
Regression line shown: y = –1.15x – 0.01; R2 = 0.54
0.2
Ethiopia 1995–2000
Côte d’Ivoire1985–95
Burundi 1992–98Ghana 1987–99Nigeria 1985–97
Lesotho 1986–95
Botswana 1985–93Mauritania 1988–95
Gambia 1992–98
Uganda1989–96
Kenya 1992–7
Madagascar 1980–99
–0.05 0.10.05 0.15–0.1–0.15–0.2 0.2
0.15
0.1
0.5
–0.05
–0.1
–0.15
–0.2
Annual growth rate in per capita income
Change in $1-a-day poverty rate per person
BOX 2.1 Growth is central to sustained poverty reduction

growth—and its provision by itself does notconstitute a growth strategy. While certainforms of aid do appear to raise growth rates,the effects can be relatively small and are sub-ject to diminishing returns. There is also nosystematic evidence supporting the empiricalrelevance of poverty traps.
The policy agenda discussed in this chap-ter is daunting in its breadth, complexity,and ambition. It would be useful to describethe minimum set of reforms required tospur growth, or the larger set sufficient tosustain it. But neither is possible: the rela-tionship between growth and policies, aid,shocks, the external environment, and otherfactors is complex. The policy recommen-dations in this chapter reflect a wealth ofcross-country, time series, and case studyexperiences. Yet growth often occurs incountries where several of these mecha-nisms are not in place. Similarly, countries
may undertake substantial reforms andobserve disappointing growth payoffs for awhile. With respect to growth accelerations,for example, occurrences are both fairlycommon and hard to explain—though bothpolicy and institutional improvements helpextend these episodes.
The priorities emphasized in this chapterare macroeconomic stability, and institutionsand policies that promote private sectorgrowth. For countries that have achievedbroad macroeconomic stability, better expen-diture management is critical to sustaining itand creating fiscal space for investmentsaimed at promoting growth and reducingpoverty, including those that complement pri-vate activity. To invigorate the private sectorand encourage a wider range of profitableopportunities to be taken up, it is essential toremove excessive regulatory and institutionalconstraints and improve weak infrastructure.
S P U R R I N G A N D S U S T A I N I N G E C O N O M I C G R O W T H
G L O B A L M O N I T O R I N G R E P O R T 2 0 0 5 19
Sub-Saharan countries tend to have a low sensitivity of poverty to growth, and the contributionof changes in inequality to changes in poverty in the region is similar to that in the developing worldas a whole. Together these findings suggest that poverty reduction in Sub-Saharan Africa has beendisappointing primarily because of its slow growth and low sensitivity of poverty to growth (hold-ing constant the distribution of income). This low sensitivity can be traced to the region’s low incomesand high inequality. (Sub-Saharan Africa and Latin America are the world’s most unequal regions.)
What are the implications for policy? At a basic level, growth remains crucial for reducing povertyin Africa—all the more so given that the region’s low income levels imply a relatively low sensitivityof poverty to growth. Moreover, the dominance of growth as the driver of changes in poverty seemsto be even clearer over longer periods, suggesting that growth is especially critical for sustained reduc-tions in poverty. Finally, evidence does not suggest that policy and institutional reforms aimed at pro-moting growth lead to higher inequality, which would temper the poverty impacts of growth.
Recent case studies on the factors driving pro-poor growth in 14 developing countries confirmthe importance of macroeconomic reforms, followed by substantially higher growth without anyshort-term increase in the Gini coefficient. During the first five years of economic reforms, annualper capita growth rose by 2.0 percentage points in Burkina Faso and 4.5 points in Uganda. Duringthe same period the Gini coefficient fell from about 0.47 to 0.45 in Burkina Faso. Although lack ofpre-reform data preempts a similar comparison for Uganda, a relatively low post-reform Gini coef-ficient of 0.36 does not raise serious concerns about rising inequality.
Source: World Bank 2004; Dollar and Kraay 2002; Ghura, Leite, and Tsangarides 2002; Lopez 2004.
BOX 2.1 Growth is central to sustained poverty reduction (Continued)

To underpin these efforts, recent progress onpolitical governance must begin to be trans-lated more clearly into progress on economicgovernance. Better economic governance isimportant for improving the private sectorenvironment and increasing public sectoreffectiveness. Transparency in its variousdimensions is a theme underlying many of theinterventions identified here. Trade liberal-ization is also a policy priority in many coun-tries (see chapter 4).
This discussion of priorities is inevitablybroad because, in the end, the best path willbe tailored to each country. While there aremany similarities, different countries face dif-ferent problems to different degrees. Equallyimportant, the relationship between differentaspects of reform will vary across countries.Progress must occur on a number of fronts,and the key areas will differ by country. Inmany cases, trade liberalization will createpossibilities for reform in other areas. In oth-ers, improvements in the regulatory environ-ment will have an important impact. In stillothers, improving the regulatory environ-ment or even achieving macroeconomic sta-bility will depend on improving public sectorgovernance. Countries must adapt the rec-ommendations in this chapter, in terms ofform and sequence, to their own circum-stances, in the context of country-ownedpoverty reduction strategies. Still, the priori-ties and progress indicators described hereshould help in determining the direction ofreforms and assessing progress.
In Sub-Saharan Africa, home to most low-income countries under stress (LICUS), theroad ahead is not easy, and there is a need forbold action. Within the agenda outlinedabove, there is substantial room for enablingvirtuous circles. For example, as credible evi-dence of a change in the macroeconomic pol-icy regime takes hold, the uncertaintyattached to fixed investments begins todecrease—and as more investors considertaking up profitable opportunities, thedemand for a better investment climateincreases. Because there will remain vested
interests intent on maintaining the status quo,political commitment is key to initiating andsustaining reforms.
The scale of the challenge in Sub-SaharanAfrica means that domestic efforts willrequire external support. Large increases inaid will be needed, particularly to accelerateprogress toward the nonincome MDGs (seechapter 3). Better access to the markets ofdeveloped countries is needed to promote anddiversify exports (chapter 4), and externaldebt levels must be sustainable to ease theburden on fiscal policy (chapter 5).
The first section of this chapter provides thecontext for the discussion of the growth agendaby reviewing medium-term projections forgrowth and poverty rates, analyzing Sub-Saha-ran Africa’s record of economic performance,and identifying conditions that have histori-cally accompanied the onset of, and tended tosustain, periods of growth acceleration. Thesubsequent sections focus on the three key ele-ments of the growth agenda: the macroeco-nomic environment, the private investmentclimate, and public sector governance.
Growth and Its Implications for PovertyThe overall outlook for growth remainspromising over the next decade (figure 2.1).1
Strong growth should continue in East Asiaeven as China’s spectacular growth rates ease,and in Europe and Central Asia as the benefitsof EU accession continue for several countriesin the region. Elsewhere, ongoing reformsshould ensure a better investment climate andstable macroeconomic environment—particu-larly in South Asia, where the average annualincrease in per capita income is expected toexceed 4 percent over 2005–15.2 After variousdifficulties in recent years, including conta-gion from Argentina’s long crisis, per capitagrowth in Latin America is expected to aver-age nearly 2.5 percent a year. Although Sub-Saharan Africa’s performance has improvedsince the mid-1990s (see below), the regioncontinues to lag in terms of economic growth.
C H A P T E R 2
20 G L O B A L M O N I T O R I N G R E P O R T 2 0 0 5

If these projections hold, the incomepoverty MDG will be achieved globally.Worldwide, the poverty headcount index willfall from 28 percent in 1990 to 10 percent in2015, and the number of people living on lessthan $1 a day will fall from 1.22 billion to622 million (table 2.1). These achievementswill largely reflect successes in China andIndia, which contained most of the world’spoor people in 1990 but where incomegrowth has since accelerated and remainedhigh. In Europe and Central Asia, where therate of poverty is relatively low, the increasein poverty that accompanied the sharp dropin incomes in the early 1990s has beenreversed, as it has in Latin America.
Still, many individual countries are not ontrack to achieve the poverty goal, includingmost countries in Sub-Saharan Africa. Evenin regions with strong overall performanceand prospects for achieving the povertyMDG, some countries need to substantiallyaccelerate progress, such as Cambodia andPapua New Guinea in East Asia. In somelarge middle-income countries the nationalpoverty rate is low, but some subnationalregions continue to have large concentrationsof poverty, such as inland western provincesin China, some southern states in Mexico,and the northeast region of Brazil.3
In Sub-Saharan Africa, reaching the povertygoal will require a substantial acceleration in
S P U R R I N G A N D S U S T A I N I N G E C O N O M I C G R O W T H
G L O B A L M O N I T O R I N G R E P O R T 2 0 0 5 21
–2
–1
0
1
2
3
4
5
6
7
8
2005–15
2001–041991–2000
Middle-income
countries
Low-income
countries
Sub-SaharanAfrica
South AsiaMiddleEast &NorthAfrica
LatinAmerica & Caribbean
Europe &Central
Asia
East Asia& Pacific
Percent per yearReal GDP per capita growth by region, 1991–2015
FIGURE 2.1 Growth prospects are promising, but wide regional disparities remain
Source: World Bank staff estimates.

income growth or a significant increase in thepoverty elasticity of growth. While the recentpickup in growth has improved prospects, theeconomic stagnation of the early 1990s causedpoverty rates—already the highest in the worldin 1990—to increase even further by 2001 (fig-ure 2.2). Household surveys, which are avail-able for 28 countries (accounting for 78percent of the region’s population and 87 per-cent of its GDP), suggest that the weightedaverage annual growth in per capita incomerequired to achieve the income poverty goal isabout 5 percent (table 2.2). Of these countries,Cameroon, Ethiopia, Senegal, South Africa,and Swaziland have a required per capitagrowth rate of less than 3 percent a year, leav-ing them well positioned to meet the povertygoal. Also close are Mauritania and Mozam-bique, where the required per capita growthrate is less than 3.5 percent a year. But togetherthese seven countries contain less than a quar-ter of the population of Sub-Saharan Africa.
Ensuring that Sub-Saharan Africa makessignificant progress toward the incomepoverty goal will require substantial effortsfrom countries in the region and all theirdevelopment partners. For a successful exam-ple the region might look to South Asia,
where similar initial disadvantages—includ-ing a high incidence of conflict—and similarincome levels have not prevented rapidprogress toward the MDGs. In South Asia animproving investment climate and strongerpolicies have sustained rapid economicgrowth since 1990 and made significantinroads into reducing poverty. Importantdevelopments in service delivery, such as pro-vision of basic services by nongovernmentalorganizations (NGOs) and the private sector,have also contributed to the MDGs in someSouth Asian countries. Still, sustaining andaccelerating economic growth, increasing theeffectiveness of public spending, making ser-vices work for all people, and dealing withlagging regions and countries remain vastchallenges in South Asia (box 2.2).
Africa’s Growth Record
Although Sub-Saharan Africa’s performancehas recently improved, its overall economicrecord over recent decades presents a somberpicture.4 Since 1980 real per capita GDPgrowth has been lower than in other develop-ing regions, and growth rates have been morevolatile (figure 2.3).5 Of the 45 Sub-Saharan
C H A P T E R 2
22 G L O B A L M O N I T O R I N G R E P O R T 2 0 0 5
TABLE 2.1 Over the next 10 years growth is expected to rise and poverty fall around the world (percent unless otherwise indicated)
Population living on less than $1 a day
Average annual growth Number ofrate, 2005–15 Headcount index people (millions)
Region Per capita GDP GDP 1990 2001 2015 1990 2001 2015
East Asia and Pacific 5.5 6.3 29.6 14.9 0.9 472 271 19China 6.0 6.7 33.0 16.6 1.2 375 212 16
Europe and Central Asia 3.6 3.7 0.5 3.6 0.4 2 17 2Latin America and the Caribbean 2.4 3.6 11.3 9.5 6.9 49 50 43Middle East and North Africa 2.4 4.2 2.3 2.4 0.9 6 7 4South Asia 4.2 5.6 41.3 31.3 12.8 462 431 216Sub-Saharan Africa 1.7 3.6 44.6 46.4 38.4 227 313 340
Average/total 3.6 4.8 27.9 21.1 10.2 1,219 1,089 622Excluding China 2.8 4.2 26.1 22.5 12.9 844 877 606
Source: World Bank staff estimates.

S P U R R I N G A N D S U S T A I N I N G E C O N O M I C G R O W T H
G L O B A L M O N I T O R I N G R E P O R T 2 0 0 5 23
50
1990
14.90.9
14.8
29.6
1995 2000 2005 2010 2015
1990 2001 2015 Actual and forecast Path to goal
40
30
20
0
10
50
1990
3.6 0.40.3
0.5
1995 2000 2005 2010 2015
40
30
20
0
10
50
1990
9.5
5.76.9
11.3
1995 2000 2005 2010 2015
40
30
20
0
10
50
1990
2.40.9
1.22.3
Num
ber
of p
eopl
e liv
ing
onle
ss th
an $
1 a
day
Num
ber
of p
eopl
e liv
ing
onle
ss th
an $
1 a
day
1995 2000 2005 2010 2015
40
30
20
0
10
50
1990
31.3
12.8
20.7
41.3
1995 2000 2005 2010 2015
40
30
20
0
10
50
1990
46.4
38.4
22.3
44.6
1995 2000 2005 2010 2015
40
30
20
0
10
Goal
Europe & Central Asia
Middle East & North Africa South Asia
East Asia & Pacific Latin America & the Caribbean
Sub-Saharan Africa
FIGURE 2.2 Most regions will reach the poverty MDG by 2015, but Sub-Saharan Africa is seriously off track
Source: World Bank staff estimates.
TABLE 2.2 Many Sub-Saharan countries require rapid growth to achieve the income poverty MDG
Share of Share ofRequired growth of Population, 2000 Sub-Saharan Sub-Saharan GDP,per capita GDP, 2005–15 Number of countries (millions) population (percent) 2000 (percent)
< 2 percent 1 9.5 1 22 –3 percent 4 124.5 19 523–4 percent 2 20.2 3 14–6 percent 4 44.4 7 5> 6 percent 17 315.4 48 27
Total 28 514.0 78 87
Source: World Bank staff estimates.Note: For the 28 countries in this sample, the weighted average required growth in per capita GDP is 5.2 percent a year.

countries, only 5 consistently recorded real percapita growth rates above 2 percent a year:Botswana, Cape Verde, Mauritius, Seychelles,and Swaziland.6 Moreover, economic disrup-tions have been widespread, with nearly three-quarters of the region’s countries recording atleast one year of per capita growth lower than
–10 percent. Consequently, Africa’s real incomeper capita has steadily declined relative to otherregions, and is roughly the same as in the mid-1970s (figure 2.4).
At the same time, the region’s income dis-tributions may have become more unequal.Empirical estimates indicate that inequality in
C H A P T E R 2
24 G L O B A L M O N I T O R I N G R E P O R T 2 0 0 5
With per capita income averaging $460 a year, the eight countries of South Asia—Afghanistan,Bangladesh, Bhutan, India, Maldives, Nepal, Pakistan, and Sri Lanka—are home to nearly 40 per-cent of the world’s people living on less than $1 a day. But since 1990 the region has achieved annualGDP growth of nearly 5.5 percent, helping to reduce poverty significantly. For example, India—theregion’s largest country, with a population of more than 1 billion people—has reduced its povertyrate by 7–10 percentage points since 1990. Most other countries in the region have registered sim-ilarly significant reductions. Two notable exceptions are Afghanistan, which is emerging fromdecades of conflict, and Pakistan, where poverty has stagnated at around one-third of the popula-tion.
Improving the delivery of human development and key related services has also been instrumentalin boosting MDG-related outcomes and prospects. Three places in South Asia stand out as havingespecially good MDG indicators for their income levels. Sri Lanka and the Indian state of Kerala havestrong records of good performance (similar to those in high-income countries), reflecting the prior-ity that successive governments have long given to investing in human development. And Bangladeshhas shown remarkable progress on many of the MDGs despite its low income, high poverty (secondonly to Afghanistan in the region), adverse initial conditions, high population density, contentious pol-itics, and vulnerability to natural disasters. Bangladesh’s success has owed much to an effective scal-ing up of basic services based largely on partnerships between the public sector and NGOs and aresulting high degree of community involvement, local innovation, and experimentation.
Although reducing poverty remains a huge challenge for South Asia, the income poverty MDGis within reach, as continued high economic growth will raise incomes, widen economic opportu-nities, and create jobs for poor people. But sustaining rapid growth will require further improve-ments throughout the region in the investment climate, basic infrastructure, and delivery of basicservices within a framework of macroeconomic (especially fiscal) stability.
A number of other MDGs are also within the region’s reach if service access and delivery improvefor poor people—as shown by the region’s success stories. Yet despite substantial public spending,health, education, water, and sanitation services continue to fail poor people in some countries andstates. In many cases this is due to the fragile accountability between users, providers, politicians,and policymakers caused by ineffective public institutions, poor focus on outcomes and incentives,political clientelism and patronage, and difficulty of monitoring and supervision. But with democ-racy firmly rooted across the region, the devolution of political power to lower levels of govern-ments is proceeding. While progress varies, decentralizing resources and responsibilities to localproviders and communities holds prospects for better service delivery. Against this backdrop theuniversal primary education, gender equality, child mortality, and major disease MDGs appearwithin reach of most South Asian countries, with only Afghanistan, Pakistan, and poorer states inIndia remaining off track unless progress quickens substantially.
Source: World Bank South Asia Vice Presidency.
BOX 2.2 South Asia shows that stronger growth and better service delivery are key to the MDGs
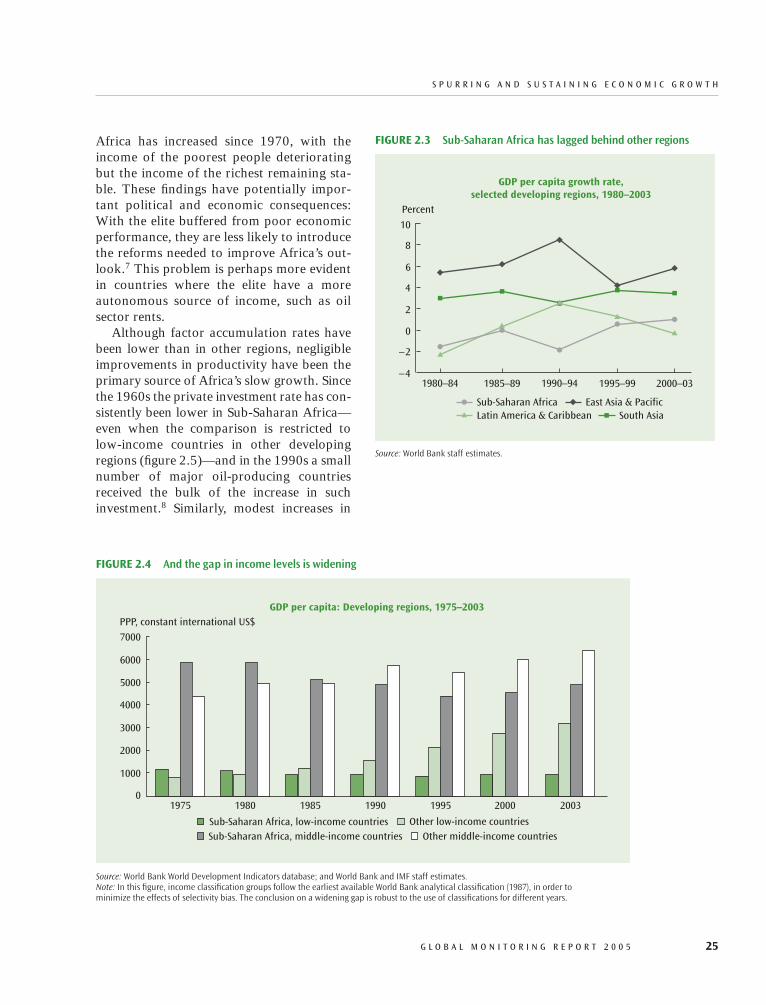
Africa has increased since 1970, with theincome of the poorest people deterioratingbut the income of the richest remaining sta-ble. These findings have potentially impor-tant political and economic consequences:With the elite buffered from poor economicperformance, they are less likely to introducethe reforms needed to improve Africa’s out-look.7 This problem is perhaps more evidentin countries where the elite have a moreautonomous source of income, such as oilsector rents.
Although factor accumulation rates havebeen lower than in other regions, negligibleimprovements in productivity have been theprimary source of Africa’s slow growth. Sincethe 1960s the private investment rate has con-sistently been lower in Sub-Saharan Africa—even when the comparison is restricted tolow-income countries in other developingregions (figure 2.5)—and in the 1990s a smallnumber of major oil-producing countriesreceived the bulk of the increase in suchinvestment.8 Similarly, modest increases in
S P U R R I N G A N D S U S T A I N I N G E C O N O M I C G R O W T H
G L O B A L M O N I T O R I N G R E P O R T 2 0 0 5 25
Percent
1980–84 1985–89 1990–94 1995–99 2000–03
GDP per capita growth rate,selected developing regions, 1980–2003
–4
–2
0
2
4
6
8
10
Sub-Saharan Africa East Asia & PacificLatin America & Caribbean South Asia
FIGURE 2.3 Sub-Saharan Africa has lagged behind other regions
Source: World Bank staff estimates.
7000
6000
5000
4000
3000
2000
1000
0
Sub-Saharan Africa, middle-income countriesSub-Saharan Africa, low-income countries Other low-income countries
Other middle-income countries
1975 1980 1985 1990 1995 2000 2003
GDP per capita: Developing regions, 1975–2003PPP, constant international US$
FIGURE 2.4 And the gap in income levels is widening
Source: World Bank World Development Indicators database; and World Bank and IMF staff estimates.Note: In this figure, income classification groups follow the earliest available World Bank analytical classification (1987), in order tominimize the effects of selectivity bias. The conclusion on a widening gap is robust to the use of classifications for different years.

education enrollments have implied a smallercontribution from increased human capitalthan for most other developing regions.9 Butthe key source for the region’s weak economicperformance was that total factor productiv-ity growth was nonexistent between 1960 and2002—unlike in other developing regions,where such efficiency improvements played animportant role in supporting growth.10
On a more positive note, since the mid-1990s economic growth has improved to lev-els last recorded in the region in the early1970s. Since 1995 more than 15 Sub-Saharancountries have persistently recorded real percapita growth rates above 2 percent a year,compared with only 5 in 1960–94. Thisimprovement has benefited a range of coun-tries, including low- and middle-incomecountries and even those that recently suf-fered conflict. On the whole, though, oil-based economies have enjoyed the bestperformance, with real per capita growth ofclose to 4 percent a year since the mid-1990s.
What explains Sub-Saharan Africa’s pooreconomic record—and incipient recovery?
On the former, it has suffered, and continuesto suffer, from a number of major disadvan-tages relative to other regions. It has a dis-proportionately large number of landlockedcountries that, given weak regional infra-structure, are unduly dependent on tradewith their immediate neighbors. Many coun-tries are heavily dependent on low-value agri-culture and therefore vulnerable to climaticfluctuations, including periodic droughts. Itspopulation endures high rates of malaria,HIV/AIDS, and other communicable dis-eases.11 Since 1970 one-quarter of its coun-tries have experienced civil conflict. And likeother developing regions, Sub-Saharan Africahas been handicapped by lack of access for itsexports to markets of developed countriesand vulnerability to natural disasters andterms-of-trade shocks.
Still, there is a general view that drivers ofgrowth operate in much the same way inAfrica as elsewhere.12 Critically, on the maindimensions of macroeconomic and structuralpolicies as well as the effectiveness of institu-tions, Sub-Saharan Africa tends to underper-form relative to other developing regions. TheWorld Bank’s Country Policy and Institu-tional Assessment (CPIA) ratings confirmthat Sub-Saharan Africa achieves a loweraverage score than other developing regionson each of the main categories assessed: eco-nomic management, structural policies, socialinclusion and equity policies, and public sec-tor management and institutions. In addition,macroeconomic instability—as measured, forexample, by the standard deviation of con-sumer price inflation or the parallel marketexchange rate—has tended to be higher inAfrica than most developing regions.13 Evenwhen the comparison is restricted to low-income countries in other regions, the qualityof macroeconomic policies is still lower inAfrica (table 2.3).
Empirical studies confirm that weak macro-economic policies and governance have had anegative impact on growth in Sub-SaharanAfrica. These studies indicate that in recentdecades growth could have been significantly
C H A P T E R 2
26 G L O B A L M O N I T O R I N G R E P O R T 2 0 0 5
Percent of GDP
1965–69 1970–74 1975–79 1980–84 1985–89 1990–94 1995–99 2000–03
Private investment in Sub-Saharan Africa andlow-income countries in other regions, 1960–2003
7
9
11
13
15
17
19
East Asia & Pacific Sub-Saharan AfricaSouth Asia Latin America & Caribbean
FIGURE 2.5 Lower investment rates in Sub-Saharan Africa have been a source of low growth
Sources: IMF, World Economic Outlook; World Bank, World Development Indicators database; and IMF staff estimates.

raised by better fiscal policies (including lowergovernment consumption and smaller fiscaldeficits), policies that promoted human capitalformation and private investment, andstronger institutions. Estimates of the addi-tional growth that Africa would have enjoyedwith the adoption of policies, institutions, andrates of factor accumulation similar to those inother regions range from 2–8 percentagepoints a year.14
One explanation for which there is no sys-tematic empirical evidence is the view thatpoverty traps explain Sub-Saharan Africa’spoor economic record. Proponents of suchexplanations argue that low productivity andsavings rates make it difficult for poor countriesto rise past a threshold income level. This logicis plausible, given the persistence of poverty. Ingeneral, however, neither macroeconomic normicroeconomic evidence tends to support theexistence of such traps. Moreover, there is littleevidence of the type of productivity and savingsbehavior needed at low income levels to gener-ate poverty traps (box 2.3).
Empirical evidence also offers some wordsof caution on the commonly proposed solu-tion for poverty traps—namely, large exter-nal resource transfers. Certainly, largeincreases in foreign assistance are needed inmany Sub-Saharan countries, including to
allow significant increases in key public ser-vices (see chapter 5). Moreover, aid increasescomplement improvements in policy, institu-tions, and the international environment. Butthe apparently limited growth impact of aid,combined with its diminishing returns,implies that by itself aid does not constitutea growth strategy.15
Experiences with oil windfalls in Sub-Saharan Africa in the late 1970s illustratethat increases in public investment driven byforeign inflows are also unlikely, in them-selves, to lead to sustained growth. Because oflarge increases in oil production and prices,countries such as Congo enjoyed large wind-falls over nearly 10 years starting in the late1970s. But the medium-run impact on livingstandards was negligible at best (box 2.4).This example is particularly relevant becauseoil rents share many characteristics with andhave similar macroeconomic effects as for-eign assistance flows.
Since the 1960s Sub-Saharan Africa hasalso experienced widespread conflict andendured the associated heavy costs (figure 2.6).In the region’s low-income countries the typi-cal civil war has lasted about seven years andcaused GDP to decline (relative to the coun-terfactual) by more than 2 percentage pointsfor each year of conflict. It has typically taken
S P U R R I N G A N D S U S T A I N I N G E C O N O M I C G R O W T H
G L O B A L M O N I T O R I N G R E P O R T 2 0 0 5 27
TABLE 2.3 Macroeconomic policies are weaker in Sub-Saharan Africa than in other low-income countries (percentage of countries)
Governance andtransparency
Composition Consistency Public in monetaryFiscal of public Monetary of macro sector and financial Trade
Region/rating policy spending policy policies governance institutions regime
Sub-Saharan AfricaUnsatisfactory 42 68 17 30 46 30 14Good 22 3 72 46 14 52 73
Other low-income countriesUnsatisfactory 19 57 7 14 26 7 5Good 48 10 74 55 14 63 86
Source: IMF staff assessments.Note: Policies are assessed as unsatisfactory, satisfactory, or good. Percentages do not sum to 100 because the intermediate category—satisfactory—is not shown.

C H A P T E R 2
28 G L O B A L M O N I T O R I N G R E P O R T 2 0 0 5
A popular and plausible explanation for Africa’s persistent underdevelopment is that much of thecontinent is caught in a trap: Poverty leads to low savings, low investment productivity, poorhealth, and other features that cause poverty to persist (Sachs and others 2004; Collier 2004). Butthere is little empirical work testing for poverty traps, and much of what exists tends not to sup-port the hypothesis.
The persistence of poverty across countries is consistent with the hypothesis. A number of papershave documented that over the past 50 years the cross-country distribution of per capita incomeshas become bimodal, with a group of countries clustered around quite a low income level. (SeeAzariadis and Stachurski 2004 for links between models of poverty traps and this kind of empiri-cal evidence; Quah 1993a, 1993b, 1996, and 1997 for the evidence; and Kremer, Onatski, and Stock2001 for a critique. Bloom, Canning, and Sevilla 2003 also provide closely related cross-countryevidence.) Other evidence comes from looking at the dynamics of individual incomes. Many mod-els of poverty traps suggest that individuals receiving large income shocks may take a long time torecover—and if their incomes fall below a certain threshold, they may never recover. But Lokshinand Ravallion (2004) carefully examine household data from Hungary and Russia, and concludethat there is no evidence of the kind of “threshold effects” associated with models of poverty traps.
Reduced-form evidence such as this can demonstrate the persistence of poverty but not thenature of the underlying mechanism that may be creating a trap. Without such information it is dif-ficult to distinguish a poverty trap from persistence in the determinants of poverty, or to formulatean appropriate policy response. Several recent studies have looked for evidence of particular mech-anisms generating poverty traps. One such mechanism involves financial market imperfections. Ifthe upfront cost of starting a small business is large, and poor individuals cannot borrow to financethis investment, they will be unable to reap the benefits of self-employment. McKenzie andWoodruff (2004), using data on microenterprises in Mexico, show that the costs of starting such abusiness are surprisingly small—averaging just two weeks’ income for a typical low-wage Mexicanworker. This finding casts doubt on the idea that fixed costs, combined with financial frictions, areresponsible for poverty traps.
Another possible mechanism is that productivity is low at low levels of development. This maybe because it is difficult to reach minimum efficient scales of production, or because complemen-tary investments in public goods (such as infrastructure) are inadequate in poor countries. Oncethese thresholds are crossed, it is possible that productivity will increase sharply, allowing countries
BOX 2.3 Do poverty traps account for Africa’s underdevelopment?
about 14 years after the end of a conflict for acountry to recover to its prewar growth path.In addition, substantial spillover costs under-mine economic performance in neighboringcountries. In the typical low-income Africancountry, with a purchasing power parity valueof GDP of around $20 billion, the presentvalue of the cost of conflict is about $50 bil-lion. Most costs arise in the form of externali-ties, accruing either to people in the future orto neighbors.16 Crucially, the risk of conflicttends to be strongly affected by low economicperformance (box 2.5).
Sub-Saharan Africa’s recent recovery hasbeen supported by improvements in keymacroeconomic indicators, particularly in thefastest-growing economies, and some strength-ening of political institutions. Across the conti-nent, macroeconomic indicators have improvedsince the mid-1990s: price inflation is at near-historic lows, distortions in exchange rateshave been mostly eliminated, fiscal deficits arelower, and export volumes have increased.School enrollments are also increasing, alongwith budget allocations to both education andhealth. The percentage of countries holding

competitive elections has increased, and theincidence of conflict appears to be declining.
Policy improvements since the mid-1990shave been particularly striking among thefastest-growing Sub-Saharan countries. Rela-tive to slower growers, these countries have amuch lower average inflation rate, smaller fis-cal deficits (despite similar spending levels),and significantly higher trade openness (mea-sured by the share of exports and imports inGDP). Moreover, growth in productivity wasa robust 2.4 percent for the fastest growers,compared with close to zero for the others.
Growth Accelerations
To achieve the MDGs, the central challengefacing Africa is generating at least 10 years ofsharply accelerated growth. Such growthaccelerations, while not uncommon, haveproven somewhat more elusive in Sub-SaharanAfrica (table 2.4).17 Between 1960 and 2003,across developing countries as a whole, theprobability of a growth acceleration starting ina country in any year averaged 3.3 percent,while 37 percent of observed country yearsoccurred during an acceleration episode. But in
S P U R R I N G A N D S U S T A I N I N G E C O N O M I C G R O W T H
G L O B A L M O N I T O R I N G R E P O R T 2 0 0 5 29
to reach much higher income levels. Kraay and Raddatz (2005) embed this mechanism in a stan-dard growth model and show that for this mechanism to generate a poverty trap, productivity mustincrease (implausibly) sharply with the level of development. In particular, the authors show that ifthis mechanism is at work, one should expect to see increasing returns to scale much larger than areever seen in the extensive empirical literature on estimating production functions. Somewhat moredirectly, McKenzie and Woodruff (2004) find in their Mexican data that returns to investment arevery high even for microenterprises.
Poverty traps might also arise because of low savings rates in poor countries. If many householdslive at the margins of subsistence, they will be unable to save much. In addition, public saving mightbe low in poor countries because governments have difficulty with tax collection. Low savings ratesmay translate into such low investment rates that countries are unable to accumulate significantstocks of productive assets per capita. And if savings rates only begin to increase at much higherlevels of development, countries that start out poor may be stuck in a poverty trap.
Kraay and Raddatz (2005) confirm that savings rates tend to increase with income—but not ina way that would explain the existence of poverty traps for most African countries. The authorsalso calibrate a growth model with subsistence consumption and find that the impact on saving andgrowth is substantial only for countries that start out close to subsistence levels. But the observeddispersion in per capita incomes, which is significant even in a poor region such as Sub-SaharanAfrica, implies that the role of subsistence consumption can explain low saving and growth in onlya few of the region’s poorest countries.
There are also potential poverty traps based on self-reinforcing dynamics in the area of gover-nance. For example, there is evidence that civil wars are both a consequence and a cause of lowincome, creating the possibility of a conflict trap (Collier and others 2003). There are also reasonsto believe that high corruption creates self-perpetuating expectations of future corruption. The roleof such mechanisms in generating stable poverty traps in growth models has not been fully studied.But in these cases, large increases in foreign aid might actually be counterproductive, increasingincentives and opportunities for corruption and conflict. Tackling these underlying dysfunctionsdirectly must be done in parallel with any large increases in aid (Collier 2004).
Source: Kraay and Raddatz (2005).
BOX 2.3 Do poverty traps account for Africa’s underdevelopment?(continued)

C H A P T E R 2
30 G L O B A L M O N I T O R I N G R E P O R T 2 0 0 5
In the 1970s the Republic of Congo began to benefit from a large rise in oil rents as internationaloil prices surged and national oil production increased. In 1979–86 oil prices averaged more than$30 a barrel (up from $14 in 1978 and $2 in 1970), and by 1986 national production reached120,000 barrels a day (up from 65,000 in 1980). Suddenly the Congo was much richer and the statetreasury—as the main local beneficiary of the enclave oil sector—experienced a surge in revenues.The ensuring increase in government spending helped to generate a temporary growth acceleration(see figure below, and Hausmann and others 2004).
The failure to sustain the growth spurt of the early 1980s was apparently not due to appropria-tion of the rents for consumption. The Congo significantly boosted public investment—indeed,between 1980 and 1986 (again taking 1979 as the base year) the increase in public capital spendingwas equivalent to 93 percent of the additional government oil revenues. The impact on social indi-cators was positive, including a surge in electricity consumption and school enrollments. Ultimately,however, weak policies and institutions (including a highly overvalued real exchange rate and lowgovernance ratings) did not sustain the growth spurt. Real per capita income, which had risen toalmost $1,000 in the mid-1980s, fell to less than $900 by 2000 (measured in purchasing power par-ity terms and constant dollars), and the improvements in social indicators proved temporary. Signif-icantly, aid flows increased throughout the oil boom until reaching a peak, at just over $70 per capita,in the mid-1990s.
Source: IMF (2004).Note: The use of five-year moving averages is intended to capture the effects of faster financial than physicalexecution and of the usual lags in bringing projects fully online.
0
20
25
30
35
40
–5
5
15
25
Public investment (percent of GDP, left axis)
Oil price (US$ per barrel, right axis)
Real non-oil GDP growth (annual percent change, left axis)
0
15
10
5
1975
Percent US$
1977 1979 1981 1983 1985 1987 1989 1991 1993 1995 1997 1999 2001 2003
Republic of Congo: Oil rents, 1975–2003(5-year moving averages)
BOX 2.4 A gush of oil rents and surge in public investment do not ensure sustained growth

S P U R R I N G A N D S U S T A I N I N G E C O N O M I C G R O W T H
G L O B A L M O N I T O R I N G R E P O R T 2 0 0 5 31
Conflict tends to have multiple causes. Typically, an incipient rebel group gets a charismatic leader,the government mishandles counter-insurgency, and a neighboring government sees an opportunityfor mischief. But susceptibility to such events is strongly affected by economic circumstances—namely, low income, low growth, dependence on natural resource exports, and vulnerability toadverse shocks. A legacy of previous conflict also increases the probability of conflict, possiblybecause the only organizations that flourish are those that profit from violence. The role of aid andeconomic policy is limited to their impact on the growth rate. If Côte d’Ivoire conforms to the globalpattern, its prospects are for prolonged and intermittent violent conflict.
Postconflict experience is highly diverse. Some economies recover rapidly, while others continueto decline. Recent analysis finds that choices of policy, institutions, and governance are radicallymore important for growth during the postconflict decade than at other times: The same improve-ment (as measured by country policy and institutional assessments) generates much more growthduring the postconflict decade. Aid also appears effective in raising growth during the postconflictdecade. But the peak effect of aid occurs in the middle of the decade. In the first few years, althoughneeds are great, capacity to absorb project aid is probably rather limited. Hence an early priority isto rebuild the institutions that manage the spending process.
Because the risk of repeat conflict is high, policy needs to be directed to managing it. Postcon-flict governments typically maintain high military spending—almost at conflict levels—resulting invery small peace dividends. This can be a major policy error because high military spending in post-conflict situations can increase the risk of further conflict. Two good models are Mozambique,where the government radically cut military spending, and Sierra Leone, where peace has been guar-anteed not by domestic military spending but by robust external peacekeeping. In addition, strongpolitical commitment to economic development and social inclusion is fundamental.
Sources: Collier and Hoeffler 2002b, 2004; Miguel, Satyanath, and Sergenti 2004.
BOX 2.5 Political commitment is central to breaking the conflict cycle
Number of wars
1960 1964 1968 1972 1976 1980 1984 1988 1992 1996 2000
Incidence of war, 1960–2002
0
4
2
6
8
10
12
14
Sub-Saharan Africa All other regions
FIGURE 2.6 Sub-Saharan Africa has suffered from many conflicts
Source: World Bank Staff estimates.

Sub-Saharan Africa the annual probability ofsuch an episode starting was just 2.4 percent,and only 20 percent of country years occurredduring such an episode.18
Not only has it been more difficult to initi-ate sustained growth in Sub-Saharan Africa,but safeguarding those advances has also beenmore problematic. Growth accelerationepisodes in Sub-Saharan Africa have been morelikely to be followed by a period of negative percapita growth: of the 23 accelerations thatended before 1998, only 7 were followed by aperiod of positive growth.19 This observation isin sharp contrast to the post-acceleration expe-rience in other regions—such as Latin Ameri-can and the Caribbean, where 20 of 33acceleration periods were followed by positiveper capita growth.
On a more positive note, in the midst ofthe general slump of the 1990s, when theaverage per capita growth rate was negativefor the region as a whole, some successesbegan to emerge in Sub-Saharan Africa. Overthe past decade or so Africa saw a fasterincrease in the frequency of growth episodes,and in the proportion of country years spentin such episodes, than did other regions (withthe exception of Europe and Central Asia).Average growth performance during theserecent African episodes was similar to that ofother regions. In terms of episodes ending inthe 1990s or ongoing at the end of 2003, theaverage annual per capita growth rate was
about 5 percent in Sub-Saharan Africa (fig-ure 2.7).
The experience on the duration of growthaccelerations raises a note of caution aboutepisodes under way in Sub-Saharan Africa.Historically, 75 percent (44 percent) ofepisodes in low-income (middle-income) Sub-Saharan countries end before their 10th
anniversary. At the end of 2003 the averagelength of the episodes under way was 8.5years for low-income countries and close to20 years for middle-income countries.
Initial analyses of the determinants ofgrowth accelerations have found that theseepisodes are not easily amenable to explana-tion or prediction.20 Still, it is possible toidentify some policy and institutional mea-sures that are significant correlates with theirinception (box 2.6). The analyses suggest thatlower inflation, higher fiscal expenditures oninvestment (within a given spending enve-lope), higher private investment, and bettergovernance are associated with the beginningof growth accelerations, particularly thosethat last longer.
Macroeconomic Policy: Stability,Sustainability, and SpaceRecent progress toward macroeconomic sta-bility across Sub-Saharan Africa has begun toremove obstacles to vigorous economicgrowth, and growth has picked up in some
C H A P T E R 2
32 G L O B A L M O N I T O R I N G R E P O R T 2 0 0 5
TABLE 2.4 Growth accelerations have been much less common in Sub-Saharan Africa (percent)
Probability of growth Proportion of country yearsepisode starting occurring in a growth episode
Sub-Saharan Europe and Sub-Saharan Europe andPeriod Africa Central Asia Other Africa Central Asia Other
1960s 5.5 6.7 8.1 18.8 42.1 42.61970s 1.8 0.0 2.7 25.7 14.3 50.21980s 0.9 2.7 2.5 11.8 13.4 30.51990s 3.3 8.2 3.2 20.2 30.2 32.22000–03 ... ... ... 28.4 60.2 9.7All periods 2.4 2.5 3.3 20.0 32.5 36.7
Sources: Penn World Tables database; IMF, World Economic Outlook; and IMF staff calculations.

countries. On the whole, however, the regioncontinues to suffer from low growth. Keymacroeconomic issues include the sustain-ability of the fiscal stance and the availabilityof fiscal space for additional investments insuch crucial areas as physical infrastructureand human capital.
Underlying this discussion is the notion thata stable policy framework is a crucial determi-nant of an enabling macroeconomic environ-ment. Moreover, the relationship between thepolicy framework, macroeconomic stability,and economic growth is intermediated by theinstitutional setting.21 Ultimately, highergrowth is the result of profitable investmentopportunities, whose feasibility depends notjust on macroeconomic predictability but alsoon the state of the microeconomy and the(enabling) role of institutions. Macroeconomicstability is thus a necessary but insufficientcondition for sustained growth.
Over the medium term it is crucial that fis-cal policy be perceived as sustainable. The fis-cal stance is sustainable when it is unlikelythat wrenching policy adjustments will berequired to maintain stability and avoid cri-sis. Such a policy configuration increases thepredictability of the macroeconomic environ-ment and ensures the long-term viability of anoninflationary growth path. Policy stabilitycontributes to macroeconomic stability byremoving the effects of destabilizing policiesand enabling a stabilizing response to exoge-nous shocks.
In low-income countries fiscal sustainabil-ity has two crucial dimensions: reliance onexternal concessional financing; and the needto limit recourse to domestic financing. Thehigh degree of concessionality of externalfinance implies that, as long as the productiv-ity of public investment is reasonable and thecountry does not experience large adverseshocks, further external finance should notthreaten sustainability.22 With underdevel-oped financial sectors, most governments inSub-Saharan Africa do not have the option ofraising substantial sums from domestic capi-tal markets, and the growth of domesticcredit (and therefore money supply and
prices) tends to be closely linked to govern-ment financing requirements.23
Additionally, the effect of governmentspending on growth depends on the macro-economic context and the composition ofexpenditures. If macroeconomic stability islacking, even productive government spend-ing can, on net, have an adverse effect ongrowth, due to negative macroeconomic con-sequences. On the other hand, a structure ofspending that is financed in a sustainablemanner and that favors growth-sensitive sec-tors can be expected to increase factor pro-ductivity and crowd in private investment,including by reducing private sector costs.
Targeting fiscal sustainability while payingattention to the structure and quality of fiscalspending is fully consistent with the goal ofpromoting productive public investment. ForSub-Saharan Africa, further progress towardfiscal sustainability will be necessary to securerecent gains, and the current structure ofspending could be made more commensuratewith the growth imperative. Institutionalizingimprovements in macroeconomic policy maybe a quick way to change perceptions.
S P U R R I N G A N D S U S T A I N I N G E C O N O M I C G R O W T H
G L O B A L M O N I T O R I N G R E P O R T 2 0 0 5 33
Percent
1960s 1970s 1980s 1990s & later
Acceleration episodes, in developing regions, 1960–2003(average per-capita growth rates by ending date)
3.0
3.5
4.0
4.5
5.0
5.5
Sub-Saharan Africa Other
FIGURE 2.7 Annual growth rates during accelerations areimproving in Sub-Saharan Africa
Source: IMF staff calculations.

C H A P T E R 2
34 G L O B A L M O N I T O R I N G R E P O R T 2 0 0 5
While statistical models of growth accelerations have modest explanatory power, there is some evi-dence that improvements in key policies and institutions tend to accompany the onset of such accel-erations—particularly in the case of longer episodes. Comparing the behavior of key policy andinstitutional variables at the onset of growth accelerations with the preceding five-year period indi-cates that rapid increases in growth tend to be accompanied by a lower level of inflation, a less dis-torted exchange rate, and an improved perception of law and order. On the other hand, there is noevidence of major changes in investment, exports, terms of trade, foreign aid, or savings.
Over the lifetime of growth accelerations, there is improvement in a broader set of indicators.While this result would generally be expected for macroeconomic variables, including private invest-ment and the fiscal balance, it is perhaps surprising in the case of institutions, which are generallythought to be relatively stable. During a typical 10–12 year acceleration, indicators of politicalregime, bureaucratic quality, and law and order improve by a statistically significant amount, rais-ing the possibility of a virtuous circle whereby higher growth facilitates institutional reform.
Just as critical as spurring growth accelerations is sustaining them. The improvements observedduring accelerations are consistent with the idea that ongoing reforms are necessary to sustain suchaccelerations, but it is also possible that faster growth enables policy improvements. Comparing thedegree of upfront improvements in indicators across longer episodes (those lasting at least nineyears) and shorter episodes (those lasting less than eight years) sheds some light on what tends tomake accelerations durable.
Upfront improvements in macroeconomic indicators are more generalized for longer thanshorter episodes (see table). First, the improvements in inflation and the exchange rate that tend toaccompany the onset of accelerations are stronger for longer accelerations. Second, longer episodes
tend to be more private sector–led, withlower government consumption and higherprivate investment. Third, there is anupfront improvement in the perception ofcorruption in episodes that turn out to belonger. These results are generally robustacross different groups of countries, includ-ing Sub-Saharan and low-income countries,and similar conclusions emerge when theassessment is made three years into episodesof growth accelerations.
These results offer hope that recentimprovements in these indicators in a numberof Sub-Saharan countries may mean thatongoing African accelerations will provemore sustained than in the past.
Source: IMF staff.Note: For purposes of this analysis, a growth acceleration is deemed to last at least five years (the averageduration exceeds eight years) and to be defined by an increase in annual average per capita GDP growth of atleast 2 percent (accelerating growth) and annual average per capita growth of at least 3.5 percent (rapidgrowth). Accelerations are deemed to end when annual per capita GDP growth dips below an average of 2percent for the subsequent five-year period, or below 3 percent in the year immediately following the periodof acceleration. This is an extension of the definition proposed by Hausmann, Pritchett, and Rodrik (2004).
BOX 2.6 Better macroeconomic policies and stronger institutions are associated with longer growth accelerations
Changes in values of key indicators at the onset of long relative to short acceleration episodes (percent except where noted)
Inflation rate –10.6Government consumption/GDP –4.1Noninterest spending/GDP –4.2Black market premium –39.2Law and order (index) 0.1Corruption (index) 0.6Private investment/GDP 2.5
Note: Numbers in bold indicate statistical significance at the 10 percentlevel. Corruption and law and order are measured on a scale of 1–6,where a higher score indicates less corruption and stronger law and order.

Recent Developments in MacroeconomicPolicy and Stability
Across low-income countries as a whole,macroeconomic policies have improved overthe past decade. Inflation has slowed appre-ciably, and other indicators—such as fiscaland current account deficits—have alsoimproved, though more modestly (table 2.5).Similar patterns have emerged in Sub-Saha-ran Africa. On this basis, to what extent canstabilization in Sub-Saharan Africa, as theregion most in need of a growth payoff, beconsidered a success?
Macroeconomic stability depends heavilyon control of inflation and sound fiscal per-formance, although some definitions of sta-bility also include criteria on growth rates (asan additional measure of internal macroeco-nomic balance) and international reserve lev-els (as a measure of robustness to externalshocks).24 The rationale for the inclusion of afiscal criterion derives from the close linkbetween the fiscal stance and inflation, par-ticularly in an environment where fiscal pol-icy holds sway over monetary policy or wherethe scope for noninflationary domesticfinancing is limited.
Given Sub-Saharan Africa’s heavy relianceon concessional external financing, it seemsappropriate to assess the fiscal contributionto stabilization by monitoring domesticfinancing of the budget deficit, instead of thedeficit itself. Not only does external financinghave less of an impact on inflation than doesdomestic financing, but most of this borrow-ing tends to come with a sizable grant ele-ment, further diluting the applicability of thefiscal balance measure. In this context a forth-coming International Monetary Fund (IMF)study, in defining successful stabilizationefforts in developing countries, measures fis-cal sustainability in terms of limited recourseto domestic financing, proxied by a target ofless than 1 percent of GDP.25
With the recent progress toward price sta-bility, most countries in Sub-Saharan Africa
have reasonably low inflation. During2000–3 the median rate of inflation was 5percent, and only a half-dozen countries(Angola, Eritrea, Liberia, Nigeria, Zambia,Zimbabwe) recorded annual price increasespersistently above 10 percent. But progresson the fiscal front has been less consistent.26
Although domestic financing in Sub-SaharanAfrica averaged close to 1 percent of GDPduring 2001–3, about one-third of countriesin the region exceeded this level. Of those, 12recorded domestic financing ratios persis-tently higher than 3 percent of GDP. In thesecountries further progress on fiscal consoli-dation would appear particularly prudent inorder to safeguard the recent improvementson the inflation front.27
This general assessment disguises consid-erable variation across the region. As agroup, middle-income Sub-Saharan coun-tries have registered substantial progress onmacroeconomic stability since the early1990s.28 These countries have averagedannual per capita growth rates of nearly 4.5percent, and their fiscal positions appearsound. At the end of 2003 their recourse todomestic budget financing stood at close to 1percent of GDP, while their stock of interna-tional reserves reached five months ofimports—levels that would allow flexibilityin the event of unanticipated fiscal chal-lenges.
For low-income Sub-Saharan countries,tangible progress toward stabilization startedto materialize only in the second half of the1990s. But by 2000–3 the picture had bright-ened considerably. Within this group, naturalresource–dependent economies have benefitedmost from recent movements in internationalprices. As a result their fiscal position hasstrengthened, with the primary budget in bal-ance, supplemented by external grants ofalmost 4 percent of GDP. Of potential con-cern, however, these countries remain exposedto international price corrections—anddomestically, recent appreciations in real
S P U R R I N G A N D S U S T A I N I N G E C O N O M I C G R O W T H
G L O B A L M O N I T O R I N G R E P O R T 2 0 0 5 35

exchange rates may weaken the competitiveposition of nonresource sectors, on whichmost people depend. In addition, fiscal policyin these countries has tended to be procyclical,partly a reflection of some unique challenges
imposed on public policy by the nature of oiloperations (box 2.7).
For most of these countries the challenge isto strengthen the fiscal outlook (and stabilizeprices) not just for an interim phase, but for a
C H A P T E R 2
36 G L O B A L M O N I T O R I N G R E P O R T 2 0 0 5
TABLE 2.5 Macroeconomic indicators have generally improved in low-income countries (annual average except where indicated)
Indicator/region 1984–8 1989–93 1994–8 1999–03 2004 2005–9(estimate) (projected)
Inflation (percent, median) a
East Asia and the Pacific 7.1 9.5 8.7 6.1 5.8 3.6Europe and Central Asia 1.2 417.7 233.8 10.2 5.6 4.2Latin America and the Caribbean 4.4 12.6 6.7 3.3 3.9 3.1Middle East and North Africa 14.2 23.1 21.0 6.3 8.6 7.1South Asia 7.7 10.5 8.4 3.7 4.6 4.1Sub-Saharan Africa 9.9 10.6 12.7 5.6 6.5 3.6All low-income countries 6.8 10.8 11.9 4.7 5.0 3.8
Current account balance(percentage of GDP) b
East Asia and the Pacific –1.9 –4.4 –1.5 –1.3 –1.1 –3.1Europe and Central Asia –1.0 –6.4 –11.7 –7.1 –7.7 –2.5Latin America and the Caribbean –10.8 –14.3 –14.1 –12.1 –11.7 –11.3Middle East and North Africa –6.5 –5.4 –1.4 0.3 –3.6 –9.8South Asia –7.2 –5.7 –2.4 –1.3 –2.0 –2.3Sub-Saharan Africa –7.2 –8.5 –9.1 –8.8 –7.7 –6.8All low-income countries –6.1 –8.0 –8.0 –6.9 –6.5 –5.9
External debt (percentage of GDP)East Asia and the Pacific 63.1 69.4 58.5 60.1 56.5 52.3Europe and Central Asia 0.0 14.2 49.8 63.8 49.8 43.6Latin America and the Caribbean 105.8 178.2 92.5 68.0 60.6 58.8Middle East and North Africa 53.4 57.1 68.6 59.9 53.3 48.4South Asia 45.5 50.8 45.1 45.6 46.0 40.1Sub-Saharan Africa 85.9 108.1 136.7 120.5 97.4 84.0All low-income countries 70.6 93.5 99.2 89.6 75.1 66.2
Fiscal balance (percentage of GDP) b
East Asia and the Pacific –8.9 –5.7 –4.0 –5.0 –3.8 –3.5Europe and Central Asia –1.2 –11.1 –7.7 –3.6 –2.0 –0.2Latin America and the Caribbean –7.7 –5.1 –2.4 –5.0 –3.9 –2.8Middle East and North Africa –16.7 –11.2 –6.0 –0.5 –1.8 –8.2South Asia –5.5 –5.0 –4.8 –5.9 –4.9 –4.7Sub-Saharan Africa –6.2 –6.9 –5.5 –5.4 –3.2 –1.3All low-income countries –6.5 –6.9 –5.1 –5.0 –3.3 –2.2
Memorandum item: real per capita GDP growth (percent)
All low-income countries 1.3 –1.3 1.5 1.5 2.8 3.3
Source: IMF, World Economic Outlook database.Note: Averages are calculated as unweighted means of country values.a. Calculated from annual medians, then averaged over five-year periods.b. Includes grants.

G L O B A L M O N I T O R I N G R E P O R T 2 0 0 5 37
Like oil-producing countries elsewhere, those in Sub-Saharan Africa face some sharp challenges. Ata technical level, the main challenges stem from the high volatility and unpredictability of oil pricesand the nonrenewable nature of oil reserves. At an institutional level, the nature of oil operationsraises the social benefit of good governance.
Uncertainty about oil prices translates into uncertainty about fiscal revenues. As a result the fiscalbalance tends to be volatile and unrelated to developments in domestic demand. One of the main con-cerns of policymakers should be insulating the local economy from this volatility. In this context twostandard policy prescriptions are that fiscal policy should be guided by the non-oil primary balance,as a fiscal target, and by caution, as a motive for building up financial reserves. Contrary to these pre-scriptions, oil economies in Sub-Saharan Africa have tended to carry out fiscal polices that are pro-cyclical relative to oil price movements, leading to variability in the real exchange rate, which tends tobe damaging to the non-oil sector and capital formation, and to increased fiscal costs, includingthrough a negative impact on spending levels and quality induced by boom-bust cycles. It is also desir-able for such countries to build up financial reserves against unanticipated falls in revenue, but suchprudence in fiscal policies has not always emerged. One example of good practice is Botswana, whichin 2001–2 absorbed a confluence of shocks by relying on income from accumulated financial assets.
The second challenge stems from the nonrenewable nature of oil revenues and the attendant risein the importance of long-run fiscal sustainability, mainly due to concerns for intergenerationalequity. In countries with significant short-term development needs and insufficient physical andhuman capital, intergenerational equity could conceivably be secured through sufficient accumula-tion of financial and nonfinancial assets. In this context it is essential that projects be compatiblewith broader development strategies and projected returns secured by strong oversight. But as dis-cussed in the case of the Congo (see box 2.4), returns have not always matched expectations.
At an institutional level, strong governance is of primary importance in the context of an enclaveoil sector, which benefits a country mainly through its tax payments, and the nature of oil revenues,which tend to be both high and easily appropriated. With the government being the channel of mostof the possible benefits of an enclave oil sector, judicious use of government revenues is even morecritical than usual. Otherwise the rest of the economy only sees its competitiveness eroded (theDutch disease effect).
In an environment with weak oversight institutions, the size of oil revenues may mean that thepublic sector is asked to manage more resources than it can prudently administer and that the gov-erning elite acquires substantial financial independence. Oil-producing Sub-Saharan countries tendto underperform on key dimensions of economic governance. Yet given the extreme need to ensurejudicious administration of public resources, these are precisely the countries where good gover-nance has the highest social benefit. With their income derived mostly from the oil sector, includingpossibly in illicit ways, the governing elite are less motivated to strengthen oversight institutions,and the overall investment climate suffers.
The nature of oil contracts tends to further obfuscate public sector management and hamper rev-enue transparency. The typical results are fiscal policies that are beholden not to the population, butto entrenched elites. Under the typical oil contract in Sub-Saharan Africa, the bulk of the fiscalregime is subject to confidentiality clauses and unknown to the public. In such circumstances thesystem draws resources, including human capital, into activities geared to appropriating rents ratherthan encouraging more directly productive activities. Elites tend to favor excessive and imprudentinvestments—especially large projects, which are particularly prone to graft, and other inefficientmeans of rent distribution, such as sustained protection for favored firms.
In light of the resulting difficulties of implementing prudent fiscal policy and promoting soundeconomic governance in oil-producing countries, the creation of oil savings funds is often proposedas a solution. It is crucial to integrate such funds into the overall design of fiscal policy and the bud-get process. They have tended to work well in environments with strong institutions, such as Canada(Alberta), Norway, and the United States (Alaska). But savings funds have tended not to work whereunderlying institutions were weak and political commitment was lacking, as with Mexico’s oil sta-bilization fund and the Venezuelan Investment Fund.
Source: IMF staff.
BOX 2.7 Challenges for fiscal policy in oil-producing Sub-Saharan countries

sustained period and in a credible manner. Fora significant impact on growth, “gains inmacroeconomic stability need to be viewed bythe private sector as indicative of a permanentchange in the macroeconomic policy regime.”29
Fiscal Institutions: Key to Fiscal Sustainability and Macroeconomic Predictability
At a fundamental level, strong fiscal institu-tions enhance fiscal discipline and provideclear evidence on the direction of policy. Agrowing literature has indicated that institu-tional weaknesses, such as budget institutionsthat allow narrow interests to prevail, play animportant role in influencing fiscal outcomes.Some developing countries lack institutionsthat can promote sound fiscal policies, such as:
• Transparency, including wide dissemina-tion of key economic data and controls onpublic enterprise budgets.
• Judicial systems that control tax evasion.• Spending constraints that mitigate tenden-
cies toward inefficient and procyclicalspending policies.
The structure of public spending in someSub-Saharan countries could be made morecommensurate with the growth imperative.Fiscal adjustment and sustainability should beviewed not just in terms of quantity but alsoquality. To the extent that basic investments inphysical and human capital raise growth, it iscrucial to orient public spending toward pro-ductive projects in these areas.
Recent increases in social sector allocationsin low-income countries implementing povertyreduction strategies (PRSs) have begun to makea difference, but there is scope for furtherimprovement. In 2000–3 increases in thespending envelope (noninterest spending as apercentage of GDP) have not resulted in addi-tional allocations to public investment. More-over, given the consensus on the need to rapidlyraise the level of human capital across theregion, further progress on raising the share ofnoninterest spending allocated to educationand health would appear necessary. This is par-ticularly the case for health spending, for whichSub-Saharan Africa falls at the bottom amongdeveloping regions (figure 2.8).30
Looking ahead, it will be essential thatSub-Saharan countries underpin attempts tostrengthen their fiscal outlook with enhancedtransparency and stronger fiscal institutions.Budget transparency has been associated withenhanced fiscal discipline, particularly in theaftermath of the East Asian crisis of the late1990s, and enhanced government account-ability. The more transparent governmentoperations are, the easier it is to identify fis-cal policy weaknesses and address them. Fis-cal transparency improves the businessenvironment because investors (domestic andforeign) gain more confidence in governmentpolicies, and transparency can improve sov-ereign credit rating—a tangible benefit forcash-strapped governments. Consequently,the IMF published the Fiscal TransparencyCode in 1999 and the Manual on Fiscal
C H A P T E R 2
38 G L O B A L M O N I T O R I N G R E P O R T 2 0 0 5
Percent of GDP
1970–79 1980–84 1985–89 1990–84 1995–99 2000–03
Public expenditures in low-income countries, 1970–2003
0
5
15
30
35
40
45
10
25
20
East Asia & Pacific Europe & Central Asia
Expenditures on health
Total non-interest expenditures
Latin America & Caribbean Middle East & North AfricaSouth Asia Sub-Saharan Africa
FIGURE 2.8 There is scope for allocating more to priority sectors such as health
Sources: IMF, World Economic Outlook database and World Bank, World Development Indicators database.

Transparency in 2001, and a draft Guide onResource Revenue Transparency is availablefor public comments and will be published inthe near future. The earlier publications serveas a framework for the fiscal Report on theObservance of Standards and Codes (ROSC),a voluntary diagnostic tool that assesses theavailability and quality of fiscal data. In Sub-Saharan Africa 11 countries have agreed topublish fiscal ROSCs, and the assessments,
while recording some progress and examplesof good practice, highlight the general needfor better budget formulation and reporting,and broader data coverage (box 2.8).
One Sub-Saharan country that has recentlymade significant strides toward fiscal trans-parency is the Republic of Congo, where thepublication of fiscal data, audit reports on oilactivities, and reports on external verificationof government revenues, oil contracts, and data
S P U R R I N G A N D S U S T A I N I N G E C O N O M I C G R O W T H
G L O B A L M O N I T O R I N G R E P O R T 2 0 0 5 39
Country-specific fiscal transparency assessments—called fiscal Reports on the Observance of Stan-dards and Codes, or fiscal ROSCs—have been published on the IMF’s Web site for more than 70countries, including a number of countries in Sub-Saharan Africa (Benin, Burkina Faso, Cameroon,Ghana, Malawi, Mali, Mauritania, Mozambique, Rwanda, Tanzania, Uganda). Reports are beingprepared for several other Sub-Saharan countries.
The assessments record some progress in improving fiscal transparency in a number of areas,including the quality of budget formulation and investment in fiscal reporting systems. South Africa,while it has not published a fiscal ROSC, provides examples of good transparency practices, includ-ing clear policy statements and publication of a “budget in brief”—a summary of the governmentbudget written for the layman. But fiscal ROSCs have also found that much still remains to be donein Africa. For example, in many Sub-Saharan countries central government budget data remainweak and unreliable, and there is insufficient reporting on local government fiscal operations. Fis-cal risks related to off-budget activities (such as quasi-fiscal activities related to state-owned enter-prises or banks, contingent liabilities, tax expenditures) are often not transparent. External audit isgenerally weak, impairing the ability of parliaments and the general public to monitor governmentoperations and hold the executive branch accountable for its actions. There appears to be a strongneed to maintain continuing assessment of fiscal transparency in Sub-Saharan Africa and to encour-age publication and dissemination of good practices that are in place.
The need for better fiscal transparency in resource-rich countries has recently gained some promi-nence. Several Sub-Saharan countries, including Ghana and Nigeria, have begun to participate in theExtractive Industries Transparency Initiative. This initiative emphasizes the need for oil and otherextractive industry companies to publish what they pay to governments and to reconcile these pay-ments with what government reports show that they have received from companies. The IMF has pre-pared a draft Guide on Resource Revenue Transparency, which supplements its Manual on FiscalTransparency and can be used to assess fiscal transparency in resource-rich countries. The draft guidehas been released for public comments (http://www.imf.org/external/np/sec/pr/2004/pr04274.htm). Anumber of pilot country assessments are being undertaken in resource-rich countries—including Equa-torial Guinea, which recently hosted a seminar for parliamentarians from the six countries of the Eco-nomic and Monetary Community of Central African States (CEMAC) that focused on fiscaltransparency and accountability (see IMF Survey, 7 February 2005).
Note: The IMF has promoted fiscal transparency over the past several years as part of its Standards andCodes initiative. Its Fiscal Transparency Code and Manual on Fiscal Transparency are available athttp://www.imf.org/.Source: IMF staff.
BOX 2.8 Fiscal transparency has improved in Africa, but much remains to be done

has been influential in convincing developmentpartners that a significant change in the policyregime is under way.31 Nevertheless, as dis-cussed below, broader gains in governance areneeded for Sub-Saharan Africa to reach thelevel attained by other developing regions.
More broadly, stronger fiscal institutionscan improve fiscal management by clarifyinglines of responsibility and constraining thepolitical bargaining that typically affects fiscaloutcomes. One approach has been to createautonomous revenue agencies and grant cen-tral banks independence in the pursuit of pricestability. Another has been to strengthen rulesgoverning budget procedures and reporting,often in the context of medium-term expendi-ture frameworks (MTEF). Neither approachhas been widely embraced in Sub-SaharanAfrica. Institutional independence is morelikely to be effective in a climate with multiplechecks and balances, and an MTEF is onlyeffective when fully integrated with the bud-get process and related documents—whichhas only happened in five Sub-Saharan coun-tries.32 Yet another approach is to adopt a fis-cal responsibility act, under which broaddiscussion of the policies underlying budgetdocuments precedes formal presentation ofthe budget. The debate takes place bothwithin and outside parliament, improvingtransparency and binding government overthe medium term—as in Brazil, whichadopted a fiscal responsibility law in 2000.33
Fiscal Space: Safeguarding Development Spending
The identification of significant infrastructuregaps, particularly in Latin America, has led tocalls for the creation of fiscal space through arevision in accounting rules and change in theapproach to fiscal analysis. It has been sug-gested that data on fiscal expenditures shouldnot cover the operations of public enterprises,and that fiscal programming should target thecurrent, instead of overall, fiscal deficit. Thesearguments have also been marshaled as a wayto substantially increase government spend-ing on the MDGs.
Ultimately, a change in accounting rulescannot make the resource envelope larger orensure that additional spending is justified. ForSub-Saharan Africa the proposed change in fis-cal data coverage would not have much of animpact, given that standard practice across theregion already limits coverage to general gov-ernment (and only records direct transfers topublic enterprises as fiscal expenditures).Moreover, targeting the current deficit (as away of treating investment spending differ-ently from recurrent spending) would notobviate the need to assess the sustainability ofdebt loads, the impact of higher domesticfinancing on inflation and private investment,and the productivity of expenditure.34
Effectively creating fiscal space wouldrequire, first, generating additional resourcesand, second, ensuring that projects are appro-priately selected and implemented. Domesticsources of additional resources include mobi-lization of additional fiscal revenue anddomestic borrowing. Scope for the latter is typ-ically limited, however, in part because finan-cial markets in Sub-Saharan Africa are thinand in part because of a need to preservedomestic savings for private investment. Exter-nal sources include a sustained and predictableflow of external grants (and, to a lesser extent,other concessional borrowing). Ensuring theoverall adequacy and quality of developmentspending may entail reprioritizing expendituretoward more productive sectors and projects(as discussed earlier), and lifting limits onabsorption capacity, including by improvingexpenditure monitoring systems.
In Sub-Saharan Africa the bulk of the addi-tional financing required to achieve theMDGs will have to come from sources otherthan additional taxation. Certainly, tax rev-enue ratios in low-income Sub-Saharan coun-tries are on the low side. But raising revenueratios will require improvements in taxadministration and resolution of importantissues of tax design, including greater relianceon indirect taxation schemes such as the valueadded tax (VAT).35 The associated politicaland administrative challenges are not easilyovercome in a short period.36
C H A P T E R 2
40 G L O B A L M O N I T O R I N G R E P O R T 2 0 0 5

External grants unambiguously enhancefiscal space—in contrast to borrowing, wheresuch space is constrained by debt sustainabil-ity considerations, even when loans are con-cessional. Still, a sustained, predictable flow ofexternal grants is needed to secure a sustainedscaling up of expenditures. Historically, aidflows have been more volatile and less pre-dictable than other sources of revenue.37
These tendencies have been more pronouncedfor countries least capable of absorbing exter-nal shocks: those with a higher proportion ofaid-financed budgets and those with fewerdomestic financial instruments to smooth thefiscal impact. These effects undermine some ofthe benefits of foreign assistance.
In Sub-Saharan Africa recent drops in pub-lic investment underscore the importance ofimproving capacity to implement productiveprojects. Over the past two decades the shareof public investment has fallen by about 3percentage points of GDP across the region.Although part of the drop has been offset byrising private investment, budget execution inlow-income Sub-Saharan countries regularlyresults in lower than programmed capitalspending and overruns on current spending.The shortfalls in capital spending cannot beattributed entirely to lower than expectedforeign financing—underscoring the impor-tance of improving project selection andimplementation.
Better public expenditure management iscritical in addressing concerns about the rela-tionship between additional spending, publicservice delivery, and improved outcomes.Attempts have been made to address publicexpenditure management in the context ofefforts to increase pro-poor spending underthe aegis of the enhanced HIPC Initiative(box 2.9). The reported increase in poverty-reducing spending will have to be supple-mented by improvements in efficiency andtargeting to raise social outcomes. For this,countries must also develop the means toassess the effectiveness and social impact ofpoverty-reducing spending.
More generally, identifying and addressingabsorptive capacity constraints requires for-
mulating country-specific strategies. At themacroeconomic level, aid may distort domes-tic markets by raising the price of domesticgoods and services, and impair economic per-formance by threatening fiscal sustainability(particularly with volatile and unpredictableaid flows). Managing these policy challengesis facilitated by the use of a medium-term fis-cal framework and flexibility in adjustingexpenditure and revenues, and possibly bythe absorption of shortfalls in aid flows withthe use of international reserves or nonmon-etary financing instruments. For some sec-tors, such as health and education, humanand physical infrastructure constraints mayalso be relevant. Addressing these concerns islikely to require more resources and time.
In sum, sustained effort is necessary toensure that recent progress toward a stablemacroeconomic environment marks a per-manent shift in the policy regime. In the shortterm, with high fiscal deficits and limited abil-ity to raise revenues, most increases in domes-tic contributions to the region’s developmentneeds will come from higher economicgrowth and a shift in spending toward high-quality projects in growth-sensitive sectors.
Finally, macroeconomic stability cannotbear the entire burden of boosting economicgrowth. As the past two decades have shown,Sub-Saharan Africa’s institutional environ-ment has not always ensured that policy gainstranslate into permanent improvements. Fis-cal institutions should ensure transparency,effective expenditure monitoring, and sustain-ability. Institutionalizing nascent improve-ments in macroeconomic policy may be aquick way to change perceptions.
Enabling Climate for PrivateSector ActivityThe earlier analysis of growth accelerationsindicates that private investment can play asignificant role in supporting sustained eco-nomic growth. In slow-growing economies inSub-Saharan Africa and elsewhere, invest-ment is typically low.38 The rate of return oninvestment also tends to be low, due to low
S P U R R I N G A N D S U S T A I N I N G E C O N O M I C G R O W T H
G L O B A L M O N I T O R I N G R E P O R T 2 0 0 5 41

C H A P T E R 2
42 G L O B A L M O N I T O R I N G R E P O R T 2 0 0 5
The IMF and World Bank have been working closely with countries benefiting from the enhancedHIPC initiative to strengthen the link between HIPC assistance and poverty reduction. Recogniz-ing that public expenditure management plays a key role in poverty reduction, action plans forexpenditure management were agreed with the authorities of each HIPC—taking into account thetechnical assistance available to them from their development partners—and two assessments ofthose plans have been completed. (More generally, a key feature of the IMF’s Poverty Reductionand Growth Facility, the Bank’s Poverty Reduction Strategy Credits, and the PRS approach is thatthe budgets of low-income countries should become more pro-poor, which makes tracking poverty-reducing spending relevant to all PRS countries.) Under the 2001 assessment, progress was trackedusing 15 indicators: 7 related to budget preparation and 4 each to execution and reporting. For the2004 assessment a new indicator was added, on procurement.
After the first assessment confirmed the weak state of public expenditure management systems, HIPCsbegan strengthening expenditure management and monitoring. By 2004 most were able to reportpoverty-reducing spending as defined in their PRSs, and the average number of benchmarks met increasedfrom 6.0 to 6.5. (The second assessment covered 25 HIPCs—22 in Sub-Saharan Africa and 3 in LatinAmerica; see table.) On average, pro-poor spending has grown by about 2 percent of GDP a year. But toreduce poverty, higher spending must be accompanied by increased efficiency and better targeting toimprove social outcomes. Revised action plans are being incorporated into IMF-supported programs andBank adjustment operations—and to increase ownership, should also be incorporated into PRSs.
BOX 2.9 Strengthening expenditure monitoring under the enhanced HIPC Initiative
Many HIPCs need to substantially upgrade public expenditure management
Level ofupgrading required 2004
2001 Substantial Some Little
Substantial Bolivia (5, 4) Mozambique (5, 4)(7 or fewer Cameroon (4, 7) Niger (3, 5)benchmarks met) Ethiopia (6, 7) São Tomé and Principe (4, 4)
The Gambia (5, 3) Senegal (4, 7)Ghana (1, 7) Zambia (3, 3)Guinea (5, 5)
Madagascar (7, 4)Malawi (7, 5)
Some Chad (8, 7) Benin (8, 8) Mali (8, 11)(8–10 Honduras (8, 7) Burkina Faso (8, 9) Tanzania (8, 11)benchmarks met) Guyana (8, 10)
Rwanda (8, 8)Uganda (9, 8)
Little(11 or morebenchmarks met)
Not assessed in 2001 Democratic Republic of Congo (4)
Guinea-Bissau (0)Sierra Leone (7)
Note: Numbers in parentheses are the number of benchmarks met in 2001 and 2004, in that order.
Source: IMF (2003); and IMF and World Bank staff.

S P U R R I N G A N D S U S T A I N I N G E C O N O M I C G R O W T H
G L O B A L M O N I T O R I N G R E P O R T 2 0 0 5 43
productivity and high costs of doing busi-ness.39 Faster growth requires a business cli-mate that enables the private sector to take upprofitable investment opportunities, raisingboth the level and productivity of investment.
In many developing countries excessive reg-ulation and other institutional constraintsimpose a heavy burden on entrepreneurialactivity. A number of countries are imple-menting regulatory reforms, but recentimprovements need to be deepened and under-pinned by stronger institutions—particularlythose related to property rights and the rule oflaw. Alongside regulatory and institutionalreform, access to finance and availability ofkey infrastructure need to be improved. Lim-ited access to credit and poor infrastructureundermine private activity in many countries,limiting growth in industry and agriculturealike. Among regions, Sub-Saharan Africa hasthe greatest need to improve these determi-nants of the business environment.
Assessing the Business Environment
Recent enterprise surveys and business regu-lation assessments provide the necessarymetrics for a careful evaluation of the invest-ment climate in developing countries.40 Theenterprise surveys provide benchmarks ofinvestment climate indicators and firm per-formance, allowing conclusions to be drawnon constraints facing entrepreneurs. Thebusiness regulation assessments providebenchmarks of regulatory and property pro-tection systems, providing policy guidanceon areas needing improvement. Across thedeveloping world, entrepreneurs consistentlyreport regulatory impediments, corruption,and lack of access to finance and key infra-structure (such as electricity) as major con-straints on their activity.
Firms in Sub-Saharan Africa consider hightaxes and poor access to finance to be amongtheir most significant constraints (figure 2.9).In countries with small tax bases, firms oftenbear a disproportionate share of the tax bur-den, particularly small and medium-sizefirms. With the informal sector representing
more than 70 percent of nonagriculturalemployment in the region, many firms do notpay any taxes—or report only a fraction oftheir sales to the authorities. And many firms,particularly small ones, do not see many ben-efits from becoming formal. Most firms lackconfidence that courts will uphold their prop-erty rights, and most have little access tofinance due to shallow financial systems andthe difficulty of obtaining collateral.
Corruption and policy uncertainty are alsosignificant constraints in Sub-Saharan Africa.In particular, the discretion that many offi-cials enjoy in implementing complex regula-tions creates opportunities for bribes anduneven application of requirements. Morethan 95 percent of firms in the region reportthat corruption or policy uncertainty are aproblem, with most firms calling them majoror very severe constraints on their ability tooperate and expand.
Unreliable electricity supply is reported asa constraint by 52 percent of firms in Sub-Saharan Africa, compared with 42 percent in
Policy uncertainty
Corruption
Cost & accessto finance
Telecommunications
Tax rates
Regulation & tax administration
Electricity
Crime
Legal
Access to land
Latin America & the CaribbeanSub-Saharan Africa South Asia
Europe & Central AsiaEast Asia & Pacific
Percent of firms reporting constraints as major or very severe
5025
75
FIGURE 2.9 Sub-Saharan firms view taxes, finance, electricity, andcorruption as particularly constraining
Source: World Bank Investment Climate Surveys.Note: The graph does not include every country in each region.

South Asia, 24 percent in East Asia and LatinAmerica, and less than 10 percent in Europeand Central Asia. Moreover, a much largershare of African firms report frequent poweroutages and serious production losses stem-ming from such interruptions in production.
There is considerable cross-country varia-tion in the ranking of constraints reported bySub-Saharan firms. For example, policyuncertainty is reported as a major or severeconstraint by 27 percent of firms in Ugandabut by 57 percent in Zambia. Similarly,unpredictable interpretation of regulations isa problem cited by 40 percent of firms inUganda but by 70 percent in Zambia (table2.6). In Kenya more than 75 percent of firmsreport paying bribes, averaging more than 5percent of sales. Losses from power interrup-tions average 6–7 percent of sales in Ethiopiaand Zambia, and 10 percent or more inEritrea, Kenya, and Senegal.
The above picture, derived from the WorldBank’s Investment Climate Surveys, is corrob-orated by its Doing Business indicators. Thebusiness environment, as measured by the reg-ulatory burden, is weakest in Sub-SaharanAfrica (figure 2.10).41 Among the 20 countrieswith the most regulatory obstacles to doingbusiness, 16 are in Sub-Saharan Africa—withAngola, Burkina Faso, Chad, and the Democ-ratic Republic of Congo ranking among the
worst 5 worldwide. Entrepreneurs in thesecountries face a staggering array of costs,including those related to starting a business,registering property, enforcing contracts, hir-ing and firing workers, getting credit, closinga business, and protecting investors.
On average, starting a company in Sub-Saharan Africa costs the equivalent of 224percent of national per capita income, com-pared with 45 percent in South Asia and only7 percent in high-income countries. Similarly,a simple, formal property transfer costs 14percent of the value of the property and takesmore than 100 days in Africa, compared with48 days in East Asia and the Pacific and 36days in high-income countries.
Nigeria has some of the world’s most cum-bersome regulations for registering property,requiring 21 procedures, 27 percent of theproperty value in fees, and a registrationperiod of 274 days. Other African countriespresent similar obstacles to registering prop-erty: Completing the transfer process takesmore than a year in Ghana and 354 days inRwanda, and costs 34 percent of the propertyvalue in Senegal and 23 percent in the Repub-lic of Congo. Moreover, Africa’s property reg-istries tend to be poorly organized andprovide little security of ownership.
Sub-Saharan Africa is also the region whereit is most difficult to enforce a simple com-
C H A P T E R 2
44 G L O B A L M O N I T O R I N G R E P O R T 2 0 0 5
TABLE 2.6 Investment climate constraints vary across Sub-Saharan Africa (percentage of firms citing problem, unless otherwise indicated)
ManagementUnpredictable Lack confidence time spent dealing Averageinterpretation courts will uphold with officials number of days Finance a Infrastructure a Skills a
Country of regulations property rights (percentage of time) to clear customs major constraint major constraint major constraint
China 33.7 17.5 19.0 7.9 22.3 29.7 30.7Kenya 45.5 51.3 13.8 8.9 58.3 48.1 27.6Mozambique 11.3 11.9 78.0 64.0 33.5Senegal 42.5 40.5 13.8 6.5 60.0 30.7 18.5Tanzania 58.6 55.1 16.2 17.5 53.0 58.9 25.0Uganda 40.0 30.1 5.0 52.8 44.5 30.8Zambia 70.1 36.0 14.1 4.8 67.7 39.6 35.7
Sources: World Bank, World Development Report 2005; World Bank Investment Climate Surveys.

S P U R R I N G A N D S U S T A I N I N G E C O N O M I C G R O W T H
G L O B A L M O N I T O R I N G R E P O R T 2 0 0 5 45
0
20
40
60
80
100
120
Sub-Saharan Africa
High-income countriesOther middle-income countries
Other low-income countries
Starting abusiness
Hiring andfiring
Registeringproperty
Gettingcredit
Protectinginvestors
Enforcingcontracts
Closing abusiness
Overall
Ranking
Ease of doing business
Overall index and Sub-indexes
FIGURE 2.10 Sub-Saharan Africa lags other regions in the quality of the business environment
Source: Doing Business in 2005 database.
mercial contract through the courts. On aver-age, creditors must go through 35 steps, wait15 months, and pay 43 percent of their coun-try’s per capita income before receiving theirdue payment. The result is less access to jus-tice and weaker protection of property rights,leading to fewer formal business transactions.
Hiring and firing workers in the formalsector in Africa is also not easy. The regionhas the most rigid labor regulations andamong the highest firing costs.42 In BurkinaFaso employers cannot write a fixed-termcontract unless a job is seasonal; the man-dated minimum wage is $54 a month, whichat 82 percent of value added per worker is the
third highest in the world; night and weekendwork are prohibited; and women are not per-mitted to work more than 8 hours a day. If abusiness needs to downsize, it must notify theMinistry of Labor of its intention to retrenchworkers, and the law requires that redundantworkers be trained and placed in other jobsprior to dismissal. If an employer followsthese procedures, a redundancy costs an aver-age of 18 months’ wages in severance pay andpenalties. Thus it is little wonder that manybusinesses operate in the informal economy,which accounts for about 40 percent of thecountry’s output. High firing costs makeemployers less likely to hire.

Moreover, without clearly defined prop-erty rights and efficient contract enforce-ment, lenders are less likely to extend creditto entrepreneurs. Although Sub-SaharanAfrica performs better on indicators of legalrights for borrowers and lenders than doSouth Asia, Latin America, and the MiddleEast and North Africa, institutions thatsupport credit markets are weak. For exam-ple, only four Sub-Saharan countries—Botswana, Ghana, Namibia, and SouthAfrica—have private credit bureaus to pro-vide lenders with information on a bor-rower’s creditworthiness.
Within Sub-Saharan Africa’s overall diffi-cult business environment, however, perfor-mance varies considerably, and there areseveral examples of good practice. The costof starting a business varies across countriesby more than 100-fold, from 10 percent ofper capita income to more than 10 times
(figure 2.11). Botswana and South Africahave low official fees, in line with those inhigh-income countries, while Angola andSierra Leone have costs that are among theworld’s highest. In other examples of goodpractice, Tanzania and Uganda have com-mercial or small claims courts, Tanzania hasa specialized court for bankruptcy,Botswana and Tanzania have no minimumcapital requirement for starting a business,Madagascar and Namibia have introducedmoderate severance pay for redundantemployees, and South Africa gives investorsaccess to ownership and financial databefore they invest in a company.
There are also broader patterns across theregion. As in other regions, middle-incomecountries have more efficient regulation thando low-income countries. For instance, ittakes an average of 234 days to enforce a debtcontract in a middle-income country, but
C H A P T E R 2
46 G L O B A L M O N I T O R I N G R E P O R T 2 0 0 5
0
500
1000
1500
SouthAfrica
Botswana Zambia Kenya Ethiopia Nigeria Niger Congo,Dem.Rep
Angola SierraLeone
11 23 53
396
557
885
1268
77 959
Percent of GNI per capita
Cost of starting a business in African countries
FIGURE 2.11 The cost of starting a business varies widely
Source: Doing Business in 2005 database.

almost twice that in a low-income country.On the other hand, business regimes tend tobe most onerous in oil-dependent economies(box 2.10) and countries that have recentlyendured civil conflict.
Improving the Business Environment
The costs of a weak investment climate aresubstantial, and the impacts widespread. Atthe enterprise level the estimated costs, mea-sured in terms of the share of sales lost, rangefrom less than 10 percent in Poland to morethan 30 percent in Zambia. The compositionof costs also varies dramatically across coun-tries. In Kenya, Tanzania, and Uganda weakinfrastructure services are particularly bur-densome, while in Zambia bribes are espe-cially costly (figure 2.12). Priorities forreform thus vary by country.
Reform offers large payoffs. In Ethiopiaannual business registrations increased by 48percent after the process was simplified in2003. In Namibia the cost of expanding out-put fell by 15 percent as a result of more flex-ible working hours introduced in 2003. InMozambique commercial banks report thatreforms to the public credit registry havehelped provide credit to a wider set of entre-preneurs. Empirical analysis indicates thatAfrica could grow by an additional 1.6 per-centage points a year if the average countrywere to improve its business regulation systemto the level of the average OECD country.43
Countries with better business environmentstend to benefit from higher private invest-ment: among Sub-Saharan countries thatscored 50 or higher on the ease of doing busi-ness index in 2005, the correlation betweenthat score and the rate of private investmentduring 1990–2003 was 70 percent. Improve-ments in Uganda’s business environment havecontributed significantly to stronger economicperformance since the early 1990s (box 2.11).
While some countries in Sub-SaharanAfrica are taking notable steps to improve
the private business environment, reformsneed to be quickened and extended to othercountries. Despite their heavier burden ofbusiness regulation and weaker protection ofproperty rights, African countries laggedthose in other regions in the scope and paceof reform achieved in the past year, asassessed by the annual Doing Businessreport.44 Of the 58 countries in the samplethat had reformed regulation or strengthenedproperty rights, only 8 were in Africa. Mostreforms in Africa were in the relativelystraightforward area of starting a business,while outside Africa there were reforms inevery area measured (figure 2.13).
Among Sub-Saharan nations enactingreforms, Ethiopia improved the process forstarting a business by cutting the number ofrequired procedures and reducing the associ-ated cost and time. Madagascar slashed thetime required to start a business by establish-ing a new one-stop shop for entrepreneurs.Benin, the Democratic Republic of Congo,Côte d’Ivoire, and Kenya also reformed entryregulation. In Mozambique a public creditregistry went online, strengthening the qual-ity of data. In contrast, some countries wors-ened their investment climates: actions inMalawi, Mauritania, Rwanda, and Zim-babwe raised the cost of starting a business.
Looking ahead, how can the businessenvironment be improved in Sub-SaharanAfrica? The evidence points to a broadagenda of reform, with specific prioritiesand sequencing varying by country. Assess-ments of the business environment suggestthe following as key areas for improving theregulatory and institutional framework inmany countries:
• Streamlining entry regulations and cuttingfees. In Africa the official fees for startinga business are prohibitive for most would-be entrepreneurs. Cutting these feeswould encourage more businesses to oper-ate in the formal sector. To reduce the pro-
S P U R R I N G A N D S U S T A I N I N G E C O N O M I C G R O W T H
G L O B A L M O N I T O R I N G R E P O R T 2 0 0 5 47

C H A P T E R 2
48 G L O B A L M O N I T O R I N G R E P O R T 2 0 0 5
One of the manifestations of the “resource curse” is lack of economic diversification in resource-dependent economies. Among the most severe cases have been oil-dependent economies in Sub-Saharan Africa, such as Angola, where significant private investments have flowed to the oil sector(with its enclave fiscal, regulatory, and legal regime) but, for the most part, not to other sectors.Other countries, including Botswana, have been able to harness the power of natural resources byimplementing sound macroeconomic and structural policies and providing adequate incentives forentrepreneurs to take up profitable opportunities in all sectors. The table below compares the reg-ulatory burden imposed on entrepreneurs in Angola and Botswana.
Worldwide, Angola is among the 20 countries with the least business-friendly regulations, whileBotswana is among the top 20. On most indicators measured by the Doing Business project,Botswana substantially outperforms Angola. Registering property—essential for obtaining credit inmany countries—takes almost five times longer in Angola. Hiring and firing workers is considerablyless flexible and more costly in Angola. And closing a business, which helps entrepreneurs start and
BOX 2.10 Comparing business regulations in two resource-dependent economies: Angola and Botswana
Businesses face a lower regulatory burden in Botswana than Angola
Starting Registering Enforcing Hiring Closing a Protectinga business property contracts and firing Getting credit business investors
Labor Firing Legal Credit RecoveryCountry Days Cost Days Cost Days Cost rigidity costs rights information rate Disclosure
Angola 146 885 335 11 1,011 9 75 116 3 4 1 2Botswana 108 11 69 5 154 25 20 19 9 5 51 5
Note: Cost of starting a business is measured as a percentage of per capita gross national income (GNI). Cost of registering property ismeasured as a percentage of property value. Cost of enforcing contracts is measured as a percentage of debt value. Labor rigidity is anindex from 0–100, with higher values indicating more rigid regulation. Firing costs are measured in number of weeks of salary due asseverance payment. Legal rights is an index from 0–10, with higher scores indicating the degree to which collateral and bankruptcylaws facilitate lending. Credit information is an index from 0–6, with higher scores indicating more availability of information throughpublic or private bureaus. Recovery rate is measured in cents on the dollar. Disclosure is an index from 0–7, with higher scores indicat-ing more disclosure of corporate information.
cedures and time required for businessregistration (which can also significantlyreduce the cost), governments could alsocreate single access points for business (asin Madagascar), introduce temporarybusiness licenses, impose “a silence is con-sent” rule for business registration, andstandardize paperwork.
• Cutting fees and unnecessary proceduresfor property registration. A large bottle-neck in several African countries is therequirement for government consent
before property is transferred. Thiscauses delays, usually requires an exorbi-tant fee, and can be a major source of cor-ruption. Lesotho, Malawi, Nigeria,Rwanda, Senegal, and Zambia all havegovernment consent requirements. Theimpact of such requirements can be con-siderable. For example, if Malawi elimi-nated the requirement of obtainingconsent from its Ministry of Land (proce-dure 3 in figure 2.14), registering prop-erty would take 28 days instead of 118.

Other reforms that strengthen propertyrights and encourage investment includesimplifying and consolidating proceduresat the property registry, cutting fees, link-ing the cadastre and property registry,and providing easier access to informa-tion in the registry.
• Encouraging the establishment of creditbureaus. Access to credit would be madeeasier if lenders had assurance that bor-rowers are creditworthy (and that it is pos-sible to recover debt, in cases of default).
By encouraging the development of creditbureaus, African governments can helpfurnish creditors with information to sortgood from bad borrowers, price loans cor-rectly, and reduce screening costs.
• Making labor regulations more flexibleand reducing the cost of firing. To accom-plish this, African countries can increasethe length and scope of term contracts,introduce apprentice wages (following theexample of Madagascar), allow flexibleworking hours (as in Namibia), and
S P U R R I N G A N D S U S T A I N I N G E C O N O M I C G R O W T H
G L O B A L M O N I T O R I N G R E P O R T 2 0 0 5 49
grow their businesses, is significantly more complex in Angola. Not surprisingly, Botswana has amore diversified economy and has grown roughly twice as fast as Angola over the past 10 years.
Across Sub-Saharan Africa, Angola is typical of oil-driven economies, which tend to have morecumbersome business regulations and weaker protection of property rights than do non-oileconomies (see figure). Reforms in these areas could significantly enhance the attractiveness of non-oil private investment in oil economies.
Source: Doing Business in 2005 database.
70
60
50
40
30
20
10
0
Non-oil countriesSub-Saharan Africa Oil countries
Overall Starting abusiness
Hiring andfiring
Registeringproperty
Gettingcredit
Protectinginvestors
Enforcingcontracts
Closing abusiness
Ease of doing business in Sub-Saharan Africa
Ranking
BOX 2.10 Comparing business regulations in two resource-dependent economies: Angola and Botswana (continued)

remove administrative approvals for dis-missal.
• Reducing unnecessary procedures andcontract enforcement times. Approachesinclude introducing case management (asin Uganda), reducing abuse of appeals pro-cedures (as in Botswana), improvingenforcement (in Uganda the creditor’sattorney is responsible for enforcement,
with the help of the police), and creatingspecialized courts or sections of commer-cial courts (as in Ghana and Tanzania).
Some reforms, such as improvements toentry regulations, credit reporting systems,and property registries, can be achieved rela-tively quickly through administrative reforms.Others, such as those involving labor regula-
C H A P T E R 2
50 G L O B A L M O N I T O R I N G R E P O R T 2 0 0 5
The economic successes of China and India are well known, with China growing at 10 percent ayear and India having doubled its growth rate since the 1970s, following major reforms over thepast two decades. But the benefits of investment climate reforms are not limited to large countries.Uganda’s experience shows the importance of persistence, rather than perfection, in translatinginvestment climate reforms into increased growth and poverty reduction. Uganda initiated itsinvestment climate improvements in the early 1990s, after a period of civil conflict and macroeco-nomic instability.
Reforms covered many areas affecting the investment climate: Macroeconomic stability wasachieved, expropriations by a previous government were reversed, trade barriers were reduced, andtax and court systems were strengthened. The persistence of the government’s reform effortsenhanced its credibility, giving firms confidence to invest. Indeed, private investment as a share ofGDP more than doubled, from just over 6 percent in 1990 to 15 percent in 2002. These improve-ments contributed to stronger per capita income growth, which averaged 4 percent a year in1993–2002 (eight times the average in Sub-Saharan Africa), and a reduction in the share ofUganda’s population living below the poverty line, from 56 percent in 1992 to 35 percent in 2000.
Source: Adapted from World Bank 2004b.
BOX 2.11 High returns to investment climate improvements in Uganda
0
10
20
30
40
Tanzania ZambiaPoland China Brazil Uganda Algeria Kenya
Infrastructure disruptions Crime and security Bribes Regulation Contract enforcement
Share of sales lost
FIGURE 2.12 A weak investment climate entails high costs
Sources: World Bank 2004b; World Bank Investment Climate Surveys.

tions and court reforms, require longer-termefforts and legislative action. Investment cli-mate reform is a process, not an event. Noteverything needs to be fixed at once, or per-fectly at one go. Significant progress can beachieved by addressing the more importantconstraints facing businesses in a way thatgives them confidence to invest and by sus-taining a process of ongoing improvements.45
The foregoing discussion focuses on theneed for regulatory and institutional reform.The evidence presented also points to lack offinancial and physical infrastructure as majorconstraints in many countries. The next twosections focus on these aspects of the agenda.
Financial sector
Sub-Saharan Africa’s financial sector hasgone through major changes over the past 15years, and has largely been transformed intoan open system that includes a variety ofinstitutions owned by domestic and foreignprivate entities. With the proliferation offinancial institutions, the average bank sizehas shrunk by about 25 percent. Thesechanges have revealed weaknesses in regula-tory capacity and limitations in risk assess-ment within financial institutions, and manyAfrican countries have had to cope with sig-
nificant bank failures. The resolution of thesefailed banks through restructuring and priva-tizing has been the main focus of policymak-ers over the past 15 years.
In addition, considerable efforts have beenmade to improve legal and regulatory frame-works and to build regulatory capacity toprevent further failures. African banking lawsand regulations are now largely comparable
S P U R R I N G A N D S U S T A I N I N G E C O N O M I C G R O W T H
G L O B A L M O N I T O R I N G R E P O R T 2 0 0 5 51
01
40
80
120
2 3 4 5 6
Days
Procedures
FIGURE 2.14 Registering property is unduly time-consuming in Malawi
Source: Doing Business in 2005 database.
Reforms in Sub-Saharan Africa
Creditinformation
Closing abusiness
Hiring andfiring
Starting abusiness
Hiringand
firing
Starting abusiness
Enforcingcontracts
Reforms outside Sub-Saharan AfricaCredit
information
FIGURE 2.13 Business environment reforms need to be scaled up in Sub-Saharan Africa
Source: Doing Business in 2005 database.

to international standards—although theenforcement of regulatory standards is weak,as in many other developing countries. Theregion’s reforms have achieved substantialresults, and financial system stability hasimproved appreciably.
Despite this legal and regulatory progress,financial systems in Sub-Saharan Africaremain underdeveloped. Outside Mauritiusand South Africa, lending to the private sec-tor is still limited and costly. Since 1995 therehas been limited progress on financial sectordeepening (figure 2.15). Excluding SouthAfrica, private sector credit relative to GDPhas grown by only about 2 percentage pointsover the past 10 years, with most of thegrowth occurring recently (figure 2.16). Anumber of explanations have been advanced,including increased holdings of governmentpaper by banks due to bank restructuring,crowding out, and more conservative lendingin the face of high credit risks.46 Anotherproblem is that the cost of borrowing ishigher in Sub-Saharan Africa than in otherregions (figure 2.16b).
In this context, improving access to financialservices poses a significant challenge. As noted,
investment climate surveys in Sub-SaharanAfrica reveal that inadequate access to financeis a major constraint for entrepreneurs. Thesurveys also indicate that access is hamperedfor two reasons. First, high real interest ratesand banking fees make financial services toocostly. Second, mainstream financial institu-tions fail to serve the needs of important pop-ulation segments, including small-scaleentrepreneurs. Virtually all surveys indicatethat financial institutions are hesitant to lendbecause of difficulties in securing collateral andseizing assets in case of default. The availabil-ity of financial services is also crucially relatedto financial system supporting structures,including regulation, information infrastruc-ture, property rights enforcement, and overallgovernance and institutional development.
There have been notable efforts to developcredit information systems and improve reg-ulations to facilitate access to finance.47 TheWorld Bank has documented the incipientdevelopment of credit reporting systems in 30Sub-Saharan countries, including systemsoperated by private firms in Botswana, CapeVerde, Equatorial Guinea, Eritrea, andNamibia. A number of countries have
C H A P T E R 2
52 G L O B A L M O N I T O R I N G R E P O R T 2 0 0 5
70
60
50
40
30
20
10
0
1995 2003
Low-incomecountries
Lower-middle-income countries
Upper-middle-income countries
b. M2/GDP by income categoryin Sub-Saharan Africa 1995–2003
PercentPercent
1995 1996 1997 1998 1999 2000 2002 20032001
a. M2/GDP inSub-Saharan Africa 1995–2003
10
20
30
40
50
60
70
FIGURE 2.15 Financial depth is lowest among low-income Sub-Saharan countries
Source: World Bank Staff estimates.

improved their regulatory systems to facili-tate access to finance, notably legal rights forcreditors in Kenya, Nigeria, and Zimbabweand registration of movable collateral inBotswana and South Africa. In addition,Ghana, Kenya, Mauritius, Tanzania, andUganda have introduced regulations to facil-itate the integration of microfinance institu-tions with mainstream financial systems.These are all promising efforts, as develop-ment of financial infrastructure can secureaccess to credit for a wider segment of thepopulation.
Most African countries receive (bilateraland multilateral) donor-funded facilities fortrade and investment finance purposes. Whenthese facilities are implemented effectively,they substantially enhance domestic privatesector credit (as in Zambia). But experienceswith donor-funded financing vehicles haveshown the need for terms and conditionsmore consistent with long-term goals forfinancial sector development. Donor-fundedfacilities that are priced below market rates,targeted to specific sectors and borrowers,and channeled through a few select interme-
diaries do not provide an adequate frame-work for promoting efficient resource alloca-tion. Coordination among providers of thesefacilities and harmonization of terms andconditions are among the most importantchallenges for donor-funded facilities toimprove financial intermediation.
Physical infrastructure
Inadequacies in the level and quality of infra-structure—including electricity, transporta-tion, and communications—can adverselyaffect private sector productivity and invest-ment rates. While macro evidence on thegrowth impacts of infrastructure remainssomewhat inconclusive, businesses in devel-oping countries often cite infrastructure qual-ity among their top constraints, particularlyin Sub-Saharan Africa and South Asia. Forexample, entrepreneurs in Sub-SaharanAfrica consider unreliable electricity one oftheir biggest constraints (see figure 2.9).Transport infrastructure is also key in theregion, given its long distances and manylandlocked countries. But the wide variation
S P U R R I N G A N D S U S T A I N I N G E C O N O M I C G R O W T H
G L O B A L M O N I T O R I N G R E P O R T 2 0 0 5 53
30
25
20
15
10
5
0
Real lending rate Real deposit rate
Sub-SaharanAfrica
LatinAmerica
&Caribbean
SouthAsia
Europe&
CentralAsia
MiddleEast &NorthAfrica
Middle-income
countries
b. Lending and deposit rates in 2003
Percent
Percent of GDP
1995 1997 1999 2001 2003
a. Domestic credit to private sector
10
11
13
15
18
19
12
14
16
17
FIGURE 2.16 The cost of borrowing is higher in Sub-Saharan Africa
Source: World Bank staff estimates.

in survey responses across developing coun-tries suggests that the severity of the con-straints imposed on the private sector byinadequate infrastructure differs consider-ably.48 In particular, in some countries a lackof sufficient maintenance, rather than a lackof infrastructure, is the more pressing issue.
Sub-Saharan Africa and South Asia havethe lowest access to basic infrastructure suchas water, electricity, communications, androads (figure 2.17). Even when services areavailable, their quality tends to be quite poor.Moreover, the quality of electricity and roadsdeclined during the 1990s.49
Estimates of infrastructure gaps for thedeveloping world indicate sizable investmentneeds and large financing gaps. These gapsincreased in many developing countries in the1990s as public investment in infrastructurefell and private investment failed to rise suffi-
ciently to take up the slack. Recent projec-tions indicate that Sub-Saharan Africa hasinvestment needs of $17–22 billion a year in2005–15, including both capital and mainte-nance expenditures.50 Estimates place currentpublic infrastructure investment at about $6billion a year (roughly half of which is donor-financed) and private commitments at about$4 billion a year. Thus the region’s infra-structure financing gap is $7–12 billion ayear, or 4.5 percent of GDP (figure 2.18).
Under current conditions it is unlikelythat infrastructure projects involving privateparticipation will fill a significant portion ofSub-Saharan Africa’s financing gap. Due toits relatively low level of private involve-ment, the region escaped the retrenchmentof private participation in infrastructurethat occurred throughout the developingworld in the late 1990s (figure 2.19). But
C H A P T E R 2
54 G L O B A L M O N I T O R I N G R E P O R T 2 0 0 5
0
50
100
150
200
250
East Asia & PacificEurope & Central AsiaLatin America & CaribbeanMiddle East & North AfricaSouth AsiaSub-Saharan Africa
Access to infrastructure
Electricitykwh per
20 million people
Telephone mainlinesper 1000 people
Mobile phonesper 1000 people
Roadskm per 1000 sq km
FIGURE 2.17 Weak access to infrastructure is a major constraint in Sub-Saharan Africa and South Asia
Source: World Development Indicators database.

Africa’s initial experience with private par-ticipation was unsatisfactory in two keyrespects. First, private participation wasbelow government expectations. Second, anumber of contracts were subsequentlyrenegotiated or cancelled. In general, privateinvestors perceived a high level of opera-tional and political risk, particularly becauseof the lack of reliable information on theoperational and financial outlook. More-over, the bulk of projects were implementedin South Africa.
Long-term success will require ensuringan enabling regulatory environment forboth private and public projects. In thisrespect, three challenges appear crucial.First, it is important to strike an adequatebalance in government budgets betweencapital and recurrent spending. Politicianstend to find more satisfaction in openingnew facilities—but throughout the develop-ing world, a maintenance deficit tends tosignificantly shorten the lifespan of expen-sive equipment. Second, it is essential toensure the financial viability of infrastruc-ture projects, with a focus on full costrecovery. It is notable that South Africa,which has made enormous progress inexpanding water and sanitation services,has a policy of full cost recovery. Third, it isessential that returns not be confiscated bythe government. A major risk for private-public partnerships is that governments willrenege on commitments to cost-recoveringtariffs once fixed investments are sunk.Addressing these concerns requires carefuldesign of the contracts and regulatory envi-ronments under which utilities operate.
Public Sector Governance: The Role of InstitutionsPublic sector governance has a significantimpact on economic outcomes, such asgrowth and poverty reduction, and on theachievement of the nonincome MDGs. Inmany ways improving governance is thebiggest challenge facing developing countries.
Building on the earlier discussion on the needfor sound public financial management and anenabling environment for private sector activ-ity, this section assesses progress in strength-ening a broader set of institutions—economicand political—that affect economic outcomes.
S P U R R I N G A N D S U S T A I N I N G E C O N O M I C G R O W T H
G L O B A L M O N I T O R I N G R E P O R T 2 0 0 5 55
0
2
5
910
Percent of GDP
1
43
876
Actuals Needed
Developing countries
5.5
3.5
Sub-Saharan Africa
9.2
4.7
Annual spending on infrastructure, 2005–15
FIGURE 2.18 Infrastructure spending fails to meet needs, particularly in Sub-Saharan Africa
Source: Estache and Yepes 2004.
US$ millions
1991 1992 1993 1994 1995 1996 1997
Sub-Saharan Africa
South Africa
1998
Year
1999 2000 2001 2002 2003
Private participation in infrastructure, 1991–2003
0
1,000
2,000
3,000
5,000
6,000
4,000
FIGURE 2.19 Private participation in infrastructure remains low in most Sub-Saharan countries, and has recently fallen
Source: Private Participation in Infrastructure database (World Bank).

Economic Governance
The perception that economic governance isweaker in Sub-Saharan Africa than in otherregions is broadly supported by availableindicators. For example, the Worldwide Gov-ernance Indicators, a comprehensive set ofmeasures compiled by the World Bank andbased on information from a wide set ofsources, show weak performance in Sub-Saharan Africa on four critical governanceissues—rule of law, voice and accountability,government effectiveness, and control of cor-ruption—throughout the period covered,1998–2004. The only exception is voice andaccountability, where Sub-Saharan Africaslightly outperforms the Middle East andNorth Africa and South Asia. Country Policyand Institutional Assessments (CPIAs), devel-oped by World Bank staff, paint a similar pic-ture, with Sub-Saharan Africa rated lowerthan all other developing regions on propertyrights and rule-based governance, quality ofbudgetary and financial management, effi-ciency of revenue mobilization, and quality ofpublic administration.
Crucially for investment flows, the percep-tions presented by these indicators are con-firmed by the risk assessment servicescommonly used by private investors. Forexample, the composite risk index from theInternational Country Risk Guide (ICRG)rates Sub-Saharan Africa as the highest-riskregion during 2000–3 (and consistently sincethe inception of the group’s assessments in the1980s).51 This overall rating is consistentwith the results of the previous section as wellas low scores on key economic governancedimensions such as bureaucratic quality, cor-ruption, and law and order.
Moreover, while there has been someimprovement in recent years on a few indica-tors in some Sub-Saharan countries, econo-metric evidence confirms that the region’scountries tend to underperform on gover-nance, relative to their income levels. Recentclaims to the contrary suggesting that the per-ception of weaker governance in Africa is dueentirely to low income levels assume that
higher income leads to better governance;these claims ignore the effect of potentialcausality from governance to income levels.Yet empirical evidence suggests that thestronger causality effect is from governanceto income and, once that is accounted for,most African countries have governancescores lower than would be expected on thebasis of their income levels (box 2.12).
Within this general assessment, disaggrega-tion of the previous indexes by income levelreveals important differences across Africancountries. While low-income countries in Sub-Saharan Africa are assessed as having weakerperformance than their counterparts else-where, the eight middle-income Sub-Saharancountries outperform other middle-incomecountries. This result holds for the WorldwideGovernance Indicators and the CPIA scores,as well as the ICRG risk assessments.52
Political Governance and Accountability
On political governance, Sub-Saharan Africa’sperformance is stronger, with indicators gen-erally ranking it ahead of some other develop-ing regions. For example, on Freedom House’s2005 rankings of political rights and civil lib-erties, Sub-Saharan Africa is rated “more free”than the Middle East and North Africa andSouth Asia. More impressively, the Databaseon Political Institutions maintained by theWorld Bank shows that by 2002, Sub-SaharanAfrica attained a higher percentage of coun-tries with chief executives selected throughcompetitive multiparty elections than the aver-age for other developing regions (figure 2.20).Finally, the African Governance Indicators,compiled for the United Nations EconomicCommission for Africa’s 2005 African Gover-nance Report,53 confirm the region’s higherscores on the political dimension and lowerscores on economic governance (box 2.13).
On press freedom, a key indicator ofpolitical accountability, the picture is simi-lar. A well-informed citizenry has beencalled the “ultimate constraint on a democ-ratic government,”54 and recent evidencepoints to the role of the media in promoting
C H A P T E R 2
56 G L O B A L M O N I T O R I N G R E P O R T 2 0 0 5

S P U R R I N G A N D S U S T A I N I N G E C O N O M I C G R O W T H
G L O B A L M O N I T O R I N G R E P O R T 2 0 0 5 57
A recent paper argues that weak governance is not a major factor in Africa’s poor growth performance(Sachs and others 2004). The argument is that, once their (low) level of income is accounted for, Sub-Saharan countries do not have particularly poor governance indicators. This point is illustrated in thefigure below, which plots the rule of law measure from the Worldwide Governance Indicators (on thevertical axis) against the logarithm of real per capita GDP in the mid-1990s (on the horizontal axis).Sub-Saharan countries are identified by green dots outlined in black. A striking observation is thatmore than half (27 of 46) of the countries in the region fall above the (ordinary least squares, or OLS)regression line, shown in black. The conclusion drawn by Sachs and others (2004) is that, with morethan half of the countries in the region performing better on governance than would be predicted bytheir income, the perception of weak governance in Africa is simply a reflection of low income levels.
But the simple correlation portrayed by the OLS regression line does not imply causality. Theabove argument assumes that higher income leads to (or causes) better governance. Intuitively, how-ever, causality could run in the opposite direction, with better governance leading to higherincome—or, more likely, in both directions. In either case, the OLS results do not isolate the differ-ent directions of causality and do not support any conclusion on the causal relationship betweengovernance and income.
On the other hand, the green lines are drawn from two attempts to effectively identify the direc-tion of causality. The upward-sloping green line is from Rigobon and Rodrik (2004) and the down-ward-sloping green line from Kaufmann and Kraay (2002). Although the two estimates use differentapproaches to identification, the conclusions are similar: Very few countries (7 and 6, respectively)fall above the regression line. Thus the evidence suggests that governance in Sub-Saharan Africa isnot as good as one might expect given the level of per capita income.
Source: Kaufmann, Kraay, and Mastruzzi 2005.
2.5
OLS regression line
Causal effect of incomeon governance
(Rodrik-Rigobon, 2004estimate)
Causal effect of income ongovernance
(Kaufmann-Kraay, 2002estimate)
–0.5 0.5 1 1.5 2–1.5–2.5 –2 –1–3 2.5
2
1.5
1
0.5
–0.5
–0.1
–1.5
–2
–3
Log GDPper capita in PPP, 1996
y = 0.82x – 0.01R2 = 0.68
Rule of Law index, 2004
AGOBDI
BENBFA
BWA
CAF CIV
CMRCOG
COM
CPV
DJIERI
ETH
GAB
GHA
GIN
GMB
GNB
GNQKEN
LSO
MDGMLI
MOZ MRT
MUS
MWI
NAM
NER
NGA
RWA
SDN
SEN
SLE
STP
SWZ
SYC
TCDTGO
TZA
UGA
ZAF
ZAR
ZMB
ZWE
BOX 2.12 How does governance affect per capita incomes in Africa, and vice versa?

good governance and holding governmentsresponsive and accountable.55 For 2004 theFreedom House indicator of press freedomranks Sub-Saharan Africa (with 50 percentof countries ranked as “not free”) ahead ofboth the Middle East and North Africa (100percent) and South Asia (75 percent).
Is Governance Improving?
On economic governance, there is little evi-dence of regionwide improvement. TheWorldwide Governance Indicators do notprovide any evidence of a relative improve-ment over the period covered, 1998–2004.56
Similarly, the most common ICRG indicators(bureaucratic quality, corruption, law andorder) show no improvement over time,while the CPIAs show only marginalimprovement.57 The same pattern of stagna-tion holds for both low- and middle-incomeSub-Saharan countries.
On the other hand, there have been sub-stantial improvements in political institutionsacross Sub-Saharan Africa. Since 1990 Free-dom House indexes on political rights andcivil liberties in Africa have outpaced the gen-eral trend toward more inclusive and openpolitical systems; similar indications are pro-vided by the polity index on democracy. Asnoted, equally positive has been the progresssuggested by the World Bank’s Database onPolitical Institutions, according to which Sub-Saharan Africa has made impressive stridessince the mid-1990s.
Can Policy Spur Institutional Reform?
Although institutions tend to persist, they arenot predetermined.58 Economic institutionshave improved considerably in Chile and thefast-growing countries of East Asia, andthere is evidence of recent improvements inpolitical institutions across Sub-Saharan
C H A P T E R 2
58 G L O B A L M O N I T O R I N G R E P O R T 2 0 0 5
Percent
Chief executives elected through competitive multiparty elections
1982 1987 1992 1997 20020
10
20
30
40
60
70
50
All othersAfrica
FIGURE 2.20 Participatory processes are improving in developing countries, but most rapidly in Africa
Source: World Bank Database on Political Institutions.Note: The index measures the percentage of country leaders elected in multiparty elections with less than 75 percent of the vote. The category “all others” includes developing countries in all other regions exceptEurope and Central Asia (for lack of comparable data for that region for the early part of the period covered).

S P U R R I N G A N D S U S T A I N I N G E C O N O M I C G R O W T H
G L O B A L M O N I T O R I N G R E P O R T 2 0 0 5 59
The African Governance Indicators, compiled as part of the United Nations Economic Commissionfor Africa’s (UNECA’s) African Governance Report 2005, offer interesting insights on the strengthsand weaknesses of different governance dimensions in Africa. Based on surveys of 25 Sub-Saharancountries, the figure below shows that, on average, the highest scores are given for indicators ofpolitical representation: the credibility of the electoral process, the freedom of political parties, andthe distribution of political power. Average scores were lower for the effectiveness of institutions inall three branches of government (executive, judicial, legislative). Scores were lower still for the effi-ciency of government services, the control of corruption, and the transparency and accountabilityof the civil service. Scores were lowest for the decentralization of government structures and cor-ruption in the tax system. Generally, these assessments are consistent with the thrust of the earlierdiscussion on economic and political governance.
The report identifies 10 priority areas in building capable and accountable states:
• Strengthening the capacity of parliaments to perform their core functions, including providingchecks and balances on the executive. Parliamentarians and their support staff need training andaccess to libraries and databases.
• Deepening legal and judicial reforms, including through protection and enforcement of theautonomy of the judiciary and modernization of the judicial process. The judiciary needs inde-pendent funding. Reforms must also cover the police force and public prosecutors.
• Improving public sector management through long-term, sustained efforts, tailored to countryneeds—for example, reducing red tape, accelerating improvements in pay and other incentives,and using in-country, regional, and international knowledge hubs.
• Improving the delivery of public services, through effective channels of accountability betweenpublic providers and their clients. Options include decentralizing and encouraging greater choiceand competition.
• Removing bottlenecks to private enterprise, to improve national and regional investment cli-mates. This requires macroeconomic stability, consistent policies and regulations for businessentry, protection of property rights, and enforcement of contracts.
• Tapping the potential of information and communication technologies for promoting trans-parency, openness, and knowledge exchange in the affairs of government. Due to high costs, astrategic approach to e-governance is needed.
• Fostering credible and responsible media that report accurate information and stimulate debatein an environment of freedom. Training is needed to support professionalism and effective self-regulation by the media.
• Maximizing the contribution of traditional modes of governance. Traditional authorities mustbe enabled to complement the resources of government in providing public goods and services,including for conflict prevention and resolution.
• Confronting the governance dimension of HIV/AIDS, which requires strong national leadershipto reduce the effects of the pandemic on institutional structures and to manage the resources andmechanisms needed for societywide responses.
• Getting partners to live up to their commitments for more and better aid through harmonizedprocedures, budget support, and predictable disbursements. Policies on aid, trade, and debt mustbe consistent with African efforts to achieve the MDGs.
This ambitious reform agenda will require considerable contributions in the area of politicalcommitment and supporting actions from donors, including assistance for capacity development.On every dimension, international financial institutions, in concert with bilateral donors, havelaunched initiatives to assist steadfast reformers push ahead.
BOX 2.13 The Economic Commission for Africa’s governance indicators and agenda

Africa. At times, crises or changes in leader-ship have led to institutional change, butthese are not amenable to policy guidance.More applicable is the possible role of policyin promoting improvements in economic orpolitical institutions.
In general, policies that open up economicopportunities to a circle wider than the ini-tially entrenched elite tend to be conducive toinstitutional improvement. An improvedinvestment climate tends to spur demand forwider institutional reforms because as“investors, whether domestic or foreign, comeforward, they tend to demand more effectiveinstitutions, greater security, and constantimprovements in the provision of publicgoods, which further enhances the quality ofthe investment climate.”59 Along the samelines, a number of studies have found thatstrengthening competition, including throughtrade openness, can be conducive to institu-
tional improvement.60 Opening up new mar-kets may reduce the rents derived from theprevailing economic and institutional arrange-ments and thus weaken vested interests.
There is also evidence that the wide avail-ability of independent sources of informationtends to encourage accountability. Whereownership of press outlets is monopolized bythe government, political and economic free-dom tends to be lower and corruptionhigher—and when there is more informationavailable on policy choices and outcomes, gov-ernments tend to be more responsive.61 In aprominent case, Amartya Sen drew a linkbetween the impact of transparency on the rel-ative incidence of poverty and famine in Chinaand India.62 The combination of higher trans-parency of public decisions and press freedomto stoke the public debate tends to constrainthe options available to policymakers andreduce the scope for institutional failure.
C H A P T E R 2
60 G L O B A L M O N I T O R I N G R E P O R T 2 0 0 5
Stronger performance on political representation; weaker performance on public sectormanagement and institutional effectiveness
Source: UNECA (2004).Notes: The scale is from 0 to 100, where scores close to 100 reflect good governance as perceived by thesurvey respondents. CSO = Civil Society Organizations.
70605040200
Corruption control
10 30 100
Economic management
CSO/media independence
Executive’s effectiveness
Human rights and rule of law
Institutional effectiveness/accountability
Political representation
48
49
54
44
48
48
65
Perception of key dimensions of governance(average for 23 African countries)
BOX 2.13 The Economic Commission for Africa’s governance indicators and agenda (continued)
In some cases external anchors may alsocontribute to institutional change. In combi-nation with domestic commitment to reform,external incentives, constraints, and agree-ments may help in breaking throughentrenched interests and other domesticimpediments to reform. This has been true inthe case of accession to the European Unionfor new members in Central and EasternEurope, to the North American Free TradeAgreement (NAFTA) for Mexico, and to theWorld Trade Organization (WTO) for China.In Africa the New Partnership for Africa’sDevelopment (NEPAD) aims to use collectivecommitments and peer pressure to promoteinstitutional reform (see below). Conces-sional loans and technical assistance frominternational financial institutions are alsogeared to improving the policy and institu-tional framework in borrowing countries.
Priorities for Building Capable andAccountable States in Africa
Across Sub-Saharan Africa there is growingrecognition of the critical role of good gover-nance, and a renewed resolve to improve per-formance on the ground. Under the aegis ofNEPAD, African states have agreed toimprove their economic and political gover-nance. The work of regional developmentagencies is focusing more on governance, andthe United Nations Economic Commissionfor Africa’s 2005 African Governance Reportrepresents a major contribution to the buildupof a critical mass of country-specific data andanalysis on governance achievements andchallenges. On the ground, NEPAD continuesto advance with the African Peer ReviewMechanism (APRM), its innovative approachto improving governance.
Already, 23 countries—containing aboutthree-quarters of the population of Sub-Saha-ran Africa—have acceded to the APRM, a keyobjective of NEPAD since its inception in2001. Under the APRM, African countries vol-unteer to “open their books” on political gov-ernance, economic governance, corporategovernance, and socioeconomic development.
The underlying objective is to foster the adop-tion of policies, standards, and practices thatlead to political stability, high economicgrowth, sustainable development, and acceler-ated subregional and continental economicintegration through sharing of experiences andreinforcement of successful and best practice.
In 2004 NEPAD heads of state approvedGhana, Kenya, Mauritius, and Rwanda asthe first countries to be exposed to theAPRM reviews. The second group of coun-tries to be reviewed will include Algeria,Mali, Mozambique, Nigeria, Senegal, andSouth Africa. The four countries that havestarted the review process have establishedfocal points (at ministerial level or higher)for the APRM as well as national coordinat-ing mechanisms to secure widespread con-sultations through all APRM stages. Theextended design of the APRM processemphasizes learning and seeks to build moreinclusive processes than are typically foundin, for example, poverty reduction strategy(PRS) formulation and implementation.
Recent changes in approach have consid-erably lengthened the process, and the focushas changed from the regional to the countrylevel. With the limited capacity of the APRMsecretariat to prepare background analysesof countries and to promote substantive,political discussions on governance problemsin the individual countries as well as in thePeer Review Panel and Forum, the APRMfaces the challenge of moving beyond formalconsultations and extended processes. Theseare critical challenges for the APRM as themost innovative and potentially influentialcomponent of NEPAD.
In the period ahead, it will be essential totranslate the recent improvements in politicalinstitutions to similar enhancements in eco-nomic institutions, particularly in rule-basedgovernance and protection of property rights.Extending reforms to these critical dimensionsof governance would begin to set in motion avirtuous circle consisting of renewed incentivesfor better policies, a more favorable environ-ment for private investment, and rising livingstandards. Better policies can play a role in
S P U R R I N G A N D S U S T A I N I N G E C O N O M I C G R O W T H
G L O B A L M O N I T O R I N G R E P O R T 2 0 0 5 61

spurring institutional development, includingby helping to overcome resistance to changefrom entrenched interests. In practice, politicalcommitment will be key in ensuring thatreforms extend beyond mere changes of for-mal laws to more fundamental transforma-tions of daily practice, including informal rulesof behavior and the impact of vested interests.
Notes1.The scenario presented is based on current
trends and primarily useful as a reference point.2.The tsunami that hit Indian Ocean countries
in December 2004 caused a human tragedy of epicproportions. The quick humanitarian and finan-cial response of the rest of the world helped theaffected countries quickly launch the recovery andreconstruction process and also helped limit theeconomic and financial costs of the tragedy. Basedon initial assessments, the macroeconomic impactis expected to be modest for India, Indonesia, SriLanka, and Thailand. Although the impact ongrowth and inflation will also be modest in theSeychelles, the economy was not as robust as in theother countries prior to the disaster, and there maybe increased pressure on the fiscal position and thebalance of payments in 2005. In the Maldives,where the physical destruction was also significant,the macroeconomic impact may be more pro-nounced, with initial estimates suggesting that out-put in 2005 may be lower than forecast by some 5percentage points of GDP. Somalia was alsoaffected by the disaster, but the relative lack ofinformation and absence of an internationally rec-ognized government operating in the country haveslowed the pace of assessments, which are cur-rently under way.
3. In addition, for some regions the $1 a daypoverty line may underestimate the extent ofpoverty. Using a $2 a day definition of poverty, theheadcount measure for East Asia and Pacificwould be 69.9 percent for 1990 and 11.3 percentfor the 2015 forecast, for Europe and Central Asiait would be 4.9 percent and 5.2 percent, and forLatin America and the Caribbean it would be 28.4percent and 19.6 percent.
4. This section draws on IMF (2005b).5. The figure excludes Europe and Central
Asia, for which membership has varied consider-ably across the period covered, and Middle Eastand North Africa, where heavy reliance on oil com-
plicates regional comparisons. In either case, therelevant conclusions are robust to their inclusion.
6. Equatorial Guinea should also be includedin this group, but its period average growth ratehas been heavily influenced by spectacular oil-ledgrowth since the mid-1990s.
7. The estimates of inequality and the argu-ment on the political economic consequences ofobserved patterns across Africa are both fromArtadi and Sala-i-Martin (2003). The same studypoints out that most of the inequality in Africa canbe accounted for by inequality within countriesrather than across countries.
8. The major oil producers in Sub-SaharanAfrica are Angola, Cameroon, Chad, Republic ofCongo, Equatorial Guinea, Gabon, and Nigeria.
9. Bosworth and Collins (2003, p. 8).10. See Bosworth and Collins (2003) and
Tahari and others (2004). Growth in total factorproductivity reflects not just changes in economicefficiency, but also the influence of growth deter-minants not otherwise included in measuredchanges in physical or human capital, includingpolitical instability and conflicts, droughts andother exogenous shocks, and changes in govern-ment policies and institutions.
11. While HIV/AIDS prevalence rates differwidely across countries, ranging from 1 to almost40 percent, average life expectancy across theregion has fallen over the past 15 years, largelydue to HIV/AIDS. The primary effect ofHIV/AIDS is an increase in mortality and a dete-rioration in health, primarily among youngadults. In turn, HIV/AIDS affects most of thecommon indicators of living standards, such asincome, health standards, and access to educa-tion—and success in combating HID/AIDS, alongwith other communicable diseases, is one of theMDGs. The channels through which the diseaseaffects economic growth are not well understood.Studies focused on disruptions to the productionprocess, and additional health expenditures tendto find modest effects. On the other hand, studiesthat have attempted to capture some of the micro-economic impacts associated with the disease finda larger effect on economic growth owing, forexample, to disruptions in the process of accumu-lating human capital (Haacker 2004).
12. The earlier spotlight on unique drivers ofAfrican growth has given way to a more complexexplanation as the empirical relevance of the“African dummy” has been eliminated and amore policy-relevant dialogue has focused on the
C H A P T E R 2
62 G L O B A L M O N I T O R I N G R E P O R T 2 0 0 5

underlying determinants of economic outcomes.See, for example, Hoeffler (2002).
13. Satyanath and Subramanian (2004)attribute the causes of long-run macroeconomicinstability to the incidence of conflict, lack ofopenness to trade, and ineffective political institu-tions. This raises the general question of the extentto which macroeconomic policy is a function ofdeeper determinants and thus not an independentdriver of growth. It is clearly the case that macro-economic performance is partly driven by deeperpolitical, economic, and structural factors. But avariety of evidence, including case studies andexperience, suggests that there is an important rolefor macroeconomic policy itself. In any case, bothmacroeconomic policy and underlying institu-tional policies must be addressed simultaneously.
14. Artadi and Sala-i-Martin (2003); Tsan-garides (2005).
15. The impact of foreign aid on recipient coun-tries has been a controversial question in the acad-emic literature, with earlier results often found notto be robust to changes in sample or specification.Recently, Clemens, Radelet, and Bhavnani (2005)found that economic aid raised growth in Sub-Saharan Africa, but they also found evidence ofdiminishing returns to aid. By their estimates, rais-ing aid to Sub-Saharan Africa from current levelsto the point at which marginal returns diminish tozero, at close to 17 percent of GDP, would raisegrowth in the region by 0.4 percent per year. Rajanand Subramanian (2005) find no evidence that aidis associated with growth.
16. See Collier, Hoeffler, and Soderbom (2004)on duration, Collier and Hoeffler (2004a) on thecosts, and Staines and others (2005) on the macro-economics of recovery from conflict.
17. Growth accelerations are defined in box 2.6.18. The lower incidence of growth accelera-
tions in Sub-Saharan Africa does not seem to beattributable to the region’s higher proportion oflow-income countries. Measured by the percent-age of country years spent in acceleration episodes,the incidence of growth accelerations has beenunrelated to either the initial level of income percapita or the initial savings rate—a result thatholds for both the overall sample of countries andfor those in Sub-Saharan Africa.
19. The cutoff at 1998 is imposed to allow cal-culation of the post-episode five-year average.
20. Hausmann, Pritchett, and Rodrik (2004)find that statistical models tend to have modestexplanatory power but that political regime
changes, macroeconomic stabilizations, and posi-tive terms of trade shocks tend to be statisticallysignificant predictors of accelerations, and thatsustained booms tend to be associated with eco-nomic reform rather than external shocks.
21. World Bank (2005).22. In heavily indebted poor countries, debt sus-
tainability is closely linked to the attainment of thecompletion point under the enhanced HeavilyIndebted Poor Countries (HIPC) Initiative. In addi-tion, successful implementation of the new Bank-IMF forward-looking debt sustainability frameworkfor low-income countries will be critical. This in turnwill require an adequate supply of grant financing.These issues are discussed in chapter 5.
23. The fragility of fiscal sustainability withrespect to domestic financing is illustrated by sev-eral African countries that saw sharp increases indomestic real interest rates as domestic debt levelsrose from very low levels to amounts that wouldnot typically be considered excessive in moredeveloped economies. The examples of Ghana,Malawi, and Zambia show how even what looklike relatively small increases in domestic debt cansharply increase real interest rates.
24. There is no universal definition of a success-ful stabilization (that is, a post-stabilization) coun-try. Adam and Bevan (2005) suggest that inflationrates lower than 15 percent for at least two years aresufficient for qualification as a successful stabiliza-tion. Gupta and others (2002) propose a combina-tion: fiscal deficits under 2 percent of GDP andinflation rates under 10 percent. A forthcoming IMFstudy advances a more comprehensive measure:some degree of internal macroeconomic balance,proxied by positive per capita growth rate and lowinflation; a fiscal stance that is sustainable over themedium term, proxied by restricted domestic financ-ing of the budget deficit; and robustness to externalshocks, proxied by the level of international reserves.
25. IMF (Forthcoming).26. Using the alternative indicators of the fiscal
balance to assess progress in Sub-Saharan Africawould tend to reduce the number of countries con-sidered successful stabilizers.
27. Despite the caveats mentioned in the texton the applicability of overall fiscal deficits toassess the sustainability of fiscal positions in Sub-Saharan Africa, it is worth noting that empiricalestimates of the deficit-growth nexus yield a sub-stantively similar conclusion in suggesting thatsome African countries could boost growth with areduction in fiscal deficits. Recent studies indicate
S P U R R I N G A N D S U S T A I N I N G E C O N O M I C G R O W T H
G L O B A L M O N I T O R I N G R E P O R T 2 0 0 5 63

that post-stabilization countries with low deficitsmay not benefit from further fiscal consolidation.However, most countries in Sub-Saharan Africahave a fiscal deficit higher than the threshold of1.5–2.5 percent of GDP (Adam and Bevan 2005).At the end of 2003 there were 25 countries in Sub-Saharan Africa with a fiscal deficit, includinggrants, higher than 2.5 percent of GDP, with 13countries exceeding 5 percent. Among the lattergroup, the growth rate per capita was 0.9 percentin 2003, compared with the regional average of1.2 percent.
28. As of April 2004 this group includedBotswana, Cape Verde, Equatorial Guinea,Gabon, Mauritius, Namibia, Seychelles, Swazi-land, and South Africa.
29. World Bank (2005, chap. 3, p. 16).30. Within Sub-Saharan Africa the pattern of
relative underallocation toward capital expendi-tures and the social sectors is particularly strikingin the oil economies, which tend to underinvest rel-ative to other countries in the region.
31. The data, contracts, and audit reports areavailable at http://www.mefb-cg.org.
32. Le Houerou and Taliercio (2002, p. 35). 33. IMF (2005a).34. IMF (2003).35. Tax reform could also contribute to policy
stability by helping to moderate the relatively largevariance of revenue ratios in African countries.This tendency for greater variability effectivelyreduces the level of sustainable debt, among otherthings.
36. As noted, sustainable policy configurations,by promoting private investment and economicgrowth, can be an effective source of fiscal space.
37. Bulir and Lane (2002) document that aidhas been up to seven times more volatile thandomestic fiscal revenue, and that aid disbursementshave not been well predicted by aid commitments.
38. See, for example, Levine and Renelt (1992)on the robustness of investment in cross-countryregressions, and Collier and Gunning (1997) onthe conclusion that investment in Africa is low.
39. For example, Devarajan, Easterly, and Pack(2001) and, more recently, Eifert, Gelb andRamachandran (2004). Arguably, the reportedhigh level of capital flight from Sub-Saharan Africacould be seen as a rational response to the lack ofprofitable investment opportunities at home (Col-lier, Hoeffler, and Pattillo 1999).
40. The Investment Climate Surveys and theassessment of business regulations in Doing Busi-
ness 2005 were conducted by the World Bank incollaboration with local partners. There have been8 surveys completed by countries in Sub-SaharanAfrica, in a total of 53 across all developingregions, and 8 more are planned over the next year.The goal of the exercises is to assess the impact ofthe investment climate on firm performance, andto measure business regulations across the worldand benchmark best practices. Doing Business2005 covers 145 countries, including 32 in Sub-Saharan Africa.
41. The ease of doing business index is the sim-ple average of country rankings (from 1-135) ineach of the seven measures included in DoingBusiness 2005, with higher values indicating moreefficient regulation and stronger protection ofproperty rights.
42. Labor regulation rigidity is the average ofthe difficulty of hiring index, rigidity of hoursindex, and difficulty of firing index. This indicatorranges from 0-100, with higher values indicatingmore rigid regulation.
43. Djankov, McLiesh, and Ramalho (2004).44. Doing Business in 2005.45. This a key message of World Bank (2004b).46. Hanson and Ramachandran (2004).47. Doing Business database.48. There are, of course, other good reasons to
prioritize investments in infrastructure, such asenhancing service delivery and accessibility in linewith the nonpoverty goals of the MDGs; these arediscussed in chapter 3.
49. Estache and Goicoechea (2004).50. Estache and Yepes (2004).51. The International Country Risk Guide
(ICRG) economic risk index is a weighted averageof measures on political, economic, and financialrisk components, with the values ranging from 0-100, where a higher score indicates lower risk.During 2000-3 the median rating for Sub-SaharanAfrica was 59, followed by South Asia at 62, LatinAmerica and the Caribbean at 67, East Asia andthe Pacific, Europe and Central Asia, and the Mid-dle East and North Africa at 70, and high-incomecountries (OECD and others) at 82.
52. On the ICRG economic risk index, low-income countries in Sub-Saharan Africa have a riskassessment of 31.0, compared with 33.5 for otherlow-income countries (where a lower score impliesa higher risk). On the other hand, the same indexrates middle-income countries in Sub-SaharanAfrica at 36.5, compared with 35.5 for other mid-dle-income countries.
C H A P T E R 2
64 G L O B A L M O N I T O R I N G R E P O R T 2 0 0 5

53. United Nations Economic Commission forAfrica: Striving for Good Governance in Africa. Syn-opsis of the 2005 African Governance Report (Pre-pared for the African Development Forum IV, AddisAbaba, October 2004; http://www.uneca.org/agr/).
54. McMillan and Zoido (2004, p. 87).55. Besley and Burgess (2004); Djankov and
others (2003).56. These indicators are not, strictly speaking,
designed to show progress over time, but they doindicate whether a region is making progress rela-tive to others over time.
57. The improvement in CPIAs during 1999-2003 is marginal in two senses: relative to the
average improvement in other regions and, statis-tically, relative to the standard deviation.
58. This section draws on IMF (2003).59. Stern (2001).60. See, for example, Ades and Di Tella (1999),
Berg and Krueger (2003), Djankov and others(2001), Wei (2000), and World Bank (2002).
61. See, for example, Djankov (2002), Adserà,Boix, and Payne (2003), and Brunetti and Weder(2003) on the relationship between the press andgovernance, and Besley and Burgess (2002) on therelationship between government responsivenessand newspaper circulation.
62. Sen (1995).
S P U R R I N G A N D S U S T A I N I N G E C O N O M I C G R O W T H
G L O B A L M O N I T O R I N G R E P O R T 2 0 0 5 65


The chance for every child to go to pri-mary school. A place to go for medi-cine and basic health care. Clean water
flowing from a tap. Sanitation. Electricity atthe turn of a switch. These basic services aretaken for granted by citizens of developedcountries. Yet in much of the developingworld—even for relatively wealthy groups—these services are either unavailable or avail-able only at low quality or high private cost.
The human development outcomes at thecore of the Millennium Development Goals(MDGs)—primary education, literacy, gen-der equality, good health—depend on accessto these basic services. Human developmentoutcomes are also influenced by many otherfactors, such as individuals’ traits and familybackgrounds, community features (includingroads and communications), and countrycharacteristics (including income, demogra-phy, geography, and history). But striking dif-ferences in these outcomes across countriescan be explained to an important degree bythe policy choices that governments make toshape the financing and delivery of the basiceducation, health, water, and sanitation ser-vices that directly affect human development.
This chapter assesses the progress thatcountries and regions are making toward thehuman development MDGs, focusing on thethree most difficult implementation chal-lenges for most countries:
• Scaling up skilled providers—the doctors,nurses, and teachers needed to rapidlyexpand health and education services.
• Ensuring the sustained financing requiredto expand these recurrent cost intensiveservices.
• Making sure that resources translate intoeffective service delivery, by improvinggovernance and accountability.
This selective focus means that the chaptergives less attention to many other issues—such as social protection, population trends,pharmaceutical availability, and school con-struction—that are also important for MDGprogress. The goal is to complement otheranalyses, including Global Monitoring Report2004 and the recent Millennium Project andtask force reports, which are more compre-hensive. The chapter also contains an assess-ment of MDG-related global programslaunched since 2000 and of the role donorsneed to play in accelerating MDG progress. Itconcludes with an action agenda for countriesand their development partners derived fromthis stocktaking.
The Pace of MDG Progress,2000–5Five years after the global commitment was madeto the MDGs, progress has been inadequate toensure their attainment. Sub-Saharan Africa is
G L O B A L M O N I T O R I N G R E P O R T 2 0 0 5 67
Scaling Up Service Delivery3

not on track to achieve a single MDG. In addi-tion to the goals discussed in the following sec-tions, it is off track on the hunger goal—and isthe only region where child malnutrition is notdeclining. South Asia is off track on six goals:gender equality, universal primary school com-pletion, child mortality, maternal mortality,communicable diseases, and sanitation. Andwhile malnutrition in the region is droppingsufficiently to achieve the MDG target reduc-tion, it remains at very high absolute levels:almost half of children under five are under-weight. The Middle East and North Africa isalso off track on six goals: gender equality, uni-versal primary completion, child mortality,communicable diseases, water, and sanitation.Europe and Central Asia is off track on childmortality, maternal mortality, communicablediseases, and sanitation. And both Latin Amer-ica and the Caribbean and East Asia and thePacific are off track on child mortality, mater-nal mortality, and communicable diseases.
This slow progress is all the more troublingbecause the MDGs are only first-stage devel-opment goals; no 21st century country canafford to focus on these alone. No matter howfar they are from universal primary comple-
tion, countries must simultaneously invest insecondary and tertiary education—both toproduce the skilled workers that health, edu-cation, and other sectors need, and becauseincreasing rates of primary completion gener-ate social demand for more schooling. Nomatter how high child mortality is, countriesmust also address increased chronic diseasesamong adult populations. In a world of com-peting priorities and devastating natural disas-ters, the challenge facing developing countriesis not just to achieve the MDGs; it is to achievethem at minimum global cost while simultane-ously advancing other important goals. Thefollowing sections look at where progress isbeing made, where it is not, and why.
Gender Equality
The world will not achieve the first MDG tar-get, set for 2005: gender equality in primaryand secondary education. Despite strongprogress in every region, girls’ enrollments atthe primary level are still less than 90 percentof boys’ in Sub-Saharan Africa, South Asia,and the Middle East and North Africa (figure3.1). At the secondary level, only Europe and
C H A P T E R 3
68 G L O B A L M O N I T O R I N G R E P O R T 2 0 0 5
Middle East & North Africa
Sub-SaharanAfrica
South Asia
1990 2002
Ratio of female to male gross enrollment rates in primary education
0.0
0.2
0.4
0.6
0.8
1.0
Middle East & North Africa
Sub-SaharanAfrica
South Asia
1.0
0.8
0.6
0.4
0.2
0.0
MDG target MDG target
Ratio of female to male gross enrollment rates in secondary education
FIGURE 3.1 Despite progress, the 2005 gender target will not be met
Source: UNESCO Institute for Statistics.

S C A L I N G U P S E R V I C E D E L I V E R Y
G L O B A L M O N I T O R I N G R E P O R T 2 0 0 5 69
Central Asia has achieved enrollment parity.Primary completion rates show the same pat-tern—great progress in narrowing the gap, butas of 2003 the completion rate for girls wasstill more than 15 percent below that of boysin Sub-Saharan Africa and South Asia. Fore-casts for the 2015 goal of gender equality intertiary education are even less encouraging,with less than 10 percent of developing coun-tries on track to achieve this target.
Although gender parity in primary educationwill not be reached globally in 2005, an impres-sive number of countries will achieve it—even inthe three regions with the deepest educationinequality. In Sub-Saharan Africa these coun-tries include Botswana, Gabon, The Gambia,Lesotho, Mauritania, Mauritius, Namibia,Rwanda, Seychelles, Tanzania, Uganda, andZimbabwe; in South Asia, Maldives and SriLanka; and in the Middle East and NorthAfrica, Jordan, Libya, Oman, and Saudi Arabia.Jordan and Oman have also achieved genderparity in secondary education.
While some of these countries had rela-tively equitable gender outcomes in educationin 1990 (the year against which progresstoward the MDGs is measured), in otherspolicy actions and incentives have trans-formed the playing field for girls. In Guineagirls’ enrollments in primary education rosefrom barely 40 percent of boys’ in 1990 to aprojected 88 percent in 2005. Similarprogress has been made in Benin, The Gam-bia, and Mauritania, as well as Bangladesh,Morocco, Nepal, Papua New Guinea, andYemen. How did they do it? Box 3.1 profilesdifferent strategies.
But achieving gender equality and empow-ering women—the third MDG—requiremore than parity in education enrollments.Additional targets include attaining genderparity in literacy and increasing the share ofwomen in nonagricultural employment andnational parliaments. Although progress hasbeen made, the gap has not closed in Sub-Saharan Africa, South Asia, and the MiddleEast and North Africa, where literacy ratesamong 15–24-year-olds are 10–20 percentagepoints lower for women than for men.
Paid employment is crucial to women’sempowerment and important to families’ wel-fare because women are more likely than mento invest their income in health care, educa-tion, and food.1 But progress has been slow inthis area. Between 1990 and 2003 women’sshare of nonagricultural employment in devel-oping countries increased only 2 percentagepoints, from 35 percent to 37 percent.
More encouraging has been progress in polit-ical representation. The share of countrieswhere women hold at least one-fifth of the seatsin national parliaments grew from 13 percent in1990 to 24 percent in 2004—a significantchange. But as noted in a report prepared for therecent 10-year follow-up to the 1995 BeijingConference on Women, the real mark ofprogress is women’s greater prominence inpolitical life translating into leadership positionsand more influence over decision making. Andin many cases, that has yet to happen.2 Muchremains to be implemented from the Beijingaction plan, including faster progress on thegender equality targets reaffirmed in the MDGs.
The world’s failure to meet the 2005 targetfor gender parity in primary and secondary edu-cation should not be rewarded with a reprieveto 2015. Most regions are on track to achieveparity sooner—particularly at the primary level,where girls’ enrollments have been growingfaster than boys’ in every region. The UnitedNations should review the latest data and set anew year for this target, such as 2007 or 2008,to encourage the fastest possible progress.
Universal Primary Education
Primary education completion rates areincreasing in all developing regions. But as withgender equality, in the Middle East and NorthAfrica, South Asia, and especially Sub-SaharanAfrica the pace of progress is too slow to ensureattainment of the second MDG: universal pri-mary completion by 2015 (figure 3.2). LatinAmerica and the Caribbean has made strongprogress and, on a population-weighted basis,both it and East Asia and the Pacific are closeto achieving the goal. In both regions, though,some smaller countries are not on track.

C H A P T E R 3
70 G L O B A L M O N I T O R I N G R E P O R T 2 0 0 5
Twelve Sub-Saharan countries will meet the 2005 target of gender parity in primary education, andat least three others will come close. Many countries in other regions have also made exceptionalprogress in getting girls into school. In every case some combination of the following policies liesbehind the progress:
• Making schools affordable. Eliminating school fees increases both girls’ and boys’ enrollments—but as shown in Tanzania and Uganda, these policies have a larger effect on girls. Countries suchas Bangladesh and The Gambia have gone further, providing scholarships and financial aid forgirls in the poorest communities. World Food Program “take-home rations” in Eritrea, Ethiopia,Ghana, Guinea, and many other African countries have also been associated with significantincreases in girls’ school attendance and completion.
• Reducing the distance to school. New schools often expand girls’ enrollments faster than boys’because they relieve concerns about girls’ safety in walking long distances to school.
• Providing water and sanitation at schools. In Bangladesh, India, Kenya, Nigeria, and other coun-tries the introduction of clean, private sanitation and washing facilities in schools has raised girls’attendance rates by as much as 11 percent. UNICEF surveys in Africa and Asia show that insome countries as few as 10 percent of schools have adequate, separate sanitation facilities forboys and girls, and in some schools as many as 150 students share a single latrine. Standpipes atschools also ease the burden that girls face in fetching household water from distant sources.
• Providing bilingual instruction. Instructing children in their first language during the early yearsof schooling lowers repetition and raises attendance, classroom participation, exam scores, andpromotion rates—especially for girls. In Mali teaching in the mother tongue in grade 1 and grad-ually replacing it with French afterward has led girls to volunteer more during class, read morecomfortably, and stay in school. In Mauritania a switch to Arabic language instruction hasincreased girls’ enrollments.
• Increasing the number of female teachers. In Botswana a consistently positive relationship hasbeen found between the proportion of female teachers in a school and girls’ achievement levels.The Gambia has reviewed curriculums to ensure that they are gender-sensitive and offers careercounseling for girls.
• Involving the community. Involving communities in the development of national and local actionplans helps identify and address factors that deter girls from attending school. In 1993 The Gam-bia became the first country to apply the Participatory Learning and Action approach to girls’education. Ideas that emerged included flexible fee payment schedules, separate latrines for girlsand boys, and enforcement of sexual harassment policies in schools—and sharply increased girls’enrollments at both the primary and secondary levels. In Guinea, Kenya, Senegal, and Ugandathis approach has led to changes in school calendars and fee policies, the creation of single-sexschools, and provision of community-supervised protection for girls.
• Raising public awareness. Niger’s increase in girls’ primary enrollments is partly due to cam-paigns on the importance of girls’ education, particularly in rural areas. The Gambia has usedwomen’s theater groups to raise community awareness about the importance of girls’ education.
• Making schools girl-friendly. Allowing married and pregnant adolescents to attend school andoffering flexible school schedules has promoted girls’ secondary school attendance in Botswana,Guinea, Kenya, Malawi, and Zambia.
Sources: IRC 2004; UNICEF Nigeria 2003; UNICEF India 2003 and other data; Sen 2000; UNICEF Somalia1999.
BOX 3.1 Sub-Saharan Africa shows that fast progress is possible in closingthe gender gap

Although Europe and Central Asia needs toaccelerate progress, the goal is within reach.
In the Middle East and North Africa, coun-tries such as Morocco have made rapidprogress, although primary completion ratesin many of the large population countries inthe region have been stagnating. In South Asia,reaching the education MDG will requirefaster overall progress: in India, where impres-sive performance in a number of states has notyet translated into aggregate national progress;in Pakistan, which remains seriously off track;and Afghanistan, which is recovering quickly,but from a tragically low base.
In Sub-Saharan Africa the overall prospectsare dim. In 2003 only 59 percent of childrencompleted primary school, and on currenttrends the region will not achieve universalprimary completion until 2061.
Yet enormous education progress is beingmade in many Sub-Saharan countries. Annual
increases in primary completion in the region’sbest-performing countries far exceed anythingachieved by today’s developed countries whenat a similar stage in their development.3 Since1990, 8 of the developing world’s 10 top per-formers have been in Africa: Benin, Eritrea,Ethiopia, Guinea, Mali, São Tomé and Principe,Togo, and Malawi. In all these countries pri-mary completion rates have grown by morethan 5.0 percent a year, well above the low-income country average of 0.8 percent. Coreelements of policy progress in these and othercountries have been political commitment touniversalizing education, actions to lower thecosts of expanding schooling through more effi-cient construction, teacher training, and hiring,attention to crucial inputs such as books andmaterials, and “demand side” adjustments tomake schools more accessible—by adapting thelanguage of instruction, changing school calen-dars, eliminating fees, and other actions.
S C A L I N G U P S E R V I C E D E L I V E R Y
G L O B A L M O N I T O R I N G R E P O R T 2 0 0 5 71
110
1990
97
10097
Perc
ent o
f re
leva
ntag
e gr
oup
1995 2000 2005 2010 2015
1990 2004 2015Primary completion rate
Actual Path to goal
10090807060
4050
110
1990
90
100
88
50
1995 2000 2005 2010 2015
10090807060
4050
110
1990
97 100
88
1995 2000 2005 2010 2015
10090807060
4050
110
1990
84
100
79
1995 2000 2005 2010 2015
10090807060
4050
110
1990
80
100
74
1995 2000 2005 2010 2015
10090807060
4050
110
1990
59
100
1995 2000 2005 2010 2015
10090807060
4050
Goal
Europe & Central Asia
Middle East & North Africa South Asia
East Asia & Pacific Latin America & the Caribbean
Sub-Saharan Africa
Perc
ent o
f re
leva
ntag
e gr
oup
FIGURE 3.2 Several regions are off track to achieve universal primary completion by 2015
Sources: UNESCO Institute for Statistics and World Bank joint database.Note: Data are weighted by population.

For many countries the main challenge forattaining this MDG is the very low base fromwhich they started. For any country with a pri-mary completion rate below 60 percent in2003, even the highest recorded rates ofimprovement (on a percentage point basis)would not be enough to attain the MDG.Around the world, 26 countries fall below thatthreshold—and 22 are in Sub-Saharan Africa.
In another set of countries, though, slowprogress is the issue. Between 1990 and 2000the primary completion rate was stagnant inGhana, Kenya, Nigeria, and Tanzania, andhas only recently begun to increase. Thesecountries can attain universal primary com-pletion, but only if progress improves sub-stantially and is sustained. That is also truefor a significant number of countries in otherregions, most notably India. There is clearscope for knowledge diffusion and increased
financing to help lagging countries, includingthrough global programs such as the Educa-tion for All Fast Track Initiative. But globalattainment of universal primary education by2015 is far from assured.
Child Mortality
Every week in the developing world, 200,000children under five die of disease—as manylives as were lost in the recent South Asiantsunami. The fourth MDG aims to reduceinfant and under-five mortality by two-thirdsbetween 1990 and 2015, implying an averagereduction of 4.3 percent a year. Although noregion achieved such a population-weightedreduction in the 1990s, Latin America andthe Caribbean, the Middle East and NorthAfrica, and East Asia and the Pacific are notfar off track (figure 3.3).
C H A P T E R 3
72 G L O B A L M O N I T O R I N G R E P O R T 2 0 0 5
200
1990
41 2059
Dea
ths
per
1,00
0 liv
e bi
rths
Dea
ths
per
1,00
0 liv
e bi
rths
1995 2000 2005 2010 2015
1990 2004 2015Under age five mortality
Actual Path to goal
150
100
50
0
200
1990
36 1546
1995 2000 2005 2010 2015
150
100
50
0
200
1990
331853
1995 2000 2005 2010 2015
150
100
50
0
200
1990
53 2677
1995 2000 2005 2010 2015
150
100
50
0
200
1990
92
43
130
1995 2000 2005 2010 2015
150
100
50
0
200
1990
171
62
187
1995 2000 2005 2010 2015
150
100
50
0
Goal
Europe & Central Asia
Middle East & North Africa South Asia
East Asia & Pacific Latin America & the Caribbean
Sub-Saharan Africa
FIGURE 3.3 Despite progress on child mortality, all regions are off track
Sources: UN and World Bank staff estimates.Note: Data are weighted by population.

As with the primary completion rate, thereis substantial variation in trends at the coun-try level. Even in Sub-Saharan Africa, wherelittle progress has been made overall, coun-tries such as Ethiopia, Malawi, Mozambique,Namibia, and Uganda have improved childsurvival despite challenging circumstances,such as widespread HIV/AIDS (box 3.2). Butother Sub-Saharan countries saw child mor-tality increase in the 1990s, erasing earlierprogress.
About 70 percent of child mortality occursin the first year of life, and almost 40 percent inthe first month. Most of these deaths are due tofive highly preventable and treatable condi-tions: acute respiratory infections, diarrhea,malaria, measles, and malnutrition. Basic post-natal care, breastfeeding, and access to simple,low-cost treatments for diarrheal diseases canhave a major impact on infant mortality. Watersupply and sanitation can also make a big dif-ference: about 90 percent of diarrheal deathsamong children are due to lack of safe waterand sanitation.4 Finally, low-cost immuniza-tions against measles, diphtheria, polio, andother diseases can prevent a lot of childhoodsickness and death. Encouragingly, three devel-oping regions have achieved 90 percent immu-nization coverage against measles: Europe and
Central Asia, the Middle East and NorthAfrica, and Latin America and the Caribbean.But coverage has fallen in East Asia and thePacific, and in Sub-Saharan Africa it has stag-nated at less than 60 percent.
Maternal Mortality
Every week 10,000 women in the developingworld die giving birth. A woman’s risk ofdying during delivery is 250 times higher inlow-income than in developed countries. Thefifth MDG calls for reducing the maternalmortality ratio by three-quarters between1990 and 2015, an average annual reductionof 5.4 percent. Due to scarce data, maternalmortality is tracked largely through modelingprojections from demographic data ratherthan direct reporting, and trend estimates arequite tentative. The World Bank estimatesthat only one developing region is on track toreach the maternal mortality target (MiddleEast and North Africa), though two others(East Asia and the Pacific, Europe and Cen-tral Asia) are close.5 In Latin America and theCaribbean the maternal mortality ratio (190per 100,000 births) is lower than in otherregions, but it is proving more difficult toachieve incremental improvements.
S C A L I N G U P S E R V I C E D E L I V E R Y
G L O B A L M O N I T O R I N G R E P O R T 2 0 0 5 73
Despite low economic development and high poverty—per capita gross national income (GNI) was$200 in 2002, and 54 percent of the population lives below the poverty line—Mozambique hasmade impressive progress in lowering under-five mortality, from 226 per 1,000 live births in 1990to 170 in 2003. While this level is still very high, the decline is encouraging given the country’s unfa-vorable disease environment, with HIV/AIDS affecting an estimated 15 percent of adults and a highprevalence of malaria and other infectious childhood diseases.
What accounts for Mozambique’s success? One important factor has been the country’s effortsto provide basic preventive health services in remote areas, delivered by both community healthfacilities and mobile teams, resulting in high coverage for key interventions. About 85 percent ofpregnant women receive antenatal care, while 77 percent of children are immunized against measlesand 63 percent are fully immunized. Community-based services also promote healthy behaviorssuch as breastfeeding and oral rehydration therapy. Mozambique has shown that mobile teams canbe effective in an environment with too few health facilities and a dire shortage of qualified healthstaff, reaching households that otherwise lack access to health care.
Source: World Bank 2004c.
BOX 3.2 Reducing child mortality in Mozambique

Because measuring maternal mortalityratios directly is so difficult, the percentage ofdeliveries attended by medically skilled per-sonnel is also used to track progress. Althoughthis indicator increased in all regions between1990 and 2000, it is still below 50 percent inSouth Asia and Sub-Saharan Africa.
HIV/AIDS, Malaria, and Other Diseases
The sixth MDG is to halt and begin reversingthe spread of HIV/AIDS, malaria, and othermajor communicable diseases by 2015.
H I V / A I D S
Despite 20 years of efforts to control it,HIV/AIDS continues to spread. In 2004, 39 mil-lion people were living with HIV/AIDS (figure3.4) and 3.1 million died—more than from any
other infectious disease. That same year nearly5 million people became infected with HIV, 2million children were living with it, and 15 mil-lion children had been orphaned by AIDS.
Sub-Saharan Africa remains by far the worst-affected region, home to nearly two-thirds of allpeople with HIV/AIDS. The average HIV preva-lence rate in the region is 7.4 percent, or 1 inevery 14 adults—and in parts of SouthernAfrica it is 1 in 3. In nine African countries lifeexpectancy has dropped below 40 years becauseof the disease, and across the region 11 millionchildren have been orphaned by it.
But HIV/AIDS poses enormous threats inevery region. Since 2002 the number of peo-ple living with it has risen by 50 percent inEast Asia, reflecting China’s rapidly growingepidemic, and by 40 percent in Europe andCentral Asia, driven by its rapid spread in theRussian Federation and Ukraine.
Two decades of battling HIV/AIDShave taught the world two main lessons.First, countries have a crucial window ofopportunity early in the epidemic, whenprevalence is largely confined to high-riskpopulations such as sex workers and intra-venous drug users. Brazil, Cambodia,Senegal, and Thailand are among thecountries that acted decisively to introducestrong prevention programs when preva-lence was low, and they have achieveddeclining levels of new infections. Earlyaction in Thailand averted an estimated 5million infections during the 1990s.
Second, even in countries whereHIV/AIDS has spread into the generalpopulation and the main mode of trans-mission is heterosexual, some are doingbetter than others at curbing its spread.Among African countries, in Uganda HIVprevalence among pregnant womendropped from 13 percent in the early1990s to just under 5 percent in 2002, andin Botswana, Ethiopia, and Kenya theprevalence in urban populations appearsto have stabilized.6 The key has beenforthright national leadership, widespreadpublic awareness campaigns, and inten-sive prevention efforts.
C H A P T E R 3
74 G L O B A L M O N I T O R I N G R E P O R T 2 0 0 5
1990
1991
1992
1993
1994
1995
1996
1997
1998
1999
2000
2001
2002
2003
2004
Millions of people454035302520151050
FIGURE 3.4 Since 1990 the number of people living with HIV/AIDS hasquadrupled
Source: UNAIDS data.
Yet these lessons appear unheeded in manycountries, including large countries such asChina, India, and the Russian Federation.Unless more aggressive actions are taken inthese and other countries, HIV prevalence isprojected to rise further. Work continues onvaccine development, and the Joint UnitedNations Programme on HIV/AIDS (UNAIDS)estimates that the number of people withaccess to antiretroviral drugs increased from300,000 in 2002 to 700,000 in 2004. Butgiven that the impact of expanded treatmenton HIV transmission is not clear, it is crucialto redouble education and prevention effortsat the same time.
Financing, research, and global advocacyfor HIV/AIDS have increased significantlysince the MDGs were adopted. Commitmentsfor HIV/AIDS prevention and treatment pro-grams jumped from less than $400 million inthe late 1990s to an estimated $6 billion in2005. Now concerns have shifted from financ-ing to implementation, reflecting the multipledonor procedures for accessing support andweaknesses in health delivery systems. Fasterprogress is needed in harmonizing donor aidat the country level and implementing the“three ones” principle agreed to in mid-2004:that all donors will work through oneHIV/AIDS coordinating agency in each coun-try, one national strategic plan, and one sys-tem for monitoring and evaluating progress.
M A L A R I A
Malaria takes a heavy toll on health and eco-nomic productivity where it is endemic, andit is concentrated in countries that can leastafford it: 69 of the 80 poorest countries haveendemic malaria. Data are poor becausemany cases go unreported, but the annualincidence of malaria is estimated at 300–500million cases—with 1.2 million deaths,mainly among children. About 85 percent ofthese deaths occur in Africa, 8 percent inSoutheast Asia, 5 percent in the EasternMediterranean, 1 percent in the WesternPacific, and 0.1 percent in the Americas. Inmany African countries malaria is the leadingcause of death.
Yet malaria is eminently preventable, cur-able, and controllable with modern technolo-gies—at a cost of a few dollars per person.Brazil’s malaria control program is creditedwith averting an estimated 2 million casesand 231,000 deaths. Other countries thathave made impressive progress includeEritrea (which has reduced malaria incidenceover four consecutive years through the use ofinsecticide-treated bednets), India (whichsince 2002 has reduced malaria incidence by58–98 percent across different states), andVietnam.
Effective strategies generally involve acombination of vector control, insecticide-treated bednets and curtains, indoor resid-ual (house) spraying with insecticides wherethe pattern of transmission warrants it,intermittent preventive treatment duringpregnancy, and prompt treatment of infec-tions with effective drugs. Global fundingfor malaria has almost quintupled in thepast few years, from $120 million to $570million, thanks largely to the Global Fundto Fight AIDS, Tuberculosis and Malaria.Yet most experts estimate that as much as$1 billion more a year is needed. Bednet useremains low in many malarious countries,vector control is inadequate, and increasedresistance to traditional drugs is requiringnewer, more expensive treatments. Butexperience shows that rapid gains can bemade against malaria, even in countrieswith weak health systems. The Roll BackMalaria effort provides a global frameworkfor intensified progress.
Water and Sanitation
Expanding water and sanitation services isone of the most cost-effective strategies forimproving health outcomes. Water and san-itation coverage also makes powerful con-tributions to other MDGs, includingachieving gender equality and reducingpoverty and malnutrition. The seventhMDG seeks to halve by 2015 both the pro-portion of people without sustainableaccess to safe water and the proportion
S C A L I N G U P S E R V I C E D E L I V E R Y
G L O B A L M O N I T O R I N G R E P O R T 2 0 0 5 75

without adequate sanitation. Achievingboth targets would provide safe water toanother 1.5 billion people and sanitation toanother 2.0 billion people. Unsafe water andpoor sanitation and hygiene are responsiblefor 90 percent of diarrheal diseases and anestimated 4–8 percent of the total disease bur-den in developing countries.7
The most recent estimates by the WorldHealth Organization and United NationsChildren’s Fund indicate that most develop-ing regions are on track to achieve the safewater target (figure 3.5). The exception isSub-Saharan Africa, where only slightly morethan half of the population has access to safewater. To achieve the water target in Sub-Saharan Africa, for each of the next 10 yearsthe number of additional people servedwould have to double for urban water andtriple for rural water. Only a handful of coun-
tries in any region have achieved suchprogress, particularly in rural areas. ButGhana, Senegal, South Africa, and Ugandahave shown that it can be done.
The sanitation target is more problematic,with only two regions on track—East Asia andthe Pacific and Latin America and theCaribbean. At current trends, the world willmiss the sanitation target by more than half abillion people. But even within lagging regionssome countries have made significant progress.Between 1990 and 2002 Bangladesh, India,and Nepal more than doubled sanitation cov-erage, with some notable successes in slums(box 3.3). In Africa strong progress has beenmade by Cameroon, South Africa, andUganda. And within countries there are localsuccess stories, as in Burkina Faso and Senegal.
The keys are sustainable institutionsfinanced through effective cost recovery of
C H A P T E R 3
76 G L O B A L M O N I T O R I N G R E P O R T 2 0 0 5
90
1990
42
26
51
Perc
ent o
f po
pula
tion
64
34
68
1995 2000 2005
Sub-Saharan Africa
2010 2015
1990 2004 2015 1990 2004 2015Water SanitationWater Sanitation
Actual Path to goal Actual Path to goal
60
Perc
ent o
f po
pula
tion
30
0
90
1990
1615
30
65
42
83
1995 2000 2005
South Asia
People without access to piped water and improved sanitation
2010 2015
60
30
0
90
1990
22 1529
51
35
70
1995 2000 2005
East Asia & Pacific
2010 2015
60
30
0
90
1990
11 918
2616
32
1995 2000 2005
Latin America & the Caribbean
2010 2015
60
30
0
90
1990
187
14
1995 2000 2005
Europe & Central Asia
2010 2015
60
30
0
90
1990
12 613
2515
31
1995 2000 2005
Middle East & North Africa
2010 2015
60
30
0
Goal
FIGURE 3.5 Progress is being made in water supply, especially in South Asia, but sanitation progress is slower
Source: WHO and UNICEF joint monitoring program.Note: Only sanitation estimates are available for Europe and Central Asia.

sanitation surcharges linked to water bills,greater use of demand-based onsite sanitationtechnologies, and increased reliance on small-scale local contractors and artisans as sanita-tion service providers. A shift in focus toonsite sanitation, which is much cheaper thanpiped sewerage, is helping increasing num-bers of low-income countries speed MDGprogress. In Dakar, Senegal, for example,onsite sanitation has permitted service deliv-ery to hundreds of thousands of periurbanslum residents for the first time. The invest-ment cost was about $400 a household, andresidents can afford the operating costs.
Is MDG Progress Reaching Poor People?
The MDGs aim to improve human welfare.But it is important to recognize that some ofthe goals—especially in health—can beachieved without progress reaching poor peo-ple. In two-thirds of the countries that havereduced child mortality since 1990, outcomesfor families in the lowest income quintile haveimproved less than for the population as awhole (figure 3.6). In some of these countriesoutcomes have actually worsened for thepoor while improving for richer groups.
It is crucial to learn from the exceptions.During the 1990s Mali, Turkey, Egypt,Peru, and Cameroon achieved faster reduc-tions in child mortality for the poorest quin-tile than for the population as a whole.
Because improvements in health outcomesfor the poorest groups will not automati-cally result from the pursuit of MDG healthgoals, policymakers must focus on targetedstrategies for reaching poor households. Inmany settings effective targeting must takeinto account other characteristics of disad-vantaged groups, such as ethnicity or ruralresidency. Effective strategies for reachingtarget groups include prioritizing theexpansion of services in poor or ruralregions, expanding those services (such asbasic water and sanitation, primary healthcare, and primary education) that most ben-efit poor people, and eliminating user fees inprimary education and for essential healthservices for poor families, since such feescan impede their access to services.
In education, progress toward universalprimary completion more often enhancesequity. In 21 of 31 developing countries forwhich comparable survey data are availablebetween 1991 and 2002, primary enrollmentsfor children in the bottom income quintileincreased faster (in two cases, declined less)than enrollments for the population as awhole (figure 3.7) This finding is confirmedby more detailed studies in countries such asIndia, showing that expansion of basic edu-cation has been progressive in impact—thatis, it has benefited lower-income groups morethan other groups.8 Still, in about 30 percentof countries primary enrollments for children
S C A L I N G U P S E R V I C E D E L I V E R Y
G L O B A L M O N I T O R I N G R E P O R T 2 0 0 5 77
The crowded slums of Mumbai (formerly Bombay), India, are home to 7 million people. Recog-nizing their needs, an innovative sanitation program financed by the World Bank has built 320 toi-let centers that serve 500,000 slum residents. These community-managed centers provide sanitaryexcreta disposal (with continuous water supply, to ensure hygiene), offer health education, and aregradually replacing municipally managed latrines that were rapidly falling into disuse. Althoughthe toilet centers were financed by grants, user families pay monthly subscriptions that cover therunning costs, including wages of attendants. All the toilet centers have been well maintained andare the pride of the communities that own them. The success of similar community-run programsin other Indian cities has led to the adoption of a nationwide slum sanitation program that willapply the same principles.
Source: OED 2003.
BOX 3.3 Improving sanitation in India’s slums

C H A P T E R 3
78 G L O B A L M O N I T O R I N G R E P O R T 2 0 0 5
40–4–8–12
Mali
Turkey
Egypt
Peru
Cameroon
Colombia
Haiti
Malawi
Tanzania
Nepal
India
Ghana
Guatemala
Bolivia
Benin
Bangladesh
Nicaragua
Vietnam
Kazakhstan
Difference in annual percentage improvementin child mortality between the poorest
quintile and the population average, selectedyears between 1991 and 2001
FIGURE 3.6 Progress on health does not alwaysbenefit poor people
Sources: World Bank estimates from Demographic and Health Surveydata.
–5 0 5 10 15 20
Niger
Tanzania
Nicaragua
Bangladesh
Nepal
Namibia
Ghana
Turkey
Kazakstan
Zambia
Philippines
Peru
Bolivia
Zimbabwe
Côte d’Ivoire
Cameroon
Indonesia
Burkina Faso
Egypt
Colombia
Kenya
Rwanda
Uganda
Malawi
India
Nigeria
Guatemala
Benin
Dominican Rep.
Haiti
Mali
Difference in annual percentage improvementin primary enrollments between the
poorest quintile and the population average,selected years between 1991 and 2002
FIGURE 3.7 Progress on education is generallymore equitable
Source: World Bank estimates from Demographic and Health Surveydata.

from upper-income groups increased morethan those for the poorest children. As poli-cymakers and development partners tracknational progress toward the MDGs, it isessential to watch the progress of the poor.
In education, health, water, and sanitationmany of the interventions needed for betteroutcomes in developing countries are wellunderstood. The International Water Supplyand Sanitation Decade of the 1980s showedthat scaling up investment is not difficult—farmore challenging is ensuring the sustainabil-ity of systems, which is crucial for safe andcontinuous services. Building schools andhealth clinics is far less complex than devel-oping and organizing the large workforces ofskilled providers that must engage in face-to-face interactions with individual clientsacross highly decentralized networks. Formost countries the two main implementationchallenges to the health and education MDGsare scaling up skilled providers to achieveuniversal access to services and ensuring thatproviders perform effectively. The rest of thischapter focuses on these two issues and on athird with important links to both: the role ofdonor financing in supportingsystem expansion and leverag-ing better performance.
Scaling Up Skilled ProvidersStudent learning and patienthealth result from multiplecomplementary inputs, includ-ing school and clinic infrastruc-ture, availability of books,drugs, and clean water, andfamily investments of time andenergy, to study for exams orfollow treatment instructions.But skilled providers—teachers,doctors, nurses—are the biggestexpense in any social sectorbudget, as well as the mostessential input for effective ser-vice delivery. Teacher costsaverage 75 percent of total edu-
cation costs in developing countries, and healthcare salaries typically account for 60–75 per-cent of government health spending.9 Policiesgoverning the recruitment, training, salaries,deployment, and management of skilled edu-cation and health workers are core drivers ofsystem costs, unit costs, resources available forcomplementary inputs, and outcomes.
Although there is considerable variationacross countries, the number of health careproviders is correlated with health service cov-erage. Countries with fewer than 1.5 healthworkers per 1,000 people are highly unlikely tohave a measles immunization rate of 80 percent,whereas this rate is almost assured in countrieswith a health worker density of more than 2.5(figure 3.8).10 Countries with fewer than 2.5health workers per 1,000 people are also lesslikely to have at least 80 percent of birthsattended by skilled personnel. In education theprocess of classroom instruction creates eventighter limits on the number of children that canreceive “education services” for a given numberof teachers. No country with less than 1 teacherper 70 school-age children has achieved univer-sal primary enrollment.
S C A L I N G U P S E R V I C E D E L I V E R Y
G L O B A L M O N I T O R I N G R E P O R T 2 0 0 5 79
100
10 21.5 32.5 4 5
Coverage (percent)
80
60
40
20
0
Births attended by skilled healthpersonnel (1995–2001)
One-year-olds immunized against measles (2001)
Gambia
MozambiqueNicaragua Trinidad
Eritrea
Uganda
Mali
Nepal
Namibia
RB de VenezuelaKenya
Laos
Health workers per 1,000 population
FIGURE 3.8 Health service coverage increases with the number of providers
Source: Joint Learning Initiative 2004.

The number of skilled providers is alsoimportant for health outcomes. A recentstudy of 83 countries found that a 10 percentincrease in the number of trained healthworkers (doctors, nurses, midwives) per pop-ulation unit is associated with a 2–5 percentdecline in mortality, controlling for per capitaincome, poverty, and female literacy (figure3.9) 11 Maternal mortality outcomes are themost sensitive to provider density, becauseskilled health workers can address a largershare of the conditions that lead to maternalmortality than the conditions that lead toinfant or child mortality.
Although worker numbers are important,skill levels are key. In a rigorous study of primaryeducation in the United States that controlled forstudents’ innate ability and socioeconomic sta-tus, the teacher a child was assigned could affecthis or her learning levels that school year by upto a full grade—a huge difference that dwarfsany other factor correlated with learning, such asbooks, facilities, class size, or teacher salaries.12
And, important for policymakers, these large dif-ferences in teacher effectiveness were not wellcorrelated with the formal measures usuallybelieved to determine teacher quality, such as
their level of education or years of experience.What counted was what teachers actually knowand can do.
A recent large-scale learning assessment inVietnam confirms this finding. The strongestpredictor of students’ performance on fifth-grade tests of reading comprehension andmathematics was their teachers’ performanceon the same tests. Not the teachers’ salaries,training levels, or teaching conditions—buttheir mastery of the subjects being taught. Asobering finding was that the bottom 30 per-cent of teachers actually scored lower on read-ing comprehension than did the top 12 percentof fifth grade students.13 Few developing coun-tries have braved political pressures to measureteachers’ subject knowledge directly, but thosethat have—including Brazil and Peru—havealso found teachers’ mastery of content to be acritical determinant of education quality.
Research also demonstrates the impor-tance of provider quality in health. In 1992Indonesian health centers were forced to cutincentive payments for rural doctors as partof a government effort to reduce the fiscaldeficit. As a result, over the next several yearsthere was a 30 percent decline in the averagenumber of physicians per rural health center(from 1.8 to 1.2). Although patient visitswere not affected, the quality of care was—and there was a 39 percent increase in childstunting in the affected regions.14 Such severemalnutrition is likely to have long-term cog-nitive and productivity effects on the childreninvolved and may generate cumulative eco-nomic costs that outweigh the short-term fis-cal savings from the reforms.
Interestingly, the researchers in Indonesiaevaluated providers not with formal mea-sures such as level of education, but byobserving how closely they followed bestpractices in diagnosing and treating patientconditions. The conclusion: As in the educa-tion research, what providers know and cando are crucial to quality services. Whetherscaling up systems through new hiring or try-ing to improve existing education and healthservices, the most effective governments focuson screening and rewarding candidates for
C H A P T E R 3
80 G L O B A L M O N I T O R I N G R E P O R T 2 0 0 5
543210
9Mortality per 1,000 (log)
Density, workers per 1,000 (log)
8
7
6
5
4
3
2
1
0
Maternal Infant Under-five
Skilled health worker density and mortality
FIGURE 3.9 Provider presence is also associated with betterhealth outcomes
Source: Calculations based on Anand and Barnighausen 2004.

competency, and avoid recruitment andadvancement driven by clientelism, formalqualifications, or years of service alone.
Are Human Resources a Binding Constraint?
The low-income countries furthest from theMDGs, many of which are in Sub-SaharanAfrica, face major challenges in producing thenumber of skilled providers required todeliver the health and education servicesneeded to attain the MDGs—even under opti-mistic assumptions about the impact of ser-vice delivery on outcomes. The Joint LearningInitiative, supported by the Rockefeller Foun-dation, the World Health Organization, andother health donors, estimates that for Sub-Saharan Africa to rise from its current ratio of1 health worker per 1,000 people to a targetlevel of 2.5, the region will need to add theequivalent of 1 million health workersbetween now and 2015.15 Ethiopia willrequire an additional 150,000 workers, whilethe Democratic Republic of Congo and Nige-ria will each need 90,000. Globally, about 4million additional health workers will beneeded, including 285,000 in Bangladesh.
Estimates of teacher requirements are alsodaunting, especially for Sub-Saharan Africa.To meet the needs for primary educationalone, eight Sub-Saharan countries must pro-duce at least 30 percent of their current stockof teachers each year until 2015 (figure 3.10).Two countries need to annually producemore than 40 percent of their current stock.In some countries annual requirements aremore than 10 times current output fromteacher training schools (figure 3.11).
Clearly, in much of Sub-Saharan Africa theMDGs will not be attained with “business asusual” approaches to the production ofskilled health workers and teachers. But in agrowing number of countries, pragmaticchanges in human resource policies have dra-matically increased the number of skilledproviders. Although not all cases have beenequally successful in terms of provider andservice quality, they demonstrate a range of
S C A L I N G U P S E R V I C E D E L I V E R Y
G L O B A L M O N I T O R I N G R E P O R T 2 0 0 5 81
SeychellesMauritius
Cape VerdeSao Tome and Principe~ '
KenyaTogo
BotswanaGhana
ComorosNamibia
SwazilandZimbabwe
UgandaSouth Africa
GabonLiberiaNigeriaLesotho
Equatorial GuineaMauritania
BeninGambia
CameroonCôte d’lvoire
RwandaTanzania
Sierra LeoneMadagascar
GuineaMalawiZambiaSenegal
Republic of CongoBurundi
AngolaMali
ChadEritrea
EthiopiaMozambiqueBurkina Faso
Central African RepublicNiger
Annual production of teachers needed,2002–15, to achieve universal primary
education, as a percent of existing numberof teachers
Percent5010 20 30 400
FIGURE 3.10 Projected primary teacher needs are large in Sub-Saharan Africa
Source: Calculated from EdStats data.Note: Projected from 2001 data.

C H A P T E R 3
82 G L O B A L M O N I T O R I N G R E P O R T 2 0 0 5
Benin Niger Lesotho BurkinaFaso
Chad Eritrea Mali Malawi Ghana Kenya
Number of teachers
Actual production of teachers and required production,2002–15, to achieve universal primary education
12,000
2000
4000
6000
8000
10,000
0
Actual production of teachertraining colleges
Yearly production of teachers needed at projectedrate of attrition (including expected impact of HIV/AIDS on teacher supply), assuming average class size of 40 and 10% student repetition
FIGURE 3.11 Projected primary teacher needs far exceed training capacity in many African countries
Source: Calculated from EdStats data. Note: Projected from 2001 data.
strategies for rapidly shifting the productioncurve for skilled providers. In several cases sectorefficiency has also improved, because newrecruitment strategies have lowered costs perbeneficiary served. And a few cases show thatrapid expansion of quantity can be managedwith attention to quality.
Core Strategies for Scaling Up Providers
Three basic strategies can be used to rapidlyincrease a country’s production of educationand health workers:
• Expand training capacity and/or adapt recruitment standards and trainingprocesses.
• Manage international migration, either byimporting skilled workers or curbing out-flows of nationally trained workers.
• Increase retention, by drawing retired orunemployed workers back into the work-force or by improving the health of sickworkers, such as with antiretroviral treat-ment for employees with HIV/AIDS.
The first of these strategies has generatedthe most dramatic progress: In a wide range ofcountries, adapted standards and reengineeredtraining processes for teachers and healthworkers have set the stage for rapid expansionof service delivery. The second strategy appliesmuch more to health than to education, giventhe international market for health workers.

S C A L I N G U P S E R V I C E D E L I V E R Y
G L O B A L M O N I T O R I N G R E P O R T 2 0 0 5 83
The third strategy, while important, offers lim-ited quantitative prospects in most contexts.
A D A P T I N G R E C R U I T M E N T S T A N D A R D SA N D T R A I N I N G P R O C E S S E S
The time lag and costs involved in expandingtraditional medical, nursing, and teachertraining schools have led a number of devel-oping countries to seek alternative ways ofscaling up basic health and education person-nel. In education the most common approachis to set new standards for teaching that donot require graduation from a pedagogicalinstitute—even though in some cases moreyears of general education may be required. Inhealth, waiving or shortening medical school-ing for doctors is generally unacceptable, sothe main strategy is to leverage available doc-tors and nurses better with paraprofessionals.These paraprofessionals—often called com-munity health workers—are trained for peri-ods ranging from three months to two yearsand can provide many primary and preventivehealth care services. In countries with severeshortages of higher-skilled professionals theymay even perform duties normally performedby physicians, as China’s “barefoot doctors”did in the 1960s.16 An important advantage ofcommunity health workers—and of alterna-tive or community teachers—is that they arewilling to work in rural areas, where it can bedifficult to attract highly trained personnel.Community health workers are also less likelyto migrate out of the country.17
Bangladesh, China, Cuba, The Gambia,Ghana, India, Madagascar, Mozambique, andSouth Africa are among the many countriesthat have trained community health workers toscale up delivery for a wide range of services,including malaria prevention, immunizations,family planning, tuberculosis treatment, andhome visits to provide neonatal care. In manycases these efforts have substantially increasedcoverage, generated measurable improvementsin outcomes, and dramatically lowered unitcosts. In rural Maharashtra, India, infant mor-tality was cut in half—from 76 to 39 per 1,000live births—between 1995 and 1998 by a pro-gram that trained village health workers to visit
new mothers and monitor infants’ weight andhealth for the first month of life. In control vil-lages infant mortality declined only from 77 to75 per 1,000 live births.18
Since 1991 South African tuberculosispatients treated by community health work-ers have actually achieved better health out-comes than those treated by more skilledpersonnel; 88 percent of patients seen bycommunity health workers completed the fullcourse of treatment, compared with 79 per-cent of patients seen by fully trained doctorsand nurses. As a result the directly observedtreatment strategy (DOTS) for tuberculosisimplemented by community health workerswas as effective as hospitalization or sanato-rium care—at less than half the cost.19
The Planned Parenthood Association ofGhana trained community members to pro-vide health education and family planningsupport to women in their communities. In vil-lages covered by the program, family planninguse reached 25–44 percent, far higher than therural average. Immunization rates were 74–87percent, compared with 30 percent in controlvillages. Moreover, village women whoreceived support promoted maternal and childhealth and family planning in neighboring vil-lages. The results point to a low-cost strategyfor improving maternal and child health.20
Drawing on these experiences and the evi-dence on cost-effectiveness, several Africancountries are rapidly scaling up training ofparaprofessional health cadres. Over the nextfive years, for example, Ethiopia plans to train20,000 health extension workers to staff ruralhealth posts throughout the country.21 How-ever, not all country efforts to realign the skillsmix in health have been evaluated carefully,and clearly not all skills can be substituted. Asignificant number of programs—particularlythose where paraprofessionals have not beenpaid or supported with basic equipment,drugs, and backup—have been unsuccessful.22
But with adequate supervision, reasonableremuneration, and simple support systems,there is great potential for community healthworkers to help expand service delivery atbasic levels of quality.23 Medical schools are

rare in Sub-Saharan Africa, with 6 countrieshaving none and 21 having just one.24 Forcountries such as these, at least over the shortto medium term—as production of doctorsand nurses expands—there appears to be lit-tle alternative but to leverage the skills of fullytrained professionals with judicious use ofcommunity health workers.
In education a number of countries haveshown the potential for alternative teachersto help accelerate expansion of primaryschooling. Even countries where the annualproduction of teacher training institutes issmall often have large pools of unemployeduniversity graduates who can be recruitedinto teaching. In West Africa this strategy hasled not only to a large increase in primaryenrollments over the past decade, but also torising average levels of teacher education.Guinea—which over the past decade hasachieved one of the world’s most impressiveincreases in primary school completion—is agood example.
In 1998, under a project supported by theWorld Bank, Guinea experimented with twoalternative changes in recruitment standardsfor primary teachers. Under one variant pre-service teacher training was shortened fromtwo years to a staggered program involvingthree months of initial training, eight to ninemonths of on-the-job training, and a finalthree months of formal training. The secondvariant involved eight months of formaltraining followed by eight to nine months onthe job. For both alternatives the pre-trainingeducation requirement was increased fromgrade 10 to grade 13 (grade 12 for women).
The two new programs enabled Guinea toincrease annual teacher production from 200to 2,000 a year—a 10-fold increase that hashad a similar impact on enrollment growth.Moreover, the benefits were not all quantita-tive: Controlling for socioeconomic andschool factors, students of the new teachersperformed better than those of traditionalteachers on a recent study of learning achieve-ment in francophone countries.25 Guinea’sexperience suggests that adjusting teacherrecruitment standards to emphasize content
mastery (through a higher level of generaleducation), and complementing this with rel-atively short-term training focused on practi-cal classroom techniques, can be moreefficient than expanding traditional teachertraining institutes.
A similarly pragmatic strategy enabledMadhya Pradesh, India, to eliminate its back-log of children out of school in just 18months, at one-third the usual cost.26 Thestate reduced the education level required toteach in rural schools and gave villages fund-ing to directly hire local secondary schoolgraduates. These changes eased constraintson teacher supply and permitted rapid expan-sion of access; in 1997 the state opened 40new primary schools a day. A key similaritywith the Guinean program was the emphasisplaced on supporting these new teachers inservice, with materials and regular supervi-sion, as a cost-effective alternative to formalpre-service training.
These two examples—and similar earlierreforms in countries ranging from the Repub-lic of Korea in the 1950s to Indonesia in the1970s and Zimbabwe in the 1980s—demon-strate that with pragmatic strategies to adaptrecruitment standards and restructure train-ing, teacher production can be scaled up 10-fold or more in just one or two years. Inrecent years virtually all countries with verylow primary completion rates have begunpursuing such policies, and in none has thesupply of potential teachers been a constraint.On the contrary, even when offering averagesalaries as low as half the civil service teacherwage, countries have found more qualifiedapplicants for contract teaching positionsthan they can afford to hire. In Benin, wherethe national training institute produces only100 teachers a year, 6,500 university gradu-ates recently applied for 1,000 new contractpositions. In Senegal, which in 1998 becamethe first West African country to introducecontract teachers, there were 35,000 appli-cants for the first 6,000 positions. In Nigerteacher production has quadrupled since2001, when teacher training was shortenedfrom two years to one and contract teachers
C H A P T E R 3
84 G L O B A L M O N I T O R I N G R E P O R T 2 0 0 5

were introduced. The experience has been thesame in Ethiopia, Mali, Togo, and elsewhere.
Do the adapted standards affect quality?While more research is needed, the bestanswer at present is that the results have beenmixed. In many countries the adoption ofnew standards has been driven as much by fis-cal constraints on hiring teachers at prevail-ing civil service standards and wage scales asby an absolute shortage of skilled (or skill-able) personnel. Alternative teachers are oftenhired under new contracting arrangementsthat provide less job security and, in manycases, a direct role for communities in creat-ing contracts and monitoring performance.These multiple variables can make it difficultto disentangle whether changes in teacherbehavior and student learning outcomesreflect differences in teacher skills or differ-ences in motivation. In contrast to the resultsfrom Guinea, a study of fifth graders in Togoshowed slightly lower learning by students ofcontract teachers, controlling for other fac-tors.27 But it is important to remember that inmost cases—and especially for poor childrenin rural areas—the alternative to contractteachers is not a formally trained civil serviceteacher, but no schooling at all.
Changes in teacher contracting and thetraining of paraprofessional health workershave met resistance from labor unions.Indeed, one of the most difficult aspects oflaunching such reforms may be the politicaleconomy of maintaining two-tier salary sys-tems over time. African teacher unions havebeen vocal critics of the use of contract teach-ers and are trying to organize these workersto demand higher salaries.
But the magnitude of human resourceshortfalls in these sectors leaves governmentscommitted to universalizing education andbasic health coverage—committed, that is, toachieving MDG targets—little choice but tomake these pragmatic adjustments, evaluatethem carefully, and upgrade provider qualityover time. It is encouraging that the long-termevidence in education suggests that, control-ling for country income, countries thatachieve universal coverage sooner, even by
adapting teacher standards, achieve higheraverage levels of student learning.28 The keysto success are likely to be countries’ ability toscreen new candidates carefully, train themeffectively, equip them adequately with well-designed teaching manuals and treatmentprotocols, provide ongoing, cost-effective, in-service support and supervision, monitor andreward performance effectively, and gradu-ally raise standards over time. In educationthat has been exactly the approach taken overa 40-year span by countries, such as theRepublic of Korea and Singapore, that havemade the transition from low-income statusand low average education levels to sustainedeconomic growth and high-performing edu-cation systems.
M A N A G I N G M I G R A T I O N
A confounding issue for developing countriestrying to scale up health services is the glob-alization of the health care workforce, asmigration flows increase throughout theworld. While the national specificity of a cur-riculum makes teacher migration relativelyrare, the past decade has seen an explosion inthe migration of physicians and nurses fromdeveloping to developed countries.29
Such outflows have reached troubling lev-els in several developing countries, whencompared with the size of the health work-force and the output of local training insti-tutions. There are allegedly more Nigeriandoctors in the New York (United States)area than in Nigeria, and more Malawiandoctors in Manchester (United Kingdom)than in Malawi. Of the more than 600physicians trained in Zambia since its inde-pendence, only 50 remain in the nation’shealth system. Of the 489 students whograduated from the Ghana Medical Schoolbetween 1986 and 1995, 61 percent haveleft Ghana—with more than half going tothe United Kingdom, and just over a third tothe United States.30 A third of Ethiopia’sphysicians left the country between 1988and 2001. And in 2003, 7 percent of Zim-babwe’s public sector nursing force migratedto the United Kingdom alone.
S C A L I N G U P S E R V I C E D E L I V E R Y
G L O B A L M O N I T O R I N G R E P O R T 2 0 0 5 85

While migration brings significant benefitsin terms of remittances, networks, and tech-nology transfers, for most Sub-Saharan coun-tries it also creates a loss of skills that the regioncan ill afford. There are relatively few countriesin the region where the labor market cannotfully absorb graduates of medical training pro-grams. In Malawi, for example, vacancy ratesfor funded positions in the public health systemare 25 percent for nurses and as high as 80 per-cent for specialists, and in Zambia, 40 percentof funded public sector health positions arevacant. Yet, at the same time, in both countriesskilled providers are leaving the public system.The key constraint on the use of available fund-ing appears to be the public sector’s inability toselectively increase wages in health to morecompetitive levels without creating broadercivil service wage pressures.
The pull from developed countries isexpected to grow. In the United States an esti-mated 126,000 nursing positions are unfilled,and the shortage is projected to hit 500,000by 2015. The United Kingdom will require anadditional 35,000 nurses by 2008.31 Giventhe enormous compensation differencesbetween developing and developed countries,what can developing countries do to managemigration?
Policies currently being tried includebonding, mandatory community service,diaspora exchange programs, and ethicalrecruitment guidelines, such as the Com-monwealth Code of Practice adopted in1999 in the United Kingdom. While the gen-eral consensus is that these efforts have hadlittle impact,32 Thailand has had some suc-cess in attracting back medical professionals.The government’s “reverse brain drain”strategy has involved relaxing licensingrequirements and offering generous researchfunding and monetary incentives.33 A fewother countries, most notably Ghana, aretrying reverse migration strategies; in theearly 1990s they began recruiting Cubandoctors and senior allied health profession-als. The number of Cuban doctors recruitedto Ghana increased from about 60 a year inthe early 1990s to more than 200 a year in
2003. The doctors provide services, mainlyin rural areas, for two years.34
There is no simple solution, and actions areneeded by both developed and developingcountries. Donor countries can help by tryingto attract more of their own citizens into nurs-ing, for example, by raising wages; the Britishgovernment recently did this. Donors can alsohelp finance the expansion of medical trainingin developing countries, recognizing that someshare of graduates will inevitably migrate.Developing countries need to keep salaries inpublic health systems as competitive as possi-ble, and donor countries can help financesalary increases through development assis-tance. Finally, developing countries can makemedical and nursing students finance theirstudies with loans and, if a student migratesbefore the loan is repaid, work with the receiv-ing country to recoup the balance throughthat country’s tax system.
I N C R E A S I N G R E T E N T I O N
To boost human resources, several countrieshave explored recruiting retired, inactive, orunemployed workers back into the labor forceand in some cases allowing flexible, part-timeemployment. Since 1994 public hospitals inThailand have recruited retired physicians towork part time.35 Ghana is also experiment-ing with such policies. Up to two-thirds ofretiring doctors and nurses apply to theGhana Health Service to be reengaged afterretirement. The first contract period lasts twoyears, and is renewable for two more yearsand an additional year until the age of 65.36
Countries facing human resource short-ages must also actively protect the health ofexisting providers, particularly those withHIV/AIDS. In low-income countries disabil-ity and death typically account for less than10 percent of attrition among health careproviders. But in Southern African countriessuch as Malawi, where HIV/AIDS prevalencehas reached 15 percent among 15–49-year-olds, death accounted for 58 percent of theattrition of Ministry of Health personnelbetween 1990 and 2000—with a substantialproportion due to AIDS.37 Data are scarce,
C H A P T E R 3
86 G L O B A L M O N I T O R I N G R E P O R T 2 0 0 5

but in the highest prevalence countries theannual death rate from AIDS is estimated at4–5 percent for education workers and 2–3percent for health workers.38 Surveys ofsupervisors indicate that absenteeism linkedto AIDS, both from sickness and attendingfunerals, is also a serious issue. Most employ-ers estimate that the costs of absenteeism areeven higher than the costs of training andrecruitment to replace staff lost to AIDS.39
The key operational implication is thathuman resource management and planning—even in relatively low-prevalence settings—mustaddress the impacts of HIV/AIDS. The diseasetends to exacerbate weaknesses in humanresource management and planning, and fewcountries have implemented systems thatrespond effectively to the additional strains thatthe epidemic places on the supply of services.Fewer than 5 of 30 ministries of education inSub-Saharan Africa have built HIV/AIDS indi-cators into their management information sys-tems or included projections of the disease’simpact in their models of future human resourceneeds. Many countries also lack workplacepolicies that ensure access to prevention, anti-retroviral therapy, and other support and treat-ment, mitigate the impacts on infected staff, andprovide clear backup arrangements for staffabsences. Most crucial is to protect healthworkers from job-related exposure to infectionthrough appropriate training, enforceable safetypolicies, and adequate supplies and protectivegear—and to give these workers first call onantiretroviral therapy.
Deploying Providers to UnderservedAreas—A Separate Issue
In both the developed and developing world,even when overall numbers of education andhealth personnel balance needs, there can bewide variations in the quantity and quality ofservice delivery across regions. Almost always,these variations result from difficulties indeploying and retaining workers in rural areas.Although 66 percent of Ghana’s populationlives in rural areas, for example, only 15 per-cent of its physicians work there.40
Several countries have analyzed the factorsinfluencing the willingness of service providersto locate in remote areas. While salary com-pensation is one factor, other factors are justas important. But virtually all the relevant fac-tors imply higher costs for governments. Non-financial concerns include the intellectual andsocial isolation that highly qualified staff canfeel in remote rural communities, lack ofamenities such as electricity and telephones,primitive accommodations, limited trans-portation availability and difficulties in main-taining contact with family and colleagues, anabsence of professional support and develop-ment, lack of quality education options forchildren, and a mismatch between an individ-ual’s professional training and the skillsrequired on the job.41
Countries that have succeeded in imple-menting multipronged strategies to providerural services include Indonesia, whichposted tens of thousands of primary schoolteachers to rural areas in the 1970s andthousands of skilled doctors to remoteprovincial clinics in the 1980s, and Thailand(box 3.4). Ethiopia, Guinea, Mauritania,and Niger provide allowances for teachers indeprived areas, and Niger has also intro-duced allowances for teachers in nomadicschools. The premium over the averagesalary varies, but in these cases is 15–40 per-cent. Experiences from these and othercountries permit several cautious conclu-sions about the keys to success:
• Rural and other hardship allowances shouldbe linked to the position, not the person. If ateacher leaves a rural post, he or she shouldnot continue to receive the premium.
• Allowances should be calibrated to regionalconditions, but differentials should betransparent and based on observable char-acteristics.
• Criteria for and levels of allowances mustbe reevaluated periodically. In Bolivia,failure to do this has led to a large share ofrural hardship allowances going to schoolsin areas that have actually become urbanover time.
S C A L I N G U P S E R V I C E D E L I V E R Y
G L O B A L M O N I T O R I N G R E P O R T 2 0 0 5 87

As a general strategy, recruiting individualsfrom rural areas into service or training pro-grams is a more effective way to increaseretention and improve service delivery thantrying to rotate individuals trained in urbanareas to rural settings.42 Recent research inwestern Kenya shows interesting results in thisrespect. Since early 2004 a pilot program hasenabled schools to hire additional teachers forgrade 1, to cope with increased enrollmentafter Kenya’s introduction of free primaryeducation. Teachers are hired locally, at aboutone-fifth the cost of civil service teachers.Once a month a team of nongovernmentalorganization (NGO) researchers visits schoolsunannounced and records attendance of grade
1 teachers and pupils. In the first year of theprogram, in schools that received the funding,attendance averaged 90 percent for locallyhired teachers and 73 percent for civil serviceteachers. Locally hired teachers were alsomore likely to be in class when the researchersarrived—71 percent compared with 46 per-cent for regular teachers. Finally, the programseems to have had beneficial effects on schoolaccountability and performance: Averageteacher attendance in the program schools is78 percent, compared with 71 percent in non-program schools.43
In sum, in many developing countries themagnitude of doctor, nurse, and teachershortfalls relative to ambitious MDG targets
C H A P T E R 3
88 G L O B A L M O N I T O R I N G R E P O R T 2 0 0 5
Over the past 30 years Thailand has achieved universal coverage of basic health services and sus-tained improvement in health outcomes. At the heart of this success are three decades of policyefforts and incentives aimed at expanding health services and attracting doctors to rural areas. Thai-land’s experience illustrates the need for a multipronged approach and confirms evidence from othercountries that financial incentives are not always the most important component of such efforts.
In the early 1970s Thailand introduced a bonding system that offers medical students heavilysubsidized tuition if they promise to work in the public sector for three years upon graduation. Stu-dents who decline the program have to pay full tuition, which is quite high, and doctors who breachthe contract must pay a large fine. During that period the government also began putting priorityon rural health infrastructure, as part of a national rural development effort. Expansion of urbanhospitals was halted, while rural hospitals and health centers grew significantly. So did the avail-ability of paramedics, drugs, equipment, supplies, housing, and other amenities in rural areas.
A further reform aimed at strengthening rural service delivery began in 1994, when medicalschools began increasing recruitment of students from rural areas. By 2001, 32 percent of medicalstudents were from rural areas, up from 23 percent in 1994. Medical training was also changed, toincrease exposure to rural practice, and rural doctors were given priority in continuing educationprograms. Experience in rural public service is now a prerequisite for residency training programs,and doctors with more than five years of rural experience can apply for a Thai board certificate—the equivalent of a doctorate.
Rural doctors receive hardship allowances, with the largest allowances going to the most remotedistricts. In addition, each year a rural hardship award is presented to the best doctor from a remotearea, as is a rural doctor of the year award.
Since the early 1970s the difference in density between doctors in rural areas and Bangkok hasbeen cut in half, from 1/20th to 1/10th—a dramatic improvement equaled by very few countries. Inaddition, the proportion of outpatient visits to public health facilities occurring in rural areas hasincreased from 54 percent to 82 percent. After their compulsory three-year contract expires, two-thirds of doctors in rural areas remain there. During the late 1990s an economic boom led manydoctors to breach their public contracts (paying a large fine) to work in the private sector. But doc-tors with rural training were least likely to do so.
Source: Wibulpolprasert and Pengpaibon 2003.
BOX 3.4 Attracting doctors to rural areas in Thailand

calls for pragmatic strategies for scaling upproviders that represent a sharp changefrom traditional training systems. Suchstrategies include changes in recruitmentstandards to permit faster production ofproviders, maximum use of complementary,less skilled workers to leverage scarce skills,attention to international migration pres-sures, and incentives or rural recruitmentstrategies to ensure service delivery in ruralareas. These strategies have enabled somecountries to achieve impressive scale-ups ofhuman development services. In some casesit appears that the supply of trained or train-able human resources could support evenfaster production or hiring. The next sectionexamines financing issues that affect the scal-ing up of human development services.
Ensuring Sustained and Predictable FinancingThe challenge of achieving the MDGs at min-imum global cost implies four distinct lines ofaction, aimed at both minimizing costs andmaximizing the efficiency of financing:
• Lowering the marginal costs of expandedservice delivery as much as possible, espe-cially through human resource strategiessuch as those discussed above, to leverage
scarce skills and expand provider cadres atsustainable unit costs.
• Increasing the efficiency of service delivery,the focus of the next section.
• Increasing domestic financing for education,health, water, and sanitation in countrieswhere fiscal allocations for these sectors arelow, to minimize aid dependency.
• Mobilizing efficient donor support to fillremaining financing gaps.
Trends in Developing Countries’ Spending
Between 1990 and 2002 low-income coun-tries significantly increased their spending oneducation and health. In both sectors spend-ing as a share of GDP started from a lowbase—3.1 percent of GDP for education and1.4 percent for health—but it has grown bymore than 40 percent in education and 70percent in health (figure 3.12). There is littlequestion that delivery of human developmentservices has become a higher priority in manypoor countries.
By contrast, spending shares in middle-income countries have remained relativelyflat. These countries started the 1990s withmuch higher levels of GDP devoted to educa-tion and health than low-income countries,but the gap in health has nearly closed and ineducation it has narrowed considerably.
S C A L I N G U P S E R V I C E D E L I V E R Y
G L O B A L M O N I T O R I N G R E P O R T 2 0 0 5 89
1990
3.1
5.14.1
5.04.0
5.14.3
5.4
1995 2000 2002
Government spending on education
Percent of GDP
1990 1995 2000 2002
Government spending on health
Percent of GDP
0
2
4
6
8
0
1
2
3
4
Low-income countries Middle-income countries
1.4
2.7
2.1
2.7
2.1
2.72.4
2.7
FIGURE 3.12 Low-income countries are spending more on health and education
Source: IMF data.Note: Unweighted averages based on corresponding available data from 1990–2002.

Education and health spending alsoaccounts for a growing share of governmentbudgets in low-income countries. Between1990 and 2002 education rose from an aver-age of 12 percent to 14 percent of govern-ment spending, and health increased from 5percent to 7 percent. The upward trend hasbeen most pronounced in Sub-SaharanAfrica, South Asia, and Europe and CentralAsia, and more consistent in education thanhealth, but overall it reflects increasing fiscalshares for the two sectors (figure 3.13). InSub-Saharan Africa these trends show thebenefits of debt relief. A recent study ofAfrican heavily indebted poor countriesfound that between 1998 and 2002 theirspending on education and health increasedby 1.9 percentage points of GDP, while debtpayments as a share of GDP fell by 1.4 per-centage points.44
At the country level, however, there is widevariation in fiscal efforts for human develop-ment. In Sub-Saharan Africa educationspending averaged about 4.9 percent of GDPin 2002—but ranged from less than 2 percentin Burkina Faso and Guinea to more than 10percent in Botswana and Lesotho. In healththe regional average was 2.7 percent of GDP,but Burundi and Madagascar spent less than
1 percent, while Eritrea, Lesotho, and SãoTomé and Principe spent more than 5 per-cent. In many countries human developmentspending appears to be below what theycould afford.
In health, though, public spending is onlya small part of the story. In low-income coun-tries as much as 70 percent of health spend-ing is private, out-of-pocket payments toprivate providers. In general, as countryincomes increase, both the private share ofhealth spending and the share of privatespending that is out-of-pocket—rather thanfor health insurance—tend to decrease. Themix of these sources has important implica-tions for health system access, equity, andfinancial sustainability.
Broadly speaking, these financing trendsare encouraging. Still, spending falls wellshort of needs. Progress on MDG outcomesneeds to be accelerated for some goals inevery region—and in Sub-Saharan Africa, forevery goal. Even with significant increases infiscal effort for health, in recent years slowGDP growth and rapid population increaseshave translated into declines in per capitapublic spending in several regions, most dra-matically in Sub-Saharan Africa (table 3.1). IfSouth Africa is excluded, rather than $12 per
C H A P T E R 3
90 G L O B A L M O N I T O R I N G R E P O R T 2 0 0 5
Sub-SaharanAfrica
EastAsia &Pacific
SouthAsia
MiddleEast &NorthAfrica
LatinAmerica
& theCaribbean
Europeand
CentralAsia
Percent of government spending
0
5
10
15
1990 2000 2002
Sub-SaharanAfrica
EastAsia &Pacific
SouthAsia
MiddleEast &NorthAfrica
LatinAmerica
& theCaribbean
Europeand
CentralAsia
Percent of government spending
0
5
10
15
20
25
Health Education
FIGURE 3.13 Budget shares for health and education have increased in many regions
Source: IMF data.Note: Unweighted averages based on corresponding available data from 1990–2002.

capita in 2001, the region’s public healthspending drops to $6 per capita.
Many low-income countries require sub-stantially increased domestic financing andexternal aid if they are to achieve the MDGs.For middle-income countries, although notall are on track to all the goals, the case forincremental aid is less compelling—giventhese countries’ higher fiscal capacity, closerproximity to MDG targets, and more devel-oped health, education, and water supply andsanitation systems.
External Financing Requirements
Numerous studies have estimated the incre-mental costs and external financing needed toreach the MDGs. These estimates have variedwidely because of the sensitivity of cost esti-mates to assumptions about spending effi-ciency, the difficulty of factoring in theimpacts of synergies from progress on otherMDGs, and the sensitivity of global aidrequirements to assumptions about countries’own fiscal efforts in pursuit of the goals. Esti-mates of external financing needs are alsosensitive to assumptions about the efficiencyof aid in filling estimated funding gaps, anissue that has received less attention.
Table 3.2 summarizes the best available esti-mates of incremental spending requirementsfor the health and primary education MDGs.While the range is large, even the most conser-vative estimates of the external financing gapindicate the need to double or triple current lev-els of official development assistance (ODA) forhealth and primary education.
Investment needs in water supply and san-itation must be added to these requirementsas well, because expanding these services isessential to achieving health and educationgoals. The overall incremental financingneeds for infrastructure investments relatedto the MDGs (including water and sanita-tion) are discussed in chapter 2. It is estimatedthat to achieve the MDG target for water sup-ply, annual investment must increase from $9billion to $12 billion—and for sanitation,from $4 billion to $18 billion. Thus annual
investment in water and sanitation needs todouble. Roughly one-third of this investmentis needed in East Asia and the Pacific, close toone-third in South Asia, and nearly one-fifthin Sub-Saharan Africa. Even if progress inincreasing private participation continues,the bulk of this financing will have to comefrom the public sector and ODA.
In all these sectors there is significant scopefor lowering unit costs and increasing domes-tic financing for the MDGs in many coun-tries. But several costing studies haveexamined this potential carefully and con-cluded that even with major increases inspending efficiency, a significant financinggap will remain.45 The estimates of invest-ment needs in water and sanitation presentedabove, for example, assume that investmentand operating efficiency will be higher than inthe past, due to reforms of sector manage-ment being implemented in many regions.The Bruns, Mingat, and Rakotomalala(2003) study of the costs of universal primarycompletion goes even further. Not only doesit model improvements in unit costs andspending efficiency to best practice levels forall low-income countries, it also models
S C A L I N G U P S E R V I C E D E L I V E R Y
G L O B A L M O N I T O R I N G R E P O R T 2 0 0 5 91
TABLE 3.1 Public health spending per capita has fallen in someregions (current U.S. dollars, weighted by population)
Region 1997 1998 1999 2000 2001
East Asia and Pacific 15 15 16 17 19
Europe and Central Asia 100 90 77 84 89
Latin America and the Caribbean 131 132 120 125 122
Middle East and North Africa 59 61 61 66 69
South Asia 4 5 5 5 5
Sub-Saharan Africa 17 15 13 13 12
High-income 1,596 1,609 1,694 1,714 1,763countries
World 274 274 284 285 294
Source: WHO 2004.

increases in all countries’ fiscal efforts to abest practice norm (about 20 percent of therecurrent budget and 4 percent of GDPdevoted to education, with half for primary).But even under these best case assumptions,the study estimates an external financingshortfall of nearly $4 billion a year for low-income countries to reach the 2015 goal, anda gap of $5–7 billion a year for all developingcountries.
As part of the Abuja Declaration in 2000,African governments agreed that funding forhealth should increase to 15 percent of theirbudgets, up from the current average of 8 per-cent. World Bank simulations for a sample offive African countries indicate that even if thisspending target were achieved from 2005 on,countries would still not be able to finance theincreased recurrent salary and other costsassociated with scaled-up service delivery (toa target level of 2.5 providers per 1,000 pop-ulation) by 2015 out of domestic resourcesalone. Indeed, for a few of the countries, pro-
jected external financing needs would notdecline significantly until after 2020.
In sum, the incremental aid requirementsestimated in even the most conservative stud-ies are large. But for the social sectors in par-ticular, as important as increasing thequantity of aid is the need for profoundchanges in its quality. The additional publicspending needed to scale up human develop-ment service delivery is largely for recurrentcosts, especially personnel. This spending willneed to be sustained and increased overtime—in many countries for a 10–20-yearhorizon. There is a near-complete disconnectbetween this core need and the nature ofdonor assistance to these sectors today inthree major respects: aid flexibility, aid pre-dictability, and transaction costs.
A I D F L E X I B I L I T Y
The financing gaps in health and education arefor core budget expenses—largely local costs,largely recurrent, and largely for personnel.
C H A P T E R 3
92 G L O B A L M O N I T O R I N G R E P O R T 2 0 0 5
TABLE 3.2 Significant additional financing is needed to achieve the health and primary education MDGs
Additional Additional financing external financing Source of
Countries covered needed annually needed annually estimate
Health goals83 low-income countries $57 billion (2007)– $22 billion (2007)– WHO 2001
$94 billion (2015) $31 billion (2015)135 developing countries $25–70 billion Not estimated Preker and others 2003155 developing countries $30 billion (2006)– $18 billion (2006)– UN Millennium Project 2005a
$50 billion (2015) a $33 billion (2015)151 developing countries $20–25 billion $15–25 billion Devarajan, Miller, and Swanson 2002
Universal primary completion79 low-income countries $9.7 billion $3.7 billion b Bruns , Mingat, and Rakotomalala 200379 low-income countries Not presented $5.7 billion UNESCO 2002 155 developing countries $33–38 billion $5–7 billion c Bruns , Mingat, and Rakotomalala 2003151 developing countries $10–30 billion Not presented Devarajan, Miller, and Swanson 2002155 developing countries $9.1 billion Not presented Delamonica, Mehrotra, and
Vandemoortele 2001155 developing countries $9 billion Not presented Naschold 2002155 developing countries $5–6 billion Not presented Colclough and Lewin 1993
a. UNMP (2005a) does not provide a disaggregated estimate of global financing requirements for health. The amounts here are rough pro-rated estimates basedon its five country studies, which do show the health share of MDG costs. b. Total, not incremental, external financing requirement. Bruns , Mingat, and Rakotomalala (2003) estimate that baseline external funding for primary educationto IDA-eligible countries is $1 billion a year.c. Total, not incremental, external financing requirement. Bruns , Mingat, and Rakotomalala (2003) do not provide a baseline estimate of external funding for pri-mary education in middle-income countries.

But a high share of aid to these sectors comespre-packaged in the form of technical assis-tance. About 70 percent of ODA for educationis extended as technical assistance—muchhigher than the 30 percent share for ODA ingeneral. From 2001–3, 10 bilateral donorcountries devoted more than 80 percent oftheir ODA for education to technical assis-tance (figure 3.14).
This picture may be slightly exaggeratedbecause some donors have difficulty isolatingthe nontechnical cooperation inputs of agen-cies that predominantly extend technicalcooperation. It may also be improving some-what, with the U.S. Millennium ChallengeAccount expected to start disbursing in 2005.Still, the bulk of aid for education cannot beused to pay the public sector workers that arethe number one requirement for scaling upeducation services. No matter how importantor even crucial the training, scholarships, tech-nical advisors, and studies supported by cur-rent education aid flows may be, they do notoffset the estimated financing gaps. Virtuallyall education MDG costing exercises havefocused on the inputs that are most straight-forward to cost, such as teachers, classrooms,books, student stipends, and other direct sys-tem operating costs. From the standpoint offilling those gaps and producing MDG results,the current pattern of education assistancerepresents a very inefficient transfer.
Although multilateral lenders such as theWorld Bank’s International DevelopmentAssociation (IDA) report lower shares of fund-ing for technical assistance, their funding tra-ditionally has not been available for personnelcosts either. World Bank policy has treatedfinancing of recurrent costs as exceptional andallowed it only on a declining basis. Betweenfiscal 2001 and 2004 the share of Bank invest-ment lending used to finance recurrent costsaveraged just 4–6 percent. Recognizing theconstraint this policy could impose on achiev-ing the MDGs, in 2004 the Bank’s ExecutiveDirectors approved a new policy on eligibilityof expenditures in investment lending, includ-ing recurrent cost financing. Under the newpolicy, financing of recurrent costs need not be
considered exceptional or occur on a decliningbasis. But decisions on the use of such financ-ing must take into account its impact on theborrowing country’s fiscal and debt sustain-ability, the country’s commitment and abilityto provide continued financing after Bankfinancing ends, and sustainability issues at thesector and project levels. The new policy is inits first year of implementation, so it is early tojudge its impact. But it is expected to have apositive effect on the flexibility of IDA supportfor MDG-related projects.
S C A L I N G U P S E R V I C E D E L I V E R Y
G L O B A L M O N I T O R I N G R E P O R T 2 0 0 5 93
Technical cooperation as a percentage ofeducation bilateral ODAcommitments, 2001–3
United StatesPercent
Belgium
Portugal
Germany
Austria
Australia
New Zealand
France
Italy
Greece
Netherlands
Canada
Spain
Switzerland
Japan
Finland
Norway
United Kingdom
Denmark
Ireland
Sweden
100
96
95
93
92
91
89
88
85
81
75
73
70
66
62
42
42
34
31
8
4
FIGURE 3.14 Seventy percent of bilateral educationaid is reported to be technical assistance
Source: Fast Track Initiative Secretariat based on OECD DAC data.

Aid is also poorly targeted to the regionsand countries furthest from the MDGs. ODAfor water supply and sanitation, for example,is highly concentrated, with the 10 largestrecipients receiving nearly half of all such aidin 1997–2001. In 2000–1 only 12 percent ofaid to the water sector went to countrieswhere less than 60 percent of the populationhas access to an improved water source—which includes most low-income countries.
A I D P R E D I C T A B I L I T Y
A second issue is the volatility of aid flows.Bilateral aid commitments—which accountfor 70 percent of education ODA and 50 per-cent of health ODA—are relatively short-term(one-to-two year) commitments, and disburse-ments can lag or diverge substantially fromcommitment amounts. Ministries of financehave raised understandable concerns abouttaking politically irreversible personnel actionsthat have long-term fiscal costs, such as hiringadditional personnel or adopting wageincreases to retain personnel, if it is not clearthat financing will be sustained. As can be seenfrom the pattern of donor funding commit-ments for health in seven different Africancountries, commitments can vary tremen-dously from year to year (figure 3.15). While it
is true that commitments may be disbursedover several years, leading to a smoother pat-tern of disbursements, the volatility of com-mitments still impedes long-term fiscalplanning.
Although low-income countries eventuallyneed to be able to sustain their education,health, and water and sanitation systems withdomestic resources—avoiding developing long-term dependency on aid—that goal can beachieved only gradually in most countries, witheconomic growth and deepening of fiscalcapacity. In the short to medium term, coun-tries face significant risks in expanding healthor education systems in an environment wherethe level and continuity of donor support arelargely unpredictable.
These issues are particularly acute in thelowest-income countries, which have a highdegree of aid dependency and would groweven more aid-dependent in the period to2015 under most scenarios for attaining theMDGs.46 In health more than 30 percent ofspending is already externally financed in 13low-income African countries. In these coun-tries (some of which appear in figure 3.15) aidvolatility has pushed sector spending into inef-ficient stop-and-start patterns, constrainedexpansion, and disrupted service delivery.47
C H A P T E R 3
94 G L O B A L M O N I T O R I N G R E P O R T 2 0 0 5
Donor commitments for health as percentage of total health expenditure
90
1997
8070605040302010
1998 1999 2000 2001 1997 1998 1999 2000 20010
60
50
40
30
20
10
0
LiberiaMaliTanzaniaMauritania
BurundiBeninGuinea
FIGURE 3.15 Donor commitments can oscillate substantially
Source: WDI and OECD DAC donor funding database and staff estimates.

What is needed is both provision of more sta-ble and predictable financing by donors andefforts by the recipients to gradually buildtheir own fiscal capacities so as to reducedependence on aid in the long term.
T R A N S A C T I O N C O S T S
A third issue is the high transaction costs thatcountries bear in accessing foreign aid. Evensmall volumes of aid for small countries flowthrough hundreds of parallel bilateral, multi-lateral, and global program channels, eachwith its own negotiation, reporting, andadministrative requirements. In 2000 the typi-cal bilateral donor provided ODA to about115 nations. Mozambique has more than 100development partners in its health sectoralone. It is sobering to recognize that, from thestandpoint of a health minister, the volatilelines in figure 3.15 showing total externalfinancing for health are actually composites ofmany different financing sources and disburse-ment patterns, each with its own volatility andadministrative requirements.
Donors often require assistance to be kept inparallel budgets outside the ministry of finance,to facilitate their accounting of the directimpact of their aid. But aid is fungible, and thecumulative demands on recipients are heavy.Low-income countries are forced to allocatelimited human resources away from managingservice delivery to managing donors.
There is a growing view that because aid isfungible, donors should dispense with thenotion that they can identify what their moneybuys and focus on the entire public expenditureprogram and sectorwide results. In Ugandadonors’ willingness to increase the share offunding channeled through the governmentbudget in the context of a sectorwide approachto water has slashed transaction costs and spedimplementation of rural and town water sup-plies. Donor support for water going throughthe national budget increased from 14 percentin 2000 to 44 percent in 2002 and will reach 70percent in 2006. In parallel, Uganda’s annualinvestment in water points and town watersupplies has reached twice that of similarlysized countries.
In education, pooled donor support forsingle, agreed sector investment programshas been a major thrust of the Education forAll Fast Track Initiative (see the next sec-tion). This approach is increasingly beingdiscussed in health as well. Harmonization isalso being advanced more generally throughthe Rome, Marrakech, and recent Parismeetings and ongoing work by OECD’sDevelopment Assistance Committee toimplement country partnership and harmo-nization agreements.
Are Global Programs Advancing the MDGs?
Development assistance for health has risensteadily since 1990 and significantly since theMDGs were adopted in 2000 (figure 3.16). Incontrast, support for education declinedbetween 1990 and 2000, but increased by 35percent in real terms between 2000 and 2003.
H E A L T H
In health much of the post-2000 increase inODA and private philanthropic funding(notably the Gates Foundation) can be cred-ited to new global programs aimed at mobi-lizing global awareness and funding toeradicate major diseases. Major global pro-grams in health include the Global Fund toFight AIDS, Tuberculosis, and Malaria(GFATM), the Global Alliance for Vaccina-tion and Immunization (GAVI), the WorldBank’s Multi-country AIDS Program (MAP),the U.S. President’s Emergency Plan for AIDSRelief (PEPFAR), and some 70 other globalhealth initiatives. The impact on HIV/AIDSfunding has been particularly large: By 2003,almost 80 percent of public spending onHIV/AIDS in low-income countries wasfinanced by external grants.48
These new global initiatives have trans-formed the landscape in the health sector. Injust three to five years the programs have hadthree major achievements:
• Raising global awareness of key diseases.The global health initiatives have been veryeffective in drawing donors’ attention to
S C A L I N G U P S E R V I C E D E L I V E R Y
G L O B A L M O N I T O R I N G R E P O R T 2 0 0 5 95

communicable diseases such as malaria,tuberculosis, and HIV/AIDS that are majorkillers in the developing world, as well as toless-known tropical diseases that dispro-portionately affect low-income countries—such as riverblindness, Chagas disease, anddengue fever. This advocacy has had amajor impact on funding for malaria, tuber-culosis, and HIV/AIDS, all of which are keyfor MDG progress. Some of the resultingpartnerships, notably for river blindness,have also been catalysts for the cross-bordercollaboration needed to produce results.The global programs have played anequally important role at the country level,in encouraging developing country govern-ments to revitalize programs for thesesometimes neglected diseases. Finally, theyhave helped improve the delivery of inter-ventions, often by contributing drugs.
• Stimulating new drug and vaccine research.The global health initiatives have used inno-vative approaches and market power tostimulate research on the drugs and vac-cines needed by developing countries; they
have also stimulated production and helpedlower prices. In noncompetitive markets,such as those for vaccines against childhoodillnesses, guarantees of future purchasesand sharing of risks with producers havebeen used by the Global Alliance for Vac-cines and Immunization (GAVI), for exam-ple. In competitive markets, programs suchas the Tuberculosis Global Drug Facilityhave been effective in expanding access tohigh-quality drugs at reduced prices throughpooled financing and commodity purchases.The Malaria Medicines Supply Service isproposing to use globally pooled procure-ment to increase purchaser leverage andreduce prices, while at the same time creat-ing demand for artemisinin combinationtreatment (ACT) and expanding markets.
• Making aid for health pro-poor. Theresources of global health initiatives aremore focused on low-income countries thanare donor commitments overall, and a highproportion of their resources are dedicatedto communicable diseases, which dispro-portionately affect the poorest people in
C H A P T E R 3
96 G L O B A L M O N I T O R I N G R E P O R T 2 0 0 5
1990
2002 US$ billions2002 US$ billions
Average1997–99
2002
Health ODA and private commitmentsto all developing countries, 1990–2002
0
1
2
3
4
5
6
7
1999 2000 2001 2002 2003
Education ODA commitmentsto all developing countries, 1999–2003
0
1.1
4.6
3.6
1.2
5.96.5
4.8 4.64.43.8
5.0
1.81.41.1
5.8
1
2
3
4
5
6
7
Private non-profitMultilateral, excluding UNBilateral
All donors DAC countries Multilateral
FIGURE 3.16 Total ODA for health and education is increasing
Source: World Bank estimates from DAC database.

low-income countries. Support from theinitiatives is directly pro-poor, and theyhave been very effective at leveraging addi-tional funds from foundations. Finally,they promote cost-effective interventions.
Against these achievements, however, thereis a growing realization that the “verticaliza-tion” of health sector support through diverse,specialized global initiatives is having adverseeffects. All the new global programs have putsubstantial effort into establishing lean andtechnically proficient administrations, carefulaccounting of funding and results, and innov-ative approaches to program delivery—includ-ing, for example, channeling funds directly toNGO providers. But their cumulative impactis to undermine the capacity of ministries ofhealth for coherent planning, financing, per-sonnel deployment, and administration.
A recent study of 14 low-income countriesfound that the multiplicity of global pro-grams, on top of existing multilateral andbilateral channels, is exacerbating transactioncosts and distorting sector priorities.49 Therehave been numerous instances of differentteams of technical experts with identicalterms of reference visiting a single country,and different donors promoting conflictingapproaches and priorities. Citing recent pro-posals in Guyana and Tanzania forHIV/AIDS treatment programs that equalhalf of existing health budgets, the reportargues that such programs—driven by globalfinancing availability rather than nationalpoverty reduction strategy priorities—maydraw disproportionately on health sectorstaffing and other resources.50 Of equal con-cern are reports of agency turf fights andother coordination difficulties at the countrylevel. An IMF mission recently concludedthat bureaucracy and infighting linked to dif-ferent specialized programs were the mainreason one African country was unable to dis-burse more than 20 percent of available aidfor health in 2004 (box 3.5).51
If ODA for health in support of the MDGsis to produce the desired results, a new frame-work is needed. Given the predominantly
recurrent and local nature of financing needs,there is a strong case for providing the bulkof funding as general or sectoral budget sup-port. Equally important is that all donor sup-port be organized around a country-ledhealth strategy that encompasses HIV/AIDS,malaria, and all other disease priorities in abalanced and coherent way. The sector strat-egy should be fully aligned with the country’spoverty reduction strategy and consistentwith its medium-term expenditure frame-work. No donor assistance should be “offplan” or off budget, and the first priority fordonors should be to fill financing gaps inimplementing the poverty reduction strategy.
But for donors to accept flexible transfer oftheir funding through national budgets, theremust be a quid pro quo: Country publicexpenditure management and sector moni-toring must meet performance standards thatassure citizens of donor countries their moneyis resulting in efficient service delivery—andthat those services, over time, are producingMDG results.
E D U C A T I O N
Such a “compact” between countries anddonors figures prominently in the Education forAll Fast Track Initiative (FTI). Consistent withthe Monterrey consensus, the initiative aims toensure developing countries committed to uni-versalizing primary completion the technicaland financial support they need, in exchange forincreased accountability for results. In contrastto health, there is a single global partnership tosupport MDG progress in education, which alleducation donors have formally agreed to. Alsoin contrast to the global health programs, thecore objectives of the FTI are to support coun-tries’ development of a coherent educationstrategy and promote coordinated—and moreefficient—donor support. To make technicalassistance more efficient, donors have agreed toa pooled Education Program DevelopmentFund at the global level to help countriesdevelop credible education strategies andcosted programs—and reduce the welter ofuncoordinated, overlapping studies and capac-ity building initiatives. At the country level, all
S C A L I N G U P S E R V I C E D E L I V E R Y
G L O B A L M O N I T O R I N G R E P O R T 2 0 0 5 97

C H A P T E R 3
98 G L O B A L M O N I T O R I N G R E P O R T 2 0 0 5
The International Monetary Fund (IMF) has a clearly stated policy of ensuring appropriate flexi-bility in fiscal targets, including by seeking and accommodating higher aid flows in countries sup-ported by its Poverty Reduction and Growth Facility (PRGF). How is this policy beingimplemented? What impact is it having on government spending and MDG progress in low-incomecountries? Why do critics continue to assert that IMF programs constrain countries’ ability to scaleup health and education service delivery? Consider the facts in three African countries.
Zambia. Some 16 percent of Zambia’s adult population is HIV positive, and the government hasset a target of reaching 100,000 Zambians with antiretroviral treatment by the end of 2005. In itsfight against HIV/AIDS, Zambia is receiving support from the World Bank’s Multi-country AIDSProgram (MAP), the Global Fund to Fight AIDS, Tuberculosis, and Malaria, and the U.S. Presi-dent’s Emergency Plan for AIDS Relief (PEPFAR). Resources from the MAP and Global Fund aremainly channeled through the National AIDS Council, while the PEPFAR operates largely outsidethe government budget. Efforts are now under way to compile a comprehensive database that tracksthese inflows to improve coordination.
Funding to combat HIV/AIDS is rising sharply, and there now appears to be a problem of absorp-tive capacity. This is not a result of any direct or indirect limit on spending or hiring under the IMF-supported program. No limit has been placed on external funding of HIV/AIDS programs or hiringof health workers in the program. The budget for 2005 makes special efforts to ensure the employ-ment and retention of available health workers. However, external sources of funding to HIV/AIDStypically do not cover personnel.
Uganda. Uganda has achieved considerable success in reducing HIV prevalence rates throughaggressive public sector efforts at prevention and, now, treatment. Between 1998 and 2005 thehealth budget increased from 1.8 to 2.6 percent of GDP. Additional annual health resources of upto 2.0 percent of GDP are available from the Global Fund and PEPFAR. Nearly 40,000 Ugandansare currently on antiretroviral therapy. The authorities hope that by the end of 2005, 60,000 peo-ple will benefit from this therapy (out of 120,000 who need it).
The IMF’s PRGF arrangement with Uganda includes a “ring fence” to protect health care andother poverty-related spending from within-year budget cuts, and promotes a progressive shift inresources to social programs—for example, by seeking to limit growth of nonpriority spending suchas on public administration. But adequate budget resources are not the only issue. Improvementsare needed in the management of Global Fund and other health resources to accelerate the use ofapproved funding (currently less than 20 percent of funding has been used). Capacity also needs tobe enhanced in the health sector, notably through training additional nurses and doctors.
Kenya. Kenya’s HIV infection rate is estimated at 14 percent of the adult population. The fiscalframework underpinning the PRGF-supported program reflects Kenya’s poverty reduction strategypriorities, including the fight against HIV/AIDS—including actions to increase the number of AIDSpatients on antiretroviral therapy.
The Global Fund, MAP, and PEPFAR are expected to disburse $32 million a year over 2005–6to support the government’s AIDS program—about 0.2 percent of GDP. The government estimatesthat AIDS treatment targets will require hiring 4,000 more nurses in addition to the estimated 2,000additional nurses needed for the overall health system. The Global Fund has agreed to providefinancing for 725 nurses on two-year contracts, under prevailing pay scales. While the current IMFprogram places limits on the size of the core civil service establishment, teaching, health, and secu-rity services are excluded. It has been agreed that these services may hire additional personnel to fillthe 3,000 positions lost by the core civil service through natural attrition.
Source: IMF Africa Region staff.
BOX 3.5 IMF programs and MDG progress

S C A L I N G U P S E R V I C E D E L I V E R Y
G L O B A L M O N I T O R I N G R E P O R T 2 0 0 5 99
education donors participate in ministry ofeducation–led coordination groups, with arotating donor “lead” agency. While suchgroups had arisen in some countries previously,they were not a systematic practice.
Country-level donor groups have three keyresponsibilities: review and collectivelyendorse the sector plan, align their financingwith the country’s priorities, and monitorprogress in improving education spendingefficiency, through a set of agreed perfor-mance indicators. Indicators include key out-comes, such as the primary completion rateand the gender ratio in education, and keyintermediate indicators, such as the repetitionrate, the pupil-teacher ratio, the share of edu-cation in public spending, and the share ofeducation spending on books, materials, andother crucial quality-enhancing inputs.
Making each dollar of education spendinggo further is a joint priority under the initia-tive’s “compact.” Donors have also agreed thattheir progress in increasing aid efficiencyshould be monitored annually and reportedtransparently. At the March 2005 High LevelForum on Harmonization and Alignment inParis, donors committed to a specific set of har-monization indicators (see chapter 5). Progresson these indicators will be monitored by theOECD’s Development Assistance Committee(DAC). The FTI, which involves both country-level coordination groups and regular globalmeetings to monitor progress, offers a ready-made channel for disseminating the indicatorsand working with education donors on theseagreed areas of harmonization and alignment.The initiative’s secretariat, for example, is help-ing to turn principles into good practice bydeveloping sample memorandums of under-standing and common guidelines for assessingthe quality of education sector plans.
The FTI was launched in June 2002. Whathas it accomplished? There is general consen-sus on two conclusions:
• The initiative is having a positive impact ondonor coordination at both the country andglobal levels. Honduras’s minister of educa-tion called this the initiative’s greatest bene-
fit, and countries such as Nicaragua, Viet-nam, and Yemen have credited the initiativewith bringing the donor communities intheir countries together—and creating dis-cipline around a country-led, coherentprocess of education planning and prioritysetting linked to their poverty reductionstrategies. At the global level the FTI haspromoted ongoing dialogue and informa-tion sharing among donors, through semi-annual meetings and working groupsfocused on priority issues such as trackingof aid flows and harmonization.
• A continuing challenge for the initiative iscountering skepticism about its ability tomobilize substantially increased fundingfor the education MDG. Although a firstset of endorsed countries has received sig-nificant additional support, the number ofcountries is small and the commitmentsare fairly short term. Moreover, manymore countries are poised to enter the ini-tiative. As part of the global stocktaking ofMDG progress in 2005, donors need todevelop options for a more stable fundingframework for the FTI.
In contrast to the global programs inhealth, the FTI started with little upfrontfunding. Instead, donors pledged to commitadditional resources to specific countries oncetheir sector plans had been endorsed andfinancing needs established. The rationale wasthat channeling incremental funding throughexisting bilateral and multilateral mechanismswould speed disbursements and avoid theincreased bureaucracy and transaction costsof setting up new global funds. With initialsupport from the Netherlands (subsequentlyjoined by Belgium, Italy, Norway, and theUnited Kingdom), however, a $235 milliontrust fund was established in 2003, called theCatalytic Fund. Given its size, the fund wasnot designed to be the primary financing chan-nel for primary education support. Rather, itprovides transitional (two- to three-year)financing to endorsed countries with only asmall number of active donors (“donororphans”) until larger and more sustained

volumes of aid can be attracted from newbilateral or multilateral channels.
While this approach has kept administra-tive and transactions costs lower than in thehealth sector, it is difficult to argue that it hasworked well from the perspective of mobiliz-ing the incremental aid volumes needed toachieve the education MDG. The financinggaps for the first seven countries endorsed bythe initiative have been closed, but it tookalmost two years to do so, and transitionalsupport from the Catalytic Fund has played alarge role. The additional commitments forthese seven countries represent a 30–40 per-cent increase in their ODA for primary edu-cation, but the new commitments extend onlyto the end of 2006. The gap-filling has notbeen timely, and the assurance of sustainedand predictable financing is largely absent.
Another five countries, endorsed in 2002–3,still have financing gaps totaling $260 million(over three years). And in 2005 as many as 25additional countries could meet the FTIendorsement requirements (having a povertyreduction strategy and an agreed educationplan), raising global financing needs for theprogram to an estimated $1.7 billion in 2005and more than $3 billion a year from 2006.52
From a developing country standpoint, how-ever, there has been no credible indicationfrom the initiative’s donors that these amountsare being programmed.
The FTI’s country-driven model, its align-ment with Poverty Reduction Strategy andMedium Term Expenditure Framework plan-ning and budgeting, its focus on monitoringresults and spending efficiency, and its activepromotion of donor harmonization are allimportant achievements. Its donors now needto develop a fundraising model that ensures asubstantially increased volume of sustained,predictable funding for countries with credi-ble education plans and good implementationperformance.
Making the Money WorkAchieving the MDGs will depend above all ondeveloping countries’ ability to achieve stronger
public sector performance in delivering services.The challenge is essentially political. The evi-dence that aid works best where policies andgovernance are good is influencing aid flows,and this trend will intensify. While some donorssuggest that a viable strategy in weak states is tobypass the public sector altogether, no OECDcountry has ever achieved universal health orbasic education coverage with mainly privatesystems—in fact, most are heavily public. Bothfor-profit and nonprofit private actors will likelyplay more important roles in the development ofthese sectors in low-income countries, especiallylow-income countries under stress (box 3.6), andespecially in water and sanitation. But evenwhere services are privately provided, effectivestate capacity is required to perform the corefunctions of mobilizing revenues, planning, cost-ing and prioritizing sector investments, settingstandards and policies, contracting withproviders, and monitoring outcomes.
The World Bank’s World DevelopmentReport 2004 documents the many ways inwhich the public sector in developing coun-tries fails in service delivery, particularly forpoor people. Even where spending on educa-tion and health absorbs a high share of GDP,key outcomes can be weak (figure 3.17).Studies consistently confirm the weak rela-tionship between social spending and out-comes—especially in health—and the twomain causes. First, spending may not be allo-cated to the types of services that mostdirectly affect outcomes. Health spending onhospitals, for example, does not have as muchimpact on child mortality rates and malariaincidence as does spending focused on immu-nization programs and malaria control.
The second issue is that even whereresources are allocated to the basic educationand primary health care services most closelylinked to MDG outcomes, the chain of peopleand transactions through which resources flowdown to frontline providers is long, geograph-ically dispersed, dependent on the discretionarybehavior of many individuals, and open toleakage at many points. The core services thatfrontline teachers and doctors provide are com-plex and individualized, making them difficult
C H A P T E R 3
100 G L O B A L M O N I T O R I N G R E P O R T 2 0 0 5

G L O B A L M O N I T O R I N G R E P O R T 2 0 0 5 101
Low-income countries under stress are defined by their weak policies and institutions. Many haverecently emerged from or been affected by conflict. Achieving effective service delivery in these cir-cumstances is a challenge. Nevertheless, successful approaches are emerging, including some thatfeature the use of local institutions or that work with nonstate actors in ways designed for eventualtransfer to state delivery.
In countries where national institutions are weak, it may seem counterintuitive to look to thesubnational levels of government to provide services. But in a number of low-income countriesunder stress, it is at the local level that formal and informal institutions often demonstrate the mostcapacity to manage and allocate resources. Community-driven development and social fundapproaches have been widely used and proven well suited to these country contexts.
The Northern Uganda Social Fund, for instance, supports construction and rehabilitation ofsocial and economic infrastructure that is identified, managed, and implemented by local commu-nities in conflict-affected areas. In Afghanistan community forums helped ensure vital services andincome generation opportunities in local areas during a period of state collapse. Supported by smallgrants to cover initial costs, the forums relied mostly on community mobilization and cost recov-ery to organize and finance services. They gradually developed relationships with local governmentsand donors to become key development actors at the local level. Their highly flexible approachallowed them to respond to community initiatives and local conditions, and later to become thebasis for a social fund after the fall of the Taliban. Until recently their model of representative gov-ernance was unique in Afghanistan and contributed to the local reduction of ethnic tensions at atime when ethnicity became heavily politicized and a driver of conflict. The project laid the basisfor the new National Solidarity Program, which operates at scale and has been instrumental inbringing both participatory processes and a positive state presence to many remote areas.
Particularly in postconflict countries, experience shows that it is important to give early attentionto building the capacity of government actors to take responsibility for service delivery, as well as torestoring basic services quickly. In Timor-Leste health indicators improved significantly in the fouryears following the country’s crisis, through a strategy that balanced these two goals. The programworked simultaneously on short-term needs such as reconstruction of health facilities, through gov-ernment contracts with nongovernmental organizations (NGOs), and medium- to long-term goalssuch as developing a national health policy, pharmaceutical logistics systems, human resources forhealth, and gradual handover of NGO contracts to government.
Source: World Bank LICUS unit.
BOX 3.6 Scaling up service delivery in low-income countries under stress (LICUS)
Perc
ent d
evia
tion
from
rat
epr
edic
ted
by G
DP
per
capi
ta
Per child public spending on education, 1990s average(% deviation from expenditures predicted by GDPper capita)
150
–150
100
50
0
–50
–100
–100 –50 0 50 100 150–150
Primary completion rate 1999 Under age five mortality rate 2000
Per capita public spending on health, 1990s average(% deviation from expenditures predicted by GDPper capita)
150
–150
100
50
0
–50
–100
–100 –50 0 50 100 150–150
FIGURE 3.17 Higher spending on education and health does not always mean better outcomes
Source: World Development Report 2004.Note: Regression line shown: Coefficient = .157, T-statistic = 1.70. Note: Regression line shown: Coefficient = –.148, T-statistic = 1.45.

to monitor and manage. Difficult working con-ditions, uncompetitive salaries, and higher sta-tus relative to illiterate and unempoweredfamilies can undercut providers’ accountabilityto clients and foster absenteeism and low qual-ity. Inefficiency in the use of available resources,arising from all these sources, can be large.
The case for additional aid, especially inthe form of flexible budget support, willdepend on countries’ ability to show thatfunds are well managed and producing MDGresults. And as the World DevelopmentReport 2004 emphasizes, reforms to improveservice delivery must address not only itsproximate causes—no drugs in clinics,teacher absenteeism, no water connections inpoor urban areas—but also the underlyingpower and accountability relationships link-ing citizens, politicians, and service providersthat are the cause of persistent inequity andinefficiency in the use of public resources.Progress in many settings will require actionson all three dimensions of the “accountabil-ity triangle” linking citizens, politicians, andservice providers. It will require broadreforms to improve governance and increasethe responsiveness of elected officials to citi-zens, strategic actions to improve the man-agement of resources and performance alongthe service delivery chain, and strengtheningof “client power,” or citizens’ ability todemand better basic services directly fromfrontline providers.
Improving Governance
The broad structures at the foundation ofgood government—the rule of law, control ofcorruption, sound economic management,representative governance, and independentmedia—are crucial for macroeconomicgrowth and foreign direct investment. Theyalso have direct repercussions on the equityand efficiency of public services.
Jump-starting progress toward the MDGscan require decisive actions to prioritize uni-versal coverage of basic services over the inter-ests of politically influential stakeholders. Ithas involved such politically difficult actions as
shifting to contract teachers to make the costsof expanding schooling more sustainable, atthe price of opposition from teacher unions;eliminating fees for basic health services for thepoor while retaining them for upper-incomegroups; shifting to low-cost construction ofschools and clinics by communities rather thanmore expensive national or international con-tractors; and resisting pressures from teachersand parents for smaller classes until universalcoverage is achieved.
All these actions to lower the unit costs ofbasic services or recover costs from those whocan afford them promote faster achievementof universal coverage. Countries that havemade the fastest MDG progress have givenpriority to coverage for all, adopted cheaperbut “good enough” service delivery modelsinitially, and focused on improving qualityover time. These political choices are unlikelyin contexts where the voices of the groupsthat would benefit from universal access areweak and the influence of institutional stake-holders, such as medical or teacher unions, isstrong. A recent study of Georgia concludedthat slow progress on the health MDGs andunderfunding of MDG-related health serviceswere much more a “failure of citizens to exer-cise their voice power and the ability of politi-cians to remain largely unresponsive to thepoorly expressed demands than of resourcelimitations per se.”53
But progress is being made. In most devel-oping regions, two decades ago democracywas the exception; now it is the rule. Politicalrepresentation, transparency, corruption, andthe quality of public administration are beingopenly evaluated with a number of interna-tional indexes, and most are steadily improv-ing. Since 1999 the average ratings forSub-Saharan African countries on the WorldBank’s policy and institutional assessmentindex (CPIA) have been stable or increasingin all five areas (quality of budgetary andfinancial management, efficiency of revenuemobilization, quality of public administra-tion, property rights, rule-based governance).The New Partnership for Africa’s Develop-ment (NEPAD) has developed a peer review
C H A P T E R 3
102 G L O B A L M O N I T O R I N G R E P O R T 2 0 0 5

mechanism that uses transparent nationalassessments by teams from neighboring coun-tries to highlight governance weaknesses inAfrican countries and encourage improve-ments (see chapter 2 for more on NEPAD andthe African Peer Review Mechanism).
One of the most critical areas for progressis public expenditure management. Achievingthe health and education MDGs will requiregreatly increased volumes of flexible aid chan-neled through national budgets. But in manyof the low-income countries in greatest needof external recurrent cost support, budget sys-tems are too weak to give donors confidencethat resources can be tracked and well used.Systems for budget formulation, execution,and reporting must be able to meet thresholdstandards of integrity and efficiency.
Under the Heavily Indebted Poor Coun-tries initiative the IMF and World Bank haveworked with countries on benchmarks formeasuring capacity to manage priority publicspending. Although a first assessment of 24countries in 2002 found no country with afully adequate system and most in need ofsubstantial upgrading, many countriesshowed progress when they were reassessedin 2004 (see chapter 2 for more details). Maliand Tanzania advanced to the category of“little upgrading needed,” and Ghana andSenegal showed substantial progress. For thegroup as a whole the average number ofbenchmarks met increased from 6.0 to 6.5out of a possible 15. Much more is needed,obviously, but trends are in the right direc-tion. But countries’ performance againstthese indicators can be expected to play amajor role in their access to expanded aid inthe form of budget support.
Managing the Service Delivery Chain
Broad improvements in political responsive-ness to citizens and in public expenditure man-agement should increase the resourcesavailable for MDG-related services. But it isthe service delivery chain—institutional per-formance and policies in the education, health,water, and sanitation sectors—that transforms
financing into coverage and coverage into out-comes. Substantial country evidence showsthat both links can be problematic. But coun-try experience also points to four importantstrategies for strengthening provider account-ability and system efficiency.
M E A S U R E R E S U L T S , P E R F O R M A N C E ,A N D I M P A C T
Fundamental for progress is measurement ofperformance and results. At present, coun-tries are far from real-time tracking of MDGprogress for virtually all the goals and indica-tors. To focus health and education systemson key results, countries need better and moretimely administrative data. Capacity buildingin this area should be a priority, but it mustbe carried out in new ways that avoid thewastefulness of incompatible managementinformation systems financed by differentdonors and technical assistance that fails tobuild true local capacity. Countries also needhousehold surveys at regular intervals—suchsurveys are essential for tracking MDG out-comes by income quintile, gender, ethnicity,or region.
The World Bank and the United NationsEducational, Scientific, and Cultural Organi-zation’s Institute of Statistics should put coor-dinated emphasis on building countries’capacity for consistent annual reporting of pri-mary school completion and build up the Pri-mary Completion Database they have jointlylaunched. The targets for the second MDG, onprimary school completion, should also beexpanded to include some measurement of stu-dent learning. Universal primary completion isa meaningful goal only if it signals that chil-dren have learned, and in an economicallyintegrated world this threshold level of skillsand knowledge should be a globally relevantone. Donors should support work by a con-sortium of international testing agencies on aculturally neutral global “core curriculum”that can be embedded in the various regionallearning assessments in use today. Countriesnot participating in regional assessmentsshould be encouraged to do so. And strength-ening national assessment systems should be a
S C A L I N G U P S E R V I C E D E L I V E R Y
G L O B A L M O N I T O R I N G R E P O R T 2 0 0 5 103

priority area of support. Equally important ismaking results known to parents and com-munities. Albania, Romania, and Turkey,among other countries, have recently madeimportant strides in broad public diffusion ofstudent learning results.
Most MDG outcomes improve relativelyslowly, so intermediate indicators of progressare also important—above all, measures ofsystem efficiency. The FTI “indicative frame-work” for monitoring education sector per-formance is transparent and permits directcomparisons of countries’ progress; a similarframework is being developed by a donor con-sortium in health (Health Metrics Network).These new approaches will work to theadvantage of countries committed to betterperformance.
Finally, rigorous evaluation of the impact ofdevelopment programs builds the knowledgebase for better policies. Considerable resourcesare devoted to evaluation studies today, but thefailure to establish clear baseline data orappropriate controls often compromises thequality and policy value of the results. Severalrecent examples, including the Progresa/Opor-tunidades conditional cash transfer program inMexico and school health interventions inKenya, attest to the role that well-designedevaluations can play in persuading policymak-ers to expand or sustain programs, even acrosschanges of government.
One of the most crucial questions for pol-icymakers is how a program or policy’sdesign will play out in different country cir-cumstances. This kind of knowledge, whichcan be derived only from comparable evalua-tions across countries, is a global publicgood—and the costs of generating it need tobe broadly shared by the international devel-opment community. The World Bank is espe-cially well-positioned to identify programswith similar objectives and design featuresbeing implemented in different parts of theworld, and to support systematic and rigor-ous evaluations of their impact. Through theBankwide Development Impact Evaluation(DIME) initiative and efforts by the Bank’sHuman Development Network to organize
impact evaluations of key types of education,health, youth employment, and early childdevelopment programs, there has been asharp increase in attention to this area overthe past year. It should be strengthened fur-ther, with expanded support from donors tobuild capacity in low-income countries fordata collection and analysis and to broadlydiffuse evaluation results. Developing coun-try policymakers and their donor partnersshould also provide a “demand side” stimu-lus to impact evaluation, by systematicallyasking for the evidence base when consider-ing new programs or policy proposals.
U S E T R A N S P A R E N T A L L O C A T I O N R U L E S A N D T H E P O W E R O F I N F O R M A T I O N
A core issue in education and health servicedelivery is getting funds to the frontlines,where services are delivered. Setting simple,clear norms for the allocation of funding hasbeen a boon to more efficient and equitableservice provision in both developed and devel-oping countries. In education, “funding fol-lows the student” reforms have had dramaticeffects in countries ranging from Brazil toAustralia. In Brazil a 1997 reform that set aminimum floor on education spending in allregions sharply increased resources for thepoorest (Northeast) region, and nationallycaused primary enrollments of children fromthe lowest income quintile to rise from 55 per-cent to 85 percent—in the space of six years.
Norms for the allocation of personnel orother inputs (such as medicines or books) canalso be established and clearly communicatedto each facility. In addition, fees for healthservices and drugs should be posted transpar-ently, to ensure that patients are chargedfairly and collected funds are not diverted. InGeorgia prominent posting of the fee sched-ule in the children’s hospital in Tbilisi hascurbed excessive payments and significantlyincreased hospital revenues.54 In water andsanitation, Burundi and other countries havesignificantly increased investment efficiencyby setting clear guidelines, disbursement pro-cedures, and performance indicators for civil
C H A P T E R 3
104 G L O B A L M O N I T O R I N G R E P O R T 2 0 0 5

works contractors, with oversight providedby nonprofit contract management agencies.As a result water and sanitation project exe-cution has improved dramatically in Burundi,with invoice payment time averaging 5days—compared with 90 days elsewhere inthe central government.
The positive impact of clear funding ruleson leakage is shown by public expendituretracking studies, which document enormousvariations in the degree to which fundsintended for frontline facilities actuallyreach them (figure 3.18). Leakage estimatesare not comparable across countries andsometimes simply reflect a failure to recordtransfers properly, not a failure of resourcesto arrive. But the studies show that even inthe same country, results can vary substan-tially under programs with different designs.Leakage is not an inevitable feature of low-income settings.
Clear allocation rules have the greatestimpact if they are widely known. Ugandaraised the share of per student capitationgrants that made it to schools from 13 per-cent in 1991–5 to 82 percent in 2001 by pub-lishing monthly data on the transfers innewspapers, broadcasting it on the radio, andhaving primary schools post notices of theirentitlements and the amounts actuallyreceived. For the first time, parents had theinformation they needed to understand andmonitor the grant program.
Subsequent research in Uganda has docu-mented that throughput to the school level ismost efficient in areas where newspaper pen-etration is highest—pointing to the power ofinformation.55 And a new study shows that,controlling for other factors, schools withhigher transfers show more improvement instudent learning.56 Uganda’s story points tothree key messages for MDG progress:
S C A L I N G U P S E R V I C E D E L I V E R Y
G L O B A L M O N I T O R I N G R E P O R T 2 0 0 5 105
20
62
84
43
59
13
82
90
Percent
51Ghana: non-wage transfers
to primary schools (1997–8)
Degree to which funds reach frontline facilities
Ghana: non-wage transfersto health clinics (1998)
Madagascar: fixed per-school grant (2003–4)
Papua New Guinea:education sudsidy (2001)
Tanzania: non-wage transfersto primary schools (1999)
Tanzania: non-wage transfersto health clinics (1999)
Uganda: per studentcapitation grant (1991–5)
Zambia: fixedper-school grant (2001)
Uganda: per studentcapitation grant (2001)
Education Health
FIGURE 3.18 Leakage of funds can be high but is not inevitable
Source: Kushnarova 2005.

• Clear, equitable norms for managing keyinputs—be it personnel allocations or fund-ing for books or drugs—are important.
• Broad use of the media and transparent report-ing at the facility level can unleash “clientpower” and pressures for improvement.
• It is important to go the extra step to ana-lyze not just progress in reducing leakage,but also its impact on outcomes, such asstudent learning or community healthindicators.
Few countries have done all these things,but the growing number of countries usingPublic Expenditure Tracking Surveys (PETS)and Service Delivery Surveys to measurefrontline funding and service quality isencouraging.
F O C U S O N P R O V I D E R Q U A L I T Y ,D E P L O Y M E N T , A N D I N C E N T I V E S
Skilled providers are the most expensive ele-ment of health and education systems; recruit-ing, deploying, equipping, and supervisingthem carefully are key to maximizing the pro-ductivity of spending. Yet very few countriesrecruit teachers on the basis of tests measuringtheir subject mastery and what they can do inthe classroom. Far more common are the prac-tices of Colombia, where teachers and head-masters are routinely hired based on partyaffiliation regardless of their experience, train-ing, or knowledge,57 or Cameroon, whereheadmaster posts are sold.58
Deployment is also poorly managed inmany settings. In Ethiopia each health workerin the Afar region handles 1,200 outpatientvisits a year, in Addis Ababa 680, and in Gam-bella just 82.59 The implication? If health careworkers were posted more efficiently acrossthe system, achieving Afar’s degree of produc-tivity everywhere, the Ethiopian health caresystem could dramatically increase servicedelivery with the current number of workers.
Similarly, studies in Sub-Saharan Africafind some countries doing a far better job ofallocating teachers equitably across schools.Whereas in Benin 39 percent of teacher post-ings deviate from the official norm of 40 stu-
dents per teacher, in São Tomé and Principeonly 3 percent do. Deviations from officialnorms almost always reflect an oversupply ofteachers in more appealing urban areas andlow service provision in rural zones.60 Coun-tries seeking better MDG outcomes can startby examining factors like these.
Even when providers are deployed rela-tively efficiently, poor incentives, weak man-agement, widespread illness, and otherfactors can cause high rates of providerabsence. Surveys of service delivery that makeunannounced visits to a sample of facilitiesshow consistently high absence rates amongteachers and health workers (figure 3.19).The problem is especially acute among doc-tors, who have a ready private market fortheir services. In Bangladesh absentee ratesfor physicians average 74 percent at smallrural posts.61 Provider absence seriously dis-rupts service delivery and undermines MDGoutcomes. In Nigeria a 2003 project to trackeffective hours of instruction found thatalmost half the annual school hours in Kano,Nasarawa, and Lagos were lost because ofteacher and pupil absences.62
Studies that have examined this issue indetail have found that it is not simply a ques-tion of salary incentives. In Bangladesh thehighest-paid teachers were most likely to beabsent.63 And in India, as well as Bangladesh,a large share of teacher absences wereexcused absences for training and otheradministrative processes. Many providersposted to remote rural areas, for example,must travel long distances to pick up theirpay—and must do so on business days.Countries concerned about MDG outcomesneed to address these managerial issues.
Average salaries for skilled providers mayneed adjustment in many contexts, to counterproviders’ incentives to migrate internationallyin health or to extract informal payments. Butthere is abundant evidence that effective incen-tives are not just a question of average salaries,or even salary dispersion, although—if tied toperformance evaluation systems perceived asfair—this can help. Nonsalary inducements(such as housing, research and training oppor-
C H A P T E R 3
106 G L O B A L M O N I T O R I N G R E P O R T 2 0 0 5

tunities, and public recognition) are important,as are accountability pressures through, forexample, effective supervision. In Karnataka,India, the Learning Guaranty Program is aninnovative attempt to strengthen incentives forpublic education providers to focus on out-comes that really matter—how well they serveall children in the community, and how muchchildren learn (box 3.7).
M A K E G O O D U S E O F T H E P R I V A T E S E C T O R
Comparisons of service delivery norms andoutputs in public and private facilities oftenreveal large differences in efficiency. Althoughthe Christian Health Association of Ghanaemploys only 17 percent of health sector
staff, it handles 41 percent of hospital patientvisits (outpatient and inpatient) and 27 per-cent of health clinic visits.64 Evaluations ofJesuit-run Fe y Alegria schools in nine LatinAmerican countries have found that theschools systematically outperform publicschools, with lower repetition and dropoutrates and higher graduation rates—despitethe fact that resources per student are thesame or lower in Fe y Alegria schools and theschools cater to disadvantaged students.65
The higher efficiency of private providerscan have major benefits for poor people’saccess to services and for MDG progress. InBarranquilla, Colombia, after water and san-itation services were contracted out in 1993,water supply coverage increased from 68 to
S C A L I N G U P S E R V I C E D E L I V E R Y
G L O B A L M O N I T O R I N G R E P O R T 2 0 0 5 107
14
14
25
19
15
11
27
17
16Bangladesh
Absence rates of teachers
Ecuador
Honduras
India
Indonesia
Papua New Guinea
Peru
Zambia
Uganda
27
40
40
19
19
23
37
35Bangladesh
Absence rates of health workers
Percent
Honduras
India
Indonesia
Mozambique
Papua New Guinea
Uganda
Peru
FIGURE 3.19 Absence rates can be very high, especially in health
Source: Kushnarova 2005.Note: Based on studies/surveys conducted between 2000 and 2004.

99 percent by 2002, and sanitation coverageincreased from 54 to 96 percent. In addition,unaccounted-for water fell, taps began func-tioning 24 hours a day, and response timesfor consumer complaints improved dramati-cally. Poor consumers benefited most fromthe increased efficiency: more than 80 percentof new connections were in low-incomeneighborhoods.
After Argentina privatized local water com-panies in about 30 percent of its municipalitiesin the early 1990s, child mortality fell by 5–7percent in those areas. The largest gainsoccurred in the poorest municipalities, wherechild mortality fell by 24 percent. Researchersestimate that privatization of water serviceshas prevented 375 child deaths a year.66 Datafrom Bolivia and Chile confirm this pattern:private companies’ capacity to generateincome from efficiently operated services andpromote faster system expansion led to pro-poor expansion of water supply, with 25–30percent of network expansion targeted to thepoorest fifth of the income distribution.
Countries can capitalize on what privateproviders do best by allowing high-quality
for-profit providers to serve the top segmentsof the income distribution and making strate-gic use of contracting with for-profit andNGO providers to serve other incomegroups. NGO providers are often associatedwith local innovation and communityinvolvement in service delivery, whichincrease quality, targeting, and cost-effective-ness. El Salvador, Guatemala, Honduras, andPanama are increasingly contracting withNGOs to provide health services to remote(often indigenous) populations on the basis offixed annual capitation payments. In mostcases the NGOs use networks of itinerantteams, complemented by community-basedparamedics. In Guatemala, where the experi-ence is longest, about 90 NGOs serve morethan 3 million people—30 percent of thenational population. Impact evaluations haveshown more cost-effective health outcomesunder this approach than under traditionalpublic sector delivery.67
That Bangladesh has made faster progresson MDG outcomes than other South Asiancountries, despite its lower per capita income,is attributed by many observers to its wide-
C H A P T E R 3
108 G L O B A L M O N I T O R I N G R E P O R T 2 0 0 5
The Learning Guaranty Program, launched in 2002 by the government of Karnataka, India, in col-laboration with the Azim Premji Foundation, aims to strengthen incentives for schools to enroll allchildren and ensure that they learn. All of the approximately 10,000 public primary schools in thepoor, northeastern districts of the state are eligible to participate in the program, which is essen-tially a competition. Using a novel approach, the program rewards schools on the basis of learningoutcomes for all children in their catchment area, whether or not they are enrolled. If 60 percent ofchildren can demonstrate on assessment tests that they have acquired 90 percent of prescribed com-petencies in mathematics and language, the school receives 5,000 rupees. If 70 percent of childrendo well, the reward is 10,000 rupees. And with 80 percent, the reward is 20,000 rupees. Over athree-year period a school can win a maximum of 60,000 rupees.
In the program’s first year, about 10 percent of schools competed, but the number has since risendramatically. The program provides direct financial incentives for government schools to deliverbetter education services to their communities. It is expected that the program will enable parentsand communities to put pressure on their children’s schools to become a certified Learning Guar-anty School. It is also expected that such schools will develop more creative ways of encouragingchildren to enroll and stay in school. The Learning Guaranty Program is an interesting attempt tomore closely align schools’ incentives and MDG outcomes.
Source: Azim Premji Foundation 2002, cited in World Bank 2004b.
BOX 3.7 Rewarding schools for MDG outcomes

spread use of partnerships between the gov-ernment and innovative NGOs. In health thecountry’s largest NGO, BRAC, developed asystem for teaching mothers how to use oralrehydration therapy for children with diar-rhea, under which more than half of outreachworkers’ compensation is paid as bonuses.Bonuses are based on sample surveys ofmothers, and the greater the number ofwomen in a village who can explain how tomake and use the rehydration solution, thehigher the payment. Within the first two yearsof the program, two-thirds of mothers sam-pled could use the therapy—a much highersuccess rate than outreach and communica-tion efforts usually achieve. Researchers alsoobserved a wide range of practical and effec-tive teaching techniques developed by theoutreach workers in response to whatworked best for clients.68
But private service delivery does not auto-matically lead to better accountability. Alsoin Bangladesh, researchers have found higherrates of teacher absence in privately run, gov-ernment-subsidized secondary schools thanin schools run by the government directly.Even though continued public funding is sup-posed to be tied to school performance, gov-ernment supervisors rarely visit schools, andthere are few institutional mechanisms toensure accountability.69 The issue is not pub-lic or private; it is the degree to which theinstitutional framework creates incentives forgood performance and the capacity to holdproviders accountable.
Strengthening “Client Power”
In many settings slow progress toward theMDGs mainly reflects the failure of servicesto reach or meet the needs of poor people.Poor regions are the last to receive access tosocial services. And even when they do, deepsocial inequalities and rampant illiteracy canproduce such imbalances in client-providerrelationships that abusive or alcoholic teach-ers, nurses hitting mothers during childbirth,and doctors refusing to treat patients of alower caste constitute “service delivery” for
hundreds of millions of poor people. Evenmore widespread is the failure to listen tolow-income clients’ needs in order to makeservices work better.
Countries are experimenting with ways tostrengthen client power in frontline relation-ships, and the results are encouraging. Whileincreasing client choice among providers is acore strategy, it is most feasible in relativelydeveloped settings—urban areas in middle-income countries—where provider density isrelatively high. Approaches that increasevoice appear to hold more promise forexpanding MDG-related services in low-income countries, at least for the near future.
I N V O L V E C O M M U N I T I E S I N T A R G E T I N G , M O N I T O R I N G , A N D M A N A G E M E N T
Experiences with community-run schools,health clinics, and rural water systems in adiverse group of countries suggest that directclient involvement in the design and manage-ment of services can yield positive results. Thewater supply and sanitation sector has beenat the fore of more efficient targeting ofsubsidies by involving communities—andespecially women—in designating whichhouseholds qualify as poor. In Cambodiawater operators compete for contracts to con-nect designated households and are paid perconnection; this “output-based aid” hasresulted in connection costs for poor house-holds that are about one-quarter below theaverage for public bids. After being con-nected, households pay the full costs of oper-ating and maintaining the systems—whichensures their sustainability.
In education, evaluations in numerousLatin American countries and Indian stateshave found that parental and communityinvolvement in schools is correlated withlower teacher absenteeism, higher student testscores, and in some cases lower dropout andrepetition rates. Three Central Americancountries—El Salvador, Honduras, andNicaragua—have more than a decade of expe-rience with relatively strong devolution ofautonomy to primary schools and substantive
S C A L I N G U P S E R V I C E D E L I V E R Y
G L O B A L M O N I T O R I N G R E P O R T 2 0 0 5 109

engagement of parents in school manage-ment, including the ability to hire and fireprincipals and teachers. These reforms haveresulted in less teacher absenteeism, longerteacher work hours, more homework assign-ments, and closer parent-teacher relation-ships. Such changes are promising, especiallyin contexts where education quality is low,teacher absenteeism is high, and schools areoften not functioning.70
But evaluations in these countries have alsoshown that the degree of effective controlvaries across schools. Although El Salvador’scommunity-managed schools program(EDUCO) has shown that illiterate parentscan manage school budgets and key personneldecisions, researchers in Nicaragua foundmany schools where parents’ de jure involve-ment in school councils was not matched byde facto voice. Communities often needcapacity building and support in taking onthese new functions. Finally, evaluations ofstudent learning outcomes provide a reminderthat improving teacher attendance and workhours are only first steps toward improvingeducation quality. The impact of school-basedmanagement on learning outcomes is mixed,with Honduras showing the most improve-ment, El Salvador some improvement, andNicaragua declines. For better outcomes,teachers also need to be knowledgeable in thesubjects they are teaching and to use effectiveteaching methods. School-based managementhas not affected these areas.
L E T C I T I Z E N S E V A L U A T E P R O V I D E R S
A second tool for promoting voice is citizenreport cards or other surveys to gain clientfeedback on the performance of public ser-vices. Report cards enable clients to signalneeded reforms and can increase account-ability pressures through media coverage andcivil society advocacy. Report cards on pub-lic services were first tried in Bangalore, India,in 1993. The feedback—revealing poor qual-ity, petty corruption, lack of access for slumdwellers, and the large hidden private copingcosts of deceptively cheap public services—were widely publicized by an active press.
The report cards empowered citizens todirectly evaluate the civil service and pushedmanagers of public agencies to act.71 By 1999a report card rated some Bangalore servicessubstantially higher. Citizen report cards havesince been used in Colombia (where a pro-gram called Como Vamos is supported bymajor media groups that disseminate results),Peru (where they are built into the nationalhousehold survey), the Philippines, Vietnam,and most recently Albania. They are alsobeing developed in Argentina, Bolivia,Ecuador, Honduras, Mexico, and Ukraine. Asimilar tool is community scorecards, whichfocus on service performance at the facility orcommunity level. Rwanda is developing com-munity scorecards for health and educationfacilities. In Parana, Brazil, a school reportcard allows parents to rate their children’sschools, teachers, and overall performance.
These approaches have the potential toalter accountability relationships betweenclients and providers, but in many settings itwill take time for client power to develop. InParana state officials observed that parentswere often unsure about what to assess andfound it difficult—particularly in face-to-facemeetings—to criticize the school establish-ment. Still, as a signal from the public sectorthat citizens’ views are considered importantfor improving the quality of service deliveryand the accountability of providers, theseapproaches are an important step in the rightdirection. Their effectiveness will be enhancedif communities have regular access to basicinformation on school, clinic, district, andnational performance on key MDG and otherindicators.
S T R E N G T H E N D E M A N D W I T H C O N D I T I O N A L C A S H T R A N S F E R S
Conditional cash transfers provide cash grantsdirectly to poor families, conditional on theirchildren’s regular school attendance and healthclinic visits for immunizations, nutrition sup-port, and growth monitoring. They have beenadopted in a number of Latin American coun-tries over the past 10 years and are spreading toother regions.
C H A P T E R 3
110 G L O B A L M O N I T O R I N G R E P O R T 2 0 0 5

Such transfers have a number of sellingpoints. First, rigorous impact evaluations haveshown that they work—they are effective bothin raising the immediate incomes of poor fam-ilies and developing their longer-term humancapital.72 Second, conditional cash transfershave political advantages: They allow centralgovernments to have a direct relationship witha target population and to provide a visibleand popular form of assistance. The programscan operate with small technical teams,focused on designing and maintaining the tar-geting system and ensuring timely paymentsby post or local bank accounts to large num-bers of families. Compared with the alterna-tive of channeling incremental public fundsthrough inefficient public agencies or decen-tralized levels of government, the politicalattraction for national politicians is clear.
But from the standpoint of MDG progress,conditional cash transfers’ third asset is by farthe most important. They can protect thehealth and brain development of children dur-ing the period when these investments are mostcrucial—the first three years of life. Losses inbrain development from undernutrition,micronutrient deficiencies, illness, and lack ofcognitive stimulation in this period are irre-versible. Investments supported by conditionalcash transfers in early child development arethe most highly leveraged investments coun-tries can make toward MDG progress.73 Theyaffect nutrition, infant and child mortality, andsubsequent performance in primary school.
The evidence from Latin America is robustthat conditional cash transfer programsincrease clients’ use of education, health, andnutrition services. Some researchers also pointto empowerment effects on poor clients, whogain a sense of legitimacy in approaching pub-lic services because the transfers rest on anexplicit expectation that they should use suchservices. A major question in adapting suchtransfers to other countries is how efficient theyare in settings where service quality is poor.Conditional transfers cannot fix the supply sideof service delivery. But where supply is ade-quate, they are an effective tool for stimulatingdemand among target vulnerable groups.
Quick Wins Are Not Enough
Many developing countries must promoteMDG progress as rapidly and cost-effectivelyas they can over the coming years. There isunderstandable interest in interventions thatproduce results quickly—such as insecticide-treated bednets and the elimination of schoolfees. But there are some important cautions.First, even “quick” interventions require sys-tem capacity to deliver, and it is crucial thatcapacity be built in efficient and sustainableways. In pursuit of faster progress, donorshave too often succumbed to the temptationto “parachute in” capacity or develop paral-lel delivery channels that may not be sustain-able over the long term. Even the quickest ofwins needs to be part of a long-term processof capacity building.
Deworming pills, for example, work veryquickly, but it has taken four years—afterfunding became available—to get dewormingmainstreamed across primary schools inGuinea and Senegal. Water and sanitationaccess for clinics and schools can bring vitalgains in their effectiveness, but while the phys-ical access may be relatively easy to achieve,the capacity to operate and maintain the hard-ware is not: Witness the large number of non-functioning school toilets in developingcountries. “Quick wins” are not necessarilyquick or easy to implement at scale. And evenharder and longer-term is building the capac-ity and systems to sustain them.
Second, some powerful and cost-effectiveinterventions may have longer-term impacts,such as conditional cash transfers that stimu-late early child nutrition and health care, orthe building of a new medical school. The keyfor any country is to prioritize investmentsthat will have the highest overall returns in itscontext. This needs to emerge from a carefuldiagnosis of the national context, through thepoverty reduction strategy process, supportedby sound sector planning, costing, and iden-tification of binding constraints.
Still, the “quick wins” recommended by theMillennium Project offer a useful menu forcountries to consider. Most of the recommended
S C A L I N G U P S E R V I C E D E L I V E R Y
G L O B A L M O N I T O R I N G R E P O R T 2 0 0 5 111

interventions are backed by robust microlevelresearch. Some will be relevant in a numberof different country contexts.
But they will not be enough. Quick winsare no substitute for context-specific identifi-cation of priorities. Nor do they constitutethe full range of high-return investments in agiven context, some of which are inherentlylonger term. Finally, even where they areadopted as relevant strategies, they do notsolve the biggest challenge: building capacityfor effective, large-scale implementation.
Priorities for Global ActionFor many countries, especially in Sub-Saha-ran Africa, the MDGs will not be met with-out unprecedented expansion of health andeducation service delivery. The private sectorwill play an important role, particularly inhealth, but most incremental funding will bechanneled through the public sector—and inmany countries deep changes in public sectorfunctioning are needed for funding to pro-duce results. The challenge is great, but prag-matic strategies are being shown to work.
As discussed elsewhere in this report, the pri-orities for public action in education, health,water supply, and sanitation must be deter-mined in the context of a country-ownedpoverty reduction strategy that is at the centerof national planning and budgeting processes. Ifthe MDGs are to be reached, poverty reductionstrategies must include well-costed, coherentsector strategies aimed at these goals—whichhas not always been the case. Individual inter-ventions—such as “quick wins”—need to beevaluated in this country-specific framework.To cope with uncertainties in aid levels, coun-tries can draw on sector plans to prepare two orthree alternative “stretch” scenarios that can beimplemented if additional funding is available.
Special actions are needed in the three crit-ical areas analyzed in this chapter: scaling upskilled providers in health and education,ensuring the sustained financing required toexpand these recurrent cost intensive services,and making sure that money produces effec-tive service delivery and results.
Scaling Up Skilled Providers
Expanding education and health services onthe scale needed to achieve the MDGs willrequire major increases in teachers, doctors,nurses, and community health workers, espe-cially in Sub-Saharan Africa. Human resourceshortages are likely to be a binding constrainton system expansion, especially in health,unless countries adapt policies and increaseprovider productivity. Strategies that are prov-ing effective include:
• Pragmatic adjustments to recruitment stan-dards, to increase production of alternativeteachers and community health workers.
• Careful deployment and management ofproviders, to avoid underutilization.
• Effective use of incentives to make publicsector positions attractive, especially inrural areas.
• Selective salary adjustments for the high-est-skilled workers (such as doctors) in thepublic sector, to diminish migration.
• Cost-effective investments in medical, nurs-ing, and teacher training capacity, to com-plement the shorter-term strategies above.
Donors have an important role to play inaddressing the crisis in human resources forhealth in many developing countries. Healthsector wage adjustments in OECD countriescould attract more of their own nationals intoservice. Developed countries that benefit fromAfrican-trained medical personnel could helpfinance expanded training facilities in thosecountries and assist them in recouping med-ical students’ loans. A donor working grouphas begun to develop proposals in this area,which should get priority attention.
Mobilizing Sustained Recurrent Cost Financing
To achieve the MDGs, many developing coun-tries will need to allocate more of their ownfiscal resources to education and health. Foreducation, 20 percent of the recurrent budgetis the benchmark under the Fast Track Initia-
C H A P T E R 3
112 G L O B A L M O N I T O R I N G R E P O R T 2 0 0 5

tive, while Sub-Saharan African countries, forexample, currently average 15 percent. Forhealth, African governments have set a targetof 15 percent of the recurrent budget, wellabove their current average of 8 percent.
But every MDG analysis has concluded thatcountries’ own efforts will not be enough, anda large increase in external financing is required.Equally or more important for the humandevelopment MDGs are deep changes in thenature of donor support. A significant share ofbilateral assistance falls outside national plan-ning and budgeting processes. Transaction costsseverely strain recipient countries’ limitedadministrative capacity. And there is a near-complete disconnect between the type of expen-diture needed to scale up service delivery ineducation and health—recurrent, local, largelypersonnel costs—and what bilateral donors areactually providing—short-term, in-kind, andlargely technical assistance financing.
Most MDG cost estimates have focused oncountries’ core financing requirements, butmost aid today—bilateral and multilateral—cannot be flexibly used for these. Support forcapacity building is important, but it must becosted over and above the core requirements.Technical assistance should also be carriedout in new ways, to eliminate the all too com-mon pattern of uncoordinated and overlap-ping studies, training, and technical advisersbeing provided to the same country by differ-ent donors.
The MDGs will not be achieved unless alldevelopment partners rethink the way theydo business. Specific priority actions include:
• Aligning aid with PRS priorities. All aidshould support priorities identified in thepoverty reduction strategy and endorsedsector plans—nothing should be “offplan.” In countries meeting public expen-diture management standards, all aidshould flow through national budget andprocurement systems.
• Limiting the number of recipient coun-tries. A twofold strategy of narrowing thenumber of countries of bilateral interestand channeling future increases in ODA
largely through multilateral channels andcoordinated global efforts would lowertransaction costs and contribute to MDGprogress.
• Harmonizing assistance. At the recent ParisForum, donors committed to specific har-monization indicators, with progress to bemonitored by the OECD’s DevelopmentAssistance Committee. But the EFA FTI,which involves both country-level coordi-nation groups and regular global meetingsto monitor progress, and the High LevelForum in Health and country level coordi-nation groups offer ready-made channelsfor disseminating the indicators and work-ing within the respective sectors towardbetter harmonization and alignment.
• Creating a stable funding framework forthe Fast Track Initiative. To strengthen theFast Track Initiative, its partners shouldmake a monitorable, public commitmentto sustained funding for primary educa-tion. The target should be a significantannual increase from each partner’s 2005base, which the initiative’s secretariatshould monitor. This kind of predictablefunding framework is essential to signal toactual and potential recipient countriesthat the initiative has sustained financialbacking. Each partner’s annual fundingcommitment should help fill agreed financ-ing gaps for endorsed countries where theyhave a bilateral presence or interest; anyresidual should be allocated to the FTICatalytic Fund. Donors should also showthat expanded support for primary educa-tion is not coming at the expense of fund-ing for other levels of education, especiallysecondary education.
• Supporting increased funding for health.Additional external resources are needed toprevent and treat childhood diseases andmaternal conditions, sustain HIV/AIDStreatment, and make progress againstmalaria and tuberculosis. Increased donorfunding must be longer-term and more pre-dictable, aligned with country priorities,and increasingly made available throughbudget support.
S C A L I N G U P S E R V I C E D E L I V E R Y
G L O B A L M O N I T O R I N G R E P O R T 2 0 0 5 113

• Aligning global health initiatives withnational policies and priorities. The globalhealth community urgently needs to exam-ine all options for ensuring that global pro-grams organized around specific healthpriorities do not undermine the coherenceof countries’ health strategies, the balancedallocation of resources, and the strengthen-ing of health systems. Scenarios should pre-serve the mandates these programscurrently have for resource mobilization,awareness raising, results monitoring, andfinancing of global public goods withrespect to individual disease priorities. Butthese functions must be much better coor-dinated at the global level, to achievegreater convergence of policies and strate-gies, and especially at the country level,with harmonized procurement, disburse-ment, and reporting.
Each country should have a country-ledhealth sector working group involving alldevelopment partners—including thenational HIV/AIDS coordinator and a rep-resentative from the education sector—tocoordinate school health and preventionprograms. This group should agree on theoverall sector strategy and medium-terminvestment plan for health, and on keyoutcome and intermediate indicators to bemonitored annually. The most efficientstrategy is to create a single pooled fund toprovide budget support linked to imple-mentation of the agreed sector program.Within such a framework, global pro-grams could pursue the same objectives—but without the high transaction costs ofseparate programming missions and pro-curement and reporting requirements.
The High Level Forum for the HealthMDGs, established in 2003, offers a plat-form for this collaborative “rethink” ofthe current global architecture in healthand for the development of common prin-ciples and standards of good practice forthe engagement of global health partner-ships at the country level.
• Aiding countries to absorb more aid effec-tively. The IMF should continue to take a
public, proactive stance in helping govern-ments increase absorption of externalgrants linked to the MDGs. IMF policy isthat program ceilings should be flexible inaccommodating such additional spendingwhen grant financing is available. The IMFshould help country authorities work withdevelopment partners and civil societygroups to clarify how fiscal and wage billceilings are derived, and provide reassur-ance that program ceilings are in fact flex-ibly accommodating spending supportedby grants. Staff reports should also explic-itly discuss how IMF-supported programshave addressed key macroeconomic issuesthat affect MDG progress.
Translating Resources into Service Delivery and Results
Achievement of the MDGs is in the hands ofdeveloping countries. Increased aid—espe-cially in the form of flexible budget support—is unlikely to materialize unless countriesdemonstrate both sound public expendituremanagement and MDG results. The firstrequires systems for budget formulation, allo-cation, and reporting that meet thresholdstandards of integrity and efficiency. In manyof the countries in greatest need of externalrecurrent cost support, these systems are tooweak to give donors confidence thatresources can be tracked and used well.Donors are giving high priority to capacitybuilding in this area, but the deepest con-straints to country progress are political.
The second requires the capacity for real-time data on MDG progress. Countriesneed to be able to track the primary com-pletion rate and use regular household sur-veys and sentinel monitoring to generatedata on child and maternal mortality andmajor communicable diseases. Data mustbe disaggregated by gender, region, andincome to ensure that MDG progress isreaching vulnerable groups. Because out-come indicators improve relatively slowly,intermediate indicators of progress are alsoimportant—above all, measures of system
C H A P T E R 3
114 G L O B A L M O N I T O R I N G R E P O R T 2 0 0 5

efficiency, such as those for educationdeveloped by the Fast Track Initiative. Asimilar framework is being developed by adonor consortium in health (Health MetricsNetwork). These new approaches will workto the advantage of countries demonstratingimproved performance.
Progress will also require a better evi-dence base for policy, built on rigorousimpact evaluation of key programs. Pro-grams should be rolled out in ways that per-mit the use of control groups. Countriesshould develop local capacity for carryingout quality evaluations and using results.But knowledge on how interventions playout under different country circumstances isa global public good—and the costs of gen-erating it need to be broadly shared by theinternational development community. TheWorld Bank has an important role to play,through the Development Impact Evalua-tion initiative, in organizing more—andmore systematic—evaluation of innovativeprograms across countries, supportingmetastudies in key areas, ensuring broad dif-fusion and use of results, and supportingcountry-level capacity building.
Ultimately, strengthening service deliveryrequires action to improve core accountabil-ity relationships: the responsiveness of gov-ernments to citizen demands through thepolitical process, the responsiveness of ser-vice providers to clients, and the effective-ness of government agencies in turningresources into results. These weaknesses arethe deepest threat to MDG progress. Thereare no panaceas. But countries are makingprogress in improving governance. Sectormanagement can be helped by clear fundingnorms, competency-based recruitment,results focus, attention to cost-effective stan-dards, and strategies to make effective use ofthe private sector. Above all, governmentscan strengthen the voice of clients at thepoint of service delivery—through thepower of information, direct involvement inschool and health facility monitoring andmanagement, and the use of conditionalcash transfers.
Notes1. Hoddinott, Haddad, and Alderman (1997).2. UN Research Institute for Social Develop-
ment (2005).3. Clemens (2004) 4. Black (2003).5. Wagstaff and Claeson (2004).6. UNAIDS (2004b).7. WHO (2002).8. Lanjouw and Ravallion (1999).9. Joint Learning Initiative (2004).
10. Joint Learning Initiative (2004).11. Anand and Barnighausen (2004).12. Rivkin, Hanushek, and Kain (2005). 13. World Bank (2004b).14. Gertler and Barber (forthcoming).15. Joint Learning Initiative (2004).16. Dugger (2004).17. Dovlo and Martineau (2004).18. Bang and others (1999), cited in World
Bank (2004a). 19. Lehmann, Friedman, and Sanders (2004).20. Lehmann, Friedman, and Sanders (2004).21. Ethiopia Federal Ministry of Health (2004).22. Stekelenburg, Kyanamina, and Wolffers
(2003).23. WHO (2004).24. World Bank (2005a).25. Mingat (2003).26. Jalan and Glinskaya (2004).27. Vegas and De Laat (2004).28. Crouch and Fasih (2004); UNESCO
(2004).29. Dovlo and Martineau (2004); Joint Learn-
ing Initiative (2004); Vujicic and others (2004);Buchan, Parkin, and Sochalski (2003).
30. Dovlo and Martineau (2004).31. Dovlo and Martineau (2004).32. Joint Learning Initiative (2004); Stilwell
and others (2003).33. Wibulpolprasert and Pengpaibon (2003).34. Vujicic and Sagoe (2004).35. Wibulpolprasert and Pengpaibon (2003).36. Vujicic and Sagoe (2004).37. UNDP (2002), cited in World Bank (2005a,
p. 98).38. Bennell (2005).39. Grant, Gorgens, and Kinghorn (2004);
Grassly and others (2003).40. Joint Learning Initiative (2004)41. Zambia Ministry of Health (2004); Vujicic
and Sagoe (2004); Joint Learning Initiative (2004).
S C A L I N G U P S E R V I C E D E L I V E R Y
G L O B A L M O N I T O R I N G R E P O R T 2 0 0 5 115

42. Wagstaff and Claeson (2004).43. Duflo, Kremer, and Dupas (2004).44. Hinchliffe (2004).45. Bruns, Mingat, and Rakotomalala (2003);
Colclough and Lewin (1993); Wagstaff and Clae-son (2004).
46. Bulir and Hamann (2003); Bruns, Mingat,and Rakotomalala (2003).
47. Gottret and Schieber (forthcoming).48. Haacker (2004, p. 63); IMF (2004).49. Foster (2004).50. Foster (2004).51. Data are from the IMF’s Africa desk. 52. FTI Secretariat (2005).53. World Bank (2005b).54. World Bank (2005b, p. 38).55. Reinikka and Svensson (2003).56. Bjorkman (2005).
57. UNMP (2005c, p. 49).58. Bennett (2001).59. WHO (2004).60. Mingat (2004).61. Chaudhury and Hammer (2004).62. Rodd (2004).63. Chaudhury and others (2005).64. Vujicic and Sagoe (2004).65. Fiszbein (2005).66. Galiani, Gertler, and Schargrodsky (2005).67. La Forgia, Mintz, and Cerezo (2004), cited
in Fiszbein (2005).68. World Bank (2005c).69. Chaudhury and others (2005).70. Vegas and Umansky (2004).71. Fiszbein (2005).72. Rawlings and Rubio (2005).73. Carneiro and Heckman (2003).
C H A P T E R 3
116 G L O B A L M O N I T O R I N G R E P O R T 2 0 0 5

Removing barriers to trade that discrim-inate against developing countries ispotentially a powerful tool to help
achieve the Millennium Development Goals(MDGs). Multilateral, reciprocal, nondis-criminatory trade liberalization offers the bestapproach for supporting development. Rapidconclusion of an ambitious Doha Round istherefore of great importance. As noted inGlobal Monitoring Report 2004, the roundshould spawn a major reduction in trade-distorting policies. Ambitious reference pointscould be helpful in guiding the negotiations,such as capping the agricultural tariffs ofdeveloped countries at 10 percent, eliminatingtheir agricultural export subsidies and manu-facturing tariffs, fully decoupling domesticagricultural and rural support policies fromproduction, and pursuing meaningful liberal-ization of trade and investment in services,including through temporary migration of ser-vice providers. Equally important, developingcountries need to set ambitious targets to fur-ther reduce the average level and dispersion ofprotection and substantially expand theirWorld Trade Organization (WTO) commit-ments. To assist in attaining the MDGs, suchactions should be fully implemented by 2015,with significant progress before 2010.
A surge in ambition is needed to realize thepromise of the Doha Development Agenda.The ambition must focus on transforming
agricultural trade policies in OECD countries,devoting greater attention to reducing thetrade-restricting effects of nontariff measures,and safeguarding and expanding the scope fordeveloping countries to contest services mar-kets. Given that trade restrictions are muchhigher in developing than developed countries,significant further liberalization by developingcountries will also be required to realize thefull potential of trade for development. Indeed,about half of the potential developing countrygains from merchandise trade reform willcome from reforms by developing economies.
An ambitious Doha Round would benefitthe world as a whole and developing countriesas a group. But it would not be a panacea, andit would not be costless. Trade is a key driverof growth, but it needs to be complemented bymany other policies. In many developingcountries “behind-the-border” policies andthe investment climate are binding constraintson the ability to realize the benefits fromgreater trade opportunities. All countries willincur adjustment costs from deep tradereforms, and some developing countries willconfront erosion of current tariff preferences.Such changes should be considered within thebroader context of development and povertyreduction strategies, with special attention tothe concerns of poor households. The stan-dard argument for trade liberalization is thattotal gains exceed total losses—especially over
G L O B A L M O N I T O R I N G R E P O R T 2 0 0 5 117
Realizing the DevelopmentPromise of Trade
4

time—and that gainers can compensate loserswhile still improving their welfare. But in prac-tice such compensation does not occur. Anambitious Doha Round would generate sub-stantial gains, providing a basis for transferringadditional resources to low-income countriesto enhance trade capacity. Given that lack ofcompetitiveness due to high operating costsand weak investment climates is the primaryfactor limiting trade potential in many poorcountries, actions to lower such costs areurgently needed, especially in Africa. Theagenda includes supporting trade logistics andfacilitation, strengthening transport infrastruc-ture, and further reforming policies that createantiexport bias—including import tariffs.
An ambitious Doha outcome—significantliberalization commitments by both developedand developing countries—complemented bya credible commitment to convert part of theresulting gains into increased aid to the poor-est countries to enhance their trade capacity—would send a strong signal that political willexists to leverage trade to help achieve theMDGs. This would help countries that havethe capacity to export but are now constrained(such as middle-income agricultural exporters)as well as countries that have much less capac-ity and are unlikely to benefit much from thestandard reciprocal exchange of market accesscommitments in the WTO.
Recent policy in OECD countries hasemphasized tariff preferences for small, low-income countries, especially the least devel-oped countries (LDCs) and Sub-SaharanAfrican countries. While actions to make tar-iff preferences more effective in the short runcould be beneficial—for example, throughadoption of common, liberal rules of origin—consideration should be given to alternativeforms of trade assistance that generate greaterbenefits for recipients and are less trade-dis-torting. Tariff preferences have been of lim-ited value to many African countries and havenegative effects on the functioning of theglobal trading system. Alternative measuresinclude sharp reductions in most favorednation (MFN) tariffs and other barriers byhigh- and middle-income countries on goods
and services of export interest to low-incomecountries, financial assistance, and actions tominimize the incidence of nontariff measureson exports from low-income countries.
“Aid for trade”—assistance to bolstertrade capacity and reduce trade costs—canhave high returns in terms of increasinggrowth, reducing poverty, and facilitating therealization of ambitious global trade reforms.The share of aid for trade in total aid com-mitments increased from 3.6 percent in 2002to 4.2 percent in 2003.1 A concerted effort tofurther expand such assistance could domuch to improve developing countries’capacity to benefit from both global anddomestic reforms. Numerous trade integra-tion studies undertaken for the LDCs underthe Integrated Framework for Trade-RelatedTechnical Assistance, as well as similar analy-ses done in other developing countries, haveidentified areas where such aid can be usedeffectively. The Integrated Framework, a col-laborative venture between six multilateralagencies, bilateral donors, and governmentsof LDCs, offers a mechanism to identify pri-orities and allocate additional assistance totrade-related investments and policy reforms.To date, dedicated resources to supportimplementation of the framework have beenlimited to small-scale technical assistance.Funding for trade priorities is considered inthe context of the resource allocation andprioritization process related to countrydevelopment strategies—poverty reductionstrategies (PRSs) or equivalent national devel-opment strategies—with donor assistancecomplemented by loans and other supportfrom international financial institutions.While this should continue to be the case, theIntegrated Framework could be used moreextensively to both bolster the trade capacityof poor countries and help address the adjust-ment costs from an ambitious Doha Round.
Regional cooperation is another potentiallypowerful instrument to leverage trade fordevelopment—as long as it does not detractfrom the pursuit of an ambitious Doha Roundand focuses policy attention on domestic(intraregional) policy-related trade constraints.
C H A P T E R 4
118 G L O B A L M O N I T O R I N G R E P O R T 2 0 0 5

In Sub-Saharan Africa there is a strong regionaldimension to growth, absorptive capacity, andthe widening of economies of scale needed tolower infrastructure costs and facilitate trade.To fully realize the development promise ofboth North-South and South-South regionalintegration arrangements, developing countrymembers of trade agreements should imple-ment significant liberalization on a nondis-criminatory basis in addition to grantingpreferential access to partner countries. ManySub-Saharan countries still rely on importduties for a significant portion of governmentreceipts, so revenue concerns and the ability toput in place alternative revenue sources are fac-tors that need to be taken into account in deter-mining the speed of liberalization.
Trade Performance of Low-Income and LeastDeveloped CountriesThe past two decades saw a boom in worldtrade. Non-oil exports from developing coun-tries grew faster than those from developedcountries (table 4.1), and their global marketshare rose from 21 percent in 1980 to 37 per-cent in 2003 (table 4.2). This increase reflectsthe growing openness of developing countriesto trade and the competitiveness of theirexports in global markets. Openness ratios (thesum of exports and imports as a share of GDP)have increased for most developing regions andrange from a low of 25 percent in South Asia to64 percent in Europe and Central Asia.
The foreign exchange earnings of the poorestcountries depend on agricultural commoditiesand labor-intensive manufactures. Although itsaverage annual export growth has increasedsince the mid-1990s, Sub-Saharan Africa’s shareof world trade remains far below what prevailedin the 1970s (see table 4.2). Reasons include theregion’s high dependence on agriculture, limitedtrade opportunities caused by highly distortingpolicies in OECD countries, and downwardglobal price trends for some commodities (suchas coffee) due to expanding supplies.
Problems on the supply side of the marketalso help explain the below-average trade and
foreign direct investment performance ofmany low-income countries. Civil conflictshave undermined economic performance in ascore of African countries, and in others poormacroeconomic policies have often led toprice disadvantages as a result of overvaluedcurrencies.2 Moreover, governance problems,corruption, and institutional weaknesseshave worsened the local investment climateand inhibited local entrepreneurs from takingadvantage of market opportunities. Those
R E A L I Z I N G T H E D E V E L O P M E N T P R O M I S E O F T R A D E
G L O B A L M O N I T O R I N G R E P O R T 2 0 0 5 119
TABLE 4.1 Trade has grown rapidly in recent years, especially in developing countries (average annual growth rate, percent)
Country group 1991–95 1996–2000 2001–03
Exports
World 8.7 4.8 5.8Developing countries 12.2 7.7 7.4
Least developed countries 3.8 10.1 8.4African least developed countries 0.1 7.3 10.2Low-income countries 8.7 9.6 8.1African low-income countries 2.8 12.6 4.2
Imports
World 8.1 5.2 6.0Developing countries 13.3 5.3 8.1
Least developed countries 5.8 3.3 12.0African least developed countries 3.1 1.9 13.3Low-income countries 9.2 4.4 12.8African low-income countries 5.2 0.9 16.1
Source: IMF, Direction of Trade Statistics.
TABLE 4.2 Developing countries account for a growing share of non-oil exports (percentage of total)
Country group 1975 1980 1990 1995 2000 2003
Developed countries 80.3 78.9 76.5 70.6 65.1 62.6Developing countries 19.7 21.1 23.5 29.4 34.9 37.4
Least developed countries 0.8 0.6 0.6 0.4 0.5 0.6African least developed countries 0.6 0.4 0.4 0.2 0.3 0.3
Low-income countries 3.1 1.7 2.0 1.9 2.3 2.5African low-income countries 2.1 0.8 1.0 0.7 0.9 0.9
Source: IMF, Direction of Trade Statistics.

heavily dependent on oil exports.4 This isalmost twice the figure for East and South Asia,and 50 percent higher than in Latin America.Agricultural products account for at least aquarter of exports from Sub-Saharan Africaand Latin America. As a result countries inboth regions are subject to greater commodityprice (terms of trade) volatility. The decline innonfuel commodity prices and the increase inenergy prices since 1995 have contributed to adecline in the shares of food and raw materialsand an increase in the share of fuels in exportsfrom the LDCs (figure 4.1). Expanding apparelexports from Africa are a noteworthy develop-ment of recent years. While reliable data on thecomposition of exports for 2003 are not yetavailable, the sharp increase in fuel prices dur-ing 2003–4 will likely further increase the shareof fuels in LDC exports.
Recent Developments in Trade Policy Global trade policy developments in 2004 pro-vide a mixed picture. After a disappointing out-come at the WTO ministerial conference in
Cancun, Mexico, in September 2003,there was considerable gloom aboutthe prospects of the multilateral trad-ing system. But in 2004 WTO negoti-ations came back on track, with apackage of agreements reached inAugust. The WTO agreed on a frame-work for negotiations on agricultureand industrial products, a set of rec-ommendations on services, andmodalities for negotiating improvedcustoms procedures. Other positivedevelopments included proposals forreforming EU sugar and bananaregimes, and an end—after some 40years—to the regime of managedtrade in textiles and clothing.
The proliferation of reciprocalpreferential trade arrangements con-tinued in 2004, with activity spreadacross all regions and countries. Since1990 the number of preferentialtrade arrangements in force and noti-
C H A P T E R 4
120 G L O B A L M O N I T O R I N G R E P O R T 2 0 0 5
3525201550
Fuel
Share in total exports, percent10 30
Clothing
Food
Raw materials
Other semi-manufactures
Textiles
Other
2002 1995
FIGURE 4.1 LDC Exports: Less food and raw materials, more energy and apparel
Source: WTO (2004).
same factors have also induced instability incommodity prices and had adverse effects onthe demand for commodity exports.
Since the mid-1990s exports from low-income countries and the LDCs have grownfaster than the average for the world and fordeveloping countries (see table 4.1). Thislargely reflects an increase in commodity pricesand more recently the decline in the U.S. dollar,as well as an increase in exports of manufac-tures (textiles). These developments con-tributed to a minor recovery in these countries’world market shares, though these remainbelow those of the 1970s (see table 4.2). Globalexport shares for low-income African countriesand for the LDCs as a group exceed their sharesin world GDP.3 Average import growth rateshave also picked up recently for low-incomecountries and the LDCs, outpacing growth inimports for the world and for developing coun-tries during 2001–3.
Exports from the poorest countries remainconcentrated in primary commodities. In 2001the concentration index of Sub-SaharanAfrica’s exports was 0.47—similar to that ofthe Middle East and North Africa, a region

fied to the WTO has risen from 50 to nearly230,5 and another 60 are being negotiated.But there is growing concern that sucharrangements create trade diversion and sub-stantial administrative costs due to compli-cated rules of origin. Although many of thecountries most active on this front are strongproponents of the Doha Round and considerthe agreements a form of “competitive liber-alization” that reinforces WTO-based liberal-ization efforts, preferential trade may createinterests opposed to multilateral extension ofmarket access opening and divert scarce nego-tiating resources. Moreover, while the agree-ments can help developing countries byreinforcing internal reforms and loweringtrade costs, such benefits do not require pref-erential access to markets. As discussed laterin this chapter, minimizing discrimination andfocusing attention on cooperation to lowerregulatory trade barriers is an important chal-lenge from a development perspective.
The recent accession of 10 new members tothe European Union consolidated the extensivenetwork of intra-European trade agreementsand expanded the EU internal market. TheEuropean Union is also pursuing associationagreements with Common Market for theSouthern Core (Mercosur) and Mediterraneancountries, and is negotiating reciprocal economicpartnership agreements with regional subsets ofAfrican, Caribbean, and Pacific (ACP) countries.
Over the past year the United States has alsobeen active in concluding preferential tradeagreements, including with Australia, Bahrain,Central America, the Dominican Republic,and Morocco. Several more are under negoti-ation. In Latin America, Mercosur signed anagreement with Andean countries and is nego-tiating with India, Mexico, and South Africa(in addition to the European Union). Mexicohas entered into a trade agreement with Japanand is negotiating one with Singapore. Simi-larly, a South Asia free trade area is being nego-tiated between seven countries, and in Africathe customs union of the East African Com-munity has been launched. The Association ofSouth-East Asian Nations (ASEAN) hasagreed to negotiate preferential agreements
with China, India, and Japan, among others.Japan, the Republic of Korea, Singapore,South Africa, and Thailand have also beennegotiating bilateral accords.6 The risingregional activity in East Asia is particularlynoteworthy given these countries’ historicalnoninvolvement in preferential trade andreliance on the multilateral trading system. Anincreasing number of developing countries areseeking membership in regional agreements.
Developments also occurred for nonrecipro-cal preferences. The European Commissionintroduced a new Generalized System of Pref-erences scheme offering duty-free access to theEU market for 80 percent of dutiable tariff linesto countries that adhere to a number of inter-national conventions on human rights, labor,the environment, and governance. The newscheme enters into force in April 2005 and pro-vides for better product coverage, more relaxedrules of origin, and greater certainty and pre-dictability in the granting of preferences. In theUnited States the passage of the AfricanGrowth and Opportunity Acceleration (AGOAIII) Act extended the general timeframe forAGOA preferences until 2015. It also extendedthe third-country fabric manufacturing provi-sion for least developed AGOA beneficiarycountries until 2007—an important provisionsince few AGOA beneficiary countries haveadequate capacity to manufacture fabric. Thelegislation provides temporary respite to textileand clothing sectors in several Sub-Saharancountries (including Lesotho, Madagascar, andSwaziland) as competitive pressures intensifyfollowing the elimination of all quantitativeexport restraints in January 2005.
Tariffs, Nontariff Measures, and Contingent Protection
In recent years there has been a decline in tariffbarriers worldwide, reflecting autonomousreform, regional agreements, and WTO acces-sion (including by Cambodia, China, Egypt,India, Iran, Pakistan, Tunisia, and Zimbabwe).Globally, average tariffs fell by 2 percentagepoints between 1997 and 2000 and by 1 pointbetween 2000 and 2003. As measured by MFN
R E A L I Z I N G T H E D E V E L O P M E N T P R O M I S E O F T R A D E
G L O B A L M O N I T O R I N G R E P O R T 2 0 0 5 121

tariffs, South Asia is the most restrictive region,followed by Sub-Saharan Africa (table 4.3).
By contrast, there has been no decline in non-tariff measures affecting trade, such as licensingrequirements and antidumping investigations.(Licensing requirements are often associatedwith health- and safety-related regulatory
C H A P T E R 4
122 G L O B A L M O N I T O R I N G R E P O R T 2 0 0 5
TABLE 4.3 Applied most favored nation tariffs are highest in SouthAsia and Sub-Saharan Africa (simple average, percent)
Region/income group Late 1980s 2004 (preliminary)
East Asia and Pacific 18.8 9.6Europe and Central Asia 10.2 7.3Latin America and the Caribbean 22.4 10.4Middle East and North Africa 17.3 12.4South Asia 68.9 17.7Sub-Saharan Africa 25.1 15.3High-income OECD 7.0 4.1High-income non-OECD 9.0 6.6Developing countries 25.4 11.7
Least developed countries 28.4 15.1Low-income countries 31.7 12.9Middle-income countries 21.8 10.5
Sources: UNCTAD TRAINS database; World Bank, World Development Indicators; IMF Trade Policy Information Database; WTO Trade Policy Reviews.Note: Classification of regions and income groups based on World Bank 2004b.
TABLE 4.4 Nontariff measures remain high in several regions, 2002(percent)
Frequency ratio Coverage ratioRegion/income group (share of tariff lines) (share of imports)
East Asia and Pacific 44.0 32.8Europe and Central Asia 14.6 23.9Latin America and the Caribbean 26.9 44.4Middle East and North Africa 49.5 51.6South Asia 12.1 28.6Sub-Saharan Africa 24.4 28.8High-income OECD 22.0 24.1High-income non-OECD 45.1 46.9Developing countries 27.2 34.3
Least developed countries 20.0 36.7Low-income countries 25.5 36.4Middle-income countries 28.3 34.0
Sources: UNCTAD TRAINS database; WTO Trade Policy Reviews; EU Product Standards Data-base; Groupe d’Economie Mondiale, Institut d’Etudes Politiques.Note: Classification of regions and income groups based on World Bank 2004b. Nontariffmeasures include price controls, quantity restrictions, state trading monopolies, and techni-cal product regulations as classified in the UNCTAD TRAINS database.
requirements that apply in principle to bothimports and domestic products; see below.)Nontariff measures apply to a large share oftrade, with the highest ratios in developing coun-tries (table 4.4). But as discussed below, whenconverted to ad valorem equivalents, nontariffmeasures are more important in rich countries.
The use of instruments of contingent protection—antidumping and safeguardactions—against imports by WTO membershas grown steadily, with more than 2,400antidumping investigations launched since1995 (table 4.5). This instrument is increasinglybeing used by developing countries againstother developing countries. Indeed, developingcountries have overtaken developed countries inthe number of cases launched: between 2002and June 2004 developed countries initiated190 cases, compared with 441 by developingcountries. India has passed the United States asthe top initiator, and Argentina and SouthAfrica have an even higher incidence ofantidumping use relative to the value of theirimports (table 4.6).
Another important nontariff measureaffecting exports and imports are health- andsafety-related product standards. In contrastto antidumping efforts, which by definitionare intended to protect domestic import-competing industries, health and safety regu-lations (mandatory product standards) areoften applied equally to domestic and foreign(imported) products—so in principle they arenot (or should not be) intended to protectdomestic industries. Indeed, WTO rules pro-hibit the protectionist use of technical prod-uct regulations. As discussed below, suchnorms affect trade by increasing the costs ofentering a market, with the incidence of theassociated costs differing across countriesdepending on the composition of theirexports and the ease of satisfying (document-ing compliance with) a specific norm.
Textiles and Clothing, Bananas, and Sugar
A major trade policy change in 2004 was thephase-out of bilateral quotas on exports of tex-tiles and clothing at the end of the year, as

required by the Uruguay Round Agreement onTextiles and Clothing. Because the quotas werebilateral and not based on competitive consid-erations, their removal is likely to lead toexport declines and balance of paymentsswings for several countries. China and Indiaare expected to gain from this liberalization, asthey are considered the most competitive pro-ducers. But the actual effects will depend onmarket sourcing decisions by retailers and buy-ers, as well as the extent to which safeguardmeasures are invoked and U.S. quotas aremaintained under the provisions of China’sWTO membership. In January 2005 Chinaimposed a low MFN tax—ranging from 2–4percent—on its textiles and clothing exports, toremain in place through the end of 2007.7
Although this will attenuate the expected shiftin sourcing to Chinese producers, the elimina-tion of the quotas will still force significantadjustments in less efficient countries (box 4.1).
In July 2004 the European Union announcedthat it will substantially reduce its sugar pro-duction and exports over a four-year period.8
The cut in output is to be accompanied by areduction in domestic support prices of aboutone-third, implemented over a three-yearperiod. Import quotas from African, Caribbean,and Pacific countries and India will be main-tained at current levels. Farm support paymentswill be decoupled from production and linkedto environmental and food safety standards.While this reform will benefit EU consumersand competitive developing country suppliers, itwill reduce benefits from sugar production forseveral African, Caribbean, and Pacific coun-tries as the value of their quotas declines. TheEuropean Union has made provisions foradjustment assistance for such countries.
In October 2004 the European Unionannounced a proposal to change its importregime for bananas. Under a WTO-backedagreement with Ecuador and the United States,the Union is required to move away from itsquota-based system of controlling imports to atariff-only system by January 2006. Under theproposal the Union would levy a tariff of 230euros a ton on banana imports from non-African, Caribbean, and Pacific countries,
R E A L I Z I N G T H E D E V E L O P M E N T P R O M I S E O F T R A D E
G L O B A L M O N I T O R I N G R E P O R T 2 0 0 5 123
TABLE 4.5 Developing countries initiate more antidumpinginvestigations, 1995–2003
Target region
Developed Developing TransitionInitiating region countries countries economies Total
Developed countries 226 574 (129) 132 932Developing countries 453 827 (225) 173 1,453Transition economies 4 7 (2) 20 31Total 683 1,408 (356) 325 2,416
Share of total (percent)
Developed countries 24.2 61.6 (13.8) 14.2 100.0Developing countries 31.2 56.9 (15.5) 11.9 100.0Transition economies 12.9 22.6 (6.5) 64.5 100.0Total/average 28.3 58.3 (14.7) 13.5 100.0
Source: WTO Antidumping Committee data.Note: Numbers in parentheses are actions against China. Developed countries are Australia,Canada, EU15, Iceland, Japan, New Zealand, Norway, Switzerland, and United States. Transi-tion economies are Albania, Armenia, Azerbaijan, Belarus, Bosnia and Herzegovina, Bulgaria,Croatia, Czech Republic, Estonia, FYR Macedonia, Georgia, Hungary, Kazakhstan, KyrgyzRepublic, Latvia, Lithuania, Moldova, Poland, Romania, Russian Federation, Slovak Republic,Slovenia, Tajikistan, Turkmenistan, Ukraine, Uzbekistan, and Yugoslavia.
TABLE 4.6 A few large developing countries have launched the mostantidumping investigations, 1995–2003
Index of initiationsInitiating Number Share of total per US$ of importscountry/region of cases (percent) (United States = 100)
India 379 15.7 2,416United States 329 13.6 100European Union (15) 274 11.3 101Argentina 180 7.5 2,577South Africa 166 6.9 2,634Australia 163 6.7 719Canada 122 5.0 170Brazil 109 4.5 590Mexico 73 3.0 155China 72 3.0 109
Sources: WTO Antidumping Committee data; IMF, Direction of Trade Statistics.
which it argues is equivalent to the level of pro-tection now in place. This move has disap-pointed producers in several Latin Americancountries, who are concerned that such a hightariff will make them unable to compete in theEU market, as well as producers in African,Caribbean, and Pacific countries, who fear thatthe proposed tariff is not high enough to main-tain their existing market shares.

C H A P T E R 4
124 G L O B A L M O N I T O R I N G R E P O R T 2 0 0 5
The Agreement on Textiles and Clothing, agreed to as part of the Uruguay Round, was designed toprogressively phase out quotas that limited developing countries’ opportunities to export textilesand clothing. Quotas were to be gradually abolished, and the growth rates of export volumes sub-ject to quotas steadily increased, over a 10-year period ending on 1 January 2005. Importing coun-tries were allowed to choose which products to make quota free at three stages (1995, 1998, and2002) set out in the agreement. They chose products in which developing countries did not have acomparative advantage—or even face quotas. The acceleration of quota growth did succeed in mak-ing quotas nonbinding for some exporters, but for some dynamic exporters—particularly China—the quota growth rates of around 3 percent a year were much lower than their supply capacity. Asa result quotas became more restrictive.
Quota abolition will lower prices for consumers in markets that had restricted textile and cloth-ing imports. Prices in unrestricted markets can be expected to rise, absent the incentive for efficientexporters to divert products shut out of U.S. and EU markets into these markets. In addition, lesscompetitive suppliers—including small, low-income countries that became exporters of textiles andclothing in part because dynamic exporters were fettered by quotas—may be confronted with lowerprices for their products. The impacts on individual exporters will depend on the destination of theirexports. One way to identify countries that might lose from this change is to examine what per-centage of their exports comes from exports of textiles and clothing to restricted markets. The 18most vulnerable countries are those for whom exports of textiles and clothing to Canada, the Euro-pean Union, and the United States exceeded 35 percent of total exports in 2003 (see figure). Mostof these are small economies.
Francois and Spinanger (2004) estimate that for China the quotas had the same effect as a taxof about 25 percent on clothing exports to the European Union and United States. Most otherexporters faced much lower barriers. The adverse effect on the prices received by vulnerableexporters would be much smaller than 25 percent, partly because textiles and clothing are differ-
BOX 4.1 The varying effects of the Agreement on Textiles and Clothing
0
20
40
60
80
100Percent
Leso
tho
Haiti
Cam
bodia
Bangla
desh
Macao
Hondura
s
El Sa
lvador
Maurit
ius
Pakist
an
Sri La
nka
Maldive
s
Toke
lau
Lao P
DRCh
ad
Tunisi
a
Dominica
n Rep.
Nicara
gua
Nepal
Mongo
lia
Guatem
ala
Exports of textiles and clothing to Canada, the EU, and the United States as a share of total
Source: Manole (2004).

Restrictiveness and Incidence of Trade PoliciesAs noted in Global Monitoring Report 2004,the trade policy measures reviewed abovecannot be readily compared across countries.Such comparison is possible only on the basisof an index that measures the overall traderestrictiveness implied by trade policy. Themeasure used is the overall trade restrictive-ness index (OTRI), which represents the uni-form tariff equivalent of the different policyinstruments observed for a country thatwould generate the prevailing level of trade.When the focus is on measuring the tradeeffects of policies on an importing economy,the trade restrictiveness index can be definedas the equivalent uniform tariff that wouldkeep imports constant. When the focus is onan exporting country’s perspective (marketaccess), the index is the equivalent uniformtariff implied by the set of policies maintainedby each country (or all importers) on thateconomy’s export bundle. The OTRI is cal-culated as the weighted sum of nominal tar-
iffs and the ad valorem equivalent of nontar-iff measures at the tariff line level.9
The contribution of nontariff measures tothe overall level of trade restrictivenessincreases with GDP per capita (figure 4.2).One reason is that average tariffs in richcountries tend to be lower and are bound inthe WTO and through regional trade agree-ments. As a result protectionist pressures, ifsuccessful, will by necessity be reflected inother instruments—antidumping being amajor example. Most developing countrieshave tariff bindings (commitments) in theWTO that are well above their applied tariffs,and may not have bound tariffs at all, allow-ing for the use of tariffs when desired.
Trade Restrictiveness, Income, and Poverty
OTRIs are negatively correlated with GDPper capita—the higher is a country’s GDP percapita, the lower is its trade restrictiveness asmeasured by the OTRI (figure 4.3). Similarly,the higher is a country’s GDP per capita, the
R E A L I Z I N G T H E D E V E L O P M E N T P R O M I S E O F T R A D E
entiated products (exports from different countries are very different; see Martin, Manole, and vander Mensbrugghe 2004) and partly because prices in unrestricted markets can be expected to risefollowing abolition of the quotas.
Continuation of quotas against China is a possibility because of the safeguard provisionsincluded when China acceded to the WTO in 2001 (Bhattasali, Li, and Martin 2004). But theseapply only against China: if invoked, they would allow other efficient exporters to fill the gap. Asafeguard system—or an equivalent export tax on China’s exports—would create global costs ofaround $13 billion, while transferring some $3 billion to competing exporters (Manole 2004). Mostof this benefit would go to countries that are not heavily dependent on exports of textiles and cloth-ing to restricted markets.
Initial indications are that exports of many smaller countries dependent on textiles and clothingare holding up better than had been widely feared. This partly reflects reforms to raise productiv-ity in these countries and partly reflects China’s reluctance to expand its production of textiles andclothing, rather than more sophisticated products. In addition, as noted by Nordas (2004), stan-dard modeling results do not fully incorporate the special features of the supply chain—particularlythe advantages of proximity for geographically favored countries in a marketing environment ofjust-in-time ordering. Still, this initial assessment should not lead to complacency. Countries depen-dent on textile and clothing exports and their development partners need to focus on how thesecountries can raise their productivity and improve their trade policies and investment climates toencourage diversification away from dependence on a single sector.
G L O B A L M O N I T O R I N G R E P O R T 2 0 0 5 125

126 G L O B A L M O N I T O R I N G R E P O R T 2 0 0 5
4
–1.5–2
e(log of GDP per capita|X)
–0.5 0–1 0.5 1 1.5
3
2
1
–1
0
–2
–3
–4
e(log of OTRI home|X)
4
–1.5–2
e(log of GDP per capita|X)
–0.5 0–1 0.5 1
3
2
1
–1
0
–2
–3
–4
e(log of OTRI abroad|X)
ZWE
ZMB
ZAF
VNM
VEN
USA
URY
UKR
UGATZA
TURTUNTTOTHA
TCD
SVN
SENSDN
SAU
RWA
RUS
ROMPRY
POL
PNG
PHLPER
PAK
OMN
NZL
NPL
NOR
NICNGA
MYS
MWI
MUS
MOZMLI
MEX
MDG
MDA
MARLVA
LTULKA
LBN
LAO
KGZKEN
KAZ
JPN
JOR
ISL
INDIDN
HUN
HND
GTMGNQ
GHA
GAB
EUN
ETH
EST
EGY
ECU
DZACZE
CRICOL
CMRCIV
CHN
CHL
CHE
CAN
CAFBTN
BRN
BRA
BOLBLR
BHR
BGD
BFA
AUS
ARG
ALBZWE
ZMB
ZAF
VNM
VEN
USAURY
UKR
UGA TZA
TURTUN
TTO
THA
TCD
SVN
SLV
SENSDN
SAU
RWA
RUSROM
PRYPOL
PNGPHL
PER
PAK
OMN
NZL
NPL
NOR
NIC
NGA
MYS
MWI
MUS
MOZ
MLI
MEX
MDG
MDA MAR
LVALTU
LKA
LBN
LAOKGZ
KEN
KAZ
JPN
JOR
ISL
INDIDN
HUN
HND
GTM
GNQGHA
GAB
EUN
ETH
EST
EGY
ECU
DZA
CZECRICOL
CMR
CIV
CHN
CHL
CHECAN
CAF
BTN
BRN
BRA
BOLBLR
BHR
BGDBFA
AUS
ARG
ALB
FIGURE 4.3 Trade restrictiveness at home and abroad falls as countries become richer
1.2
54
AVE of NTM/total protection
6 7 8 9 10 11 12
1
0.8
0.6
0.4
0.2
0
Log GDP per capita
HKG
ZWEZMBZAF
VNM
VEN
USA
URYUKR
UGA
TZA
TUR
TUN
TTOTHA
TCD
SVN
SLV
SEN
SDN
SAU
RWA
RUS
ROM
PRY
POL
PNG
PHL
PER
PAK
OMN
NZL
NOR
NICNGA
MYS
MWIMUS
MOZMLI
MEX
MDG
MDA
MAR
LVA
LTU
LKA
LBN
LAO
KGZKEN
KAZ JPN
JORISL
IND
IDNHUN
HND
GTM
GNQ
GHA
GAB
EUN
ETH
EST
EGYECU
DZA
CZE
CRI
COL
CMR
CIV
CHN
CHLCHE
CAN
CAF
BTN
BRN
BRA
BOL BLR
BHR
BGD
BFA
AUS
ARG
ALB
FIGURE 4.2 Nontariff measures are more important in rich countries, 2002
Source: Kee, Nicita, and Olarreaga 2005b.Note: AVE stands for ad valorem equivalent.
Regression line shown: coefficient = –0.71; standard error = 0.23; t-statistic = –3.05.Source: Kee, Nicita, and Olarreaga 2005c.Note: Partial correlation plots obtained by regressing log GDP per capita on constant, log OTRI at home, and log OTRI abroad.
Regression line shown: coefficient = –1.16; standard error = 0.32; t-statistic = –3.52.

R E A L I Z I N G T H E D E V E L O P M E N T P R O M I S E O F T R A D E
G L O B A L M O N I T O R I N G R E P O R T 2 0 0 5 127
lower are the trade barriers imposed by the restof the world on its exports. Thus there is a neg-ative association between GDP per capita andthe trade restrictiveness that countries imposeon their imports and that imposed by the restof the world on their exports.
For developing countries for which suchdata are available, OTRIs are positivelycorrelated with poverty headcounts: thehigher is a country’s trade restrictiveness,the poorer it tends to be (figure 4.4). Highertrade restrictiveness on exports is also pos-itively correlated with poverty head-counts—that is, the higher is the OTRIconfronting a country’s exports, the morepoor households that country is likely tohave.10 The implication is that reductions inprotection at home and abroad are likely tobe pro-poor. Although such correlations ofaverage trade restrictiveness and the num-ber of poor people in a country suffer fromaggregation bias and do not imply a causalrelationship, more detailed microeconomet-ric studies of trade reforms in developingcountries find that liberalization tends tobenefit poor people.11
The Incidence of OECD Trade Policies
Estimated OTRIs for high-income OECDcountries average 12 percent for all trade.They are much higher for agricultural tradethan other merchandise—44 percent com-pared with 6 percent (figure 4.5). This dis-parity reflects high levels of support foragricultural production: the OECD ProducerSupport Estimate rose to 32 percent in 2003,up from 31 percent in 2002.12 A similar sec-toral pattern applies to OTRIs for importsfrom developing countries, although theabsolute level of trade restrictiveness is sub-stantially lower for trade with Sub-SaharanAfrica as a result of bilateral tariff preferenceprograms (but still high in agriculture).
Nontariff measures account for a largeshare of these OTRIs.13 Thus, taking theeffects of such measures into consideration isimportant in accurately assessing the extentto which policies affect trade, both importsand exports. It is important to bear in mindthat not all nontariff measures have explicitprotectionist objectives. Particularly in thecase of health- and safety-related productstandards, the intention generally is not (and
2
–2
e(log of poverty headcount|X)
0–1 1 2
1
0
–1
–2
–3
–4
e(log of OTRI home|X)
2e(log of poverty headcount|X)
0 0.5–0.5
1
0
–1
–2
–3
–4
e(log of OTRI abroad|X)
ZWE
ZMB
ZAF
UKRUGA
TZA
TUR
TUN
THA
TCD
SL V
RUS
ROM
PNGPHLPER
PAKNPL
NICMWIMOZMLI
MEX
MDG
MDA
MAR
LTULTU
LKALAO
KGZKEN
KAZ
JOR
INDIDNHUN
GTMGHA ETH
EST EGYDZA
CRI
COLCMR
CHN
CHL
BRA
BOLBLR BGDBFA
ARG
ALBZWE
ZMB
ZAF
UKRUGA
TZA
TUR
TUN
THA
TCD
SLV
RUS
ROM
PNGPHLPER
PAK
NPLNIC
MWIMOZ
MLI
MEX
MDG
MDAMARLKA
LAO
KGZ KENKAZ
JOR
INDIDN
HUN
GTMGHAETH
ESTEGYDZA
CRI
COLCMR
CHN
CHL
BRA
BOLBLR BGDBFA
ARG
ALB
FIGURE 4.4 Trade restrictiveness at home and abroad rises with poverty headcount
Regression line shown: coefficient = 0.24; standard error = 0.25; t-statistic = 0.94.Source: Kee, Nicita, and Olarreaga 2005c.Note: Partial correlation plots obtained by regressing log poverty headcount on constant, log OTRI at home, and log OTRI abroad.
Regression line shown: coefficient = 0.91; standard error = 0.52; t-statistic = 1.74.

should not be) to protect domestic producers.To varying degrees, all countries maintainsuch regulations. WTO rules on such policiesrequire that they be justified by scientific evi-dence and a process of risk assessment, andbased on international norms if any exist.Such standards should also apply to domesticgoods, although WTO case law and numer-ous bilateral disputes over many years regard-ing their enforcement illustrate that inpractice these standards may be used to shielddomestic producers from import competi-tion.14 However, it is not possible to discernintent in the data—OTRIs simply show thatthese types of policies have a major effect ontrade, especially in agricultural products.15
No presumptions exist or are implied regard-ing the intent or scientific basis of any of thenontariff measures captured in OTRIs.16
Because the OTRI does not include ser-vices trade and policies, it likely underesti-mates countries’ actual trade restrictiveness.Trade in services has been growing rapidlyfor the past two decades and now accountsfor some 40 percent of world trade if sales of
foreign affiliates are included.17 But statisti-cal agencies do not compile the type ofdetailed data on bilateral trade in servicesthat exist for merchandise. Nor is there acomprehensive global database on services-related trade policies.
The trade policies of high-income OECDcountries imply higher restrictions on importsfrom low-income countries than from othersources (table 4.7). In part this simply reflectsthe sectoral structure of protection—mostintra-OECD trade is in manufactures thatconfront low barriers. Barriers are highest foragricultural imports from middle-incomecountries, which do not benefit from the pref-erences accorded to poorer countries (table4.8). Still, even after taking into account thefact that developing countries benefit fromtariff preferences under the Generalized Sys-tem of Preferences and that Sub-SaharanAfrica and the LDCs have highly preferred—often duty- and quota-free—access to manyOECD markets as a result of programs suchas the EU Everything But Arms initiative andthe U.S. African Growth and Opportunity
C H A P T E R 4
128 G L O B A L M O N I T O R I N G R E P O R T 2 0 0 5
0OTRI
agricultureOTRI
manufacturingOTRI
agriculturelow-incomecountries
OTRImanufacturing
low-incomecountries
OTRIagriculture
Sub-saharanAfrica
OTRImanufacturing
Sub-saharanAfrica
5
10
15
20
25
30
35
40
45
50Percent
Tariff Non-tariff meaures Agricultural subsidies
FIGURE 4.5 Agricultural protection is high in OECD countries, and border barriers account for most of it
Source: Kee, Nicita, and Olarreaga 2005c.

R E A L I Z I N G T H E D E V E L O P M E N T P R O M I S E O F T R A D E
G L O B A L M O N I T O R I N G R E P O R T 2 0 0 5 129
TABLE 4.7 OECD trade restrictiveness is highest toward low-income countries, 2002 (percent)
OTRI for OTRI for OTRI for Share of Share of low-income Importing income OTRI for all low- income least developed Sub- Saharan low-income countries in total imports group/country countries countries countries Africa country exports from developing countries
High-income OECD 12 14 12 11 68 11Canada 6 7 6 5 1 8European Union 13 15 13 14 27 11Japan 14 24 21 18 10 13United States 8 6 5 4 23 10
Source: Kee, Nicita, and Olarreaga 2005a. Note: OTRI stands for overall trade restrictiveness index.
TABLE 4.8 Globally, trade restrictiveness is highest for agriculture, 2002 (overall trade restrictiveness index,percent)
Importing region/income group
Exporting region/ High-income Middle- Low- Least Sub-Saharanincome group OECD Quad income income developed Africa World
Total trade
High-income OECD 9 8 19 23 21 23 14Quad 8 8 19 23 21 23 14
Middle-income 9 9 22 25 22 25 15Low-income 14 14 25 26 22 26 20Least developed 12 12 24 25 22 26 18Sub-Saharan Africa 11 11 23 24 21 24 17World 12 12 20 22 21 23 18
Agriculture
High-income OECD 36 35 45 36 28 34 39Quad 31 30 46 37 29 34 37
Middle-income 49 49 42 36 28 33 43Low-income 43 43 40 34 27 31 39Least developed 38 38 39 32 26 30 37Sub-Saharan Africa 34 35 38 33 26 30 35World 44 43 36 30 26 32 35
Manufacturing
High-income OECD 5 5 15 21 19 21 10Quad 6 6 15 21 20 21 11
Middle-income 4 4 19 23 21 24 11Low-income 4 4 20 22 21 24 13Least developed 3 3 20 22 21 24 12Sub-Saharan Africa 2 2 16 19 18 21 9World 6 6 17 20 20 22 12
Source: Kee, Nicita, and Olarreaga, 2005a.Note: The Quad are Canada, the European Union, Japan, and the United States.

Act, OTRIs for low-income countries average14 percent (figure 4.6).
A reason for this is that the incidence ofnontariff measures in a number of OECDcountries tends to be disproportionately highon products that developing countriesexport—especially agricultural products.Thus the higher OTRIs against low-incomecountries primarily reflect the product com-position of imports—developing countrieshappen to export the goods most affected bynontariff measures—and the fact that not alllow-income countries benefit equally fromthe preferential access regimes offered by theOECD members concerned.18 An implicationis that nontariff measures matter, in that theytend to reduce the effective value of the pref-erential access granted through tariff exemp-tions. Insofar as the incidence of nontariffmeasures is higher in developing countries,there is a case for additional assistance to bedirected at these countries to help themaddress the underlying regulatory require-ments. The need for this increases the moreambitious the outcome of the Doha Roundwill be, as deep multilateral liberalization willreduce the value of existing tariff preferences.
Another striking feature of the OECDOTRI estimates is that agricultural subsidiesplay only a small role in determining themagnitude of OTRIs for most countries thatemploy them (see figure 4.5). That is because,from a market access perspective, subsidiesare often redundant—because border barrierssuch as tariffs and tariff rate quotas are theinstruments that determine the (world) priceimpacts. If border barriers were to be reducedsignificantly, agricultural subsidies wouldbecome much more important determinantsof trade restrictiveness; thus they are notinnocuous. But the implication is that policies(and negotiations) should focus on removingborder protection. Lowering agricultural sub-sidies without lowering border protectionwill not have much effect.19
Although market access dominates interms of affecting world prices and distortingdomestic markets, subsidies are very impor-tant for some developing countries.20 Cottonis an example where global trade barriers arelow, but subsidies in several OECD countriesare large—with well-documented detrimentaleffects on West African and other developingcountry producers. Cotton accounts for about30 percent of exports from the four WestAfrican nations that proposed a cotton initia-tive in the WTO, and for a significant share ofincome for millions of poor farming house-holds in the region.21 Recent U.S. cotton sub-sidies have ranged from $1.5 billion to almost$4.0 billion a year, depending on market con-ditions.22 Eliminating U.S. cotton programs,while leaving in place other farm programs,would reduce U.S. production by 25–30 per-cent, reduce U.S. exports by about 40 percent,and raise world prices by about 10 percent.The annual losses for LDC cotton producersresulting from U.S. and EU support policiesare in the range of $120–240 million.23
The Incidence of Developing Country Trade Policies
Developing countries have higher averageOTRIs than do high-income OECD countries.Among regions, the Middle East and North
C H A P T E R 4
130 G L O B A L M O N I T O R I N G R E P O R T 2 0 0 5
Percent
30
25
15
20
10
5
0CanadaQUAD Japan United
StatesEuropean
UnionHigh-
income,OECD
countries
OTRI in terms of low-income countriesOTRI in terms of Sub-Saharan Africa
FIGURE 4.6 OECD trade restrictiveness remains high for developingcountries
Source: Kee, Nicita, and Olarreaga 2005c.Note: Quad countries are Canada, the EU, Japan, and the United States.

Africa have the highest OTRIs, followed bySub-Saharan Africa, South Asia, and East Asia(table 4.9). Eastern European and CentralAsian countries, many of which acceded to theEuropean Union in 2004, have the lowestOTRIs. The average OTRI for all developingcountries is 20 percent. As with high-incomeOECD countries, manufacturing protectiontends to be lower than restrictions applied toagricultural trade, though the differences aresmaller than in the OECD countries (see table4.8). On average the world has an OTRI inagriculture that is three times that in manufac-turing—35 percent compared with 12 per-cent—with high- and middle-income countriesbeing more restrictive than low-income coun-tries. The LDCs have the lowest agriculturalOTRIs of all income-based country groups.Conversely, developing countries have muchhigher manufacturing OTRIs, with the high-est average levels observed in Sub-SaharanAfrica. This generally reflects either a desire toprotect local industries or to achieve fiscalobjectives; tariffs account for a substantialshare of government revenues in many Sub-Saharan countries.
In terms of the incidence of OTRIs, a pat-tern similar to that for OECD countries isobserved for developing countries—OTRIs
are higher for exports from other developingcountries (though the LDCs confront slightlylower average OTRIs than do other low-income countries; see table 4.8). Thus, inaddition to facing high barriers in OECDcountries, developing countries impose highbarriers on trade with one another, and theincidence of these intra-developing countrytrade restrictions is higher for poorer coun-tries—just as the incidence of OECD traderestrictions is higher for poorer countries.
These estimates show that the protection-ist trade policies of high-income OECD coun-tries are not the only external problemundermining the ability of developing coun-tries to use trade for development andpoverty reduction. Indeed, middle-incomecountries maintain much higher levels of pro-tection. Reducing such protection would bein their own interest and that of poorer coun-tries—which often confront higher barriers inglobal markets than do rich countries, imply-ing that the structure of trade policies in mid-dle-income countries is antipoor. Thus reformof trade policies in developing countriesshould be a central part of the trade reformagenda. This conclusion also emerges fromthe research summarized below assessing thepotential gains from the Doha Round—
R E A L I Z I N G T H E D E V E L O P M E N T P R O M I S E O F T R A D E
G L O B A L M O N I T O R I N G R E P O R T 2 0 0 5 131
TABLE 4.9 Developing countries impose high restrictions on trade with one another, 2002 (overall traderestrictiveness index, percent)
OTRI for OTRI for least OTRI for OTRI for all low-income developed Sub-Saharan
Importing region/income group countries countries countries Africa
East Asia and Pacific 21 26 26 26Europe and Central Asia 12 16 15 16Latin America and the Caribbean 18 21 20 20Middle East and North Africa 31 48 47 40South Asia 23 29 27 28Sub-Saharan Africa 23 26 26 24
Developing countries 20 25 25 23Least developed countries 21 22 22 21Low-income countries 22 26 25 24Middle-income countries 20 25 24 23
Source: Kee, Nicita and Olarreaga, 2005a.

which are potentially large only if the roundencompasses significant further liberalizationof trade by developing countries.
The Doha Round ChallengeThe WTO is the primary multilateral instru-ment through which countries can reduce thetrade protection summarized above. In August2004 the WTO General Council reached sev-eral agreements to guide future negotiationsunder the Doha Round. The agreements werea welcome step forward after the setback atCancun, but they leave key questions unan-swered and extend the timeframe of theround. The agreements include a frameworkfor negotiations on agriculture and industrialproducts, recommendations on services, andmodalities for negotiating improved customsprocedures (trade facilitation; table 4.10).
Why Ambition Matters: Likely Impacts of Different Doha Round Outcomes
The extent to which reform commitmentsunder the Doha Round will have economicrepercussions depends on whether they affect
applied policies. WTO negotiators focus noton applied tariffs and subsidies but on the lev-els of import tariffs, export subsidies, anddomestic support for agriculture that countriescommit not to exceed. These so-called bind-ings are often much higher than applied levelsof protection, especially in developing coun-tries. Thus, if cuts to bound tariffs or subsidyrates are not very large, or the gap betweenbound and applied rates is large, the reformsrequired by a Doha deal may be minimal. So,much depends on the extent to which changesin bindings translate into real reductions inapplied protection levels. Much also dependson the magnitude of exceptions and exemp-tions for specific instruments or products.
Deep trade reform could generate largeglobal gains. Freeing all merchandise tradeand abolishing all trade-distorting agriculturesubsidies would boost global welfare by$80–280 billion a year by 2015, dependingon whether exogenous population and laborsupply growth, savings-driven capital accu-mulation, and labor-augmenting technologi-cal progress are taken into account.24 Theseestimates ignore possible dynamic productiv-ity gains, exploitation of economies of scale,
C H A P T E R 4
132 G L O B A L M O N I T O R I N G R E P O R T 2 0 0 5
TABLE 4.10 Key elements of the August 2004 WTO framework agreement
Agriculture subsidies All forms of agricultural export subsidies to be eliminated. Overall bound level oftrade-distorting domestic support to be reduced over time, with a 20 percentreduction in the first year. Members with higher levels of support to commit tolarger reductions, with product-specific caps on the most trade-distorting formsof agricultural support.
Market access in agriculture Nonlinear formula to ensure deeper cuts in higher tariffs. A category of“sensitive” products to be subject to greater flexibility. Possibility of trading offmore modest tariff reductions against larger tariff rate quotas.
Cotton To be dealt with “ambitiously and expeditiously” within the agriculturenegotiations, by a special subcommittee.
Non-agriculture market access No a priori exclusions. Recognition that credit should be given for autonomousliberalization. Nonlinear formula to tackle tariff peaks, high tariffs, and tariffescalation, to be applied on a line-by-line basis.
Services Revised offers to be tabled by May 2005, and developing countries to be giventechnical assistance to help them participate in the negotiations.
Trade facilitation Negotiations to be part of the Doha Round, with a focus on expediting themovement, release, and clearance of goods, with implementation by developingcountries linked to provision of technical assistance.

effects of increased competition on markupsand X-inefficiency in production, and liberal-ization of trade in services—includingthrough greater temporary internationalmobility of service suppliers. They alsoassume that beneficiary countries make fulluse of preferences and that any resulting rentsaccrue to exporters. Taking such factors intoaccount greatly increases the potential aggre-gate gains and affects the distribution of neteffects across countries.25
Recent research suggests that developingcountries would obtain about one-third ofthe global gain from freeing all merchandisetrade, well above their one-fifth share ofglobal GDP. Recent analyses using globalgeneral equilibrium models and the latestdatabases on trade protection and prefer-ences suggest that developing countrieswould receive a 1.2 percent static gain overinitial welfare (real income) levels, comparedwith just 0.6 percent for developed countries(assuming an overall global gain of $280 bil-lion). The larger gain for developing countries
is partly because of their relatively high tar-iffs—meaning, they would reap substantialefficiency gains from reforming their protec-tion—and partly because their exporters facemuch higher farm and textile tariffs in devel-oped countries than do exporters from otherdeveloped countries, notwithstanding non-reciprocal tariff preferences for many devel-oping countries.26
Agriculture is the most important sector inrealizing these potential gains, reflecting theextensive assistance it receives relative toother sectors. Food and agriculture policiesare responsible for more than three-fifths ofthe global gain forgone by merchandise tradedistortions (table 4.11)—despite the fact thatagriculture and food processing account forless than 10 percent of world trade and lessthan 4 percent of global GDP. Agriculture isas important for the welfare of developingcountries as it is for the world as a whole:their gains from global agricultural liberal-ization account for almost two-thirds of theirtotal potential gains, compared with one-
R E A L I Z I N G T H E D E V E L O P M E N T P R O M I S E O F T R A D E
G L O B A L M O N I T O R I N G R E P O R T 2 0 0 5 133
TABLE 4.11 Most economic welfare benefits of full merchandise trade liberalization would come fromagriculture, 2015 (percent)
Global welfare benefits
Sector liberalized
Source of Agriculture Textiles Otherbenefits and food and clothing manufactures All goods
Developed countries’ policies 46 6 3 55Developing countries’ policies 15 9 21 45Total 61 15 24 100
Developing countries’ welfare benefits
Sector liberalized
Source of Agriculture Textiles Otherbenefits and food and clothing manufactures All goods
Developed countries’ policies 28 16 6 50Developing countries’ policies 35 9 6 50Total 63 25 12 100
Source: Anderson, Martin, and van der Mensbrugghe 2005, table 12.4.Notes: (1) These data are shares based on a simulated global gain of $280 billion that takes into account exogenous population and labor supplygrowth, savings-driven capital accumulation, and labor-augmenting technological progress between 2001 (base year) and 2015. Developed countriesinclude the transition economies of Eastern Europe and the former Soviet Union. (2) The share of global welfare gains due to liberalization by middle-income countries is 12 percent for agriculture and food liberalization; 7 percent for textiles and clothing; and 13 percent for other manufactures.

quarter for textiles and clothing and one-eighth for other merchandise liberalization(see table 4.11).
Stronger subsidy disciplines are important,but increased market access in agriculture iscrucial. High applied tariffs on agriculturalrelative to nonfarm products are the mainreason food and agriculture policies accountfor 61 percent of the welfare cost of mer-chandise trade distortions. Aggregatingacross all products, subsidies for farm pro-duction and exports are only minor contrib-utors: 4 and 1 percentage points, respectively,compared with 56 points due to agriculturaltariffs.27 Tariffs are more important in devel-oping than in developed countries, becausesubsidies are much less prevalent. Given thatbound tariff rates are high in agriculture,large cuts are needed to make a difference.The average bound tariff rate in developedcountries is almost twice the average appliedrate; in developing countries the difference iseven greater. To lower the average global agri-cultural tariff by one-third, bound rateswould have to be reduced for developedcountries by at least 45 percent and the high-est tariffs by up to 75 percent.28
Even large cuts in bound tariffs will do lit-tle if exemptions for “sensitive” products areallowed. If WTO members limit tariff cuts for“sensitive” farm products such as rice, sugar,milk, beef, fruits, and vegetables, the prospec-tive gains from Doha could be greatly dimin-ished. Classifying 2 percent of six-digitHarmonized System agricultural tariff lines indeveloped countries as sensitive (and 4 per-cent in developing countries, to reflectdemands for differential treatment) and sub-jecting them to just a 15 percent tariff cutwould shrink by three-quarters the welfaregains from global agricultural reform.29
These findings illustrate the importance of thecall made in Global Monitoring Report 2004for ambitious targets with respect to loweringagricultural tariffs, for example, to no morethan 10 percent.
While agricultural market access liberal-ization is by far the most critical merchan-dise trade issue on the negotiating table from
a developing country perspective, disciplin-ing domestic production subsidies and phas-ing out export subsidies is also important. Inpart these steps are needed to prevent “re-instrumentation” of assistance from tariffsto domestic subsidies. Moreover, someOECD subsidies are very important fordeveloping countries. Removing cotton sub-sidies would raise the price of cotton ininternational markets and benefit develop-ing country exporters. For Sub-SaharanAfrica, recent research suggests that theincrease in export prices relative to manu-factures overall would be small. But cottonexports from Sub-Saharan Africa wouldincrease 75 percent. The share of all devel-oping countries in global cotton exportswould expand to 85 percent, instead of the56 percent projected for 2015.30
The foregoing analyses of possible out-comes of negotiations consider policy instru-ments such as tariffs, preferences, subsidies,and tariff rate quotas in agriculture. But theydo not consider the effects of nontariff mea-sures and mostly ignore the implications ofremoving barriers to trade and investment inservices. Given that nontariff measures playan important role in determining the overalltrade restrictiveness of countries, reducing theincidence of such policies could generateadditional gains for developing countries andthe world as a whole. Using a partial equilib-rium framework that allows much greaterdisaggregation across products and countriesthan is possible in global computable generalequilibrium models, a recent study comparedthe likely effects of an unambitious DohaRound and an ambitious one that addressesnontariff measures.31 The low-ambitionround is defined as causing a 40 percent cutin bound tariffs, a reduction in tariff peaks toa maximum of 50 percent, a 40 percentreduction in domestic agriculture subsidies,elimination of export subsidies, and animprovement in trade facilitation thatincreases world trade by an average of 2 per-cent.32 Conversely, an ambitious DohaRound would result in free trade (eliminationof all applied tariffs), a 50 percent cut in the
C H A P T E R 4
134 G L O B A L M O N I T O R I N G R E P O R T 2 0 0 5

restrictiveness of nontariff measures, elimina-tion of trade-distorting agriculture produc-tion and export subsidies, and the sameimprovement in trade facilitation.
An unambitious Doha Round would notdo much to improve developing country wel-fare or help achieve the MDGs. Static globalwelfare gains would be about $59 billion. Incontrast, an ambitious Doha agenda couldnearly quintuple these gains, to $269 billion.Full tariff and subsidy reform without anychanges in nontariff measures would generate“only” $111 billion.33 Sub-Saharan Africawould see its welfare increase by an estimated$2.8 billion under the ambitious scenario,compared with only $140 million under thetype of agreement that current trends suggestis likely to emerge. The low-ambition sce-nario would raise Sub-Saharan GDP by 0.1percent. In contrast, an ambitious DohaRound outcome could boost GDP by 1.3 per-cent. Around 40 percent of the gains from theround would accrue to developing countriesunder both scenarios, with the greatestabsolute amount going to middle-incomenations. Low-income countries would obtain14 percent of the developing world welfaregains. Under both scenarios welfare gains rel-ative to GDP are largest for low- and middle-income countries (figure 4.7).
This analysis suggests that efforts toreduce the incidence of nontariff measuresare important. But as noted, not all thesemeasures are discriminatory. In the case ofregulatory product requirements—whichaccount for a large share of nontariff mea-sures in many high-income countries—attenuating the effects of enforcement isunlikely to be costless. Thus the additional$150 billion that could be attained by halv-ing the ad valorem equivalent of nontariffmeasures is an upper bound estimate ofpotential net gains. Determining how toattenuate the impacts of nontariff measuresat the lowest cost requires both country-specific analysis and a concerted effort toimprove the global information base onapplied nontariff policies. But it is probablethat much of the appropriate response
revolves around “aid for trade” to improvequality, testing, conformity assessmentcapacity, and so on.
Prospects for realizing the potential oftrade to support development are also condi-tional on further liberalization by developingcountries. As revealed by the OTRIs, devel-oping countries maintain much higher tradebarriers against nonagricultural productsthan do OECD countries and impose hightrade barriers on each other. Combined withthe fact that many (especially middle-income)developing countries have been growingmore rapidly, prospects for greater tradeflows are greatest between developing coun-tries. Moreover, most of the benefits of tradereform derive from what countries do them-selves—as discussed in Global MonitoringReport 2004 and numerous recent reports,including the United Nations MDG taskforcereport on trade, maintaining high barriers totrade imposes costs on an economy.
If developing countries as a group were notto participate in liberalizing trade under theDoha Round, not only would global gainsfall significantly—by close to one-half—butpotential gains to developing countries would
R E A L I Z I N G T H E D E V E L O P M E N T P R O M I S E O F T R A D E
G L O B A L M O N I T O R I N G R E P O R T 2 0 0 5 135
0.0
0.5
1.0
1.5
2.0
2.5
High-incomecountries
Middle-income
countries
Low-incomecountries(excluding
Sub- SaharanAfrica)
Sub- SaharanAfrica
(excludingSouth Africa)
Percent
Low Ambition Ambitious Doha
Impact in terms of increase in GDP
FIGURE 4.7 A low-ambition round vs. deep WTO reforms
Source: Hoekman, Nicita, and Olarreaga (2005).

fall by 50 percent.34 Sub-Saharan Africa andthe LDCs could even end up losing from theDoha Round if they do not pursue reforms.The reason is that the efficiency gains fromown liberalization are needed to help offsetterms of trade losses that may arise becausefood prices rise (in the case of net foodimporters), tariff preferences are eroded, ormarket share is lost to other developing coun-tries that pursue reforms (or have alreadydone so).
Services
The foregoing discussion largely ignoresdomestic reform and liberalization of servicesector policies, an area where research suggeststhere is great potential for gains, in terms ofboth efficiency and equity. Countries such asBrazil and India have seen exports of businessprocess services such as call centers, softwaredevelopment, and back-office services expandrapidly. African exports of commercial servicesgrew by more than 20 percent in 2003, in line
C H A P T E R 4
136 G L O B A L M O N I T O R I N G R E P O R T 2 0 0 5
100
80
DC Tran Dev LDCs DC Tran Dev LDCs DC Tran Dev LDCs DC Tran Dev
Mode 1 Mode 2 Mode 3 Mode 4
LDCs
Full Partial Unbound
60
40
20
0
Percent of commitments
Source: Marchetti (2004), updating WTO document S/C/W/99.Note: The above information is as of August 2004 and is based on a sample of 37 representative sectors. DC (developed countries);Tran (transition economies); Dev (developing countries). Full implies a binding commitment to market access and national treat-ment; unbound implies no commitments were made; and partial implies specific policies limiting access or involving discrimina-tion were bound.
FIGURE 4.8 WTO Market access commitments for services by mode of supply
with merchandise export growth, and accountfor 18 percent of total exports—the largestshare of all developing regions.35
Developing countries have called for spe-cific commitments on improving access toOECD markets for service suppliers, espe-cially through temporary migration (mode 4in the General Agreement on Trade in Ser-vices, or GATS). This is the main area wherevirtually no commitments have been made(figure 4.8). As noted in Global MonitoringReport 2004, it is also the area with the great-est potential for increased exports from devel-oping countries (figure 4.9).
To date, little progress has been made onservices negotiations. Although numerousrequests have been put on the table, only 47first-round offers have been put forward byWTO members.36 Most of these are of lim-ited value as they do not go beyond statusquo policies. The LDCs have made the fewestcommitments on services in the WTO—incontrast to recently acceded countries, whichhave been asked to make far more commit-

higher service costs reduce export prices andincrease import prices. As a result exportingindustries must pay lower wages or acceptlower returns on capital. For example, freightrates for goods originating in Sub-SaharanAfrican countries are often considerablyhigher than for similar goods originating inother countries, and thus have contributed tothe region’s weak trade performance and high
R E A L I Z I N G T H E D E V E L O P M E N T P R O M I S E O F T R A D E
G L O B A L M O N I T O R I N G R E P O R T 2 0 0 5 137
Mode 2(consumption abroad)
14%
Mode 1(cross-border supply)
35%
Mode 4(movement of natural persons)
1%
Mode 3(commercial presence)
50%
Value of world trade in services by mode
FIGURE 4.9 Foreign direct investment and cross-border exchangeaccount for most trade in services
Source: Maurer (2004)
TABLE 4.12 Developing countries have made fewer market access andnational treatment commitments for services under the WTO
Average number Rangeof subsectors (lowest/highest committed number of committed
Country group per country subsectors)
Developing countries 54 1–154Least developed countries 20 1–110Transition economiesa 106 58–154
Developed countries 108 87–117Countries acceded since 1995 106 37–154
Source: Marchetti 2004. Note: Data as of August 2004. The total number of subsectors in which commitments can bemade is 160. These commitments may be full or partial bindings; see note to figure 4.8.a. Includes only European and Central Asian transition economies.
ments than most existing members (table4.12). There is great scope for more advancedcountries to lock in liberal trade and invest-ment policies in areas that matter to develop-ing countries—especially on cross-bordertrade (mode 1)—and to increase the extent towhich service markets can be contestedthrough temporary migration of serviceproviders. Conversely, developing countriescan do much more to use the WTO as aninstrument to commit to greater liberaliza-tion of their services. While considerations of“balance” create incentives not to do so untilgreater clarity has emerged on what is likelyto be feasible in other areas (such as agricul-ture), services are an area where a quid proquo can be offered that is likely to benefit thecommitting country. Much of the agenda hererevolves around making commitments tar-geted at attracting greater foreign directinvestment (FDI) in services (mode 3 of theGATS). Encouraging such investment in bothgoods and services production is a direct wayto improve the investment climate.
FDI can do much to enhance an economy’sproductivity, because foreign service suppliersoffer new technologies, new products, andmore differentiated and higher-quality ser-vices. The increased competition associatedwith open access to service markets also putspressure on the prices and performance ofincumbent firms, reducing input costs forfirms that buy the services. Moreover, theimportance of an efficient services sector goesbeyond the sector’s contribution to a country’sbalance of payments; such efficiency is also akey determinant of domestic firms’ competi-tiveness. Key services that influence firms’ability to participate in world trade includetelecommunications, transportation, finan-cial, and other business services such asaccounting and legal services.
In many of the LDCs, inefficient businessservices are an important barrier to effectiveintegration with world markets. High-costtrade support services act as a tax onexporters and ultimately on growth andpoverty reduction. For a small economy con-fronting given world prices of traded goods,

poverty in recent decades. High transporta-tion costs are partly due to shortcomings ininfrastructure, geography, and the economicsize of markets, but they may also reflect poli-cies that restrict competition—such as cargoreservation schemes or entry barriers into airand maritime transport.
The Doha Round, Low-Income Countries,and Sub-Saharan Africa
Market access is a necessary but insufficientcondition for harnessing trade for develop-ment. As noted in Global Monitoring Report2004, domestic supply constraints are themain reason for the lack of trade growth anddiversification in many developing countries.Without action to improve supply capacityand reduce transactions costs, trade opportu-nities cannot be fully exploited and the poten-tial gains discussed previously will not berealized. The agenda spans many areas, manyof them “behind-the-border.” Dealing withthese issues will require action in developingcountries and assistance from developedcountries, including both finance and effortsto reduce the costs of nontariff measures.
Recent country studies that analyze thepotential impacts of global reforms on Africanpoverty, using information from household sur-veys, show that trade policy actions by them-selves will have limited effects—positive ornegative. Complementary reforms and invest-ments are needed to stimulate the desired sup-ply response to changed incentives. In Ethiopia,one of the world’s poorest countries (with morethan two-thirds of the population living on lessthan $2 a day), the Doha Round alone will nothave much significant effect on poverty.37 Thatis because any impact on the prices and quan-tities of Ethiopia’s main exports—coffee, qat (amild stimulant exported mostly to neighboringcountries), and livestock—will not be large.Moreover, exports represent a small part ofGDP: annual exports are about $600 million,or $10 per capita, equal to 15 percent ofGDP—one of the lowest shares in Sub-SaharanAfrica. Thus even a hypothetical doubling ofinternational demand for Ethiopian products
would have limited impact on poverty. Domes-tic markets are poorly connected, limiting theprice and quantity effects of any trade policychanges in rural areas, where most poor peoplelive. If price signals fail to reach households,supply responses to international shocks will below. In addition, low agricultural productivityimplies that supply responses will be associatedwith higher production costs, reducing net ben-efits. Finally, Ethiopian households, especiallythe poorest, are insulated from market shocks(and thus effects of trade policies) because theyare widely engaged in subsistence activity.More than half the average budget of poorhouseholds is from subsistence.
This does not mean that an ambitiousDoha Round would not bring opportunitiesto Ethiopia. It would increase internationaldemand for Ethiopian products. But for thatto translate into quantifiable benefits, theincreased demand would have to be accom-panied by improved productivity (rather thana simple increase in production), to also spurnonexported agricultural production (espe-cially staple crops). And given that most poorEthiopians live in remote areas, increasedproductivity alone may not have a large effecton poverty in the absence of complementarypolicies. Better infrastructure and access tocredit are two preconditions for integratingthe rural poor with domestic markets andreducing subsistence.
A similar conclusion arises from a recentstudy on Zambia.38 In 1998 more than 70 per-cent of the country’s population lived inpoverty. Using an approach similar to theanalysis of Ethiopia, in terms of projecting thelikely effects of a Doha Round on world prices,the authors investigate the impact of tradereforms on household welfare through effectson consumption and income. They concludethat only small impacts can be expected froma Doha Round set of trade reforms. Thisreflects the fact that the round will likely gen-erate only a small change in prices, so gainsand losses for producers and consumers will besmall as well. Moreover, for Zambian house-holds large shares of spending and income arerelated to home-produced goods—which are
C H A P T E R 4
138 G L O B A L M O N I T O R I N G R E P O R T 2 0 0 5

Fueled by low labor costs, relocation of textile and apparel firms from neighboring Mauritius, pref-erences granted by the U.S. African Growth and Opportunity Act, and the creation of export pro-cessing zones, Madagascar’s textiles sector experienced dramatic growth in the late 1990s. Textileand apparel exports increased from $100 million in 1995 to almost $500 million in 2001. In thesame period employment in the sector grew from 30,000 to 200,000 individuals. Expansion of thetextiles and apparel industry has enabled many individuals and households to increase income andin some cases escape poverty. But the welfare effects of this expansion have been geographicallyconfined: most of the employment has been created in a few urban areas with relatively low poverty.
Most of the gains, in both absolute and relative terms, have accrued to nonpoor households. As aresult this export-led growth has increased inequality between poor and nonpoor people, between urbanand rural areas, and between skilled and unskilled workers. Skilled workers have experienced rapidlyincreasing wages, while rural areas have largely been cut off from the effects of the growing textiles andapparel sector. Unskilled workers have benefited only marginally, because a large pool of unemployedand underemployed workers has kept their wages from rising. But poor households located in the cap-ital, where most of the employment was created, have benefited. It is estimated that five years of expan-sion of the textiles sector reduced poverty by almost 1 percentage point, or about 150,000 individuals.
These results suggest that two factors are required if export-led economic growth is to reduce povertysignificantly. First, growth and job creation must not be restricted to a few geographic areas. Disper-sion could be achieved by creating geographically diverse export processing zones to generate job oppor-tunities for a wider range of the population. Second, to facilitate their absorption into the formal laborforce, poor people must be assisted in obtaining the skills sought by expanding industries. This can beachieved by providing government-sponsored training or incentives for firms to provide training.
Source: Nicita 2005.
BOX 4.2 Why has rapid export growth failed to significantly reducepoverty in Madagascar?
unlikely to be affected by trade liberalization.Larger effects are predicted on the income side,particularly in terms of higher wages, employ-ment opportunities, and a move from subsis-tence to market-oriented agricultural activities.Again, a key finding is that trade policy byitself is not enough. Complementary policiesare important in allowing households to takefull advantage of trade liberalization andglobal market opportunities. This result isillustrated by two recent case studies: one onthe role of extension services in boosting pro-ductivity among poor Zambian farmers, andanother on the role of job programs in provid-ing employment for heads of households.39
An analysis for Madagascar similarly con-cludes that global trade reforms by themselvesmay have limited impact.40 Many of the coun-try’s exports do not confront high protection(vanilla, cloves, crustaceans, semiprecious
stones), most poor people live in rural areasnot connected to markets (preventing the pass-through effects of border price changes onsupply), and productivity is low. Moreover,limited competition in domestic markets islikely to concentrate gains from trade in thehands of traders and exporters, as opposed topoor farmers.41 Global liberalization wouldincrease international demand for Madagas-car’s exports, but to take full advantage of thisit would be necessary to raise productivity andreduce the transportation costs of gettingproducts to urban areas and export hubs. Pastunilateral reforms and improved access toexport markets show that trade can reducepoverty—although given their low initial base,the impact of greater exports can be limitedonly in the short to medium term (box 4.2).42
In sum, country-based analysis of thepoverty impacts of global trade reforms in
R E A L I Z I N G T H E D E V E L O P M E N T P R O M I S E O F T R A D E
G L O B A L M O N I T O R I N G R E P O R T 2 0 0 5 139

very poor countries suggests that the first-order (or static) effects are small. Price effects,whatever the magnitude, will be passedthrough incompletely, little will be done toattenuate the effects of nontariff measures,and many LDCs have concentrated exportbundles involving products that often are notheavily protected in world markets (such asvanilla in Madagascar and coffee inEthiopia). Second-order effects—allowing foradjustments on the supply side throughmovements from subsistence into market par-ticipation, changes in crops, and moves out ofunemployment—can be larger. But for anypositive effects to be significant, global tradereforms must be accompanied by comple-mentary actions targeted at increasing thesupply response. Such actions could center onreducing transportation costs from remoteareas, increasing farm productivity throughextension services, and so on.
This conclusion is supported by the manyDiagnostic Trade Integration Studies con-ducted under Integrated Framework auspicesfor the LDCs, as well as similar assessmentsfor other developing countries. These findthat trade cannot play much of a positive roleif the macroeconomic climate is unstable andthe business environment is hostile, and thatfor many countries the key challenges are toreduce constraints on competitiveness andsupply responses—especially lack of trans-port, energy, and water infrastructure, lack ofaccess to finance, and weak worker skills.Improving trade policies and taking action tofacilitate trade by strengthening and stream-lining customs can have a significant payoff,but a major impact on poverty requiresreducing domestic supply constraints.
Thus trade may make only a limited con-tribution to reducing poverty in the short tomedium run. And though its potential is sub-stantial, especially in the long run, trade isjust part of the solution.43 Even in Kenya andLesotho, African countries with dynamicexport sectors (cut flowers and apparel,respectively), booming exports have not hadmajor benefits for employment, and develop-ment of supply industries (backward link-ages) has been slow.44
Trade and Development—Toward a Concerted ResponseThe traditional international policy responseto the challenge of expanding trade in devel-oping countries has been a mix of preferentialaccess and development assistance. In recentyears preferential access has been deepenedand made more meaningful through the EUEverything But Arms initiative and the U.S.African Growth and Opportunity Act.Efforts have also been strengthened to pro-vide more aid for trade.
All these programs have been beneficial.But preferences are an eroding asset: theyhave become less valuable as importing coun-tries have liberalized their trade—both on anondiscriminatory MFN basis and as a resultof regional trade agreements. The value ofpreferences will be further eroded the morethe Doha Round results in significant furtherliberalization. The answer is not to stopglobal liberalization to maintain the value ofpreferences. Instead, action is required oncomplementary instruments to help countriesaddress competitiveness challenges andexploit market access opportunities. Thisincludes measures to reduce the incidence ofnontariff measures.
Market Access: Beyond Tariff Preferences
To some extent tariff preferences offset theexplicit discrimination against developingcountry trade reflected in higher tariffs on keyexports and the higher incidence of nontariffmeasures revealed by the OTRIs discussedpreviously. Given that developing countriesgenerally do not give significant tariff prefer-ences to other poor countries, preferencesonly significantly affect the incidence of tradepolicies in developed countries. A seeminglylogical implication of this is that advanceddeveloping countries should also offer prefer-ential access to their markets to the poorestcountries. At the 2004 meeting of the UnitedNations Conference on Trade and Develop-ment in Brazil, it was agreed that countrieswould seek to do so in the framework of theGlobal System of Trade Preferences.45
C H A P T E R 4
140 G L O B A L M O N I T O R I N G R E P O R T 2 0 0 5

Much of the literature on this subject con-cludes that preferences have not resulted inthe desired export expansion and diversifica-tion in many countries. There have been sev-eral notable exceptions, but these areassociated with quantitative restrictionsbeing imposed on competitive suppliers. Rea-sons why benefits have often proven limitedinclude restrictive rules of origin—reducingutilization of preferences below 100 percent,especially for key manufactures such as cloth-ing,46 and excluding “sensitive” productsfrom the coverage of arrangements. Recentpreference schemes for the poorest coun-tries—such as the EU Everything But Arms
initiative for the LDCs, the U.S. AfricanGrowth and Opportunity Act for eligibleSub-Saharan countries, and Canada’s duty-and quota-free access program for theLDCs—provide more comprehensive cover-age than do traditional General System ofPreferences-type programs. In the case of theAfrican Growth and Opportunity Act, theyalso apply more liberal rules of origin andhave allowed exports of textiles to expandrapidly from eligible countries.
While preferential access may generate rentsand stimulate export-oriented production incountries that are granted liberal origin rules,any rents are shared with importers (box 4.3).47
R E A L I Z I N G T H E D E V E L O P M E N T P R O M I S E O F T R A D E
G L O B A L M O N I T O R I N G R E P O R T 2 0 0 5 141
For exporters, benefits from trade preferences depend on the size of the rents associated with beingable to sell into protected markets and on their capacity to capture those rents. Recent research hasfound that importers may be able to capture some, if not most, of such rents. For example, one studyfound that the average export price increase for products benefiting from preferences under theAfrican Growth and Opportunity Act was about 6 percent, whereas the average MFN tariff for theseproducts was some 20 percent (see figure). Thus, on average exporters received around one-third ofthe tariff rent. Moreover, poorer and smaller countries tended to obtain smaller shares. The estimatesranged from 14 percent in Malawi to 46 percent in South Africa. Reasons why importers and retail-ers capture a large share of the rents include the monopsony power of buyers and limited bargain-ing power of African exporters—perhaps reflecting limited or asymmetric information.
BOX 4.3 Many of the rents created by trade preferences accrue to importers
0
5
10
15
20
25
Percent
All cou
ntries
Kenya
Leso
tho
Madag
asca
r
Malawi
Maurit
ius
South
Africa
Swaz
iland
Export price increase U.S. importers tariff rent
Source: Olarreaga and Özden 2004.

More important, such rents are highest wherethere are also quantitative restrictions oncompetitive suppliers (as under the now-expired Agreement on Textiles and Clothingand the EU sugar regime). These regimes arebeing (or have been) dismantled, implyingerosion of rents even before the conclusion ofthe Doha Round. One response is to deepenand extend preferences to additional coun-tries. The experience under AGOA or EBAsuggests that existing tariff preference pro-grams could be made more effective byadopting common, liberal rules of origin. Sev-eral OECD countries have also proposed thatmiddle-income countries apply accessschemes like those under the act.
While a decision to adopt common, lib-eral rules of origin would be desirable if putin place rapidly, and preferential access tolarge middle-income markets would be ofvalue, it must be recognized that such “affir-mative action” is not a panacea for poorcountries to expand and diversify their trade.One reason is the earlier observation thatpreferences that have generated rents havelargely been accompanied by quotas. Withthe implementation of the Agreement onTextiles and Clothing, these have largelybeen removed. A second reason is that manycountries have not been able to benefit fromexisting deep preferences, so extending thesemay not have much effect. Third, there is aglobal negative externality associated withpreference programs—they create incentivesnot to pursue global liberalization, especiallyin sectors where distortions are highest. Pref-erences for some countries by definitionimply greater discrimination against other,less preferred developing countries, and thustrade diversion—because the set of goodsthat beneficiary developing countries pro-duce overlaps with those of other developingcountries that are not beneficiaries. Thistrade diversion and discrimination has cre-ated significant tension between developingcountries and has recently given rise to sev-eral formal WTO disputes. Finally, in termsof numbers, most of the world’s poor people
do not live in the poorest countries, and pref-erences for some come at the cost of equallypoor households in other, less preferreddeveloping countries.
Given the systemic downsides, limitedbenefits, and historical inability of many poorcountries in Africa and elsewhere to use pref-erences, a decision to shift away from prefer-ential “trade as aid” toward more efficient,effective instruments to support poor coun-tries could both improve development out-comes and help strengthen the multilateraltrading system. More effective integration ofthe poorest countries with the trading systemrequires instruments aimed at improving theproductivity and competitiveness of firms andfarmers in these countries. Supply constraintsare the primary factors that have constrainedthe ability of many African countries to ben-efit from preferences.48 This suggests that themain need is to improve trade capacity andfacilitate diversification. In part this can bepursued through a shift to more (and moreeffective) development assistance that targetsdomestic supply constraints as well as mea-sures to reduce the costs of entering foreignmarkets. Such aid for trade is particularlyurgent for countries that confront preferenceerosion as a result of multilateral reforms.This is a significant economic issue for smallcountries dependent on sugar, bananas, andto a lesser extent clothing exports—productswhere protection and thus preference mar-gins are high. Importantly, most of these arenot the poorest countries, but middle-incomeeconomies.49
Aid for Trade
Bolstering trade capacity by linking farmersto markets and improving their productivity,lowering transaction costs by identifying andremoving red tape and improving customsclearance, or putting in place the regulatorypreconditions for benefiting from and man-aging liberalization—especially in the area ofservices—are all institution-intensive. Theneeds are not just for trade infrastructure and
C H A P T E R 4
142 G L O B A L M O N I T O R I N G R E P O R T 2 0 0 5

trade facilitation, but also involve comple-mentary actions to implement safety nets,enhance access to credit, improve health andeducation services, and pursue effective regu-lation to attain efficiency and equity objec-tives. This agenda extends well beyond tradeintegration. It is largely “additive” in thatactions on these fronts can be pursued in par-allel.50 On all these fronts development assis-tance can play an important role in enhancingthe overall gains from trade and managingcosts and downside risks. A specific areawhere assistance may have high payoffs is inreducing the costs of satisfying nontariff reg-ulatory policies in export markets.
In recent years progress has been made inexpanding trade-related technical assistanceand capacity building. The WTO and OECDdatabase that tracks such assistance distin-guishes between trade policy and regulations(technical assistance for product standards,integration of trade with development plans,trade facilitation), trade development (tradepromotion, market development activities,and so on), and infrastructure. Infrastructureis the largest of these categories but is not lim-ited to trade-related projects. The share of
total aid commitments that went to supporttrade policy and regulations and trade devel-opment rose from 3.6 percent in 2002 to 4.2percent in 2003.51 About one-third of thissupport went to the LDCs. Aid has beenexpanding most rapidly for trade policy andregulations (figure 4.10), reaching almost $1billion in 2003, with the amount allocated toAfrica tripling between 2001 and 2003.Commitments for trade development activi-ties, which amounted to some $1.35 billion ayear in 2001 and 2002, reached $1.8 billionin 2003.52 Infrastructure assistance was sta-ble at around $8 to $9 billion a year between2001 and 2003, with Asia by far the largestrecipient region. In 2002 Africa’s share ofinfrastructure aid diminished, reflecting anemphasis on social sectors.
The World Bank has continued to expandits activities and support for trade, focusingon trade integration broadly defined toencompass trade policy, infrastructure, andcustoms and trade facilitation. Trade diag-nostic work is being carried out in more than35 countries and is complemented byregional studies that examine issues for sev-eral countries at a time. There is a growing
R E A L I Z I N G T H E D E V E L O P M E N T P R O M I S E O F T R A D E
G L O B A L M O N I T O R I N G R E P O R T 2 0 0 5 143
1200
US$ millions
200320022001
Africa Asia Oceania
Trade policy and regulations Trade development Infrastructure
America Europe Global programs
1000
800
600
400
200
0
2000
US$ millions
200320022001
10001200140016001800
800600400200
0
10
US$ billions
200320022001
56789
43210
FIGURE 4.10 Distribution of ODA for trade-related activities and infrastructure by region and main category
Source: WTO and OECD, 2004.Note: These regions were defined using U.N. classification.

lending program for trade-related activities(figure 4.11). Projected commitments for newtrade operations between fiscal 2004 and2006 are significantly larger than in previousyears, with trade facilitation lending being amajor growth area.
Trade policy has been a frequent compo-nent of programs supported by the Interna-tional Monetary Fund (IMF). In April 2004concerns about the balance of paymentsimpacts of trade policy changes motivated theintroduction of the Trade Integration Mech-anism. Although the core of the IMF’s man-date involves support for orderly externaladjustment in the face of shocks, the mecha-nism provides added assurances and repre-sents the first explicit attempt to helpmembers adjust to shocks that emanate frommultilateral trade liberalization. The mecha-nism is designed to help mitigate the statedconcerns (by many developing countries) thatimplementation of WTO agreements mightgive rise to temporary balance of paymentsshortfalls—through the erosion of tariff pref-erences, adverse changes in the terms of trade
of net food importers, or expiration of quo-tas following full implementation of theWTO Agreement on Textiles and Clothing. InJuly 2004 Bangladesh became the first mem-ber to obtain support from the Trade Inte-gration Mechanism, followed in January2005 by the Dominican Republic.
These activities reflect the growing recog-nition that trade-related reforms and infra-structure—both hard and soft—can have highrates of return in increasing economic growthrates. Realizing an ambitious Doha Roundand addressing trade capacity priorities inpoor countries calls for more to be done. Notonly will the associated trade and relatedreforms give rise to adjustment costs, but toenhance the benefits for poor households inpoor countries, as argued previously, invest-ments are needed to facilitate trade, lowertransport costs, link farmers and producers tomarkets, and improve productivity. Strength-ening “aid for trade” mechanisms to pursuethis agenda would help improve the develop-ment relevance of both the WTO and regionalintegration agreements. An expanded alloca-
C H A P T E R 4
144 G L O B A L M O N I T O R I N G R E P O R T 2 0 0 5
0
200
400
600
800
1000
1200
0.0
0.5
1.0
1.5
2.0
2.5
3.0
3.5
4.0US$ billions US$ millions
Approvedand
projectedFY 2004–6
ApprovedFY 1996–2003
Approvedand
projectedFY 2004–6
ApprovedFY 1996–2003
1049
304
3.8
2.4
Total trade lending(left axis)
Trade facilitation component(right axis)
FIGURE 4.11 Bank trade-related lending
Source: The data comes from the Bank’s Business Warehouse, which consolidates information recordedin SAP and other Bank Systems.
tion of aid for trade would also help build sup-port for the gradual elimination of discrimi-natory tariff preferences. Indeed, such supportis likely to be a precondition for attaining anambitious Doha outcome that benefits alldeveloping countries.
In considering options for expandingfinancial support for trade adjustment andintegration, two issues are particularly perti-nent: the “additionality” of aid resources andthe operational framework through whichadditional funds are made available. Addi-tionality may be achieved by recognizing thatthe Doha Round, especially an ambitiousone, will generate substantial gains for theworld as a whole, and that much of thesegains will accrue to developed countries. Thepotential gains create an opportunity fordonor countries to consider transferring anincrement of the net gain from trade liberal-ization to help address adjustment costs andimprove trade capacity in developing coun-tries. Various options could be considered inthis connection, in addition to more officialdevelopment assistance and stronger public-private partnerships: a commitment to trans-fer a proportion of the tariff revenuecurrently collected on imports from develop-ing countries, capturing some of the con-sumer gains resulting from lower agriculturalsupport for specific products, or partial real-location of current subsidies and income sup-port to development assistance.53 In all suchcases explicit earmarking of additional fund-ing for trade is not desirable—instead thegoal would be to establish a framework tocommit to redistributing some of the gainsfrom global trade reforms.
The operational framework for allocatingaid for trade must ensure harmonization ofdonor efforts (bilateral and multilateral) andplace assistance for trade reform, adjustment,and competitiveness within the broad contextof a country’s development program. Theattention given to the trade and investmentagenda in a country’s national developmentstrategy depends on many factors. Whethertrade capacity and trade policy reforms shouldbe given greater priority is a decision for gov-
ernments. To determine this requires thattrade be considered when designing nationaldevelopment and poverty reduction strategies.Progress has been made in this direction andcontinues to be pursued, but much more canbe done to better integrate trade considera-tions into this process. Equally important,demands for funding to address trade andsupply capacity constraints need to be met bythe donor community in instances where tradeis considered a priority and requests for assis-tance have been put on the table.
The institutional mechanism to identifypriorities and allocate additional aid for tradecould build on the Integrated Framework forTrade-Related Technical Assistance. Thismechanism has already been established,piloted, and subjected to external evaluation,and has broadly based donor and recipientsupport. The framework is a unique collabo-rative venture between 6 multilateral agen-cies—the IMF, International Trade Centre,United Nations Conference on Trade andDevelopment, United Nations DevelopmentProgramme, WTO, and World Bank—17bilateral donors, and LDC governments. Theprimary objective is to integrate assistance inalignment with national development strate-gies and priorities (including poverty reduc-tion strategies), based on diagnostic countrystudies and national consultations. Demandfor the framework’s trade assessments ishigh—14 LDCs have completed the assess-ments and another 14 are under way orplanned.54
Progress in subsuming the IntegratedFramework’s recommendations into countrygrowth strategies has been slower than antic-ipated. Without additional assistance, overtime, legitimate questions can be raisedabout the efficacy of the program in provid-ing a more effective enabling process of inte-gration with the global trading system. Thededicated resources associated with the Inte-grated Framework have been limited tosmall-scale technical assistance. Funding fortrade priorities is considered in the context ofthe poverty reduction strategy resource allo-cation and prioritization process, with donor
R E A L I Z I N G T H E D E V E L O P M E N T P R O M I S E O F T R A D E
G L O B A L M O N I T O R I N G R E P O R T 2 0 0 5 145

assistance (grants) complemented by loansand other support from international finan-cial institutions and regional developmentbanks. While that should continue to be thecase, the Integrated Framework could beused more extensively to both bolster thetrade capacity of poor countries and helpaddress the adjustment costs from an ambi-tious Doha Round. To do so, considerationshould be given to expanding the frame-work’s reach beyond LDCs to include otherlow-income countries and consider regionaltrade cooperation priorities. (In Africa, forexample, members of regional integrationinitiatives span both LDCs and non-LDCs.)Given the strong case for additional fundingto meet trade adjustment and integrationcosts, building on the Integrated Frameworkcould improve aid effectiveness in the tradearea and ensure that identified trade priorityprojects are implemented.
Leveraging Regional Integration as a Tool for Development
Regional agreements among neighboringdeveloping countries can help lower tradetransaction costs and remove policy barriersto intraregional trade. Achieving this is par-ticularly important for landlocked economiesthat must transport goods through neighbor-ing countries. The agenda extends beyondtariffs and nontariff barriers imposed at bor-ders—it includes regulatory cooperation andjoint provision of infrastructure to facilitatetrade. South-South integration can also playa beneficial role in helping to create the pre-conditions for agglomeration, clustering, andthe linkages that are critical in diversifyingproductive activities and sustaining growth.
In Africa in particular, there is a strongregional dimension to growth, absorptivecapacity, and the widening of the economicspace needed to lower infrastructure costsand facilitate trade. This goes well beyond thetrade agenda narrowly defined and includesimproving natural resource management andincreasing energy supplies and reliability. Interms of absorptive capacity, regional inte-
gration provides a means to increase aid flowsin order to open markets and enhance growthprospects in developing countries. Some poorAfrican countries are too small to raise sav-ings for investment on their own, improvegrowth given limited national markets, oreffectively absorb large aid flows for infra-structure. A regional strategy—such as thatforeseen by the New Partnership for Africa’sDevelopment (NEPAD), revolving aroundimproving policies and governance and devel-oping regional programs for groups of coun-tries to cooperate on infrastructure (power,roads, transportation)—can do much toincrease the capacity of the countries con-cerned to effectively use greater aid flows. Asdiscussed in a number of recent studies,55 nar-row trade agreements between developingcountries have limited potential to foster eco-nomic growth, because preferential liberal-ization of trade policies offers substantialscope for costly trade diversion. For regionalintegration to be beneficial, external barriersmust be low.
North-South agreements can help provideboth a focal point for behind-the-bordertrade reforms in developing countries andmechanisms through which to engage stake-holders and policymakers in the design andimplementation of reforms. Because theyrequire trade liberalization by their develop-ing country members, such agreements canalso help reduce trade diversion created bySouth-South agreements among the countriesconcerned. They also create more opportuni-ties for economic benefits to be realized givenlarger Northern markets and higher incomelevels.
Preferential trade agreements revolvearound trade discrimination: this is an explicitobjective. Because global developmentprospects are best served by nondiscrimina-tion,56 from a development perspective thebest outcome would be if regional agreementspromoted the principle of nondiscrimination.Achieving this is a major challenge given thatthe driving force of trade agreements is in partmercantilist—improving (preferential) accessto markets. This specific challenge is an illus-
C H A P T E R 4
146 G L O B A L M O N I T O R I N G R E P O R T 2 0 0 5

tration of a more general one: to change themodus operandi of designing and implement-ing trade agreements to place development(economic efficiency and equity) considera-tions more at the center of deliberations.
Agreements that the European Union andUnited States are negotiating with developingcountries can do much good if designed in away that puts development first. The ongoingEconomic Partnership Agreement (EPA)negotiations are the most important in termsof scale and country coverage, but Japan, theUnited States, and other large traders are alsonegotiating agreements with other developingcountries.57 Taking development seriously insuch negotiations has a number of implica-tions, including identifying the most appropri-ate form of, and membership in, counterpartregional arrangements, addressing trade bar-riers with neighboring countries, and identify-ing actions to reduce trade costs—somethingof great importance for landlocked coun-tries.58 Perhaps most important in the contextof EPAs and Africa is to avoid trade diversioncosts and attenuate tariff revenue losses asso-ciated with a move to reciprocal free tradewith the European Union.59 If African,Caribbean, and Pacific partner countriesmaintain current levels of protection againstthe rest of the world, the effect of moving tofree trade with the European Union will be totransfer part of what is now collected in rev-enue on imports to EU producers in the formof higher prices. This points to the importanceof complementing reciprocal liberalizationwith reductions in external barriers to trade,as well as effective assistance to facilitate tradeand improve services and related behind-the-border regulation. Pursuit of nondiscrimina-tory tariff liberalization by developingcountries where such barriers are still signifi-cant would be better than full preferential lib-eralization relative to the developed partneronly. Many Sub-Saharan African countriesstill rely on import duties for a significant por-tion of government receipts, so revenue con-cerns and the ability to implement alternativerevenue sources are a factor influencing thespeed of liberalization.
The policy agenda confronting developingcountries at the regional level is similar tothat at the multilateral level: in both casesmuch of the challenge is to use these instru-ments to help address specific national andforeign trade constraints. A major differenceis that in the case of regional agreements,reducing external barriers is important toreduce trade diversion. Another difference isthat in the case of North-South agreementsthere may be significant development assis-tance commitments associated with theimplementation of agreements. Allocatingand channeling such aid for trade through amultilateral mechanism—such as the Inte-grated Framework—would ensure explicitrecognition that the trade agenda is (andshould be) largely a national, country-specificone, and that technical and financial assis-tance should be directed toward trade-relatedareas identified as priorities by countries.
Notes1. WTO and OECD (2004).2. World Bank (2001).3. In 2003 shares in global GDP for all LDCs,
African LDCs, all low-income countries, andAfrican low-income countries were 0.5, 0.3, 3.4,and 0.6 percent, respectively.
4. The measure of concentration reportedhere is the Herfindahl-Hirschmann index (the sumof squared shares).
5. World Bank (2004a).6. World Bank (2004a) provides a compre-
hensive discussion of the ongoing proliferation ofregional trade agreements.
7. These are reportedly specific taxes, not advalorem, and thus imply an incentive to upgradequality (produce higher-value products). Thesetaxes may seem low, but because they apply to allexports (not just exports to restricted markets),they are significant.
8. In a case brought by Australia, Brazil, andThailand against the EU sugar regime, a WTO dis-pute settlement panel ruled that a number ofaspects of EU sugar policy violated WTO rules,including on export subsidies. African, Caribbean,and Pacific countries opposed the case on the basisthat reforms in the EU regime would erode exist-ing preferential access arrangements.
R E A L I Z I N G T H E D E V E L O P M E N T P R O M I S E O F T R A D E
G L O B A L M O N I T O R I N G R E P O R T 2 0 0 5 147

9. The OTRI belongs to the family of traderestrictiveness indexes developed by James Ander-son (Boston College) and Peter Neary (UniversityCollege, Dublin) for the World Bank in the early1990s. A welfare-based measure was originallydeveloped in Anderson and Neary (1994, 1996);an import volume-based measure was first definedin Anderson and Neary (2003). The OTRI is atheoretically well-grounded measure of protec-tion. It does not suffer from the well-known draw-backs of simple or import-weighted tariffaverages, and allows the effects of both tariffs andnontariff measures to be estimated. The method-ology used for the measure comprises four steps.First, import demand elasticities by country andby product are estimated at the 6-digit level of theHarmonized System (HS) of commodity classifi-cation (some 4,200 product categories). Second,an estimate is made of the impact on imports,again at the 6-digit HS level, of core nontariff bar-riers (quotas, nonautomatic licensing, minimumprices, and similar policies), measures of a regula-tory nature (particularly technical, product-specific regulations, and sanitary and phytosani-tary measures), and domestic support granted toagriculture. Third, using these demand elasticityand impact estimates, the product-level ad val-orem equivalent of the nontariff measures andagricultural subsidies is calculated for each coun-try in the sample. Finally, tariffs and ad valoremequivalents of nontariff policies at the productlevel are aggregated to produce an overall mea-sure of trade restrictiveness. The index is calcu-lated bilaterally for every country and its partners.The OTRI calculations use the most recent mea-sures of applied preferential tariffs—both recip-rocal and nonreciprocal—as well as ad valoremequivalents of specific tariffs. In both instances thesource of these data is the Centre d’EtudesProspectives et d’Informations Internationales(CEPII, France). It is assumed that tariff prefer-ences are fully utilized by eligible countries andthat any associated rents accrue to the exportingcountries. As discussed below, however, in prac-tice a significant share of such rents often accruesto the countries providing preferential access.
10. The statistical robustness of these relation-ships is not strong, especially for own trade restric-tiveness imposed on imports. Removing just asmall number of (outlier) countries results in therelationship either disappearing or becoming anegative association—that is, more protection isassociated with less poverty. The relationship
between OTRIs on exports and poverty is stronger(both the coefficient and its statistical significance).
11. See Nicita (2004c) on Mexico and Porto(2003) on Argentina, as well as the Africa-specificwork summarized below. Hertel and Winters(2005) contains a review of recent evidence.
12. That is, 32 percent of the gross receipts offarmers were generated by transfers from con-sumers and taxpayers (OECD 2004).
13. Relative to the Global Monitoring Report2004, the OTRIs reported here are higher onaverage due to the inclusion of information onmandatory product standards. These were notincluded in last year’s report due to an absence ofdata for EU members in the UNCTAD TRAINSdatabase. Such data were collected in preparationfor this report. Detailed information, includingOTRIs by country that use tariff data only, andwelfare-based measures of trade restrictiveness,can be found at www.worldbank.org/trade; clickon Data & statistics.
14. See Sykes (1995).15. Whether the intent of these measures is pro-
tectionism or based on sound scientific evidence isan important question, but one that is difficult toaddress. Does the ban on hormone beef imports orrestrictions on genetically modified food productsin Europe have a protectionist element? Is the banon Iberico ham “pata negra” or on some types ofFrench epoisse cheese in the United States protec-tionist? Are they legally and scientifically defensi-ble on health grounds? The answers to thesequestions will clearly vary depending on whichside of the Atlantic they are asked, influenced byrisk perceptions and attitudes of those whoanswer, regulatory requirements, and so on. TheOTRI simply measures the impact that these poli-cies have on imported quantities and prices.
16. It is not possible to make clear-cut distinc-tions in the data between discriminatory and reg-ulatory measures. Even so-called core nontariffbarriers identified in the UNCTAD database—such as nonautomatic licensing—may be used as ameasure to enforce regulatory requirements.
17. This comprises trade as defined by the WTOGeneral Agreement on Trade in Services (GATS).
18. These preference regimes generally targetthe LDCs, which are a subset of the broader low-income group. Note also that many African coun-tries are not LDCs.
19. As discussed below, this conclusion regard-ing the relative impact of subsidies on global pricesis supported by both partial and general equilibrium
C H A P T E R 4
148 G L O B A L M O N I T O R I N G R E P O R T 2 0 0 5

analysis. See Hoekman, Ng, and Olarreaga (2004);Anderson, Martin, and van der Mensbrugghe(2005); and Hertel and Keeney (2005).
20. Argentina is an example of a country thatis significantly affected by OECD agricultural sub-sidies—they account for about half of the OTRI itconfronts in the EU market.
21. Minot and Daniels (2002).22. Baffes (2004).23. Sumner (2005).24. Anderson, Martin, and van der Mensbrug-
ghe (2005); Hertel and Keeney (2005).25. For example, Walmsley and Winters (2003)
conclude that allowing inflows of service suppliers(natural persons) equivalent to 3 percent of thelabor force would generate global (static) gains ofmore than $300 billion. Estimates of global gainsfrom deep liberalization that include induced pro-ductivity effects and services liberalization exceed$1 trillion (Anderson 2004a; Anderson, Martin,and van der Mensbrugghe 2005) and range to upto $2.1 trillion (Brown, Deardorff, and Stern2003). The extent to which such gains can be real-ized depends on complementary actions beingtaken to improve the investment climate and busi-ness environment so as to allow factors of produc-tion to be allocated to their most productive uses,markets to clear, and so on. This “behind-the-bor-der” complementary agenda will require invest-ment and is an area where development assistancecan play an important role in allowing countries tocapture the potential dynamic gains from trade.
26. Anderson, Martin, and van der Mensbrug-ghe (2005).
27. Hoekman, Ng, and Olarreaga (2004); Her-tel and Keeney (2005, table 2.7).
28. Anderson, Martin, and van der Mensbrug-ghe (2005).
29. The potential loss can be reduced by requir-ing any product with a bound tariff in excess of 200percent to be reduced to the cap rate. See Anderson,Martin, and van der Mensbrugghe (2005).
30. Sumner (2005); Baffes (2004).31. Hoekman, Nicita, and Olarreaga (2005).32. Based on estimates reported in Francois,
van Meijl, and van Tongeren (2005).33. This is larger than the $80 billion found by
Hertel and Keeney (2005) using a static computablegeneral equilibrium (CGE) model and the latestGTAP database (which also includes preferences)because of the greater disaggregation of products.
34. Anderson, Martin, and van der Mensbrug-ghe (2005).
35. WTO (2004).36. These are mostly confidential; only some
countries have derestricted them. 37. Nicita (2005).38. Balat, Brambilla, and Porto (2004).39. Balat, Brambilla, and Porto (2004).40. Nicita (2004b).41. Regarding cereal and particularly rice,
which are largely produced and consumed inMadagascar, predicted price increases followingan ambitious Doha Round would have mostlyneutral effects from a poverty perspective becausethe poorest households are both producers andconsumers of rice. An increase in the price of ricewould likely produce a redistribution of incomebetween geographic areas, with rural areas bene-fiting at the expense of urban areas. Given thatMadagascar is a net importer of rice (althoughonly 7 percent of consumption is imported), anincrease in the price of rice would have a smallnegative effect on overall welfare.
42. Similar conclusions emerge from otherLDC country case studies undertaken as back-ground research for the MDG taskforce report ontrade (Soloaga 2004), as well as a number of recentcountry cases collected in Hertel and Winters(2005).
43. Previous reports, including the GlobalMonitoring Report 2004, have argued that tradehas significant potential to help achieve povertyreduction and support higher growth rates. Asnoted in those reports, however, trade offers anopportunity, not a guarantee. Realization of sig-nificant reductions in poverty rates is dependent onfunctioning markets, linking farmers to markets,and so forth. Dealing with the complementary“behind-the-border” and investment climateagenda is critical.
44. OECD (2005).45. The Global System of Trade Preferences
(GSTP) was established in 1988 as a frameworkfor negotiations aimed at the exchange of tradepreferences. It is based on (differentiated) reci-procity—that is, is not unilateral.
46. Recent research suggests that rules of origingenerate costs on the order of 3–5 percent of thevalue of the goods (Brenton 2003; Anson and oth-ers 2003). Given that many MFN tariffs in OECDcountries are less than these levels, this has obvi-ous implications for the effective value of tariffpreferences. Candau, Fontagne, and Jean (2004)find that underutilization is highest in textiles andclothing (for EU imports under both the Global
R E A L I Z I N G T H E D E V E L O P M E N T P R O M I S E O F T R A D E
G L O B A L M O N I T O R I N G R E P O R T 2 0 0 5 149

System of Preferences and Everything But Armsprograms). In the case of the Everything But Armsinitiative, exporters in principle benefit from 100percent duty-free access, but are found to pay upto 6.5 percent average tariffs. The authors also findthat the utilization of trade preferences is lowerwhen the preferential margin is small, suggestingthat compliance costs (rules of origin) are a factor.
47. See Olarreaga and Özden (2004) on theAfrica Growth and Opportunity Act, Özden andSharma (2004) on the U.S. Caribbean Basin pref-erence program, and Tangermann (2002) on agri-cultural preferences in general.
48. Stevens and Kennan (2004).49. IMF (2003) estimates the potential loss
from preference erosion resulting from a 40 per-cent cut in protection in the Quad at 1.7 percentof total LDC exports. However, individual LDCsmay suffer bigger losses due to the concentrationof their exports in products that enjoy deep pref-erences. Of these, Cape Verde, Haiti, Malawi,Mauritania, and São Tomé and Príncipe are themost vulnerable to preference erosion. The total(aggregate) value of export revenue that wouldbe lost by LDCs as a whole is estimated at some$530 million—similar to the $600 million figurefound by Limão and Olarreaga (2005). Thisassumes that preferences are fully utilized andthat developing countries get all the associatedrents, so this is an upper bound. Alexandrakiand Lankes (2004), focusing on middle-incomecountries, conclude that potential erosionimpacts are less than 2 percent of total exportsfor countries that are most “preference depen-dent.” Six countries—Belize, Fiji, Guyana, Mau-ritius, St. Kitts and Nevis, and St. Lucia—wouldbe significantly affected, with predicted export
declines ranging from 7.8 percent for Fiji to 11.5percent for Mauritius.
50. Winters (2004).51. WTO and OECD (2004).52. Examples mentioned in WTO and OECD
(2004) include a regional trade facilitation programof the United Kingdom that aims to increase tradingopportunities for small-scale farmers and tradersthrough the development of common standardsacross goods and services and the streamlining ofcustoms procedures in Southern Africa. Anotherexample is France’s regional program that aims todevelop “fair trade” in Africa. Increases in tradedevelopment activities have centered on regionalprograms, such as an International DevelopmentAssociation (IDA) credit to assist the development ofpower exports between Southern African countriesand an EU multisector small and medium-size enter-prise development project in Latin America.
53. Hoekman (2005a); Prowse (2005).54. For information on the Integrated Frame-
work and the status of its activities, go towww.integratedframework.org.
55. Schiff and Winters (2003); World Bank(2004a).
56. World Bank (2004a).57. World Bank (2004a).58. These issues are discussed at greater length
in Hinkle and Newfarmer (2005) in the specificcase of the EPAs. For example, the form ofAfrican, Caribbean, and Pacific agreements is anissue because a customs union—the preference ofthe European Union—may be difficult to imple-ment given overlapping regional agreements inAfrica and the need to develop revenue sharingmechanisms.
59. Hinkle and Schiff (2004).
C H A P T E R 4
150 G L O B A L M O N I T O R I N G R E P O R T 2 0 0 5

Developed countries can help develop-ing countries achieve the MillenniumDevelopment Goals (MDGs) by pro-
viding more and better aid. Developmentassistance can ease the short- and medium-term resource constraints facing poor coun-tries, enabling them to make much-neededinvestments in infrastructure and social ser-vices. In many low-income countries, espe-cially in Sub-Saharan Africa, aid dominatesexternal development flows. Accordingly,these countries are particularly dependent onhigher levels of assistance if they are toachieve the MDGs—and are more vulnerableto aid shortfalls. The issue that arises iswhether aid can be scaled up effectively incountries that need it most. Low-incomecountries that implement sound economicpolicies, strengthen institutions, and pursuegood governance can absorb additional aidrapidly and effectively.
How aid is allocated and delivered is asimportant as its volume for achieving theMDGs. Aid is more effective in fosteringgrowth and improving service delivery incountries with better policies and institutions.It is also more effective when it is aligned withrecipients’ priorities, when it reduces transac-tion costs through harmonized and coordi-nated donor processes, when it is predictable,and when there is a clear focus on results.
As a result of the 2002 United NationsConference on Financing for Development inMonterrey, Mexico, donors committed toproviding more—and more effective—aid.What progress has been made? The recoveryin official development assistance (ODA) thatstarted in 2001 is continuing, but recent lev-els and near-term projections fall far short ofwhat is needed to meet the MDGs. Amongmembers of the OECD’s Development Assis-tance Committee (DAC), ODA as a share ofnational income remains low relative to the1990s and before. Moreover, much of therecent increase in bilateral ODA reflectsdonor concerns about regional and globalsecurity. Donor attention to geopoliticallysignificant countries appears to be crowdingout assistance to countries that need the mosthelp in achieving the MDGs. A better balanceis needed between poverty reduction andother donor objectives. Aid policy shouldreflect the growing recognition that reducingpoverty and human deprivation is perhapsthe most effective way of promoting long-term peace and security.
Although the proportion of aid going toSub-Saharan Africa is rising, much morecould be done. On average, ODA equaled 6.2percent of recipients’ GNI in the region in2003—high relative to other regions, butbelow the levels of the early 1990s. Most of
G L O B A L M O N I T O R I N G R E P O R T 2 0 0 5 151
Increasing Aid and ItsEffectiveness
5

the $8.5 billion nominal increase in bilateralODA to Sub-Saharan Africa between 2001and 2003 was in the form of debt relief; pro-gram and project assistance grew by just $0.6billion. While debt relief helps relieve prob-lems associated with heavy debt burdens andcreates fiscal space, it is not enough. Substan-tial increases in program and project financ-ing are needed as developing countries scaleup their efforts to achieve the MDGs. Sub-Saharan countries have seen a decline in ODAfor infrastructure and rural and agriculturaldevelopment. Investments in these countries’social sectors have also been inadequate (seechapter 3). Large shortfalls in financing forthese sectors—which are key to spurringgrowth and scaling up MDG-related ser-vices—point to the need for much higherODA.
Discussions continue on proposals to aug-ment higher aid flows with innovative financ-ing mechanisms, such as the InternationalFinance Facility, global taxes, voluntarymechanisms, and blending arrangements.The International Finance Facility, proposedby the U.K. Treasury, is designed to frontloadaid flows in the short term to help reach theMDGs. In addition, a wide range of propos-als has been made on ways to raise additionalresources through new global tax instru-ments. If technical and political challengescan be resolved, global taxes could comple-ment the International Finance Facility, gen-erating additional aid funds in the medium tolong term, when flows under the facilitywould diminish.
Policies and institutions in developingcountries continue to improve, promoting abetter enabling environment for scaling upaid. Although low-income countries as agroup can effectively absorb much more aid,the amount varies by country. A number ofcountries could manage a doubling of assis-tance in the short to medium term, but capac-ity constraints pose a significant obstacle incountries with weak policies and institutions.In all cases a country-specific approach,anchored in a poverty reduction strategy(PRS) framework, is required to assess exter-
nal financing needs, identify and addresscapacity constraints, and appropriatelysequence incremental financing. Absorptivecapacity is a dynamic concept, so even thoughcapacity may be limited today, it can be builtover time—and aid can play an importantrole in that as well.
Donors are allocating more aid to betterperformers—those with stronger policies andinstitutions—and to poorer countries. Butthere is considerable variation among donors,and some large donors are not very selectiveon these dimensions. A sharper performance-based focus by these donors could strengthenthe overall quality of aid. Increasing attentionis being paid to the special needs of difficultpartnership countries (including low-incomecountries under stress), which receive less aidthan predicted by their policy and institu-tional environments and poverty levels. Thusa modest increase in aid to this group mightbe possible without compromising the per-formance basis of aid. Recent evidence alsosuggests that well-coordinated and appropri-ately sequenced and directed aid can be effec-tive in supporting the recovery of countriesfrom conflict and from situations of excep-tionally weak policies and governance.Appropriate and adequate support for capac-ity building is a priority in these situations.
Progress on harmonization and alignmenthas been mixed, and that on managing forresults is just beginning. The 2003 High LevelForum on Harmonization in Rome and the2004 Roundtable on Managing for Develop-ment Results in Marrakech strengthened thefocus on aligning donor assistance with recip-ients’ national strategies and priorities asarticulated in PRSs or equivalent nationalstrategy documents, harmonizing donorprocesses and procedures with those of part-ner countries, and managing aid programsfor development results. Yet efforts to imple-ment good practices in these areas have beenslow and uneven. Progress on harmonizationand alignment is most evident in countrieswhere governments have worked longest andhardest to take ownership of the aid process.Some early progress on managing for results
C H A P T E R 5
152 G L O B A L M O N I T O R I N G R E P O R T 2 0 0 5

is also evident, as the development commu-nity moves toward implementing the resultsagenda. Participants at the March 2005 HighLevel Forum on Aid Effectiveness in Parisreaffirmed their commitment to the globalagenda on harmonization, alignment, andresults. The forum’s Paris Declaration defines12 indicators for monitoring reforms of aiddelivery and management.
The potentially large financing needs asso-ciated with the MDGs pose a challenge tolow-income countries in maintaining sustain-able debt positions. The enhanced HeavilyIndebted Poor Countries (HIPC) initiativehas lowered debt burdens for participatingcountries: 27 countries have reached theirdecision points and are receiving debt relief,and 15 of these have reached their completionpoints—when creditors provide the fullamount of debt relief committed at the deci-sion points. Nevertheless, continued mea-sures are needed by HIPCs and their creditorsto ensure that financing the MDGs will notlead to excessive buildup of new debt. Thisissue of debt sustainability is not limited toHIPCs; it extends to other low-income coun-tries with existing or prospective debt pres-sures. The World Bank and InternationalMonetary Fund (IMF) are developing a for-ward-looking debt sustainability frameworkfor low-income countries that incorporatessystematic analysis of the evolution of keydebt burden indicators (under baselineassumptions and in the event of plausibleshocks) and that establishes indicative thresh-olds for these indicators, based on the qualityof a country’s policies and institutions. Inaddition, G-7 members have recently offereda number of new proposals, beyond the HIPCinitiative, for debt relief to low-income andhighly indebted countries.
Looking ahead, there are numerous prior-ity areas for action on aid:
• Donors need to implement their post-Monterrey commitments and substantiallyraise and extend them beyond 2006—say,to 2010—with a view to at least doublingODA in the next five years. While several
countries have committed to expandingaid efforts beyond 2006, half of DACmembers have not, including some of thelargest donors. They should do so in 2005.
• PRSs should provide the framework forscaling up aid—assessing financing needs,identifying and addressing capacity con-straints, and appropriately sequencingincremental financing. Where absorptivecapacity is an obstacle to scaling up, aidcan still be effective by focusing on build-ing capacity and improving service deliv-ery through innovative mechanisms.
• Donors need to further sharpen their focuson providing aid to better-performingpoor countries. For their part, recipientcountries should expedite efforts toenhance their capacity to make effectiveuse of incremental aid flows.
• Donors need to address more effectivelythe special needs of difficult partnershipcountries (including low-income countriesunder stress), exerting greater efforts tobetter coordinate, align innovatively, andsequence aid.
• Progress on implementing the harmoniza-tion, alignment, and managing for resultsagenda should be accelerated. Bottlenecksto progress—captured in the 12 indicatorsdefined by the Paris Declaration—need tobe addressed by donor and partner coun-tries, and continued focus at the highestlevels in these countries will be required toaccelerate change. Developing countriesneed to take more ownership of the aidharmonization and alignment process.And donors need to encourage and sup-port this process, especially through capac-ity building.
• On debt relief, continued effective imple-mentation of the HIPC initiative remainskey. On proposals for additional debtrelief for poor countries with heavy debtburdens that are pursuing crediblereforms, efforts should be made to reachclosure in 2005. Additional debt reliefshould not cut into the provision of needednew financing, which for these countriesshould primarily be in the form of grants.
I N C R E A S I N G A I D A N D I T S E F F E C T I V E N E S S
G L O B A L M O N I T O R I N G R E P O R T 2 0 0 5 153

aid commitments.1 Development assistanceincreased by 5 percent in real terms in 2003,down from 7 percent in 2002. Taking intoaccount exchange rate movements and infla-tion, which accounted for nearly $8 billion ofthe increase, nominal ODA rose by almost$11 billion in 2003, to $69 billion. Prelimi-nary OECD DAC estimates indicate that netODA rose to $78.6 billion in 2004; theincrease in real terms was much smaller—to$72.2 billion (at 2003 prices and exchangerates). If announced aid commitments aredelivered, ODA is expected to grow by nearly30 percent in real terms between 2003–6 andcould rise to more than $100 billion by 2010(figure 5.1).2 Several countries have commit-ted to higher aid efforts beyond 2006, the tar-get date for the commitments made at theMonterrey conference, but some of the largestdonors have not done so.
Despite the progress in expanding ODAsince Monterrey, donors’ aid efforts lagbehind those of the early 1990s and before.3
At 0.25 percent in 2003, ODA as a share ofdonors’ average gross national income (GNI)was three-quarters the level in the 1970s,1980s, and early 1990s, and only about halfthe level in the 1960s.4 Five countries—Den-mark, Luxembourg, the Netherlands, Nor-way, and Sweden—have achieved ODAshares of 0.7 percent of GNI or more (figure5.2), and six—Belgium, Finland, France, Ire-land, Spain, and the United Kingdom—haveannounced timetables for achieving that level.Implementation of such pledges will be vitalto raising aid flows to poor countries; the tar-get of $5 billion in annual assistance by fiscal2006 under the U.S. Millennium ChallengeAccount is now unlikely to be reached untilfiscal 2007 (box 5.1). Even on announcedpledges, DAC donors’ aid effort is expected toreach only 0.3 percent of GNI by 2006 and0.32 percent by 2010, below the level of theearly 1990s. Among the actions being consid-ered by the European Commission is the set-ting of new—and higher—interim targets forODA relative to members’ GNI for the periodbeyond 2006, with the goal of reaching thetarget of 0.7 percent as soon as possible.5
C H A P T E R 5
154 G L O B A L M O N I T O R I N G R E P O R T 2 0 0 5
2003 US$ billions Percent
0
20
40
60
80
100
120
0
0.30
0.25
0.20
0.15
0.10
0.05
0.35
1990 2000
ODA as percent of donors’ GNI(right axis)
Total ODA (left axis)
0.25
0.300.32
Total ODA to Sub-Saharan Africa
1995 2005 2010
DAC members’ net ODA: 1990–2003 and prospects for 2006 and 2010
FIGURE 5.1 ODA is rising but is well short of what is needed; donorsneed to raise their post-Monterrey commitments andextend them beyond 2006
Source: OECD 2005a.Note: Prospects for ODA in 2006 and 2010 are based on DAC members’ post-Monterreyannounced commitments. Not all DAC members have made commitments beyond 2006.
Recent Trends in AidDespite positive trends, donors’ recent aidefforts lag those of the early 1990s. And thoughdonor commitments announced at and afterthe Monterrey conference point to the prospectof higher aid, far more is needed. Moreover,much of the recent increase in developmentassistance reflects donors’ strategic concerns.Only a modest amount is available in cash andmore flexible forms to meet countries’ financ-ing requirements for the MDGs. Thus far moreaid is needed to meet the MDGs, and a betterbalance is needed between donors’ povertyreduction and other objectives.
As with overall ODA, flows to Sub-SaharanAfrica have been rising. Aid dwarfs other sourcesof foreign financing for the region, underscoringits importance. Still, a major increase in aid willbe required if the region is to achieve the MDGs.
Aid—Rising But Insufficient for MDG Needs
The recovery in ODA that started in 2001 isholding as donors deliver on post-Monterrey

G L O B A L M O N I T O R I N G R E P O R T 2 0 0 5 155
2520
2003 US$ billionsPercent
151050
Sweden
France
Netherlands
Norway
Denmark
Belgium
Switzerland
Ireland
Finland
Portugal
Greece
New Zealand
Austria
Australia
Canada
Luxembourg
United Kingdom
Italy
Germany
United StatesJapan
Spain
10.9
2003 2006
0.80.70.60.50.40.30.20.1
Sweden
France
Netherlands
Norway
Denmark
Belgium
Switzerland
Ireland
Finland
Portugal
Greece
Canada
Austria
New Zealand
DAC total
Luxembourg
United Kingdom
Italy
Germany
Japan
Australia
United States
Spain
Net ODAODA/GNI
ODA as a percent of donor GNI and ODA volumes: 2003 and prospects for 2006
FIGURE 5.2 Wide variation in donor effort
Source: OECD DAC database.
The Millennium Challenge Account (MCA) is a new bilateral aid mechanism, announced by theUnited States at the Monterrey conference and established in January 2004. It allocates new U.S.aid to poor countries based on their performance in three policy areas: governing justly, investingin people, and promoting economic freedom. To date, 17 countries are eligible to apply for MCAassistance. In addition, a threshold program encourages policy reform by offering 13 other coun-tries help in areas where they fall short of qualifying for the MCA.
MCA-eligible countries identify their own priorities and develop their own MCA proposals,based on their assessments of the greatest barriers to their development and in consultation withcivil society and the private sector. The Millennium Challenge Corporation evaluates MCA pro-posals based on their potential for reducing poverty through sustainable economic growth. The pro-posals are not restricted to any particular sector or area. MCA countries join with the MillenniumChallenge Corporation in multiyear compacts to achieve shared development objectives. The com-pacts identify the responsibilities of each partner and contain clear objectives, benchmarks to mea-sure progress, procedures to ensure fiscal accountability for the use of MCA assistance, and plansfor effective monitoring and objective evaluation of results. Programs are designed to enableprogress to be sustained after funding under the compacts has ended.
The initial target envisioned $5 billion in annual assistance under the MCA by fiscal 2006. TheU.S. administration’s fiscal 2006 budget request of $3 billion doubles the 2005 appropriation andenvisions expansion of MCA funding to $5 billion in fiscal 2007. The Millennium Challenge Cor-poration approved the first MCA compact in March 2005, with Madagascar (providing nearly $110million for a four-year project), and disbursements are expected to begin in spring 2005.
Source: Millennium Challenge Corporation 2003, 2005.
BOX 5.1 The U.S. Millennium Challenge Account—poised to deliver
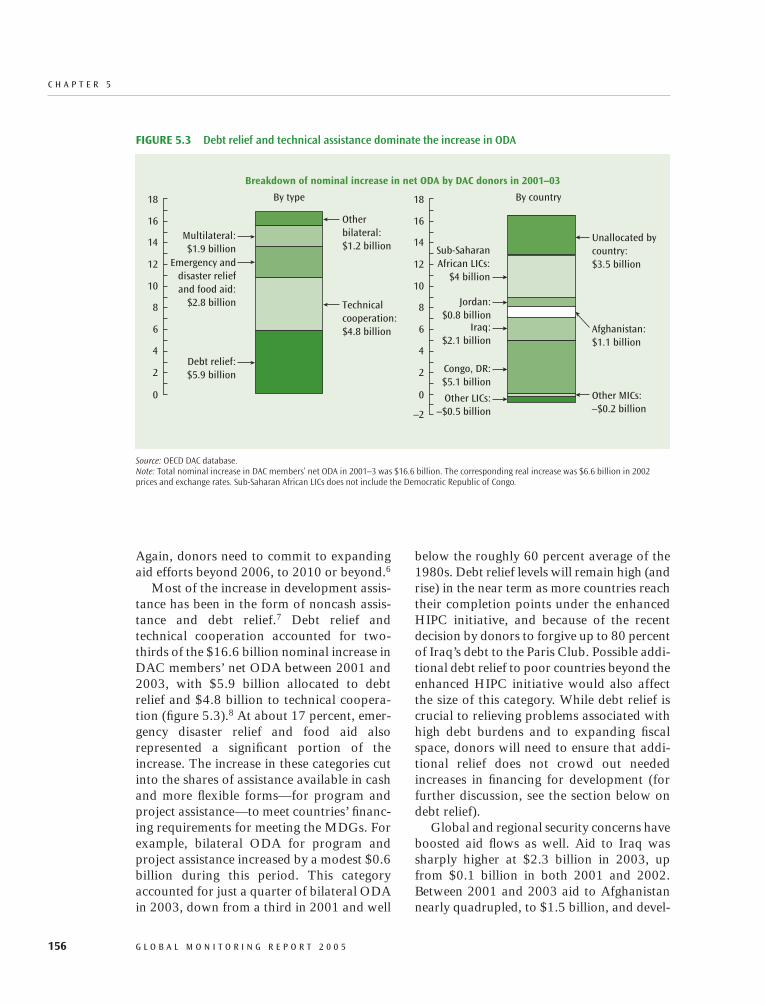
C H A P T E R 5
156 G L O B A L M O N I T O R I N G R E P O R T 2 0 0 5
Debt relief:$5.9 billion
Technical cooperation:$4.8 billion
Emergency anddisaster reliefand food aid:
$2.8 billion
Other bilateral: $1.2 billion
Multilateral:$1.9 billion
By type By country
Congo, DR:$5.1 billion
Other MICs:–$0.2 billion
Jordan:$0.8 billion
Unallocated bycountry: $3.5 billion
Other LICs:–$0.5 billion
Iraq:$2.1 billion
Afghanistan:$1.1 billion
Sub-SaharanAfrican LICs:
$4 billion
18
16
14
12
10
8
6
4
2
–2
0
18
16
14
12
10
8
6
4
2
0
Breakdown of nominal increase in net ODA by DAC donors in 2001–03
FIGURE 5.3 Debt relief and technical assistance dominate the increase in ODA
Source: OECD DAC database.Note: Total nominal increase in DAC members’ net ODA in 2001–3 was $16.6 billion. The corresponding real increase was $6.6 billion in 2002prices and exchange rates. Sub-Saharan African LICs does not include the Democratic Republic of Congo.
Again, donors need to commit to expandingaid efforts beyond 2006, to 2010 or beyond.6
Most of the increase in development assis-tance has been in the form of noncash assis-tance and debt relief.7 Debt relief andtechnical cooperation accounted for two-thirds of the $16.6 billion nominal increase inDAC members’ net ODA between 2001 and2003, with $5.9 billion allocated to debtrelief and $4.8 billion to technical coopera-tion (figure 5.3).8 At about 17 percent, emer-gency disaster relief and food aid alsorepresented a significant portion of theincrease. The increase in these categories cutinto the shares of assistance available in cashand more flexible forms—for program andproject assistance—to meet countries’ financ-ing requirements for meeting the MDGs. Forexample, bilateral ODA for program andproject assistance increased by a modest $0.6billion during this period. This categoryaccounted for just a quarter of bilateral ODAin 2003, down from a third in 2001 and well
below the roughly 60 percent average of the1980s. Debt relief levels will remain high (andrise) in the near term as more countries reachtheir completion points under the enhancedHIPC initiative, and because of the recentdecision by donors to forgive up to 80 percentof Iraq’s debt to the Paris Club. Possible addi-tional debt relief to poor countries beyond theenhanced HIPC initiative would also affectthe size of this category. While debt relief iscrucial to relieving problems associated withhigh debt burdens and to expanding fiscalspace, donors will need to ensure that addi-tional relief does not crowd out neededincreases in financing for development (forfurther discussion, see the section below ondebt relief).
Global and regional security concerns haveboosted aid flows as well. Aid to Iraq wassharply higher at $2.3 billion in 2003, upfrom $0.1 billion in both 2001 and 2002.Between 2001 and 2003 aid to Afghanistannearly quadrupled, to $1.5 billion, and devel-

opment assistance to Jordan tripled. Pakistanreceived large amounts of net aid in 2001 and2002 (about $2 billion a year), but loan repay-ments on previously rescheduled debt lowerednet flows in 2003. In addition, the DaytonPeace Accord countries—Bosnia and Herze-govina, Croatia, and Serbia and Montene-gro—continue to receive large amounts of aid,averaging $2.2 billion a year in 2001–3.
Non-DAC countries contribute significantassistance to developing countries, with suchflows reaching $3.4 billion in 2003, or 5 per-cent of DAC ODA—more than twice the levelin 2001.9 Saudi Arabia continued to be thelargest donor in this group; its ODA contri-butions jumped from less than $500 million in2001 to $2.4 billion in 2003. Other non-DACcountries have also rapidly increased theirODA. For example, the Czech Republic morethan tripled its development assistance duringthis period, providing $91 million in 2003.
Important contributions to developmentefforts in poor countries are also being madethrough South-South cooperation, particu-larly through the sharing of experience andknow-how. Comprehensive data on South-South development assistance are not avail-able, but countries such as Brazil, China, andIndia have been particularly active in provid-ing technical assistance to low-income coun-tries.10 South-South assistance is expected togrow as these larger economies continue torecord impressive economic and technologi-cal advances. Grants from nongovernmentalorganizations (NGOs), using their ownresources, also continue to rise. These grantstotaled $10.1 billion in 2003, up from $8.8billion in 2002, and are expected to besharply higher in the aftermath of the recentAsian tsunami.
Although multilateral ODA—comprisinggrants and net concessional lending—hasgrown in recent years, total multilateral flowsto developing countries have declined. Multi-lateral ODA grew by 7 percent in nominalterms between 2001 and 2003, with highergrants offsetting a decline in net concessionaldebt flows. Nonconcessional lending by mul-tilaterals, mostly to middle-income countries,
has exhibited considerable variation—reflect-ing less nonconcessional borrowing from theIMF, repayments on past crisis financingpackages, and prepayments of loans to theWorld Bank.
Because of rising incomes in developingcountries, higher aid volumes have translatedinto only a modest rise in the share of ODAin recipients’ GNI. Indeed, in 2003 this shareis only slightly above the low of 1997 and isexpected to remain in a narrow rangethrough 2006. The weight of aid in recipients’economies is largest in Sub-Saharan Africa,averaging 6.2 percent of GNI in 2003—atleast four times that in other regions, signal-ing the importance of aid for Africa (figure5.4). Globally, per capita ODA edged up inrecent years, averaging about $14 in 2003,though this was below the level of the early1990s. Again, there was wide regional varia-tion, with Sub-Saharan Africa receiving themost ODA per capita.11
Improving Trend in DevelopmentAssistance to Sub-Saharan Africa
Mirroring the recovery in overall ODA,development assistance to Sub-SaharanAfrica has begun to rise from its substantialslide of the 1990s. In real terms, aid to theregion is higher now than in the early 1990s.The region is also receiving a larger share ofnet ODA (disbursements): At about $24 bil-lion, its share of total ODA was 33 percent in2003, up from 27 percent in 2000. Most aidto the region is in the form of grants—bilat-eral donors provide nearly all their assistanceas grants, and multilateral net ODA consistsof highly concessional loans (60 percent) andgrants (40 percent). In 2001–3 the UnitedStates and the International DevelopmentAssociation (IDA) were the largest donors toSub-Saharan Africa (with the U.S. sharesharply higher in 2003, at 20 percent), fol-lowed by France and the European Commis-sion (figure 5.5). Several bilateral donors,such as Belgium, France, Ireland, Italy, andPortugal, allocate more than half of theirbilateral net ODA to Sub-Saharan Africa.
I N C R E A S I N G A I D A N D I T S E F F E C T I V E N E S S
G L O B A L M O N I T O R I N G R E P O R T 2 0 0 5 157

While the positive trend in devel-opment assistance to Sub-SaharanAfrica is encouraging, the increase inaid provided in cash and more flexi-ble forms—program and projectassistance—has been rather modest.Most of the $8.5 billion increase innet bilateral ODA to the regionbetween 2001 and 2003 was in theform of debt relief ($5.6 billion) andemergency and disaster relief andfood aid ($1.5 billion).12 The increasein program and project assistance (incash) was only about $0.6 billion.
The increase in total ODA—bilat-eral and multilateral—to the regionwas concentrated in a handful of coun-tries. The Democratic Republic ofCongo received an additional $5.1 bil-lion (most of it for debt relief opera-tions), Cameroon $480 million, Sudan$436 million, Tanzania $398 million,and Ethiopia $389 million.13 Othercountries in the region received about$2.5 billion. Although the amount of
aid allocated to social services has grown, thatto infrastructure and rural and agriculturaldevelopment has steadily declined.
C H A P T E R 5
7
6
5
4
3
2
1
0Sub-
SaharanAfrica
Sub-SaharanAfrica
Europe&
CentralAsia
Europe&
CentralAsia
EastAsia&
Pacific
EastAsia&
Pacific
MiddleEast&
NorthAfrica
MiddleEast&
NorthAfrica
SouthAsia
SouthAsia
LatinAmerica
& theCaribbean
LatinAmerica
& theCaribbean
Percent35
30
25
20
15
10
5
0
US$ODA/GNI
Size of ODA in recipients’ economies (2003)
ODA per capita
FIGURE 5.4 Dependence on aid varies by region and is highest in Sub-Saharan Africa
Source: OECD DAC database.
France 11%
United Kingdom 6%
Germany 6%
Other bilateral 28%
EuropeanCommission
11%
IDA 13%
Other multilateral
9% United States 15%
Average share for 2001–3
FIGURE 5.5 Sub-Saharan Africa’s largest donors
Source: OECD DAC database.Note: The shares may not add to 100 because of rounding.
158 G L O B A L M O N I T O R I N G R E P O R T 2 0 0 5

Although aid to Sub-Saha-ran Africa is rising, muchmore will be needed to sup-port its efforts to achieve theMDGs. Again, ODA averages6.2 percent of recipients’GNI, and while this is highrelative to other regions, it iswell below the levels of theearly 1990s and the estimatedneeds to meet the MDGs.There is also large variationin aid flows across Sub-Saha-ran countries. A handful ofcountries, such as Mozam-bique and Sierra Leone, havevery high aid to GNI ratios.Indeed, in one-sixth of 42countries in the region, bilat-eral ODA is equal to morethan 10 percent of GNI. Yetin almost as many that shareis less than 1 percent. In 1990the corresponding distribu-tion was nearly 40 percent and 2 percent,respectively.
ODA accounts for nearly 55 percent offoreign financial flows to Sub-Saharan Africa(figure 5.6), up from the levels of the late1990s.14 Foreign direct investment (FDI) isalso a significant source of external financefor the region. In 2003 FDI was equal to 2.5percent of GNI for Sub-Saharan countries,larger than the share for low-income coun-tries (1.5 percent) and slightly higher than theaverage for all developing countries (2.3 per-cent). FDI is concentrated in a few large,resource-rich economies, with more than halfgoing to Angola, Nigeria, and South Africa in2001–3. In 2003 remittance flows to theregion equaled just 1.5 percent of GNI.15
Remittances are also concentrated in a fewcountries, with Kenya, Nigeria, and Sudanreceiving almost 55 percent of these flows in2001–3.
Most Sub-Saharan countries have limitedprospects for attracting FDI. While manycountries have gone through tough reformsto liberalize their economies, promote macro-
I N C R E A S I N G A I D A N D I T S E F F E C T I V E N E S S
G L O B A L M O N I T O R I N G R E P O R T 2 0 0 5 159
All developing countries excludingSub-Saharan Africa ($331 billion)
Other private 14% Remittances
13%
FDI 22%
Other private 16%
Remittances 33%
FDI 43%
Official flows50%
Sub-Saharan Africa($45 billion)
Official flows9%
FIGURE 5.6 Official flows are the main source of external finance for Sub-Saharan Africa,twice as large as FDI and nearly four times as large as remittancesFinancial flows (long-term), 2003
Sources: OECD DAC database; World Bank data and staff estimates.Note: Official flows include ODA and non-ODA. Although remittances are classified as current transfers in the balance ofpayments, they are an increasingly important source of foreign exchange for developing countries and are includedhere as financial flows. Also included are NGO grants, which are current transfers. The shares may not add to 100because of rounding.
economic stability, and rationalize taxes andtariffs, much remains to be done. FDI isstrongly influenced by a country’s investmentclimate—and among developing countries,those in Africa have the most regulatoryobstacles to doing business.16
African countries perform especiallypoorly on the costs of starting a business,enforcing contracts, registering property,and labor regulation flexibility. The costs ofa weak investment climate can be substan-tial. Data from investment climate surveysshow that in terms of sales lost, such costsare two to three times larger in Kenya, Tan-zania, and Zambia than in Brazil andChina. The composition of these costsvaries dramatically across countries: inKenya and Tanzania weak infrastructureservices are particularly burdensome, whilein Zambia bribes are especially costly. Thuspriority areas for reform also vary by coun-try. Other country features, such as smallsize and geographic location (especiallybeing landlocked), are further constraints toattracting FDI.

Sub-Saharan countries need to acceleratereforms to enhance their investment climates.They also need to scale up investments inbasic infrastructure. Over time, such changeswill attract more FDI. But in the near tomedium term, increases in ODA will remaincritically important for the region.
Innovative Financing Mechanisms toAugment Traditional Aid
In the absence of sufficient traditional ODA,innovative financing mechanisms may berequired to increase aid flows. Several pro-posals are under discussion.17
I N T E R N A T I O N A L F I N A N C E F A C I L I T Y
The International Finance Facility (IFF) is aproposal designed to frontload aid flows inthe short term to help countries reach theMDGs. Donors would make off-budgetpledges of future increases in aid commit-ments. The IFF would use the pledges asbacking to issue AAA-rated bonds. Bond pro-ceeds would be channeled through existingaid programs. Over time the IFF would drawdown the donor pledges to pay off its bonds.Future aid budgets would thus be used to sup-port aid disbursements as and when they areneeded in the short term.
Technical aspects of the IFF proposal arebeing addressed through a pilot IFF forImmunization (IFFIm). This pilot facilitywould raise frontloaded, reliable fundingover a number of years to expand globalimmunization efforts to help achieve the childmortality MDG.18 The IFFIm would largelyrely on the governance structures and coun-try programs of the Global Alliance for Vac-cines and Immunization (GAVI) and theVaccine Fund.
The frontloaded IFFIm funds would beused for two main purposes: accelerating pro-duction of new and existing vaccines, to stim-ulate private investment and competition andto reduce vaccine costs more rapidly than ifthere were no scaling up; and strengtheningcapacity to deliver vaccines to save children’slives immediately, reduce the risk of disease,
and support other health interventions byimproving public health infrastructure.
The IFFIm is intended to be a small IFF,and if successful would serve as proof of con-cept for some aspects of the larger IFF: thecapacity to garner donor support for such amechanism, resolution of issues on the fiscaltreatment of contingent donor pledges, andacceptance of IFF-generated AAA bonds byrating agencies and capital markets.
G L O B A L T A X E S
A wide range of proposals has been made onways to raise additional revenue through theintroduction of global tax instruments. Globaltax proposals should be judged by their rev-enue adequacy and stability, efficiency, equity,ease of collection, and minimum coalitionsize. Additionality must also be considered:allocating the proceeds of a tax to develop-ment spending may partially or completelydisplace spending from traditional sources. Inaddition, detailed aspects of implementationhave received relatively little attention.
Increasing international attention on howto move forward on specific mechanisms maylead to more focused work on promisingalternatives. One possibility recently put for-ward in the European Union would be aninternational airline fuel tax, which wouldaddress two externalities: the environmentaldamage caused by air transportation and thefailure of international tax coordination inthat airline fuel, unlike any other fuel, is gen-erally untaxed. Such a tax could raise some$9 billion a year, if levied globally at a rate of$0.20 a gallon. As another example, it hasbeen estimated that a tax on arms sales couldraise $2.5–5.0 billion a year.19 If technicaland political difficulties can be resolved,global taxes could complement the IFF, gen-erating additional aid funds in the medium tolong term as IFF flows, designed to increasedevelopment funds in the short term, dimin-ish while its bonds are being repaid.20
V O L U N T A R Y C O N T R I B U T I O N S
Private contributions to finance developmentare increasing. They are made in a range of
C H A P T E R 5
160 G L O B A L M O N I T O R I N G R E P O R T 2 0 0 5

ways that could be expanded, encouraged,and made more effective without impingingon their voluntary and private nature. Somemechanisms, such as the establishment of“affinity” credit cards that provide fundingfor development through voluntary sur-charges, could be undertaken by interestedbanks or companies. Others, such as the cre-ation of a special-purpose global lottery orpremium bond, would require regulatoryaction by participating countries, either uni-laterally or acting in concert. Given the rela-tive lack of clear, consistent global data aboutthese flows, the international communitycould benefit from a more systematic workprogram to explore what governments can doto encourage private and voluntary flows fordevelopment, and to foster their effectivechanneling and use in support of developingcountries’ priorities.
B L E N D I N G A R R A N G E M E N T S
Blending arrangements—that is, combiningflows with different financial terms and charac-teristics (such as grants, loans, and guarantees)to increase concessionality or gain leverage—are a possible way to augment resources for theMDG agenda, fund global and regional publicgoods, and address individual country circum-stances, such as creditworthiness constraintsaffecting gap countries.21 Blending mechanismscould be structured in a variety of ways to pro-vide different types of funding based on countryand program circumstances.
The Need for—and Challengesof—Increasing AidCurrent and near-term projections of develop-ment assistance fall far short of what is neededto meet the MDGs. Although recent estimatesof the additional resources needed to achievethe MDGs vary widely, they all point to a sig-nificant financing gap (box 5.2). At the con-servative end of these estimates, ODA mustincrease by at least $50 billion a year, with theincreases phased in alignment with growth inrecipients’ absorptive capacity. The UN Mil-lennium Project projects the additional exter-
nal assistance needed to directly support theMDGs in low-income countries at $73 billionin 2006, rising to $135 billion by 2015.22
Financing the MDGs and other needs wouldrequire nearly tripling net ODA. Because cost-ing the MDGs is difficult, there is much debateon the amounts needed to achieve them.23 Still,there is broad agreement that current develop-ment assistance is insufficient and that sub-stantially more aid is needed.
At current trends, most developing countrieswill fall far short of achieving the MDGs forhealth and education. The financing needs formeeting these goals are large relative to avail-able domestic resources, and significantlyhigher aid will be needed to fill the financinggap. Adequate progress by developing coun-tries on the health goals, where projected short-falls are greatest, will require at least $25 billiona year in additional aid. Additional aid require-ments for meeting the primary education goalin low-income countries are estimated to be atleast $3 billion a year (see chapter 3).
Developing countries also need to addressserious gaps in infrastructure.24 Annual spend-ing on infrastructure—electricity, transport,telecommunications, water, and sanitation—isabout 3.5 percent of GDP in these countries,against estimated needs of about 5.5 percent toreach the MDGs. The shortfall in infrastruc-ture financing is worse in poorer countries. Forexample, Sub-Saharan Africa needs to doubleannual infrastructure spending from 4.7 per-cent to 9.2 percent of GDP (see chapter 2).Ethiopia shows just how large the infrastruc-ture gap is: In 2001 its road density was 0.029kilometers per square kilometer of land—about a quarter of the average for low-incomecountries. Scaling up Ethiopia’s road densityby a factor of three, as part of a strategy toaccelerate progress toward the MDGs, wouldcost some $7.2 billion over 2005–15. Thisamount is more than three times what invest-ment would be if current trends continued.Clearly, many low-income countries do nothave sufficient domestic resources or access toglobal financial markets to finance suchinvestment.25 More aid will be critical to accel-erating provision of infrastructure.
I N C R E A S I N G A I D A N D I T S E F F E C T I V E N E S S
G L O B A L M O N I T O R I N G R E P O R T 2 0 0 5 161

C H A P T E R 5
162 G L O B A L M O N I T O R I N G R E P O R T 2 0 0 5
The UN Millennium Project (2005) conducted detailed MDG-based needs assessments for five low-income countries—Bangladesh, Cambodia, Ghana, Tanzania, and Uganda. In Ghana, for example,per capita expenditure needs are projected at $80 in 2006, rising to $124 by 2015. The bulk of suchspending will have to come from external financing: $52 in 2006 and $70 in 2015. (During thisperiod domestic resource mobilization is expected to rise by about 4 percentage points of GDP.) Theassessments for the other low-income countries suggest similar external financing needs: $40–$50per capita in 2006, rising to $77–$98 in 2015. The study projects the MDG financing gap in low-income countries to be $73 billion in 2006, rising to $135 billion in 2015. The gap in middle-incomecountries is projected to be $10 billion a year. Meeting the MDGs and other needs in low- and mid-dle-income countries implies additional ODA over 2003 levels of $66 billion in 2006 and $126 bil-lion in 2015—a nearly threefold increase in net ODA by 2015. This implies that the share of ODAin donors’ GNI will be 0.44 percent in 2006, rising to 0.46 percent in 2010, and reaching 0.54 per-cent by 2015.
Several other studies have tried to place a figure on the global cost of meeting the MDGs. Thesewere discussed in detail in the Global Monitoring Report 2004, so their results are only summa-rized here. The range of estimates varies widely, but most point to the need to increase ODA by atleast $50 billion.
The Commission for Africa (2005) estimates that achieving the MDGs in Sub-Saharan Africawill require $75 billion a year in additional financing. Two-thirds of the increase ($50 billion) wouldcome from external sources. The Commission recommends proceeding in two stages. In the firststage an additional $25 billion a year would be required within three to five years (2006–2008/10)—doubling aid to Sub-Saharan Africa over 2004 levels. Implementation of the second stage would bebased on an assessment of the improvements in governance and aid quality achieved in the firststage.
Estimates of additional ODA requirements vary widely
Study Estimate of additional annual ODA required to meet the MDGs
UNMP (2005) Increase over 2003 of $66 billion in 2006, $83 billion in2010, and $126 billion in 2015
Development Committee (2003, 2004) Initial increment of at least $30 billion (for MDGinvestment needs), rising to more than $50 billion
United Nations (2001) About $50 billion (to directly support the MDGs)
Commission for Africa (2005) For Sub-Saharan Africa, $25 billion (doubling ODA)within 3–5 years, and $50 billion by 2015
BOX 5.2 Estimates of MDG financing needs vary widely, but all point tothe need for a major increase
Recent evidence suggests that aid canboost growth if it is invested well, say, ininfrastructure.26 A cross-country study alsofinds that aid that directly supports invest-ment has a positive influence on growth.27
Thus budget support, balance of paymentssupport, and investment in infrastructureand productive sectors like agriculture
appear to have a positive impact on growthin the short term. Aid to social sectors alsocontributes to growth, but its impact islonger term. Importantly, the case for moreaid to education and health, apart from its“narrow” contribution to economic growth,derives from its impact on the nonincomedimensions of poverty.

Absorptive Capacity Constraints to Scaling Up Aid
Scaling up of development assistance will beeffective only if poor countries have adequatecapacity to absorb more aid. Capacity con-straints to effective absorption of resourcescan manifest themselves at a number of lev-els—from national policy and public budgetmanagement to local service delivery—and invarious ways—including macroeconomicmanagement, institutional capacity, infra-structure, human capital, social, and culturalfactors. But not all constraints are equallybinding; some can be eased in the near term,while others may take longer.28 Constraintsrelated to the labor market (such as the sup-ply of skilled health and education serviceproviders) and the quality of governance (cor-ruption) might take more time to resolve,while issues such as weak public expendituremanagement can be overcome more readily.29
Moreover, changes can be mutually reinforc-ing, with improvements in one area serving asa catalyst in others. All these aspects implythat sequencing is central to capacity build-ing: Interventions across the range of con-straints should be prioritized, and publicinvestments aligned with those priorities.
The complex, dynamic nature of capacitybuilding points to the need for country-spe-cific approaches to identifying, analyzing,and addressing capacity constraints. Box 5.3provides a preliminary assessment of Ethiopia’sability to achieve the MDGs and of labor,macroeconomic, and infrastructure con-straints to resource absorption. The modelingframework used helps capture country- andsector-specific constraints (such as skilledlabor shortages), cross-effects from investingin related MDGs, and the role of sequencinginvestment. The simulation results show thatit will be possible for Ethiopia to achieve theMDGs if aid (grants) roughly doubles (as ashare of GDP) by 2015. They also help illus-trate key absorptive capacity constraints, lim-its to frontloading of disbursements, and theimportance of careful sequencing of increasesin aid and associated investments.
An Improving Environment for Aid Absorption
The policy and institutional environment indeveloping countries has steadily improved inrecent years, creating a better environmentfor scaling up aid. In addition to pursuingsound macroeconomic policies and betterpublic sector management, developing coun-tries have strengthened institutions, improvedgovernance, pursued wide-ranging structuralreforms, and adopted policies of social inclu-sion and equity. The overall improvement inpolicy frameworks and institutional perfor-mance has contributed to faster growth inthese countries. The average quality of poli-cies and institutions, as measured by theWorld Bank’s Country Policy and Institu-tional Assessments (CPIAs), has risen over thepast five years. Although improvements insome areas (such as institutions and publicsector management) have lagged those in oth-ers, the overall upward trend is widespread.In tandem, output growth has more thandoubled over the average rate of the 1990s,with low-income regions such as South Asiaand Sub-Saharan Africa seeing much strongergrowth.30
A 2003 Development Committee reportassessed the capacity of 18 well-performinglow-income countries to effectively use moreaid to achieve the MDGs. It found that the fivelarge Asian countries in the sample(Bangladesh, India, Indonesia, Pakistan, Viet-nam) could absorb an immediate doubling ormore of aid. Some Sub-Saharan countries(such as Ethiopia and Madagascar) could,with substantial policy reforms, also absorb adoubling of aid. Overall, the Sub-Saharancountries in the sample were found to have thecapacity to use additional aid productively ifthey continued and strengthened reforms. Ofcourse, there was considerable variation inabsorptive capacity across countries.
The UN Millennium Project recommendsidentifying well-governed low-income coun-tries as fast-track countries that could receivelarge increases in assistance.31 Existing perfor-mance-based criteria—such as being eligible to
I N C R E A S I N G A I D A N D I T S E F F E C T I V E N E S S
G L O B A L M O N I T O R I N G R E P O R T 2 0 0 5 163

164 G L O B A L M O N I T O R I N G R E P O R T 2 0 0 5
Government policies and the flow of foreign aid required to reach the MDGs have strong econo-mywide effects that, through markets for labor, goods, services, and foreign exchange, feed back onthe MDG targets. Measuring and projecting MDG costs and achievements must therefore be basedon an economywide approach that complements in-depth sector studies. To examine these macro-micro linkages for Ethiopia—a very poor country for which the MDGs pose enormous challenges—a model has been calibrated to country data to capture select macro and sector-specific constraints.Simulations of progress toward the MDGs are possible that reflect, in particular, labor market, infra-structure, and macroeconomic constraints.
Projections of income poverty levels through 2015 under three scenarios are shown in the fig-ure. The first scenario is a continuation of present trends. Annual GDP growth follows the trendrate over the past decade (3.6 percent), external aid increases marginally (by 1.5 percent a year)above the current level ($16 per capita), and there is modest investment in physical infrastructure.Under this scenario Ethiopia will fall significantly short on all the MDGs, with poverty falling mod-estly—from its current 35 percent to 29 percent—and weak progress toward the other goals.
The second scenario adds public investment in basic infrastructure (roads, other transport,energy, irrigation), which is considered critical to growth. Infrastructure investment is frontloaded,growing by 10 percent a year until 2009 and 5 percent a year thereafter, reflecting network effects.Without this investment, Ethiopia cannot reach the first MDG of halving income poverty. The net-work effects from improved infrastructure enable returns to private sector activities—worker pro-ductivity, agricultural yields, and so on—to rise over time. Such investment would require a 15percent increase in foreign grants relative to the base case. Productivity gains would help boostannual GDP growth to nearly 5 percent after 2009, and poverty reduction would be accelerated,falling to 22 percent by 2015.
Under the third scenario, investments in public services are set at the levels required to achievethe core human development MDG targets—universal primary education completion, two-thirds
BOX 5.3 Addressing absorptive capacity in Ethiopia
40
35
30
25
20
152002 2003 2004 2005 2006 2007 2008 2009 2010 2011 2012 2013 2014 2015
Base Base-infrastructure Meeting MDGs
MDG 1: Share of population living on $1 (PPP) per day or less
Percent
Projected income poverty in Ethiopia, 2003–15 (Headcount index)
Note: The projections use the Ethiopia Maquette for MDG Simulation (MAMS) model, parameterized using data from the Ethiopianpoverty assessment (World Bank 2005a).

G L O B A L M O N I T O R I N G R E P O R T 2 0 0 5 165
reduction in under-five mortality, three-quarters reduction in maternal mortality, and halving thepopulation share without access to improved water and sanitation services. This scenario requiresa gradual but substantial increase in foreign grants, rising to around $60 per capita, or about 40percent of GDP, by 2015—roughly twice current aid as a share of GDP.
These scenarios illustrate several key points. It is possible to achieve the MDGs—providedthere is adequate external grant financing, and expansion of MDG-related services is accompa-nied by investment in basic infrastructure to raise growth. Additional aid is essential. Relying ondomestic resources to finance such investment would reduce income growth, lower householdconsumption, and deepen poverty, even though some of the human development MDGs might beachieved. Investment in basic infrastructure is key to supporting economic expansion. Withoutbetter growth performance, income poverty goals will not be achieved. In the short run thisrequires improving physical infrastructure, whereas investing in human development has a longer-term impact on growth.
This framework helps illustrate the important role of absorptive capacity and the lags inherentin expanding capacity. Consider investing to achieve the second MDG—universal primary educa-tion completion by 2015. Ethiopia currently has about 75,000 teachers and a student-teacher ratioof 75:1. To meet the goal with an unchanged student-teacher ratio, more than 52,000 additionalteachers will need to be trained and deployed by 2015—while as many as 160,000 more teacherswould be required for a much-needed reduction in the ratio to 40:1. Recruiting teachers will requireincreasing the supply of skilled labor—a gradual process with a lagged response—or raising realwages to hire skilled labor away from alternative uses. But raising wages to attract skilled laborraises the costs of public services, draws skilled labor from the private sector, and crowds out pri-vate growth.
Constraints to absorptive capacity are also evident in the macroeconomic impact of higher aidflows. Aid permits a larger trade deficit and increases the demand for goods and services. This putsupward pressure on the exchange rate and reduces the competitiveness of both exports and import-competing goods. Over time this may shift the economy away from production for export, make itmore dependent on aid, and reduce growth (often called the “Dutch disease”). In the third scenarioabove, which requires roughly a doubling of aid to GDP by 2015, the real exchange rate appreci-ates and leads to shrinkage of the export sector. But if public investment made possible by aidincreases productivity and removes constraints to growth, this potential drag on output can be off-set. This underscores the importance of well-targeted investment and policy measures to offset thesecosts—particularly improvements in the business environment and trade reforms that improve mar-ket access and reduce behind-the-border barriers to export productivity.
The importance of investment sequencing is another lesson from these simulations. Priority mustbe placed on basic infrastructure investment because of its key role in raising the underlying growthrate and achieving network productivity effects. At the same time, investments must proceed inhuman services that address binding constraints—such as education to ease skilled labor con-straints—and where production lags require earlier attention. Priority should also be given to invest-ments that generate positive externalities and lower costs. Investments in water and sanitation, forexample, accelerate improved health outcomes.
There are also implications for the pace of investing in the MDGs. Frontloading infrastructureinvestment helps accelerate growth through productivity gains. But frontloading expenditures onsocial and other MDG services runs into absorptive capacity constraints relatively quickly. Realwages rise, the exchange rate appreciates, and growth is compromised. Simulations suggest that forEthiopia the cost-minimizing share of spending on MDG social services over the first five years isabout one-fifth of total expenditures by 2015 (in present value terms) to meet goals related to theseservices. Note, however, that this calculation ignores the welfare gains of accelerated service deliv-ery due to frontloading.
Finally, improved governance and institutional capacity are crucial to effective delivery of pub-lic (and private) services. Both strengthen absorptive capacity and can greatly reduce the costs ofimproving service delivery over time.
Sources: Bourguignon and others 2004, 2005; Lofgren 2004.

apply for assistance under the U.S. Millen-nium Challenge Account, having reachedthe completion point under the HIPC initia-tive, or participating in the African PeerReview Mechanism (APRM) of the NewPartnership for Africa’s Development(NEPAD)—could be used to assign fast-track status to countries.
As the relevance of the poverty reductionstrategy (PRS) approach continues to grow,the enabling environment for growth andpoverty reduction is expected to improve fur-ther. In low-income countries Poverty Reduc-tion Strategy Papers (PRSPs) provide thestrategic and operational framework for pro-grams and policy reforms to promote growthand reduce poverty. The papers are now alsobroadly viewed as the key operational vehiclefor achieving the MDGs. By the end of Feb-ruary 2005, 47 countries had prepared fullPRSPs, and 12 others had prepared interimPRSPs.32 Of these, 33 were Sub-Saharancountries. Solid progress has been achieved inmany aspects of the PRS approach, but a keychallenge going forward is to deepen imple-mentation on the ground. (See chapter 1 forfurther discussion of the PRS process andrelated agenda.)
Countries are paying more attention toimproving public expenditure management,which is key for effective aid use. By strength-ening such systems, public resources can bealigned better with development priorities,and budget processes can be made moretransparent. Many countries have made orare planning significant changes in publicexpenditure management, and country strate-gies increasingly include measures to enhanceit.33 Sustained government commitment andstrong, well-coordinated donor assistancecan boost progress on strengthening publicexpenditure management capacity.
P O V E R T Y R E D U C T I O N S T R A T E G I E S A N DB U D G E T S : P R O G R E S S I N D E L I V E R I N GA I D I N S U B - S A H A R A N A F R I C A
Several recent studies have reviewed budgetsin highly aid-dependent countries to assesshow PRSs have helped improve aid delivery.
The studies have found that the PRS processhas fostered improvements, though there ismuch room for further progress.34
Uganda saw foreign aid increase by nearly5 percentage points of GDP between 1997/98and 2001/02. The increase came in the formof budget support, with 60 percent in grantsand the rest in concessional loans. Untiedbudget support was provided through WorldBank Poverty Reduction Support Credits(PRSCs)—a series of annual credits support-ing a three-year rolling reform program—andgrants from other donors.35 This approachmade the overall budget envelope more pre-dictable and helped boost service delivery,especially to poor people.36 Between 1998/99and 2002/03 the ratio of actual disburse-ments to amounts initially programmed rosesteadily, from less than 40 percent to morethan 85 percent. During this period devia-tions in budget outturns and allocations nar-rowed, with the discrepancy index fallingfrom nearly 10 percent to 5.5 percent.37 Inaddition, the share of the budget allocated tothe Poverty Action Fund more than doubled,from 17 percent in 1997/98 to 37 percent in2002/03.
In Tanzania foreign assistance more thandoubled during 1999–2003, and donors nowfinance about 90 percent of the country’sdevelopment budget.38 Increases in donorfinancing were associated with increases inpriority sector spending.39 With PRS imple-mentation, government spending on prioritysectors increased continuously, and by fiscal2002 such spending exceeded ODA (figure5.7). But donor funding still exceeds spendingon core priority areas, implying that there isscope for sharpening donor focus on theseareas. As donors align with national priori-ties, there is also scope to better integratetheir support with the budget.40 Aid contin-ues to be highly variable, and though thisvariability has declined in recent years, it stillexceeds that of domestic revenues. Within-year variability of aid flows is substantial aswell.
In Burkina Faso, with foreign assistancecomprising 40 percent of the budget, donor
C H A P T E R 5
166 G L O B A L M O N I T O R I N G R E P O R T 2 0 0 5

alignment with national priorities is crucialto successful implementation of the PRS. Aidis increasingly aligned with priority sectors,as evidenced by the narrowing gap betweenODA and spending on priority sectors andcore priority areas (see figure 5.7).41 Never-theless, the gap between development assis-tance and spending on core priority areasremains high, at about 4 percentage points ofGDP in 2002—implying that aid is beingspent on noncore priority areas. Since thecountry’s PRS was developed, donors havebeen shifting the composition of aid towardbudget support. As a result program loansand grants increased from 2.6 percent ofGDP in 1998 to 4.0 percent in 2002, whileproject loans and grants fell from 8.5 percentof GDP to 6.6 percent. The in-year variabil-ity of aid is large, however: During1996–2000 about 60 percent of aid dis-bursements were in the last quarter of theyear. This bunching of assistance, which isusually not synchronized with the budgetcycle, makes it difficult for the country tofinance its budget effectively. Receiving funds
at the beginning of the fiscal year would con-tribute to better public expenditure manage-ment. Gaps between PRS projections andactual expenditures can be both large andvariable. Gaps in primary education expen-diture are in part due to a shortfall in foreignfinancing—that is, a gap between projectedand actual financing. When foreign financinghas been late or postponed, this is reflected ina gap between PRS projections and actualexpenditures. When foreign financing hasbeen delivered as projected, this gap is rela-tively small.
C O U N T R Y S T U D I E S O N S C A L I N G U P
Development efforts are being scaled up atthe national, state, and community levels.The Shanghai conference on scaling uppoverty reduction, held in May 2004, show-cased a broad range of successful countryinterventions to reduce poverty and expandaccess to health, education, water, and otherkey services (box 5.4). These experiencesreinforce some of the factors shown by otherevidence as common to successful scaling
I N C R E A S I N G A I D A N D I T S E F F E C T I V E N E S S
G L O B A L M O N I T O R I N G R E P O R T 2 0 0 5 167
9
8
7
6
5
4
3
2
1
0FY99 FY00 FY01 FY02
Priority sectorsTotal ODA Core priority areas
14
12
10
8
6
4
2
01998 1999 2000 2001 2002
Tanzania
Official development assistance and spending on priority sectors and core priority areas (as a percentage of GDP)
Burkina FasoPercent Percent
FIGURE 5.7 Higher development assistance is increasingly supporting and catalyzing more spending in priority areas
Source: Alonso and Utz 2004; Alonso 2004.

up: institutional and policy change; innova-tion, learning, and adaptation; politicalleadership and sustained commitment; part-nership with all stakeholders (which is keyfor service delivery); and a supportive exter-nal environment.
In sum, emerging country evidence, recentresearch, a better understanding of how toaddress absorptive capacity constraints,prospects for continuing favorable trends inpolicies and institutions, and a stronger focuson governance all show that countries haveincreased, and continue to increase, theircapacity to absorb aid productively. Still,prospects vary by country. Many low-incomecountries are well positioned to absorb a scal-ing up of aid. But in some, especially difficultpartnership countries, absorptive capacitycan be a significant obstacle to scaling up, andinnovative ways of channeling aid areneeded. In all cases a country-specific
approach anchored in the PRS (or a jointneeds assessment, such as the UN–WorldBank Post-Conflict Needs Assessment, andresults-based framework, such as the Transi-tional Results Matrix, a multidonor andnational stakeholders’ coordination andmonitoring tool for difficult partnershipcountries) is required to assess financingneeds, identify and address capacity con-straints, and appropriately sequence incre-mental financing and investment.
Making Aid More EffectiveThe way aid is allocated and delivered is asimportant as its volume in achieving theMDGs. Broad consensus has emerged thatdevelopment assistance is particularly effectivein poor countries with sound policy and insti-tutional environments.42 But even as donorsare allocating more aid to better performers,
C H A P T E R 5
168 G L O B A L M O N I T O R I N G R E P O R T 2 0 0 5
The May 2004 Shanghai conference on scaling up poverty reduction presented a number of coun-try cases of successful efforts to reduce poverty and scale up service delivery. In El Salvador, forexample, education reforms have resulted in universal primary enrollment. Years of conflict hadweakened the country’s education system, and by the end of the 1980s more than a quarter of thepopulation was illiterate, and a fifth of primary school-age children were not in the system. But inthe early 1990s the country started reforming the system. The reforms transferred resources anddecision making to stakeholders such as schools, communities, and parents. In addition, between1992 and 2002 public spending on education rose from 1.9 percent of GDP to 3.3 percent. Thereforms, which were supported by World Bank sector loans, targeted low-income and rural areas,and helped achieve a gross primary enrollment rate of 112 percent—and more than doubled thesecondary enrollment rate, to 56 percent. El Salvador’s successful education program has spurredsimilar innovations in Guatemala and Honduras.
In Indonesia the community-based Kecamatan Development Program has been used to developinfrastructure and alleviate poverty in rural areas. It started small in 1997, operating in 25 villages,and by 2003 it had been scaled up to 28,000 villages. The program provides rural communities withblock grants to build small-scale productive infrastructure. The communities receive the transfersat the beginning of the planning cycle, providing certainty of funding. Execution is decentralized,with planning and decision making directly involving local communities. In its first seven years theprogram reached 35 million people. Other social funds that have involved communities in the plan-ning and decision-making process—such as in Malawi, Yemen, and Zambia—have likewise hadnational scope and impact.
Source: World Bank 2004d.
BOX 5.4 Scaling up development efforts

increasing attention is being focused on thespecial needs of difficult partnership countriesand on seeing how to make aid effective inthese economies.
In all countries, donors must provide assis-tance in ways that are aligned with country-based and -led development priorities asarticulated in PRSs or equivalent nationaldevelopment strategies. They should also dis-burse aid in effective ways—reducing the bur-den of processes, procedures, and requirementsand making aid more predictable. In addition,a stronger focus is needed on the results agenda.This calls for moving from “accounting byinputs” to practical ways of “accounting foroutputs.” Equally important to improving aideffectiveness is the need for more coherentdonor policies.
Aid Selectivity
Donors are becoming more focused on per-formance, with aid allocations increasinglydetermined by both policy performance andpoverty. The policy selectivity index, whichmeasures the elasticity of aid with respect tothe quality of recipients’ policies and institu-tions (based on the World Bank’s CPIAs),shows a generally improving trend in1999–2003 (table 5.1).43 This trend has beenfueled by the sharpening policy focus of mul-tilateral assistance: The relationship betweenaid and policy performance is much strongerfor multilateral than for bilateral aid. Butbilateral aid does exhibit a significantly posi-tive relationship with the quality of recipients’policies and institutions—for more than 80percent of bilateral donors this relationship ispositive, and for more than half it is statisti-cally significant. Still, some of the largest bilat-eral donors are not very selective. Donors’poverty focus has strengthened as well, asreflected in the rise in the poverty elasticityindex (elasticity of aid with respect to recipi-ents’ per capita income). Thus more aid isbeing allocated to poorer countries by bothbilateral and multilateral donors.
Since the various components of aid arefar from homogenous, it is not surprising to
see substantial variation in the policy andpoverty sensitivity of the different types ofaid. The results for disaggregated aid indi-cate that flexible ODA is more sensitive topolicy performance than technical coopera-tion.44 On average, a 100 percent increase inthe quality of recipients’ policies and insti-tutions is associated with a more than 250percent increase in flexible ODA. Technicalcooperation, by contrast, is not sensitive tothe quality of policies and institutions. Thiscategory of aid is also the least selective withrespect to poverty, reflecting the fact thattechnical cooperation is provided to a broadrange of countries—including special needand conflict countries with extremely weakinstitutional capacity, and middle-incomecountries with institutional capacity gaps innarrowly defined areas. Overall, the resultssuggest that the scope for improving theallocation of aid by altering its compositionis potentially large.
Donor focus on performance is stronger inlow-income countries. Thus some donors thatare not very selective in overall aid allocationsnevertheless tend to favor better performers
I N C R E A S I N G A I D A N D I T S E F F E C T I V E N E S S
G L O B A L M O N I T O R I N G R E P O R T 2 0 0 5 169
TABLE 5.1 Selectivity in aid allocation: Donors’ policy and povertyfocus is improving, but bilateral donors could do more
Official development assistance net of emergency aid
Flow Policy Policy Poverty Poverty selectivity selectivity selectivity selectivity
1999 2003 1999 2003
Total aid 1.57* 1.77* –0.34* –0.55*Bilateral aid 1.15* 1.04* –0.27* –0.47*Multilateral aid 2.09* 2.71* –0.68* –0.87*
Five largest donorsUnited States 1.37 1.43 –0.77* –0.88*Japan 3.72* 1.74* –0.23 0.01France 0.65 1.27 –0.17 –0.32Germany 1.99* 3.36* –0.24* –0.52*United Kingdom 2.82* 3.89* –0.47* –1.21*
Source: Levin 2005. * Significant at the 10 percent level or higher.Note: Policy selectivity shows the policy selectivity index, which measures the elasticity of aidwith respect to the quality of recipients’ policies and institutions. Poverty selectivity shows thepoverty elasticity index, which measures the elasticity of aid with respect to recipients’ percapita income.

Aid Effectiveness in Difficult Partnership Countries
As bilateral donors move toward more policyand poverty selectivity in aid allocation, thereis concern that difficult partnership countriesmay be underfunded.45 Empirical evidenceshows that these countries receive about 40percent less aid than predicted by their policyand institutional ratings (figure 5.9).46 There iswide variation, with the so-called “aidorphans” receiving much less aid and the “aiddarlings” receiving much more than can beexplained by policy and poverty criteria. Whilenot all difficult partnership countries shouldreceive more aid, the results suggest that anincrease in overall aid to the group would notcompromise the performance basis of aid.47
Recent studies find that postconflictcountries can absorb more aid than otherlow-income countries with similar levels of
C H A P T E R 5
170 G L O B A L M O N I T O R I N G R E P O R T 2 0 0 5
FIGURE 5.8 In low-income countries donors allocate more aid to better performers; more generous donorsalso tend to be more selective
140
120
100
80
60
40
20
0Luxembourg Denmark Norway Netherlands Sweden United
StatesJapan France Germany United
Kingdom
Bottom Middle Top
Largest donors by volume
Largest donors by aid per capita
Distribution of aid per bilateral donor country’s capita by quality of policies andinstitutions in IDA-eligible countries
120115
85
40
68
53
11
362623
Average for 1999–2003 in US$ per capita
Source: Based on Levin 2005.Note: IDA-eligible countries are split into three groups—bottom, middle, and top—using the 33.3 and 66.7 percentiles of quality of policies andinstitutions as measured by the World Bank’s Country Policy and Institutional Assessments (CPIAs).
among poor countries. The best-performingthird of recipients (as measured by the Bank’sCPIAs) receive an average of 40 percent of aidallocations—while the worst-performing thirdreceive 17 percent (figure 5.8). There is widevariation in donor effort directed at low-income(IDA-eligible) countries. During 1999–2003countries that were consistently the topproviders of assistance per donor country citi-zen to low-income countries were Denmark(with an annual average of $62 out of a total of$115 per Danish citizen directed to the top thirdof policy performers in low-income countries),Luxembourg ($57 out of $120), Norway ($35out of $85), Netherlands ($29 out of $68), andSweden ($23 out of $53). Comparable amountsfor some of the largest donors are $4 out of $11for the United States and $11 out of $40 forFrance. The more generous donors in terms ofper capita aid effort are also generally moreselective.

poverty and institutions. Aid allocation pat-terns in postconflict periods show an increasein the first few years after a conflict ends, fol-lowed by a dropoff. One study finds that rel-ative to conflict levels, per capita aid isgenerally $2 higher in the second year afterconflict, then rises and peaks at around $9 percapita higher in the fourth year after con-flict.48 Another finds that the increase is high-est in the first two postconflict years, then fallsoff.49 But postconflict countries can effectivelyabsorb higher levels of aid in later periodswhen their absorptive capacity has increased,so higher aid sustained over longer periods ismore desirable for ensuring turnarounds inthese countries.50 Thus donors need to pro-vide assistance over a longer period—anexample is Sierra Leone’s 10-year develop-ment plan—to rebuild weak capacity, restartgrowth, and reduce poverty. The Senior LevelForum on Development Effectiveness in Frag-ile States—organized jointly by DAC andbilateral and multilateral donors and held inLondon in January 2005—addressed the issueof how to improve effectiveness of aid in frag-ile states and the principles of good donor
practice in these countries.51
Because these countries have weak capacityand risky environments, delivering effectiveaid is a considerable challenge.52 Aid should befocused on building capacity and providingkey services through innovative mechanisms.Some successful approaches are emerging,including those that use local institutions todeliver services and those that work with non-state actors in ways designed for eventualtransfer to state delivery. (See chapter 3 formore on service delivery in countries understress.) The appropriate aid modality is likelyto vary by country situation. But to be effec-tive, aid needs to be better coordinated to min-imize the problem of aid darlings and orphans,as well as better sequenced and sustained.
Aid Fragmentation
Donor fragmentation remains high in devel-oping countries. A donor fragmentation index,constructed from shares of individual bilateraldonors in annual bilateral aid flows, showsthat the degree of fragmentation in 2003 waslargely unchanged at 68; in 2002 the index was
I N C R E A S I N G A I D A N D I T S E F F E C T I V E N E S S
G L O B A L M O N I T O R I N G R E P O R T 2 0 0 5 171
50
45
40
35
30
25
20
15
10
5
01992 1993 1994 1995 1996 1997 1998 1999 2000 2001 2002
Dollars per capita
Actual Predicted on the basis of GDP per capita and CPIA
Actual versus predicted aid per capita flows to DPCs(1992–2002; population-weighted group averages)
FIGURE 5.9 Difficult partnership countries receive less aid than predicted by their policy/institutional qualityand poverty levels
Source: Levin and Dollar 2005.

67 (figure 5.10). High fragmentation can havenegative implications for aid quality for severalreasons: high transaction costs for recipientsbecause more time is taken meeting donorrequirements; too many small projects, withconsequent limited opportunities to reap scaleeconomies; and smaller or narrower donorstakes in overall country outcomes.53 A largenumber of donors also compounds the chal-lenge of donor coordination. A number ofmembers of OECD’s Development AssistanceCommittee (DAC) are considering measures tolimit the number of countries on which theyfocus. Although the recent High Level Forumon Aid Effectiveness (held in Paris in March2005) did not include fragmentation among the12 indicators it adopted to monitor reforms ofaid delivery and management, donors commit-ted to delegating authority to lead donors,where appropriate, to reduce transaction costs.
The problem is especially severe in Sub-Saha-ran Africa, where the donor fragmentation indexfor 2003 is 81. The high degree of donor frag-mentation is especially surprising given that aidtends to be concentrated in relatively few coun-tries: 60 percent of bilateral aid to the region goesto 10 countries. But although donors have their
favorite countries, they like to be present inmany countries in the region. On average, arecipient country in Sub-Saharan Africa receivedaid from 25 donors a year over the past twodecades.54 The number varies, ranging from 16for Gabon to 37 for Ethiopia in 2003.
Untying Aid
Untying of aid significantly increases its effec-tiveness, yet large amounts of bilateral ODAcontinue to be tied. The DAC recommendsuntying all aid, excluding technical cooperationand food aid, to the least developed countries(LDCs).55 Almost all DAC countries havelargely implemented these provisions, but fourdonors, including the largest (the United States),do not report on the tying status of their bilat-eral ODA. Technical cooperation, whichaccounts for more than a third of bilateral ODAand is largely spent on source-country expertise,is essentially a form of tied aid. Although sub-stantially smaller, food aid (excluding humani-tarian assistance) is mostly tied as well.
Tying aid is costly for recipients. A recentOECD study finds that untied food aid canreach up to 50 percent more beneficiaries than
C H A P T E R 5
172 G L O B A L M O N I T O R I N G R E P O R T 2 0 0 5
1975 1980 1985 1990 1995 2000
All developing countries
Donor fragmentation index, 1975–2003
Sub-Saharan Africa
90
80
70
60
50
FIGURE 5.10 Aid fragmentation is high, especially in Sub-Saharan Africa
Sources: OECD DAC database; World Bank staff estimates.Note: The indexes graphed are averages over groups of aid recipient countries. Donor fragmentation goes from 0-100; highervalues imply more fragmentation.

does tied aid.56 Other studies have also foundthat untying (project) aid yields sizable sav-ings.57 More progress on untying categories ofaid that are currently tied and broadening cov-erage to other developing countries wouldimprove the effectiveness of aid. DAC membersare considering several options to expand thescope of recommendations on untying aid. Atthe recent Paris High Level Forum on AidEffectiveness, DAC donors agreed to continueto make progress on untying aid and to moni-tor this progress through an indicator that mea-sures the share of bilateral aid that is untied.58
Reliability of Aid Flows
Given the large size of official flows relative tothe incomes of many countries, variations inthese flows can cause problems. Volatile, unre-liable aid flows can undermine budget manage-ment in recipient countries and efforts todevelop medium-term expenditure frameworks.In poor countries aid shortfalls are typically off-set by cutbacks in spending, and sometimes bytax increases.59 Improving the reliability of aidis important to increasing its effectiveness. It isalso important for effective scaling up of assis-tance: Countries that commit to sustainedreforms should be assured of timely, more pre-dictable, and longer-term aid commitments. Thepredictability of aid will be monitored using theindicators agreed under the Paris Declaration,to minimize gaps between aid commitments(under agreed schedules in annual or multiyearframeworks) and actual disbursements.
Although donors are beginning to pay moreattention to aid volatility and predictability,cross-country data reveal no significantimprovement in these areas. Cross-countrydata for 1995–8 and 2000–3 indicate that aidcontinues to be more volatile than fiscal rev-enue.60 Moreover, the volatility of aid relativeto revenue appears to have edged up: The mea-sure of the volatility of aid relative to revenuein 2000–3 is nearly twice the median value of1995–8. Aid to poor countries is also morevariable than these countries’ GDP.61 In addi-tion, aid commitments remain poor predictorsof disbursements, particularly for the poorest
countries—such countries receive only abouthalf of promised aid. The data also show thataid does not counter large income shocks.Among countries experiencing adverse macro-economic shocks equivalent to 5 percent ormore of GDP, only a fifth saw higher aid.
Progress on Harmonization, Alignment, and Results
Aid is more effective when it is aligned withrecipients’ priorities, when it reduces transactioncosts through harmonized processes and proce-dures and donor coordination, and when it ispredictable. Related to such efforts is the needfor a clearer focus on managing for developmentresults. An overarching principle of the harmo-nization and alignment agenda is that donorsshould support country-owned strategies forgrowth and poverty reduction—in the form ofpoverty reduction strategies or equivalentnational development plans—and base theirprogramming on the needs and priorities identi-fied in these strategies. In addition, developmentassistance should be provided in ways that buildon partners’ sustainable capacity to develop poli-cies, implement them, and account for theseactivities to their people and legislatures.
I M P L E M E N T I N G A L I G N M E N T A N D H A R M O N I Z A T I O N
The 2003 Rome High Level Forum provided animpetus for advancing alignment and harmo-nization, and this global agenda was the focusof the recent Paris High Level Forum—whereministers and senior officials from more than 90developed and developing countries and 25heads of multilateral and bilateral donor agen-cies reaffirmed their commitment to the RomeDeclaration. Through the Paris Declaration,donors and partners agreed to mutual account-ability in carrying out the partnership commit-ments made by both sides. The internationaldevelopment community has agreed to measureprogress on aid effectiveness using 12 indicators(table 5.2). The indicators cover dimensions ofownership, alignment, harmonization, manag-ing for results, and mutual accountability. Totrack and encourage progress at the global level
I N C R E A S I N G A I D A N D I T S E F F E C T I V E N E S S
G L O B A L M O N I T O R I N G R E P O R T 2 0 0 5 173

and among countries and agencies, participantsat the Paris forum also agreed to set targets for2010 for 11 of the 12 indicators. Five prelimi-nary targets were agreed during the forum, andthese and the others will be finalized andadopted before the UN General Assembly sum-mit in September 2005.
Evidence from an OECD DAC WorkingParty on Aid Effectiveness and Donor Practices
(WP-EFF) survey,62 Strategic Partnership forAfrica (SPA) surveys, and the United NationsEconomic Commission for Africa (UNECA)–DAC Mutual Review of Development Effec-tiveness in the Context of the New Partnershipfor Africa’s Development (NEPAD) show thatpartner countries and donors are workingtogether and taking actions to improve coor-dination and aid effectiveness (box 5.5). The
C H A P T E R 5
174 G L O B A L M O N I T O R I N G R E P O R T 2 0 0 5
TABLE 5.2 Indicators of progress (on ownership, harmonization, alignment, and results)To be measured nationally and monitored internationally
OWNERSHIP TARGET FOR 2010 a
1 Partners have operational development strategies—number of partner countries with national development At least 75% ofstrategies (including PRSs) that have clear strategic priorities linked to medium-term expenditure frameworks partner countriesand reflected in annual budgets
ALIGNMENT
2 Reliable country systems—number of partner countries with procurement and public financial management Target to be setsystems that adhere to broadly accepted good practices or have a reform program in place to achieve by September 2005these
3 Aid flows aligned with national priorities—percent of aid flows to the government sector that is reported 85% of aid hoursin partner countries’ national budgets reported on budgets
4 Strengthen capacity by coordinated support—percent of donor capacity-development support provided Target to be set through coordinated programs consistent with partner countries’ national development strategies by September 2005
5 Use of country systems—percent of donors and of aid flows that use partner country procurement and/or Target to be set public financial management systems in partner countries, which adhere to broadly accepted good by September 2005practices or have a reform program in place
6 Strengthen capacity by avoiding parallel implementation structures—number of parallel project Target to be set implementation units per country by September 2005
7 Aid is more predictable—percent of aid disbursements released according to agreed schedules in At least 75% ofannual ormultiyear frameworks such aid released
on schedule
8 Aid is untied—percent of bilateral aid that is untied. Continued progress
HARMONIZATION
9 Use of common arrangements or procedures—percent of aid provided as program-based approaches b At least 25%
10 Encourage shared analysis—percent of field missions and/or country analytic work, including diagnostic Target to be set reviews, conducted jointly by September 2005
MANAGING FOR RESULTS
11 Results-oriented frameworks—number of countries with transparent, monitorable performance assessment 75% of partnerframeworks to assess progress against national development strategies and sector programs countries
MUTUAL ACCOUNTABILITY
12 Mutual accountability—number of partner countries that undertake mutual assessments of progress in Target to be set implementing agreed commitments on aid effectiveness, including those in this (Paris) Declaration by September 2005
Source: OECD 2005e.a. Existing targets will be confirmed or amended by September 2005.b. See OECD 2005e, appendix A.

G L O B A L M O N I T O R I N G R E P O R T 2 0 0 5 175
Cambodia. Establishing country ownership takes time, patience, perseverance, and resources. Toaddress problems of poor aid management, Cambodia’s government and donors have launched var-ious initiatives since a new coalition government was formed in the late 1990s. The multidonor, three-year Technical Cooperation Action Plan was approved in 2001 to help the government strengthenits capacity to formulate and implement sound macroeconomic policies and manage public finances.In the past few years Cambodia has started to connect to the global debate and is now a signatoryto the Rome and Paris declarations on harmonization. A number of recent developments have sig-nificantly improved prospects for moving toward more productive use of resources. For example, thegovernment has committed to merge three donor-funded strategies—the Second-Socio-EconomicDevelopment Plan 2001–5 (supported by the Asian Development Bank), Cambodia’s MillenniumDevelopment Goals (supported by the United Nations Development Programme), and the NationalPoverty Reduction Strategy (supported by the World Bank and IMF)—into one poverty-focusednational development plan for 2006–10. Donors have responded with common country strategydevelopment processes, joint analytic work, joint support for public financial management reforms,sectorwide approaches (SWAps), and other types of collaboration. In November 2004, together withlocal donors, the government developed a National Action Plan for Harmonization and Alignmentto guide implementation of its commitment to the Rome and Paris declarations on ownership, lead-ership, capacity building, harmonization, and alignment. Government-donor collaboration on pub-lic financial management reforms was further strengthened under a SWAp launched in late 2004.
Ethiopia. In many countries where national systems are inadequate for donors to rely on, thedonor community has bolstered collective action on capacity development efforts to help strengthenthe systems. Recognizing that public sector capacity building efforts were largely supported by frag-mented donor projects and ad hoc financing, the government launched a consolidated five-year pro-gram to rapidly scale up capacity building and institutional transformation efforts in six crucialareas: a regional decentralization program that rapidly transferred delivery responsibilities—withsubstantial fiscal and administrative authority—to rural jurisdictions; municipal reforms designedto restructure and empower urban centers; reformulated civil service reforms increasingly focusedon strengthening the public sector fiduciary framework and service delivery results on the ground;initiatives to enhance connectivity and develop e-government applications and school Internet pro-jects, efforts to reform the justice system (including the courts, lawmaking and law enforcementinstitutions, and the legislative process); and ongoing tax reforms that strengthen tax policy andadministration at the federal and regional levels. In 2003 the scaling up process resulted in a SWAp:Seven donors combined their financial support under the program and aligned their procedures withthe government’s planning, budgeting, and disbursement procedures.
Honduras. The Honduran PRS provides a framework for donors to align around country pri-orities. An executive office has been established to unblock project implementation bottlenecks andaccelerate the achievement of results, and the government has begun negotiating with donors torestructure some operations for greater program coherence. Donors have cooperated by makinginstitutional changes such as decentralized funding approvals, accepting lead donor roles in someareas, carrying out joint analytic work, and coordinating fiduciary requirements.
Middle-income countries. Many middle-income countries have not elaborated formal harmo-nization and alignment efforts, but have simply pursued relevant aspects of the agenda. In Brazil,India, Mexico, and Morocco donor assistance often involves SWAps and increasingly relies on coun-try systems for financial management, disbursements, and procurement. Brazil’s Bolsa FamiliaSWAp, for example, integrates several pro-poor federal programs into one comprehensive programcovering health, education, and nutrition, with program implementation streamlined into a singleadministrative and management mechanism. Poland’s Road Maintenance and Rehabilitation Pro-ject is fully aligned with the government’s program and budget cycles, and implementation reliesheavily on country systems for financial management, accounting, and environmental safeguards.
Source: World Bank staff.
BOX 5.5 Alignment and harmonization: country examples show a widevariety of approaches

SPA surveys and the UNECA-DAC report findthat while progress is being made in Africancountries, it has been uneven and concen-trated in countries that have worked longestand hardest to take ownership of the aidprocess (box 5.6). By the end of 2004 morethan 60 partner countries (worldwide) and 40bilateral and multilateral agencies wereengaged in harmonization and alignmentactivities. The challenge remains to ensurethat the broad range of activities taking place,and the energy and creativity driving them,help increase aid effectiveness.
Aid management and alignment. The WP-EFF has begun to quantify progress towardthe harmonization and alignment commit-ments adopted in the Rome Declaration in2003. After the Rome meeting a set of coun-try-level indicators were developed, and theWP-EFF surveyed harmonization and align-ment in 14 partner countries self-identified atthe Rome forum as being interested in pursu-ing harmonization efforts.63 The workingparty’s survey found that donors are internal-izing the principle of aligning their program-
ming to the needs and priorities identified inPRSs. More than four-fifths of the donorsconsulted indicated they rely on PRSs to pro-gram their country assistance, and only a fifthexpressed reservations (figure 5.11).64 But theWP-EFF and SPA surveys found only a smallnumber of collaborative approaches to har-monizing donor assistance around agreedcountry priorities, and little evidence that,overall, donors have adapted their programsin support of national growth or povertystrategy priorities. Furthermore, in a numberof countries growth and poverty strategies arestill broad, and while donors may be alignedon broad categories—that is, priority sec-tors—this may not imply alignment on corepriority areas.
Aid flexibility and predictability. The WP-EFFsurvey found that for countries that receive bud-get support, 60 percent of donors provide mul-tiyear commitments and timely commitments,and 69 percent disburse budget support onschedule (see figure 5.11). Effective publicexpenditure management is an important pre-requisite for efficient use of budget support, and
C H A P T E R 5
176 G L O B A L M O N I T O R I N G R E P O R T 2 0 0 5
All African multidonor budget support arrangements define a framework for periodically assessingcountry performance. In an innovative twist, Mozambique’s government and donors have agreedto establish a performance assessment framework for the donor community as well. The objectiveis to monitor donor behavior on commitments, expose noncompliance and weaknesses to peer pres-sure, and strengthen donor accountability to government. Key features of this arrangement include:
• Donors will identify the indicators to be assessed, which subsequently will be discussed with andvetted by the government.
• Donor performance will be assessed by an independent team and subject to periodic discussionby the government and donor peers.
• The donor performance assessment framework will be linked to an action plan and timeframefor its implementation.
• Annual donor performance reports will be released publicly. • The framework will be continuously adapted based on collective and individual donor assess-
ments.
Source: Gerster and Harding 2004.
BOX 5.6 Mozambique’s performance assessment framework—for donors
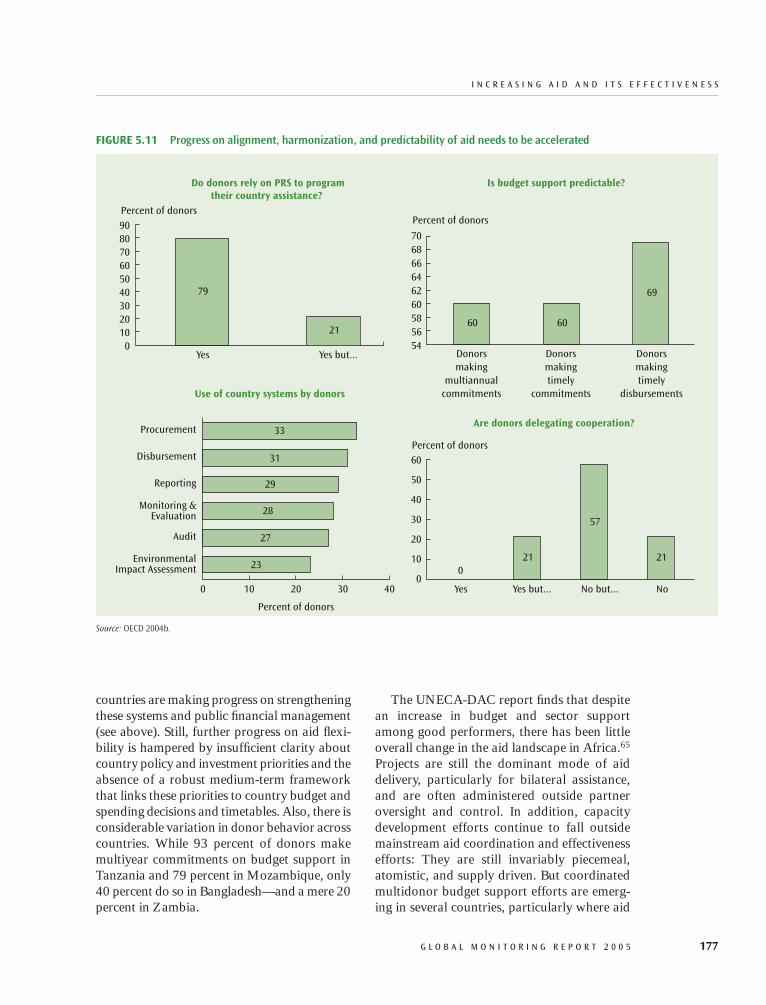
G L O B A L M O N I T O R I N G R E P O R T 2 0 0 5 177
Use of country systems by donors
23
27
28
29
31
33
0 10 20 30 40
Environmental Impact Assessment
Audit
Monitoring & Evaluation
Reporting
Disbursement
ProcurementAre donors delegating cooperation?
021
57
21
60
50
40
30
20
10
0Yes Yes but... No but... No
Percent of donors
Percent of donors
Is budget support predictable?
60 60
69
70 68 66 64 62 60 58 56 54
Percent of donorsPercent of donors
Do donors rely on PRS to program their country assistance?
79
21
90 80 70 60 50 40 30 20 10 0
Yes Yes but... Donors making
multiannual commitments
Donors making timely
commitments
Donors making timely
disbursements
FIGURE 5.11 Progress on alignment, harmonization, and predictability of aid needs to be accelerated
Source: OECD 2004b.
I N C R E A S I N G A I D A N D I T S E F F E C T I V E N E S S
countries are making progress on strengtheningthese systems and public financial management(see above). Still, further progress on aid flexi-bility is hampered by insufficient clarity aboutcountry policy and investment priorities and theabsence of a robust medium-term frameworkthat links these priorities to country budget andspending decisions and timetables. Also, there isconsiderable variation in donor behavior acrosscountries. While 93 percent of donors makemultiyear commitments on budget support inTanzania and 79 percent in Mozambique, only40 percent do so in Bangladesh—and a mere 20percent in Zambia.
The UNECA-DAC report finds that despitean increase in budget and sector supportamong good performers, there has been littleoverall change in the aid landscape in Africa.65
Projects are still the dominant mode of aiddelivery, particularly for bilateral assistance,and are often administered outside partneroversight and control. In addition, capacitydevelopment efforts continue to fall outsidemainstream aid coordination and effectivenessefforts: They are still invariably piecemeal,atomistic, and supply driven. But coordinatedmultidonor budget support efforts are emerg-ing in several countries, particularly where aid

relationships are characterized by mutual trustand accountability.
Limited use of country systems. Donors con-tinue to make limited use of country systems.One of the main goals of the Rome agenda wasto provide development assistance in ways thatbuild partners’ sustainable capacity to developpolicies, implement them, and account forthese activities to their people and legislatures.This means increased reliance on partners’ sys-tems and procedures to manage aid. Yet few ofthe donors active in the 14 countries surveyedby the DAC Working Party reported usingpartner systems (for financial reporting, dis-bursement, procurement, audit, monitoring,and evaluation), and there are significant dis-parities between them in this area. Of course,country systems must meet certain criteria fordonors to rely on them.
On average, the donors reported that only29 percent of their projects are managed usingpartner systems and procedures. Results rangedfrom 23 percent of donors who said they relyon country systems for environmental impactassessments to 33 percent who use country pro-curement systems. Additional technical workhas been done since Rome and Marrakech todevelop criteria for assessing and strengtheningcountry systems and for harmonizing donorrequirements around them. In several casesthese criteria are guiding efforts among groupsof donors to simplify and harmonize fiduciary,monitoring, and reporting arrangements.
Sectorwide approaches. Sectorwide approaches(SWAps) are used to provide comprehen-sive, coordinated support for country-ledsector programs. In 2003–4 borrowers frommultilateral institutions showed increasedinterest in SWAps as a means for aligningaround sector priorities. A growing numberof SWAps use existing country frameworks tochannel and account for funds, becoming anintegral part of the harmonization and align-ment agenda. In Brazil (health), India (educa-tion), Mexico (rural infrastructure), and Poland(roads), SWAps use country systems for pro-curement and financial management.
The SPA survey shows that sector supportoperations are an important aid deliverymechanism for promoting and consolidatingharmonization and alignment. The surveyconcludes that strong elements of harmo-nization in sector programs included jointconsultations with stakeholders, analyticwork, partner reviews and governmentreporting, and monitoring and evaluation.Harmonization was weaker on procurementarrangements, disbursement mechanisms,financial management, technical assistance,and capacity building.
Delegated cooperation. Donors are also pur-suing delegated cooperation in some areas.The Rome Declaration encourages donors tointensify their efforts to work through dele-gated cooperation at the country level as ameans of reducing transaction costs by makinggreater use of the comparative advantages ofindividual donors. For instance, in a delegatedcooperation agreement being prepared forEthiopia, Sweden will delegate its role in thehealth program to Norway, while Norway willdelegate its role in the education program toSweden. The level and form of delegation varyconsiderably, and the DAC Working Party sur-vey found relatively few examples of delegatedcooperation. Only 21 percent of donors across14 countries reported that they were delegat-ing cooperation, and less than 8 percent ofdonor missions were carried out jointly.66
How recipients view donor efforts. The SPABudget Support survey asked African govern-ments to describe their satisfaction with donorbehaviors in a number of areas. The results indi-cate that donors made some progress between2002 and 2003 (table 5.3). There seems to be ahigher degree of coordination (if not harmo-nization). Moreover, satisfaction rose in coun-tries with more experience and higher budgetsupport (Mozambique, Tanzania, Uganda) andfell in countries with less experience and lowerbudget support (Benin, Niger, Rwanda).
Partner countries also viewed donors posi-tively in areas such as providing timely infor-mation on planned disbursements (with a
C H A P T E R 5
178 G L O B A L M O N I T O R I N G R E P O R T 2 0 0 5

score of 3.8 out of 5.0), aligning disbursementswith national budget cycles (3.6), disbursing atthe intended time (3.5), and using governmentreports with minimal demands for other infor-mation (3.5).
M A N A G I N G F O R D E V E L O P M E N TR E S U L T S
The development community has movedfrom conceptualizing to implementing theglobal results agenda. Some early progress inmanaging for development results is evidentat the country and agency levels and acrossaid agencies. Partner countries are beginningto focus on results and are integrating resultsin their development strategies. For example,strong strategies for education and health inEthiopia have helped set a well-prioritizedand -costed PRS program.
Budget processes and public expendituremanagement efforts have the strongest resultsorientations. In all countries there has been amove to apply the principles of managing forresults in line ministries, programs, or cross-cut-ting themes. Stronger links are observed inBrazil, the Philippines, South Africa, Thailand,Vietnam, and Uganda. A number of countrieshave also developed strategies to improve theirmonitoring and evaluation systems. Recogniz-ing the importance of quality statistical systemsfor monitoring and evaluation, a few coun-tries—Burkina Faso, Ukraine—have startedprograms for statistical capacity development,and strategic plans for statistical systems arebeing finalized in other countries—Albania,China, India, Kenya, Nigeria, Yemen.
Aid agencies are strengthening the focuson results in their country programs, financialinstruments, incentives, and reporting sys-tems. Many agencies are deriving countryprogramming from PRSs and linking countrysupport to a partner’s medium-term expendi-ture framework. Emerging practices are beingshared and analyzed in the DAC Joint Ven-ture on Managing for Development Results.All aid agencies have strengthened monitor-ing and evaluations to better ascertain thequality and impact of their operations. Theyare also working to enhance staff ownership
of the results agenda through guidance, train-ing, and information technology systems.Both bilateral and multilateral agencies havestrengthened their development effectivenesswork and corporate reporting.
At the global level, aid agencies are workingmore systematically in identifying actions thatproduce results, scaling up support for thatwork, and ensuring the availability of appro-priate data. Work is under way on presentingexisting experiences in a Sourcebook onEmerging Good Practice in Managing forDevelopment Results. Aid agencies are seekingto harmonize results reporting requirementsaround national monitoring and evaluationsystems that help countries manage for results.Progress is expected in four African pilot coun-tries in 2005. Aid agencies are also beginningwork on jointly assessing monitoring and eval-uation settings in partner countries and align-ing capacity building support with nationalstrategies for monitoring and evaluation, whichwill be pursued by supporting communities ofpractice in managing for development results.
C H A L L E N G E S A H E A D
Progress on harmonization and alignment hasbeen mixed, and that on managing for resultsis just beginning. The pace of progress needs tobe accelerated. It will not be easy, becauseachieving harmonization, alignment, and man-aging for results requires intensive work among
I N C R E A S I N G A I D A N D I T S E F F E C T I V E N E S S
G L O B A L M O N I T O R I N G R E P O R T 2 0 0 5 179
TABLE 5.3 African governments are viewing donor behavior morefavorably (scale of 1 to 5; 5 is highest)
Area 2002–3 2003–4
Conditionality coordinated 3.0 3.4Joint missions or reviews 3.2 3.4Reporting requirements minimized 3.2 3.1and coordinatedCoordinated support on public 3.1 3.3finance reformsCoordinated support to strengthen 2.7 3.1statistical systemsConditionalities seen as useful 3.1 3.6Number of conditions minimized 2.1
Source: SPA Budget Support Working Group 2004.

participants—donors and partner countries—to remove obstacles. Continued commitment atthe highest levels to the harmonization, align-ment, and results agenda will be needed for itssuccessful implementation. Participants at theParis High Level Forum acknowledged thatenhancing the aid effectiveness is feasible andnecessary across all aid modalities, and theycommitted to concrete actions to address chal-lenges that impede progress.
In partner countries weaknesses remain ingrowth and poverty reduction strategies as wellas in institutional capacities to manage thesestrategies for results. Progress in exercisingcountry ownership and leadership of the devel-opment process can be broadened, deepened,and facilitated by strengthening the nationaldevelopment strategy process—for example, byintegrating PRSs with budget processes andwidening the participation of key stakeholdersin developing the strategies. To ensure mutualaccountability, donors should provide compre-hensive, timely, transparent information on aidflows, and governments should commit to pub-lic financial reporting that includes clear, mon-itorable, outcome-based targets.
Among donor agencies, fragmented anduncoordinated assistance at the country levelneeds to be minimized and programs alignedwith country priorities, processes, and sys-tems. Also, donors need to help strengthencountries’ capacities to implement nationaldevelopment strategies. Donors shouldstreamline conditionality to focus on the pri-orities that governments set out in theirdevelopment strategies. To increase donorcomplementarity, agencies should seek waysof improving cross-country balance andavoid major gaps and overlaps, applyingcomparative advantage principles betweenand among bilateral and multilateral agen-cies. The agreed aim is for donors to committo use country systems, as soon as they jointlyassess them as being robust enough, in at leastfour key areas: public financial management;procurement; monitoring and evaluation;and environmental and social safeguards. Butin determining the most effective modalitiesof aid delivery, donors must ultimately be
guided by the development strategies and pri-orities established by partner countries.
In aid agencies, managing information anddecision gaps between headquarters and fieldstaff is critical to facilitate progress on har-monization. Agencies need to assess theiraccountability regimes and mandates to seehow increased delegation of authority to thefield can promote more effective aid at thecountry level. Creating incentives for harmo-nizing and aligning––at the political, institu-tional, and individual levels––is anothercritical variable on which more thought andaction are needed.
Debt ReliefMost debt relief to low-income countries hasoccurred under the aegis of the HIPC initiative,including the enhanced version of the initiativeintroduced in 1999. But donor assistance fordebt relief involves more than one-time reduc-tions in developing countries’ debt levels—italso requires ensuring that countries have thecapacity and ability to ensure that debt remainsat sustainable levels. In addition, recent pro-posals have suggested that donors introducenew approaches and programs to ease debt.
Progress on the HIPC Initiative
For heavily indebted poor countries, debt reliefis crucial to create the fiscal space for much-needed increases in spending to promotegrowth and reduce poverty. Overall, substan-tial progress has been made in implementingthe enhanced HIPC initiative. By March 2005,27 HIPCs—more than two-thirds of the 38countries that potentially qualify for assistanceunder the initiative, and accounting for abouttwo-thirds of total expected debt relief in netpresent value terms—had reached their deci-sion points and were receiving relief. Of these,15 had also reached their completion points—when creditors provide the full amount of debtrelief committed at the decision points on anirrevocable basis.
Progress on reaching completion pointsincreased in 2004, and three more countries
C H A P T E R 5
180 G L O B A L M O N I T O R I N G R E P O R T 2 0 0 5

are expected to reach their completion pointsby mid-2005. For many of the 12 countries inthe interim stage between decision and com-pletion points, maintaining macroeconomicstability remains a challenge. Although anumber of countries are on track with respectto their macroeconomic programs, othersthat have experienced difficulties in programimplementation are pursuing the policy mea-sures needed to bring their economic pro-grams back on track.67 Most of the countriesin the interim stage have finalized their PRSsand are making good progress in implement-ing them.
Of the 11 countries that have not reachedtheir decision points, 2 are making significantprogress and are expected to reach their deci-sion points in 2005. For the others, significantchallenges remain: These countries have beenaffected by domestic conflicts and have pro-tracted arrears to various creditors, which hascomplicated the design and implementationof reform programs.
The sunset clause of the HIPC initiativehas been extended by two years to the end of2006, with its application ring-fenced to poorcountries with unsustainable external debtbased on end-2004 data. All IDA-only andPoverty Reduction and Growth Facility(PRGF)-eligible countries that have not ben-efited from HIPC debt relief and whose exter-nal indebtedness (based on end-2004 data)exceeds the enhanced initiative’s thresholdsafter the assumed full application of tradi-tional debt relief are potentially eligible forthe initiative. World Bank and IMF staff arepreparing a preliminary list of countries thatmeet this criterion for consideration by theinstitutions’ boards in August 2005. As now,countries would receive debt relief based onthe level of debt at the time of reaching thedecision point.
HIPC relief is projected to substantiallylower debt stocks and debt service ratios formost HIPCs that have reached their decisionpoints. Net present values of debt stocks inthe 27 HIPCs that reached their decisionpoints by mid-March 2005 are projected todecline by about two-thirds once they reach
their completion points. HIPCs in the interimperiod have benefited from debt relief fromthe Paris Club as well as from several multi-lateral creditors. Ratios of debt service toexports and to fiscal revenues for the 27countries that have reached their decision orcompletion points are estimated to havefallen from an average of 16 percent and 24percent in 1998–9 to 7 percent and 12 per-cent in 2004, respectively (table 5.4). Thenear-term debt service ratios of these coun-tries are below the average for non-HIPClow-income countries.
Debt relief under the HIPC initiative hashelped countries increase poverty-reducingspending. In the 27 countries that havereached the decision point, such spendingrose from an average of 6.4 percent of GDPin 1999 to 7.9 percent in 2004—about fourtimes the amount spent on debt service.68 Inabsolute terms, poverty-reducing spending isestimated to have increased from nearly $6.0billion in 1999 to $10.5 billion in 2004, andis projected to increase to $14.5 billion in2007 (see table 5.4).69
Although creditor participation hasimproved, some non–Paris Club bilateraland commercial creditors have not commit-ted to providing HIPC relief. Most of thecosts attributable to bilateral creditors con-tinue to be borne by members of the ParisClub. Commercial creditors represent lessthan 5 percent of the net present value costof relief, in part because of measures by theDebt Reduction Facility for IDA-only coun-tries that have reduced the stock of commer-cial debt in HIPCs. Moral suasion remainsthe principal measure for encouraging par-ticipation and discouraging litigation byremaining commercial creditors. Withrespect to multilateral debt, 23 of the 31multilateral creditors have indicated theirintent to participate in the initiative, repre-senting more than 99 percent of the totaldebt relief required.
A key premise of the HIPC initiative is thatdebt relief should be additional to otherforms of external financing assistance. Animportant issue is whether countries receiving
I N C R E A S I N G A I D A N D I T S E F F E C T I V E N E S S
G L O B A L M O N I T O R I N G R E P O R T 2 0 0 5 181

HIPC debt relief are receiving additionalresources, or whether debt relief crowds outother aid flows. Merely observing the size offlows does not provide conclusive evidence ofadditionality, as there is no way of knowinghow much aid countries would have receivedwithout the HIPC initiative. There are alsosubstantial difficulties in measurementbecause different donors account for debtrelief in different ways. Debt relief is some-times explicit, such as through grants for debtrelief, and sometimes implicit, such asthrough debt service reductions.
The August 2004 HIPC status report,based on updates of debt stock and debt ser-vice indicators in post–completion pointcountries, found that the net present value ofdebt ratios had climbed since the completionpoints.70 Most of the increase was due tointerest and exchange rate changes, whilehigh exports had significantly lowered debtratios. Debt service ratios for these countrieshad also increased but remained close to 10percent on average. While the low level was
due to HIPC debt relief and the high conces-sionality of new debt, the average changemasked important differences between coun-tries. Medium-term projections generallypointed to stable or declining trends in debtand debt service ratios. The review indicatedthat notwithstanding HIPCs’ high vulnerabil-ity to shocks, sound economic policies andclose monitoring—using the proposed debtsustainability framework for low-incomecountries (see below)—would help preventthe reemergence of unsustainable debt.
Debt Sustainability
Continued measures are needed by HIPCs andby creditors to ensure that debt sustainabilityis maintained after completion points, just assimilar measures are needed for other low-income countries. The Boards of the IMF andWorld Bank have endorsed key elements of aproposed debt sustainability framework forlow-income countries aimed at supportingthese countries’ efforts to achieve the MDGs
C H A P T E R 5
182 G L O B A L M O N I T O R I N G R E P O R T 2 0 0 5
TABLE 5.4 Debt service is falling and poverty-reducing spending rising among the 27 HIPCs that have reached their decisionpoints (percent unless otherwise indicated)
Actual Estimated Projected
Indicator 1998 1999 2000 2001 2002 2003 2004 2005 2006 2007
Debt service (US$ billions) 3.70 3.18 3.07 2.42 2.44 2.55Debt service after enhanced HIPC relief(US$ billions) 2.63 2.49 2.55 2.78
Debt service/exports a 16.9 14.5 13.6 10.2 10.1 8.9 7.3 6.3 6.1 6.2Debt service/government revenue a 25.2 21.8 21.9 16.5 15.0 13.4 11.7 9.5 9.0 9.0
Debt service/GDP a 3.9 3.4 3.3 2.5 2.4 2.2 2.0 1.7 1.6 1.6Poverty-reducing expenditure (US$ billions) 5.94 6.02 6.55 7.57 9.07 10.54 12.83 13.53 14.49
Poverty-reducing expenditure/government revenue a 40.9 42.9 44.8 46.6 47.6 46.8 49.1 47.5 46.7
Poverty-reducing expenditure/GDP a 6.4 6.4 6.8 7.4 7.8 7.9 8.6 8.4 8.4
Source: HIPC country documents and IMF staff estimates.Note: Debt service data for 1998 and 1999 reflect debt relief already provided to Bolivia, Guyana, Mozambique, and Uganda under the original HIPC initiative. Data onpoverty-reducing expenditure are not available for all countries, particularly for 2003–05. In aggregate, the last available period was used for future years, thus understat-ing the likely level of poverty-reducing spending. a. Weighted average.

without creating future debt problems andkeeping countries that have received debtrelief under the HIPC initiative on a sustain-able track. In guiding future financing deci-sions, the framework rests on three pillars:
• An assessment of debt sustainabilityguided by indicative country-specific debtburden thresholds related to the quality oftheir policies and institutions.
• A standardized, forward-looking analysisof debt and debt-service dynamics under abaseline scenario and in the face of plausi-ble shocks.
• An appropriate borrowing (and lending)strategy that contains the risk of debt dis-tress.
Building on initial Board discussions of theproposed framework in early 2004, and fur-ther considerations in September 2004, Bankand IMF staff are preparing a follow-up paperthat attempts to resolve outstanding issues onthe indicative debt burden thresholds, theinteraction of the framework with the HIPCinitiative, and the modalities for Bank-IMFcollaboration in deriving common assess-ments of debt sustainability. It needs to bestressed, however, that debt sustainability isnot only a resource flow issue. It also dependson increasing growth, diversifying exports,expanding access to global markets, and mit-igating the effects of exogenous shocks.
IDA financial support to poor countrieswill now take systematic account of their vul-nerability to debt. Debt sustainability will bethe primary determinant of the grant andcredit mix in IDA14, and the joint debt sus-tainability framework for low-income coun-tries will form the analytical basis to link debtsustainability and grant eligibility.71 Countriesfacing the toughest debt problems—most ofthem in Sub-Saharan Africa—will get all theirsupport in the form of grants, while countriesless burdened by debt will receive IDA’s highlyconcessional long-term loans, or in a few casesa mix of grants and loans. The resulting shareof grants in IDA support over the next threeyears is expected to be about 30 percent.
Proposals for Additional Debt Relief
Some G-7 members have proposed mecha-nisms for additional debt relief (box 5.7).Further debt relief holds the promise of yield-ing additional development financing beyondwhat could be forthcoming in the form ofadditional gross flows, given the broad polit-ical support for debt relief. It could alsoreduce the remaining debt overhang and easepressures to provide new aid to refinanceexisting debt service obligations (so-calleddefensive lending), enabling a more effectivepolicy dialogue between donors and debtorcountries. Debt relief also has the advantagethat, to the extent that it is committed irrev-ocably up front, it can provide aid in a pre-dictable and easy to use form.
There is a danger, however, that furtherdebt relief might instead result in a diver-sion of resources that would have gone toincreased direct aid flows. Furthermore, rel-ative to the alternative of higher new aidflows, debt relief has a number of potentialdisadvantages. First, it allocates resourcesaccording to existing debt stocks ratherthan need or policy performance, and somay prove inconsistent with the principle ofallocating assistance to countries where itwould be most effective. Second, debt reliefmay reduce the scope for linking assistanceto the maintenance of good policies, to theextent that an irrevocable commitment todebt relief is made upfront. Third, it maycreate expectations of further relief in thefuture, increasing the moral hazard associ-ated with any subsequent lending and hin-dering the development of a credit culture.This could prompt creditors to reduce netlending in the future.
Any new debt relief initiative wouldleave an unfinished agenda. Further debtrelief is inevitably only a small part of abroader agenda that involves stronger poli-cies in developing countries, more and bet-ter-targeted development assistance, and asupportive international environment forgrowth.
I N C R E A S I N G A I D A N D I T S E F F E C T I V E N E S S
G L O B A L M O N I T O R I N G R E P O R T 2 0 0 5 183

Notes1. DAC members’ ODA consists of bilateral
ODA—provided directly to developing countriesthat are on DAC’s Part I list of aid recipients—andcontributions to multilateral agencies. Disburse-ments of ODA by multilateral agencies may notequal the contributions they received from donors.
2. OECD (2005a). Paris Club (comprisingbilateral donors) members recently agreed to for-give up to 80 percent of their debt claims on Iraq,adding $12–$17 billion to ODA flows in 2005–6(in addition to the amounts discussed in the text).For many donors these flows will be in addition totheir Monterrey commitments.
3. Between 2001 and 2003 military expendi-tures rose by 18 percent in real terms (StockholmInternational Peace Research Institute 2005);such spending dwarfs aid flows. For example, in2002 U.S. military spending was $1,217 percapita and ODA was $46 per capita. At $358 percapita, EU military spending was also muchlarger than ODA per capita (Economists Alliedfor Arms Reduction 2004).
4. Oxfam International (2005).
5. European Commission (2004). In 2002 theEuropean Commission adopted an interim targetfor ODA to average 0.39 percent of gross nationalincome (GNI) by 2006.
6. Donors recently agreed to increase contri-butions to the International Development Associ-ation’s 14th replenishment (IDA14) by more than25 percent. Over the next three fiscal years—from1 July 2005 to 30 June 2008—grants are expectedto account for about 30 percent of IDA support.
7. Noncash assistance typically involves tech-nical cooperation, emergency and distress relief,and food aid. Debt relief involves a net transfer ofresources if debt is being serviced (that is, is not inarrears), but amounts to an accounting exercise ifit is not.
8. The increase in real ODA between 2001and 2003 was $6.6 billion at 2002 prices andexchange rates. Debt relief increased by $3.8 bil-lion, technical cooperation by $2.6 billion, andemergency and disaster relief and food aid by $1.9billion.
9. Data are for the 14 non-DAC donor coun-tries for which the OECD collects data on devel-opment assistance.
C H A P T E R 5
184 G L O B A L M O N I T O R I N G R E P O R T 2 0 0 5
Members of the G-7 have put forward a number of proposals for further debt relief beyond theenhanced HIPC initiative. Different motivations drive these proposals. Some proposals reflect adesire to provide additional resources to help low-income countries achieve the MDGs. Others seefurther debt reduction as a way of increasing the scope for new lending—under the proposed WorldBank–IMF debt-sustainability framework—to low-income countries with relatively strong policies,to facilitate the development of a credit culture. Still others aim to eliminate the need for defensivelending and perpetual debt relief for HIPCs.
Motivations apart, the proposals differ importantly along several lines, including the scope andmodality of debt relief, the conditionality to be applied, and the source or sources of financing. Dif-ferences include:
• Whether eligibility for relief should be restricted to HIPCs or be available to all low-income coun-tries.
• Which institutions’ debt should be relieved.• What percentage of eligible debt should be relieved.• Whether relief should take the form of reductions in debt stocks or debt service payments.• The strictness of conditionality.• How debt relief by international financial institutions will be financed—for example, with con-
tributions from bilateral donors or by the institutions themselves. Some G-7 members have pro-posed that the IMF sell some of its gold reserves to cover its debt relief.
Source: IMF 2005.
BOX 5.7 Proposals for additional debt relief—moving beyond HIPC

10. The Forum on Partnerships for More Effec-tive Development Cooperation, held in February2005, brought together DAC members and a num-ber of non-OECD countries involved in support-ing development in developing countries. Theforum sought to improve coordination and coop-eration among the entire donor community, par-ticularly through better information andknowledge sharing.
11. Middle-income countries receive about athird of aid. Although these countries are lessdependent on aid, it plays an important role in cat-alyzing reforms, helping countries address issues oflarge pockets of poverty, and providing a bufferagainst shocks.
12. The increase in real net bilateral ODAbetween 2001 and 2003 was $6.5 billion, with$4.2 billion for debt relief and $1.6 billion foremergency and disaster relief and food aid.
13. The corresponding real increase was $4.4billion in the Democratic Republic of Congo, $225million in Cameroon, $344 million in Sudan, $123million in Tanzania, and $199 million in Ethiopia.
14. All official flows (ODA and non-ODA)account for a slightly smaller share of resourceflows—50 percent, as in figure 5.6—because non-ODA official flows are slightly negative.
15. Official data underestimate remittanceflows, and unrecorded remittances may be largerthan recorded remittances.
16. See World Bank (2004c) and chapter 2 fora detailed discussion of the private investment cli-mate and its links to growth.
17. Development Committee (2005) analyzesthe various proposed innovative mechanismsunder discussion. See also Development Commit-tee (2004) and Reisen (2004).
18. The IFFIm would be established as a U.K.charitable entity, essentially as a special-purposevehicle for the Vaccine Fund. Negotiations areunder way to establish a core group of donors tofund the pilot facility.
19. Reisen (2004).20. Taxes that correct inefficiencies ultimately
imply an increase in a country’s real resources andthe possibility of increased development financing.See Development Committee (2004) for a detaileddiscussion of the additionality of various innova-tive instruments.
21. Gap countries are countries that are ineligi-ble for IDA financing (because their GNI percapita is above the IDA cutoff), other than on anexceptional basis, and that are not creditworthy
for normal borrowing from multilateral develop-ment banks.
22. UNMP (2005).23. World Bank (2004b). 24. Some analysts have argued that developing
countries often lack a minimum amount of capi-tal—in terms of infrastructure, human capital, andpublic administration—to support modern produc-tion activity, so capital above a minimum thresholdis needed to boost economic activity. According tothat argument, the key to breaking out of such“poverty traps” is a large infusion of investment inphysical and human capital, which must be fundedpredominantly by external sources given limiteddomestic capacity to save. See Sachs and others(2004) for a poverty trap perspective on Sub-Saha-ran Africa; see chapter 2 and Kraay and Raddatz(2005) for empirical evidence on poverty traps.
25. UNMP (2005) estimates that in Ghana theannual investment in roads required to meet theMDGs is 2.4 percent of GDP, over three timeswhat the government can afford, and that inUganda it is 5.4 percent of GDP, more than twicewhat can be financed domestically.
26. There is considerable debate in the recenteconomic literature on how aid affects growth.Some cross-country macro studies find an unam-biguously positive relationship between aid andgrowth. Another set of studies shows more condi-tional results, with the effect dependent on thequality of policies and institutions or other coun-try characteristics. A third set of studies finds noeffect, or even a negative effect, of aid on growth.
27. Clemens, Radelet, and Bhavani (2004).28. Development Committee (2004); Renzio
(2004).29. Levy (2004).30. World Bank (2004a). 31. UNMP (2005).32. Of the 47 countries with full PRSPs, 22
have produced at least one annual progress report.33. See IMF and World Bank (2005) and chap-
ter 2 for results from the just concluded WorldBank–IMF poverty-reducing public spendingtracking exercise for HIPCs.
34. See Alonso, Judge, and Klugman (2004) fora comparative analysis of PRSs and budget link-ages in four countries.
35. PRSCs have also facilitated donor coordi-nation and increased aid for budget support. Bilat-eral donors providing budget support includeBelgium, Ireland, the Netherlands, Sweden, theUnited Kingdom, and the United States.
I N C R E A S I N G A I D A N D I T S E F F E C T I V E N E S S
G L O B A L M O N I T O R I N G R E P O R T 2 0 0 5 185

36. Miovic (2004). Input-level data show thatmuch larger amounts of resources have been chan-neled to basic health, education, and water andsanitation.
37. While the overall performance was stable,there were within-year fluctuations in some areasof the budget.
38. Alonso and Utz (2004).39. Priority sectors are broad sectors—such as
education, health, agriculture, and roads—that areassigned priority in budget allocations. Core pri-ority areas are items within priority sectors, suchas primary health care and primary school educa-tion. Per capita spending on priority sectorsincreased 53 percent between fiscal 1999 and2002, while spending on core priority areas rose77 percent. The much larger increase for core pri-ority areas was due to the donor-funded PrimaryEducation Development Program.
40. Tanzania has about 650 donor projectsbeing implemented by sector ministries and localgovernments. One of the four priorities of the Tan-zanian assistance strategy agreed to in 2003 by thegovernment and development partners is to inte-grate donor funds, including projects, with the gov-ernment budget. To that end, the government hascreated a mechanism linking donor funds to gov-ernment accounts, for donors to use in channelingfunds to projects, nongovernmental organizations,and the private sector. It has also provided relevanttraining to interested donor agencies. By August2004, however, only four of Tanzania’s develop-ment partners had indicated their readiness to usethis mechanism. See Peretz and Wangwe (2004).
41. Alonso (2004). Although priority sectorsare seeing higher spending, their share in the totalbudget is largely unchanged, even with HIPCfunds earmarked for priority sectors. Real spend-ing—including real per capita spending—on pri-ority sectors and core priority areas increasedbetween the start of the PRS, in 1999, and 2002.Between 1998 and 2002 real per capita spendingon priority sectors and core priority areas doubled.Allocations of increased spending between corepriority areas have been quite uneven, however.
42. As noted, there is considerable debate inrecent literature on the impact of aid on growth. Arecent study by Dollar and Levin (2005) addsmicro evidence to the macro results in the litera-ture. The study finds a strong link between institu-tional quality and aid-financed project outcomes.The results support the findings of other cross-
country analyses that find aid to be effective ingood institutional environments. The study findsthe most robust results for the rule of law. In addi-tion, geography matters: Projects in Sub-Saharancountries have less successful outcomes (althoughtropical location does not significantly affect out-comes). The study also finds that different institu-tions have different effects on project success. Forexample, better democratic political institutionsresult in better outcomes for policy-based loans,whereas the success of project loans is facilitatedby stronger property rights and rule of law. This isconsistent with the growth literature, which findsa favorable link between property rights and eco-nomic growth.
43. Based on Dollar and Levin (2004).44. Flexible ODA is defined here as total ODA
less special-purpose grants—such as technicalcooperation, debt relief, emergency and disasterrelief, and food aid.
45. Difficult partnership countries (whichinclude low-income countries under stress, orLICUS) are low-income countries with weak insti-tutions, defined as those with Country Policy andInstitutional Assessment (CPIA) scores in the bot-tom two quintiles.
46. Levin and Dollar (2005). 47. This model of aid allocation does not reflect
the costs of conflict and the benefits of conflict pre-vention for growth and poverty reduction. SeeChalmers (2004) and Chauvet and Collier (2004)for evidence on the potentially large effects of aidin difficult partnership countries. Aid reduces therisk of conflict by raising economic growth.
48. Kang and Meernik (2004). 49. Collier and others (2003).50. By contrast, aid has typically been inade-
quate and mistimed, phasing out just when itshould be phasing in.
51. See OECD (2005c) for a discussion of howdonors are moving forward on improving theeffectiveness of their aid to fragile states.
52. Difficult partnership countries, especiallycountries just emerging from conflicts and post-conflict countries, often need to rebuild basic state,civil society, and private sector institutions.
53. Knack and Rehman (2004).54. Felix (2005).55. A 2001 DAC High Level Meeting adopted
recommendations to untie ODA to the least devel-oped countries.
56. OECD (2004a).
C H A P T E R 5
186 G L O B A L M O N I T O R I N G R E P O R T 2 0 0 5

57. Aryeetey, Osei, and Quartey (2003) find thesavings to be in the range of 11–25 percent; Jepma(1991) estimates 15–30 percent.
58. See also table 5.2 and OECD (2005e).59. Gemmell and McGillivray (1998).60. See Bulir and Hamann (2003, 2005) and
Bulir and Lane (2002).61. World Bank (2005c); Pallage and Robe
(2001).62. OECD (2004b, 2005d). The WP-EFF is a
group of bilateral and multilateral donors thatformed after the Rome forum to monitor and assistglobal progress on harmonization and alignment.
63. The countries were Bangladesh, Bolivia,Cambodia, Ethiopia, Fiji, the Kyrgyz Republic,Morocco, Mozambique, Nicaragua, Niger, Sene-gal, Tanzania, Vietnam, and Zambia. Thesecountries, along with Mali, are associated withthe work of the Task Team on Harmonizationand Alignment, a subgroup of the WP-EFF. Inaddition to the preceding 15 countries, South
Africa participates in the Joint Venture on Pub-lic Financial Management, another group underthe WP-EFF.
64. This is similar, for example, to when donorsdisagree with specific aspects of partner countrypolicies (such as resettlement policies).
65. The SPA Budget Support survey finds thatfor Africa as a whole, budget support increasedfrom about $1.5 billion in 2002 to about $2.5 bil-lion in 2003.
66. OECD (2004b).67. IMF and World Bank (2004a).68. The definition of poverty-reducing spending
varies by country, but commonly includes primaryeducation, basic health, and rural development.
69. Some countries are implementing publicexpenditure management systems to ensure theefficiency of poverty-reducing spending. See IMFand World Bank (2005).
70. IMF and World Bank (2004a).71. IDA (2004).
I N C R E A S I N G A I D A N D I T S E F F E C T I V E N E S S
G L O B A L M O N I T O R I N G R E P O R T 2 0 0 5 187


This chapter analyzes the support pro-vided by international financial insti-tutions to help developing countries
achieve the Millennium Development Goals(MDGs) and related development objectives,and sets out priorities for strengthening and sharpening that support. The focus is onthe five largest multilateral developmentbanks—the African Development Bank(AfDB), Asian Development Bank (ADB),European Bank for Reconstruction andDevelopment (EBRD), Inter-American Devel-opment Bank (IDB), and World Bank—andthe International Monetary Fund (IMF). Thediscussion is structured around the four-pil-lared organizational framework developed inthe Global Monitoring Report 2004: countryfocus, global and sectoral programs, partner-ships, and results.
In applying the framework, the chapterreflects the similarities across the interna-tional financial institutions and commondirections of change, but also the differ-ences—especially in the ways the multilat-eral development banks and the IMFcontribute to progress on the MDGs. Oper-ating in some ways like the aid agencies con-sidered in chapter 5, the banks work
through a large variety of instruments andsectors tailored to country circumstancesthrough decentralized processes; to a largeextent the key to understanding their contri-bution lies in understanding how and howwell those processes are working. The IMF’sproduct line is simpler, with programsfocused on substantive policy issues at ahigher level of execution.
To provide historical context for the chap-ter, figure 6.1 shows development financeflows over the past 25 years. During that timethere was a significant increase in private sec-tor flows—albeit with considerable fluctua-tions. Measured by gross disbursements, thecontribution of the multilateral developmentbanks grew gradually but steadily through thelate 1990s (peaking in 1999) while shrinkingrelative to private finance—increasing thebanks’ strategic and catalytic role in support-ing policy development and institution build-ing. Net flows also peaked by the end of thedecade, turning negative in 2002 for the ADBand World Bank—reflecting transactions withmiddle-income borrowers. IMF support wassometimes countercyclical relative to privateflows, and sometimes procyclical, with netflows negative in some years.
G L O B A L M O N I T O R I N G R E P O R T 2 0 0 5 189
Strengthening and SharpeningSupport from International
Financial Institutions
6

Multilateral Development BanksIn line with the model set out in earlier chap-ters, the multilateral development banks con-tribute to the achievement of the MDGsthrough their support for country policies,institutions, and investments and for globaland regional public goods. This sectionaddresses how and how well the banks carryout these tasks. The comparative profile inbox 6.1 provides a perspective for interpret-ing the observations on the individual banks,especially with respect to their mix of low-and middle-income borrowers.
Country Programs
In exploring how the multilateral develop-ment banks are helping their developing mem-ber countries achieve the MDGs, this sectionexamines how the banks approach countryownership, strategies, financial support, andanalytic and capacity-building support. Itreflects the view that the banks’ contributionto achieving the MDGs lies in the relevance oftheir country programs—especially the linksbetween their country strategies and national
poverty reduction strategies (PRSs) or othernational strategies—and the implementationquality of those programs. The analysis drawson findings by the banks’ independent evalu-ation departments and indicates plans for fur-ther evaluation studies that can inform futureGlobal Monitoring Reports.
C O U N T R Y O W N E R S H I P
All the multilateral development banks rec-ognize the importance of country ownership,with an emerging consensus that countrydemand, balanced with staff analysis, shouldform the basis for the policy dialogue.
Low-income countries. The 61 low-incomecountries that are members of multilateraldevelopment banks are home to 2.2 billionpeople. Their populations range from around150,000 people in São Tomé and Principe tomore than 1 billion in India. They are islands,landlocked, peninsulas, and continents, withtremendous diversity across and within coun-tries. Each faces unique development chal-lenges, sharing a common statistic of annualper capita income of $765 or less. They containmore than 70 percent of the world’s people
C H A P T E R 6
190 G L O B A L M O N I T O R I N G R E P O R T 2 0 0 5
US$ billions
0
50
100
150
200
250
300
350
MDBs
1980 19901985 1995 2000 2003
IMF Private sources MDBs IMF Private sources
US$ billions
–50
0
50
100
150
200
250
300
1980 19901985 1995 2000 2003
Gross flows to developing countries Net flows to developing countries
FIGURE 6.1 Financial flows from the Big 5 multilateral development banks, IMF, and private sources
Source: World Bank Debtor Reporting System.

Together the five biggest multilateral development banks—the African Development Bank (AfDB), Asian Develop-ment Bank (ADB), European Bank for Reconstruction and Development (EBRD), Inter-American DevelopmentBank (IDB), and World Bank—commit and disburse about $35 billion a year. These banks share many character-istics. But they also have differences—in country coverage, mandate, voice and ownership, and location of work—that influence how they respond to the challenge of helping countries achieve the MDGs and other developmentgoals.
Country coverage. Most developing countries are eligible to borrow from two of the Big 5 multilateral develop-ment banks: the World Bank and their regional bank. Exceptions include countries in the Pacific that are membersof the ADB and not the World Bank (Cook Islands, Nauru, Tuvalu), countries that are members only of the WorldBank (Antigua and Barbuda, Dominica, Grenada,Iran, Iraq, Jordan, Lebanon, St. Kitts and Nevis, St.Lucia, St. Vincent and Grenadines, Syria, Turkey,Yemen), and countries that are members of theADB, EBRD, and World Bank (Azerbaijan, Kaza-khstan, Kyrgyz Republic, Tajikistan, Turkmenistan,Uzbekistan).
Differences in the income mix of the banks’developing country members translate into verydifferent client bases. The AfDB has the largestshares of low-income members, while the EBRDand IDB have the largest shares of middle-incomemembers (see top figure). The ADB and the WorldBank are in the middle. Accordingly, averageincome levels vary significantly for bank clients(see second figure).
The relative importance of different fundingsources also varies for the different categories ofclients. For investment grade and other emergingmarket economies, private financing provides up to95 percent of inflows. For the others the privateshare is much lower. These variations translate intodifferences across countries in the importance of themultilateral development banks’ financing role rela-tive to their policy and catalytic role.
A third consideration is the size of borrowers,particularly between large states (more than 100 mil-lion people) and small states (less than 1.5 millionpeople). There are nine large states, with one in theAfDB (Nigeria), five in the ADB (Bangladesh, China,India, Indonesia, Pakistan), one in the EBRD (Rus-sia), and two in the IDB (Brazil, Mexico). Smallstates cut across the spectrum of country classifica-tions, with Barbados being investment grade and theSolomon Islands a low-income country under stress,with most falling in between—whether middleincome or low income—and more aid-dependentthan larger states. Small states also cut across themultilateral development banks, accounting for20–30 percent of country clients in the AfDB, IDB,and World Bank and more than 35 percent in theADB, but less than 5 percent in the EBRD (see topfigure, next page).
BOX 6.1 Profile of the “Big 5” multilateral development banks
Percent of client countries
Investment grade Core MIC
100
90
80
70
60
50
40
30
20
10
0WBIDBEBRDAsDBAfDB
27
46
4
23
16
25
13
46
4
8
12
77
7
7
33
52
23
23
18
36
Core LIC LICUS
Differences in Big 5 client bases
Average GDP per capita, 1995 US$4000
3500
2500
3000
2000
1500
1000
500
0EBRDAsDB WBIDBAfDB
Average incomes of Big 5 client countries
G L O B A L M O N I T O R I N G R E P O R T 2 0 0 5 191

Mandate. The mandates of the AfDB, ADB, IDB,and World Bank are similar: promoting growth anddevelopment and reducing poverty. The EBRD’smandate is to promote transition and private sectordevelopment. The mandates of the EBRD andAfDB, ADB, and IDB also include an importantregional dimension—to focus on regional and sub-regional projects, programs, and trade.
Voice. The Big 5 differ in their borrowers’ sharesof bank ownership, ranging from low in the EBRDto high in the AfDB (see middle figure, this page).But the influence of nonborrowers is affected by therole played by the banks’ concessional windows,which are heavily supported by nonborrowingdonors. In the AfDB concessional lending accountsfor 44 percent of total lending; in the World Bank,40 percent; and in the ADB, 27 percent. The IDB hasa concessional Fund for Special Operations thataccounts for 7 percent of all lending. Also relevantis the process for selecting the banks’ presidents—with the heads of the ADB, EBRD, and World Banktraditionally selected from a developed country andthe heads of the AfDB and IDB from a developingcountry.
Location of work. A final issue is the locationof the banks and their work. The headquarters ofthe EBRD, IDB, and World Bank are in G-7 coun-tries, while the AfDB and ADB are in borrowercountries. Equally important is the location ofwork and staff. Two parameters are key: coverageof field offices and roles and responsibilities. Mostof the Big 5 have full or fairly full field presence intheir developing member countries (see last figure,this page). The exception is the AfDB, which hadclosed its field offices because of problems but isestablishing new ones in 25 countries, followingthe example of the other Big 5 and lessons learnedfrom recently established offices in Egypt,Ethiopia, Gabon, Mozambique, Nigeria, Senegal,Tanzania, Tunisia, and Uganda. All the Big 5 con-sider project administration a key task of theircountry offices. But the ADB, EBRD, and WorldBank also see a critical role for their country officesin strategy formulation and program design, withmost World Bank country directors located out-side Washington, D.C.
Source: Staff of the Big 5 multilateral development banks.
Percent of client countries
40
35
30
25
20
15
10
5
0EBRDAsDB WBIDBAfDB
Small states in the Big 5 (percentage of client countries)
Percent of ownership60
50
40
30
20
10
0EBRDAsDB WBIDBAfDB
Borrower shares in Big 5 ownership
Big 5 decentralization(percentage of member countries with bank office)
Percent of client countries100
60
70
80
90
30
40
50
20
10
0EBRDAsDB WBIDBAfDB
BOX 6.1 (continued)

S T R E N G T H E N I N G A N D S H A R P E N I N G S U P P O R T F R O M I N T E R N A T I O N A L F I N A N C I A L I N S T I T U T I O N S
G L O B A L M O N I T O R I N G R E P O R T 2 0 0 5 193
living on less than $1 per day and 60 percentof those living on less than $2 per day. Theyare eligible for concessional financing fromthe multilateral development banks—fromthe World Bank’s International DevelopmentAssociation (IDA) and, in their respectiveregions, from the African Development Fund,Asian Development Fund, and Inter-Ameri-can Development Bank’s Fund for SpecialOperations. Low-income members of theEBRD are supported by the Early TransitionCountries initiative, under which the EBRDaccepts higher risks in the projects it finances.
Each of these facilities explicitly recog-nizes PRSs (or national strategies) as thevehicle for the banks to work with in low-income countries on their MDG priorities.1
All the banks are committed to using the PRSprocess in the dialogue on, and as the start-ing point of, their country strategies. Recentreviews of the PRS approach carried out bythe independent evaluation departments ofthe World Bank (Operations EvaluationDepartment, or OED) and IMF (IndependentEvaluation Office, or IEO) highlightstrengths and weaknesses of the PRS process,as well as priorities for change.2 (See box 6.2for the findings of the OED review; the IEOreview is discussed in box 6.11.) Building onthese reviews and their recommendations,steps are being taken to strike a better bal-ance between country ownership and exter-nal involvement—including by internationalfinancial institutions—and to help countriesbroaden domestic participation, develop andmonitor their strategies, strengthen analysisof the sources of growth and poverty reduc-tion, link ambitious objectives with availableresources and capacity constraints, and setout operational paths for sustained imple-mentation.
Low-income countries under stress. Amonglow-income countries, low-income countriesunder stress (LICUS) are the most fragile—often affected by conflict, and with theweakest governance, policies, and institu-tions. This translates into severely limitedprogress on and prospects for poverty reduc-
tion and the other MDGs. The more than400 million poor people living in these coun-tries share bleak socioeconomic indicators,with per capita income levels half, and childmortality rates double, those in other low-income countries. Six LICUS are also smallstates—Comoros, The Gambia, Guinea-Bis-sau, São Tomé and Principe, SolomonIslands, and Timor Leste—making themparticularly vulnerable to economic shocksand volatility; they also face unique chal-lenges in sustaining support from donors.Clearly, LICUS face the most difficult cir-cumstances for meeting the MDGs andother development goals. Hence the impor-tance of focused attention on their specialneeds, a central topic of the recent Senior-Level Forum on Development Effectivenessin Fragile States hosted by the U.K. Depart-ment for International Development (DFID)and co-sponsored by the European Com-mission, OECD Development AssistanceCommittee (DAC), United Nations Devel-opment Programme (UNDP), and WorldBank.3 The forum led to support by theOECD DAC High Level Meeting in March2005 for a new set of principles for interna-tional engagement in fragile states, and anagreement to pilot them in donor programsin seven countries.4
Among the 25 LICUS in fiscal 2005, theWorld Bank has been working closely with 15focus countries, while providing more generalsupport to the larger group.5 For the 8 focuscountries where the Bank had previously dis-engaged, there have recently been countrymissions to all, along with analytic work toregain basic knowledge. These reengagementactivities have proved critical in positioningthe Bank to move quickly when necessary, ashas happened recently in Haiti, Liberia, andSudan. Of the $25 million in the LICUSimplementation trust fund approved by theBank’s Board in March 2004 to support gov-ernance and social service delivery in coun-tries in arrears to the Bank, grants totaling$20 million have been approved for the Cen-tral African Republic, Comoros, Haiti,Liberia, Somalia, and Sudan.

Of the LICUS, 14 are also members ofthe AfDB, 9 of the ADB, 3 of the EBRD (ofwhich 2 are also members of the ADB), and1 (Haiti) of the IDB. Responding to theAfrican Development Fund’s Deputies inthe context of the recent replenishmentprocess, the AfDB is preparing a compre-hensive strategy for institutional engage-
ment, with implementation of the strategyto begin later this year. In the meantime theAfDB is continuing to implement its Post-Conflict Country Facility, approved by itsBoard in July 2004.6
The ADB is developing an approach forworking with fragile states in the context ofthe Asian Development Fund’s IX replenish-
C H A P T E R 6
194 G L O B A L M O N I T O R I N G R E P O R T 2 0 0 5
A recent review by the World Bank’s independent Operations Evaluation Department (OED) foundthat the poverty reduction strategy (PRS) initiative is relevant to the development challenges in low-income countries and warrants continued World Bank support. But according to OED, the initia-tive has not yet fulfilled its full potential to enhance poverty reduction efforts in low-incomecountries because it has led countries to focus more on completing documents—which give themaccess to resources—than on improving domestic policies and practices. Other identified weaknessesinclude the absence of an effective mechanism for adapting the initiative to different country con-ditions, especially in the context of the weak public sector capacity found in most low-income coun-tries. Moreover, most PRSs pay too little attention to infrastructure, rural development, and otherareas with substantial growth and poverty reduction potential. External partners have supportedPRS formulation, and changes in donor processes are evident—but donors have not specificallydefined whether and how they should change the content of their programs to reflect PRSs.
The review also assessed the World Bank’s role in the PRS initiative. Most problematic in OED’sview, the Bank’s process for presenting PRSs to its Board undermines country ownership. The JointStaff Assessment mechanism was designed to provide the Bank and IMF Boards with an assessmentof the soundness of a country’s PRS as a basis for support; it was also designed to provide feedbackon how a PRS could be improved over time. But OED found these assessments to be of mixed ana-lytic quality and coverage, with limited awareness of their findings and recommendations amongstakeholders.
On the positive side, OED found that the World Bank has effectively supported national stake-holders in PRS formulation, that Bank lending since the launch of the initiative has increased forcountries with PRSs completed through 2003, and that economic and sector work has added valueto country planning, with poverty assessments and public expenditure reviews useful for PRS for-mulation. OED also found that the Bank has promoted PRSs as a coordinating framework fordonor activities—although apparently with limited success, in light of the evidence.
Going forward, OED recommends that the World Bank make changes in:
• PRS content, by helping countries address key analytic gaps about the poverty impact of poli-cies and programs.
• PRS process, by emphasizing ways of improving country processes for planning, implementing,and monitoring public actions geared toward poverty reduction; placing less emphasis on com-pletion of documents; and developing a review procedure that is more supportive of ownershipand more effectively linked to decisions about the World Bank’s program.
• Partnerships and alignment, by assisting countries in using the PRS as a partnership frameworkand encouraging government-led aid management and selectivity; and better integrating its assis-tance with the efforts of other partners.
Source: OED 2004e.
BOX 6.2 Independent evaluation of the World Bank’s role in povertyreduction strategies

ment. The approach will emphasize highlyfocused interventions at points where assis-tance can be used effectively, with anincreased emphasis on strategic partnerships.Other issues under consideration include theimportance of an initial assessment ofabsorptive capacity, use of stakeholder andpartner analysis to refine interventions,instruments that allow flexibility in situa-tions where existing institutions are essen-tially nonfunctional, and the potential role ofsubregional cooperation.
Middle-income countries. Some 2.9 billionpeople live in middle-income countries,which range in size from the very small, suchas Dominica (with less than 100,000 people),to the very large, such as China (with almost1.3 billion people). Relative to low-incomecountries, middle-income countries havegreater public and private sector capacity,more resources, and better prospects,although there are large variations acrossmiddle-income countries. Though they haveless poverty than low-income countries, mid-dle-income countries still have too much:They are home to almost 30 percent of allpeople living on less than $1 a day and 40percent living on less than $2 a day.
Few middle-income countries are boundby the PRS process, as they are generally noteligible for concessional funding.7 But theyhave long been in the development driver’sseat and are articulate in expressing theirviews. Most set out clear plans for growthand poverty reduction in the context of theirannual budget and planning documents,which in turn provide the starting point fortheir dialogue with multilateral developmentbanks (and donors). Multilateral develop-ment banks help middle-income countriesthrough a combination of knowledge, lend-ing, and financial services tailored to eachcountry’s needs and circumstances. Theystrive to ensure that their country strategiesrespond to the countries’ diverse needs, ascovered by their mandates. By supportingpolicy and institutional reforms, they aim tocatalyze private investment and support from
other development partners. The access tointernational capital markets of many mid-dle-income countries reinforces the banks’shared premise that their job is to add valuethat private markets cannot or will not—crowding in private sector support, notcrowding it out—a factor to be consideredwhen reviewing trends in lending and nettransfers.
COUNTRY STRATEGIES
The country strategy process forms the basisfor multilateral development banks’ supportfor country development, and in turn for theMDGs. In each case the process begins withthe country’s own priorities—as expressed inPRSs or similar national strategies in low-income countries (including plans for EarlyTransition Countries in the EBRD) and coun-try plans in middle-income countries. Theprocess takes into account participatoryapproaches and performance under earlierstrategies and reflects diagnostic analyses bythe country, the bank, and partners. Optionsfor future support are set out, reflecting thelikelihood of success in contributing to sus-tained growth, the MDGs, and other devel-opment goals. Throughout this process, thebanks’ financial, analytic, and capacity build-ing support is customized to country needs,aimed at ensuring the most effective packagein light of the priorities articulated by thecountry.
All multilateral development banks haveevaluation departments that assess their strate-gies upon program completion, affordingopportunities to test and validate results—including with respect to the banks’ contribu-tions to the MDGs—and lessons for the future(table 6.1). A recent OED retrospective con-cluded that roughly two-thirds of the 70 WorldBank country assistance programs it hadreviewed over the past decade had satisfactoryoutcomes, with tailoring to country contexts,strong knowledge bases, and realistic policyoutlooks considered critical success factors.8
Conversely, the absence of these factors was animportant ingredient in the third of the pro-grams judged unsatisfactory.
S T R E N G T H E N I N G A N D S H A R P E N I N G S U P P O R T F R O M I N T E R N A T I O N A L F I N A N C I A L I N S T I T U T I O N S
G L O B A L M O N I T O R I N G R E P O R T 2 0 0 5 195

Looking to improve their effectiveness,the banks are increasingly focused onresults, with the AfDB, ADB, and WorldBank piloting results-based strategies. Theaim is to sharpen the relevance of the banks’country support programs by focusing oninterventions with the greatest expectedimpacts and to improve their implementa-tion through enhanced monitoring andevaluation using clearly identified indica-tors and baselines. The EBRD’s countrystrategies do not have results indicators assuch, but they do contain transition indica-tors, which are also included in unit busi-ness plans. The IDB’s Office of Evaluationand Oversight (OVE) has consistently iden-tified the need for better “evaluability” of
the bank’s country strategies and projects,including better results frameworks incountry strategies and indicators for mea-suring progress.9
F I N A N C I A L S U P P O R T
Multilateral development banks providefinancial support through lending, grants,and debt relief under the Heavily IndebtedPoor Countries (HIPC) Initiative.
Lending. Lending by multilateral develop-ment banks serves two development pur-poses: financial, and policy and institutional.Recent growth in concessional lending com-mitments has been driven by IDA, with sup-port for Sub-Saharan Africa growing
C H A P T E R 6
196 G L O B A L M O N I T O R I N G R E P O R T 2 0 0 5
TABLE 6.1 Country strategies of multilateral development banks
World Bank EBRD Country
AfDB Country ADB Country Country IDB Country AssistanceIssue Strategy Paper Strategy Paper Strategy Strategy Strategy
Basis for strategy’s PRS for low-income PRS or national PRS or national PRS for low-income PRS for low-income country vision and countries; national strategy for low- strategy for Early countries; country countries; country objective development plans income countries; Transition Countries; documents for documents for
for middle-income country documents country documents middle-income middle-incomecountries for middle-income for middle-income countries countries
countries countries
Frequency of bank Every 3 years Every 3–5 years Every 2 years With every new Every 4 yearsstrategy government
Progress report Annual Annual Annual Annual Every 2 years
Results-based Being launched 1 pilot No No 7 pilots completed; strategy? in 2005 completed; assessment
2 under way under way
Strategy completion To be launched Under No, but lessons No, but lessons 7 completed; report? with results-based consideration reflected in reflected in discussed
strategies as part of new strategies new strategies with Boardresults-based
strategies
Independent 5 completed; 8 completed; 2 completed Conducted for Conducted every evaluationa 4 under way 3 under way every strategy; 8–10 years;
17 completed 70 completed
Overall strategy Under way Under consideration Every 5 years No Every 3–4 yearsretrospective?
Source: Staff of the Big 5 multilateral development banks.a. Country program evaluations carried out by the banks’ independent evaluation departments are available at www.afdb.org; www.adb,org; www.ebrd.com;www.iadb.org; and www.worldbank.org.

sharply in 2000 and 2004, and for East andSouth Asia in 2004 (figure 6.2). Commit-ments for nonconcessional lending havebeen more volatile. World Bank lendingcommitments have fluctuated narrowly, fol-lowing a sharp correction from a spike inpolicy-based lending in 1998–9 thatreflected turbulent conditions in globalfinancial markets for many emerging marketeconomies. For the regional developmentbanks, trends in nonconcessional lendinghave been driven by substantial annual vari-ations in commitments by the IDB, largelyassociated with emergency lending, andstrong growth in EBRD commitments, inpart, reflecting the appreciation of the euro,in which many loans are denominated.
For many years there was a proliferation oflending instruments among the multilateraldevelopment banks, responding to specificrequests from shareholders and clients. Morerecently, attention has focused on the twomain kinds of instruments—project-basedand policy-based lending—with the othersrecognized as variations on these two.10 Allthe banks offer project-based lending (orinvestment lending, as it is often called). TheEBRD does not offer policy-based lending,but it does have a substantial program in equi-ties, equity funds, and guarantees.
Though there are many specific differencesbetween project-based and policy-based lend-ing, they are fundamentally distinguished bythe rules governing the use of the funds they
S T R E N G T H E N I N G A N D S H A R P E N I N G S U P P O R T F R O M I N T E R N A T I O N A L F I N A N C I A L I N S T I T U T I O N S
G L O B A L M O N I T O R I N G R E P O R T 2 0 0 5 197
US$ billions US$ billions
2003200220012000AfDF, AsDF, IDB IDA
1999 2004
12
2
4
6
8
10
20032002200120001999 2004
18
20
468
10121416
All regions—RDBs and IDA All regions—RDBs and IBRDConcessional Nonconcessional
AfDB, AsDB, EBRD, IDB IBRD
US$ millions
2004200220012000AfDF IDA
1999 2003
5,500
5001,0001,5002,0002,5003,0003,5004,0004,5005,000
Africa—AfDF and IDA IDA grants
1,800
200400600800
1,0001,2001,4001,600
2,0002,200
02003 20042002
US$ millions
FIGURE 6.2 Trends in lending and grant commitments by multilateral development banks
Source: Staff of the Big 5 multilateral development banks.Note: Data are for calendar years.

provide, with disbursements of project-basedlending historically tied to complex require-ments for procurement, financial manage-ment, and environmental assessment, andpolicy-based lending disbursed in a moreuntied manner, albeit associated with policyconditionality.11 Recent reforms have nar-rowed the differences between the two instru-ments. Table 6.2 summarizes the status quoin each of the banks, illustrating the trendtoward greater flexibility for both project-based and policy-based lending:
• For project-based lending, reforms aremoving the banks in the direction of sec-torwide approaches (SWAps) and relatedapproaches, allowing greater reliance oncountry systems—where the systems meetagreed standards—and in turn encourag-ing the banks to do more to help countriesmeet those standards.
• For policy-based lending, reforms aremoving the banks toward streamliningconditionality, relying more on countryownership and selectivity to align flows offinancial resources with the policies andinstitutions needed to ensure their effectiveuse—and in turn encouraging the banks tohelp countries design and implement theneeded reforms, often in advance of actuallending.
Grants. Multilateral development bankshave long provided grant facilities, whetherfunded out of net income or donor funds.Traditionally, these have taken the form ofsmall grants to countries, public agencies,and private entities to carry out specifictasks. Such grant funding continues at allthe banks—including on a large scalethrough the IDB’s Multilateral InvestmentFund (MIF), which together with its part-ners has directed more than $2 billion intechnical assistance and investment projectsfor private sector development. Replenish-ment negotiations for MIF II are expectedto be finalized in April 2005, with a clearfocus on poverty reduction and economic
growth and an enhanced focus on measur-able results.
Grant funding to public agencies took agiant step under the IDA13 replenishment,allowing for 18–21 percent of the resourceenvelope to be used for grants. The Africanand Asian Development Funds have takensimilar approaches. Under the recently com-pleted IDA14 replenishment, concerns aboutdebt sustainability led to the expansion ofgrants and mainstreaming of their use for eli-gible countries, based on the WorldBank–IMF debt sustainability framework(box 6.3; see also figure 6.2). Grants underthe African Development Fund X replenish-ment will follow the same approach, with thefund using its own performance assessmentratings for eligible member countries. Simi-larly, the grants program under the AsianDevelopment Fund IX replenishment aims toreduce the debt burden of developmentfinance in the region’s poorest countries, helppoor countries accelerate their transitionfrom postconflict situations to peace and sta-bility, combat HIV/AIDS and other infectiousdiseases, and undertake priority technicalassistance.
The HIPC Initiative and debt sustainability.Along with the World Bank and IMF, theregional multilateral development banks haveparticipated in the HIPC Initiative. The esti-mated combined cost to AfDB and IDBbroadly equals the cost to the IMF and is halfthe size of the cost to the World Bank. TheADB is agreeable, in principle, to considerHIPC relief; however, none of its membershas requested it.
Cooperation on debt relief and sustain-ability has taken on a new dimension, withthe African and Asian Development Fundsand IDA starting to allocate grants andcredits based on debt sustainability consid-erations, and with announcements by theG-7 and others of their interest in furtherdebt relief. Plans are under way for theregional development banks to collaborateon debt sustainability analysis—using the
C H A P T E R 6
198 G L O B A L M O N I T O R I N G R E P O R T 2 0 0 5

G L O B A L M O N I T O R I N G R E P O R T 2 0 0 5 199
TABLE 6.2 Lending instruments of multilateral development banks
AfDB ADB EBRD IDB World Bank
Project-based lending
Available? Yes Yes Yes Yes Yes
Share of commitments 77 81 81a 71 78 (IDA)in fiscal 2004 (percent) 61 (IBRD)
Recent reforms Sectorwide SWAps; scope SWAps; SWAps;approaches for use liberalization liberalization
(SWAps) identified of expenditure of expenditure eligibility eligibility
Forward agenda Simplification Developing similar Eliminating Increasing use ofproposals on minimum country systems in liberalizing disbursement procurement;expenditure periods and piloting use of
eligibility “matrix” for foreign country systems exchange financing;b for environmental
increasing use of and social country systems safeguards;
reviewing conditionality
Policy-based lending
Available? Yes Yes No Yes Yes
Share of 23 19 29 22 (IDA)commitments 39 (IBRD)in fiscal 2004 (percent)
Statutory limit on 25 20 Under New Shares amount or share Lending Framework monitored(percent unless (NLF):b ordinary regularlyc
otherwise indicated) capital, $9.8 billion in 2005–08;
Fund for Special Operations (FSO),
$100 million a year
Recent reforms Development Scope for use None From adjustment budget support of program-based lending to
loan policy approaches identified developmentpolicy lending
Single-tranche Yes Yes Yes for Yesoperations ordinary capital, permitted? under NLF;b
No for FSO
Stance on Streamlined: Country ownership None explicit Minimize legally conditionality fewer and simpler essential binding conditions
Forward agenda Further streamlining Review of program- NLF eliminates Review ofof conditionality based approaches limits on conditionality
under way disbursement periodsb under way
Source: Staff of the Big 5 multilateral development banks.a. Remainder is equities, equity funds, and guarantees.b. Pending approval by Board of Governors.c. With regard to IDA, the IDA14 Deputies noted that Development Policy Operations (DPOs) should remain below 30 percent of total IDA commitments during the IDA-14 period. Management will monitor annually the overall share of DPOs in IDA countries. If it is projected that it could exceed 30 percent for any year, management will report that projection to the Executive Directors for review and guidance.

C H A P T E R 6
Recent empirical research has emphasized the need to fully consider the specific factors that affectdebt sustainability in low-income countries. It calls for country-specific external debt thresholds thattake into account the importance of policies and exogenous shocks. This recommendation emergesfrom the research finding that the risk of debt distress in low-income countries is inversely correlatedwith the quality of policies and institutions in these countries, and positively correlated with the sever-ity of shocks that may affect them. This research has also formed the basis for a new joint WorldBank–IMF debt sustainability framework for low-income countries. Additional analysis of the risksassociated with exogenous shocks and how country responses might be strengthened is under way—with due consideration being given to the role to be played by the IMF and other partners.
African Development Fund. During the recently concluded discussions for the African Devel-opment Fund X replenishment, donors recommended that terms of financing be based on analysesof country prospects for debt sustainability, and it was agreed that eligibility for the fund’s grantswill be based on the World Bank–IMF debt sustainability framework. This means that eligibilitywill be guided by the same policy-dependent external debt thresholds as used for IDA14, althoughthe African Development Fund will continue using its own country policy and institutional assess-ments to evaluate the performance of its member countries. Meanwhile, the share of grants has beenmore than doubled under this replenishment, to nearly 45 percent. Under the African DevelopmentFund IX replenishment, as under IDA13, the grant share was limited to 18–21 percent of totalresources and covered multiple objectives.
Asian Development Fund. Negotiations for the Asian Development Fund IX replenishment wereconcluded before the IDA14 and African Development Fund X negotiations were finalized. TheAsian Development Fund’s IX grants program is similar to the IDA13 and African DevelopmentFund IX programs, incorporating a 21 percent limit on the overall grant share and broad coverage,including grants for debt-vulnerable poorest countries, postconflict countries, HIV/AIDS opera-tions, and priority technical assistance. Donors recommended that the Asian Development Fund IXgrants program be assessed during the fund’s midterm review and that the fund coordinate closelywith the World Bank and IMF on debt sustainability issues.
IDA. Participants in the IDA14 replenishment discussions recommended that debt sustainabil-ity be the primary determinant of the program’s grant and credit mix. They agreed that IDA shouldadopt the Bank–IMF debt sustainability framework for low-income countries as the analytic basisto link debt sustainability and grant eligibility in IDA14. Therefore, unlike in IDA13, grants inIDA14 will no longer be allocated according to multiple, special-purpose eligibility criteria. InIDA13 the overall grant share was expected to fall between 18 and 21 percent of the total resourceenvelope, covering postconflict countries, countries with per capita gross national income below$360 a year, debt-vulnerable poorest countries, and HIV/AIDS and natural disaster relief projects.Under the new grant allocation system the share of grants in total IDA financing will emerge froma country by country analysis of the risk of debt distress. The resulting overall grant share isexpected to be around 30 percent.
Sources: Kraay and Nehru 2004; IMF and World Bank 2004a; African Development Fund 2004; AsianDevelopment Fund 2004; World Bank 2005f.
BOX 6.3 Grant financing in the African and Asian Development Funds and IDA
new debt sustainability framework (see box6.3)—to provide a common platform forjudgments on the mix of financial assistanceprovided to low-income countries. This alsomoves in the direction previously recom-
mended by OED, which had found that theWorld Bank and its partners did not alwayscalibrate the size and financing of theirassistance to recipients’ debt carryingcapacity.12
200 G L O B A L M O N I T O R I N G R E P O R T 2 0 0 5

Cross-country determinants of financial sup-port. While within-country lending andother resource allocation decisions aredetermined through country strategy andprogramming processes, cross-country allo-cations are determined differently. To allo-cate their scarce concessional funds inlow-income countries, the four banks withconcessional windows—the AfDB, ADB,IDB, and World Bank—follow broadly sim-ilar performance-based allocation processes.Country policy and institutional assess-ments are carried out by staff as part of anallocation formula that also takes intoaccount population, degree of poverty, andtrack record for effective use of multilateraldevelopment bank funds. As discussed else-where in this report, the criteria used by thebanks are converging, as are the scores forcountries rated by two banks.
Recent research has examined the selec-tivity of the concessional assistance providedby the multilateral development banks andother agencies. The findings suggest thatselectivity in aid allocation by the banks, asmeasured by the policy and poverty elastici-ties of their aid, is generally high—bothabsolutely and relative to bilateral donors—and has held up well in recent years, with amodest trend toward further improvement(figure 6.3; see chapter 5, table 5.1, for moredetails on the calculation of these elastici-ties). The Asian Development Fund’s alloca-tions are the most targeted to the poorcountries within its region, followed byIDA’s. On policy selectivity, the AfricanDevelopment Fund is the most selective forcountries with good policies and institutionswithin its region, followed by the AsianDevelopment Fund and IDA—which theresearch suggests are also well aligned withpolicy performance. Meanwhile, the perfor-mance-based allocations of the banks’ con-cessional financial resources precludesubstantial financial allocations to low-income countries under stress (LICUS),where the banks continue to engage throughfocused capacity building to help restoreessential state functions and through social
service delivery to the most vulnerablegroups, in some cases relying on trust fundsupport.
For middle-income countries the level ofthe banks’ support is determined by institu-tional financial constraints, country credit-worthiness considerations, and countrydemand factors. In recent years—especiallyin the context of the negative net transferpositions of the ADB, IDB, and WorldBank—country demand has received muchattention from the banks, reflecting “cost ofdoing business” concerns cited by develop-ing country members as a factor discourag-ing them from borrowing from the banks forinfrastructure and related investments,13
along with other constraints such as limitedfiscal space. The banks are implementingbroadly similar reforms to respond to theseconcerns, which are also being applied tolow-income borrowers. Being developedunder different names—the New Partner-ship Framework in the AfDB, New LendingFramework in the IDB, and Middle-IncomeCountry Action Plan in the World Bank—these initiatives have involved a healthyrethinking of many bank processes, leading
S T R E N G T H E N I N G A N D S H A R P E N I N G S U P P O R T F R O M I N T E R N A T I O N A L F I N A N C I A L I N S T I T U T I O N S
G L O B A L M O N I T O R I N G R E P O R T 2 0 0 5 201
9876543210
–1–2–3–4–5–6
IDB Fund forSpecial Operations
AsDF
Policy selectivity Poverty selectivity
Bilateral aidIDAAfDF
FIGURE 6.3 Policy and poverty selectivity of aid from multilateraldevelopment banks, 2003
Sources: Dollar and Levin 2004; World Bank staff estimates.

them toward more risk-adjusted approachesthat are also likely to enhance the efficiencyof operations even as they contribute tocountry capacity building through the afore-mentioned increased attention to countrysystems.
A N A L Y T I C A N D C A P A C I T Y B U I L D I N G S U P P O R T
The multilateral development banks alsocontribute to country development throughtheir analytic and capacity building sup-port—both in terms of their inputs into theselection, design, and implementation oflending operations and in terms of the morefundamental challenge of helping countriesmanage their development efforts, regardlessof the financing source. While the banks’analytic work is important for all developingmember countries, it is relatively moreimportant for the countries at the oppositeends of the performance spectrum, given therelatively smaller financial role played by thebanks in those countries: for middle-incomecountries, targeted analytic support addsvalue that can catalyze private financing; forLICUS, more basic capacity building supportis key. Future Global Monitoring Reportscould usefully quantify the banks’ contribu-tions in the various areas of analytic andcapacity building support. But this willrequire further work, including agreeingamong the banks on appropriate metrics andmonitoring tools.
Analytic work. Economic, technical, and sec-tor work underpins the multilateral develop-ment banks’ policy dialogue with membercountries—on policies, strategies, lending,and capacity building support. In its 10-yearretrospective on 70 World Bank country pro-grams, the Bank’s Operations EvaluationDepartment (OED) found that economic andsector work was critical for good outcomes,and that successful country programs wereassociated with timely analytic work.14 It alsoconcluded that the absence of analytic workleads to unsatisfactory project outcomes, and
that such work can be an effective vehicle forengaging governments in policy dialogue andinforming civil society. Though the reviewwas focused on World Bank programs, itsbroad conclusions about the importance ofanalytic work are echoed in the evaluationreports of the other multilateral developmentbanks.
• The AfDB’s analytic work is being strength-ened, building on the recommendations ofan independent external evaluation, whichemphasized the work’s central importanceto the Bank’s policy dialogue, countrystrategies, and lending operations.15 To thatend, the Bank has introduced the CountryGovernance Profile as a new diagnostic toolto systematically identify governance-related structural and institutional weak-nesses and inform participatory dialogue. In2004 such profiles were prepared for Benin,Cameroon, Chad, Malawi, Senegal, andSwaziland. The AfDB is also developingPrivate Sector Country Profiles, setting outits private sector strategies for membercountries and building on investment cli-mate assessments and other diagnosticwork.
• Analytic work is the basis for all ADB pol-icy discussions, strategy formulation, andpreparation of lending and nonlendingprograms. Macroeconomic and povertyanalyses and assessments on gender, gov-ernance, private sector development, theenvironment, and other areas provide thenecessary background to formulate theBank’s country strategies, while detailedroadmaps steer operations in individualsectors. The ADB has carried out invest-ment climate surveys in selected Asiancountries, in partnership with the WorldBank.
• The EBRD’s analytic work is mostly con-ducted as part of project due diligence (forexample, market studies and least costanalyses). To support its policy dialogueon the investment climate, the EBRD(together with the World Bank) has under-taken periodic Business Environment and
C H A P T E R 6
202 G L O B A L M O N I T O R I N G R E P O R T 2 0 0 5

Enterprise Performance Surveys (BEEPS).The next round of BEEPS is planned for2005, covering all 26 EBRD borrowers—and, as noted below, the survey is to beextended to all developing countries undera joint initiative of the multilateral devel-opment banks. A parallel EBRD-onlyexercise will focus on Early TransitionCountries. The EBRD’s knowledge trans-fer activities focus on market economyskills for the private and public sectors andon results-based demonstration projects.
• The IDB’s country strategies benefit fromanalytic work carried out in partnershipwith governments and other developmentpartners. Sector policy notes and, increas-ingly, debt sustainability assessments (inboth HIPCs and other countries) arebecoming an integral part of the countrystrategy preparation process, albeit withina highly constrained administrativeresource envelope—as reflected in the find-ings of the country program evaluations ofthe Bank’s Office of Evaluation and Over-sight (OVE), which has identified underin-vestment in economic and sector work asa factor hindering the policy dialogue atthe sectoral and country levels.16
• The World Bank has adopted a partner-ship approach to economic and sectorwork. Carrying out its analysis with bor-rowers helps promote capacity buildingwhile grounding the analysis in countryconditions. Sharing the work with bilat-eral and multilateral partners helps con-tain costs by reducing duplication andpromoting harmonization. Much of theBank’s diagnostic work on country fidu-ciary systems is carried out with partners,a trend also observed in the preparation ofPoverty and Social Impact Assessmentsand Investment Climate Assessments.Growth in the Bank’s economic and sectorwork has begun to level off from the rapidrates recorded several years ago when theBank was overhauling its economic andsector work program. Sector work onhuman and social development and socialprotection, the rural sector and agricul-
ture, and other discretionary topics is gain-ing ground relative to fiduciary diagnosticstudies as gaps in the latter have increas-ingly been filled. But the status of countryfiduciary systems, assessments, and knowl-edge gaps will continue to require carefulattention—especially given the capacitybuilding role played by the multilateraldevelopment banks in helping countriesimplement the financial accountability sys-tems needed to absorb higher aid levels.
Capacity building. Capacity building consti-tutes the quintessential challenge of develop-ment assistance, and support for it isembedded in almost all multilateral develop-ment bank activities. As discussed later in thischapter, support to build capacity in statisticsand managing for results is central to theresults agenda of the multilateral develop-ment banks. Of equal and complementaryrelevance to this report—given the recom-mendations of earlier chapters—is supportfor enhancing countries’ absorptive capacityin managing and accounting for aid (andother resource) flows, in view of the need forincreased volumes if the MDGs are to be met,improving capacity for private sector–ledgrowth, and trade capacity building—partic-ularly for trade facilitation, financial services,and transport infrastructure.
• Aid management. Increasing aid absorptivecapacity requires credible country systemsfor accounting for and managing themoney—including, importantly, fightingcorruption. This involves arm’s-lengthfinancial audits, competitive procurement,and accountable public expenditure man-agement. All the multilateral developmentbanks are working in these areas, withlessons learned shared through the Work-ing Group on Governance, Anti-Corrup-tion, and Capacity Building. Meanwhile, aspart of the shift from enclave projects toSWAps, budget support operations, andbroader lending support vehicles, the banks(and others, such as the U.K. Departmentfor International Development, European
S T R E N G T H E N I N G A N D S H A R P E N I N G S U P P O R T F R O M I N T E R N A T I O N A L F I N A N C I A L I N S T I T U T I O N S
G L O B A L M O N I T O R I N G R E P O R T 2 0 0 5 203

Commission, and IMF) have been helpingto strengthen country systems for manag-ing public funds from all sources, usingdiagnostic instruments such as CountryFinancial Accountability and ProcurementAssessments, Public Expenditure Reviews,and HIPC Public Expenditure Manage-ment Assessment and Action Plans. Allthese efforts focus on the supply side of aidmanagement and have generally receivedsatisfactory marks in evaluation reviews.In a recent review of anticorruption activ-ities, the World Bank’s OED also stressedthe importance of underpinning suchefforts with demand-side initiatives—geared to fostering public support amonga wide spectrum of stakeholders.17
• Investment climate. The multilateraldevelopment banks’ approach to privatesector development has evolved over time,from support for credit institutions to agreater focus on macroeconomic policies,and now to a greater focus on the qualityof a country’s investment climate. Institu-tions—including the “rules of the game”—and associated capacity building effortsare seen as key, and all the banks havemajor programs of support and analysis,including extensive investment climatesurveys.18 As noted, the banks alsorecently announced their intention toextend the BEEPS currently used by theEBRD and World Bank in Europe to alldeveloping countries, opening a new win-dow into the conditions faced by the pri-vate sector in different countrycircumstances. Such country-specific infor-mation is especially valuable given multi-lateral development bank evaluationfindings on investment climate assess-ments, highlighting the need for greaterknowledge of country-specific constraintsand opportunities. Going forward, themultilateral development banks need toensure that this information—and thatemerging from the investment climateassessments and Doing Business surveys—is fully reflected in the design and supervi-sion of their country programs.
• Trade facilitation. The banks are active infacilitating trade, but more needs to bedone, especially to coordinate better—avoiding duplication and gaps in countrycoverage and promoting synergies. TheADB has been supporting customs harmo-nization and streamlining and anti–moneylaundering and other measures, focusing onthe Greater Mekong Subregion and CentralAsia. The EBRD—using donor funds inconjunction with its Regional Trade Facili-tation Programme—has been providingtraining and advisory services to help banksin countries such as Armenia, Azerbaijan,Georgia, and the Russian Federationimprove their international trade financeservices.19 The IDB provides direct loansand guarantees to local financial institutionsto support their trade finance activities,including through its recently establishedRegional Trade Finance Facilitation Pro-gram, while its Multilateral InvestmentFund supports the modernization of cus-toms facilities and border crossingsthroughout Latin America and theCaribbean. Focusing on diagnostic work, in2004 the World Bank carried out Trade andTransport Facilitation Audits in Benin,Chad, Guinea, Malawi, Mozambique,Rwanda, Tanzania, and Zambia—as partof an intensive program of support for Sub-Saharan Africa—as well as in Bangladesh,the Dominican Republic, and Tajikistan. Italso approved 16 new projects with tradefacilitation components, with commitmentlevels more than doubling over the previousyear. Noting the marked shift in WorldBank support from adjustment to tradefacilitation during the 1990s, its OED haslaunched an evaluation of Bank assistanceon trade; the findings should be availablefor next year’s Global Monitoring Report.
Sectoral, Regional, Global, and Research Programs
The multilateral development banks’ countryfocus is supported by four complementaryactivities, considered in turn below. First are
C H A P T E R 6
204 G L O B A L M O N I T O R I N G R E P O R T 2 0 0 5

the banks’ sectoral and thematic strategiesand programs. Second are their regional pro-grams—for addressing regional issues andregional public goods. Third are their globalprograms—for addressing global issues andglobal public goods. Fourth is their research,itself an international public good.
S E C T O R A L A N D T H E M A T I C S T R A T E G I E S ,P R O G R A M S , A N D O U T C O M E S
As the banks have become increasingly coun-try focused, they have relied on sectoral andthematic strategies to guide country strategyformulation, program and project design,and implementation, building on the lessonsof operational experience and research. Thesestrategies set out the banks’ sectoral and the-matic modalities for helping developingmember countries achieve their objectives. Ofcourse, to fully understand the banks’ differ-ent sectoral and thematic orientations, theevidentiary picture needs to go beyond state-ments of strategies and intentions. It mustalso include analysis of actual interventions,assessing how underlying sectoral and the-matic strategies have been reflected in coun-try strategies and programs—as well as in thebanks’ sectoral and thematic “results,” oncetheir interventions have worked their waythrough country systems.
Neither of these other dimensions is easy toaddress across the multilateral developmentbanks with current data. What is sketchedbelow is the very beginning of an analysis thatcould in due course be linked more directly tothe results measurement initiatives beingdeveloped by the banks in other contexts.Taking it further in future Global MonitoringReports will require more in-depth work,including investment by the banks in harmo-nizing their sectoral and thematic classifica-tions for lending and analytic work.
Strategies. In line with the themes of thisreport, all the banks’ strategies stress theimportance of private sector–led growth,infrastructure, governance, and—with theexception of the EBRD—delivery of socialservices. Specifics include:
• The AfDB’s sectoral policies and strategiescover agriculture and rural development,the social sectors (especially education andhealth), fighting HIV/AIDS, integratedwater resources management, water andsanitation, infrastructure, private sectordevelopment, gender and the environment,governance, finance, and regional eco-nomic cooperation and integration.
• The ADB’s sectoral and thematic policiesand strategies set out the Bank’s institu-tional priorities, directions, and guidanceto staff, including for safeguards and gen-der, which were updated last year. At thattime the Bank also reviewed its overarch-ing poverty reduction strategy—assessingprogress, evaluating the conceptual frame-work, and addressing implementationchallenges—and enhanced its countryfocus through alignment with nationalPRSs, introducing capacity developmentas a new thematic priority and integratingtimebound indicators in all operations.
• The EBRD’s sector strategies cover itsmain activity areas—agribusiness, energy,financial sector, microfinance and smalland medium-size enterprises, municipalinfrastructure, property and tourism,transport, and telecommunications—set-ting out the approaches that must be fol-lowed in its operations.
• The IDB’s “2+4+1” program focuses onseven sector strategies developed in 2002–3in the priority areas of the Bank’s institu-tional strategy.20 The seven strategies coversustainable economic growth, povertyreduction and promotion of social equity,modernization of the state, competitive-ness, social development, regional integra-tion, and the environment. In addition,there is an implementation plan for thestrategies, including a series of output indi-cators, designed to help focus Bank actionsand enhance their development impact.
• Among the World Bank’s many sectorstrategies, the most relevant for this reportare those that focus on private sector–ledgrowth in manufacturing, agriculture, andservices, for which the Bank Group—
S T R E N G T H E N I N G A N D S H A R P E N I N G S U P P O R T F R O M I N T E R N A T I O N A L F I N A N C I A L I N S T I T U T I O N S
G L O B A L M O N I T O R I N G R E P O R T 2 0 0 5 205

C H A P T E R 6
206 G L O B A L M O N I T O R I N G R E P O R T 2 0 0 5
21% 21%
31%27%
24% 22%
30%24%
17% 20%
33%
30%
All RDBs All regions, WB All MDBs
Private/productive sector Reform and state modernizationSocial servicesInfrastructure
US$ millions US$ millions
2003200220012000
Infrastructure
1999 2004
16,000
14,000
12,000
10,000
8,000
6,000
4,000
2,000
020032002200120001999 2004
14,000
12,000
10,000
8,000
6,000
4,000
2,000
0
All MDBs: Commitments All MDBs: Disbursements
Reform & state modernizationSocial services Private/Productive sector
FIGURE 6.4 Big 5 multilateral development banks: sectoral distribution of lending, 1999–2004
Source: Staff of the Big 5 multilateral development banks.Note: Data are for calendar years. Sectoral classification of MDB operations is not fully comparable across the institutions, indicating the need for better har-monization of the classification systems to provide a firmer basis for comparison and analysis.
drawing on the synergies across the Bank,International Finance Corporation (IFC),and Multilateral Investment GuaranteeAgency (MIGA)—can provide full-servicesupport; infrastructure, through the BankGroup Infrastructure Action Plan, whichseeks to revitalize this critical sector byinternalizing recent innovations involvingpragmatic approaches, output-based aid,public-private partnerships, and so on;governance, where the focus is on institu-tional development through sustainedreform, effective public financial manage-ment, transparent processes, and anticor-ruption efforts; and the delivery of socialservices, especially for primary educationand health care.
Lending shares and trends. Sectoral lendingshares across the multilateral developmentbanks are summarized in figure 6.4. Measuredby disbursements over the 1999–2004 period,infrastructure is the largest sector for the mul-tilateral development banks as a group. It isalso the largest sector for the ADB and IDBindividually, and for the World Bank overalland in East Asia, South Asia, and Europe andCentral Asia. For African and Latin Americanand Caribbean borrowers from the WorldBank, social sector lending is the largest. Whilenew commitments for infrastructure have beenincreasing, disbursements have been declin-ing—reflecting the lagged effect of develop-ments in the 1990s, when infrastructurecommitments fell because of concerns about

environmental risks, fiscal space, and crowdingout of the private sector, which was expected toplay a larger role than materialized. With infra-structure commitments on a recovery path, dis-bursements will also recover, albeit with a lag.
Regional differences in bank support war-rant further analysis—especially between Asia(where ADB and World Bank sectoral shares aresimilar) and Latin America and the Caribbean(where IDB and World Bank sectoral shares aredifferent). Further analysis is also warranted ofthe different approaches taken by the banks tolending support for state reform and modern-ization, which constitutes a much larger shareof disbursements by the World Bank than by theregional development banks. Such analysescould be undertaken for the next Global Moni-toring Report, including trends in banks’ ana-lytic work across sectors and countries.
Results and evaluations. The methodologicalchallenges of going beyond lending tallies toassess the multilateral development banks’ sec-toral contributions and results are not insignif-icant, involving complex methodological issueson causation and attribution. Adopting a prag-matic approach, the banks are beginning tomeasure their sectoral outputs more systemati-cally—for example in the context of the IDA14Results Measurement System (discussed later inthis chapter). But it is still early in this process,and much work needs to be done to see how tomove credibly from measuring bank-supportedsectoral outputs to outcomes.
Whatever solution ultimately emerges, it islikely to rely heavily on the findings of thebanks’ independent evaluation departments,which have carried out a number of relevantreviews. These generally paint a mixed pic-ture, in which the banks are found to havemade contributions in infrastructure, privatesector development, governance, and thesocial sectors, but where performance couldhave been better—especially at it has affectedcountry, program, and project outcomes,institutional development, and sustainability.While individual findings vary, three themesrun through many of the banks’ sectoral andthematic evaluations:
• The need for clearer evaluability at thedesign stage, with the intended results andmeasurement platform (including indica-tors and baselines) clearly set out alongwith the instruments and modalities ofimplementation.
• The importance of analyzing the politicaleconomy of reform—and the incentives ofkey players in sector reform—to allow thestrategies to take those factors intoaccount and be more likely to lead to sus-tained implementation at the country level.
• The importance of providing countrytypologies for guiding localization, so thatthe strategies can be more easily cus-tomized to country conditions.
R E G I O N A L P U B L I C G O O D S A N D P R O G R A M S
The multilateral development banks supporta number of regional and subregional pro-grams and initiatives in collaboration withother partners, as highlighted below. Espe-cially important for the regional banks, giventheir regional mandates, these programs are amix of regional public goods programs,including for regional infrastructure projects,and multicountry programs.
• Regional cooperation and integration arekey areas for the AfDB, including trans-boundary water rights and river basindevelopment. Support has been providedfor capacity building for regional economiccommunities, development of regionalinfrastructure, creation of an enablingregional environment for the private sector,promotion of sustainable development atthe regional level, and the fight againstHIV/AIDS. The AfDB supports the NEPADSecretariat, the African Union, the GlobalEnvironment Facility (especially on thedevelopment of the Environmental ActionPlan for Africa), and the Africa RegionalCoordination Unit for the UN Conventionto Combat Desertification.
• In Asia the Greater Mekong SubregionProgram has long been a prominent areaof ADB support, promoting cross-country
S T R E N G T H E N I N G A N D S H A R P E N I N G S U P P O R T F R O M I N T E R N A T I O N A L F I N A N C I A L I N S T I T U T I O N S
G L O B A L M O N I T O R I N G R E P O R T 2 0 0 5 207

cooperation in a number of sectorsthrough investments in infrastructure,policy initiatives, and institutional mech-anisms.21 Other regional programs coverthe Pacific Islands, Central Asianregional economic cooperation, SouthAsian subregional economic coopera-tion, the Indonesia, Malaysia, and Thai-land growth triangle, and the Brunei,Indonesia, Malaysia, Philippines growtharea. The Asian Development Bank alsoimplements technical assistance projectsand loans supporting regional coopera-tion. Areas of support range from infra-structure (transport, energy, tradefacilitation) to health (combating infec-tious diseases), environment, urbandevelopment, financial and capital mar-ket development, and capacity buildingin public sector management, includingmanaging for development results. Par-ticularly noteworthy is the collaborationbetween the ADB and IDB on regionalpublic goods—including their joint spon-sorship of the recent Tokyo Forum on theOperational Dimensions of SupplyingRegional Public Goods through RegionalDevelopment Assistance—and ADBleadership on tsunami-related work,including the recent high-level confer-ence it organized22 and its pledged sup-port for an interim tsunami warningsystem.
• The EBRD administers a number ofregional programs supporting private sec-tor development, including for trade facil-itation and small and medium-sizeenterprise development. These programsinclude a series of country-specific subpro-jects, which are monitored and processedas country-level operations. In addition, agrowing number of projects cover morethan one country (for example, regionalequity funds, projects in which sponsorsfrom one country invest in another, andenergy trade).
• The IDB’s approach to regional issueshas long focused on facilitating cross-fer-tilization on policy issues. Its Regional
Policy Dialogue provides a forum forpolicymakers to discuss issues of com-mon concern in its seven network areas(education, natural disasters, environ-ment, central banks and finance min-istries, poverty and social protection,public policy management, and trans-parency), with 15 regional and subre-gional meetings in 2004. Its RegionalTechnical Cooperation Program hasfocused on promoting modernization ofthe state, supporting the private sectorthrough competitiveness strengthening,and addressing social issues of develop-ment. Finally, responding to the growingdemand for regional public goods overthe past decade to support countryreform efforts, the IDB’s Initiative for thePromotion of Regional Public Goods isnow operational. Since its approval inMarch 2004, it has received 35 propos-als for an amount close to $64 million.The initiative will provide up to $10 mil-lion annually to help finance selectedprojects.
• The World Bank supports a large numberof regional programs and initiatives, incooperation with the other multilateraldevelopment banks and relevant partners.Examples of direct relevance to the priori-ties set out in earlier chapters include theTrade and Transport Facilitation in South-east Europe Program, which promotesmore efficient and less costly trade flowsand provides customs standards compati-ble with the European Union; the LatinAmerican regional initiative on infrastruc-ture, in cooperation with the IDB; and thestrategic framework for IDA assistance toAfrica in cooperation with the AfDB andother partners (box 6.4).
G L O B A L P U B L I C G O O D S A N D P R O G R A M S
Like their regional programs, multilateraldevelopment banks’ global programs are amix of global public goods programs andmulticountry programs. As implementing
C H A P T E R 6
208 G L O B A L M O N I T O R I N G R E P O R T 2 0 0 5

S T R E N G T H E N I N G A N D S H A R P E N I N G S U P P O R T F R O M I N T E R N A T I O N A L F I N A N C I A L I N S T I T U T I O N S
G L O B A L M O N I T O R I N G R E P O R T 2 0 0 5 209
Strategic context and visionThe International Development Association (IDA) is the World Bank’s main source of developmentassistance for the world’s 81 poorest countries, including 39 in Sub-Saharan Africa. This year’s inter-national focus on Africa offers unique opportunities—and challenges—for IDA to support Africandevelopment. In February 2005 donor countries reached a milestone agreement to replenish IDA overthe next three years with the largest expansion in two decades—at least 25 percent, to $33 billion—with about half of IDA resources going to Africa. This increase represents a major step in internationalefforts to promote stronger, broadly based economic growth in order to fight poverty and achieve theMDGs. Among other things, the funds will be used to improve access by poor communities to cleanwater, better communications, and power; support private sector development and a better investmentclimate to promote faster growth; provide grants to alleviate severe debt problems in Sub-Saharan Africaand elsewhere; promote transparent assessments of country performance on economic policies, gover-nance, and poverty reduction efforts; better coordinate donor support for these efforts; and fund aninnovative monitoring system of development results. In addition to IDA, Africa’s performance can beenhanced by positive outcomes in other forums, especially the Doha Round of international trade nego-tiations and meetings on the quality and quantity of donor funding, as discussed in earlier chapters.
Against this background, IDA’s outlook for Africa is one of hopeful realism. Hopeful because:
• The New Partnership for Africa’s Development (NEPAD) and the African Union are leading moreactively in the areas of postconflict recovery, economic management, public accountability, and gov-ernance, and promoting regional integration within countries: Ghana, Nigeria, Senegal, SouthAfrica, and others are shaping their economic agendas and taking ownership of their development.
• Macroeconomic management is improving, as are country policies and institutions.• Growth is widening, with 15 countries having maintained growth rates of more than 5 percent
for several years.• Subregional integration efforts are growing.• HIV/AIDS prevention is beginning to show promise.• The Extractive Industries Transparency Initiative is taking root.
But realism is needed as well, because:
• 7 percent growth is needed to achieve the poverty reduction MDG.• Conflict remains a threat to stability, investment, and growth.• HIV/AIDS and malaria are exacting enormous costs in terms of lives, public services, produc-
tivity, and growth.• Aid remains insufficient in terms of both quantity and quality (with weak harmonization and
alignment).
Strategic directionsThe new emphasis in the IDA strategy is to accelerate and deepen shared growth to achieve sus-tained poverty reduction and make faster progress toward the other MDGs, and to increase invest-ment in the assets (human, physical, financial) of poor people to enable them to participate in andbenefit from growth. An action plan is being developed to scale up World Bank activities in the con-text of Commission for Africa, IDA14, and other international efforts. Elements will include:
• Trade and regional integration—focusing on a trade policy agenda that promotes an export pushin agriculture (particularly for commodities with strong processing linkages).
• Agriculture and rural development—developing a multisectoral approach explicitly linked toIDA’s private sector development and infrastructure programs.
• Private sector and infrastructure—concentrating on reducing the transaction costs of doing busi-ness in Africa. The region will have a combined strategy with the International Finance Corpo-
BOX 6.4 IDA’s strategy in Sub-Saharan Africa
C H A P T E R 6
210 G L O B A L M O N I T O R I N G R E P O R T 2 0 0 5
ration (IFC) and the Multilateral Investment Guarantee Agency (MIGA) to help fill the gaps ininfrastructure. Regional projects, concessions, and privatization operations will increase.
• Alignment and partnership—aligning World Bank support consistently with government-ledprograms and processes as well as with other donors.
• Governance, capacity building, and conflict—addressing key dimensions: on governance, clearerbenchmarks will be set for measuring performance in difficult environments, drawing on thework of the UN Economic Commission for Africa; on capacity building, a task force is devel-oping innovations in these areas; and on conflict, Bankwide experiences and lessons point to thevalue of explicit attention to conflict prevention and, in postconflict cases, the need to be engagedearly and deeply.
• Investing in people—focusing on three strategic areas: strengthening frameworks and deliverysystems to accelerate progress toward the MDGs; helping to develop integrated macro-microsystems for social protection and risk mitigation; and emphasizing selected areas of strategicleadership and advocacy, including for infectious diseases (especially HIV/AIDS and malaria)and the education MDGs.
Source: World Bank staff.
agencies geared to supporting country devel-opment, all the banks are involved in helpingtheir clients meet their commitments underinternational agreements governing the pro-vision of global public goods—from peaceand security to disease control and supportfor the global commons to financial stabilityand anti-money laundering, open trade, andknowledge sharing. They are implementingagencies for the Global Environment Facilityand participate in the Global Fund to FightAIDS, Tuberculosis, and Malaria, the GlobalAlliance for Vaccination and Immunization,and so on.
As the single global institution amongthe banks, the World Bank’s support forglobal programs has grown rapidly inrecent years, with 70 different programsfunded by the Bank’s core budget, theDevelopment Grant Facility, and donor-supported trust funds. World Bank supportfor global programs has been the subject ofan extensive evaluation by its OED. TheGlobal Monitoring Report 2004 reportedon the findings of the OED phase 1 report.23
As noted there, OED concluded that theBank had played a useful role in these pro-grams by providing a platform for learning,advocacy, and collaborative action to
address key global challenges. But it gener-ally found the programs to be underman-aged. The phase 2 report finds a lack ofresults orientation, focus on advocacy with-out the necessary resources for technicalassistance or investments, unclear povertyimpacts, and weak knowledge manage-ment.24 OED’s recommendations stress theneed for a global strategy, based on a con-sultative process involving key partners,and better day-to-day management of theexisting global portfolio, designed toenhance returns to Bank country operationsand help set international standards forquality. In line with these recommenda-tions, the Bank has established a small, cen-tral Global Programs and PartnershipsSecretariat to better manage and monitorthese activities and is currently fleshing outits strategy.
R E S E A R C H
Research by multilateral development bankshas helped to articulate the global andregional development agenda, with notablecontributions on aid, private sector–ledgrowth, and trade, as reflected in earlier chap-ters of this report. It has also provided a basisfor the application of emerging lessons at the

S T R E N G T H E N I N G A N D S H A R P E N I N G S U P P O R T F R O M I N T E R N A T I O N A L F I N A N C I A L I N S T I T U T I O N S
G L O B A L M O N I T O R I N G R E P O R T 2 0 0 5 211
country level, albeit somewhat less success-fully according to the banks’ evaluationreviews, which have generally pointed to theneed for greater specificity based on countryconditions. OED, for example, has arguedthat the World Bank’s research on the invest-ment climate provides insufficient guidanceto client governments and staff.25
Meanwhile, consistent with the partner-ship theme of this chapter, another areaidentified for improvement involves cross-fertilization across the multilateral develop-ment banks. At present, the banks’researchers meet in a variety of contexts, butmore systematic approaches would also befruitful, especially given the banks’ differentvantage points—with the regional banksoften intermediating between the globaldevelopment agenda and regional considera-tions. The AfDB and ADB are currentlyreviewing the roles and contributions of theirresearch capacities; it would be useful tobroaden these initiatives to the other banks,and more generally to increase interactionsacross the banks in this area.
• The AfDB has launched efforts toupgrade its research capacity—in tandemwith the strengthening of its economicand sector work discussed above. Theseefforts are focusing on poverty analysis,growth, and debt sustainability; macro-economics and forecasting; public policyand public sector management; agricul-ture and food security; financial sectordevelopment; science, technology, andindustrial development; human capitaland social development; and interna-tional trade and regional integration.
• The ADB undertakes research, includinginnovative, experimental, or theoreticalwork to acquire new knowledge, normallydirected toward a specific purpose such asdeveloping a new policy or evaluating aprogram. The bank’s intellectual workincludes advocacy, capacity building, andresearch, with each of these roles contribut-ing in different ways to development think-
ing and knowledge. In 2004 the ADBadopted a knowledge management frame-work to enhance knowledge sharing amongits clients and to become a better learningorganization. As noted, the Bank is cur-rently carrying out a detailed review of itsresearch function, including analysis ofcost, user demand, and quality, with a viewto enhancing quality and impact.
• Flagship EBRD research publications arethe Transition Report (autumn) andTransition Report Update (spring), whichinclude indicators on progress in transi-tion at the country level, as well as topi-cal analyses. Areas of particular researchinterest include transition economics,social transition, the business environ-ment, energy, infrastructure, and thefinancial sector. The Office of the ChiefEconomist, which oversees EBRDresearch, provides the transition impactratings for projects, which are a key inputfor assessing operational performance.
• Mainstays of IDB research are a focus onmacroeconomics, the private sector, andgrowth; trade and integration; and sectorstrategies and policies. The bank has alsobeen active in supporting regionalresearch networks promoting academicresearch and policy dialogue and instrengthening the research capacity ofregional institutes.
• Research is central to the World Bank’s“knowledge bank” mission, with its agendaevolving in response to operational and pol-icy needs. Its main focus is strategic, anddirected at informing the overall agenda fordevelopment policy and assistance, throughflagship vehicles such as this year’s WorldDevelopment Report on the investment cli-mate and analysis and data critical to inter-national trade negotiations—as in Cancun,Mexico, last year—and the ongoing inter-national dialogue on growth, poverty reduc-tion, trade, and aid effectiveness, especiallywith respect to the mutual contributions ofdeveloping and developed countries, as dis-cussed in earlier chapters.

Partnerships and Harmonization
Virtually everything discussed in this reportinvolves partnerships—at the regional andglobal levels, at the country level, and at theinstitutional level—all touching the issue ofharmonization in one way or another. Alsorelevant are the issues of transparency anddisclosure, which bear on the inclusivenessor exclusiveness of the partnerships underconsideration.
G L O B A L P A R T N E R S H I P S
The multilateral development banks activelyparticipated in the recent Paris High LevelForum on Harmonization, Alignment, andResults, with the heads of the banks endors-ing the Paris Declaration on Aid Effective-ness—setting out specific commitments forfurther alignment, harmonization, andresults.26 All engaged in the Working Party onAid Effectiveness and Donor Practices, abroad partnership of bilateral and multilateraldonors and agencies and representatives ofmore than 16 developing countries, supportedby the OECD’s Development AssistanceCommittee (DAC). The working party wasput in place after the 2003 Rome High LevelForum on Harmonization to facilitate, sup-port, and monitor progress on harmonization,alignment, and managing for developmentresults. The ADB is represented on the work-ing party’s steering committee, and multilat-eral development bank staff chair or co-chairfour of the five subgroups, and contribute sub-stantively to the work of all. The World Bankchaired the steering committee for the Parisforum and has seconded a full-time staff mem-ber to the DAC Secretariat to assist the work-ing party. In preparing for the forum, all themultilateral development banks were involvedin regional workshops organized to ensure theinclusion of country and regional perspectiveson the challenge of harmonization and man-aging for results.
Central to these efforts is the banks’ workin fostering a Global Partnership on Manag-ing for Development Results. To that end,they have established an active working
group, and along with bilateral donors andthe United Nations Development Programme(UNDP) have formed the Joint Venture onManaging for Development Results, underthe Working Party on Aid Effectiveness andDonor Practices. The aims are to harmonizedonor requirements for country resultsreporting around national systems and bettercoordinate donor support for helping coun-tries strengthen their capacity to manage forresults. The main outcome of the global part-nership to date is the convergence of the mul-tilateral development banks around agreedcore principles and results agendas that sharecommon elements and approaches—as dis-cussed below and as reflected in the recentlyissued (draft) Results Sourcebook.27 Buildingon these efforts and the pre-forum regionalworkshops, in Paris the banks committed tosupport regional communities of practice inmanaging for development results, includingthrough a focused learning process in selecteddeveloping countries.
C O U N T R Y - L E V E L P A R T N E R S H I P S
The true test of global partnerships is opera-tional work at the local level: Without follow-through there, the various global meetingsremain talk shops with little impact. At thislevel, the multilateral development bankshave entered into a variety of arrangementswith their developing member countries andother partners—ranging from preparation ofjoint analytic work and strategies to jointoperations and common environmentalimpact assessment procedures. Theseprocesses have been facilitated by the com-mon direction in which the banks have beenmoving on their strategies and lending, assummarized earlier in tables 6.1 and 6.2.Nevertheless, individual personalities andbehavior continue to affect the speed anddepth of progress on institutional commit-ments to partnership. Hence while there aremany examples of good practice, thereremain instances of bad practice, which arelong remembered by those affected. Despitethe sense among many that World Bank cul-ture has changed, its staff continues to be
C H A P T E R 6
212 G L O B A L M O N I T O R I N G R E P O R T 2 0 0 5

considered arrogant by some, including staffof other multilateral development banks, andas reflected more broadly in the World BankGlobal Poll.28
Country strategies and portfolio reviews. Asexamples of good practice, multilateraldevelopment banks are increasingly coordi-nating their country strategies and portfolioreviews with each other and with other part-ners. Coordinated strategies are planned,under preparation, or were recently com-pleted for Bangladesh, Cambodia (box 6.5),Honduras, Nigeria, Tanzania, and Uganda;these exercises involve working with theauthorities to ease administrative burdensand with other partners to coordinateschedules, share diagnostics, and ensureconsistency and balance while avoiding
contradiction and duplication. In LICUS,such as Afghanistan, Guinea-Bissau, Haiti,Liberia, Sudan, and Timor Leste, multilateraldevelopment bank teams are collaboratingclosely with other donors to provide supporton strategy development (including, in somecases, transitional results matrixes andpooled funding mechanisms). Meanwhile,the AfDB, ADB, and World Bank haveundertaken joint portfolio reviews in a num-ber of countries, including Kenya, the KyrgyzRepublic, Mozambique, Rwanda, the Philip-pines, Uganda, and Vietnam.
Operational support. The innovations inmultilateral development banks’ lendinginstruments discussed earlier in this chapterhave opened the door to much greater part-nership at the country level, especially the
S T R E N G T H E N I N G A N D S H A R P E N I N G S U P P O R T F R O M I N T E R N A T I O N A L F I N A N C I A L I N S T I T U T I O N S
G L O B A L M O N I T O R I N G R E P O R T 2 0 0 5 213
The Cambodian country strategies for the ADB, U.K. Department for International Development(DFID), and World Bank were prepared together, all drawing on the country’s poverty reductionstrategy. By working together, the partners aimed to increase coordination and coherence in the pol-icy dialogue and reduce government transaction costs in dealing with them. Meanwhile, the gov-ernment has signaled a greater commitment to country ownership and leadership of thedevelopment and donor coordination process, giving greater attention to project implementationand to enhancement of the level of resource transfers from development partners.
In support of the above, the ADB, DFID, and World Bank have agreed on a “lead agency”approach to implementing their partnership. Under this approach the lead agency in a sector (orsectors) provides primary support for the government’s strategy development and implementation,while providing backup support in other sectors. For example, the ADB has taken the lead in agri-culture and water resources, education, finance, and transportation, while supporting the dialoguein sectors where the DFID or World Bank has the lead role.
The three donors have also developed a set of principles guiding their relationships with eachother and with the government, other international development partners, the private sector, andcivil society. Other partnership initiatives include restructuring government-donor technical work-ing groups at the sector and thematic levels, greater reliance on SWAps, and better harmonizationof donor procedures in project implementation.
The ADB, DFID, and World Bank have cooperated with the government (and with other donors)on the preparation of the Cambodia National Action Plan on Harmonization and Alignment, whichadopts a LICUS approach by placing the burden on donors for initial efforts to reduce transactioncosts and improve information and reporting, rather than waiting for government capacity toimprove before improving donor behavior.
Source: ADB and World Bank staff.
BOX 6.5 Cambodia’s country strategies—coordinating efforts amongmultiple donors

introduction of SWAps by the AfDB, ADB,IDB, and World Bank.29 (See box 6.6 for anexample of a SWAp in support of HIV/AIDSprevention and treatment.) The World Bank’sPoverty Reduction Strategy Credits (PRSCs)are also proving useful for coordinatingdonor support for low-income countries’poverty reduction strategies, with half of thePRSCs currently under implementationinvolving coordination of support and condi-tionality with other donors.
Joint analytic work. Carrying out joint ana-lytic and diagnostic work is a win-winapproach to reducing costs for donors andcountries alike. The multilateral developmentbanks have increasingly conducted analyticwork with other partners, especially for thecore diagnostic and fiduciary reviews thatunderpin lending. To facilitate sharing and
promote collaboration on analytic work, theWorld Bank hosts the Country Analytic WorkWeb site (www.countryanalyticwork.net),which offers major reports from more than25 multilateral and bilateral donor agencies;more than 1,400 reports were added to thesite in 2004.30 It will be important to build onthis initiative by using the database for jointprogramming of analytic and capacity build-ing work, based on identification of gaps andneeds in key areas.
PA R T N E R S H I P S A M O N G I N T E R N AT I O N A LF I N A N C I A L I N S T I T U T I O N S
As noted at the start of this chapter, the busi-ness models of international financial institu-tions differ between the multilateraldevelopment banks on the one hand and theIMF on the other. These differences translateinto differently shaped partnerships across the
C H A P T E R 6
214 G L O B A L M O N I T O R I N G R E P O R T 2 0 0 5
Partly because of work on its poverty reduction strategy (PRS), donor coordination in Malawi isimproving. Major donors and sectoral donor working groups in economic management, povertyreduction, water, and agriculture meet regularly. In addition, donors have been collaborating onsectorwide approaches (SWAps) for development assistance—as evidenced by the MultisectoralHIV/AIDS Project, which supports Malawi’s efforts to reduce HIV transmission, improve the qual-ity of life of those infected and affected by HIV/AIDS, and mitigate the disease’s impact, all centralPRS objectives.
Key project components include a focus on advocacy aimed at changing behavior and prevent-ing HIV transmission, especially among target populations, such as by promoting safer sex andincorporating life skills education and HIV/AIDS information into education curriculums. The pro-ject also focuses on impact mitigation, targeting those infected and affected by the epidemic. Othercomponents are designed to support the work of the National AIDS Commission in preventing andtreating the epidemic, monitoring and evaluating developments, coordinating support for policy-related issues, and managing procurement, financial accountability, and institutional development.
The project is structured as a SWAp and is supported or under consideration for support by anumber of donors, including the African Development Fund, IDA, Canadian International Devel-opment Agency, U.K. Department for International Development, Global Fund to Fight AIDS,Tuberculosis, and Malaria, Norwegian Agency for International Development, United NationsDevelopment Programme, and U.S. Agency for International Development. It involves coordinatedjoint implementation reviews, pooled funding arrangements, a single framework for financialreporting, monitoring, and evaluation (including one set of quarterly financial tables and progressreports for all eight donors), and harmonized procurement.
Source: AfDB and World Bank staff.
BOX 6.6 Malawi’s sectorwide—and multisectoral—approach to HIV/AIDS

institutions. Among the banks, given theirmany parallel concerns and challenges, there isa premium on cross-fertilization and network-ing in the pursuit of good practices that can beadapted to different regional and country cir-cumstances. Between the banks (especially theWorld Bank) and the IMF, given their morecomplementary roles and contributions, thefocus is more on joint products and an appro-priate division of labor in producing them.
Multilateral development bank networks.Consistent with the above, the multilateraldevelopment banks are increasingly function-ing as a federation of networks, operating atalmost as many different levels as the banksthemselves operate. The recent announce-ment that the banks will extend theEBRD–World Bank Business Environmentand Enterprise Performance Surveys (BEEPS)to other regions is but the latest developmentin an ever expanding series of such efforts.Another recent example is the January 2005meeting hosted by the ADB to discuss com-mon challenges in managing the perfor-mance-based allocation systems of the banks’concessional windows—an exercise that islikely to segue into an ongoing workinggroup, especially as the banks move towarddisclosure of country policy and institutionalassessments in early 2006.
Meanwhile, working groups on financialmanagement, procurement, the environment,and capacity building have continued toprogress, with new groups such as the Work-ing Group on Managing for DevelopmentResults energizing bank partnerships across abroad front. These groups have been produc-tive forums for sharing experiences, chal-lenges, and best practices across theinstitutions. Going forward, they should beencouraged to think more boldly and strate-gically, moving beyond the harmonizationagenda to seeing how they might function asfull-fledged networks across the banks. Theyalso should be encouraged to advise on futuredirections for strategic selectivity, whichcould constitute a major theme of the analy-sis of the multilateral development banks in
next year’s Global Monitoring Report,including the division of labor in country,regional, and global programs, building onthe banks’ respective mandates and areas ofcomparative advantage.
World Bank–IMF collaboration. In line withthe earlier discussion and as highlightedbelow in the section on IMF partnerships,three issues continue to be of central impor-tance to the World Bank’s partnership withthe IMF (and of continuing interest to theother banks as well): debt sustainability, thePRS process, and streamlining of structuralconditionality. In addition, two otherthemes warrant highlighting in line with thethemes of this report: collaboration betweenthe Bank’s OED and the IMF’s IndependentEvaluation Office (IEO), and issues sur-rounding public investment in infrastruc-ture. On the partnership between OED andIEO, the collaborative review of the PRSprocess referred to earlier set an importantprecedent and example for future reviews,including by other institutions.31 On infra-structure investment, the Bank and the IMFare working on steps to safeguard produc-tive public investment and improve publicinvestment planning and oversight, whilemaintaining a focus on fiscal and macroeco-nomic sustainability. Following up on workby the IMF’s Fiscal Affairs Department—carried out in close cooperation with theBank and the other multilateral develop-ment banks, particularly the IDB—eightcase studies have been prepared, the prelim-inary findings of which point to little impacton growth of the public investment com-pression under investigation.32 (See alsobelow, where this topic is discussed in thecontext of the IMF’s role and work.)
P A R T N E R S H I P S W I T H C I V I L S O C I E T Y
All the above partnerships are among“insiders”—those with institutional affilia-tions that give them access to information.But for many critics of international finan-cial institutions, the more relevant issue isopenness to “outsiders”—those without
S T R E N G T H E N I N G A N D S H A R P E N I N G S U P P O R T F R O M I N T E R N A T I O N A L F I N A N C I A L I N S T I T U T I O N S
G L O B A L M O N I T O R I N G R E P O R T 2 0 0 5 215

official affiliations and credentials, forwhom access to information and trans-parency of the institutions’ activities are key.Over the past 15 years the multilateraldevelopment banks have adopted formalpolicies for partnering with civil society andfor providing more open access to informa-tion and documents, with a number of fur-ther changes recently approved (by theWorld Bank) or pending or under consider-ation (by the AfDB and ADB). (See table 6.3for the current disclosure status of keyclasses of documents as authorized by thebanks’ Boards of Directors.) Nevertheless,there remain concerns that the banks havenot met a standard of transparency andaccountability commensurate with theirpower and influence in a number of areas,but especially on project implementationand Board deliberations.
Managing for and Measuring Results
This section addresses two points. First, whatare multilateral development banks doing tomanage better for results? Second, what arethey (and others) doing to measure results?
M A N A G I N G F O R R E S U L T S
The conceptual framework for multilateraldevelopment banks defines results as sus-tained improvements in development out-comes at the country level. It posits thatoutcomes can be improved through criticalactions along the results chain that leads frominputs to outputs and in turn to outcomes.For the banks this translates into a focus oncountry capacity and “demand” for results,and on bank strategies and quality. All thebanks have approached the results agenda ina similar manner, providing similar kinds ofsupport to client countries (table 6.4). Theexception is the EBRD, which does not havea program supporting statistical capacitybuilding.
Country pillar. All the banks stress that themost important element of the resultsagenda is the support provided for country-
based systems. The key elements of thecountry pillar are support for public sectormanagement and statistical capacity build-ing. This support has two objectives. First, itaims at increasing the efficiency of countryresource allocation and use—whether at thenational, state, provincial, or local level, orin a given sector (or both). Second, and morenarrowly, it aims at improving implementa-tion of bank-financed operations, throughgreater reliance on country systems for man-aging for results.
Helping countries manage for results is atthe heart of the banks’ public sector man-agement agenda. More specifically, suchefforts call for greater attention to certainaspects, such as building evaluation capacityand developing other vehicles to increaseaccountability in government agencies anddepartments (box 6.7). This process isoccurring in all the banks, whether in thecontext of training staff from project exe-cuting agencies (as in the AfDB and IDB),using technical assistance grants to buildevaluation capacity in borrowing countries(ADB), building evaluation capacity in pro-ject agencies on a project-by-project basis(EBRD), or strengthening country budgetand evaluation systems in the context of pol-icy-based lending (World Bank). The WorldBank, with its partners in the Public Expen-diture and Financial Accountability (PEFA)program,33 has developed standardized per-formance indicators for use in monitoringcountry progress in public financial man-agement, and is widely consulting withdevelopment partners (through the OECD’sDevelopment Assistance Committee) andclient countries. The indicators are part of astrengthened approach to public financereform that emphasizes country leadershipin developing the reform strategy, donorcoordination behind the government strat-egy, and performance indicators for moni-toring progress over time.
Supporting and complementing theseefforts is a major agenda to help countriesbuild their statistical capacity. Without goodstatistics, governments cannot deliver efficient
C H A P T E R 6
216 G L O B A L M O N I T O R I N G R E P O R T 2 0 0 5

TABLE 6.3 Transparency among multilateral development banks
Type ofinformation/stage of development AfDB ADB EBRD IDB World Bank
Country strategy documents
Early draft Yes Not routinely; proposed Yes No Yesin new policy
Final draft Under No No No No(pre-Board) consideration
Final(after Board) Yes Yes Yes Yes Yes
Analytic and project work
Economic and sector Yes Not routinely; proposed Partially Yes Yeswork in new policy
Country policy and Under Yes Yes (Transition No Yesinstitutional assessments consideration Scores in (2005 scores) Transition Report)
Appraisal reports Yes For public sector projects, Partially Yes Yes(excl. privileged yes; for private sector (such as information) projects, no. Environmental
Yes for both proposed Impactin new policy Assessments)
Project supervision No No; updated Project No No Noreports Performance Reports
disclosed in proposed new policy
Project completion Yes For public sector projects, No Yes Yesreports (excl. privileged yes; for private sectorinformation) projects, no.
Yes for both proposed in new policy
Policy papers
Final draft Under No No No No(pre-Board) consideration
Evaluation documents
Bankwide Yes Yes Yes Yes Yes
Country strategies Yes Yes No (country Yes Yesstrategy
evaluations still in pilot
stage)
Sector reviews Yes Yes Yes Yes Yes
Project audits Yes Yes Partially Yes Yes(through summary
documents)Board procedures
Agendas Yes No; proposed in new policy No Yes Yes
Minutes No; but summaries No; proposed in new policy No Yes Yesof Board
discussions, yes
Source: Staff of the Big 5 multilateral development banks.
G L O B A L M O N I T O R I N G R E P O R T 2 0 0 5 217

C H A P T E R 6
218 G L O B A L M O N I T O R I N G R E P O R T 2 0 0 5
TABLE 6.4 Managing for development results in multilateral development banks
Type of support AfDB ADB EBRD IDB World Bank
Country pillarPublic sector management √ √ √ √ √Statistical capacity building √ √ No √ √
Institutional pillarStrategies √ √ √ √ √Projects √ √ √ √ √
Source: Staff of the Big 5 multilateral development banks.
In 2000, with support from the IDB and World Bank, Colombia implemented three emergencysocial programs to help poor people cope with the economic crisis—Familias en Accion, Empleo enAccion, and Jovenes en Accion, collectively known as the RAS (Red de Apoyo Social). Familias isa cash transfer program conditional on school and health center attendance by children; Empleo isan employment program for low-skilled adults. And Jovenes is a job training and subsidy programfor young people from poor neighborhoods. Of the combined $400 million in loans for the pro-grams, $5 million was programmed to be spent on external evaluations.
Highly credible because of their high quality, the evaluations found that the programs are effec-tive tools for crisis management at the household level. For example, the evaluation of Familias enAccion showed that food consumption was 14–24 percent higher among recipients, with no effecton household tobacco and alcohol consumption; school attendance rates were 4–8 percentagepoints higher among program participants age 12–17; and program participants age 0–6 were taller(by an average of 0.75 centimeter) and heavier (by 0.25–0.50 kilograms) than nonparticipants—partly due to less illness among these children, particularly in rural areas.
The evaluations also played an important strategic role. Critics of the Familias program hadargued that it was costly and that its grant money would be poorly spent by beneficiary families,making it a candidate for budget cuts. When the evaluation results were presented to the president,the government’s strategy reversed: the program was not only maintained, but pilots and evalua-tions were conducted to explore the possibility of expansion.
The RAS evaluations also helped institutionalize a culture of evaluation and results-based man-agement in Colombia’s social sectors. While the government had established an evaluation depart-ment, the National System for Evaluation of Results and Public Management (SINERGIA, based onits Spanish name), in the early 1990s, the RAS evaluations gave it a concrete objective. The IDB andWorld Bank worked with SINERGIA to develop its capacity to be a good “consumer” of externalevaluations and to undertake evaluation studies of its own. In recent years technical assistance, grants,policy-based loans, and investment operations have supported SINERGIA’s evaluations of social pro-grams, preparation of legislation requiring periodic impact evaluations of social programs, creationof a multiministerial group on impact evaluation, regular production and dissemination of reportsmonitoring government progress in implementing policies, and a high-profile international conferenceon the importance of impact evaluations to government policy.
Source: Inter-American Bank and World Bank staff.
BOX 6.7 Multilateral development banks’ support to build Colombia’sculture of evaluation

administration, good management, and evi-dence-based policymaking. Nor can citizenseffectively monitor government perfor-mance and make informed decisions abouttheir lives. Thus an effective and efficientnational statistical system, providing thedata needed to support better policies andmonitor progress, is a crucial component ofgood governance and accountability. Sup-port for capacity building in this area com-plements multilateral development banksupport for public sector management inother areas, such as budget management andauditing, and is being provided by all thebanks except the EBRD, as noted earlier.Programs include technical assistance grantsfor statistical capacity development such asthose provided by the ADB. In addition, anumber of joint initiatives, many workingclosely with the PARIS21 initiative, areunder way.34 These include the IDB, UnitedNations Economic Commission for LatinAmerica (ECLAC), and World Bank Pro-gram for the Improvement of Surveys andthe Measurement of Living Conditions(MECOVI), which provides technical andfinancial assistance to improve householdsurveys of social conditions; the AfDB’swork with the International ComparisonProgramme in helping countries collect eco-nomic statistics; and the World Bank’s Stat-cap program, which provides support forthe long-term development of national sta-tistical systems and may involve a series ofgrants or loans as appropriate.
Institutional pillar. Efforts to bolster multi-lateral development banks’ performance andresults focus on country strategies and lend-ing operations—including support for mea-sures to help countries develop their owncapacity to manage for results, as describedabove—with independent and self-evalua-tions playing a key role.
As noted earlier, the AfDB, ADB, andWorld Bank are piloting results-basedapproaches (see table 6.1). The EBRD andIDB are incorporating many features of theresults-based approach in their strategies—
including lessons from past strategies—withthe EBRD focusing on transition impact asits key measure of results and the IDBincreasing the evaluability of its countrystrategies by improving the indicators in itsmatrixes for monitoring the outcomes of itsinterventions. The critical feature is to usethe process to move to a more strategicapproach to country programming, focusedon where the banks can have the biggestimpact and overcoming supply-driven ten-dencies that may linger among sectoral staff.Based on its ongoing review of results-basedcountry assistance strategies (CASs), theWorld Bank plans to introduce ratings intoits CAS completion report process, therebytaking a step toward more systematic self-assessment of achievements of intended CASoutcomes.
Emerging best practice relies on self-assessments by teams, arm’s-length assess-ments by quality assurance groups, andindependent assessments upon completion.Table 6.5 shows where multilateral develop-ment banks are in implementing this bestpractice system. The AfDB has committed, inthe context of African Development Fund X,to the full complement of reviews, to rein-force the positive trends emerging there.35
For the ADB important developments in2004 included the new independence of itsOperations Evaluation Department andimportant steps taken on results-based coun-try strategy papers and the broader resultsagenda. The IDB has also made progress inrecent years—piloting quality-at-entry reviewsfor both project-based and policy-based lend-ing, proposing in its new Medium-TermAction Plan for Improving DevelopmentEffectiveness the launch of a quality-of-supervision exercise as well, and revampingits project completion reporting, includingvalidation of ratings by its independent evalu-ation department (OVE).36 The World Bankhas continued to deepen the pioneering workof its Quality Assurance Group (QAG) andmanagement commitment to act on QAG(and OED) recommendations. In all cases thekey will be effective follow-through.
S T R E N G T H E N I N G A N D S H A R P E N I N G S U P P O R T F R O M I N T E R N A T I O N A L F I N A N C I A L I N S T I T U T I O N S
G L O B A L M O N I T O R I N G R E P O R T 2 0 0 5 219

M E A S U R I N G R E S U L T S
Several approaches to measuring the resultsof multilateral development banks haveemerged in recent years. The first is the prac-tice being developed in the context of replen-ishing the banks’ concessional windows. Ona parallel track, albeit more focused on bankperformance than results, some bank share-holders are developing comparative frame-works for assessing the performance of thebanks and other multilateral agencies, gener-ally with a view to fine-tuning the distributionof their financial support to multilateral enti-ties. Third, civil society organizations aremonitoring the performance of multilateraldevelopment banks in an increasingly sys-tematic manner. Finally, reflecting lessonsfrom these and other efforts, the banks’results teams are developing a comparative
performance assessment framework that canalso be used to underpin future Global Mon-itoring Reports.
Concessional windows. Efforts to measurethe results of concessional lending began withthe adoption of the IDA13 Results Measure-ment System, which had its genesis in donordiscussions in 2001. At that time the multi-lateral development banks’ work on resultswas just beginning to heat up, with the firstroundtable on results held in 2002. Muchdebate, technical analysis, and dialogue withdonors and IDA-eligible countries went intothe construction of the initial approach,which has since been refined for IDA14 andis being analyzed in the context of the AfricanDevelopment Fund and Asian DevelopmentFund systems.
C H A P T E R 6
220 G L O B A L M O N I T O R I N G R E P O R T 2 0 0 5
TABLE 6.5 Project monitoring, evaluation, and reporting in multilateral development banks
Stage AfDB ADB EBRD IDB World Bank
Upstream: arm’slength review ofquality at entry
To be launched in2005 under African
Development Fund X Agreement
Under discussion Ratings assigned byChief Economist’s
Office and Risk Management Vice
Presidency
Piloted for investment and
policy-based lending
Quality AssuranceGroup reviews since
1998
Midstream:arm’s lengthreview of qualityof supervision
To be launched in2005 under African
Development Fund X agreement
Case by casereviews by Operations Evaluation
Department
Project EvaluationDepartment
reviews, as well as(since 2003) transi-tion impact moni-
toring systemmanaged by ChiefEconomist’s Office
and Risk Management Vice
PresidencyRecommended
under Medium-TermAction Plan; timing
not yet agreedQuality Assurance
Group reviews since
1999Completion:share of projectcompletionreports validatedby evaluation
department 50%50% in-depth;
50% normal 40%100% starting in
2004
(0% before 2004)100%
since 1980
Source: Staff of the Big 5 multilateral development banks.

Box 6.8 shows the results of the IDA13measurement system, which were validatedby an independent external audit. The sys-tem focused on several country outcomeindicators (chosen because of data availabil-ity and relevance) and on the delivery ofagreed inputs of analytic work by the WorldBank.
As the World Bank’s results agenda tookshape during 2002–4, the IDA Results Mea-surement System was aligned with it, focus-ing on a broader set of country indicators(more closely aligned with the MDGs butalso reflecting broader objectives includinggrowth, governance, and infrastructure),results-based country strategies, and thequality and outcomes of lending operations.The indicators for the new system forIDA14, agreed in December 2004, are shownin box 6.9.
In line with instructions from its Deputies,the African Development Fund’s ResultsMeasurement System is similar in methodol-ogy to that of a prototype of the IDA14 sys-tem.37 Scheduled for revision in 2005,assessment of the African DevelopmentFund’s performance will occur at the project,institutional (country strategy), and countrylevels through the use of operations qualityindexes, evaluation findings, and changes incountry-level indicators, based mostly oninternationally available statistics.
The ADB is developing a Monitoring andResults Reporting System that is also relevantto the Asian Development Fund. The Bank isreviewing the IDA14 approach, especiallyagainst the backdrop of its mandate as aregional development bank, and plans tointroduce a systematic approach to resultsmeasurement in 2005.
Donor and shareholder initiatives. In parallelwith these efforts, bilateral donors and share-holders have initiated a number of programsto measure the performance of multilateralagencies. Several efforts are just getting underway, while others are quite advanced—including provisions allowing assessed agen-cies to review and comment on the factual
accuracy and other elements of their assess-ments. To date, none of these efforts includevehicles for borrowers or shareholders ofborrowing countries to rate or compare theperformance of multilateral developmentbanks.
The Danish International DevelopmentAgency (DANIDA) relies on ratings struc-tured around a set format to assess the per-formance of each multilateral organization itsupports—including the AfDB, ADB, andWorld Bank—as well as its contribution toeach organization.38 The reporting formspart of the agency’s results measurement sys-tem, set up to assess the effectiveness of Dan-ish multilateral assistance. The results arereflected in DANIDA’s annual high-level con-sultations with each organization.
The U.K. Department for InternationalDevelopment (DFID) rates multilateraldevelopment banks on three dimensions—internal performance, country-level results,and partnerships (figure 6.5). Ratings arebased on DFID assessments of corporategovernance, corporate strategy, resourcemanagement, operational management,quality assurance, staff quality, monitoring
S T R E N G T H E N I N G A N D S H A R P E N I N G S U P P O R T F R O M I N T E R N A T I O N A L F I N A N C I A L I N S T I T U T I O N S
G L O B A L M O N I T O R I N G R E P O R T 2 0 0 5 221
100
50
10203040
60708090
0
Internal performance Country-level results
AfDB AsDB EBRD IDB WB
Partnerships Average
FIGURE 6.5 DFID Scorecard for multilateral development banks
Source: Scott 2005.

C H A P T E R 6
222 G L O B A L M O N I T O R I N G R E P O R T 2 0 0 5
BOX 6.8 IDA13’s Results Measurement System—comparing targets and results
ORIGINAL PROCEDURE, TREND PROCEDURE, Education outcomes 2002 2002
Increase primary completion Target 69 69rate from baseline (percent) Result 70 73
Increase number of countries Target 38 38with positive growth in primary Result 45 43completion rate (number of countries)
Note: The original procedure imputed primary completion rate values for years where no data were available for a specific year on thepremise that the most recent observation from a previous period is the best approximation of the missing year. The trend procedureimputed values for a missing year on the premise that the trend of an indicator remains the same unless a new observation indicatesotherwise.
TARGETHealth outcomes Coverage rate 2001 result 2002 result
Increase in population-weighted coverage 60 61 65rate of measles immunization (percent)
Number of countries with 80 percent coverage 29 27 29
Private sector development TARGET,outcomes 2001–3 RESULT, 2001–3
Reduce time required for business 7 12startup (percent)
Reduce formal cost of business 7 19startup (percent)
COMPLETED between fiscal 2001 TARGET FOR SPRING Analytic inputs and spring 2004 2004
Country Financial 51 40Accountability Assessment
Africa 21 20
Country Procurement 42 38Assessment Review
Africa 19 19
Public Expenditure Reviews 42 40Africa 20 20
Investment Climate Assessment 16 14
Source: World Bank data and Booz Allen 2004.Note: Data are as of 1 April 2004.

S T R E N G T H E N I N G A N D S H A R P E N I N G S U P P O R T F R O M I N T E R N A T I O N A L F I N A N C I A L I N S T I T U T I O N S
G L O B A L M O N I T O R I N G R E P O R T 2 0 0 5 223
Outcome indicators• Share of population below $1 a day poverty
line• Under-five child mortality rate• HIV prevalence rate of pregnant women
age 15–24• Share of births attended by skilled health
personnel• Ratio of girls to boys in primary and sec-
ondary education• Primary school completion rate• Share of population with sustainable access
to an improved water source• Fixed and mobile telephone lines (per 1,000
people)• Formal cost of business startup (percentage
of per capita gross national income)• Time required for business startup (days)• Public financial management (number of
benchmarks met)• GDP per capita (annual growth rate)• Share of rural population with access to an
all-season road• Share of households with electricity
Indicators of IDA performance, fiscal 2005–7
Project level• Share of projects with satisfactory outcome
ratings• Share of projects with satisfactory quality at
entry ratings• Share of first IDA Project Supervision
Reports with satisfactory baseline data onexpected outcomes for projects initiatedafter July 2003
• Share of IDA Implementation CompletionReports with satisfactory data on projectoutcomes
Country level• Number of results-based country assistance
strategies prepared during IDA14
Outputs• Health • Education • Water supply• Transportation
BOX 6.9 Indicators introduced under IDA14’s Results Measurement System
and evaluation, and reporting of results. Rat-ings of internal performance reflect DFIDjudgments of the banks’ project performance,evaluation systems, implementation of strate-gic directions, and transparency. The EBRDreceived the top score in this category. Rat-ings for country-level results reflect, amongother things, DFID assessments of the banks’poverty reduction strategy (PRS) and MDGorientation.39 Here the AfDB and WorldBank had the top scores. On partnerships,which reflect DFID assessments of perfor-mance on harmonization and related issues,the World Bank was rated highest. The WorldBank also had the highest overall scoreamong the multilateral development banks.
In a parallel effort organized by an informalnetwork of like-minded donors—Austria,Canada, Denmark, Germany, the Netherlands,
Source: IDA 2004a.
Norway, Sweden, Switzerland, and the UnitedKingdom—the Multilateral Organizations Per-formance Assessment Network was launched in2002, with an initial focus on the Big 5 multi-lateral development banks (with the exceptionof the EBRD), plus the Pan-American HealthOrganization (PAHO), World Health Organi-zation (WHO), and United Nations Children’sFund (UNICEF). The network’s methodologyrelied on questionnaires of agency staff andknowledgeable stakeholders. The findings ofthe initial pilot, which focused on the health sec-tor, gave the highest ratings to PAHO, the nextto the WHO, UNICEF, and World Bank, andthe next to the regional development banks. Butin providing these scores, the network stressedthe limitations of its methodology—especiallythe fact that many raters lacked familiarity with the regional development banks.40

The U.S. Government AccountabilityOffice (GAO) periodically reviews how wellinternational financial institutions performon various topics. In recent years it hasassessed the sustainability of the HIPCInitiative and the control frameworks ofthe five biggest multilateral developmentbanks.41 The HIPC review concluded thatthe financial shortfalls facing the AfDB,IDA, and IDB will likely be far higher thanprojected because country export earningswill likely be less than those projected by theWorld Bank and IMF, which have assumedexport growth rates higher than historicalaverages.42 On the control frameworks, theGAO found that all the banks had consis-tently received clean audits and had clearinternal and external control frameworks.Nevertheless, in view of what it character-ized as the difficult and challenging environ-ment in which the banks operate, the GAOconcluded that the banks and their memberscould benefit from additional examinationsand reporting by external auditors (as partof the banks’ annual financial statementaudits) in the areas of internal control overlending operations and compliance with keypolicies.
Civil society monitoring. A number of civilsociety organizations and Web sites monitorprograms conducted by multilateral develop-ment banks. These organizations and Websites provide important feedback—typicallyquite critical—on bank activities. One suchorganization, the Bank Information Center,provides important monitoring and otherwatchdog services, especially on the banks’compliance with their operational policies.The center recently launched the Trans-parency Resource, an in-depth database cat-aloguing and comparing the banks’disclosure policies—and concluding that allthe banks need to improve to the highest dis-closure standards.43
Self-assessments. The initiatives describedabove are important for assessing the perfor-mance and contributions of the multilateral
development banks. They reflect the risingdemand for systematic, comparative assess-ments. They also provide useful lessons forassessing performance. The banks’ WorkingGroup on Managing for Results has been dis-cussing options for a joint self-assessmentframework, and now needs to take tangiblesteps, taking into account data from indepen-dent and self-evaluations, feedback from share-holders, borrowers, beneficiaries, researchers,and critics, and lessons from approaches devel-oped by others. Such a framework couldunderpin future Global Monitoring Reports,building on the analysis set out in this chap-ter—especially with respect to the compara-tive tables 6.1–6.5, but also bringing inquantitative information on lending (quantityand quality, including progress in using coun-try systems), grants, and analytic work (suchas poverty and social impact assessments,investment climate assessments, fiduciaryassessments, and support for statistical capac-ity building)—providing metrics, baselines,and indicators for tracking progress overtime. It would take the analysis of the contri-butions of the multilateral developmentbanks a further step beyond processes,toward a greater focus on results.
International Monetary FundThis section describes IMF activities in sup-port of the MDGs within the framework ofthe four-pillar approach set out in the GlobalMonitoring Report 2004 and used above toanalyze the multilateral development banks—country programs, global programs, partner-ships, and results. As with the banks, theIMF’s contribution to the development goalsis largely indirect. The following discussionfocuses on areas of the IMF’s competence andcomparative advantage.
Country Programs
IMF policy advice and financial support helpscountries achieve and maintain macroeco-nomic stability and growth—prerequisites for
C H A P T E R 6
224 G L O B A L M O N I T O R I N G R E P O R T 2 0 0 5

poverty reduction—and recover from crisesand exogenous shocks. The IMF also pro-vides technical assistance, either to resolvespecific problems of policy implementation orto address larger capacity constraints. Inmany developing countries this includestrade-related technical assistance, primarilyin customs administration and tariff policy,aimed at securing effective liberalization oftrade while safeguarding public revenues, orin the context of the Integrated Frameworkfor Trade-Related Technical Assistance,which helps countries prepare to benefit fromtrade liberalization and is expected to helpmainstream trade issues identified in povertyreduction strategies (PRSs).
At the end of 2004 there were 49 IMFarrangements in place, 33 of which wereunder the Poverty Reduction and GrowthFacility (PRGF). One country, Sri Lanka, issupported by blended resources from twoIMF arrangements, a PRGF and an ExtendedFund Facility (EFF). A further 17 arrange-ments were under consideration (of which 4would be with members that already havearrangements in place). Thus a total of 61members—one-third of the IMF’s member-ship—had arrangements in place or underconsideration. Thirteen of these arrange-ments had been approved in 2004, with totalcommitments of SDR 1.8 billion (roughly$2.7 billion at period average exchangerates), compared with 21 new arrangementsin 2003. Seven of these were new PRGFarrangements, for total new commitments ofSDR 534 million ($791 million).
L O W - I N C O M E C O U N T R I E S
IMF support for low-income countries’efforts to achieve the MDGs is providedwithin the framework of the country-drivenPRS approach. The support is predicated onfull country ownership of the priorities andprograms set out in PRSs, reflecting the recog-nition that successful implementation of poli-cies cannot be sustainably imposed fromoutside. Much of the IMF’s work in low-income countries involves countries in Sub-Saharan Africa (box 6.10).
The suitability of the goals of IMF-sup-ported programs in low-income countries inthe context of the MDGs is perhaps bestassessed in relation to the situation of eachcountry. Low-income countries can be distin-guished as mature stabilizers, early stabiliz-ers, or fragile states, with correspondingdifferences in how IMF-supported programsshould be designed.44
Mature stabilizers typically have had sev-eral years of relative macroeconomic stabil-ity; face less binding fiscal and externalfinancing constraints; and have more firmlyestablished and internalized PRS processesand better-defined and -prioritized PRSs.Thus PRGF-supported programs in suchcountries should be expected to:
• Focus on consolidating past gains, andaccelerating and sustaining growth.
• Set macroeconomic targets that allowgreater scope for implementing pro-poorpolicies and improving the investmentclimate.
• Provide for less IMF financing to close bal-ance of payments gaps, as financing con-straints recede.
• Have streamlined conditionality moreclosely aligned with PRS priorities, giventhe greater degree of country ownership.
Early stabilizers, by contrast, usually can-not yet sustain macroeconomic stability,often due to slippages in policy implementa-tion. They still need to consolidate publicfinances, implement key structural reforms,and bring domestic and external debt undercontrol, and they face major balance of pay-ments gaps. They are also often at early stagesof the PRS process, possibly with less well-articulated strategies. In such cases PRGF-supported programs focus on achievingmacroeconomic stabilization, implementingessential structural reforms, building basicadministrative capacity, and, often, recover-ing from external shocks. The extent of therequired adjustment effort and continuingimbalances limit the scope for direct poverty-reducing expenditures, and IMF financing
S T R E N G T H E N I N G A N D S H A R P E N I N G S U P P O R T F R O M I N T E R N A T I O N A L F I N A N C I A L I N S T I T U T I O N S
G L O B A L M O N I T O R I N G R E P O R T 2 0 0 5 225

At the end of 2004 the IMF had financial programs in place in 18 Sub-Saharan African countries,with a total commitment of SDR 1.9 billion, of which roughly SDR 850 million remained to bedrawn. This represented a small decline over 2003, when 21 programs were in place. All of theseare Poverty Reduction and Growth Facility (PRGF) arrangements. In terms of the Heavily IndebtedPoor Countries (HIPC) Initiative, 10 of 14 countries at the completion point and 12 of 13 at thedecision point are in Sub-Saharan Africa. For the first group, nominal debt relief delivered hastotaled $20.3 billion, and for the second group, $23.4 billion (with both figures measured in termsof the net present value in the year of the decision point). More than 80 percent of HIPC debt reliefprovided by the IMF has been to these countries.
Policy adviceThe IMF’s policy advice to Sub-Saharan countries encompasses all its areas of competence and man-date—fiscal and monetary policy, exchange rate issues, trade, financial sector issues (including bankregulation and supervision), and macroeconomic and financial statistics—frequently supported bytechnical assistance. Given the number of PRGF arrangements in place, much of this policy adviceaims to facilitate the policy and structural reforms needed to achieve and maintain macroeconomicstability and reduce imbalances.
Sub-Saharan Africa has seen an overall improvement in fiscal and external balances since theearly 1990s, accompanied by a more prudent financing mix. Inflation has reached historical lowssince 2000, current account deficits have stabilized at moderate levels, and fiscal deficits haveshown further improvement—allowing countries to reduce their recourse domestic financing.There has been an upward trend in spending on health and education, and IMF fiscal policyadvice to countries implementing PRSs has aimed at accommodating increases in poverty-reduc-ing expenditures while maintaining a sustainable overall fiscal stance. Particular emphasis hasbeen placed on strengthening domestic resource mobilization to augment the resources availableto fund development and poverty reduction, and on analyzing fiscal and debt sustainability overthe medium term.
Together with the World Bank, IMF staff have placed increasing emphasis on country policy dia-logues on financial sector development and trade as sources of additional growth. Areas of partic-ular importance include enhancing the access of small and medium-size enterprises to financialservices, deepening financial intermediation, and strengthening bank supervision and regulation. Intrade the focus has been on improving the effectiveness of the many regional trade arrangementsand preparing countries to participate more actively in multilateral trade liberalization. The IMFhas also stepped up its efforts to assess the impact of exogenous shocks on Sub-Saharan countriesand to help them deal with them, particularly the impact of declining world cotton prices, and toprepare for the removal of textile quotas.
Technical assistanceSub-Saharan Africa receives about one-quarter of all IMF technical assistance, consistently morethan any other region. Areas of focus include bank supervision and monetary operations, publicexpenditure policy and budget management, customs and tax administration and policy, public debtmanagement, and macroeconomic and financial statistics. One-third of the assistance supportscountries’ poverty reduction efforts and regional issues such as trade and monetary policy. But alarge portion is dedicated to postconflict and isolation cases. Almost two-thirds of the assistancesupports capacity building and policy reforms in IMF core areas. The IMF has opened two regionaltechnical assistance centers, one in Tanzania covering 6 East African countries (in October 2002)and the other in Mali covering 10 West African countries (in May 2003). An increasingly impor-tant share of technical assistance and capacity building support to East and West African countriesis delivered through regular short-term visits, seminars, and training provided by experts at theregional centers. A recent independent evaluation of the centers found that they had increased theefficiency of technical assistance, were responsive to country needs and requests, and were betterable to provide customized assistance due to their proximity. If the centers’ operations prove suc-cessful, three additional centers will be opened to cover all of Sub-Saharan Africa.
Source: IMF staff.
BOX 6.10 IMF activities in Sub-Saharan Africa

will typically play a greater role in closingexternal financing gaps. Finally, conditional-ity is unlikely to be clearly linked to the PRS,which often is not well defined.
Fragile states, often having recentlyemerged from conflict situations, generallylack the political and economic institutions toimplement full-fledged macroeconomic pro-grams or elaborate comprehensive PRSs.They also often face pressing needs forhumanitarian and balance of paymentsfinancing. IMF assistance will thus typicallyfocus on providing technical assistance tohelp rebuild critical institutions of macroeco-nomic management, with limited financialsupport provided through the emergency andpostconflict assistance program.
In broad terms, IMF program designchanges as countries become mature stabiliz-ers. But even in these cases the link between thegoals of IMF-supported programs and nationalstrategies is often not clearly specified—a particular shortcoming when a PRGF-supported program is intended to supportimplementation of a PRS. Macroeconomicoutcomes in low-income countries haveimproved markedly in recent years, reflectingimprovements in policy implementation,higher official financial support, and a rela-tively conducive international environment.At the fore of this improvement is a smallgroup of countries where (relatively) highgrowth rates have been sustained for sometime and macroeconomic imbalances havereceded furthest.
As part of an ongoing review, IMF staffexamined aspects of program design in 15mature stabilizers with PRGF-supported pro-grams.45 The analysis found that:
• In general, annual growth is projected tobe some 5.5 percent, and outcomes havebeen marginally higher. Programs initiallytarget a 4–6 percent range of inflation, butinflation targets have tended to be revisedupward over the course of programs.
• On the fiscal front, programs have gener-ally targeted modest increases in capitalspending and (offsetting) increases in tax
revenues, thus aiming at broadlyunchanged fiscal deficits of around 4.5percent of GDP. Fiscal outturns have beenless expansionary than envisaged, withcapital spending increasing more modestlythan programmed—but with a significantincrease in poverty-reducing spending.
• Programs are largely centered aroundavoiding nonconcessional financing fromboth domestic and foreign sources. Thus,to a large extent, the level of the budgetdeficit seems to be determined by the levelof external concessional financing, asincreased domestic financing is usually nottargeted.
• The growth of reserve and broad moneyhas tended to exceed program targets,accommodating unforeseen declines invelocity. It is unclear whether limits ondomestic financing of the budget in PRGF-supported programs have allowed highercredit growth to the private sector.
I N D E P E N D E N T V I E W S O F T H E I M F ’ SR O L E I N L O W - I N C O M E C O U N T R I E S
A 2004 evaluation of PRSs and the PRGF bythe IMF’s Independent Evaluation Office(IEO) found limited progress in embeddingthe PRGF into national strategies for growthand poverty reduction, despite evidence of agreater pro-poor and pro-growth orientationin PRGF-supported programs. These short-comings are explained by the IEO as reflect-ing a lack of clarity about what the IMFshould be delivering in some areas, and insuf-ficient recognition of the qualitative changesimplied by the PRS approach for the IMF’s“way of doing business.” The IMF’s role inthe PRS process, and by implication thePRGF, are thus seen as falling short of theambitious expectations set out in the originalpolicy documents (box 6.11).46
Other critics echo these points—in partic-ular, IMF-supported programs are seen asconstraining budgets to the envelope of avail-able external financing, rather than consider-ing the policies needed to achieve the MDGsand then identifying and helping to mobilizethe necessary resources. Critics have also
S T R E N G T H E N I N G A N D S H A R P E N I N G S U P P O R T F R O M I N T E R N A T I O N A L F I N A N C I A L I N S T I T U T I O N S
G L O B A L M O N I T O R I N G R E P O R T 2 0 0 5 227

228 G L O B A L M O N I T O R I N G R E P O R T 2 0 0 5
In recent years the IMF’s Independent Evaluation Office (IEO) has conducted several major reviews.This box summarizes the key recommendations of evaluations conducted in 2004. A more com-plete picture of the IEO’s activities can be found in its 2004 annual report.
Poverty reduction strategies and the Poverty Reduction and Growth FacilityThe IEO found IMF participation in the formulation of PRSs to be broader than in previous years,though not necessarily drawing more on country institutions. Ownership results were mixed, withthe least change in macroeconomic policy areas. PRSs had a greater focus on poverty and a some-what stronger results orientation, but largely fell short in providing strategic roadmaps for policyformulation, addressing difficult tradeoffs, setting out clear priorities, and addressing capacity con-straints, particularly in budget and expenditure management.
The IEO found some progress with respect to the key features of PRGF-supported programs setout in the original policy documents, particularly in mature stabilizers—with a marked increase inpoverty-reducing expenditures, greater fiscal flexibility, some streamlining of program conditional-ity, and a greater willingness to consider alternative country-driven policies. But progress was foundto be relatively limited in other areas, with little broad discussion of policy alternatives and of theneed to strengthen country-specific growth analysis underpinning programs, and an absence of clearlinks in program documents between growth, poverty, and macroeconomic policies.
Recommendations included: increasing the flexibility of PRS implementation to better fit specificcountry needs; shifting emphasis from the production of documents to the development of sounddomestic policy formulation and implementation processes; clarifying and redefining the purpose of theIMF–World Bank Joint Staff Assessment mechanism; clarifying the implications of the PRS approachfor the IMF’s operations and strengthening its implementation of that role; strengthening prioritizationand accountability on what the IMF is supposed to deliver within the PRS framework; and strength-ening the framework for establishing the external resource envelope as part of the PRS approach.
The IMF’s role in Argentina, 1991–2001The IEO found weaknesses in the IMF’s pre-crisis surveillance of Argentina’s economic policies.There was little in-depth discussion of exchange rate policy until early 1999, and fiscal policy dis-cussions paid inadequate attention to provincial finances and overestimated the sustainable level ofpublic debt. There was also little progress in fiscal structural reforms and a lack of strong structuralconditionality in IMF programs. The critical shortcoming of the crisis management period (2000–1)was a failure to have in place an exit strategy, including a contingency plan, given the known risks.
Lessons drawn included that the IMF should have a contingency strategy from the outset of a cri-sis, with “stop-loss rules” to determine when a change in approach is needed and a clearly defined rolewhen confronting a solvency problem. In addition, assessments of debt and exchange rate sustain-ability should be intensified and expanded to cover vulnerabilities that could surface over the mediumterm. Moreover, the IMF should not enter into a program relationship with a country if there is noimmediate balance of payments need or if there are serious political obstacles to needed adjustmentsand reforms. Finally, the IMF Board should exercise effective oversight of management decisions,based on full access to necessary information and open exchange with management on all topics.
IMF technical assistanceThe IEO evaluation of IMF technical assistance emphasized the need for a medium-term frameworkto define technical assistance priorities, better filters for translating those priorities into resourceallocations, greater involvement by country authorities in defining priorities and deeper commit-ment to implementing technical assistance recommendations, and greater efforts to measure theimpact of such assistance. The evaluation also advocated drawing a clearer distinction between tech-nical assistance provided in support of policy advice or program implementation and that aimed atlonger-term capacity building, and shifting the emphasis from delivering technical assistancethrough missions and short-term assignments back to greater use of long-term resident experts.
Source: IEO 2004.
BOX 6.11 Recent evaluations by the IMF’s Independent Evaluation Office

G L O B A L M O N I T O R I N G R E P O R T 2 0 0 5 229
seized on the perceived lack of willingness toopen up the debate on macroeconomic policyissues. The perceived lack of consistencybetween PRSs and PRGFs makes it difficult todiscern the links between the two and has castdoubts on the extent to which the PRSapproach has generated a greater povertyfocus in IMF-supported programs.47
Some of these problems may reflect short-comings of the PRSs, which seldom contain adetailed discussion of the macroeconomicframework and necessary structural reforms,sources of growth, or the role of the privatesector in generating that growth.48 It is alsounclear in many cases how the priorities ofthe PRS are reflected in budget allocationdecisions.
But the IEO report also points to persistingambiguities about the IMF’s contribution toadvancing the PRS process and achieving theMDGs, as well as overly ambitious expecta-tions of the PRS process itself. Many of thesequestions can be answered through a clear def-inition of the IMF’s role in the PRS approach,and in low-income countries more generally.Such efforts have already begun. Recent staffpapers have set out key elements of a concep-tual framework for the IMF’s role in low-income countries articulated around a set ofguiding principles, and work is under way todefine specific aspects of this role (box 6.12).
Global Programs
As noted in the Global Monitoring Report2004, the IMF plays a key role in promotingand helping to maintain a stable, open globaleconomic and financial environment, and inpreventing and resolving crises. It meets thisresponsibility through its program work;bilateral, regional, and multilateral surveil-lance; ongoing assessments of members’ eco-nomic and financial vulnerabilities; and workon standards and codes.
Of note in the area of surveillance in 2004was the further extension of the IMF’sregional work, reflecting the increasingimportance of regional organizations in eco-nomic and monetary policy. This work
encompasses a broad range of activities—including regular production of notes onregional outlooks and other issues, mainte-nance of dialogues with various regionalforums, and research on regional issues—thatfeed into bilateral and multilateral surveil-lance. Better integration of these activitiesand better assessment of potential global andregional spillovers have been explicitly recog-nized as priority areas of work over the nexttwo years.
In addition to its regular Article IV consul-tations with individual member countries andregional organizations, in 2004 the IMF com-pleted the Biennial Review of IMF Surveil-lance. The review found IMF surveillance tobe generally well focused, but suggested someimprovements, including better integration ofbilateral, regional, and multilateral surveil-lance; fuller treatment in Article IV consulta-tions with the largest IMF members of theglobal impact of their economic conditionsand policies; clearer and more candid treat-ment of exchange rate issues; wider coverageof financial sector issues; and refinements ofthe vulnerability and sustainability assess-ments. The review also noted the scope forArticle IV reports to draw more on analysis ofrelevant issues conducted by third parties,including other donors. Looking ahead, spe-cific monitorable objectives have been pro-posed for assessing the effectiveness ofsurveillance in the next review. It has also beendecided to extend formal procedures for IMFsurveillance of the euro area to the other threecurrency unions; a policy paper on surveil-lance in currency unions is planned for 2005.
In the context of joint work with the WorldBank on standards and codes, by the end of2004 the IMF had completed Reviews on theObservance of Standards and Codes (ROSCs)in 119 countries and Financial Sector Assess-ment Programs (FSAPs) in 18 countries. Inaddition, 82 countries had participated in theIMF’s General Data Dissemination Standards,and 58 countries had subscribed to the SpecialData Dissemination Standards.
In the area of crisis prevention and reso-lution, the IMF continued its monthly vul-
S T R E N G T H E N I N G A N D S H A R P E N I N G S U P P O R T F R O M I N T E R N A T I O N A L F I N A N C I A L I N S T I T U T I O N S

C H A P T E R 6
A conceptual framework for the IMF’s role in low-income countries was presented to its Board inAugust 2004. Although a final decision has not been made on this framework, its key elementsinclude:
• Strengthening PRGF program design through better analysis of growth and greater use of alter-native scenarios and stress tests in dealing with exogenous shocks, systematic integration of fiscaland debt sustainability analyses, analysis of the macroeconomic impact of higher aid flows, andsupport for country authorities in defining the linkages between realistic baseline macroeconomicframeworks and more ambitious frameworks for scaling up efforts to reach the MDGs.
• Improving coordination of IMF support for PRS implementation with efforts by other partners,including by providing timely assessments of the macroeconomic situation.
• Demonstrating the linkages between PRGF arrangements and PRSs, through clear descriptions ofthe alignment of PRGF objectives and conditionality with PRS priorities in PRGF documentation.
In September 2004, partly in response to evaluations of the PRS process by the IMF’s Indepen-dent Evaluation Office and the World Bank’s Operations Evaluation Department, the IMF and BankBoards made several changes in the PRS architecture. These amendments—particularly the elimi-nation of the requirement of Board endorsement of the PRS as the basis for IMF–Bank concessionallending—aim at strengthening country ownership of the PRS process and its underpinning indomestic processes, and reducing the perception of the need for “Washington signoff” on PRSs.
In 2005 the IMF’s Board will consider policy papers that pertain to several aspects of IMF activ-ities in low-income countries:
• Signaling and donor coordination in low-income countries.• The role of IMF staff in the PRS process.• The triennial in-depth review of the PRS process, jointly with the World Bank.• Options and instruments for helping countries deal with exogenous shocks (for example, in Janu-
ary 2005 the Board approved subsidization of the IMF’s emergency assistance for natural disasters).
IMF staff are also elaborating issues related to fiscal policy and public investment, based on ananalytic framework recently tested through eight pilot country case studies. Many of the pilot coun-tries were found to have sizable infrastructure needs. But they also face important tradeoffs andcomplementarities between infrastructure and other investment spending needs (including forhuman capital) and current spending items (such as in health and education). On its own, infra-structure spending may have limited effect in enhancing growth, and the various tradeoffs will haveto be addressed on a case-by-case basis.
In general, countries with a high public debt burden have limited scope for increasing publicinvestment. Moreover, additional room for infrastructure spending cannot result from changes infiscal accounting. Thus desired increases in public infrastructure investment would need to beachieved first and foremost through increases in public savings. The pilot country studies also con-firm that, in general, there is significant scope for improving the quality of government infrastruc-ture spending through better project evaluation, prioritization, and management. In many countriesthis will need to go hand in hand with improving the coverage of fiscal accounts. The IMF andWorld Bank are working together on ways to safeguard productive public investment and improveits planning and oversight within a stable fiscal and macroeconomic framework. The full findingsfrom the pilot country case studies are expected to be available in April 2005.
Finally, as part of its ongoing research on low-income countries, in February 2005 the IMF co-hosted with the World Bank an international conference on macroeconomic issues in low-incomecountries.
Source: IMF 2004b, c.
BOX 6.12 Key elements of the IMF’s role in low-income countries
230 G L O B A L M O N I T O R I N G R E P O R T 2 0 0 5

S T R E N G T H E N I N G A N D S H A R P E N I N G S U P P O R T F R O M I N T E R N A T I O N A L F I N A N C I A L I N S T I T U T I O N S
G L O B A L M O N I T O R I N G R E P O R T 2 0 0 5 231
nerability assessments as part of an earlywarning system that allows emerging prob-lems to be identified and addressed beforethey develop into crises. The IMF has alsoactively supported the introduction of col-lective action clauses and codes of conduct insovereign bond issues. Another area of recentwork concerns the development and refine-ment of financial soundness indicators andpolicies on contingency financing arrange-ments. In addition, increased publication ofpolicy papers and country reports has facili-tated better risk assessment by the privatesector and helped mobilize support for pol-icy actions.
The IMF has also been increasingly activein promoting the coherence of developedcountry policies, as called for in the Monter-rey Consensus. In addition to calls for donorsto increase their official development assis-tance (ODA) consistent with their commit-ments at Monterrey, the primary focus of thiseffort has been on trade-related issues.
Accordingly, the IMF has stepped up itssurveillance of trade-related issues. Since thestart of the Doha Round there has been a sig-nificant focus—in Article IV consultations,management’s public communications, andother forums—on trade policies in largedeveloped countries, especially with regard topolicy spillovers, trade-related macroeco-nomic vulnerabilities, and regional trade ini-tiatives.49 In addition, IMF staff haveundertaken a significant amount of trade-related research.50
The trade focus in IMF-supported pro-grams has shifted from trade policy measuresto trade administration. In 2004 the IMF fur-ther increased its focus on trade vulnerabili-ties in its program work with the introductionof the Trade Integration Mechanism, throughwhich it will support members in designingappropriate adjustment policies to trade-related shocks and provide financial assis-tance to help address any related balance ofpayments problems.51
In 2005 the IMF will complete a review ofits trade policy advice. It is also stepping upits work on remittances, which represent a
potentially major source of developmentfinance (the spring issue of the IMF’s WorldEconomic Outlook will contain a section onremittances) and its participation in variousinitiatives related to efficient management ofnatural resources, including the ExtractiveIndustries Transparency Initiative. The IMF isalso intensifying its analysis of the impact ofHIV/AIDS on country economic performanceand addressing the operational issues con-fronting HIV/AIDS donors in working withIMF staff.
In other areas, the IMF continues to playa major role in implementing the HIPC Ini-tiative and other debt relief proposals. Italso recently participated in two of the taskforces that contributed to the final report ofthe Millennium Project, and continues tocollaborate closely with the UN system inimplementing the PRS approach at thecountry level and in following up on thecommitments made at the Monterrey con-ference.
Partnerships
As noted in the Global Monitoring Report2004, in supporting the PRS approach and inall its activities related to the MDGs, theIMF’s principal partner is the World Bank. Ithas also deepened its partnerships with otheragencies and institutions, including the UNsystem, and intensified the dialogue with par-liaments, trade unions, and nongovernmentaland civil society organizations.
Three areas of cooperation with the WorldBank received increased attention in 2004.First, the framework for debt sustainabilityanalysis, initially developed for middle-income countries, has been jointly adaptedand extended to low-income countries tostrengthen their debt management. This isparticularly important in the context ofpledges of substantial increases in aid flows,as well as concerns over rising debt levels inpost-HIPC completion point countries. Sec-ond, the IMF and the Bank continue theirclose collaboration in further streamliningtheir structural conditionality.52 Third, IMF

and World Bank country teams collaborateclosely to identify needs for analysis of thepoverty and social impacts of plannedreforms in PRSs. While the Bank naturallyhas the lead in many areas, the IMF has cre-ated a special Poverty and Social ImpactAnalysis (PSIA) Unit to conduct some of thisanalysis in the IMF’s areas of competence,identify relevant PSIA work done elsewhere,and support country teams in integrating theresults of PSIA into Poverty Reduction Strat-egy Papers (PRSPs) and IMF programdesigns. The IMF and the Bank also continuetheir close collaboration on policies govern-ing the enhanced HIPC initiative (on toppingup and sunset clause arrangements); and theIMF worked closely with the Bank in prepar-ing the 2004 report to the DevelopmentCommittee on aid effectiveness and financingmodalities.53
The importance of IMF collaboration withother donors in its country work has risenwith the emphasis in the Monterrey Consen-sus on building effective partnerships forachieving the MDGs. Donor coordination insupporting PRS implementation and in align-ing their programs with country priorities is acritical element of the PRS approach, andenhances aid effectiveness by simplifying andharmonizing donor procedures. The IMF hasbeen an active participant in work in theOECD’s Development Assistance Committee(DAC), the Strategic Partnership with Africa(SPA), and other forums to advance the donorharmonization and alignment agenda, leadingup to the Second High Level Forum on AidEffectiveness, held in Paris in March 2005.54
For the IMF a key aspect of this collaborationis its role in providing signals to donors.
The IMF’s partnership with the WTO is ofgrowing importance in the context of theirmutual interests in advancing the DohaRound and further developing the multilat-eral trading system. Management and staff ofboth institutions enjoy excellent workingrelationships and collaborate closely on awide range of issues.55
Another major area of IMF collaborationwith donors is technical assistance. A recent
IEO review of the IMF’s technical assistanceand a forthcoming independent midtermassessment of its African technical assistancecenters underscore the rising importance ofthis collaboration.56 But both reviews alsonoted the absence of an effective medium-term framework for prioritizing and coordi-nating the technical assistance provided bydifferent partners, and argued that a coun-try’s PRS should provide such a framework.About one-third of IMF technical assistanceis funded by other donors.
Finally, the IMF will strengthen its collab-oration with the UN system, particularly theUnited Nations Development Programme(UNDP), in helping countries adapt theMDGs to their specific circumstances, andreflect them in their PRSs. Increasing empha-sis will be placed on enhancing countries’systems for monitoring and evaluating per-formance, consistent with the managing fordevelopment results agenda set out at Mar-rakech in 2004.
Quality and Results
The IMF has several means of ensuring qualitycontrol. First, there are regular reviews of IMFpolicies and facilities, as well as progressreports on, and periodic updates and revisionsof, the operational guidance notes provided tostaff for their implementation. This processensures that policies and facilities are appro-priately adapted to the requirements of IMFmembers and the changing economic environ-ment, and that their implementation by stafftakes into account changing circumstances andemerging best practices. In 2004 reviews andprogress reports of policies and facilities wereconducted in virtually all areas of IMF activi-ties, including surveillance, lending facilities,program design, crisis prevention and resolu-tion, collaboration with the World Bank, theHIPC Initiative, the PRS approach, and stan-dards, codes, and transparency. In early 2005,the Executive Board discussed the review ofthe implementation of the 2002 conditionalityguidelines. Other major assessments plannedfor 2005 include the review of PRGF program
C H A P T E R 6
232 G L O B A L M O N I T O R I N G R E P O R T 2 0 0 5

design and of access policy; and the triennialin-depth review of the PRS approach. Policywork is also informed by the IMF’s ongoingresearch activities, by in-depth analytic stud-ies of specific country experiences in workingpapers and occasional papers, and by theselected issues papers that accompany ArticleIV consultation reports.
Targeted reviews by the IMF’s IndependentEvaluation Office (IEO) are another majorelement of efforts to enhance the quality andeffectiveness of IMF activities. In 2004 theIEO conducted major evaluations of PRSs andthe PRGF, IMF involvement in Argentina, andIMF technical assistance (see box 6.11).Ongoing projects include evaluations of theIMF’s approach to capital account liberaliza-tion; the financial sector assessment program;and IMF assistance to Jordan. The IEO’s workprogram for 2005 may include assessments ofexperiences with structural conditionality,bilateral surveillance in large developed coun-tries, policy advice on exchange rates in thecontext of surveillance, data disseminationstandards, and IMF experience in a low-income economy.
It is difficult to measure the impact of theIMF’s activities because the intended “out-comes”—improved economic stability andperformance among its members, increasedstability of the international economic andfinancial system, and more favorable condi-tions for global growth and prosperity—depend on more than just IMF inputs. Inmost cases results are affected by a variety offactors, including policy implementation andexogenous influences. Moreover, the causal-ity between a specific policy action and agiven result is often difficult to establish or tomeasure in the short term. Comparing thetargets and outcomes of IMF-supported pro-grams is thus complex and difficult, and maynot generate conclusive results to guidefuture action.
In measuring the effectiveness of the IMF’scontributions to the MDGs, it would be use-ful to rely on parameters measuring theextent to which its PRGF is linked to a coun-try’s PRS and has the features set out in the
original policy documents. First and mostimportant is the linkage between the macro-economic framework of an IMF-supportedprogram, the country’s budget, and thepoverty reduction effort. A key issue herewould be how the program contributes toovercoming constraints to growth. An assess-ment of the quality and scope of the policydialogue can give a sense of the extent ofcountry ownership. This includes the natureand extent of IMF staff participation in thePRS process and the method used to set pro-gram targets and objectives—and how theyare adjusted to accommodate higher aidinflows or to reflect the PSIA of criticalreforms. The links between program condi-tionality and PRS priorities, and the timing ofPRGF missions and reviews, would give asense of the alignment of the content andprocess of the PRGF with the PRS.
Performance could be assessed by moni-toring the extent to which IMF program doc-uments frame the PRGF-supported programin terms of the country’s objectives and plansfor reaching the MDGs, and address thesespecific aspects. Combined with regular inter-nal reviews, progress reports, and updates ofguidance notes, evaluations by the IEO, andfollow-up to the conclusions of these andother external reviews, it should be possibleto measure progress over time in adaptingIMF policies and operations to help countriesmeet the challenges of the MDGs.
ConclusionEarlier chapters of this report have analyzedprogress on, and prospects for, meeting theMDGs, identifying priority actions for devel-oping and developed countries alike. Againstthat background, this chapter has consideredhow international financial institutions arecontributing to the international effort toachieve the MDGs and related developmentoutcomes and how they can strengthen andsharpen their support. This section summa-rizes the chapter’s conclusions for the inter-national financial institutions and ends withsome implications going beyond them.
S T R E N G T H E N I N G A N D S H A R P E N I N G S U P P O R T F R O M I N T E R N A T I O N A L F I N A N C I A L I N S T I T U T I O N S
G L O B A L M O N I T O R I N G R E P O R T 2 0 0 5 233

Low-Income Countries
For low-income countries the priorities forinternational financial institutions are to sup-port the deepening of the PRS framework andto align their assistance with that framework.For low-income countries under stress(LICUS), support for building institutionalcapacity is especially important. The goodnews is that recent replenishment agreementsfor the African Development Fund, AsianDevelopment Fund, and IDA have endorseda common approach to reliance on PRSs andnational strategies, including for operational-ization of the MDGs, grants, debt sustain-ability, disclosure of country policy andinstitutional assessments, results-based coun-try strategies, results measurement systems,and special programs for LICUS. As thesereplenishments cover some 95 percent ofmultilateral development banks’ programs inlow-income countries, they provide a solidbase for accelerating implementation of theseinitiatives and harmonizing them across thebanks. Reflecting independent assessments bytheir evaluation departments, the World Bankand IMF need to support stronger countryleadership of the PRS process, while deepen-ing their dialogue with clients on the policyagenda. Clearer country ownership of PRSs,with the Bank and IMF providing their viewsthrough Joint Staff Advisory Notes, will alsohelp clarify the accountabilities of Bank andIMF staff relative to country authorities.
Middle-Income CountriesFor middle-income countries the priority forinternational financial institutions is to con-tinue to adapt approaches and instruments torespond to these countries’ evolving and vary-ing needs, including by streamlining condition-ality and simplifying processing requirementsfor investment lending (also important forlow-income countries). For middle-incomecountries there has been a trend toward har-monization across the multilateral develop-ment banks, albeit at a slower pace than forlow-income countries—reflecting the differen-tiated needs of middle-income countries. These
countries have been vocal in calling for reduc-tions in the costs of doing business with thebanks, especially when those costs arise in thecontext of replenishment exercises for conces-sional funds that they cannot access. Healthycompetition among the banks has led to thetransmission of innovations across them, suchas liberalization of expenditure eligibility cate-gories for investment lending and reliance oncountry systems. Going forward, the banks’increasing collaboration, including their par-ticipation in joint workshops with bilateralagencies on concerns of middle-income coun-tries, should provide a vehicle for more regularcross-fertilization on these issues and help has-ten the speed and transmission of innovation.
Knowledge and Capacity Building
To ensure that the opportunities emerging fromthe recommendations for dismantling tradebarriers and increasing the scale and effective-ness of aid set out in earlier chapters can betaken advantage of, international financialinstitutions need to upgrade their support forand monitoring of country capacity buildingfor trade, private sector–led growth, and pub-lic financial management and accountability.Research by these institutions has helped artic-ulate the global development agenda, makingnotable contributions on trade, aid, and theenabling climate for private sector–led growth,as reflected in earlier chapters. Internationalfinancial institutions have also contributedmuch on building trade capacity—particularlythrough support for trade facilitation, financialservices, and transport infrastructure—and onenhancing countries’ fiduciary and fiscal sys-tems for the absorption of aid. But they need todo more—including systematically trackingkey capacity gaps and investing more in coun-try-level knowledge as a basis for informing thecomposition and design of their own andpartners’ programs. In this context, the recentannouncement that the multilateral develop-ment banks will extend Business Environ-ment and Enterprise Performance Surveys(BEEPS) to all developing countries is espe-cially welcome.
C H A P T E R 6
234 G L O B A L M O N I T O R I N G R E P O R T 2 0 0 5

Partnerships
The multilateral development banks arepartnering more effectively with theirclients, with each other, and with otherdonors. This progress is partly due to thedevelopments cited above with respect toreplenishments of the banks’ concessionalwindows and greater reliance on countrysystems for processing the banks’ funding.In terms of civil society, disclosure remains adivisive issue; despite improvements, manycritics feel that international financial insti-tutions do not meet a standard of account-ability commensurate with their power andinfluence in key areas. But recent and pend-ing changes in AfDB, ADB, and World Bankdisclosure policies signal further progress.Meanwhile, World Bank–IMF relationshave continued to mature, based on com-parative advantage and a mandate-drivendivision of labor highlighted by ongoing col-laboration on PRSs, debt sustainabilityanalysis and its application to concessionaland grant financing, and further streamlin-ing of structural conditionality. Going for-ward, in line with the Paris Declaration onAid Effectiveness, multilateral developmentbanks need to continue to strengthen part-nerships and harmonization by enhancingthe flexibility of their assistance (throughcontinued simplification and use of sector-wide approaches, or SWAps) and promotingthe development and use of country sys-tems—for procurement, financial manage-ment, and environmental assessment.
Results
In 2004 several milestones were reached inbuilding results-based systems in the multi-lateral development banks. These includedcompletion of the first cycle of the IDA13Results Measurement System; adoption ofthe IDA14 and African Development FundX Results Measurement Systems; comple-tion of results-based country strategy pilotsby the ADB and World Bank and their com-mitment (along with the AfDB) to conductfurther pilots in 2005; the IDB’s adoption of
the Medium-Term Action Plan for Develop-ment Effectiveness; the new independence ofthe ADB’s evaluation department; the recentlaunch of the (draft) Results Sourcebookprepared jointly by these institutions andbilateral donors; and the PRS evaluationscarried out jointly by OED and IEO—inaddition to continuing progress on statisti-cal capacity building, results-based publicsector management, the quality agenda, andthe Global Partnership on Managing forDevelopment Results. Meanwhile, the IMFis considering how to conceptualize andoperationalize the results agenda within itsinstitutional framework, drawing on recom-mendations from its IEO. Going forward,the international financial institutions mustcontinue to focus on results and account-ability, by supporting country efforts tomanage for development results (strength-ening public sector management and devel-opment statistics) and advancing internalefforts to enhance the results orientation oftheir country strategies and programs andquality assurance processes. Immediate pri-orities include adoption of a common frame-work for self-evaluation of multilateraldevelopment bank performance and resultsmeasurement, with adaptations that allowfor consideration of IMF operations asmuch as possible, and follow-through on theParis High Level Forum commitment to sup-port regional communities of practice inmanaging for development results, includingthrough a focused learning process inselected developing countries.
Beyond International FinancialInstitutions
The following priorities relate contributionsby international financial institutions to thebroader international institutional context.
H A R M O N I Z A T I O N , A L I G N M E N T , A N D R E S U L T S
The Paris High Level Forum on Harmoniza-tion, Alignment, and Results brought togetherdeveloping countries, bilateral donors, global
S T R E N G T H E N I N G A N D S H A R P E N I N G S U P P O R T F R O M I N T E R N A T I O N A L F I N A N C I A L I N S T I T U T I O N S
G L O B A L M O N I T O R I N G R E P O R T 2 0 0 5 235

funds, UN agencies, civil society, and interna-tional financial institutions to assess progressand chart the way forward, including throughmonitoring of agreed indicators of progress.Key components of the agreement involvealigning international support aroundnational development strategies and usingstrengthened country systems—for publicfinancial management, accounting, auditing,procurement, results frameworks, and moni-toring—to provide assurances that aid will beused for agreed purposes. This agreementplaces a premium on credible analysis of theadequacy of country systems for amounts andmodalities of donor support. It also places apremium on integrating the economic and sec-tor work prepared by international financialinstitutions and others, especially in terms ofassessments of underlying country financialaccountability systems and priorities neededto improve them, within the country-ledframework for capacity development.
M O N I T O R I N G A N D E V A L U A T I O N
Credible monitoring and evaluation are at thecore of an effective multilateral system. Inter-national financial institutions have madeprogress on this front, and it will be impor-tant to bring the PRS approach to bear on theevaluation end of the country programmingcycle, bringing together the multilateraldevelopment banks’ country assistance eval-uations, the OECD Development AssistanceCommittee’s joint donor peer reviews, andthe United Nations Development Pro-gramme’s country program evaluations in away that focuses on agency contributions tothe achievement of country outcomes. But thelessons of a well-functioning monitoring andevaluation system go beyond work on coun-tries, and are also relevant for managingglobal public goods. Ongoing work by theSecretariat of the International Task Force onGlobal Public Goods has focused on the mon-itoring and evaluation efforts of the leadinternational institutions for global publicgoods—such as the IMF for internationalfinancial stability, the World Trade Organiza-
tion for trade, the World Health Organiza-tion for disease control, and the UN SecurityCouncil for peace and security—calling formore systematic attention to them and citingthe IMF’s work with its Article IV consulta-tions, Reviews on the Observance of Stan-dards and Codes (ROSCs), and WorldEconomic Outlook and other reports as agood-practice example.57 It has also called fora periodic apex monitoring report on globalpublic goods, along the lines of the GlobalMonitoring Report. If such a report islaunched, close coordination with the GlobalMonitoring Report process will be needed toensure coherence and avoid duplication.
V O I C E A N D P A R T I C I P A T I O N
Early on, when profiling the multilateraldevelopment banks, this chapter highlightedthe differences in developing country owner-ship shares across them. But the analysis sug-gests that key drivers of bank differences arealso their varying client bases and mandates,with the banks moving in similar directionsin the way they deal with similar clients. TheIMF is also moving in similar directions ontransparency and conditionality, though itsunique mandate continues to set it apartfrom the multilateral development banksdespite the ownership structure it largelyshares with the World Bank. Internationalfinancial institutions have acted progres-sively on transparency, and the reformprocess is still under way. But the voice issue(voting shares and quotas, distribution ofBoard seats) continues to affect the perceivedlegitimacy and effectiveness of the WorldBank and IMF, and constrains their effec-tiveness as partners in the internationaldevelopment system. The 2002 MonterreyConsensus encouraged the Bank and IMF toenhance the participation of developing andtransition economies in their decisionmak-ing, and “thereby to strengthen the interna-tional dialogue and the work of thoseinstitutions as they address the developmentneeds and concerns of those countries.”58
This issue is in urgent need of resolution.
C H A P T E R 6
236 G L O B A L M O N I T O R I N G R E P O R T 2 0 0 5

Notes1. See African Development Fund replenish-
ment documents on www.afdb.org and AsianDevelopment Fund replenishment documents onwww.adb.org.
2. See OED (2004e) and IEO (2004b). 3. See OECD DAC (2005a).4. See OECD DAC (2005b).5. See worldbank.org/INTLICUS/Resources/
taskforceonlicus.pdf.6. The seven countries benefiting from the
facility are Burundi, Central African Republic,Republic of Congo, Côte d’Ivoire, Liberia, Soma-lia, and Sudan. Two other postconflict countriesthat are not yet beneficiaries are Comoros andTogo. The facility is designed to help clear thearrears of eligible countries so that they can qual-ify for debt relief at decision points under theenhanced HIPC Initiative and otherwise reengagewith the African Bank Group and other interna-tional financial institutions.
7. Nine middle-income countries are eligiblefor concessional IDA resources under the smallisland economy exception: Cape Verde, Dominica,Grenada, Maldives, Samoa, St. Lucia, St. Vincentand Grenadines, Tonga, and Vanuatu.
8. See OED (2004g).9. See, for example, IDB (2004f). See also IDB
(2002b, 2003a).10. Strictly speaking, this covers only the major-
ity of instruments. Guarantees and deferred draw-down operations, among others, are sui generis.
11. See ADB (2001).12. See OED (2003c).13. Costs of doing business associated with
long processing and approval times, high front-end costs, and delays to satisfy social and environ-mental requirements have been identified as afactor affecting borrowing from the IDB. See IDB(2004g).
14. See OED (2004g).15. See AfDB (2004a).16. See, for example, IDB (2004d, e). 17. See OED (2004a).18. See http://rru.worldbank.org/Investment
Climate.19. The EBRD’s Project Evaluation Depart-
ment reviewed this program in 2003 and con-firmed its positive transition impact, whilerecommending improvements. See EBRD (2003).
20. See IDB (2004h).
21. See ADB (2004h).22. See http://www.adb.org/Documents/Events/
2005/Rehabilitation-Reconstruction/default.asp.23. See OED (2002).24. See OED (2004f).25. See OED, OEG, and OEU (2004).26. http://www1.worldbank.org/harmonization/
Paris/FINALPARISDECLARATION.pdf.27. See www.mfdr.org/sourcebook.html.28. See World Bank (2003).29. Since 2002, when new fiduciary processes
were introduced to allow the World Bank to partic-ipate in pooled financing arrangements, its lendingusing SWAps has risen. In fiscal 2004, 13 projectsused such approaches, up from 4 in fiscal 2003.
30. Statistics include delivered, ongoing, andplanned documents.
31. See IEO (2004b) and OED (2004e).32. See IMF (2004g).33. The Public Expenditure and Financial
Accountability (PEFA) program, supported by the U.K. Department for International Develop-ment, European Commission, IMF, and WorldBank, among others, was developed to coordinateand integrate participating agency support forcapacity building in areas related to financialaccountability.
34. The Partnership in Statistics for Develop-ment in the 21st Century (PARIS21)—created in1999 by the United Nations, OECD, WorldBank, IMF, and European Union—helps coun-tries develop well-managed and appropriatelyresourced statistical systems as the foundationfor effective development policies. With itsworldwide membership, PARIS21 promotes evi-dence-based policymaking and monitoring in allcountries, especially poor countries. Seewww.paris21.org.
35. See AfDB (2004a).36. See IDB (2004b, c).37. See African Development Fund (2003).38. See Danida (2005).39. These categories were not applied to the
EBRD, given its transition mandate.40. See MOPAN (2003, 2005). 41. See GAO (2001, 2004a, b). 42. The U.S. Treasury, IMF, and World Bank all
provided critical comments on the methodologyused, but the GAO did not take them into account.
43. See http://www.ifitransparencyresource.org/en/Index.aspx.
44. See IMF (2003b).
S T R E N G T H E N I N G A N D S H A R P E N I N G S U P P O R T F R O M I N T E R N A T I O N A L F I N A N C I A L I N S T I T U T I O N S
G L O B A L M O N I T O R I N G R E P O R T 2 0 0 5 237

45. The countries are Albania, Azerbaijan,Bangladesh, Benin, Ethiopia, Guyana, Honduras,Kyrgyz Republic, Madagascar, Mongolia, Mozam-bique, Rwanda, Senegal, Tanzania, and Uganda.
46. See IMF (2000). 47. For example, see Bird (2004), Trócaire
(2004), and Eurodad (2004).48. See, for example, Fox (2004).49. Trade policies formed an important part
of the recently published Sub-Saharan AfricaRegional Economic Outlook; see IMF (2004h).
50. Regional integration was the most promi-nent topic in trade-related research. Other recentstudies include an analysis of the impact ofexchange rate volatility on trade (http://www.imf.org/external/np/res/exrate/2004/eng/051904.htm)and a study of the impact of preference erosion on middle-income countries (http://www.imf.org/external/pubs/ft/wp/2004/wp04169.pdf).
51. See IMF (2004a). In July Bangladeshbecame the first country to obtain funding underthis mechanism.
52. A recent staff study and an evaluation bythe Independent Evaluation Office both confirmeda clear reduction in structural conditionality in
recent PRGF arrangements, and the IMF andWorld Bank are both currently assessing whetherconditionality has in fact decreased, consistentwith rising country ownership of programs (par-ticularly under the PRS approach) and continuingimprovements in policy formulation and imple-mentation in developing countries. See IMF andWorld Bank (2004b).
53. See Development Committee (2004).54. Because IMF-supported programs are often
aligned with members’ budget cycles, at least ini-tially, the alignment of the PRGF with PRSs wouldbe greatly facilitated by the internal alignment ofthe PRS cycle with the budget cycle. The principleof aligning the PRGF with the PRS cycle was dis-cussed by the Executive Board in April 2003; seeIMF (2003a).
55. For example, the August 2004 frameworkagreements call for consultation with the IMF andother agencies to direct resources toward develop-ing economies where cotton is vitally important.
56. See IMF (2005).57. See www.GPGTaskForce.org.58. See World Bank (2004e).
C H A P T E R 6
238 G L O B A L M O N I T O R I N G R E P O R T 2 0 0 5

Chapter 1 Commission for Africa. 2005. Our Common
Interest: Report of the Commission forAfrica. London.
UN (United Nations). 2005. “In Larger Free-dom: Towards Development, Security, andHuman Rights for All.” Report of the Secretary-General, A/59/2005. New York.
UNMP (United Nations Millennium Project).2005. Investing in Development: A Practi-cal Plan to Achieve the Millennium Devel-opment Goals. New York.
World Bank. 2003. World DevelopmentReport 2004: Making Services Work forPoor People. New York: Oxford Univer-sity Press.
Chapter 2Ades, Alberto, and Rafael Di Tella, 1999.
“Rents, Competition, and Corruption.”American Economic Review 89 (4):982–93.
Adam, Christopher and David Bevan. 2005.“Fiscal Deficits and Growth in DevelopingCountries.” Journal of Public Economics89(4): 571–97.
Adserà, Alicia, Carles Boix, and Mark Payne.2003. “Are You Being Served? PoliticalAccountability and Quality of Govern-ment.” Journal of Law, Economics andOrganization 19 (2): 445–90.
Artadi, Elsa, and Xavier Sala-i-Martin. 2003.“The Economic Tragedy of the XXth Cen-tury: Growth in Africa.” NBER WorkingPaper 9865. National Bureau of EconomicResearch, Cambridge, Mass.
Azariadis, Costas, and John Stachurski.2004. “Poverty Traps.” In P. Aghion andS. Durlauf, eds., Handbook of EconomicGrowth. Amsterdam: North-Holland.
Barnett, Steven, and Alvaro Vivanco. 2003.“Statistical Properties of Oil Prices.” In J. Davis, R. Ossowski, and A. Fedelino, eds.,Fiscal Policy Formulation and Implementa-tion in Oil-Producing Countries. Washing-ton, D.C.: International Monetary Fund.
Berg, Andrew, and Anne O. Krueger. 2003.“Trade, Growth, and Poverty: A SelectiveSurvey.” IMF Working Paper 03/30. Inter-national Monetary Fund, Washington, D.C.
Besley, Timothy, and Robin Burgess. 2002.“The Political Economy of GovernmentResponsiveness: Theory and Evidence.”Quarterly Journal of Economics 117 (4):1415–51.
Bloom, David E., David Canning, and JaypeeSevilla. 2003. “Geography and PovertyTraps.” Journal of Economic Growth 8(4): 355–78.
Bosworth, Barry, and Susan Collins. 2003.“The Empirics of Growth: An Update.”Brookings Papers on Economic Activity 2.Washington, D.C.: Brookings Institution.
G L O B A L M O N I T O R I N G R E P O R T 2 0 0 5 239
References

Brunetti, Aymo, and Beatrice Weder. 2003.“A Free Press Is Bad News for Corrup-tion.” Journal of Public Economics 87 (7):1801–24.
Bulir, Ales, and Timothy D. Lane. 2002. “Aidand Fiscal Management.” IMF WorkingPaper 02/112. International MonetaryFund, Washington, D.C.
Burnside, Craig, and David Dollar. 2004.“Aid, Policies, and Growth: Revisiting theEvidence.” Policy Research Working Paper3251. World Bank, Washington, D.C.
Clark, George. 2004. “Productivity in Africa,”Contributions to Investment ClimateAssessments in Senegal, Tanzania, andZambia. World Bank, Washington, D.C.
Clemens, M., S. Radelet, and R. Bhavnani.2005. “Aid and Growth Research, with anEye on Africa.” Background note forGlobal Monitoring Report 2005. WorldBank, Washington, D.C.
Collier, Paul. 2002. “Primary CommodityDependence and Africa’s Future.” OxfordUniversity, Centre for the Study of AfricanEconomies, Oxford.
———. 2003. Breaking the Conflict Trap:Civil War and Development Policy.Oxford: Oxford University Press.
———. 2004. “African Growth: Why a BigPush?” Oxford University, Centre for theStudy of African Economies, Oxford.
Collier, Paul, and Jan Willem Gunning. 1997.“Explaining Economic Performance.”CSAE Working Paper 97/02. Oxford Uni-versity, Centre for the Study of AfricanEconomies, Oxford.
Collier, Paul, and Anke Hoeffler. 2002a. “Onthe Incidence of Civil War in Africa.” Jour-nal of Conflict Resolution 46 (1): 13–29.
———. 2002b. “Aid, Policy and Peace.”Defence and Peace Economics 13 (6):435–50.
———. 2004. “Aid, Policy and Growth inPost-Conflict Societies.” European Eco-nomic Review 48 (5): 1125–45.
Collier, Paul, Anke Hoeffler, and Catherine Pat-tillo. 1999. “Flight Capital as a PortfolioChoice.” Policy Research Working Paper2066. World Bank, Washington, D.C.
Collier, Paul, Anke Hoeffler, and Mans Soder-bom. 2004. “On the Duration of CivilWar.” Journal of Peace Research 41(3):253–73.
Davis, J., R. Ossowski, and A. Fedelino. 2003.“Stabilization and Savings Funds for Non-renewable Resources: Experience and Fis-cal Policy Implications.” In J. Davis, R.Ossowski, and A. Fedelino, eds., Fiscal Pol-icy Formulation and Implementation inOil-Producing Countries. Washington,D.C.: International Monetary Fund.
Devarajan, Shantayanan, William Easterly,and Howard Pack. 2001. “Is Investment inAfrica Too High or Too Low? Macro- andMicro-evidence.” Journal of AfricanEconomies 10: 81–108.
Djankov, Simeon, Rafael La Porta, FlorencioLopez-de-Silanes, and Andrei Schleifer.2002. “The Regulation of Entry.” Quar-terly Journal of Economics 117(1): 1–37.
Djankov, Simeon, Caralee McLiesh, TatianaNenova, and Andrei Shleifer. 2003. “WhoOwns the Media?” Journal of Law andEconomics 46 (2): 341–81.
Djankov, Simeon, Caralee McLiesh, and RitaRamalho. 2004. “Growth and the Ease ofDoing Business.” Processed. World Bank,Washington, D.C.
Dollar, David, and Aart Kraay. 2002.“Growth Is Good for the Poor.” Journal ofEconomic Growth 7: 195–225.
Eifert, Benn, Alan Gelb, and Vijaya Ramachan-dran. 2004. “Business Environment andComparative Advantage in Africa: Evidencefrom the Investment Climate Data.” WorldBank, Washington, D.C.
Eifert, Benn, Alan Gelb, and N. B. Tallroth.2002. “The Political Economy of FiscalPolicy and Economic Management in OilExporting Countries.” Policy ResearchWorking Paper 2899. World Bank, Wash-ington, D.C.
Estache, Antonio and Ana Groicoechea.2004. “A Research Database on Africa’sEconomic Performance.” Processed.World Bank, Washington, D.C.
Estache, Antonio and Tito Yepes. 2004.“Infrastructure Needs: An Update.” World
R E F E R E N C E S
240 G L O B A L M O N I T O R I N G R E P O R T 2 0 0 5

Bank Infrastructure Vice Presidency.Processed. Washington, D.C.
Federation Internationale des Ligues desDroits de l’Homme. 2004. “A HumanRights Approach to the NEPAD and theAPRM.” Paris.
Ghura, Dhanweshwar, Carlos Leite, andCharalambos Tsangarides. 2002. “IsGrowth Enough? Macroeconomic Policyand Poverty Reduction.” IMF WorkingPaper 04/68. International MonetaryFund, Washington, D.C.
Gupta, Sanjeev, Benedict J. Clements,Emanuele Baldacci, and Carlos Mulas-Granados. 2002. “Expenditure Composi-tion, Fiscal Adjustment, and Growth inLow-Income Countries.” IMF WorkingPaper 02/77. International MonetaryFund, Washington, D.C.
Haacker, Markus, ed. 2004. The Macroeco-nomics of HIV/AIDS. Washington,D.C.:IMF.
Hanson, James and S. Ramachandran. 2004.“Lessons from Financial Liberalization.”World Bank. Processed.
Hanson, James and S. Ramachandran,Lessons from Financial Liberalization,2004. World Bank. Processed.
Hausmann, Ricardo, Lant Pritchett, andDani Rodrik. 2004. “Growth Accelera-tions.” NBER Working Paper 10566.National Bureau of Economic Research,Cambridge, Mass.
Hoeffler, Anke. 2002. “The AugmentedSolow Model and the African GrowthDebate.” Oxford Bulletin of Economicsand Statistics 64 (2): 135–58.
IMF (International Monetary Fund). 2003a.“Public Investment and Fiscal Policy.”SM/04/93. Washington, D.C.
———. 2003b. “Update on Implementationof Action Plans to Strengthen the Capacityof HIPCs to Track Poverty—ReducingSpending.” SM/03/90. Washington, D.C.
———. 2003c. World Economic Outlook.Washington, D.C.
———. 2004. “Republic of Congo: SelectedIssues and Statistical Appendix.” CountryReport No. 04/231. Washington, D.C.
———. 2005a. “Stabilization and Reforms inLatin America: A Macroeconomic Per-spective of the Experience Since the Early1990s.” Washington, D.C.
———. 2005b. “African Regional EconomicOutlook—April 2005.” Washington, D.C.
———. Forthcoming. “Monetary and FiscalProgram Design Issues in Post-Stabiliza-tion Countries.” Processed. Washington,D.C.
Kajee, Ayesha. 2004. “NEPAD’s APRM: AProgress Report.” South African Instituteof International Affairs, New Partnershipfor Africa’s Development (NEPAD) andGovernance Project.
Kanbur, Ravi. 2004. “The African PeerReview Mechanism (APRM): An Assess-ment of Concept and Design.”
Kaufmann, Daniel, and Aart Kraay. 2002.“Growth Without Governance.” Econo-mia 3 (1): 169–215.
Kaufmann, Daniel, Aart Kraay, and MassimoMastruzzi. 2005. “Governance Matters IV:Governance Indicators for 1996–2004.”World Bank, Washington, D.C.
Kraay, Aart. Forthcoming. “When Is GrowthPro-Poor? Cross-Country Evidence.”Journal of Development Economics.
Kraay, Aart, and Claudio Raddatz. 2005.“Poverty Traps, Aid, and Growth.” Back-ground paper for Global MonitoringReport 2005. World Bank, Washington,D.C.
Kremer, Michael, Alexei Onatski, and JamesStock. 2001. “Searching for Prosperity.”Carnegie-Rochester Conference Series onPublic Policy 55: 275–303.
Le Houerou, Philippe, and Robert Taliercio.2002. “Medium Term Expenditure Frame-works: From Concept to Practice—Prelim-inary Lessons from Africa.” World Bank,Washington, D.C.
Leite, Carlos, and Jens Weidmann. 1999.“Does Mother Nature Corrupt? NaturalResources, Corruption, and EconomicGrowth.” IMF Working Paper 99/85. Inter-national Monetary Fund, Washington, D.C.
Levine, Ross, and David Renelt. 1992. “ASensitivity Analysis of Cross-Country
R E F E R E N C E S
G L O B A L M O N I T O R I N G R E P O R T 2 0 0 5 241

Growth Regressions.” American Eco-nomic Review 82 (4): 942–63.
Lokshin, Michael, and Martin Ravallion.2004. “Household Income Dynamics inTwo Transition Economies” Studies in Non-linear Dynamics and Econometrics 8 (3).
Lopez, Humberto. 2004. “Pro-Poor Growth:How Important Is Macroeconomic Stabil-ity?” World Bank, Washington, D.C.
McKenzie, David, and ChristopherWoodruff. 2004. “Is There an EmpiricalBasis for Poverty Traps in DevelopingCountries?” Stanford University, PaloAlto, Calif., and University of California atSan Diego.
McMillan, J., and P. Zoido. 2004. “How toSubvert Democracy: Montesinos in Peru.”Journal of Economic Perspectives 18 (4):69–92.
Miguel, E., S. Satyanath, and E. Sergenti.2004. “Economic Shocks and Civil Con-flict: An Instrumental VariablesApproach.” Journal of Political Economy112 (4): 725–53.
NEPAD (New Partnership for Africa’s Devel-opment) and African Union. 2004. “Coun-try Self-Assessment for the African PeerReview Mechanism: Questionnaire.”African Peer Review Mechanism Secretariat.
———. Various years. Annual Report.[www.nepad.org].
Quah, Danny T. 1993a. “Empirical Cross-Section Dynamics in Economic Growth.”European Economic Review 37: 426–34.
———. 1993b. “Galton’s Fallacy and Testsof the Convergence Hypothesis.” Scandi-navian Journal of Economics 95: 427–43.
———. 1996. “Twin Peaks: Growth andConvergence in Models of DistributionDynamics.” Economic Journal 106 (127):1045–55.
———. 1997. “Empirics for Growth andDistribution: Stratification, Polarization,and Convergence Clubs.” Journal of Eco-nomic Growth 2: 27–59.
Rajan, Raghuram, and Arvind Subramanian.2005. “What Prevents Aid from Enhanc-ing Growth?” International MonetaryFund, Washington, D.C.
Rigobon, Roberto, and Dani Rodrik. 2004.“Rule of Law, Democracy, Openness, andIncome: Estimating the Interrelationships.”Massachusetts Institute of Technology,Cambridge, Mass., and Harvard Univer-sity, Kennedy School, Cambridge, Mass.
Sachs, Jeffrey, John W. McArthur, GuidoSchmidt-Traub, Margaret Kruk, Chan-drika Bahadur, Michael Faye, and GordonMcCord. 2004. “Ending Africa’s PovertyTrap.” Brooking Papers on EconomicActivity 1. Washington, D.C.: BrookingsInstitution.
Satyanath, Shanker, and Arvind Subraman-ian. 2004. “What Determines Long-RunMacroeconomic Stability? DemocraticInstitutions.” IMF Working Paper 04/215.International Monetary Fund, Washing-ton, D.C.
Sen, Amartya, 1995. “Economic Develop-ment and Social Change: India and Chinain Comparative Perspectives.” STICERDDiscussion Paper. London School of Eco-nomics, Suntory and Toyota Interna-tional Centres for Economics and RelatedDisciplines.
Staines, N., S. Aiyar, L. Cui, P. Fallon, L. Red-ifer, and R. Stern. 2005. “Review ofRecent IMF Experience in Post-ConflictCountries.” International Monetary Fund,Washington, D.C.
Stern, Nicholas. 2001. “A Strategy for Devel-opment.” Keynote address. Annual WorldBank Conference on Development Eco-nomics (ABCDE), May, Washington, D.C.
Tahari, Amor, Dhaneshwar Ghura, BernardinAkitoby, and Emmanuel Aka. 2004.“Source of Growth in Sub-SaharanAfrica.” IMF Working Paper 04/176.International Monetary Fund, Washing-ton, D.C.
Tsangarides, Charalambos G. 2005.“Growth Empirics under Model Uncer-tainty: Is Africa Different?” IMF WorkingPaper 05/18. International MonetaryFund, Washington, D.C.
UNECA (United Nations Economic Com-mission for Africa). 2004. African Gover-nance Report 2005. Addis Ababa.
R E F E R E N C E S
242 G L O B A L M O N I T O R I N G R E P O R T 2 0 0 5

Wei, Shang-Jin. 2000. “Natural Opennessand Good Government.” NBER WorkingPaper 7765. National Bureau of EconomicResearch. Cambridge, MA.
World Bank. 2002. World DevelopmentReport 2002. New York: Oxford Univer-sity Press.
———. 2003. “Investment Climate Surveys.”Washington, D.C.
World Bank. 2004a. Doing Business in 2005.Washington, D.C.: World Bank.
———. 2004b. “Inequality in Latin America:Breaking with History?” Washington,D.C.
———. 2004c. World Development Report2005: A Better Investment Climate forEveryone. New York: Oxford UniversityPress.
———. 2005. The Growth Experience: WhatHave We Learned from the 1990s? Wash-ington, D.C.
Chapter 3Anand, S., and T. Barnighausen. 2004.
“Human Resources and Health Out-comes: Cross Country EconometricStudy.” The Lancet 364: 1603–09.
Bennell, P. 2005. “The Impact of the AIDSEpidemic on Teachers in Sub-SaharanAfrica.” Journal of Development Studies41: 440–46.
Bennett, N. 2001. “Corruption in EducationSystems in Developing Countries: What ItIs Doing to the Young.” Paper presented atthe 10th International Anti-CorruptionConference, 7–11 October, Prague, CzechRepublic.
Bjorkman, Martina. 2005. “Public Fundingin the Educational Sector and Its Effect onTest Scores.” World Bank, Washington,D.C.
Black, R. E., S. S. Morris, and J. Bryce. 2003.“Where and Why Are 10 Million DyingEvery Year? (Child Survival I).” TheLancet 361: 2226–34.
Boler, T. 2003. “Approaches to Examiningthe Impact of HIV/AIDS on Teachers.”Policy and Research Series 1. Save the
Children and Actionaid International,U.K. Working Group on Education andHIV/AIDS, London.
Bruns, Barbara, Alain Mingat, and Ramaha-tra Rakatomalala. 2003. “Achieving Uni-versal Primary Education by 2015: AChance for Every Child.” World Bank,Washington, D.C.
Buchan J., T. Parkin, and J. Sochalski. 2003.WHOLIS database. [http://whqlibdoc.who.int/hq/2003/WHO_EIP_OSD_2003.3.pdf].
Bulir, A., and J. Hamann. 2003. “Aid Volatil-ity: An Empirical Assessment.” IMF StaffPapers 50 (1). International MonetaryFund, Washington, D.C.
Carneiro, Pedro, and James Heckman. 2003.“Human Capital Policy.” NBER WorkingPaper 9495. National Bureau of EconomicResearch, Cambridge, Mass.
Chaudhury, Nazmul, and Jeffrey S. Hammer.2004. “Ghost Doctors: Absenteeism inRural Bangladeshi Health Facilities.” TheWorld Bank Economic Review 18 (3).
Chaudhury, Nazmul; Jeffrey S. Hammer,Michael Kremer, Kharthik Muralidharan,and F. Halsey Rogers. 2004. “Teacher andHealth-Care Provider Absenteeism: AMulti-country Study.” World Bank, Devel-opment Research Group, Washington, D.C.
———. 2005. “Roll Call: Teacher Absence inBangladesh.” World Bank, Washington,D.C.
Clemens, Michael. 2004. “The Long Walk toSchool: International Education Goals inHistorical Perspective.” Center for GlobalDevelopment, Washington, D.C.
Colclough, Christopher, and Keith Lewin.1993. Educating All the Children: Strate-gies for Primary Schooling in the South.New York: Oxford University Press.
CONFEMEN and Ministere de l’enseigne-ment pre-universitaire et de l’educationcivique de Guinee. 2003. “Le programmede formation initiale des maitres et la dou-ble vacation en Guinee.” Dakar.
Crouch, Luis, and Tazeen Fasih. 2004. “Pat-terns in Education Development: Implica-tions for Further Efficiency Analysis.”World Bank, Washington, D.C.
R E F E R E N C E S
G L O B A L M O N I T O R I N G R E P O R T 2 0 0 5 243

Delamonica, Enrique, Santosh Mehrotra, andJan Vandemoortele. 2001. “Is EFA Afford-able? Estimating the Global MinimumCost of Education for All.” InnocentiWorking Paper 87. United Nations Chil-dren’s Fund, New York.
Devarajan, D., M. Miller, and E. Swanson.2002. “Goals for Development, History,Prospects, and Costs.” Policy ResearchWorking Paper 2819. World Bank. Wash-ington, D.C.
Dovlo, D., and T. Martineau. 2004. “AReview of the Migration of Africa’s HealthProfessionals.” Working Paper 4-4. Har-vard University, Joint Learning Initiative,Cambridge, Mass.
Duflo, Esther, Pascaline Dupas, and MichaelKremer. 2004. “Towards Universal PrimaryEducation: Results from a Pilot ImpactStudy of Contract Extra Teachers in Pri-mary Schools in Kenya.” MassachusettsInstitute of Technology, Cambridge, MA.
Dugger, C. 2004. “Lacking Doctors, Africa IsTraining Substitutes.” The New YorkTimes, 23 November.
Ethiopia Federal Ministry of Health. 2004.“Health Extension Package Implementa-tion Guidelines.” Addis Ababa.
Fiszbein, Ariel, ed. 2005. Citizens, Politi-cians, and Providers: The Latin AmericanExperience with Service Delivery Reform.Washington, D.C.: World Bank.
Foster, Mick. 2004. “MDG-Orientated Sec-tor and Poverty Reduction Strategies:Lessons from Experience in Health.”Report for the High Level Forum on theHealth MDGs, December, Abjua, Nigeria.
FTI Secretariat. 2005. “Status Report.”World Bank. Washington, D.C.
Galiani, Sebastian, Paul Gertler, and ErnestoSchargrodsky. 2005. “Water for Life: TheImpact of the Privatization of Water Ser-vices on Child Mortality.” Journal ofPolitical Economy 113 (1).
Gertler, P., and S. Barber. 2004. “The Returnsto Investing in Quality Healthcare.” Insti-tute of Business and Economic Research,University of California, Berkeley.
Gottret, Pablo (2003). “Accelerating ProgressTowards the MDGs and Health FinancingIssues.” Health, Nutrition and PopulationDepartment. Processed The World Bank.Washington, D.C.
Gottret, Pablo, and George Schieber. Forth-coming. “Health Financing Issues in Lowand Middle Income Countries.” WorldBank. Washington D.C.
Grant, K. B., M. Gorgens, and A. Kinghorn.2004. “Mitigating the Impact of HIV onService Providers: What Has BeenAttempted, What Is Working, What HasNot Worked, Where and Why?” Studycommissioned by the U.K. Department forInternational Development Service Deliv-ery Team (Workstream on Capacity Devel-opment and Human Resources) incollaboration with the U.S. Agency forInternational Development. London.
Grassly, N. C., K. Desai, E. Pegurri, A. Sikazwe, I. Malambo, C. Siamatowe,and D. A. P. Bundy. 2003. “The EconomicImpact of HIV/AIDS on the EducationSector in Zambia.” AIDS 17: 1–6.
Haacker, Markus. 2004. “HIV/AIDS: The Impacton the Social Fabric and the Economy.” In TheMacroeconomics of HIV/AIDS. Washington,D.C.: International Monetary Fund.
Hinchliffe, K .2004. “The Impact of the HIPCInitiative on Public Expenditures in Educa-tion and Health in African Countries.”World Bank, Africa Region, Human Devel-opment Department. Washington, D.C.
Hoddinott, J., L. Haddad, and H. Alderman.1997. Intrahousehold Resource Allocationin Developing Countries: Models, Meth-ods and Policy. Baltimore, Md.: The JohnsHopkins University Press.
IEO (Independent Evaluation Office). 2004.“Evaluation Report on PRSPs and thePRGF.” International Monetary Fund,Washington , D.C.
IMF (International Monetary Fund). 2004.“External Grants and IMF Policies.”Issues Brief. Washington, D.C.
IRC (International Water and Sanitation Cen-tre). 2004. “Results from School Sanitation
R E F E R E N C E S
244 G L O B A L M O N I T O R I N G R E P O R T 2 0 0 5

Programmes in Kenya.” Delft, the Nether-lands. [http://www.irc.nl/page/9963].
Jalan, Jyotsna, and Elena Glinskaya. 2004.“Improving Primary School Education inIndia: An Impact Assessment of DPEP-Phase I.” World Bank, Washington, D.C.
Joint Learning Initiative. 2004. “HumanResources for Health: Overcoming the Cri-sis.” Harvard University, Cambridge, Mass.
Kurowski, C. 2004. “Scope, Characteristicsand Policy Implications of the HealthWorker Shortage in Low-income Coun-tries of Sub-Saharan Africa.” Backgroundpaper for Joint Learning Initiative. Har-vard University, Cambridge, Mass.
Kurowski, C., K. Wyss, S. Abdulla, N.Yemadi, and A. Mills. 2003. “HumanResources for Health: Requirements andAvailability in the Context of Scaling UpPriority Interventions in Low-incomeCountries. Case Studies from Tanzaniaand Chad.” Working Paper, LondonSchool of Hygiene and Tropical Medicine,London.
Kushnarova, Inna. 2005. “Public Expendi-ture Tracking Surveys: A Review of Sur-veys Completed from 1996 to 2004.”World Bank, Washington, D.C.
La Forgia, G., P. Mintz, and C. Cerezo. 2004.“Is the Perfect the Enemy of the Good? ACase Study of Large-Scale Contracting forBasic Health Services in Rural Guatemala.”World Bank, Washington, D.C.
Lanjouw P., and M. Ravallion. 1999. “Bene-fit Incidence, Public Spending Reforms,and the Timing of Program Capture.” TheWorld Bank Economic Review (May).
Lehmann, U., I. Friedman, and D. Sanders.2004. “Review of the Utilisation andEffectiveness of Community-Based HealthWorkers in Africa.” Working Paper 4-1.Harvard University, Joint Learning Initia-tive, Cambridge, Mass.
Mingat, Alain. 2003. “Management of Edu-cation Systems in Sub-Saharan AfricanCountries: A Diagnostic and Ways towardImprovement in the Context of the EFA-FTI.” World Bank, Africa Region, Human
Development Department, Washington,D.C.
Naschold, Felix. 2002. “Aid and the Millen-nium Development Goals.” OverseasDevelopment Institute, London.
OED (Operations Evaluation Department).2003. “Efficient, Sustainable Service forAll? An OED Evaluation of World BankAssistance to Water Supply and Sanita-tion.” World Bank, Washington, D.C.
Preker, Alexander, Emi Suzuki, Flavia Bus-treo, Agnes Soucat, and Jack Langerbrun-ner. 2003. “Costing the MillenniumDevelopment Goals: Expenditure Gapsand Development Traps.” Health, Nutri-tion, and Population Discussion Paper.World Bank, Washington, D.C.
Rawlings, Laura, and Gloria Rubio. Forth-coming. “Evaluating the Impact of Condi-tional Cash Transfer Programs.” TheWorld Bank Research Observer.
Rivkin, Steven G., Eric A. Hanushek, andJohn F. Kain. 2005. “Teachers, Schools,and Academic Achievement.” Economet-rica 79 (2): 417–58.
Rodd, A. 2004. Monitoring and evaluationdata reported at a World Bank seminar onthe U.S. Agency for International Devel-opment’s LEAP project. Research TriangleInstitute, Chapel Hill.
Sen, D. 2000. “School Sanitation and HygieneEducation.” In 26th WEDC Conference Pro-ceedings. Loughborough University, Water,Engineering, and Development Centre, U.K.
Stekelenburg, J., Sindele Simasiku Kyanam-ina, and Ivan Wolffers. 2003. “Poor Per-formance of Community Health Workersin Kalabo District, Zambia.” Health Pol-icy 65 (2): 109–18.
Stilwell, B., K. Diallo, P. Zurn, M. Dal Poz,O. Adams, and J. Buchan. 2003. “Devel-oping Evidence-based Ethical Policies onthe Migration of Health Workers: Con-ceptual and Practical Challenges.” HumanResources for Health 1 (8).
UNAIDS (United Nations Joint Programmeon HIV/AIDS). 2004. Report on theGlobal AIDS Epidemic. Geneva.
R E F E R E N C E S
G L O B A L M O N I T O R I N G R E P O R T 2 0 0 5 245

UNESCO (United Nations Educational, Sci-entific, and Cultural Organization). 2004.Education for All: The Quality Impera-tive. EFA Global Monitoring Report2005. Paris.
UNICEF (United Nations Children’s Fund) India.2003. “Catching Them Young.” [http://www/unicef.org/india/wes_224.htm].
UNICEF (United Nations Children’s Fund)Nigeria. 2003. “Nigeria: Community-wide Benefits from Water and Sanitationand Girls’ Education.” [http://www.unicef.org/infobycountry/Nigeria_1468_html].
UNMP (United Nations Millennium Project).2005a. Investing in Development: A Prac-tical Plan to Achieve the MillenniumDevelopment Goals. New York.
———. 2005b. Taking Action: AchievingGender Equality and the Empowerment ofWomen. Task Force on Education andGender Equality, New York.
———. 2005c. Toward Universal PrimaryEducation: Investments, Incentives andInstitutions. Task Force on Education andGender Equality, New York.
UNRISD (United Nations Research Institutefor Social Development). 2005. GenderEquality: Striving for Justice in an UnequalWorld. Geneva.
Vegas, E., and J. De Laat. 2004. “Do Differ-ences in Teacher Contracts Affect StudentPerformance? Evidence from Togo.” WorldBank, Washington, D.C.
Vegas, E., and J. Umansky. 2004. “ImprovingTeaching and Learning through EffectiveIncentives: What Can We Learn from Edu-cation Reforms in Latin America?” WorldBank, Washington, D.C.
Vujicic, M., and K. Sagoe. 2004. “HumanResources for Health Issues in Ghana.”Country Brief prepared for the High LevelForum on Health MDGs, Abuja, Nigeria.
Vujicic, M., P. Zurn, K. Diallo, O. Adams,and M. Dal Poz. 2004. “The Role ofWages in the Migration of Health CareProfessionals from Developing Coun-tries.” Human Resources for Health 2 (3).
Wagstaff, A., and M. Claeson. 2004. “TheMillennium Development Goals for
Health: Rising to the Challenges.” WorldBank, Washington, D.C.
WHO (World Health Organization). 2001.Macroeconomics and Health: Investing inHealth for Economic Development. Com-mission on Macroeconomics and Health,Geneva.
———. 2002. World Health Report 2002:Reducing Risks, Promoting Healthy Life.Geneva.
———. 2004. World Health Report 2004:Changing History. Geneva.
Wibulpolprasert, Suwit, and Paichit Pengpai-bon. 2003. “Integrated Strategies to Tacklethe Inequitable Distribution of Doctors inThailand: Four Decades of Experience.”Human Resources for Health 1 (12).
World Bank. 2002. “Education and HIV/AIDS: A Window of Hope.” Washington,D.C.
———. 2003. World Development Report2004: Making Services Work for Poor Peo-ple. New York: Oxford University Press.
———. 2004a. Attaining the MillenniumDevelopment Goals in India: Role of Pub-lic Policy and Service Delivery. South AsiaRegion, Human Development Unit, Wash-ington, D.C.
———. 2004b. “Vietnam: Reading andMathematics Assessment Study.” HumanDevelopment Sector Report. East Asia andPacific Region, Washington, D.C.
———. 2005a. Improving Health, Nutrition,and Population Outcomes in Sub-SaharanAfrica. Washington, D.C.
———. 2005b. “Operationalizing MDGs:How Effective Is the Long Route? A CaseStudy of Georgia.” Europe and CentralAsia Region, Washington, D.C.
Zambia Ministry of Health. 2004. HumanResources for Health: A Synopsis of theCurrent Staffing Crisis and Proposals forAction.” Country brief prepared for theHigh Level Forum, Lusaka.
Chapter 4Aksoy, M. Ataman, and John C. Beghin, eds.
2005. Global Agricultural Trade and
R E F E R E N C E S
246 G L O B A L M O N I T O R I N G R E P O R T 2 0 0 5

Developing Countries. New York: OxfordUniversity Press for the World Bank.
Alexandraki, Katerina, and Hans PeterLankes. 2004. “Estimating the Impact ofPreference Erosion on Middle-IncomeCountries,” Working Paper. InternationalMonetary Fund, Washington, D.C.
Anderson, James, and Peter Neary. 1994.“Measuring Trade Restrictiveness of TradePolicy.” The World Bank EconomicReview 8 (1): 151–69.
———. 1996. “A New Approach to Evaluat-ing Trade Policy.” Review of EconomicStudies 63 (1): 107–25.
———. 2003. “The Mercantilist Index ofTrade Policy.” International EconomicReview 44 (2): 627–49.
Anderson, Kym. 2004a. “Agricultural TradeReform and Poverty Reduction in Devel-oping Countries.” Policy Research Work-ing Paper 3396. World Bank, Washington,D.C..
———. 2004b. “Subsidies and Trade Barri-ers,” In B. Lomborg, ed., Global Crises,Global Solutions. Cambridge and NewYork: Cambridge University Press.
Anderson, Kym, Will Martin, and D. van derMensbrugghe. 2005. “Market and Wel-fare Implications of Doha Reform Scenar-ios.” World Bank, Washington, D.C.
Anson, J., O. Cadot, A. Estevadeordal, J. de Melo, A. Suwa-Eisenmann, and B.Tumurchudur. 2003. “Assessing the Costsof Rules of Origin in North-South PTAswith an Application to NAFTA.” CEPRDiscussion Paper 2476. Centre for Eco-nomic Policy Research, London.
Baffes, John. 2004. “Cotton: Market Setting,Trade Policies and Issues.” Policy ResearchWorking Paper 3218. World Bank, Wash-ington, D.C.
Balat, Jorge, Irene Brambilla, and Guido G.Porto. 2004. “An Analysis of the WTODevelopment Round on Poverty in Ruraland Urban Zambia.” Background paperfor the UN Millennium Project Task Forceon Trade, New York.
Bhattasali, D., Shantong Li, and W. Martin.2004. China and the WTO: Accession,
Policy Reform and Poverty Reduction.New York: Oxford University Press for theWorld Bank.
Brenton, Paul. 2003. “Integrating the LeastDeveloped Countries into the WorldTrading System: The Current Impact ofEU Preferences under Everything ButArms.” Journal of World Trade 37 (3):623–46.
Brenton, Paul, and Miriam Manchin. 2003.“Making EU Trade Agreements Work:The Role of Rules of Origin” The WorldEconomy 26: 755–69.
Brown, D., A. Deardorff, and R. M. Stern.2003. “Developing Countries’ Stake in theDoha Round.” Research Seminar in Inter-national Economics Discussion Paper 495.University of Michigan, Ann Arbor.
Candau, Fabien, Lionel Fontagne, andSébastien Jean. 2004. “The UtilizationRate of Preferences in the EU.” Centre d’E-tudes Prospectives et d’Informations Inter-nationales (CEPII), Paris.
Francois, J. F., and D. Spinanger. 2004. “Liber-alizing Quotas on Textiles and Clothing:Has the ATC Actually Worked?” Paper pre-sented at the Center for Global Trade Analy-sis Conference, June, Washington, D.C.
Francois, J. F., H. van Meijl, and Frans vanTongeren. 2005. “Trade Liberalization inthe Doha Development Round.” Eco-nomic Policy.
Hertel, Thomas, and Roman Keeney. 2005.“The Balance between Domestic Support,Market Access, and Export Competition:Where Do Developing Country InterestsLie?” World Bank, Washington, D.C.
Hertel, Thomas, and L. Alan Winters, eds.2005, Putting Development Back into theDoha Agenda: Poverty Impacts of a WTOAgreement. Washington, D.C.: World Bank.
Hinkle, Lawrence, and Richard Newfarmer.2005. “Risks and Rewards of RegionalTrading Arrangements in Africa: Eco-nomic Partnership Agreements (EPAs)between the EU and SSA.” World Bank,Washington, D.C.
Hinkle, Lawrence, and Maurice Schiff. 2004.“Economic Partnership Agreements between
R E F E R E N C E S
G L O B A L M O N I T O R I N G R E P O R T 2 0 0 5 247

Sub-Saharan Africa and the EU: A Devel-opment Perspective.” The World Econ-omy 27 (9): 1321–33.
Hoekman, B. 2005a. “Operationalizing theConcept of Policy Space in the WTO:Beyond Special and Differential Treat-ment.” In U. Petersmann, ed., Reformingthe World Trading System: Rule-making,Trade Negotiations, and Dispute Settle-ment. Oxford: Oxford University Press.
———. 2005b. “Making the WTO MoreSupportive of Development.” Finance andDevelopment (March).
Hoekman, B., F. Ng, and M. Olarreaga.2004. “Reducing Agricultural Tariffs ver-sus Domestic Support: What’s MoreImportant for Developing Countries?”The World Bank Economic Review 18:175–204.
Hoekman, B., A. Nicita, and M. Olarreaga.2005. “Can Doha Deliver a ‘Development’Round?” World Bank, Washington, D.C.
IMF (International Monetary Fund). 2003.“Financing of Losses from Preference Ero-sion: Note on Issues Raised by DevelopingCountries in the Doha Round.” Commu-nication to the World Trade Organization.WT/TF/COH/14. Washington, D.C.
———. 2004. “Fund Support for Trade-Related Balance of Payments Adjust-ments.” Washington, D.C. [http://www.imf.org/external/np/pdr/tim/2004/eng/022704.pdf].
IMF (International Monetary Fund) andWorld Bank. 2004. Global MonitoringReport 2004. Washington, D.C.
Kee, Hiau Looi, Alessandro Nicita, andMarcelo Olarreaga. 2004. “ImportDemand Elasticities and Trade Distor-tions.” World Bank, Washington, D.C.
———. 2005a “Estimating Trade Restric-tiveness Indices.” World Bank, Washing-ton, D.C.
———. 2005b “Estimating Ad-valoremEquivalent of NTBs.” World Bank, Wash-ington, D.C.
Limão, Nuno, and Marcelo Olarreaga. 2005.“Trade Preferences to Small Countries and
the Welfare Costs of Lost Multilateral Lib-eralization.” Policy Research WorkingPaper. World Bank, Washington, D.C.
Litchfield, Julie, Neil McCulloch and L. AlanWinters. 2003. “Agricultural Trade Liber-alization and Poverty Dynamics in ThreeDeveloping Countries.” University of Sus-sex, Brighton.
Manole, V. 2004. “The Effects of Quota Abo-lition in the Textile and Apparel Indus-tries.” World Bank, Washington, D.C.
Marchetti, Juan. 2004. “Developing Coun-tries in the WTO Services Negotiations.”Staff Working Paper ERSD-2004-06.World Trade Organization, Geneva.
Martin, W., V. Manole, and D. van der Mens-brugghe. 2004. “Dealing with Diversity:Analyzing the Consequences of TextileQuota Abolition.” Paper presented at theCenter for Global Trade Analysis confer-ence, June, Washington, D.C.
Nicita, Alessandro. 2004a. “Doha: Implica-tions for Poverty Reduction in Ethiopia.”Background paper for the UN MillenniumProject Task Force on Trade, New York.
———. 2004b. “Doha: Implications forPoverty Reduction in Madagascar.” Back-ground paper for the UN Millennium Pro-ject Task Force on Trade, New York.
———. 2004c. “Who Benefited From TradeLiberalization in Mexico?” Policy WorkingPaper 3265. World Bank, Washington, D.C.
———. 2005. “Export-led-Growth, Pro-poor or Not? A Case Study of Madagas-car’s Textile and Apparel Industry.” WorldBank, Washington, D.C.
Nordas, H. K. 2004. “The Global Textile andClothing Industry Post the Agreement onTextiles and Clothing.” World TradeOrganization, Geneva.
OECD (Organisation for Economic Co-operation and Development). 2004.OECD Agricultural Policies 2004 At aGlance. Paris.
———. 2005. “Trade and Structural Adjust-ment.” Paris.
Olarreaga, Marcelo, and Caglar Özden.2004. “AGOA and Apparel: Who Cap-
R E F E R E N C E S
248 G L O B A L M O N I T O R I N G R E P O R T 2 0 0 5

tures the Tariff Rent in the Presence ofPreferential Market Access?_” The WorldEconomy 28 (1).
Özden, C., and Gunjan Sharma. 2004. “PriceEffects of Preferential Market Access: TheCaribbean Basin Initiative and the ApparelSector. Policy Research Working Paper3244. World Bank, Washington, D.C.
Porto, Guido. 2003. “Trade Reforms, Mar-ket Access and Poverty in Argentina.” Pol-icy Research Working Paper 3135. WorldBank, Washington, D.C.
Prowse, Susan. 2005. “Additional Supportfor Trade Adjustment and Integration—AProposal.” U.K. Department for Interna-tional Development, London.
Schiff, Maurice, and L. Alan Winters. 2003.Regionalism and Development. New York:Oxford University Press for the World Bank.
Soloaga, Isidro. 2004. “The Doha Develop-ment Agenda: Implications for PovertyReduction in Cambodia.” Backgroundpaper for the UN Millennium Project TaskForce on Trade, New York.
Stevens, Chris, and Jane Kennan. 2004.“Making Preferences More Effective.”Briefing paper. Institute for DevelopmentStudies. University of Sussex, Brighton.
Sumner, Dan. 2005. “Reducing Cotton Sub-sidies: The DDA Cotton Initiative.” Uni-versity of California, Davis.
Sykes, Alan. 1995. Product Standards forInternationally Integrated Goods Markets.Washington, D.C.: Brookings Institution.
Tangermann, S. 2002 “The Future of Prefer-ential Trade Arrangements for DevelopingCountries and the Current Round of WTONegotiations on Agriculture.” UnitedNations Food and Agriculture Organiza-tion, Rome.
UN Millennium Project Task Force on Trade.2005. “Trade, Development and theWTO: An Action Agenda for the DohaRound.” United Nations, New York.
World Bank. 2001. Global EconomicProspects and the Developing Countries2002: Making Trade Work for the World’sPoor. Washington, D.C.
———. 2003. Global Economic Prospectsand the Developing Countries 2004: Real-izing the Development Promise of theDoha Agenda. Washington, D.C.
———. 2004a Global Economic Prospectsand the Developing Countries 2005:Trade, Regionalism and Development.Washington DC.
———. 2004b World Development Indica-tors 2004. Washington, D.C.
WTO (World Trade Organization). 2004.International Trade Statistics 2004. Geneva.
WTO (World Trade Organization) andOECD (Organisation for Economic Co-operation and Development). 2004.“Report on Trade-Related Technical Assis-tance and Capacity Building (TRTA/CB).”Geneva and Paris.
Chapter 5 Alonso, Rosa. 2004. “Poverty Reduction
Strategy Papers and Budget Linkages: TheCase of Burkina Faso.” World Bank,Washington, D.C.
Alonso, Rosa, and Robert Utz. 2004. “FiscalAspects of PRSP Implementation in Tan-zania.” World Bank, Washington, D.C.
Alonso, Rosa, Lindsay Judge, and Jeni Klug-man. 2004. “The PRSP and Budget Link-ages: A Synthesis of Four Case Studies.”World Bank, Washington, D.C.
Arslanalp, Serkan, and Peter Blair Henry.2004. “Helping the Poor to Help Them-selves: Debt Relief or Aid.” NBER Work-ing Paper 10230. National Bureau ofEconomic Research, Cambridge, Mass.
Aryeetey, Ernest, Barfour Osei, and PeterQuartey. 2003. “Does Tying Aid Make ItMore Costly? A Ghanaian Case Study.”Paper presented at the Workshop onQuantifying the Impact of Rich Countries’Policies on Poor Countries, sponsored bythe Center for Global Development andthe Global Development Network, Octo-ber, Washington, D.C.
Bourguignon, Francois, Mark Sundberg, andHans Lofgren. 2005. “Building Absorptive
R E F E R E N C E S
G L O B A L M O N I T O R I N G R E P O R T 2 0 0 5 249

Capacity to Meet the MDGs.” WorldBank, Washington, D.C.
Bourguignon, François, Maurizio Bussolo,Luiz Pereira da Silva, Hans Timmer, andDominique van der Mensbrugghe. 2004.“MAMS. Maquette for MDG Simula-tions.” World Bank, Washington, D.C.
Bulir, Ales, and A. Javier Hamann. 2003.“Aid Volatility: An Empirical Assess-ment.” IMF Staff Papers 50 (1): 64–89.International Monetary Fund, Washing-ton, D.C.
———. 2005. “Volatility of DevelopmentAid: From the Frying Pan into the Fire?”Paper presented at the Seminar on ForeignAid and Macroeconomic Management,14–15 March, Maputo, Mozambique.
Bulir, Ales, and Timothy Lane. 2002. “Aidand Fiscal Management.” IMF WorkingPaper 02/112. International MonetaryFund, Washington, D.C.
Chalmers, Malcolm. 2004. “Spending toSave? An Analysis of the Cost Effectivenessof Conflict Prevention versus InterventionAfter the Onset of Violent Conflict: Phase2 Synthesis Report.” University of Brad-ford, Centre for International Cooperationand Security, Bradford, U.K.
Chauvet, Lisa, and Paul Collier. 2004. “Devel-opment Effectiveness in Fragile States:Spillovers and Turnarounds.” Oxford Univer-sity, Centre for Africa Studies, Oxford, U.K.
Clemens, Michael, Steven Radelet, and RikhilBhavnani. 2004. “Counting ChickensWhen They Hatch: The Short-term Effectof Aid on Growth.” Center for GlobalDevelopment, Washington, D.C.
Collier, Paul, and Anke Hoeffler. 2004. “AidPolicy and Growth in Post-Conflict Soci-eties.” European Economic Review 48 (5):1125–45.
Collier, Paul, Anke Hoeffler, and Mans Soder-bom. 2004. “On the Duration of CivilWar.” Journal of Peace Research 41 (3):253–73.
Collier, P., L. Elliot, H. Hegre, A. Hoeffler, M. Reynal-Querol, and N. Sambanis.2003. Breaking the Conflict Trap: CivilWar and Development Policy. A World
Bank Policy Research Report. New York:Oxford University Press.
Commission for Africa. 2005. Our CommonInterest: Report of the Commission forAfrica. London.
Development Committee. 2003. “SupportingSound Policies with Adequate and Appro-priate Financing.” DC2003-0016. WorldBank and International Monetary Fund,Washington, D.C.
———. 2004. “Aid Effectiveness and Financ-ing Modalities Background Paper.”DC2004-0012/Add.1. World Bank andInternational Monetary Fund, Washing-ton, D.C.
———. 2005. “Moving Forward: FinancingModalities Toward the MDGs.” Washing-ton, D.C.
Dollar, David, and Victoria Levin. 2004. “TheIncreasing Selectivity of Aid, 1984–2002.”Policy Research Working Paper 3299.World Bank, Washington, D.C.
———. 2005. “Sowing and Reaping: Institu-tional Quality and Project Outcomes inDeveloping Countries.” World Bank,Washington, D.C.
Economists Allied for Arms Reduction. 2004.“Military vs. Social Spending.” PearlRiver, New York. [http://www.ecaar.org/factsheets/milexMDG.pdf].
European Commission. 2004. “EuropeanCommission Report on Millennium Devel-opment Goals 2000–2004.” Brussels.
Felix, Manuel. 2005. “Aid Flows to Sub-Saharan Africa.” Background Paper forGlobal Monitoring Report 2005. WorldBank, Washington, D.C.
Gemmell, Norman, and Mark McGillivray.1998. “Aid and Tax Instability and theBudget Constraint in Developing Coun-tries.” CREDIT Research Paper 98/1. Uni-versity of Nottingham, Nottingham, U.K.
Gerster, Richard, and Alan Harding. 2004.“Baseline Survey on Programme Aid Part-ners’ Performance in 2003.” Report to theG-15 Programme Aid Partners and gov-ernment of Mozambique.
Gupta, Sanjeev, Benedict Clements, Alexan-der Pivovarsky, and Erwin R. Tiongson.
R E F E R E N C E S
250 G L O B A L M O N I T O R I N G R E P O R T 2 0 0 5

Forthcoming. “Foreign Aid and RevenueResponse: Does the Composition of AidMatter?” International Monetary Fund,Washington, D.C.
IDA (International Development Association).2004. “Debt Sustainability and FinancingTerms in IDA14: Further Considerations onIssues and Options.” SecM2004-0779.World Bank, Washington, D.C.
IMF. 2005. “Financing Further Debt Relieffor Low-Income Countries: PreliminaryConsiderations.” SM/05/101. Washing-ton, DC.
IMF and World Bank. 2005. “Update on theAssessments and Implementation ofAction Plans to Strengthen Capacity ofHIPCs to Track Poverty-reducing PublicSpending.” Washington, D.C.
———. 2004a. “Heavily Indebted PoorCountries (HIPC) Initiative: Status ofImplementation.” Washington, D.C.
———. 2004b. “Poverty Reduction StrategyPapers: Progress in Implementation.”Washington, D.C.
Jepma, Catrinus J. 1991. “The Tying of Aid.”Organisation for Economic Co-operationand Development, Development Centre,Paris.
Kang, Seonjou, and James Meernik. 2004.“Determinants of Post-Conflict EconomicAssistance.” Journal of Peace Research 41(2): 149–66.
Knack, Stephen, and Aminur Rahman. 2004.“Donor Fragmentation and BureaucraticQuality in Aid Recipients.” PolicyResearch Working Paper 3186. WorldBank, Washington, D.C.
Kraay, Aart, and Claudio Raddatz. 2005.“Poverty Traps, Aid, and Growth.” WorldBank, Washington, D.C.
Levin, Victoria. 2005. “Policy and PovertySelectivity of Foreign Aid: An Update.”World Bank, Washington, D.C.
Levin, Victoria, and David Dollar. 2005.“The Forgotten States: Aid Volumes andVolatility in Difficult Partnership Coun-tries (1992–2002).” Paper prepared forthe Development Assistance CommitteeLearning and Advisory Process on Diffi-
cult Partnerships, Conference on FragileStates, January, London.
Levy, Brian. 2004. “Governance and Eco-nomic Development in Africa: Meeting theChallenge of Capacity Building.” In SahrKpundeh and Brian Levy, eds., BuildingState Capacity in Africa. Washington,D.C.: World Bank.
Lofgren, Hans. 2004. “MAMS: An Economy-wide Model for Analysis of MDG CountryStrategies.” World Bank, DevelopmentProspects Group, Washington, D.C.
McGillivray, Mark. 2005. “Aid Allocationand Fragile States.” Background paper forthe Senior Level Forum on DevelopmentEffectiveness in Fragile States, 13–14 Jan-uary, Lancaster House, London.
Millennium Challenge Corporation. 2003.“Implementing the Millennium ChallengeAccount.” Background paper. Washing-ton, D.C.
———. 2005. “Millennium Challenge Cor-poration Board Approves First Compactwith Madagascar.” Press release. Wash-ington, D.C.
Miovic, Peter. 2004. “Uganda: PovertyReduction Support Credits in Uganda—Results of a Stocktaking Study.” WorldBank, Washington, D.C.
OECD (Organisation for Economic Co-oper-ation and Development). 2004a. “TheDevelopment Effectiveness of Food Aidand the Effects of Its Tying Status.” Paris.
———. 2004b. “Draft Report on Aid Effec-tiveness for the Second High-LevelForum.” Paris.
———. 2005a. Development CooperationReport 2004. Paris.
———. 2005b. “Aid Allocation Criteria:Managing for Development Results andDifficult Partnerships. Report by OxfordPolicy Management.” Paris.
———. 2005c. “Chair’s Summary: SeniorLevel Forum on Development Effective-ness in Fragile States.” Office of the DACChair, Paris.
———. 2005d. “Harmonization, Alignment,Results: Report on Progress, Challenges,and Opportunities.” Report on Aid Effec-
R E F E R E N C E S
G L O B A L M O N I T O R I N G R E P O R T 2 0 0 5 251

tiveness for the Second High Level Forum,Paris.
———. 2005e. “Paris Declaration on AidEffectiveness Ownership, Harmonization,Alignment, Results and Mutual Account-ability.” Presented at the Paris High LevelForum, 28 February–2 March.
Oxfam International. 2005. Paying the Price:Why Rich Countries Must Invest Now inthe War on Poverty. Oxford.
Pallage, Stephane, and Michel Robe. 2001.“Foreign Aid and the Business Cycle.”Review of International Economics 9 (4):6451–72.
Peretz, M., and S. Wangwe. 2004. “Monitor-ing Donor and IFI Support behind Coun-try-owned Poverty Reduction Strategies inthe Republic of Tanzania.”
Reisen, Helmut. 2004. “Innovative Approachesto Funding the Millennium DevelopmentGoals.” Policy Brief 24. Organisation forEconomic Co-operation and Development,Development Centre, Paris.
Rnezio, Paolo de. 2004. “The Challenge ofAbsorptive Capacity: Will Lack of Absorp-tive Capacity Prevent Effective Use ofAdditional Aid Resources in Pursuit of theMDGs?” Report on a seminar held at theU.K. Department for International Devel-opment, 9 September, London.
Sachs, Jeffrey D., John W. McArthur, GuidoSchmidt-Traub, Margaret Kruk, ChandrikaBahadur, Michael Faye, and GordonMcCord. 2004. “Ending Africa’s PovertyTrap.” Brookings Papers on EconomicActivity 1: 1–100. Washington, D.C.:Brookings Institution.
SPA (Special Partnership for Africa) BudgetSupport Working Group (BSWG). 2004.“Survey of the Alignment of Budget Sup-port and Balance of Payments Supportwith National PRS Processes.” Report bythe BSWG Co-Chairs.
SPA Sector Support Working Group. 2005.“Toward Sector Support Alignment SPA-2004 Sector Program Tracking Report.”Draft.
Stockholm International Peace Research Insti-tute. 2005. Military Expenditure Database.
[www.sipri.org/contents/milap/milex/mex_database1.html].
United Nations. 2001. “Report of the High-Level Panel on Financing for Develop-ment.” Presented to the General Assembly,28 June, New York.
UNECA (United Nations Economic Com-mission for Africa) and OECD (Organisa-tion for Economic Co-operation andDevelopment). 2005. “Mutual Review ofDevelopment Effectiveness in the Contextof NEPAD.” Mutual Review DiscussionDraft of Messages and Action Frontiers.Paris.
UNMP (United Nations Millennium Project).2005. Investing in Development: A Practi-cal Plan to Achieve the Millennium Devel-opment Goals. New York: United Nations.
World Bank. 2003. World Development Report2004: Making Services Work for Poor Peo-ple. New York: Oxford University Press.
———. 2004a. Global Economic Prospectsand the Developing Countries 2005.Washington, D.C.
———. 2004b. Global Monitoring Report2004. Washington, D.C.
———. 2004c. World Development Report2005: A Better Investment Climate for Every-one. New York: Oxford University Press.
———. 2004d. “Lessons: Scaling Up Suc-cessful Efforts to Reduce Poverty.” Pre-pared for the Shanghai Conference onScaling Up Poverty Reduction Efforts.Washington, D.C.
———. 2005a. “Well Being and Poverty inEthiopia: The Role of Agriculture andAgency.” Washington, D.C.
———. 2005b. “Ethiopia: A Strategy to Bal-ance and Stimulate Growth.” Washington,D.C.
———. 2005c. Global Development Finance2005. Washington, D.C.
Chapter 6African Development Bank. 2004a. Stepping
up to the Future: An Independent Evalua-tion of ADF-VII, VIII and IX. OperationsEvaluation Department (OPEV). Tunis.
R E F E R E N C E S
252 G L O B A L M O N I T O R I N G R E P O R T 2 0 0 5

———. 2004b. 2002–2003 Annual PortfolioPerformance Review. Tunis.
———. 2004c. Uganda Country AssistanceEvaluation. Tunis.
African Development Fund. 2003. “ADF-IXResults Measurement Framework Paper.”ADF/BD/IF/2003/121/Rev. Tunis.
———. 2004. A Partnership for PovertyReduction and Economic Growth inAfrica. Report on the Consultative Meet-ings on the Tenth General Replenishmentof the African Development Fund. Tunis.
Asian Development Bank. 2001. SpecialEvaluation Study on Program Lending.Operations Evaluation Department.Manila.
———. 2004a. Economic Analysis Retro-spective. Economic Analysis and Opera-tions Support Division, Manila.
———. 2004b. 2003 Annual Report on Loanand Technical Assistance Portfolio Perfor-mance. Operations Evaluation Depart-ment, Manila.
———. 2004c. Achieving Results Together:AsDB’s Reform Agenda. Manila.
———. 2004d. Annual Review of EvaluationActivities in 2003. Manila.
———. 2004e. Evaluation Highlights of2003. Manila.
———. 2004f. Country Assistance ProgramEvaluation for Cambodia. Manila.
———. 2004g. Country Assistance ProgramEvaluation for Nepal. Manila.
———. 2004h. The GMS Beyond Borders:Regional Cooperation Strategy and Pro-grams, 2004–2008. Manila.
Asian Development Fund. 2004. ADF IXDonors’ Report: Development Effective-ness for Poverty Reduction. Manila.
Bird, Graham. 2004. “The IMF and PoorCountries: Towards a More FulfillingRelationship.” University of Surrey, SurreyCentre for International Economic Stud-ies, United Kingdom. Paper presented toFONDAD conference, 11–12 November,The Hague.
Booz Allen Hamilton INC., 2004. IDA13Results Measurement System, Spring 2004Update. McLean.
Danida, Ministry of Foreign Affairs of Den-mark. 2005. Annual Performance Report2004. Copenhagen.
Development Committee. 2004. “Aid Effec-tiveness and Financing Modalities Back-ground Paper.” DC2004-0012/Add.1.World Bank and International MonetaryFund, Washington, D.C.
Dollar, David, and Victoria Levin. 2004.“The Increasing Selectivity of Foreign Aid,1984–2002.” World Bank, Washington,D.C.
EBRD (European Bank for Reconstructionand Development). 2003. Regional TradeFacilitation Programme: Fostering Transi-tion through Documentary Credit. ProjectEvaluation Department. London.
———. 2004. Annual Evaluation OverviewReport 2004. Project Evaluation Depart-ment. London.
Eurodad (European Network on Debt andDevelopment). 2004. “Open Letter from 26Civil Society Organizations on What Rolethe IMF Should Play in Low-income Coun-tries.” Brussels. [http://www.eurodad.org/articles/default.aspx?id=548].
Fox, James W. 2004. “The Treatment of thePrivate Sector in African PRSPs andAPRs.” Report to the Bureau for Africa ofthe U.S. Agency for International Devel-opment, Washington, D.C.
GAO (General Accounting Office). 2001.Regional Multilateral DevelopmentBanks: External Audit Reporting CouldBe Expanded. Washington, D.C.
———. 2004a. Achieving Poor Countries’Economic Growth and Debt Relief Tar-gets Faces Significant Financing Chal-lenges. Washington, D.C.
———. 2004b. World Bank Group: Impor-tant Steps Taken on Internal Control butAdditional Assessments Should Be Made.Washington, D.C.
Gertler, Paul. 2000. “Final Report: TheImpact of PROGRESA on Health.” Inter-national Food Policy Research Institute,Washington, D.C. [http://ifpri.org].
High Level Forum on Aid Effectiveness. 2005.“Managing for Development Results—
R E F E R E N C E S
G L O B A L M O N I T O R I N G R E P O R T 2 0 0 5 253
Principles in Action: Sourcebook onEmerging Good Practice.” Paris. [http://www.mfdr.org/sourcebook.html].
IDA (International Development Associa-tion). 2003. “IDA Results MeasurementSystem: Update Note.” IDA/R2003-0189.Washington, D.C.
———. 2004a. IDA Results MeasurementSystem: Recommendations for IDA14.IDA/SecM2004-0499. Washington, D.C.
———. 2004b. Heavily Indebted Poor Coun-tries (HIPC) Initiative: Status of Implemen-tation. IDA/SecM2004-0599. Washington,D.C.
———. 2004c. Debt Sustainability andFinancing Terms in IDA14: Further Con-siderations on Issues and Options. IDA/SecM2004-0779. Washington, D.C.
———. 2004d. “IDA13 Results Targets:Expert Panel Review Inception Report.”Washington, D.C.
IDB (Inter-American Development Bank).2002a. Country Strategy Guidelines. GN-2020-6. Washington, D.C.
———. 2002b. Annual Report of the Officeof Evaluation and Oversight, 2001. Wash-ington, D.C.
———. 2003a. Analysis of Project Evalua-bility Year 2001. Washington, D.C.
———. 2003b. Synthesis of OVE Evalua-tions of Bank Action for Private SectorDevelopment. Washington, D.C.
———. 2004a. Regional Public Goods: TheOpportunity for an Expanded Bank Role.Washington, D.C.
———. 2004b. 2003 Annual Report on Port-folio Management, Performance andResults (ARPRE). Washington, D.C.
———. 2004c. Medium-Term Action Planfor Development Effectiveness. Washing-ton, D.C.
———. 2004d. Country Program Evalua-tion: Brazil 1993–2003. Washington, D.C.
———. 2004e. Country Program Evalua-tion: Belize 1993–2003. Washington, D.C.
———. 2004f. Country Program Evalua-tion: Argentina 1993–2003. Washington,D.C.
———. 2004g. Evaluation of the Bank’sDirect Private Sector Lending Program,1995–2003. Washington, D.C.
———. 2004h. Towards Sustainable andEquitable Development: Sector Strategiesfor Latin America and the Caribbean.Washington, D.C.
IEO (Independent Evaluation Office). 2004a.Annual Report. Washington, D.C.: Inter-national Monetary Fund. [http://www.imf.org/External/NP/ieo/2004/ar/index.htm].
———. 2004b. Evaluation of the IMF’s Rolein Poverty Reduction Strategy Papers andthe Poverty Reduction and Growth Facil-ity. Washington, D.C.: International Mon-etary Fund. www.imf.org/external/np/ieo/2004/prspprgf/eng/report.pdf
———. 2005. Evaluation of the TechnicalAssistance Provided by the InternationalMonetary Fund. Washington, D.C.: Inter-national Monetary Fund.
IFI Transparency Resource. 2005. A ComparativeAnalysis and Introduction to the IFI Trans-parency Resource: Opening the InternationalFinancial Institutions. Washington, D.C.[http://www.ifitransparencyresource.org].
IMF (International Monetary Fund). 2000.Key Features of IMF Poverty Reductionand Growth Facility (PRGF) SupportedPrograms. Washington, D.C. [http://www.imf.org/external.np/prgf/2000/eng/key.htm].
———. 2003a. Aligning the Poverty Reduc-tion and Growth Facility (PRGF) and thePoverty Reduction Strategy Paper (PRSP)Approach—Issues and Options. Washing-ton, D.C. [http://www.imf.org/external/np/prsp/2003/eng/042503.htm].
———. 2003b. “The Role of the Fund inLow-Income Member Countries over theMedium Term—Issues Paper for Discus-sion.” Washington, D.C. [http://www.imf.org/exteranl/np/pdr/sustain/2003/072103.htm].
———. 2004a. Fund Support for Trade-Related Balance of Payments Adjust-ments. Washington, D.C. [http://www.imf.rog/exteranl/np/pdr/tim/2004/eng/022704.htm].
R E F E R E N C E S
254 G L O B A L M O N I T O R I N G R E P O R T 2 0 0 5

———. 2004b. Technical Assistance Pro-gram—Findings of Evaluations andUpdated Programs. Washington, D.C.[http://www.imf.org/external/np/ta/2004/eng/030104.htm].
———. 2004c. Role of the Fund in Low-Income Member Countries. Washington,D.C. [http://www.imf.org/external/np/pdr/lic/2004/eng/081304.htm].
———. 2004d. Public Investment and FiscalPolicy. Washington, D.C. [http://www.imf.org/external/np/fad/2004/pifp/eng/pifp.pdf].
———. 2004e. Biennial Review of the Imple-mentation of the Fund’s Surveillance and ofthe 1997 Surveillance Decision—Overview.Supplement 1 (Modalities of Surveillance)and Supplement 2 (Content of Surveil-lance). SM /04/212. Washington, D.C.
———. 2004f. The Macroeconomics ofHIV/AIDS. Edited by Markus Haacker.Washington, D.C.
———. 2004g. Public Investment and FiscalPolicy. Washington, D.C.
———. 2004h. Sub-Saharan Africa RegionalEconomic Outlook. Washington, D.C.[http://www.imf.org/external/pubs/ft/afr/reo/2004/eng/02/pdf/reo1004.pdf].
IMF (International Monetary Fund) andWorld Bank. 2004a. Debt Sustainability inLow-Income Countries—Proposal for anOperational Framework and Policy Impli-cations. Washington, D.C.
———. 2004b. Strengthening IMF–WorldBank Collaboration on Country Programsand Conditionality—Progress Report.Washington, D.C. [http://www.imf/org/external/np/pdr/cond/eng/022404.htm].
Joint Marrakech Memorandum. 2004. “Pro-moting a Harmonized Approach to Man-aging for Development Results: CorePrinciples; and Action Plan on Managingfor Development Results.” Marrakech,Morocco.
Kraay, Aart, and Vikram Nehru. 2004.“When is External Debt Sustainable?”Policy Research Working Paper 3200.World Bank, Washington, D.C.
MOPAN (Multilateral Organisations Perfor-mance Assessment Network). 2003.“Report from the 2003 Pilot Exercise.”Paper commissioned by the ChristianMichelsen Institute, Bergen, Norway.
———. 2005. The Mopan Survey 2004: Syn-thesis Report.
OECD (Organisation for Economic Co-operation and Development) DAC (Devel-opment Assistance Committee). 2005a.“Chair’s Summary: Senior Level Forum onDevelopment Effectiveness in FragileStates.” Office of the DAC Chair, Paris.
———. 2005b. “Ten Principles for GoodInternational Engagement in FragileStates.” Paris.
OED (Operations Evaluation Department).1999. Investing in Health: DevelopmentEffectiveness in Health, Nutrition andPopulation Sector. World Bank, Washing-ton, D.C.
———. 2002. The World Bank’s Approachto Global Programs: An IndependentEvaluation, Phase 1 Report. World Bank,Washington, D.C.
———. 2003a. Extractive Industries andSustainable Development, An Evaluationof World Bank Group Experience. WorldBank, Washington, D.C.
———. 2003b. Efficient, Sustainable Servicefor All? An OED Review of the WorldBank’s Assistance to Water Supply andSanitation. World Bank, Washington, D.C.
———. 2003c. The HIPC Initiative: Progressand Prospects. Washington, D.C.
———. 2004a. Mainstreaming Anti-corruption Activities in World Bank Assis-tance: A Review of Progress since 1997.World Bank, Washington, D.C.
———. 2004b. 2003 Annual Review of Devel-opment Effectiveness—The Effectiveness ofBank Support for Policy Reform. WorldBank, Washington, D.C.
———. 2004c. 2003 Annual Report onOperations Evaluation (AROE). WorldBank, Washington, D.C.
———. 2004d. Influential Evaluations: Eval-uations that Improved Performance and
R E F E R E N C E S
G L O B A L M O N I T O R I N G R E P O R T 2 0 0 5 255

Impacts of Development Programs. WorldBank, Washington, D.C.
———. 2004e. The Poverty Reduction Strat-egy Initiative: An Independent Evaluationof the World Bank’s Support Through2003. World Bank, Washington, D.C.
———. 2004f. Addressing the Challenges ofGlobalization: An Independent Evalua-tion of the World Bank’s Approach toGlobal Programs. World Bank, Washing-ton, D.C.
———. 2004g. “Country Program Retro-spective: What Have We Learned fromOED’s Country Assistance Evaluations?”Conference on Effectiveness of Policiesand Reforms. World Bank, Washington,D.C.
OED (Operations Evaluation Department),OEG (Operations Evaluation Group), andOEU (Operations Evaluation Unit). 2004.Improving Investment Climates: An Eval-uation of World Bank Group Assistance.World Bank, Washington, D.C.
Paris Declaration on Aid Effectiveness. 2005.High Level Forum on Aid Effectiveness.Paris, France. February. [http://www1.worldbank.org/harmonization/Paris/FINALPARISDECLARATION.pdf].
Scott, Allison, 2005. DFID’s Assessment ofMultilateral Effectiveness: An Overview ofResults. DFID, London.
Trócaire. 2004. “The Other Side of the Coin—An Alternative Perspective on the Role ofthe IMF in LICs.” Maynooth, Ireland.
World Bank. 2003. The World Bank’s GlobalPoll 2002–2003: Follow-up and RelatedActivities. OM2003-0056. Washington,D.C.
———. 2004a. Enhancing World Bank Sup-port to Middle-Income Countries.SecM2004-0071. Washington, D.C.
———. 2004b. Implementation of theAgenda on Managing for Results: ProgressReport. Washington, D.C.
———. 2004c. Update on Cooperationamong Multilateral Development Banks.SecM2004-0116. Washington, D.C.
———. 2004d. Coherence, Coordination,and Cooperation among MultilateralOrganizations: Progress and Challenges.SecM2004-0152. Washington, D.C.
———. 2004e. Voice and Participation ofDeveloping and Transition Countries:Progress Reports. DC2004-0014. Wash-ington, D.C.
———. 2004f. Aid Effectiveness and Financ-ing Modalities. SecM2004-0407. Wash-ington, D.C.
———. 2005a. Expanding the Use ofCountry Systems in Bank-SupportedOperations: Issues and Proposals.SecM2005-0018. Washington, D.C.
———. 2005b. Note on World Bank Activi-ties in Harmonization and Alignment; andHarmonization, Alignment, Results:Report on Progress, Challenges, andOpportunities. SecM2005-0025. Wash-ington, D.C.
———. 2005c. Sector Strategy Implementa-tion Update. SecM2005-0045. Washing-ton, D.C.
———. 2005d. “Enhancing World Bank Sup-port to Middle Income Countries. Manage-ment Action Plan: Progress Memorandum.”R2005-0016. Washington, D.C.
———. 2005e. Results Focus in CountryAssistance Strategies: A Stocktaking ofResults-Based CASs. R2005-0042. Wash-ington, D.C.
———.2005f. “Managing the Debt Risk ofExogenous Shocks in Low Income Coun-tries.” SecM2005-0112. Washington, D.C.
R E F E R E N C E S
256 G L O B A L M O N I T O R I N G R E P O R T 2 0 0 5

The year 2005 marks an important juncture for development as the internationalcommunity takes stock of implementation of the Millennium Declaration—signed by 189 countries in 2000—and discusses how progress toward theMillennium Development Goals (MDGs) can be accelerated. The MDGs set clear targets for reducing poverty and other human deprivations and for
promoting sustainable development. What progress has been made toward these goals, and what should be done to accelerate it? What are the responsibilities of developing countries, developed countries, and international financial institutions? And how are these actors deliveringon the commitments to development they made under the Monterrey Consensus of 2002?Global Monitoring Report 2005 addresses these questions.
Prepared jointly by the staff of the World Bank and the International Monetary Fund (IMF), inclose collaboration with partner agencies, this report is the second in an annual series assessingprogress on the MDGs and related development outcomes. This year’s report has a special focuson Sub-Saharan Africa—the region that is farthest from the development goals and faces thetoughest challenges in accelerating progress.
The report finds that without rapid action to accelerate progress, the MDGs will be seriouslyjeopardized—especially in Sub-Saharan Africa, which is falling short on all the goals. It calls
on the international community to seize the opportunities presented by the increasedglobal attention to development in 2005 to build momentum for the MDGs.
The report presents in-depth analysis of the agenda and priorities for action. Itdiscusses improvements in policies and governance that developing countries need
to make to achieve stronger economic growth and scale up human development andrelated key services. It examines actions that developed countries need to take to provide
more and better development aid and to reform their trade policies to improve market accessfor developing country exports. And it evaluates how international financial institutions can
strengthen and sharpen their support for this agenda.
Global Monitoring Report 2005 is essential reading for development practitioners and those interested in international affairs, especially in the context of major international discussions in 2005 on the MDGs and development in Sub-Saharan Africa.
THE WORLD BANK
ISBN 0-8213-6077-9