global macro matters value versus growth stocks: the
TRANSCRIPT
Global macro matters
Value versus growth stocks: The coming reversal of fortunes
Vanguard Research | April 2021
Authors: Kevin DiCiurcio, CFA; Olga Lepigina, MBA; Ian Kresnak, CFA; and Joseph Davis, PhD
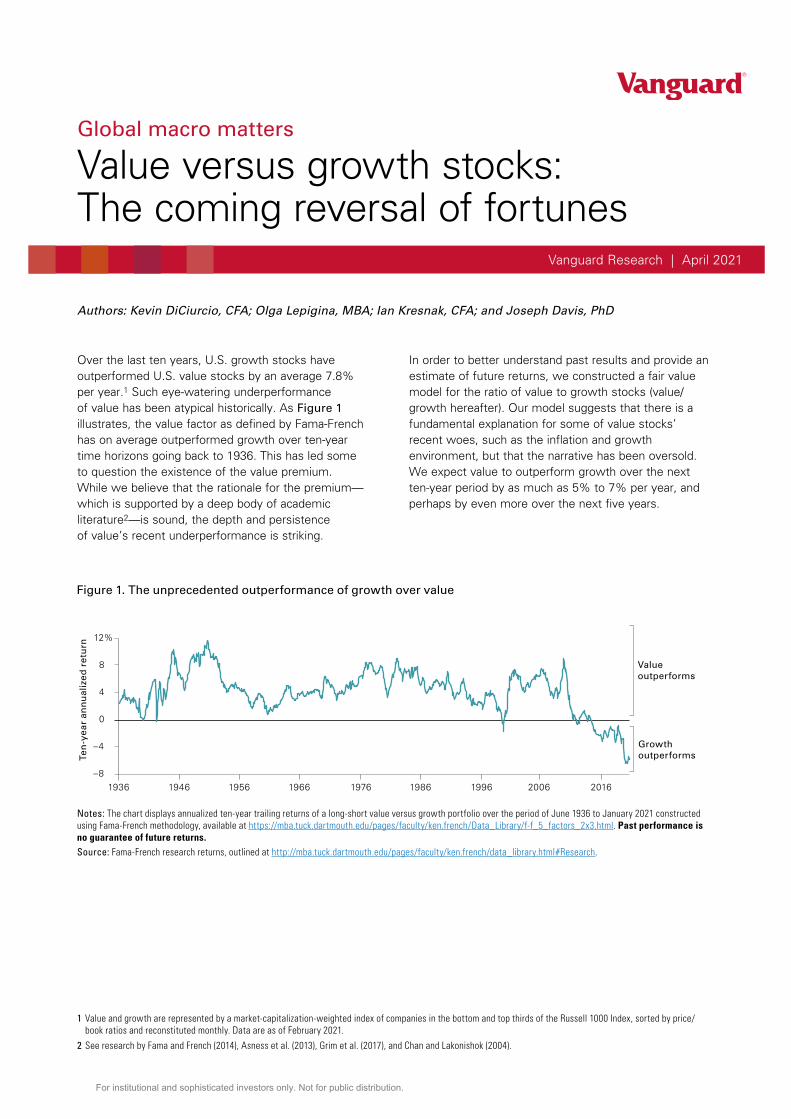
Over the last ten years, U.S. growth stocks have outperformed U.S. value stocks by an average 7.8% per year.1 Such eye-watering underperformance of value has been atypical historically. As Figure 1 illustrates, the value factor as defined by Fama-French has on average outperformed growth over ten-year time horizons going back to 1936. This has led some to question the existence of the value premium. While we believe that the rationale for the premium—which is supported by a deep body of academic literature2—is sound, the depth and persistence of value’s recent underperformance is striking.
1 Value and growth are represented by a market-capitalization-weighted index of companies in the bottom and top thirds of the Russell 1000 Index, sorted by price/book ratios and reconstituted monthly. Data are as of February 2021.
2 See research by Fama and French (2014), Asness et al. (2013), Grim et al. (2017), and Chan and Lakonishok (2004).
In order to better understand past results and provide an estimate of future returns, we constructed a fair value model for the ratio of value to growth stocks (value/growth hereafter). Our model suggests that there is a fundamental explanation for some of value stocks’ recent woes, such as the inflation and growth environment, but that the narrative has been oversold. We expect value to outperform growth over the next ten-year period by as much as 5% to 7% per year, and perhaps by even more over the next five years.
Figure 1. The unprecedented outperformance of growth over value
–8
–4
0
4
8
12%
Ten
-yea
r an
nu
aliz
ed r
etu
rn
19461936 1956 1966 1976 1986 1996 2006 2016
Growthoutperforms
Valueoutperforms
Notes: The chart displays annualized ten-year trailing returns of a long-short value versus growth portfolio over the period of June 1936 to January 2021 constructed using Fama-French methodology, available at https://mba.tuck.dartmouth.edu/pages/faculty/ken.french/Data_Library/f-f_5_factors_2x3.html. Past performance is no guarantee of future returns. Source: Fama-French research returns, outlined at http://mba.tuck.dartmouth.edu/pages/faculty/ken.french/data_library.html#Research.
For institutional and sophisticated investors only. Not for public distribution.

2
The fair value of value
The underperformance of value over the last decade has led to a proliferation of explanations. They range from the inadequacy of historical measures of value (Arnott et al., 2021) to platform effects and the “winner-take-all” benefits they bestow on the economics of technology companies (Noe and Parker, 2005, and Hand, 2001).3 Our analysis considers these arguments and concludes they have merit, but our research suggests that four key factors drove the underperformance of value and the outperformance of growth over the past decade: inflation, real interest rates, the corporate profits growth rate, and equity market volatility. Further, our findings suggest that modeling the relative performance of value and growth separately offers novel insights into which drivers most influence the behavior of the value/growth ratio.
3 Internet firms compete in an environment where aggressive competition for market share forces high upfront spending on site quality and advertising. The winner of this early, aggressive competition is rewarded with a call option on market leadership—hence “winner-take-all.”
4 This metric is calculated as the four-quarter moving average of the sum of R&D expense divided by the four-quarter moving average of the sum of book values for companies in the Russell 1000 Growth Index from October 1989 to May 2020, based on data from Compustat. For the months prior to October 1989, R&D expense is estimated from the relationship between nonresidential fixed investment intellectual property products (as defined by the U.S. Bureau of Economic Analysis) and the cumulative R&D expense from Compustat described above (r-squared: 0.98). Book values are estimated in a similar manner using data from FactSet (r-squared: 0.54).
Figure 2 highlights the rationale for four drivers and their contributions to the explanatory power of three models of past results: growth/market, value/market, and value/growth. An additional fifth driver—R&D expense as a percentage of book value—is included in the growth/market model.4 This is consistent with studies such as Arnott et al. (2021), suggesting that adjusting book value to include R&D and intangible assets reduces the relative performance gap between value and growth. Indeed, that driver—which has increased 550% since June 2011—explains most of the 80% run-up in the ratio of growth to the broad market. However, the relationship between R&D expense and the value/growth ratio is not statistically significant when it is combined with the other variables shown in Figure 2.
Notes on risk
All investing is subject to risk, including possible loss of the money you invest. Past performance does not guarantee future results. There is no guarantee that any particular asset allocation or mix of funds will meet your investment objectives or provide you with a given level of income. The performance of an index is not an exact representation of any particular investment, as you cannot invest directly in an index. In a diversified portfolio, gains from some investments may help offset losses from others. However, diversification does not ensure a profit or protect against a loss.
Figure 2. Explanatory power by factor varies across models
Driver Description Growth/Market Value/Market Value/Growth
Ten-year trailing inflation
Trailing ten-year annualized changes in the headline Consumer Price Index (CPI). Inflation is a key component of the discount rate used to value equities. A higher discount rate increases the value of cash flows that are nearer in the future—a characteristic of value.
2.7% 27.5% 29.1%
Ten-year real Treasury yield
Month-end nominal ten-year Treasury yield minus trailing one-year annualized inflation. Real yields are the building blocks of the discount rate. Higher real yields increase the discount rate, which increases the relative valuation of value to growth.
3.5% 3.2% 4.3%
Growth of corporate profits
Corporate profits after tax with inventory valuation adjustment (IVA) and capital consumption adjustment (CCAdj) from the U.S. Bureau of Economic Analysis. When growth is plentiful, investors are less willing to pay a premium for it and favor value.
5.8% 16.7% 23.9%
Equity volatility Trailing ten-year annualized equity volatility represented by the annualized standard deviation of S&P 500 Index total returns. Higher volatility implies a wider range of potential outcomes. Added uncertainty encourages investors to prefer the more immediate cash flows that value offers.
2.7% 14.1% 10.3%
Ratio of R&D expense to book value
Rolling one-year average of the ratio of aggregate R&D expense to total book value for all companies in the Russell 1000 Growth Index, a proxy for market narrative on the impact of intangible assets and R&D on company growth prospects. The theory holds that book value does not adequately capture the sources of 21st-century companies’ value.
64.9% N/A N/A
Unexplained variance (behavior)
The portion of the changes in the value/growth ratio that is not explained by the fundamental drivers above. Behavioral deviations are expected to revert to fair value over time.
20.4% 38.5% 32.4%
Notes: Values in the table show the historical contribution of each driver (rows) to the variation in the respective valuation measure (columns). Each column sums to 100%. The sum of the first five rows in each column is the r-squared for that model and reflects the proportion of the variance explained by the model. The remaining variance is captured in model residuals.Sources: Robert Shiller’s website, U.S. Bureau of Economic Analysis, FactSet, Compustat, and Datastream. Data are as of February 2021.
For institutional and sophisticated investors only. Not for public distribution.

3
Notes on risk
All investing is subject to risk, including possible loss of the money you invest. Past performance does not guarantee future results. There is no guarantee that any particular asset allocation or mix of funds will meet your investment objectives or provide you with a given level of income. The performance of an index is not an exact representation of any particular investment, as you cannot invest directly in an index. In a diversified portfolio, gains from some investments may help offset losses from others. However, diversification does not ensure a profit or protect against a loss.
Figure 2. Explanatory power by factor varies across models
Driver Description Growth/Market Value/Market Value/Growth
Ten-year trailing inflation
Trailing ten-year annualized changes in the headline Consumer Price Index (CPI). Inflation is a key component of the discount rate used to value equities. A higher discount rate increases the value of cash flows that are nearer in the future—a characteristic of value.
2.7% 27.5% 29.1%
Ten-year real Treasury yield
Month-end nominal ten-year Treasury yield minus trailing one-year annualized inflation. Real yields are the building blocks of the discount rate. Higher real yields increase the discount rate, which increases the relative valuation of value to growth.
3.5% 3.2% 4.3%
Growth of corporate profits
Corporate profits after tax with inventory valuation adjustment (IVA) and capital consumption adjustment (CCAdj) from the U.S. Bureau of Economic Analysis. When growth is plentiful, investors are less willing to pay a premium for it and favor value.
5.8% 16.7% 23.9%
Equity volatility Trailing ten-year annualized equity volatility represented by the annualized standard deviation of S&P 500 Index total returns. Higher volatility implies a wider range of potential outcomes. Added uncertainty encourages investors to prefer the more immediate cash flows that value offers.
2.7% 14.1% 10.3%
Ratio of R&D expense to book value
Rolling one-year average of the ratio of aggregate R&D expense to total book value for all companies in the Russell 1000 Growth Index, a proxy for market narrative on the impact of intangible assets and R&D on company growth prospects. The theory holds that book value does not adequately capture the sources of 21st-century companies’ value.
64.9% N/A N/A
Unexplained variance (behavior)
The portion of the changes in the value/growth ratio that is not explained by the fundamental drivers above. Behavioral deviations are expected to revert to fair value over time.
20.4% 38.5% 32.4%
Notes: Values in the table show the historical contribution of each driver (rows) to the variation in the respective valuation measure (columns). Each column sums to 100%. The sum of the first five rows in each column is the r-squared for that model and reflects the proportion of the variance explained by the model. The remaining variance is captured in model residuals.Sources: Robert Shiller’s website, U.S. Bureau of Economic Analysis, FactSet, Compustat, and Datastream. Data are as of February 2021.
For institutional and sophisticated investors only. Not for public distribution.
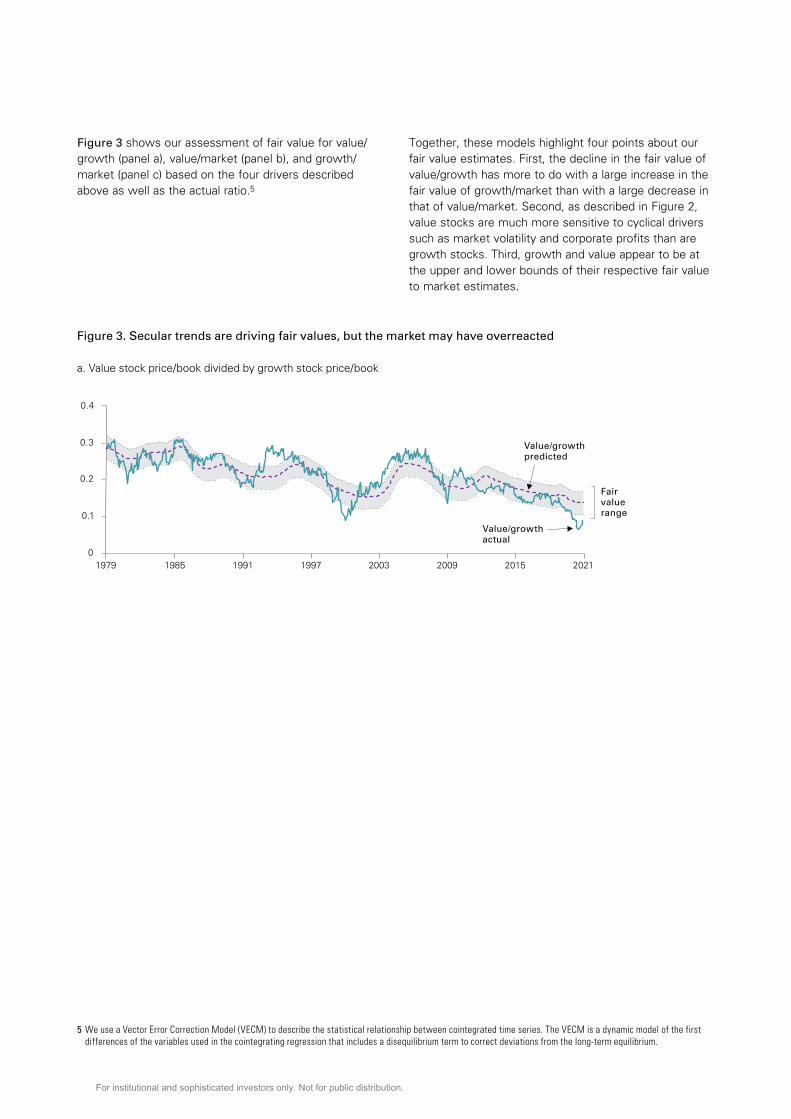
Figure 3 shows our assessment of fair value for value/growth (panel a), value/market (panel b), and growth/market (panel c) based on the four drivers described above as well as the actual ratio.5
5 We use a Vector Error Correction Model (VECM) to describe the statistical relationship between cointegrated time series. The VECM is a dynamic model of the first differences of the variables used in the cointegrating regression that includes a disequilibrium term to correct deviations from the long-term equilibrium.
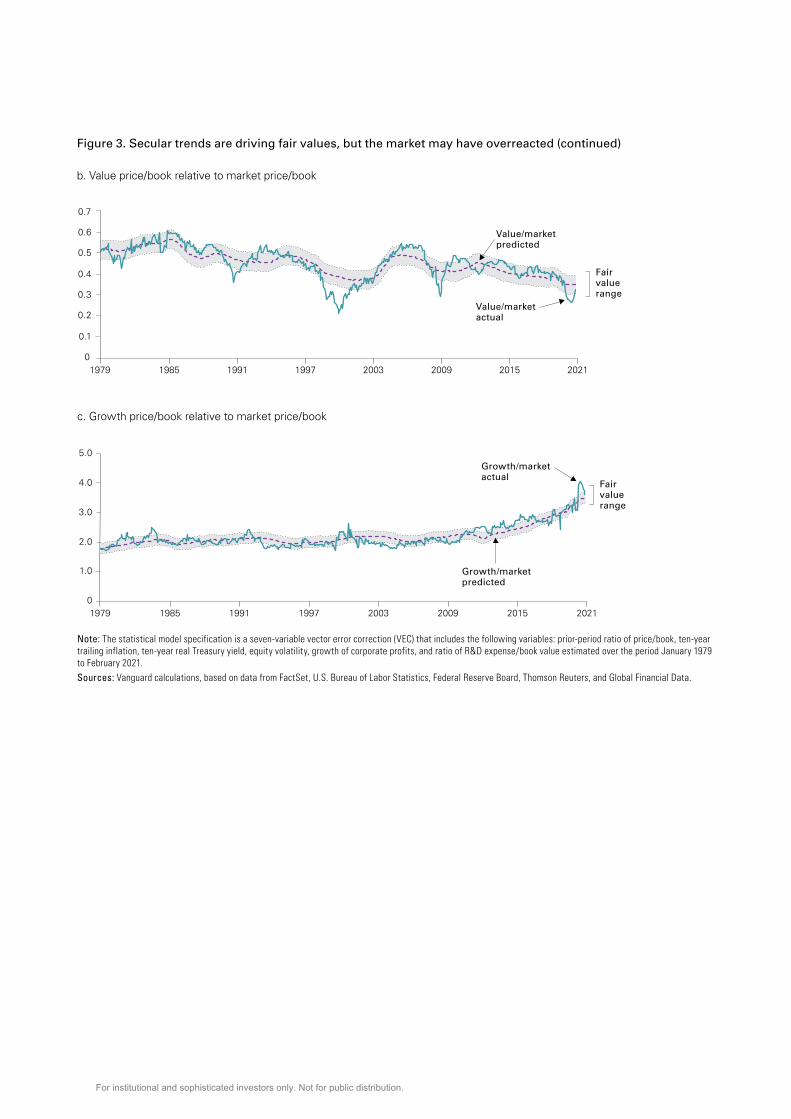
Together, these models highlight four points about our fair value estimates. First, the decline in the fair value of value/growth has more to do with a large increase in the fair value of growth/market than with a large decrease in that of value/market. Second, as described in Figure 2, value stocks are much more sensitive to cyclical drivers such as market volatility and corporate profits than are growth stocks. Third, growth and value appear to be at the upper and lower bounds of their respective fair value to market estimates.
Figure 3. Secular trends are driving fair values, but the market may have overreacted
a. Value stock price/book divided by growth stock price/book
Fairvaluerange
Value/growthactual
0
0.1
0.2
0.3
0.4
Value/growthpredicted
1979 1985 1991 1997 2003 2009 2015 2021
Figure 3. Secular trends are driving fair values, but the market may have overreacted (continued)
b. Value price/book relative to market price/book
0
0.1
0.2
0.3
0.4
0.5
0.6
0.7
Value/marketactual
Value/marketpredicted
Fairvaluerange
1979 1985 1991 1997 2003 2009 2015 2021
c. Growth price/book relative to market price/book
0
1.0
2.0
3.0
4.0
5.0
Growth/marketpredicted
Growth/marketactual
Fairvaluerange
1979 1985 1991 1997 2003 2009 2015 2021
Note: The statistical model specification is a seven-variable vector error correction (VEC) that includes the following variables: prior-period ratio of price/book, ten-year trailing inflation, ten-year real Treasury yield, equity volatility, growth of corporate profits, and ratio of R&D expense/book value estimated over the period January 1979 to February 2021. Sources: Vanguard calculations, based on data from FactSet, U.S. Bureau of Labor Statistics, Federal Reserve Board, Thomson Reuters, and Global Financial Data.
For institutional and sophisticated investors only. Not for public distribution.

6
Finally, the secular decline in inflation over the past 40 years explains a majority of the decline in the fair value of value/growth since 1979, as highlighted in Figure 4.6
Two sources of return: reversion to and changes in fair value
Our framework for assessing the current state of value/growth allows us to make projections about future returns, which will come from two primary sources. First, based on the historical performance of the models, deviations from fair value typically revert to fair value over time.
6 Over the past decade, a continued, albeit slower, downtrend in long-term inflation, falling real rates, and a lack of material strength in corporate profits further depressed relative valuations.
7 The ten-year horizon is consistent with the primary horizon featured in the latest Vanguard Economic and Market Outlook (2021). The five-year horizon was also selected after our analysis showed that deviations from fair value decay to zero over a four- to six-year period on average.
The relationship between the deviations and future relative returns is inverse and statistically significant over both five- and ten-year time horizons, suggesting that, on average, deviations from fair value in which value is considered undervalued are associated with higher value returns relative to growth, and vice versa.7 Although the range of relative returns implied by this historical relationship may not be precisely representative of what an investor should expect in the future, since it also captures the changes in fair value that occurred historically, it does provide evidence that deviations from fair value tend to revert to fair value over time—a core component of our outlook.
Figure 4. Inflation is primarily responsible for the decline in fair value
Value price to book/growth price to book
Estimatefor 1979
0.290
Increasefrom real10-year
yield
0.005
Decreasefrom
10-yearannualizedin�ation
0.146
Decreasefrom
equityvolatility
0.000
Decreasefrom
corporatepro�ts
0.000
Increasefrom
reversion
0.035
Estimatefor December
2010
0.181
Decreasefrom real10-year
yield
0.025
Increasefrom equity
volatility
0.014
Decreasefrom
corporatepro�ts
0.004
Increasefrom
reversion
0.063
Estimatefor December
2020
0.141
Decreasefrom
10-yearannualizedin�ation
0.089
Notes: The size of each bar represents that variable’s contribution to changes in the predicted ratio of value and growth price/book ratios from our fair value model. Reversion refers to the statistical properties of a Vector Error Correction Model—as estimates of fair value decline, the model forecasts a return to equilibrium. Numbers may differ slightly because of rounding.Source: Vanguard.
For institutional and sophisticated investors only. Not for public distribution.

7
In addition to reversion to fair value, returns can also come from changes in fair value itself. Forecasting the evolution of fair value requires forecasts for the systematic drivers that we have previously detailed. We estimate a system of regression models for our five drivers. We then use Monte-Carlo simulation techniques to project a probability distribution of outcomes.8 The medians of this distribution are consistent with Vanguard’s long-term macroeconomic view that inflation and real rates will stay below their historical averages despite a modest reflation (Davis et al., 2020). Figure 5 illustrates the range of fair value projections for value/
8 A Monte-Carlo simulation randomly samples values for an independent variable based on the uncertainty of the estimate, the distribution of residuals, and the correlation with other independent variables in the model. The resulting distribution can then be used to make a probabilistic prediction of the dependent variable.
growth. We expect a gradual rise in fair value over the next five to ten years as long-term inflation measures begin to normalize to our 2% target, real interest rates rise, and corporate profit growth rates increase amid the COVID-19 recovery. Although we expect the medians to converge to their long-term targets over the next five to ten years, they will fail to reach their historical norms based on our forward-looking view that inflation, interest rates, and growth will remain below historical averages. If the recovery were to stall meaningfully (or reverse) and neither inflation nor corporate profits accelerated, there is a risk that growth could continue to outperform.
Figure 5. Returns from changes in fair value are possible but likely won’t look like the past
0%
20%
40%
60%
80%
100%
-6 -4 -2 0 2 4 6
-15
-10
-5
0
5
10
15
0.0
0.1
0.2
0.3
0.4
0.5
0.6
0.7
0.8
0.0
0.1
0.2
0.3
0.4
0.5
0.6
0.7
0.8
0%
100%
200%
300%
400%
500%
2012201120102009200820072006200520042003Notes: dot size = p4
to change size: select same appearance; go to effect > convert to shape > ellipse > absolute
1p
–6
–3
0
3
6
9
12
15%
Top Bottom
Axi
s la
bel
if n
eed
ed
Axis label if needed
-6%
-3%
0%
3%
6%
9%
12%
15%
5th
95th
Percentileskey:
75th
25th
Median
5th
95th
Percentileskey:
75th
25th
Median
Note: Add .75 white stroke around small boxes on top of color.
In stroke drop down box click ‘align stroke to outside’
Note: to create white rules - Use white arrow to select the stacked boxes.
Add .75 white stroke.
In stroke drop down box click ‘align stroke to outside’
Note: Add .75 white stroke
between colors.
0
0.05
0.10
0.15
0.20
0.25
0.30
0.35
1983 1987 1981 1995 1999 2003 2007 2011 2015 2019 2023 2027 2030
Fair value rangeValue/growth price/book historical ratioMedian fair value estimateR
atio
of
valu
e p
rice
/bo
ok
to
gro
wth
pri
ce/b
oo
k
1979
Convergence of thecurrent ratio to fair value
Fair value of value/growthprice/book ratio prediction
Note: The valuation ratio is projected based on the VECM model described in footnote 5 and using a VAR(5)—a five-lag vector autoregression model—to project the systematic drivers detailed in Figure 2. Sources: Vanguard calculations, based on data from FactSet.
For institutional and sophisticated investors only. Not for public distribution.

8
Future returns: a five- and ten-year look
On an average annualized basis, our forecast suggests value should outperform growth by between 9% and 13% over the next five years and 5% to 7% over the next ten years. Investors who allocate their entire equity portfolio to value can expect average annualized returns of 4.3% to 7.3% over the next decade, versus 3% to 5% for the broad U.S. equity market.9
Figure 6 shows the full distribution of our outlook based on the two sources of returns described above. Returns from changes in fair value also account for differences in other key components of equity performance such as dividend yields and growth in fundamentals.10
Within the probability distribution, the upside scenario for value is associated with long-term inflation and real interest rate levels overshooting our targets and ending at 2.5% and 3.25%, respectively, with earnings growth reaching levels last seen in 2011. The downside for
9 These ranges reflect the middle 50 percent of projected excess return outcomes in our distribution and capture a broad range of likely outcomes. Excess returns to value (1.3% to 2.3%) are added to a +/– 1 percentage-point median range of broad U.S. equity market return expectations (3% to 5%) for the next ten years. Excess returns are additive, resulting from zero correlation between value returns in excess of the market and broad market returns historically.
10 Relative value to growth returns are calculated as diff(div yield) + change in relative valuation + diff(growth in book value), in which dividend yields and book values are constant ten-year averages and relative valuations are forecasted in the VAR.
11 Our median forecast for R&D expense assumes that the metric stays at current levels. Considering this constant median, the market is currently trading at the upper end of the fair value projection over the next decade.
value would be associated with a recessionary scenario in which long-term inflation declines to 1.4%, real rates remain near 0%, and corporate profits decline.
A significant risk to this outlook is the relationship we have identified between growth valuations and R&D spending. Participants in that market are rewarding such corporate behavior with increases in valuation multiples. While we do not have an informed view on the expectation for future R&D spending by growth companies, we can say that current valuations of growth relative to the broad market are already priced to reflect the most optimistic corners of the distribution.11 Therefore, it is not unreasonable to believe that, even if investors continue to reward this behavior, less upside potential remains.
Figure 6. Reversion to fair value will be the primary driver of value outperformance over the next five- and ten-year periods
a. Return from change in fair value
Five-yearannualized
return
Ten-yearannualized
return
–1.0%
2.8%
1.5%
–0.1%0
4.9%
2.2%
–4
4
8
12%
b. Return from reversion to fair value
–4
4
8
12%
Five-yearannualized
return
Ten-yearannualized
return
10.8%
9.0%
6.6%
5.3%4.6%3.5%
0
c. Total return
Five-yearannualized
return
Ten-yearannualized
return
15.7%
11.1%
5.7%
8.1%
6.0%
3.5%
0
4
8
12
16%
Note: Returns are calculated based on a modeled reversion to fair value and a projection of the fair value ratio of value/growth price/book, as detailed in Figure 5. Total return in panel c is the sum of the return components in panels a and b at each percentile. Note that numbers may differ slightly because of rounding.Sources: Vanguard calculations, based on data from FactSet.
Percentileskey:
5th
95th
75th
25th
Median+ =
For institutional and sophisticated investors only. Not for public distribution.

9
Conclusion
The past ten years have been tremendous for growth stocks, but, as we highlighted in the Vanguard Economic and Market Outlook for 2021: Approaching the Dawn, we do not expect the trends that defined the last decade to persist through the next. Growth’s recent outperformance is likely sowing the seeds for value’s resurgence on a relative basis. This resurgence should be further supported by a broadening economic recovery and a modest reflation in the years ahead. Investors who
maintain a portfolio diversified across sectors and styles can expect value’s outperformance to be a cushion against possible negative returns in the growth portion. In that sense, they would be advised to stay the course. However, for U.S. investors with the appropriate risk budget, time horizon, and patience, we believe an overweight to value stocks commensurate with these factors could help overcome a lower-return environment over the next decade.
For institutional and sophisticated investors only. Not for public distribution.

10
References
Arnott, Robert D., Campbell R. Harvey, Vitali Kalesnik, and Juhani T. Linnainmaa, 2021. Reports of Value’s Death May Be Greatly Exaggerated. Financial Analysts Journal 77(1): 44–67.
Asness, Clifford S., Tobias J. Mosckowitz, and Lasse Heje Pedersen, 2013. Value and Momentum Everywhere. The Journal of Finance. Available at https://core.ac.uk/download/pdf/193275548.pdf.
Chan, Louis K. C., and Josef Lakonishok, 2004. Value and Growth Investing: Review and Update. Financial Analysts Journal 60(1): 71–86. Available at http://www.jstor.org/stable/4480542.
Davis, Joseph, Roger A. Aliaga-Díaz, Peter Westaway, Qian Wang, Andrew J. Patterson, Kevin DiCiurcio, Alexis Gray, and Jonathan Lemco, 2020. Vanguard Economic and Market Outlook for 2021: Approaching the Dawn. Valley Forge, Pa.: The Vanguard Group.
Fama, Eugene F., and Kenneth R. French, 2014. A Five-Factor Asset Pricing Model. Available at http://dx.doi.org/10.2139/ssrn.2287202.
Grim, Douglas A., Scott N. Pappas, Ravi G. Tolani, and Savas Kesidis, 2017. Equity Factor-Based Investing: A Practitioner’s Guide. Valley Forge, Pa.: The Vanguard Group.
Hand, John R. M., 2001. Evidence on the Winner-Takes-All Business Model: The Profitability Returns-to-Scale of Expenditures on Intangibles Made by U.S. Internet Firms, 1995–2001. Available at http://dx.doi.org/10.2139/ssrn.292099.
Noe, Thomas H., and Geoffrey Parker, 2005. Winner Take All: Competition, Strategy, and the Structure of Returns in the Internet Economy. Journal of Economics & Management Strategy 14(1): 141. Available at http://dx.doi.org/10.2139/ssrn.250371.
For institutional and sophisticated investors only. Not for public distribution.

Important Information
VIGM, S.A. de C.V. Asesor en Inversiones Independiente (“Vanguard Mexico”) registration number: 30119-001-(14831)-19/09/2018. The registration of Vanguard Mexico before the Comisión Nacional Bancaria y de Valores (“CNBV”) as an Asesor en Inversiones Independiente is not a certification of Vanguard Mexico’s compliance with regulation applicable to Advisory Investment Services (Servicios de Inversión Asesorados) nor a certification on the accuracy of the information provided herein. The supervision scope of the CNBV is limited to Advisory Investment Services only and not all services provided by Vanguard Mexico.
This material is solely for informational purposes and does not constitute an offer or solicitation to sell or a solicitation of an offer to buy any security, nor shall any such securities be offered or sold to any person, in any jurisdiction in which an offer, solicitation, purchase or sale would be unlawful under the securities law of that jurisdiction. Reliance upon information in this material is at the sole discretion of the reader.
Securities information provided in this document must be reviewed together with the offering information of each of the securities which may be found on Vanguard’s website: https://www.vanguardmexico.com/web/cf/mexicoinstitutional/en/home or www.vanguard.com
Vanguard Mexico may recommend products of The Vanguard Group Inc. and its affiliates and such affiliates and their clients may maintain positions in the securities recommended by Vanguard Mexico.
ETF Shares can be bought and sold only through a broker and cannot be redeemed with the issuing fund other than in very large aggregations. Investing in ETFs entails stockbroker commission and a bid-offer spread which should be considered fully before investing. The market price of ETF Shares may be more or less than net asset value.
All investments are subject to risk, including the possible loss of the money you invest. Investments in bond funds are subject to interest rate, credit, and inflation risk. Governmental backing of securities apply only to the underlying securities and does not prevent share-price fluctuations. High-yield bonds generally have medium- and lower-range credit quality ratings and are therefore subject to a higher level of credit risk than bonds with higher credit quality ratings.
There is no guarantee that any forecasts made will come to pass. Past performance is no guarantee of future results.
Prices of mid- and small-cap stocks often fluctuate more than those of large-company stocks. Funds that concentrate on a relatively narrow market sector face the risk of higher share-price volatility. Stocks of companies are subject to national and regional political and economic risks and to the risk of currency fluctuations, these risks are especially high in emerging markets. Changes in exchange rates may have an adverse effect on the value, price or income of a fund.
The information contained in this material derived from third-party sources is deemed reliable, however Vanguard Mexico and The Vanguard Group Inc. are not responsible and do not guarantee the completeness or accuracy of such information.
This document should not be considered as an investment recommendation, a recommendation can only be provided by Vanguard Mexico upon completion of the relevant profiling and legal processes.
This document is for educational purposes only and does not take into consideration your background and specific circumstances nor any other investment profiling circumstances that could be material for taking an investment decision. We recommend to obtain professional advice based on your individual circumstances before taking an investment decision.
These materials are intended for institutional use only and not for public distribution. The information contained herein does not constitute an offer or solicitation and may not be treated as such in any jurisdiction where such an
offer or solicitation is against the law, or to anyone for whom it is unlawful to make such an offer or solicitation, or if the person making the offer or solicitation is not qualified to do so. Materials are provided only for their exclusive use and shall not be distributed to any other individual or entity. Broker-dealers, advisers, and other intermediaries must determine whether their clients are eligible for investment in the products discussed herein.
All investments are subject to risk, including the possible loss of the money you invest. Investments in bond funds are subject to interest rate, credit, and inflation risk. There is no guarantee that any forecasts made will come to pass. Past performance is no guarantee of future results.
THESE MATERIALS ARE PROVIDED AT THE REQUEST OF AND FOR THEEXCLUSIVE USE OF RECIPIENT AND CONTAIN HIGHLY CONFIDENTIAL INFORMATION, WHICH SHALL NOT BE REPRODUCED OR TRANSMITTED TO ANY THIRD PARTIES WITHOUT VANGUARD’S PRIOR WRITTEN CONSENT. THE CONTENTS OF THESE MATERIALS SHALL NOT BE UNDERSTOOD AS AN OFFER OR SOLICITATION TO BUY OR SELL SECURITIES IN BRAZIL AND VANGUARD IS NOT MAKING ANY REPRESENTATION WITH RESPECT TO THE ELIGIBILITY OF ANY RECIPIENT OF THESE MATERIALS TO ACQUIRE THE INTERESTS IN THE SECURITIES DESCRIBED HEREIN UNDER THE LAWS OF BRAZIL. SUCH SECURITIES HAVE NOT BEEN REGISTERED IN BRAZIL AND NONE OF THE INTERESTS IN SUCH SECURITIES MAY BE OFFERED, SOLD, OR DELIVERED, DIRECTLY OR INDIRECTLY, IN BRAZIL OR TO ANY RESIDENT OF BRAZIL EXCEPT PURSUANT TO THE APPLICABLE LAWS AND REGULATIONS OF BRAZIL.
‘This document does not constitute, and is not intended to constitute, a public offer in the Republic of Colombia, or an unlawful promotion of financial/capital market products. The offer of the Product is addressed to fewer than one hundred specifically identified investors. The Product may not be promoted or marketed in Colombia or to Colombian residents, unless such promotion and marketing is made in compliance with Decree 2555/2010 and other applicable rules and regulations related to the promotion of foreign financial/capital market products in Colombia.
The Product is not and will not be registered before the Colombian National Registry of Securities and Issuers (Registro Nacional de Valores y Emisores - RNVE) maintained by the Colombian Financial Superintendency, or before the Colombian Stock Exchange. Accordingly, the distribution of any documentation in regards to the Product will not constitute a public offering of securities in Colombia.
The Product may not be offered, sold or negotiated in Colombia, except under circumstances which do not constitute a public offering of securities under applicable Colombian securities laws and regulations; provided that, any authorized person of a firm authorized to offer foreign securities in Colombia must abide by the terms of Decree 2555/2010 to offer the Product privately to its Colombian clients.
The distribution of this material and the offering of shares may be restricted in certain jurisdictions. The information contained in this material is for general guidance only, and it is the responsibility of any person or persons in possession of this material and wishing to make application for shares to inform themselves of, and to observe, all applicable laws and regulations of any relevant jurisdiction. Prospective applicants for shares should inform themselves of any applicable legal requirements, exchange control regulations and applicable taxes in the countries of their respective citizenship, residence or domicile.”
THIS OFFER CONFORMS TO GENERAL RULE NO. 336 OF THE CHILEAN FINANCIAL MARKET COMMISSION (COMISIÓN PARA EL MERCADO FINANCIERO). THE OFFER DEALS WITH SECURITIES NOT REGISTERED UNDER SECURITIES MARKET LAW, NOR IN THE SECURITIES REGISTRY NOR IN THE FOREIGN SECURITIES REGISTRY OF THE CHILEAN FINANCIAL MARKET COMMISSION, AND THEREFORE SUCH SECURITIES ARE NOT SUBJECT TO ITS OVERSIGHT. SINCE SUCH SECURITIES ARE NOT REGISTERED IN CHILE, THE ISSUER IS NOT OBLIGATED TO PROVIDE PUBLIC INFORMATION
For institutional and sophisticated investors only. Not for public distribution.
Connect with Vanguard® global.vanguard.com
Vanguard research authors
Colleen M. Jaconetti, CPA, CFP® Jonathan Kahler, CFP® Kelly McShane, CFA Nathan Zahm, CFA, FSA
CFA® is a registered trademark owned by CFA Institute.
© 2021 The Vanguard Group, Inc. All rights reserved. Vanguard Marketing Corporation, Distributor.
ISGRFS 032021
IN CHILE REGARDING THE SECURITIES. THE SECURITIES SHALL NOT BE SUBJECT TO PUBLIC OFFERING UNLESS THEY ARE DULY REGISTERED IN THE CORRESPONDING SECURITIES REGISTRY IN CHILE.
ESTA OFERTA SE ACOGE A LA NORMA DE CARÁCTER GENERAL N° 336 DE LA COMISIÓN PARA EL MERCADO FINANCIERO. LA OFERTA VERSA SOBRE VALORES NO INSCRITOS BAJO LA LEY DE MERCADO DE VALORES EN EL REGISTRO DE VALORES O EN EL REGISTRO DE VALORES EXTRANJEROS QUE LLEVA LA COMISIÓN PARA EL MERCADO FINANCIERO, POR LO QUE TALES VALORES NO ESTÁN SUJETOS A LA FISCALIZACIÓN DE ÉSTA. POR TRATARSE DE VALORES NO INSCRITOS, NO EXISTE LA OBLIGACIÓN POR PARTE DEL EMISOR DE ENTREGAR EN CHILE INFORMACIÓN PÚBLICA RESPECTO DE ESOS VALORES. LOS VALORES NO PODRÁN SER OBJETO DE OFERTA PÚBLICA MIENTRAS NO SEAN INSCRITOS EN EL REGISTRO DE VALORES CORRESPONDIENTE.
The securities described herein have not been registered under the Peruvian Securities Market Law (Decreto Supremo No 093-2002-EF) or before the Superintendencia del Mercado de Valores (SMV). There will be no public offering of the securities in Peru and the securities may only be offered or sold to institutional investors (as defined in Appendix I of the Institutional Investors Market Regulation) in Peru by means of a private placement. The securities offered and sold in Peru may not be sold or transferred to any person other than an institutional investor unless such securities have been registered with the Registro Público del Mercado de Valores kept by the SMV. The SMV has not reviewed the information provided to the investor. This material is for the exclusive use of institutional investors in Peru and is not for public distribution.
The Products may be offered or sold in Bermuda only in compliance with the provisions of the Investment Business Act 2003 of Bermuda. Additionally, non-Bermudian persons may not carry on or engage in any trade or business in Bermuda unless such persons are authorized to do so under applicable Bermuda legislation. Engaging in the activity of offering or marketing the Products in Bermuda to persons in Bermuda may be deemed to be carrying on business in Bermuda.
Vanguard is not intending, and is not licensed or registered, to conduct business in, from or within the Cayman Islands, and the interests in the Products shall not be offered to members of the public in the Cayman Islands.
The Products have not been and will not be registered with the Securities Commission of The Bahamas. The Products are offered to persons who are non-resident or otherwise deemed non-resident for Bahamian Exchange Control purposes. The Products are not intended for persons (natural persons or legal entities) for which an offer or purchase would contravene the laws of their state (on account of nationality or domicile/registered office of the person concerned or for other reasons). Further, the offer constitutes an exempt distribution for the purposes of the Securities Industry Act, 2011 and the Securities Industry Regulations, 2012 of the Commonwealth of The Bahamas.
This document is not, and is not intended as, a public offer or advertisement of, or solicitation in respect of, securities, investments, or other investment business in the British Virgin Islands, and is not an offer to sell, or a solicitation or invitation to make offers to purchase or subscribe for, any securities, other investments, or services constituting investment business in the British Virgin Islands. Neither the securities mentioned in this document nor any prospectus or other document relating to them have been or are intended to be registered or filed with the Financial Services Commission of the British Virgin Islands or any department thereof.
This document is not intended to be distributed to individuals that are members of the public in the BVI or otherwise to individuals in the BVI. The funds are only available to, and any invitation or offer to subscribe, purchase, or otherwise acquire such funds will be made only to, persons outside the BVI, with the exception of persons resident in the BVI solely by virtue of being a company incorporated in the BVI or persons who are not considered to be “members of the public” under the Securities and Investment Business Act, 2010 (“SIBA”). Any person who receives this document in the BVI (other than a person who is not considered a member of the public in the BVI for purposes of SIBA, or a person resident in the BVI solely by virtue of being a company incorporated in the BVI and this document is received at its registered office in the BVI) should not act or rely on this Document or any of its contents.
El presente documento no constituyo una oferta o una solicitud de oferta de inversión en los valores descritos en el mismo. El presente documento está dirigido exclusivamente a inversionistas profesionales / sofisticados en los Estados Unidos y es exclusivamente de carácter informativo. Los valores solo están disponible para inversionistas finales fuera de los Estados Unidos, por lo que este documento no deberá ser distribuido a inversionistas en los Estados Unidos.Aquella entidad que utilice o reenvíe este material, elaborado por VIGM, S.A. de C.V., Asesor de Inversiones Independiente en México, a cualquier otra parte será el único responsable del cumplimiento de la regulación en dicha distribución.
This document does not constitute an offer or solicitation to invest in the securities mentioned herein. It is directed at professional / sophisticated investors in the United States for their use and information. The Fund is only available for investment by non-U.S. investors, and this document should not be given to a retail investor in the United States. Any entity responsible for forwarding this material, which is produced by VIGM, S.A. de C.V., Asesor de Inversiones Independiente in Mexico, to other parties takes responsibility for ensuring compliance with applicable securities laws in connection with its distribution.
For institutional and sophisticated investors only. Not for public distribution.