global logistics trends and the implications to …global logistics trends and the implications to...
TRANSCRIPT
© Foremost Quality Logistics Confidential
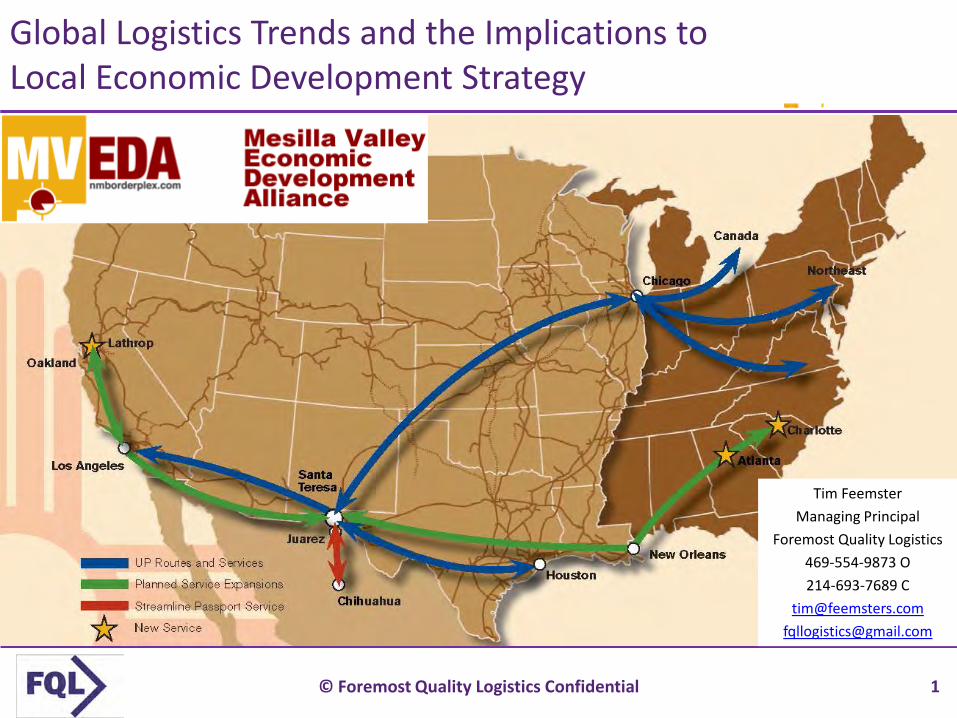
Global Logistics Trends and the Implications to Local Economic Development Strategy
Tim FeemsterManaging Principal
Foremost Quality Logistics469-554-9873 O214-693-7689 C
[email protected]@gmail.com
1

© Foremost Quality Logistics Confidential
TIM FEEMSTERMANAGING PRINCIPALForemost Quality Logistics6005 Calm Meadow RdDallas, TX 75248O 469-554-9873C [email protected]@tsfeemster on TwitterFollow on LinkedIn
YEARS OF EXPERIENCE35+ Years
AREAS OF SPECIALIZATION Facility Master Planning Lean Six Sigma Process Improvement Project Management Distribution Center Consolidations and
Greenfield Design Economic Development Business
Planning Keynote Speaker Meeting Facilitation Network Design and Planning Operations Management Real Estate Portfolio Strategy Supply Chain and Distribution Strategy Supply Chain Cost Reduction
PROFESSIONAL BACKGROUNDWith over 35 years of industry and consulting experience, Mr. Feemster specializes in supply chain and distribution network strategy,operations management in manufacturing and distribution environment, supply chain cost improvement, distribution center masterplanning, and economic development business planning.
Before establishing Foremost Quality Logistics, Mr. Feemster was a senior manager in three manufacturing companies, a consultant,an executive in two third-party logistics providers, and a practice group leader in two real estate companies.
Mr. Feemster has been exposed to the economic development, manufacturing, logistics and supply chain issues facing manyindustries and involving both refrigerated and dry channels. These experiences include specific assignments in over 40 project start-ups, operations management, Lean Six Sigma quality management, project management, strategic planning, marketing, siteselection, inventory planning and deployment, as well as transportation & private fleet management. He has been responsible forwarehouse facility layout and design, logistics systems development, purchasing strategy, business planning, carrier rationalization,warehouse network analysis, and third party qualification and selection. In addition, Mr. Feemster is quoted frequently in bothsupply chain and real estate industry press and makes over 25 presentations a year to professional organizations, university students,and economic development groups. He was honored as one of the 2010 Rainmakers by DC Velocity magazine.
Past clients include Alpo Pet Foods, Cisco Systems (US & Mexico), Coke, Disney, Federal Express, Frito Lay, Georgia Pacific, GM (USand Mexico), HP (US & Canada), Ingersoll Rand (US & Europe), NCR (US & UK), Nike Golf (US & Europe), Nissan, Philip Morris, Ricoh,and Quaker Oats.
EDUCATIONMr. Feemster holds an M.B.A. with distinction, in Marketing and Operations Research from the Ross School of Business, University ofMichigan in Ann Arbor, MI. He received his Bachelor’s degree in Mathematics from DePauw University, Greencastle, IN.
PROFESSIONAL ASSOCIATIONSWarehouse Education Research Council (WERC) – Past PresidentCouncil of Supply Chain Management Professionals (CSCMP) – Registration CommitteeDePauw University- National Alumni Board of Directors; North Texas Regional Alumni Board of DirectorsTrade Data Exchange Board of DirectorsUniversity of North Texas Center for Logistics Education & Research Advisory BoardUniversity of Houston Logistics & Technology Department Advisory Board
Tim Feemster Professional Profile
2

© Foremost Quality Logistics Confidential
Opening Ceremonies- Cabinet Secretary Jon Barela
3

© Foremost Quality Logistics Confidential
Agenda
• Introductory Questions• Understanding Trends in Global Logistics
– Origin Points– Sea Ports– Intermodal & Inland Ports
• What are they• Why are they important
– Panama Canal– FTZ
• Why do You Care- What is the Supply Chain Network Impact for the DC Network– Cost Drivers for Site Location
• Q&A Throughout
4

© Foremost Quality Logistics Confidential
Questions
• How many of you work for– Economic Development– Manufacturers- make stuff, distributors- store/ship stuff– Governmental/Port Agency– Real Estate Brokerage/development Firm– Student or Professor– Press– Don’t know?
• How many of you live within 150 miles of a Port city?• Who has visited a Port or Intermodal Hub before yesterday?• What are the major challenges to Global Trade today and in the
future?
5

© Foremost Quality Logistics Confidential
Very Large Internet Delivery
6

© Foremost Quality Logistics Confidential
Teamwork- Team projects like those that come down from Corporate or The State. Who is LEADING, who is not committed, are you on the same page?
7

© Foremost Quality Logistics Confidential
Future raw materials for the Southwest Steel Coilplant???
8

© Foremost Quality Logistics Confidential
Ultimate in Green Power
Source: Tim Feemster
9

© Foremost Quality Logistics Confidential
Profit Leverage Discussion
• CEO talks to his SVP of Sales and his SVP of Operations & Supply Chain in their annual goals and objectives meetings– CEO tells the SVP of Sales- “I want a 5% increase in sales next year– CEO tells the SVP of Operations & Supply Chain- “I want a 5%
reduction in overall costs next year
• Who do you think has the better chance of making his happen?
• If both are successful, who should get the bigger bonus?
Source: Foremost Quality Logistics & UNT
10

© Foremost Quality Logistics Confidential
Profit leverage of managing costs
EXAMPLE:• The bottom line impact of a
5% increase to sales is substantially reduced by COGS
• Whereas a 5% reduction in costs goes right to the bottom line
Source: Foremost Quality Logistics & UNT
11

© Foremost Quality Logistics Confidential
$100
$100($95)
$ 5
Sales
NetCOGS 95%
Profit
Profit leverage example- Baseline P&L
Baseline P&L
Source: Foremost Quality Logistics & UNT
12

© Foremost Quality Logistics Confidential
Profit leverage example- Sales up 5%
$100
$100($95)
$ 5
SalesSales Increase
NetCOGS 90%
Profit
Improvement
$100$ 5
$105($99.75)
$5.25
$ 0.25
Baseline P&L Sales +5% P&L
Source: Foremost Quality Logistics & UNT
13

© Foremost Quality Logistics Confidential
$100
$100($95)
$ 5
$100-
$100($95)($ 5)$ 10
$ 5
SalesSales IncreaseNetCOGS 95%Cost DecreaseProfit
Improvement
$100$ 5$105($99.75)
-$5.25
$ 0.25
Cost leverage results in a much larger return- 20 X
Profit leverage example- Sales +5% & Cost -5%
Baseline P&L Sales +5% P&L Cost -5% P&L
Source: Foremost Quality Logistics & UNT
14

© Foremost Quality Logistics Confidential
Profit Leverage- How much is a Nickel worth today?
If the net profit on each sales $ is 5%, then...
Cost Savings ofIs Equivalent to aSales Increase of
$5$50
$500$5,000
$50,000$500,000
$5,000,000
$100.00$1,000.00
$10,000.00$100,000.00
$1,000,000.00$10,000,000.00
$100,000,000.00The profit of a Cost reduction of equals Sales increase of $1,000,000 $.05/sq ft on a 1,000,000 sq ft bldg for the whole company
Source: Foremost Quality Logistics & UNT
15

© Foremost Quality Logistics Confidential
Container / TEU
• Container- The box used to transport goods in International and Domestic commerce
• Twenty foot Equivalent Unit = TEU– One 20’ container = 1 TEU– One 40’ container = 2 TEUs
16

© Foremost Quality Logistics Confidential
Chassis
The truck body used to transport containers, both international and
domestic moves
17

© Foremost Quality Logistics Confidential
The End-to-End International Supply Chain
Manufacturer
{
Inland Transportation
Ocean Goods terminal
Vendor warehouse / import center
Store
Retail Distribution
Center
Store
Head office
Physical Movement
Data Movement
Order processingPhysical movement
Track & traceSource: Tim Feemster, Foremost Quality Logistics
18

© Foremost Quality Logistics Confidential
Relative Cost for Goods Movement
Less thanTruckload$$$$/LB
Ship$/Box/Ton
Air $$$$$$/LB
Rail$$/Box/Ton
Truckload$$$/Truck
Parcel$$$$$/LB
International Supply Chain
Source: Tim Feemster, Foremost Quality Logistics
19

© Foremost Quality Logistics Confidential
US Foreign Trade- Value in 2012 (millions)
1 China 424,874$ 18.9 Canada 244,199$ 15.8 Canada 424,874$ 2 Canada 323,925$ 14.4 Mexico 175,159$ 11.3 China 388,524$ 3 Mexico 276,408$ 12.3 China 103,508$ 6.7 Mexico 451,568$ 4 Japan 144,538$ 6.4 Japan 64,599$ 4.2 Japan 209,137$ 5 Germany 105,084$ 4.7 United Kingdom 48,293$ 3.1 Germany 148,759$ 6 Korea, South 57,874$ 2.6 Germany 43,676$ 2.87 United Kingdom 54,497$ 2.4 Brazil 37,252$ 2.48 Saudi Arabia 52,306$ 2.3 Netherlands 35,918$ 2.39 France 41,099$ 1.8 Singapore 27,013$ 1.710 Ireland 33,198$ 1.5 Belgium 24,838$ 1.6
Imports TotalExports
https://usatrade.census.gov/
20

© Foremost Quality Logistics Confidential
US Containerized Imports
21

© Foremost Quality Logistics Confidential
US Containerized Exports
22

© Foremost Quality Logistics Confidential
Top 10 US Container Trading Partners- 2000 vs 2010
Ranked by 2010 containerized value in billions of dollars
Country 2003 2010Percentage
ChangeChina $120.02 $270.33 125%Japan $59.86 $63.80 7%Germany $23.64 $36.32 54%Korea, South $20.54 $29.25 42%Taiwan $19.83 $23.65 19%Brazil $10.82 $18.61 72%India $7.14 $18.11 154%United Kingdom $14.60 $17.62 21%Italy $13.69 $15.94 16%France $10.73 $15.79 47%
SOURCE: U.S. Department of Commerce, U.S. Census Bureau, Foreign Trade Division. USA Trade Online.http://www.usatradeonline.gov/ (accessed September 2011).
23

© Foremost Quality Logistics Confidential
Top US Trading Partners in Containerized Cargo- 2012 TEUs
1. Mainland China (1) 2. Japan (2)3. South Korea (4)4. Taiwan (5)5. Germany (4)6. Hong Kong 7. India (7)8. Vietnam9. Puerto Rico10. Brazil (6)11. Belgium12. Indonesia13. Italy (9)14. Thailand15. Netherlands
16. United Kingdom (8)17. Guatemala18. Honduras19. Malaysia20. Chile21. Australia22. Costa Rica23. United Arab Emirates24. Turkey25. Philippines26. France (10)27. Spain28. Singapore29. Columbia30. Dominican Republic Source: PIERS/JOC 2012
24
© Foremost Quality Logistics Confidential
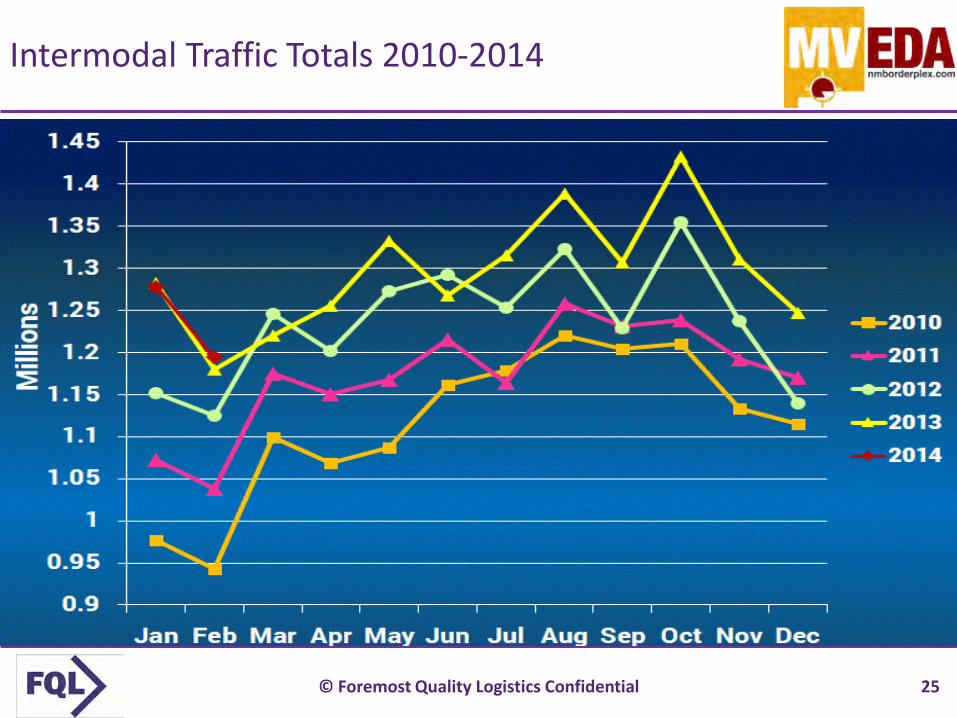
Intermodal Traffic Totals 2010-2014
Source: Intermodal Association of North America
25

© Foremost Quality Logistics Confidential
China to Surpass U.S. as World's Largest Trader
• China has held the title of largest exporter and second-largest importer globally since 2009
• 2013 numbers will show the country now has the world's largest trade value. – China's trade in 2013 is expected to have reached $4.14
trillion– U.S., which saw $3.26 trillion in trade from January to
October, is not expected to have hit the more than $880 billion necessary in November and December to exceed China's numbers.
– China's year-end trade data is expected in the coming days; U.S. numbers are expected next month. Source: China Daily (Beijing)
26
© Foremost Quality Logistics Confidential
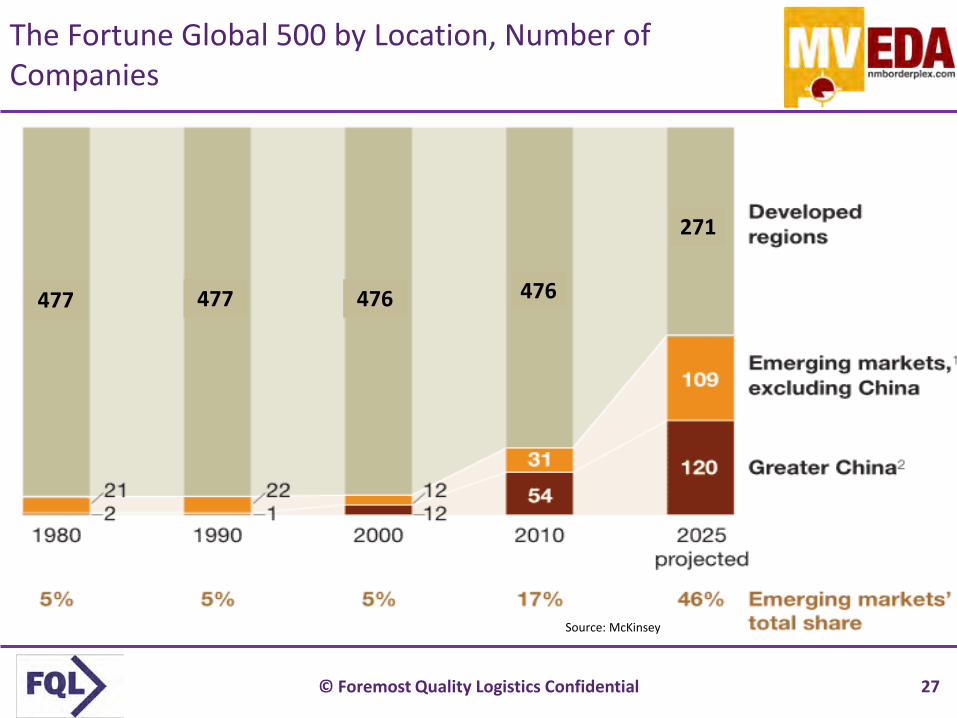
The Fortune Global 500 by Location, Number of Companies
Source: McKinsey
477 477 476 476
271
27

© Foremost Quality Logistics Confidential
Seven Trends Affecting Site Selection
1. Growing demand in emerging global markets2. Rising transportation costs3. Emerging logistics hubs and the expansion of
the Panama Canal4. Downward pressure on rents have ended and
a “flight-to-quality” in industrial real estate5. Opting for more flexibility with 3PLs6. Omni-Channel supply Chains to support
ecommerce, mcommerce, scommerce7. Move to CNG/LNG fuels for Trucks, Trains,
Ships, and CarsSource: Napolitano, Maida (2009), “Site Selection: 5 Trends for the New Economy,”Logistics Management, Vol. 48, No. 9, pp. 42-47. and Foremost Quality Logistics
28

© Foremost Quality Logistics Confidential
The Retail Sales Shift- US Estimates
• Within 5 years, the percentage of sales closed at physical stores vs. alternative sales channels (e-commerce, m-commerce and s-commerce) will drop from 91% (today) to 76% (Deloitte Study)
• By 2025 it has been estimated that e-commerce will represent 30% of all Retail Sales and account from 2.7 trillion in total sales (Source: Dematic)
Source: Forrester, Inc.
29

© Foremost Quality Logistics Confidential
Logistics Cost Breakdown- 2012
0.00%
10.00%
20.00%
30.00%
40.00%
50.00%
60.00%
70.00%
Transportation Inventory WarehouseLabor est
WarehouseNon Labor est
Administration Other
62.8%
22.9%
5.9%3.9% 3.8% 0.8%
Perc
ent o
f Log
istic
s C
ost
Cost Category
Source: CSCMP & Tim Feemster, Foremost Quality Logistics
14.4%
© Foremost Quality Logistics Confidential 30

© Foremost Quality Logistics Confidential
0%
10%
20%
30%
40%
50%
60%
70%
80%
90%
100%
High Tech RegionalRetailer
ConsumerFulfillment
LightManufacturing
CPGManufacturer
NationalRetailer
Food &Beverage
41% 42%
24%12%
62%
34%
19% 21%
72%
50%65%
23%
54%5% 4%
5% 5% 5%
2%6%
29%19%
9% 8% 3%
9%2%5%
14% 14% 12% 16%4% 4%
Inbound Trans Outbound Trans DC Fixed Inventory DC Variable
Freight, Freight, and Freight, then Labor and Love
Source: CHAINalytics
% o
f Sup
ply
Chai
n Co
sts
60%63%
72% 74% 77%
85%88%
31
© Foremost Quality Logistics Confidential
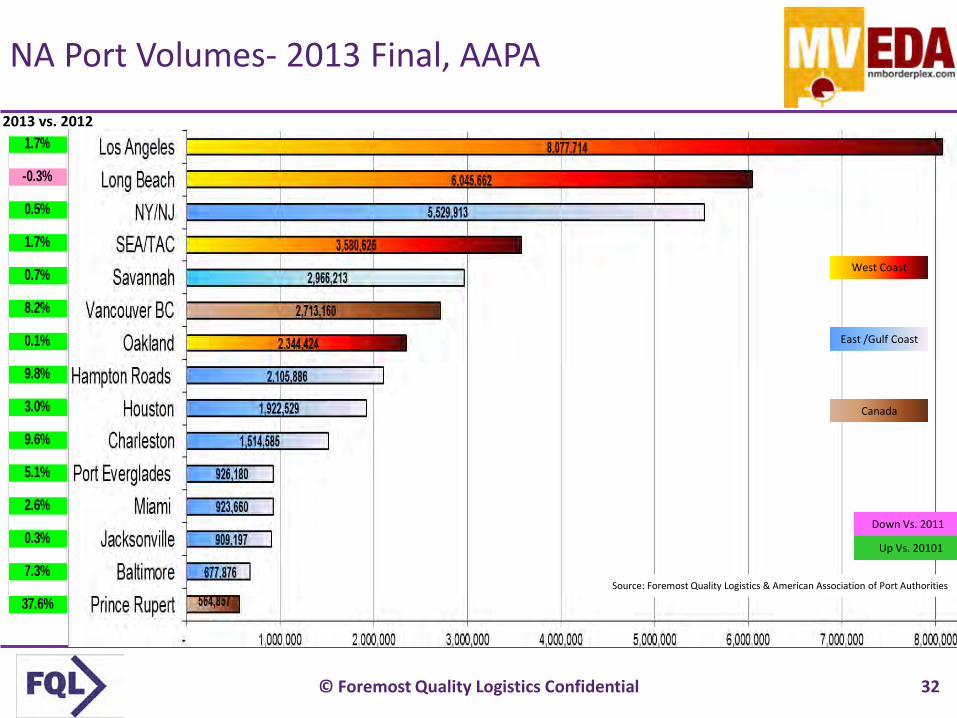
NA Port Volumes- 2013 Final, AAPA
Down Vs. 2011
Up Vs. 20101
West Coast
East /Gulf Coast
2013 vs. 2012
Source: Foremost Quality Logistics & American Association of Port Authorities
Canada
1.7%
-0.3%
0.5%
1.7%
0.7%
8.2%
0.1%
9.8%
3.0%
9.6%
5.1%
2.6%
0.3%
7.3%
37.6%
32

© Foremost Quality Logistics Confidential
Port Container Volume Shift- 2006 thru 2013
Source: Foremost Quality Logistics Logistics & American Association of Port Authorities
East West
Gulf
33

© Foremost Quality Logistics Confidential
East Coast Port Container Performance- Q1 2014
34

© Foremost Quality Logistics Confidential
Evolution of Containerships
Early Containerships (1956-)
Panamax (1980-)
Post Panamax (1988-)
New Panamax (2014-)
Fully Cellular (1970-)
Panamax Max (1985-)
Post Panamax Plus (2000-)
Post New Panamax (2006-)
Triple E (2013-)
500 – 800 TEU
1,000 – 2,500 TEU
3,000 – 3,400 TEU
3,400 – 4,500 TEU
4,000 – 5,000 TEU
6,000 – 8,000 TEU
12,500 TEU
15,000 TEU
18,000 TEU
200x20x9
137x17x9
215x20x10
250x32x12.5
290x32x12.5
285x40x13
300x43x14.5
366x49x15.2
400x59x15.5
397x56x15.5 ; 22–10–8 (not shown)
(LOA – Beam – Draft)
10
8
23
2010
6
6
917
59
15
6
813
56
13
10
45
84
646 containers across
4 containers high on deck
4 containers high below deck
A
B
C
D
E
meters
Copyright © 1998-2013, Dr. Jean-Paul Rodrigue, Dept. of Global Studies & Geography, Hofstra University. For personal or classroom use ONLY. This material (including graphics) is not public domain and cannot be published, in whole or in part, in ANY form (printed or electronic) and on any media without consent. This includes conference presentations. Permission MUST be requested prior to use.

© Foremost Quality Logistics Confidential
The Largest Available Containership, 1970-2013 (in TEUs)
0
2,000
4,000
6,000
8,000
10,000
12,000
14,000
16,000
18,000
20,000
Ship
Size
in TE
U
L “Lica” Class(3,400 TEU)
R “Regina” Class(6,000 TEU)
S “Sovereign” Class(8,000 TEU)
E “Emma” Class(12,500 TEU)
“Triple E” Class(18,000 TEU)
Copyright © 1998-2013, Dr. Jean-Paul Rodrigue, Dept. of Global Studies & Geography, Hofstra University. For personal or classroom use ONLY. This material (including graphics) is not public domain and cannot be published, in whole or in part, in ANY form (printed or electronic) and on any media without consent. This includes conference presentations. Permission MUST be requested prior to use.

© Foremost Quality Logistics Confidential
Characteristics of Some Historical Containerships
Year Name Capacity (TEU)
Yard Length (m) Width (m) Draft (m) Speed (knots)
1956 Ideal X 58 US 174.2 23.6 8 18.0
1968 Elbe Express 730 B&V 171.0 24.5 7.9 20.0
1970 Sealand Navigator 2,361 247.6 27.5 11.1
1972 Liverpool Bay 2,961 B&V 248.6 32.3 13.0 23.0
1981 Frankfurt Express 3,430 HDW 271.0 32.3 11.5 23.0
1991 Hanover Express 4,407 Samsung 281.6 32.3 13.5 23.0
1995 APL China 4,832 HDW 262.0 40.0 12.0 24.6
1996 Regina Maersk 6,700 Odense 302.3 42.8 12.2 24.6
1998 Sovereign Maersk 8,200 Odense 332.0 42.8 14.5 24.7
2001 Hamburg Express 7,506 Hyundai 304.0 42.8 14.5 25.0
2003 OOCL Shenzhen 8,063 Samsung 319.0 42.8 14.5 25.2
2005 MSC Pamela 9,200 Samsung 321.0 45.6 15.0 25.0
2006 Emma Maersk 14,500 Odense 393.0 56.4 15.5 24.5
2009 MSC Beatrice 13,798 Samsung 366.1 51.2 15.0 25.2
2012 MSC Marco Polo 16,000 Daewoo 396.0 53.6 16.0 25.1
Copyright © 1998-2013, Dr. Jean-Paul Rodrigue, Dept. of Global Studies & Geography, Hofstra University. For personal or classroom use ONLY. This material (including graphics) is not public domain and cannot be published, in whole or in part, in ANY form (printed or electronic) and on any media without consent. This includes conference presentations. Permission MUST be requested prior to use.

© Foremost Quality Logistics Confidential
Specifications for Very Large Post-Panamax Containerships
“Triple E Class” (Projected 2013)
“E Class” (Emma Maersk)
“S Class” (Sovereign Maersk)
Capacity (TEU) 18,000 14,500 8,400Length (meters) 400 397 348Width (meters) 59 56 44Draft (meters) 16.5 16 15Deadweight (tons) 165,000 156,900 105,000Speed (knots) 23 (19 optimal) 25.5 25
Copyright © 1998-2013, Dr. Jean-Paul Rodrigue, Dept. of Global Studies & Geography, Hofstra University. For personal or classroom use ONLY. This material (including graphics) is not public domain and cannot be published, in whole or in part, in ANY form (printed or electronic) and on any media without consent. This includes conference presentations. Permission MUST be requested prior to use.

© Foremost Quality Logistics Confidential
Potential New Options – Post Panamax
Charleston
Savannah
Jacksonville
Norfolk
New York
Mobile
Nova Scotia
Lazaro Cardenas
LA/LB
Oakland
Seattle
Prince Rupert
Greatest Competition for Market Share
Source: Foremost Quality Logistics Logistics
39
© Foremost Quality Logistics Confidential
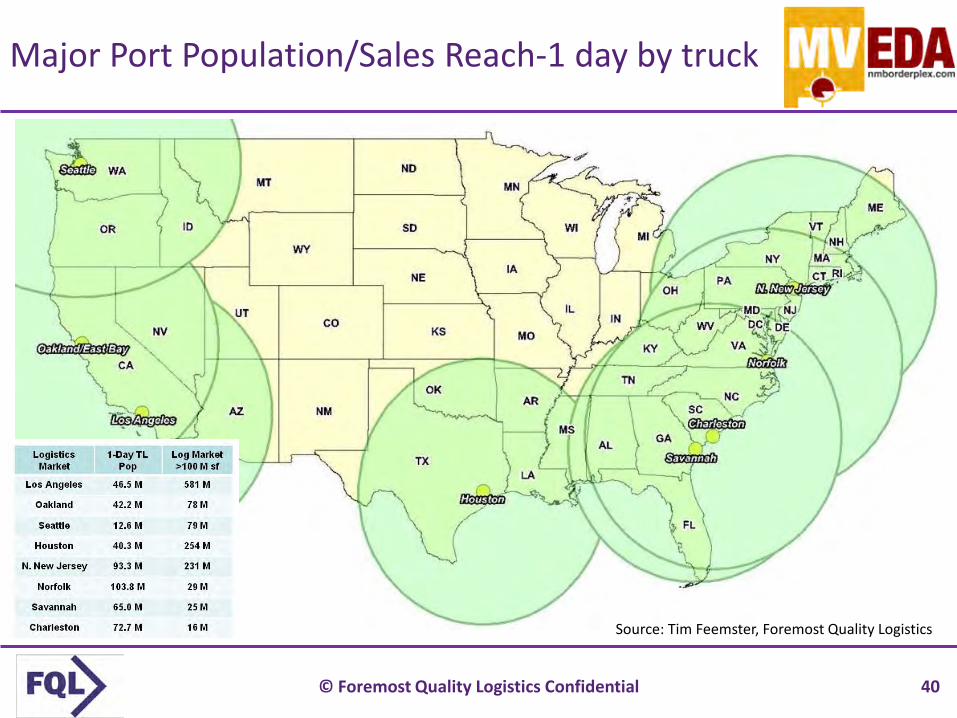
Major Port Population/Sales Reach-1 day by truck
Source: Tim Feemster, Foremost Quality Logistics
40
© Foremost Quality Logistics Confidential
Trends: Thinking Cap or NASCAR Hans Device Prototype
41

© Foremost Quality Logistics Confidential
Critical Trend Components
SiteSelectionCriteria
STRATEGIC FINANCIAL
INTANGIBLES
Sustainability Ecommerce Foreign Trade Zones Vertical Market Clusters Real Estate Strategy -
Own/Lease/Build
Transportation & Drayage Labor & Healthcare Costs Incentives Deal Structure Lease Renewals Lease Accounting Rules NPV Total Cost Analysis
Brand Reputation Unionization Paid Benefits Quality of Life Business Climate
Rising Fuel Costs Driver Hours of Service Labor Demographics,
Aging Workforce, etc. Energy Costs Trucking Capacity Intermodal Access- Int. & Dom.
OPERATIONAL
Source: Foremost Quality Logistics
42

© Foremost Quality Logistics Confidential
Fuel Impact on Warehouse Network
Source: Dr. David Simchi-Levi, MIT
43

© Foremost Quality Logistics Confidential
BNSFHub
Two Potential DC Sites Under Consideration:
Site A -- 3 miles from rail hub Site B -- 30 miles from rail hub 100,000 sq ft facility
Annual inbound units 2,000x Drayage cost differential (A-B): $100Annual Co-Location Savings $200,000
Total Occupancy Cost for B is $2.00/sq ft more
Intermodal Zones of Savings Example
•A
•B
Copyright BNSF Railway Co. 2014
Distribution Center Co-Location Benefits
44
© Foremost Quality Logistics Confidential
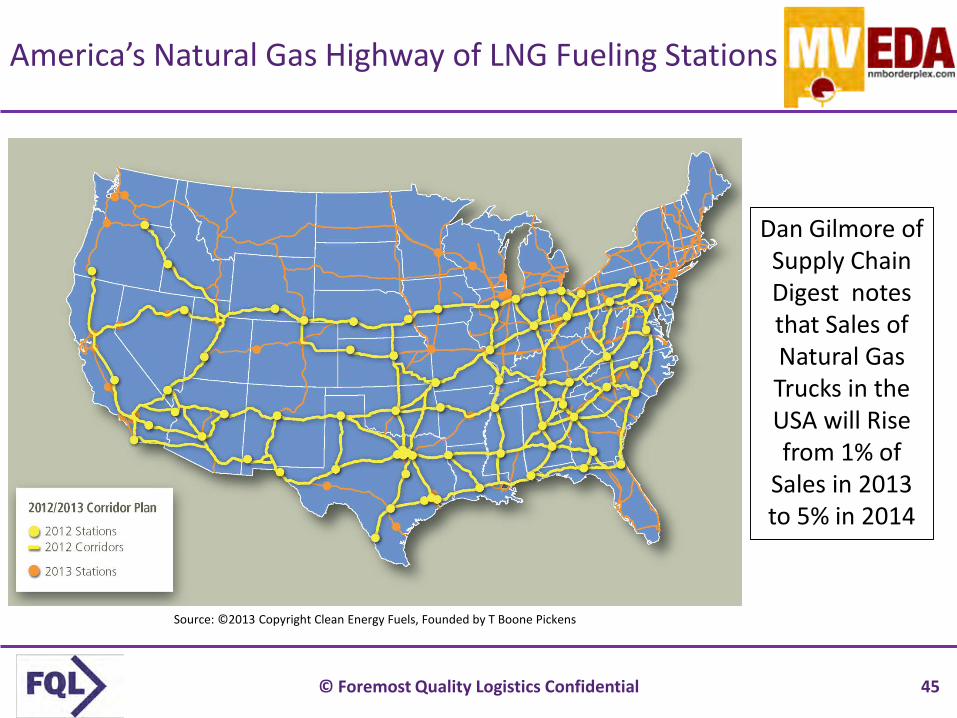
America’s Natural Gas Highway of LNG Fueling Stations
Source: ©2013 Copyright Clean Energy Fuels, Founded by T Boone Pickens
Dan Gilmore of Supply Chain Digest notes that Sales of Natural Gas Trucks in the USA will Rise from 1% of
Sales in 2013 to 5% in 2014
45

© Foremost Quality Logistics Confidential
Pre Foreign-Trade Zone
Shipments into Site
3,000 receipts inboundper yr. MPF $1,455,000
Shipments into commerce with weekly entry.
One entry filed at End of week. MPF $485or $25,220 per yr.
In a single year an FTZ importer can save $ 1,429,780 MPF Fees
FTZ Example
Assumptions:
1. 3,000 international containers a year into the facility per year
2 Container value $150,000
3 1 BOL per container; $150,000 value per BOL
Post Foreign-Trade Zone
Source: Tim Feemster, Foremost Quality Logistics
46

© Foremost Quality Logistics Confidential
Let’s Work Together on This
47

© Foremost Quality Logistics Confidential
UP Intermodal Routes
48
© Foremost Quality Logistics Confidential
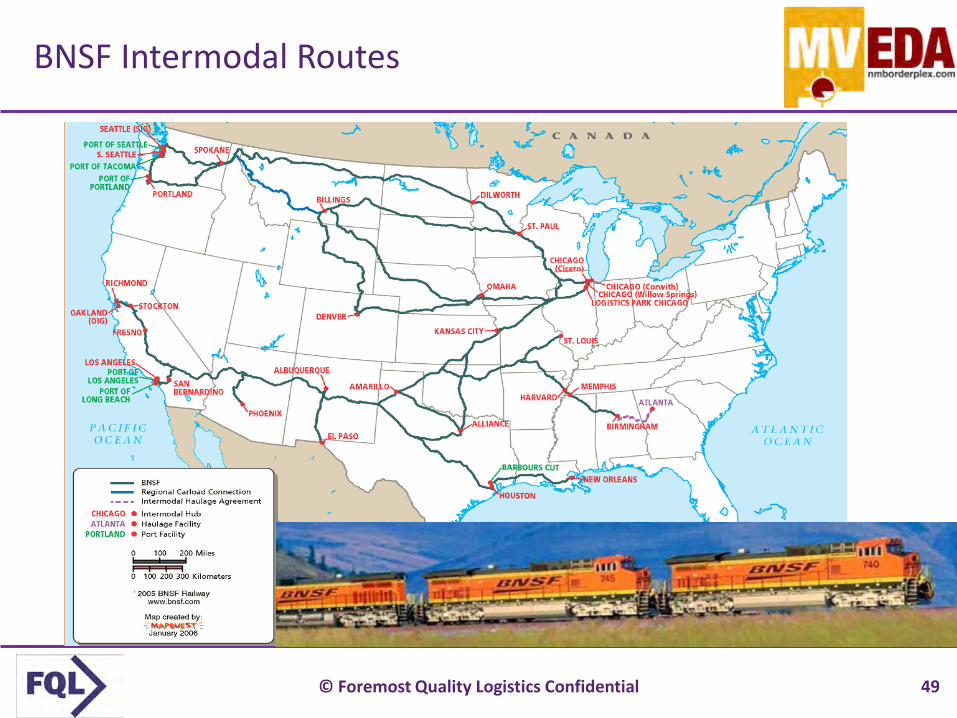
BNSF Intermodal Routes
49
© Foremost Quality Logistics Confidential
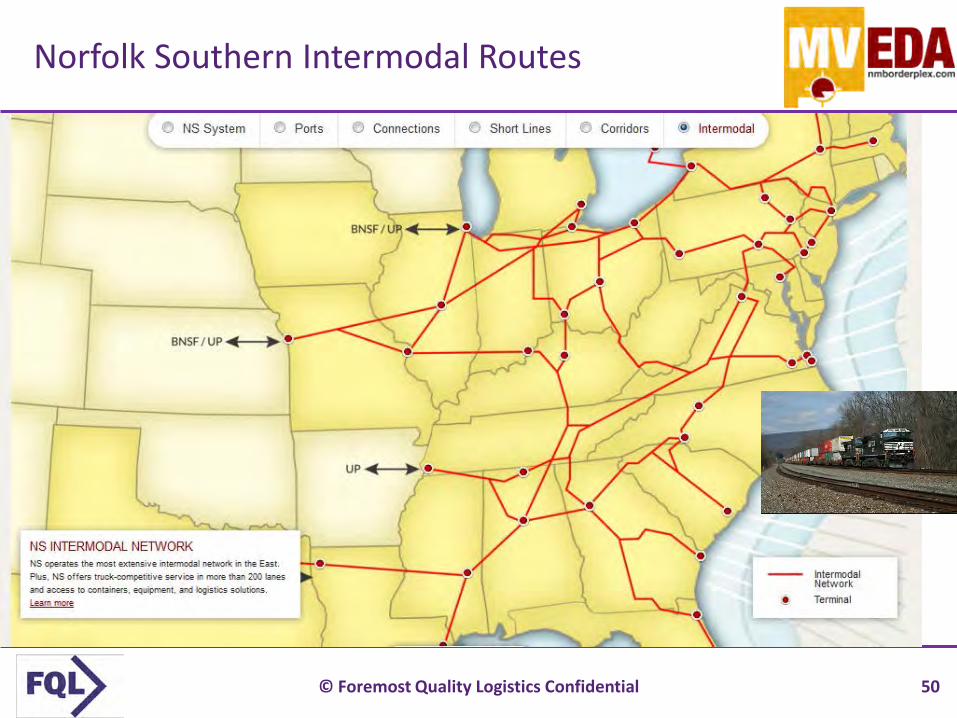
Norfolk Southern Intermodal Routes
50

© Foremost Quality Logistics Confidential
CSX Intermodal Routes
51

© Foremost Quality Logistics Confidential
CSX Intermodal Conversion
One CSX Intermodal train equals 280 trucks off of the road. Source: CSX & FQL Logistics
52

© Foremost Quality Logistics Confidential
Why do We Care about Inland Ports
As Economic/Real Estate Development, Distribution, and Real Estate professionals, understanding the Global Supply Chain is “fun” but we need to know
Where does the container come to rest– Local destination-
at or near the Port– Non-local destination-
via rail or truck to the inland Port
This is where vertical happens- at the end of the “land bridge”
Source: Tim Feemster, Foremost Quality Logistics
53
© Foremost Quality Logistics Confidential
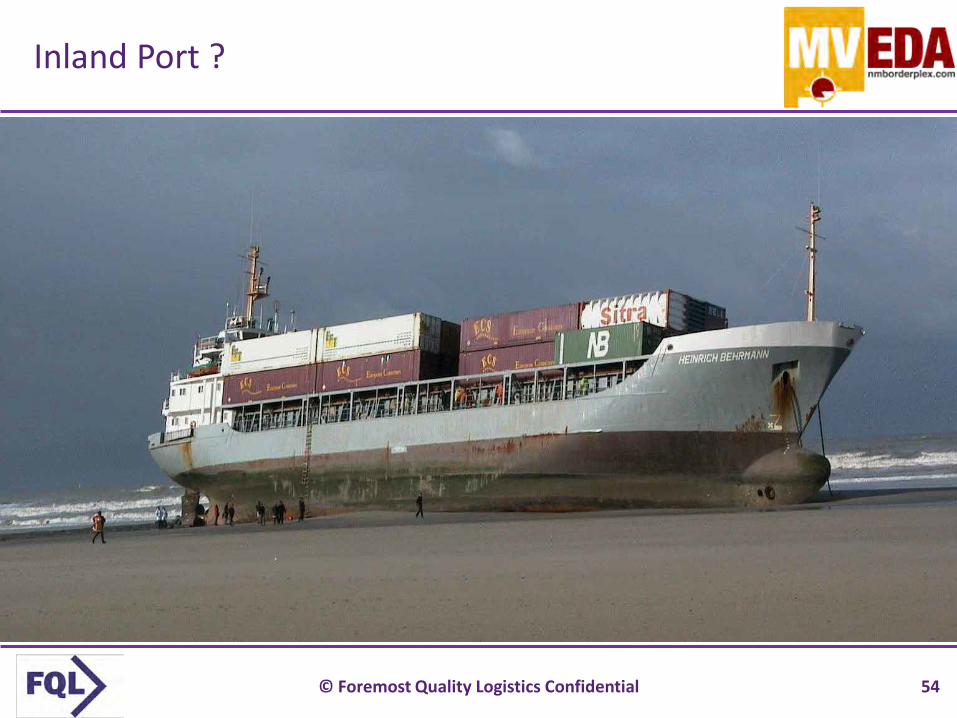
Inland Port ?
54
© Foremost Quality Logistics Confidential
Critical Elements of an Inland Port – One Developer’s View
• Hillwood’s criteria as of 2001 (Developer of Alliance)– Base population of 3 million– Multiple transportation modes– 5,000 to 10,000 acres– Tax and local incentives– Strong employment base– Telecommunications infrastructure– Foreign Trade Zone (FTZ) Status
Source: University of Texas, Center for Transportation Research. The Identification and Classification of an Inland Port. (2001)
55

© Foremost Quality Logistics Confidential
US Population- W 23%; E 77%; Top DC Markets
23% 77%
2009 Population Population PercentPacific 58,684,030 19%Mountain 12,884,051 4% EastTexas/Great Plains 43,539,381 14% 77%Great Lakes/Ohio Valley 56,080,995 18%Mid-Atlantic/Northeast 64,287,713 21% WestSoutheast 71,530,380 23% 23%US 307,006,550 Source: US Census, FQL, NGKF, & PPR
Kansas City
56

© Foremost Quality Logistics Confidential
Top Five Markets in the US
Source: Tim Feemster, Foremost Quality Logistics
57

© Foremost Quality Logistics Confidential
Always Know Where You are Going
58

© Foremost Quality Logistics Confidential
Start With Supply Chain Strategy to Get
Leverage
Source: Gartner / AMR Research
59
© Foremost Quality Logistics Confidential
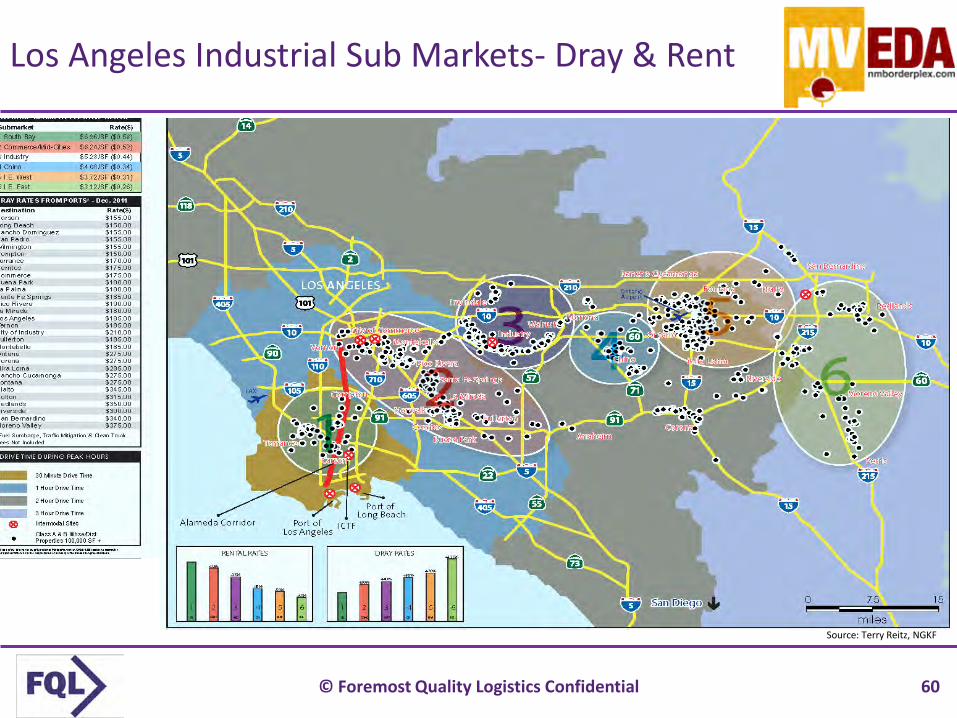
Los Angeles Industrial Sub Markets- Dray & Rent
Source: Terry Reitz, NGKF
60

© Foremost Quality Logistics Confidential
LA Drayage Calculator- Total Occupancy Analysis
Dray Cost Dray Rate
Dray Fully Loaded
(FSC and
Traffic Mit Fee Containers/Mo
Dray Cost/Mo Dray Cost/Yr
Carson (Port adjacent) $155 $268 Pier Pass 200 $53,525 $642,300Buena Park $180 $280 Pier Pass 200 $55,900 $670,800Industry $210 $318 Pier Pass 200 $63,550 $762,600Ontario (IE West) $275 $401 Pier Pass 200 $80,125 $961,500Moreno Valley (IE East) $370 $522 Pier Pass 200 $104,350 $1,252,200
Occupancy Cost Plus Dray Cost
Market Net
Rent/SF
SF Net Rent/Mo Total Operating
Expense/M
Total Occupancy Cost/Mo
Dray Cost/Mo Total Occupancy plus Dray
Carson (Port adjacent) $0.60 150,000 $90,000 $18,000 $108,000 $53,525 $161,525Buena Park $0.50 150,000 $75,000 $18,000 $93,000 $55,900 $148,900Industry $0.44 150,000 $66,000 $18,000 $84,000 $63,550 $147,550Ontario (IE West) $0.35 150,000 $52,500 $16,500 $69,000 $80,125 $149,125Moreno Valley (IE East) $0.31 150,000 $46,500 $15,000 $61,500 $104,350 $165,850
Transport Break-Even Per Building SF
Total Cost Difference
Total Occupancy Cost/SF
Dray Cost/SF TotalCost/Building SF
(Additional Transport Cost Compared to South Bay) Carson (Port adjacent) $0.00 Carson (Port adjacent) $0.72 $0.36 $1.08 Buena Park $0.02 Buena Park $0.62 $0.37 $0.99 Industry $0.07 Industry $0.56 $0.42 $0.98Ontario (IE West) $0.18 Ontario (IE West) $0.46 $0.53 $0.99Moreno Valley (IE East) $0.34 Moreno Valley (IE East $0.41 $0.70 $1.11
*A. The Department of Energy (DOE) Index for 'Diesel Fuel Prices' in Cal i fornia is used
for determining the Fuel Surcharge percentage
B. The DOE Index can be accessed at http://tonto.eia.doe.gov/oog/info/wohdp/diesel.asp
Assumptions:Warehouse Square Feet 150,000Containers/Month 200Building Type Class AFuel Surcharge ("FSC") 27.50% Outbound Transportation Cost NeutralTraffic Mitigation Fee ("TMF") $123 per 40' containerClean Truck Program ("CTP") $50 per 40' container
Source: Terry Reitz, NGKF
61
© Foremost Quality Logistics Confidential
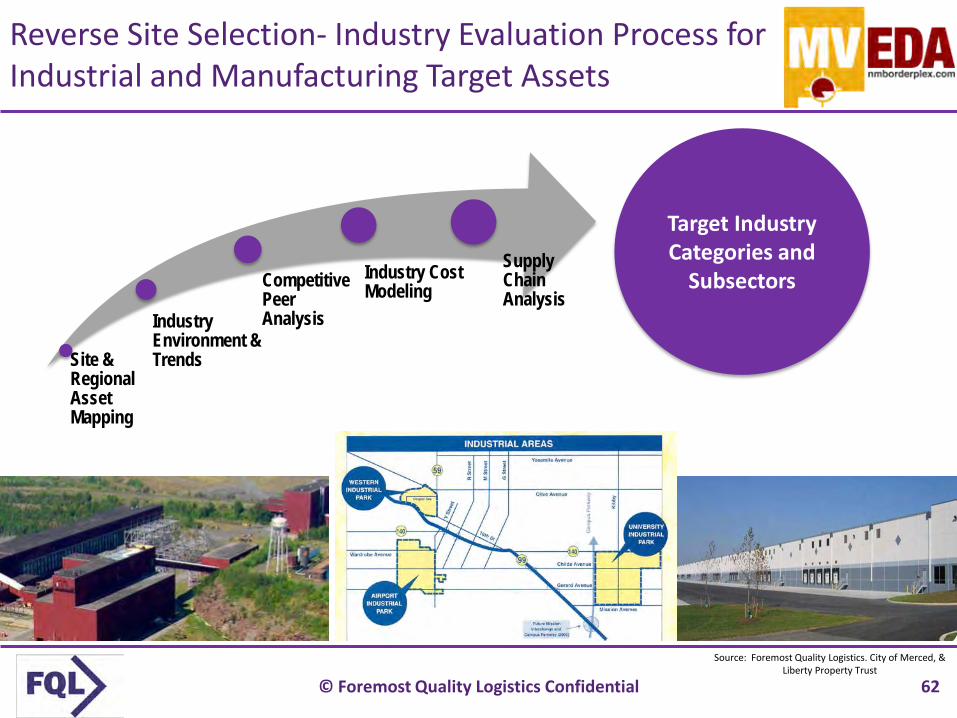
Source: Foremost Quality Logistics. City of Merced, & Liberty Property Trust
Target Industry Categories and
Subsectors
Site & Regional Asset Mapping
Industry Environment & Trends
Competitive Peer Analysis
Industry Cost Modeling
Supply Chain Analysis
Reverse Site Selection- Industry Evaluation Process for Industrial and Manufacturing Target Assets
62
© Foremost Quality Logistics Confidential
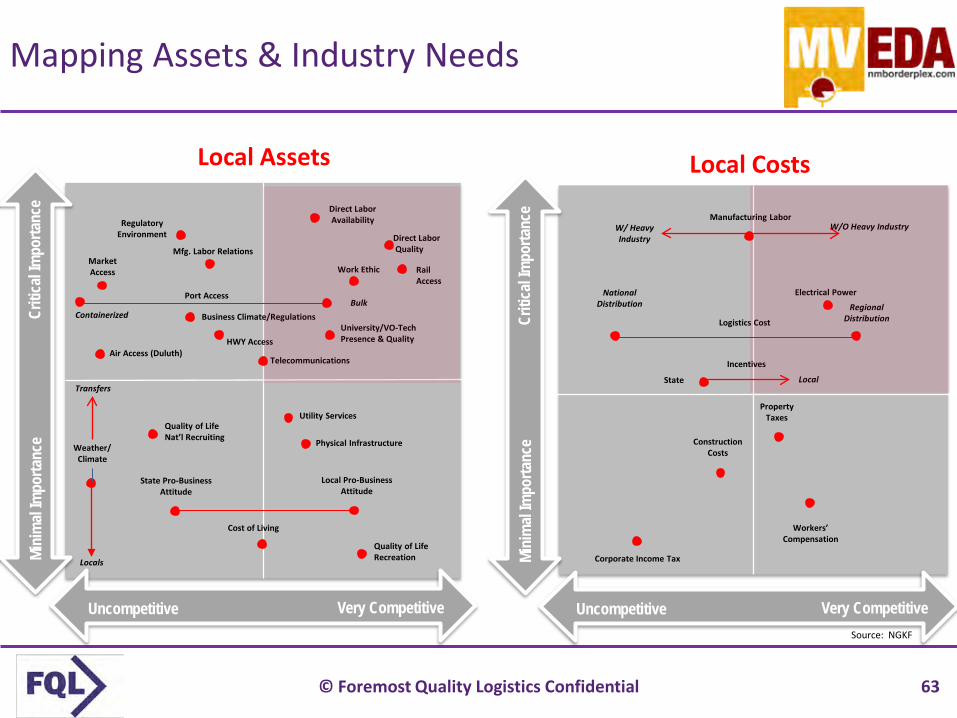
Criti
cal Im
porta
nce
Mini
mal
Impo
rtanc
e
Uncompetitive Very Competitive
MarketAccess
University/VO-TechPresence & Quality
Direct LaborQuality
Work Ethic
Direct LaborAvailability
Mfg. Labor Relations
Air Access (Duluth)
Business Climate/Regulations
State Pro-BusinessAttitude
Local Pro-BusinessAttitude
Cost of Living
Weather/Climate
Transfers
Locals
Quality of LifeNat’l Recruiting
Quality of LifeRecreation
Physical Infrastructure
Utility Services
Rail Access
HWY Access
Telecommunications
Port Access
ContainerizedBulk
Local Assets
RegulatoryEnvironment
Criti
cal Im
porta
nce
Mini
mal
Impo
rtanc
e
Very Competitive
Local Costs
Manufacturing LaborW/O Heavy IndustryW/ Heavy
Industry
Electrical Power
Incentives
LocalState
Property Taxes
ConstructionCosts
Corporate Income Tax
Logistics Cost
Workers’ Compensation
Uncompetitive
RegionalDistribution
NationalDistribution
Mapping Assets & Industry Needs
Source: NGKF
63

© Foremost Quality Logistics Confidential
Location Screening for Industrial/Manufacturing
Let the data lead us. Identify locations by looking at everything at the start instead of artificially starting with a set of predefined “preferred” or “best-in-class” areas.
First Pass: Fatal FlawsScreen out locations with fatal flaws e.g. Locations with insufficient connectivity or high logistics cost.
Second Pass: Major FlawsRule out Locations with major flaws e.g. Locations with key attributes but inadequate infrastructure like no intermodal, international airport or seaport access.
Third Pass: Manageable FlawsConsider Locations that meet all critical criteria but have manageable issues – flaws that can be remedied or mitigated through negotiations with government officials
Preferred and back-up Locations (1-2)
Quantitative AnalysisAnd Desktop Research
Identify All Site Selection Criteria
Site Due Diligence,Qualitative Data
Gathering, and Cost Modeling
Short List of PreferredLocations and Sites
Source: Tim Feemster, Foremost Quality Logistics
64

© Foremost Quality Logistics Confidential
Real Estate & Infrastructure Needs
EXISTING BUILDINGS
FDA & USDA buildings are in short supply
Building conversion for food use is difficult
Concrete construction, adequate building drainage, deliberate building layout, and sealed environment typically preferred
DEVELOPABLE READY SITES
Mitigate cost and time to develop
1 Real Estate 2 Infrastructure
WASTEWATER
Ability to handle high capacity effluent with high BOD content
WATER
High capacity of quality water at an affordable rate
ELECTRIC
Reliable and redundant power
NATURAL GAS
Access to high capacity of natural gas
3 Other Characteristics
ADJACENT LAND USE
Avoid heavy industrial uses that could cause containments, or agricultural uses that attract vermin
PROXIMITY TO SURFACE WATER
Minimize exposure to water detention & retention ponds, creeks, wetlands, etc.
PREVIOUS BUILDING & SITE USE
Redeveloped food processing opportunities require an environmentally conscious prior use.
Source: Josh Bays- Site Selection Group
65

© Foremost Quality Logistics Confidential
What about Site Selection & Using a Professional
• Site selection is both an art and a science, best handled by professionals
• Almost all companies are risk averse• Most company employees have never moved a site in their
existing company or even their entire career• I have done over 100 start-ups in my career, most site selectors
have not done that many• Many site selection companies have specialties- incentives,
taxes, data centers, etc. but don’t team with others• You may know more about a subject than the site selection
company. Use this to your advantage?• Incentives rarely make a bad location a good one, be careful• We are site eliminators, not selectors
Source: Tim Feemster, Foremost Quality Logistics
66

© Foremost Quality Logistics Confidential
We Track ALL Shipments & Yes, We Know EXACTLYWhere Yours Is!
67

© Foremost Quality Logistics Confidential
Now Let’s Discuss ecommerce Deliveries
68

© Foremost Quality Logistics Confidential
UPS Next Day Ground, Las Cruces, 88001
69

© Foremost Quality Logistics Confidential
UPS Next Day Ground, Albuquerque, 87110
70
© Foremost Quality Logistics Confidential
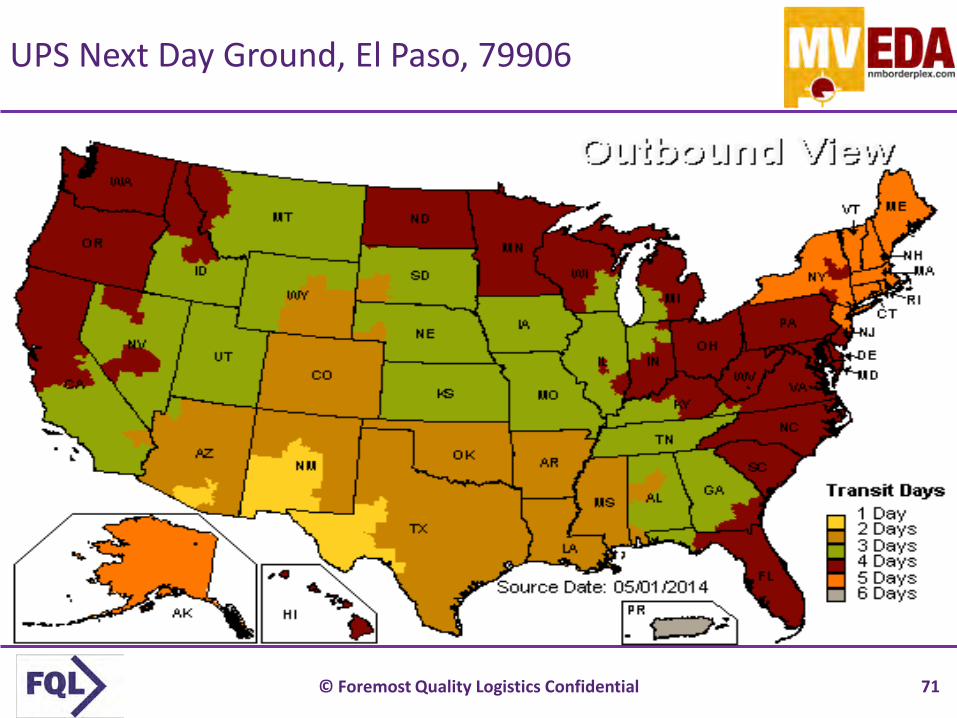
UPS Next Day Ground, El Paso, 79906
71

© Foremost Quality Logistics Confidential
UPS Next Day Ground, Phoenix, 85017
72

© Foremost Quality Logistics Confidential
UPS Next Day Ground, Lubbock, 79404
73

© Foremost Quality Logistics Confidential
UPS Next Day Ground, DFW
74
© Foremost Quality Logistics Confidential
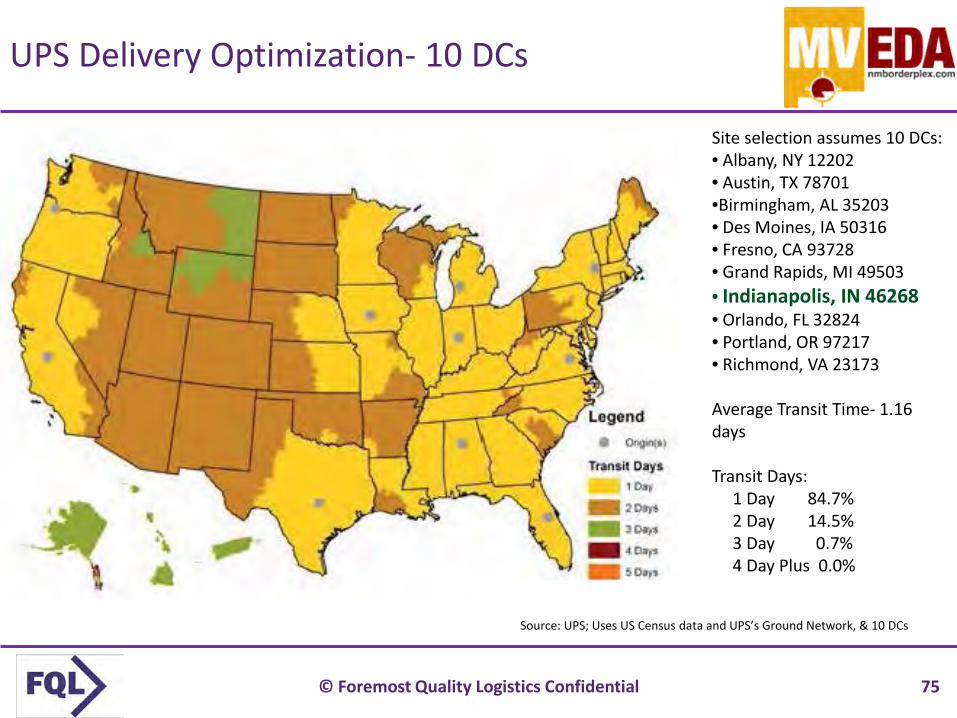
UPS Delivery Optimization- 10 DCs
Source: UPS; Uses US Census data and UPS’s Ground Network, & 10 DCs
Site selection assumes 10 DCs:• Albany, NY 12202• Austin, TX 78701•Birmingham, AL 35203• Des Moines, IA 50316• Fresno, CA 93728• Grand Rapids, MI 49503• Indianapolis, IN 46268• Orlando, FL 32824• Portland, OR 97217• Richmond, VA 23173
Average Transit Time- 1.16 days
Transit Days:1 Day 84.7%2 Day 14.5%3 Day 0.7%4 Day Plus 0.0%
75

© Foremost Quality Logistics Confidential
OmniChannel Distribution- Amazon/Walmart
Mega Import DCs/Manufacturer
Retail Stores
Customers
Product Flow Information Flow
Regional DCs
Retailer Website
76

© Foremost Quality Logistics Confidential
Top 10 Site Selection Criteria-Warehouse/Distribution- Dry
1. Transportation costs – both inbound and outbound2. Logistics infrastructure – highways, intermodal, rail, FTZ3. Labor costs, availability, & skills4. Supply Chain interruption risk5. Business climate- is there love6. Rent /lease terms/ownership7. Taxes & incentives8. Utility rates9. CAM charges10. Access to public transportation- Have you done a drive time
study for your workforce?Source: Tim Feemster, Foremost Quality Logistics
77

© Foremost Quality Logistics Confidential
Top 10 Site Selection Criteria-Food Warehouse/Distribution Frozen
Source: Tim Feemster, Foremost Quality Logistics, CHAINalytics
1. Transportation costs – both inbound and outbound
2. Utility rates/capacity for power, water & sewer
3. Logistics infrastructure – highways, intermodal, rail, FTZ
4. Labor costs, availability, & skills5. Business climate- is there love6. Supply Chain interruption risk7. Rent /lease terms/ownership8. Taxes & incentives9. CAM charges10. Access to public transportation- Have you
done a drive time study for your workforce?
78

© Foremost Quality Logistics Confidential
Top 10 Site Selection Criteria- Manufacturing
1. Labor skills, costs, & availability2. Transportation costs – both inbound and outbound3. Supply Chain & business interruption risk4. Logistics infrastructure – highways, intermodal, rail, FTZ5. Utility rates6. Business climate- is there love7. Taxes & incentives8. Rent /lease terms/ownership9. CAM charges10. Access to public transportation- Have you done a drive time
study for your workforce?Source: Tim Feemster, Foremost Quality Logistics
79

© Foremost Quality Logistics Confidential
Supply Chain Trends for 2014 and Beyond
1. Companies move beyond ERP and portals to work with trading partners– Networked companies come out ahead- collaboration works– Siloed companies are falling behind- make sure you network inside clients
2. Big data makes a difference if managed well– Mobile computing, interfaces, and data entry are the future– Integrated SC modules drive data driven decision making– Key performance indicators (KPIs) drive successfully manage service levels
3. Responsibility, transparency, and traceability important strategies– Sustainability matters in supply chains and buildings
4. Speed to market is important- think of Amazon same day– Omni channel distribution will become the norm
5. Planning for supply chain risk and disruption6. Supply chain gains prominence at the C-level for strategy & execution7. Interest rate volatility will send shocks through global trade
Source: Foremost Quality Logistics; Boris Felgendreher is marketing manager Europe at GT Nexus
80

© Foremost Quality Logistics Confidential
What does the Future Hold?
1. Mobile, social, and e commerce will continue to explode2. Omnichannel distribution will be a “norm”3. Transportation & port infrastructures will be more gridlocked & landlocked4. Diesel prices for transportation will remain volatile but on average increasing5. Customers will expect faster and more predictable lead times6. Global trade activity will grow, but so will its costs, risks, and complexities7. There will be more sources of financial and operational risk with shifting manufacturing
from China centric to other Asia and Mexico locations8. Sustainability initiatives will have greater influence on supply chain networks
(transportation), facility construction (lighting; HVAC; roofing; landscapes), and transportation choices (modal shifts; CNG/LNG as fuel)
9. Ageing populations will create labor force size and skills constraints in Trucking, Logistics and Manufacturing
10. The rules for lease accounting may change the Rent vs. Buy vs. 3PL decision in some companies
Source: Tim Feemster, Foremost Quality Logistics
81

© Foremost Quality Logistics Confidential
Soon, I am going to be up to my neck in ALLIGATORS-What Questions do You Have?
You are welcome to utilize material from this presentation but please retain the source acknowledgements.
82